Embed Size (px)
Citation preview

NREL is a national laboratory of the U.S. Department of Energy, Office of Energy Efficiency and Renewable Energy, operated by the Alliance for Sustainable Energy, LLC.
Eastern Renewable
Generation Integration Study
March 20, 2013

2
Project Sponsors
• This project is made possible by the Department of Energy’s:
o Offices of Energy Efficiency and Renewable Energy
– Wind and Water Power Program
– Solar Energy Technologies Program
o Office of Electricity Delivery and Energy Reliability
– National Electricity Delivery Division

3
Project Team
• Aaron Bloom
• Aaron Townsend
• Kara Clark
• Marissa Hummon
• Andrew Weekley
• Yih-Huei Wan
• Gary Jordan
• Jack King
NREL Contractors

4
2012 ERGIS TRC Members
• Mark Ahlstrom, Windlogics • Jared Alholinna, Great River Energy • Venkat Banunarayanan, DOE Solar
Program • Daniel Brooks, EPRI • Michael Brower, AWST • Charlton Clark, DOE Wind • Kara Clark, NREL • Cathy Cole, Michigan Public Service
Commission • Dave Corbus, NREL • Jaclyn Frank, AWST • Chris Habig, Southern Company • Bri-Mathias Hodge, NREL • Marissa Hummon, NREL • Gary Jordan, GE retiree • Jack King, Consultant
• Brendan Kirby, NREL • Debbie Lew, NREL • Larry Mansueti, DOE OE • Paul McCurley, NRECA • Michael Milligan, NREL • Tom Mousseau, Enernex Corp • Mark O’Malley, UCD, Ireland • Slobodan Pajic , National Grid • Brian Parsons, NREL • Matt Schuerger, Consultant • Ken Schuyler, PJM • Richard Sedano • J. Charles Smith, UWIG • Aidan Tuohy, EPRI • Sundar Venkataraman, GE • Bob Zavadil, Enernex Corp

5
What is ERGIS?

6
Operational Impact Study of High Wind and Solar
• Eastern Interconnection o Production cost simulation
o 2020 Study Year
• High Renewable Penetration o 20-25% wind and 5-10% solar
• Analytical Framework o PLEXOS production-cost model
o Hourly and sub-hourly analysis
• Timeline o Final report due in 2015
7
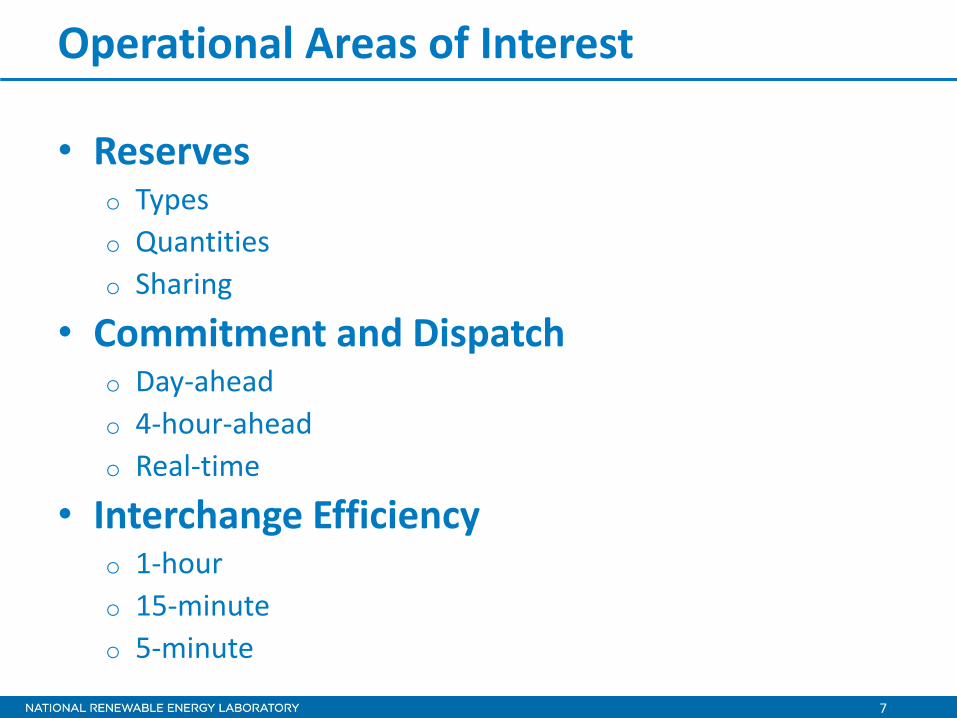
Operational Areas of Interest
• Reserves o Types
o Quantities
o Sharing
• Commitment and Dispatch o Day-ahead
o 4-hour-ahead
o Real-time
• Interchange Efficiency o 1-hour
o 15-minute
o 5-minute

8
Housekeeping
• Presentation covers lots of material
• Brief discussion after each section o 3-5 minutes
• Working Groups o Wind and solar profiles
o Thermal and hydro generation characteristics
o Transmission modeling
o Thermal fleet expansion and retirements
o Reserves analysis
o Others?
9
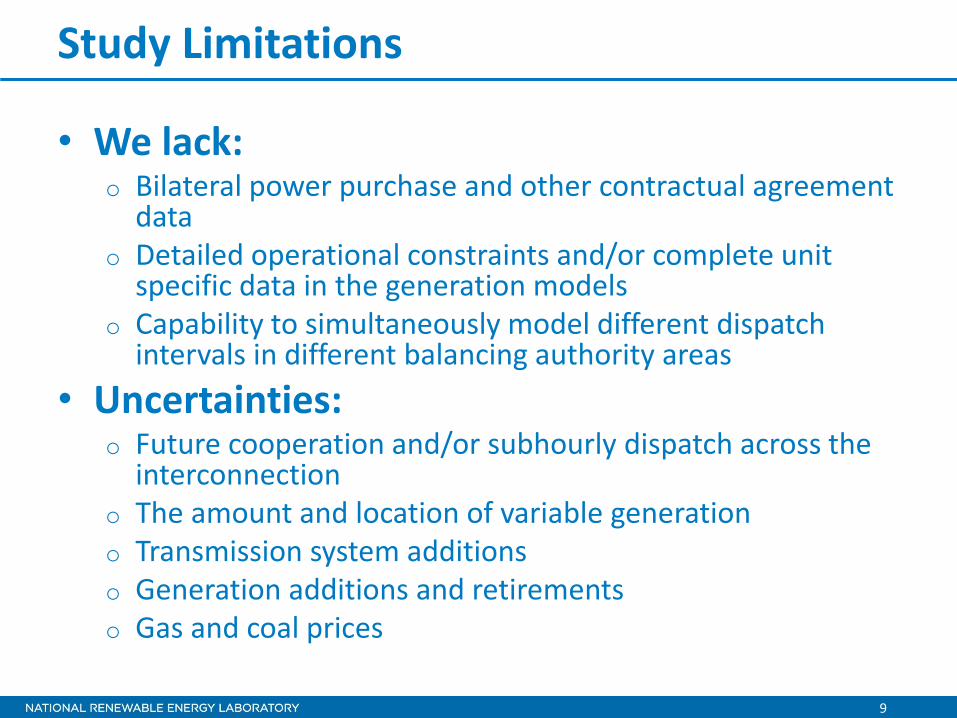
Study Limitations
• We lack: o Bilateral power purchase and other contractual agreement
data o Detailed operational constraints and/or complete unit
specific data in the generation models o Capability to simultaneously model different dispatch
intervals in different balancing authority areas
• Uncertainties: o Future cooperation and/or subhourly dispatch across the
interconnection o The amount and location of variable generation o Transmission system additions o Generation additions and retirements o Gas and coal prices

10
How are we going to do this?

Scenario Development

12
The Scenarios
• Three scenarios with different wind and solar resources
o Base Case
o Regional Scenario
o National Scenario
• Developed with TRC input last year

13
Base Case
• Similar to EIPC o Based on state retail load for wind and solar
o All existing wind plants in non-RPS states are included
o All RPS requirements are met, but not necessarily with in-state resources (e.g. Connecticut)
o Only wind and solar resources are count towards renewable penetration levels, i.e. not hydro and biomass.
o RPS=existing + queue + RPS needs
o Penetration levels – 15% Wind
– 0.25% Solar

14
Onshore
Capacity (MW) Onshore
Energy (GWh) Onshore
Pen. Offshore
Capacity (MW) Offshore
Energy (GWh) Offshore
Pen. Total Capacity
(MW) Total Energy
(GWh) Total Pen.
CT 1,045 2,871 8% 920 2,549 7% 1,965 5,420 15%
DE 417 1,036 10% 0 0 0% 417 1,036 10%
IA 8,582 30,791 72% 0 0 0% 8,582 30,791 72%
IL 7,031 24,013 16% 0 0 0% 7,031 24,013 16%
IN 2,225 7,266 6% 0 0 0% 2,225 7,266 6%
KS 4,989 19,005 42% 0 0 0% 4,989 19,005 42%
MA 1,937 6,122 10% 1,000 4,063 6% 2,937 10,184 16%
MD 734 2,217 4% 0 0 0% 734 2,217 4%
ME 450 1,345 10% 0 0 0% 450 1,345 10%
MI 3,178 10,824 7% 1,300 4,291 3% 4,478 15,116 10%
MN 9,393 34,517 45% 0 0 0% 9,393 34,517 45%
MO 2,429 8,535 7% 0 0 0% 2,429 8,535 7%
NC 860 2,581 2% 3,000 10,170 8% 3,860 12,750 10%
ND 4,788 17,485 123% 0 0 0% 4,788 17,485 123%
NE 6,108 22,457 88% 0 0 0% 6,108 22,457 88%
NH 307 1,026 10% 0 0 0% 307 1,026 10%
NJ 423 935 1% 4,000 14,068 14% 4,423 15,003 15%
NY 8,379 28,873 18% 2,620 9,262 6% 10,999 38,135 23%
OH 2,814 8,865 5% 1,020 3,342 2% 3,834 12,207 7%
OK 8,264 31,272 42% 0 0 0% 8,264 31,272 42%
PA 1,214 3,494 2% 0 0 0% 1,214 3,494 2%
RI 242 637 5% 400 1,448 11% 642 2,086 16%
SD 3,197 11,189 12% 0 0 0% 3,197 11,189 12%
TN 100 340 0% 0 0 0% 100 340 0%
TX 7,541 29,465 38% 0 0 0% 7,541 29,465 38%
VA 1,103 3,363 2% 0 0 0% 1,103 3,363 2%
VT 135 491 6% 0 0 0% 135 491 6%
WI 2,044 6,970 9% 640 2,125 3% 2,684 9,095 12%
WV 1,325 4,153 9% 0 0 0% 1,325 4,153 9%
Base Case Wind and Solar * Total penetration is % of energy

15
Wind and Solar Scenarios
• Scenario 1: Regional Resource
– 20% Wind
– 10% Solar
• Scenario 2: National Resource
– 25% Wind
– 5% Solar

16
Wind and Solar Capacity Expansion
• Regional Energy Deployment System (ReEDS)
o Long-term capacity-expansion model
o Aims to minimize total system costs
– Constraints include: transmission, load, reserves
o Multi-regional (356 wind/solar resource regions, 134 balancing areas)
o Temporal resolution: 17 time slices in each year
o Identifies energy requirement for ReEDS region
o See interim report

17
Wind and Solar Minimum Targets
Macro
Area
Wind
Target
Onshore
Wind Target
Offshore
Wind Target Solar Target
Distributed
Solar
(Rooftop)
Utility Scale
PV
FRCC 0% 0% 0% 30% 12% 18%
ISONE 25% 20% 5% 5% 2% 3%
MISO 25% 22.5% 2.5% 5% 2% 3%
NYISO 25% 20% 5% 5% 2% 3%
PJM 25% 15% 10% 5% 2% 3%
SERC w/o
VACAR 0% 0% 0% 15% 6% 9%
SPP 25% 25% 0% 5% 2% 3%
VACAR 15% 2.5% 12.5% 15% 6% 9%

18
A Few Notes
• Regional Targets o 25% wind
– 20% onshore and 5% offshore
o 5% solar PV – 2% rooftop and the rest utility
o VACAR and SERC – VACAR has lots of offshore potential – NREL data indicates low wind potential in SERC
15% from SPP wind, consistent with SPP Wind Int. Study
• National Targets o Similar to regional o Best generation resources are used to meet targets o Minimum solar targets were set to assure rooftop
PV

19
What are the expansion results?
20
Wind and Solar Maps
• See html files
• Disclaimer: Markers on these maps do not represent individual plants. They represent capacity, and are centered on grid cells used to develop profiles. Do not assume the markers represents the exact location of a plant.

21
Wind and Solar Capacity
0
20,000
40,000
60,000
80,000
100,000
FRCC ISONE MISO NYISO PJM SERC w/oVACAR
SPP VACAR
MW
Region
Wind
Regional Resource
National Resource
0
20,000
40,000
60,000
80,000
100,000
FRCC ISONE MISO NYISO PJM SERC w/oVACAR
SPP VACAR
MW
Region
Solar
Regional Resource
National Resource

22
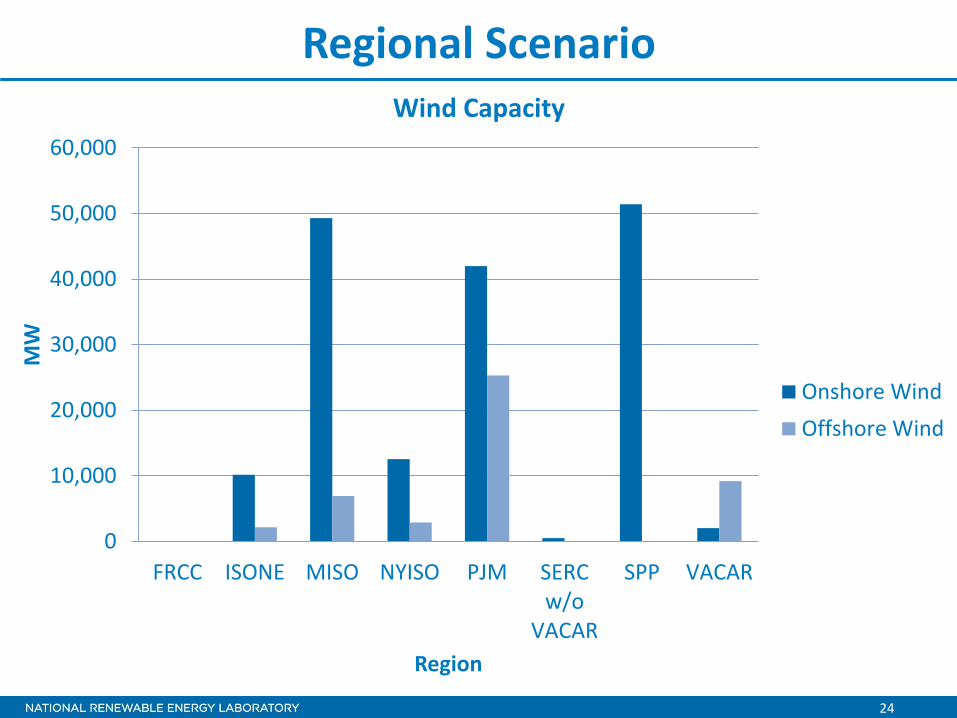
Regional Scenario
Macro Region
Capacity (MW) Energy (GWh) Penetration (%)
Wind Solar Wind Solar Load Wind Solar Total
FRCC 0 40,867 0 79,756 265,852 0% 30% 30%
ISONE 12,294 4,612 35,676 7,135 142,702 25% 5% 30%
MISO 56,197 20,616 171,562 34,221 684,420 25% 5% 30%
NYISO 15,399 5,292 41,014 8,203 164,056 25% 5% 30%
PJM 67,252 22,339 184,682 36,936 738,729 25% 5% 30%
SERC w/o VACAR 487 56,303 1,282 97,376 649,174 0% 15% 15%
SPP 51,413 7,905 169,661 14,457 289,139 59% 5% 64%
VACAR 11,200 19,129 33,234 33,234 221,557 15% 15% 30%
Total 214,243 177,063 637,110 311,318 3,155,630 20% 10% 30%

23
National Scenario
Macro Region
Capacity (MW) Energy (GWh) Penetration (%)
Wind Solar Wind Solar Load Wind Solar Total
FRCC 0 28,987 0 56,878 265,852 0% 21% 21%
ISONE 8,053 1,850 24,237 2,854 142,702 17% 2% 19%
MISO 104,488 10,230 307,989 17,110 684,420 45% 3% 47%
NYISO 15,522 2,646 41,335 4,101 164,056 25% 2% 28%
PJM 57,996 11,201 156,986 18,468 738,729 21% 3% 24%
SERC w/o VACAR 1,498 18,771 3,854 32,459 649,174 1% 5% 6%
SPP 66,602 9,839 219,746 20,806 289,139 76% 7% 83%
VACAR 9,968 6,398 28,789 11,078 221,557 13% 5% 18%
Total 264,126 89,922 782,935 163,754 3,155,629 25% 5% 30%
24
Regional Scenario
0
10,000
20,000
30,000
40,000
50,000
60,000
FRCC ISONE MISO NYISO PJM SERCw/o
VACAR
SPP VACAR
MW
Region
Wind Capacity
Onshore Wind
Offshore Wind

25
Regional Scenario
0
10,000
20,000
30,000
40,000
50,000
60,000
FRCC ISONE MISO NYISO PJM SERCw/o
VACAR
SPP VACAR
MW
Region
Solar
Utility Scale PV
Rooftop PV
26
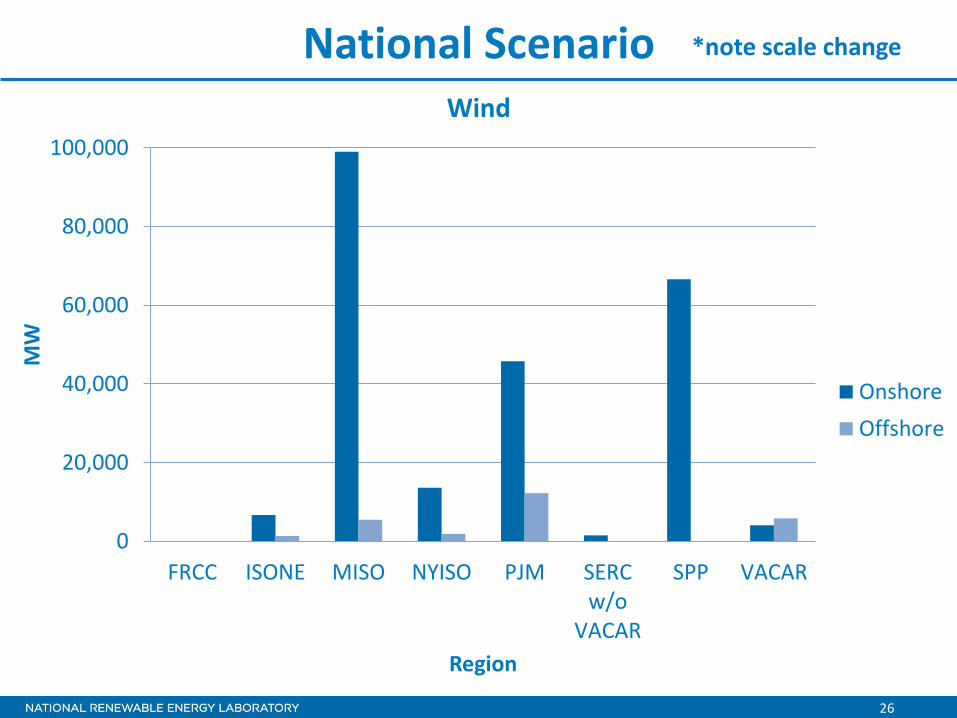
National Scenario
0
20,000
40,000
60,000
80,000
100,000
FRCC ISONE MISO NYISO PJM SERCw/o
VACAR
SPP VACAR
MW
Region
Wind
Onshore
Offshore
*note scale change

27
National Scenario
0
10,000
20,000
30,000
40,000
50,000
60,000
FRCC ISONE MISO NYISO PJM SERCw/o
VACAR
SPP VACAR
MW
Region
Solar
Uility Scale PV
Rooftop PV

28
Rest of Fleet?
• Working group – Use ReEDS analysis?
– Assume only gas combined cycle?
– What about retirements?

29
Discussion: Scenarios

30
What are the generation characteristics?

Wind and Solar Profiles

32
Wind Data
• Wind dataset inherited from the EWITS
o Developed by AWS TruePower
o Dataset developed using numerical forecasting models performing hindcasts based on historical data
o 1325 onshore sites of various plant sizes with 580 GW of capacity and approximately 100 GW of offshore
o 10 minute ‘actuals’ with hourly forecasts at several horizons
o 3 years of data, 2004 - 2006
33
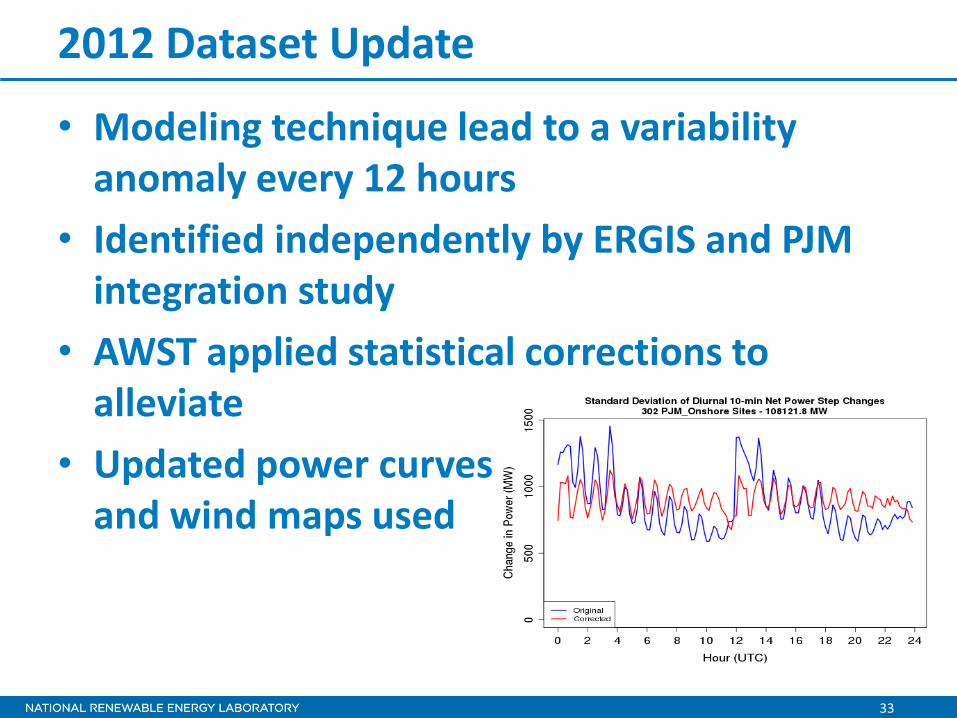
2012 Dataset Update
• Modeling technique lead to a variability anomaly every 12 hours
• Identified independently by ERGIS and PJM integration study
• AWST applied statistical corrections to alleviate
• Updated power curves and wind maps used
34
Wind Site Selection
• Sites selected from EWITS dataset plants based on ReEDS results
• Base Case - existing and planned plus best resources to meet state RPS requirements
• Existing plants in EWITS dataset are ‘built out’ to maximum capacity as identified by AWST
o Unable to scale those down to existing plant sizes as that would distort variability
o Caused penetration in base case to be higher than existing capacity would suggest
o May require some rework of base case

35
Solar Site Selection
• ReEDS analysis again formed the basis for site selection for overall PV targets
• Unlike the wind data, the solar data did not exist for the project o Next section discusses the method being used to simulate
solar data
• Based on regional analysis from ReEDS, sites where PV should be located were selected using simple rules
• Site selection would be 60% utility scale PV plants and 40% distributed rooftop PV
• PV locations over-specified by 20% to allow for variations in capacity factor and scenario flexibility

36
Rooftop Selection
• Selection by county within each ReEDS region
• In a region, counties allocated capacity by population, proportion of state load
o Max of 1 kW/person except 1.5 kW/person in FL
o Counties with small population excluded
o Capacity is allocated surrounding the center of the county

37
Utility Scale PV
• Regional utility PV energy requirement calculated after rooftop complete
• Utility scale PV sites are non-distributed plants
• Selection was manual based on ReEDS results, NREL GHI resource map and estimated CFs
• 1925 plants ranging from 2 MW to 290 MW (avg. 73 MW)
• Final siting when profiles are completed and energy known

38
Solar Profiles
39
Solar Profiles
• Solar Power Output Profiles: o 1-minute, 10-km resolution o ~2000 rooftop sites o ~1500 utility sites
• Key Characteristics: o Appropriate number and size of power output
ramps at each bus o Coincident power ramps occur at closely
clustered nodes; rarely at nodes that are far apart
o Sum of solar power over a region has appropriate ramps
40
http://www.southlandtexturearchive.com/
Solar Profiles
Andy Carter, View of clouds from above, South Africa.

41
Measured Solar Data

42
Measured Solar Data

43
Measured Solar Data

44
Measured Solar Data

45
Clearness Index
45

46
Site Clearness Index Analysis
46
Spatial satellite data is used to calculate the relative proportions of cloud cover in an
area for each hour. This data is related to the sub-hourly measurements of
irradiance. These figures show five consecutive hours of aerial satellite data (left)
and corresponding minutely ground-based irradiance data (right).
47
Solar Profiles
47
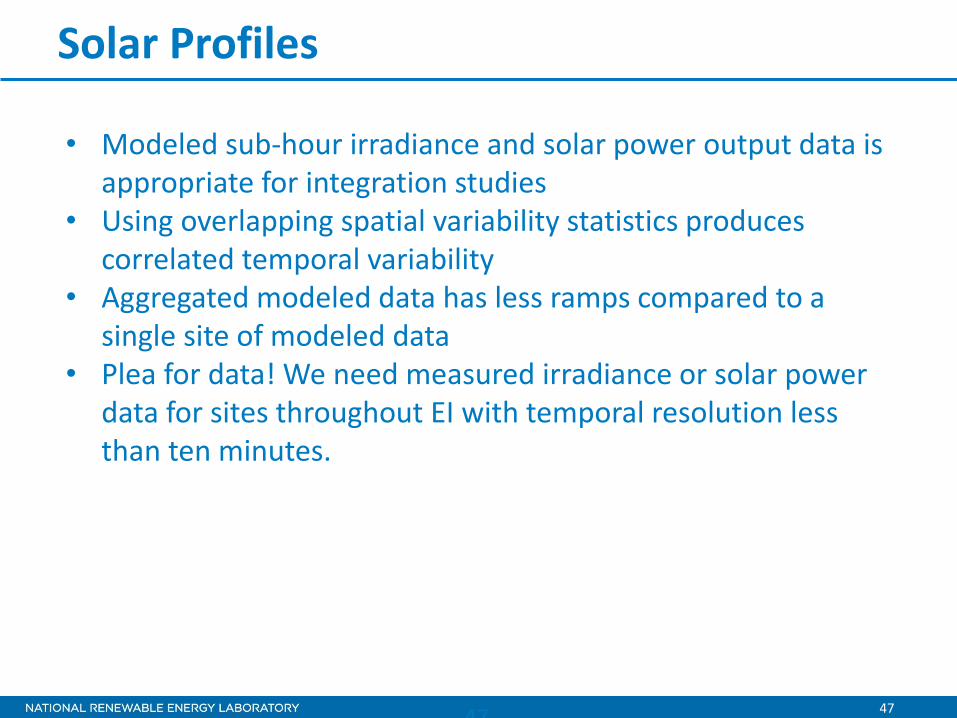
• Modeled sub-hour irradiance and solar power output data is appropriate for integration studies
• Using overlapping spatial variability statistics produces correlated temporal variability
• Aggregated modeled data has less ramps compared to a single site of modeled data
• Plea for data! We need measured irradiance or solar power data for sites throughout EI with temporal resolution less than ten minutes.

48
Discussion: Wind and Solar Profiles
49
What about the other generators?
Generator Characteristics
51
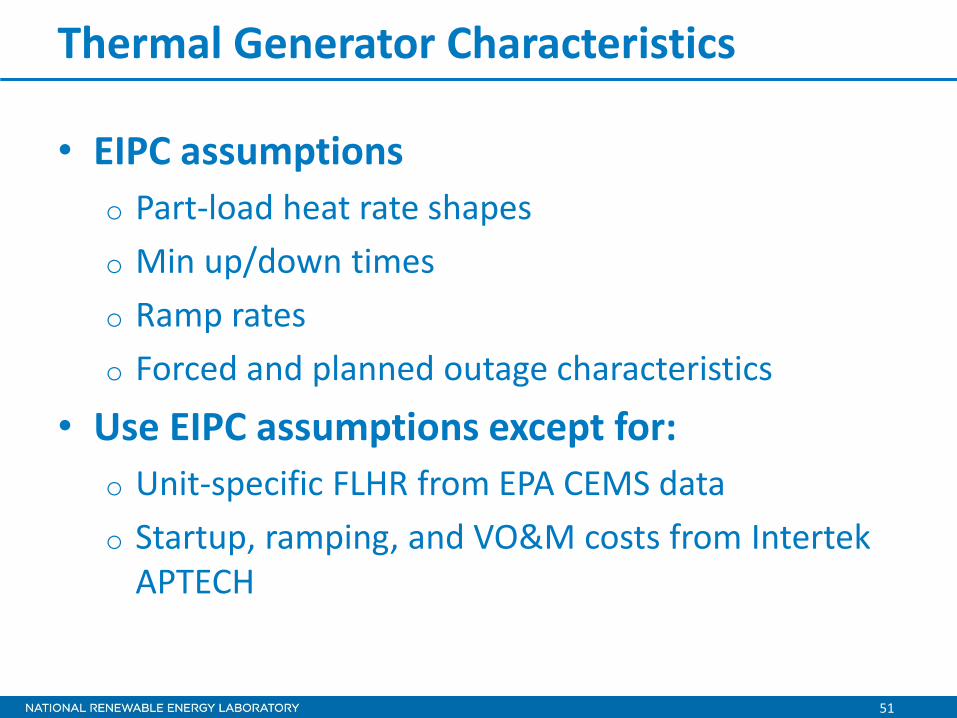
Thermal Generator Characteristics
• EIPC assumptions
o Part-load heat rate shapes
o Min up/down times
o Ramp rates
o Forced and planned outage characteristics
• Use EIPC assumptions except for:
o Unit-specific FLHR from EPA CEMS data
o Startup, ramping, and VO&M costs from Intertek APTECH

52
EIPC Thermal Assumptions
Category
Marginal Heat Rate (% of Max Capacity / % of FLHR)
Minimum Up Time (Hours)
Minimum Down Time
(Hours)
Startup Costs
($/MW)
Ramp Rate (MW/min)
Step 1 Step 2 Step 3 Step 4
CT 100% / 100% 1 1 0
CC 50% / 113% 67%/ 75% 83% / 86% 100% / 100% 6 8 35 10
Coal_ST < 600MW
50% / 106% 75%/ 90% 100% / 100% 24 12 45 3
Coal_ST > 600MW
30% / 110% 50% / 93% 75% / 95% 100% / 100% 24 12 45 3
Oil/Gas_ST < 600MW
30% /110% 50% /90% 75% / 96% 100% / 100% 10 8 40 6
Oil/Gas_ST > 600MW
20% / 110% 50% / 95% 75% / 98% 100% / 100% 10 8 40 6
Nuclear 168 168

53
Revisions
• Intertek APTECH Data o Statistical analysis of maintenance costs to
quantify relative causes – Startup
– Ramping
– VO&M costs
o Startup costs 2-3 times EIPC
o Steady-state VO&M costs lower than EIPC
• Ramp Rates o EIPC assumption is independent of plant size
o Revise to % of capacity/minute

54
Other Generation
• Hydro dispatch strategies and energy limits
• Generator characteristics for expanded capacity

55
Discussion: Generator Characteristics

Transmission Modeling

57
Transmission Representation
• Eastern Interconnect database currently contains:
o 62k nodes
o 57k lines
o Voltage levels from 400 V to 765 kV
• Data came from MMWG
• Add expansion transmission capacity
o EIPC case?

58
Solve Time
• Running a nodal model of the EI at a 5-minute interval presents significant computational challenges.
o WWSIS-2 took 6 days to solve
o ERGIS may take_____?
• Aggregate transmission into suitable zones
o One zone for each RTO/ISO or NERC Region
o Multiple zones for each RTO/ISO or NERC Region

59
Seams Issues
• Flowgates?
• Hurdle rates?
• Interchange holding?
60
Discussion: Transmission Model

61
What is an operational impact analysis?

Variability and Uncertainty
63
Sources
• Wind and Solar
• Load
• Thermal Fleet
• Seams

64
Mitigation Options
• Reserves o Type o Quantity o Source
• Commitment and Dispatch o Day-ahead o 4-hour-ahead o Real-time
• Seams Coordination o Hourly interchange o 15-minute interchange o 5-minute interchange

65
Discussion: Variability and Uncertainty

Next Steps

67
Industry Involvement
• Technical Review Committee (TRC)
o Quarterly all-day in-person meetings
o Review technical analysis of working groups
• Working Groups
o Highly technical
o Participate in many groups
o 1-2 hour conference calls
o Clustered
68
Working Groups
• Potential Topics
o Generator characteristics
o Wind and solar profiles
o Transmission modeling
o Thermal fleet expansion and retirement
o Reserves analysis
o Others ideas?

69
TRC Meetings
• Where
o In the Eastern Interconnection
o Close to airport hub
o Suggestions, volunteers?
• Future Meetings
o June 2013
o September 2013
o November/December 2013

70
Questions or Comments?
Contact
(720) 402-2065
71
Disclaimer
• This document is for discussion and development purposes only. Any data or statements contained in this document are subject to revision without notice. Do not cite or quote. Contact [email protected] with any questions.