Embed Size (px)
Citation preview
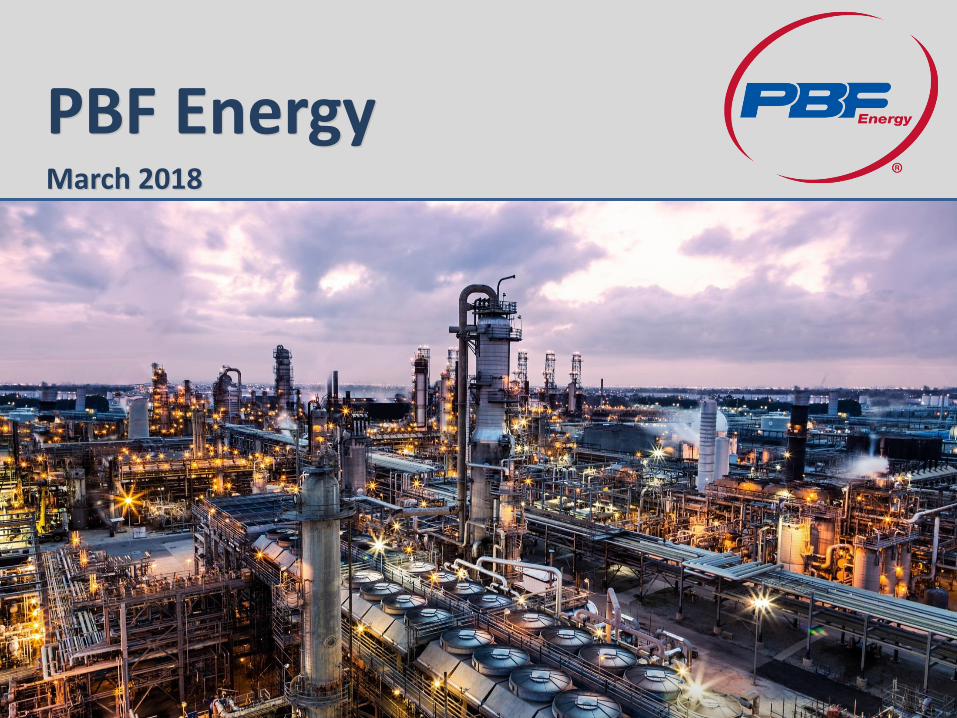
PBF EnergyMarch 2018
1
This presentation contains forward-looking statements made by PBF Energy Inc. (“PBF Energy”), the indirect parent of PBF Logistics LP (“PBFX”, or“Partnership”, and together with PBF Energy, the “Companies”, or “PBF”), and their management teams. Such statements are based on currentexpectations, forecasts and projections, including, but not limited to, anticipated financial and operating results, plans, objectives, expectations andintentions that are not historical in nature. Forward-looking statements should not be read as a guarantee of future performance or results, andmay not necessarily be accurate indications of the times at, or by which, such performance or results will be achieved. Forward-looking statementsare based on information available at the time, and are subject to various risks and uncertainties that could cause the Companies’ actualperformance or results to differ materially from those expressed in such statements. Factors that could impact such differences include, but are notlimited to, changes in general economic conditions; volatility of crude oil and other feedstock prices; fluctuations in the prices of refined products;the impact of disruptions to crude or feedstock supply to any of our refineries, including disruptions due to problems with third party logisticsinfrastructure; effects of litigation and government investigations; the timing and announcement of any potential acquisitions and subsequentimpact of any future acquisitions on our capital structure, financial condition or results of operations; changes or proposed changes in laws orregulations or differing interpretations or enforcement thereof affecting our business or industry; actions taken or non-performance by thirdparties, including suppliers, contractors, operators, transporters and customers; adequacy, availability and cost of capital; work stoppages or otherlabor interruptions; operating hazards, natural disasters, weather-related delays, casualty losses and other matters beyond our control; inability tocomplete capital expenditures, or construction projects that exceed anticipated or budgeted amounts; ability to consummate potentialacquisitions, the timing for the closing of any such acquisition and our plans for financing any acquisition; unforeseen liabilities associated with anypotential acquisition; inability to successfully integrate acquired refineries or other acquired businesses or operations; effects of existing and futurelaws and governmental regulations, including environmental, health and safety regulations; and, various other factors.
Forward-looking statements reflect information, facts and circumstances only as of the date they are made. The Companies assume noresponsibility or obligation to update forward-looking statements to reflect actual results, changes in assumptions or changes in other factorsaffecting forward-looking information after such date.
See the Appendix for reconciliations of the differences between the non-GAAP financial measures used in this presentation, including variousestimates of EBITDA, and their most directly comparable GAAP financial measures.
Safe Harbor Statements

Second most complex independent refiner with geographically diverse footprint
Crude and feedstock optionality provides access to most economic input slate
Strategic relationship with PBF Logistics (NYSE:PBFX) provides growth partnership
Long and successful history of executing accretive acquisitions and driving growth
Proven track record of investing in organic, margin-improvement projects
Targeting self-help projects to enhance margin capture and increase commercial flexibility
Focused internal investment to drive growth and enhance margins
Maintain conservative balance sheet and strong liquidity
Access to low cost-of-capital through strategic PBFX relationship
Refining and Logistics segments provide dual growth platforms
Increase refining profitability through reliable operations and reduced costs
Diversify logistics footprint through organic growth and third-party transactions
Attractive
Asset Base
PBF – A Compelling Investment
Proven
Track Record
Disciplined
Capital Allocation
Future
Growth Opportunities
3

Attractive Asset Diversification and Growth
PBF's core strategy is to operate safely, reliably and responsibly
Pursue disciplined growth strategy through strategic refining and logistics acquisitions and development of organic projects
Diversified asset base with five refineries and 884,000 barrels per day of processing capacity• Second most complex refining system with
12.2 Nelson Complexity
RegionThroughput Capacity
(bpd)Nelson
Complexity
Mid-continent 170,000 9.2
East Coast 370,000 12.2
Gulf Coast 189,000 12.7
West Coast 155,000 14.9
Total 884,000 12.2
Source: Company reports
0
500
1,000
1,500
2,000
2,500
VLO
PS
X
MP
C
AN
DV
PB
F
HF
C
DK
CV
I
US Independent Refiners by Throughput Capacity
Paulsboro
Toledo
Chalmette
Torrance
PADD 2
PADD 3
PADD 5
Delaware City
PADD 4
PADD 1
4
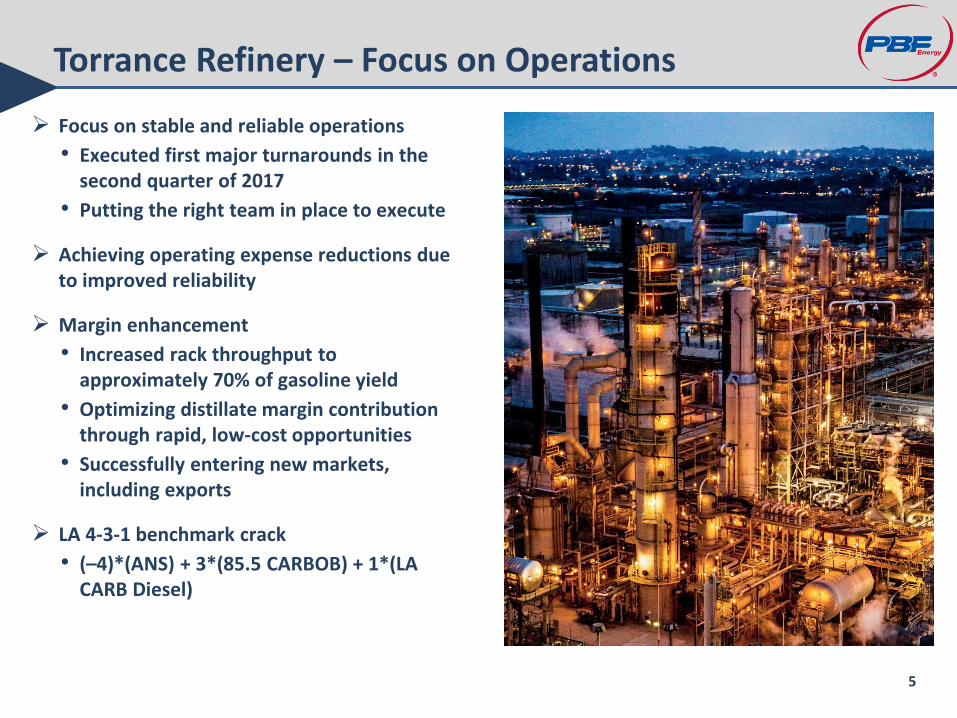
Torrance Refinery – Focus on Operations
Focus on stable and reliable operations
• Executed first major turnarounds in the second quarter of 2017
• Putting the right team in place to execute
Achieving operating expense reductions due to improved reliability
Margin enhancement
• Increased rack throughput to approximately 70% of gasoline yield
• Optimizing distillate margin contribution through rapid, low-cost opportunities
• Successfully entering new markets, including exports
LA 4-3-1 benchmark crack
• (–4)*(ANS) + 3*(85.5 CARBOB) + 1*(LA CARB Diesel)
5
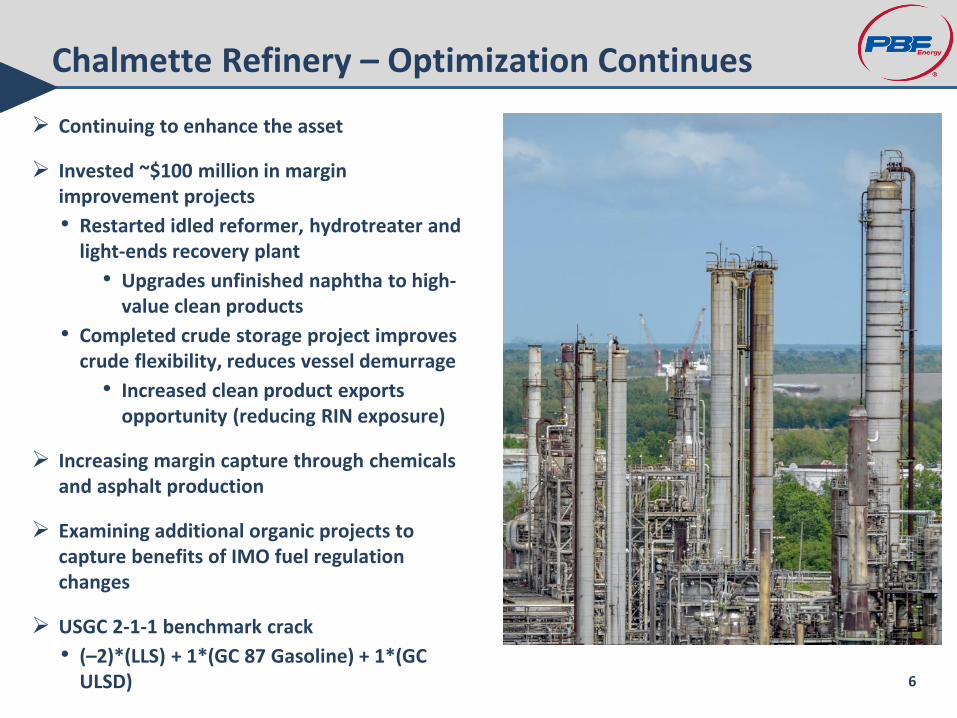
Continuing to enhance the asset
Invested ~$100 million in margin improvement projects
• Restarted idled reformer, hydrotreater and light-ends recovery plant
• Upgrades unfinished naphtha to high-value clean products
• Completed crude storage project improves crude flexibility, reduces vessel demurrage
• Increased clean product exports opportunity (reducing RIN exposure)
Increasing margin capture through chemicals and asphalt production
Examining additional organic projects to capture benefits of IMO fuel regulation changes
USGC 2-1-1 benchmark crack
• (–2)*(LLS) + 1*(GC 87 Gasoline) + 1*(GC ULSD)
Chalmette Refinery – Optimization Continues
6
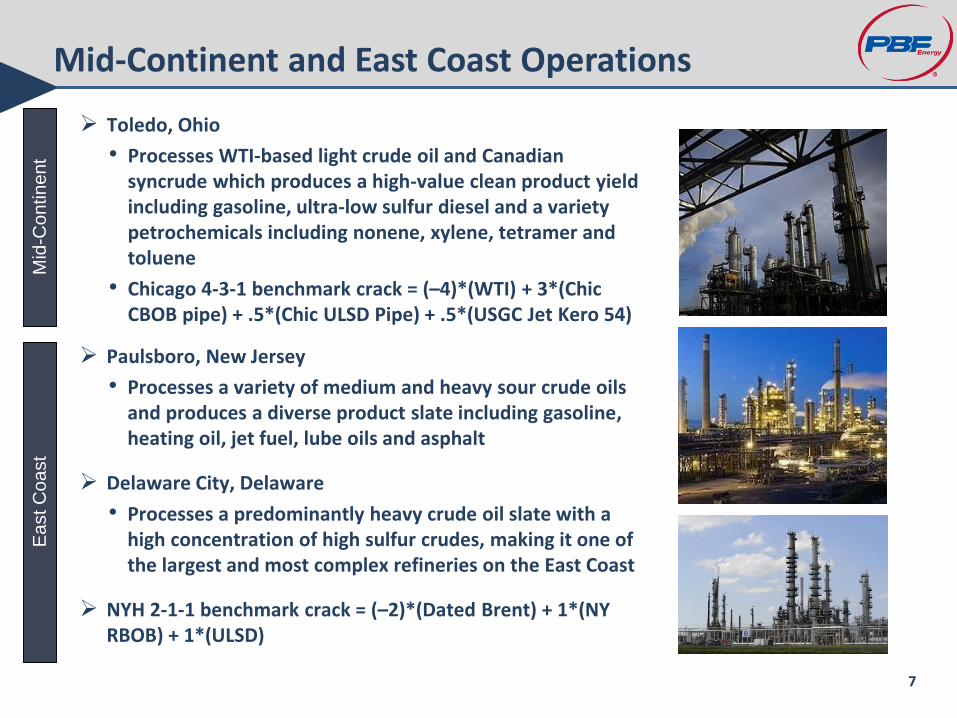
Toledo, Ohio
• Processes WTI-based light crude oil and Canadian syncrude which produces a high-value clean product yield including gasoline, ultra-low sulfur diesel and a variety petrochemicals including nonene, xylene, tetramer and toluene
• Chicago 4-3-1 benchmark crack = (–4)*(WTI) + 3*(Chic CBOB pipe) + .5*(Chic ULSD Pipe) + .5*(USGC Jet Kero 54)
Mid
-Co
ntin
en
tE
ast C
oa
st
Paulsboro, New Jersey
• Processes a variety of medium and heavy sour crude oils and produces a diverse product slate including gasoline, heating oil, jet fuel, lube oils and asphalt
Delaware City, Delaware
• Processes a predominantly heavy crude oil slate with a high concentration of high sulfur crudes, making it one of the largest and most complex refineries on the East Coast
NYH 2-1-1 benchmark crack = (–2)*(Dated Brent) + 1*(NY RBOB) + 1*(ULSD)
Mid-Continent and East Coast Operations
7

PBFX – A Strategic and Valuable Partner
PBF indirectly owns 100% of the general partner and ~44% of the limited partner interests of PBF Logistics LP (NYSE: PBFX)
Stable cash flows supported by long-term, take-or-pay Minimum Volume Commitments
• No direct commodity exposure
PBFX announced a 4-year, ~$100 million EBITDA organic project pipeline
Partnership allows PBF to drop-down ~$200-250 million EBITDA(1) of remaining logistics assets and utilize proceeds to de-lever and improve liquidity
Organic projects and third-party acquisitions add incremental growth to PBFX while extending the backlog timeline
Summary of Executed Drop-Downs*
Announcement
DateAsset
Projected
Annual Net
Income
($mm)
Projected
Annual
EBITDA
($mm)
Gross
Sale
Price
($mm)
9/15/2014
Delaware City Heavy
Crude Unloading
Rack
$12 $15 $150
12/2/2014Toledo Storage
Facility$9 $15 $150
5/15/2015Delaware City
Pipeline / Truck Rack$12 $14 $143
8/11/2016
Torrance Valley
Pipeline Company
LLC (50% interest)
$9 $20 $175
Total $42 $64 $618
*For reconciliation from EBITDA to Net Income please refer to PBF 8-K filings
dated 9/19/14 (p.164); 12/5/14 (p.80); 5/5/15 (p.80) and 9/7/16 (p.201),
respectively. EBITDA is a non-GAAP financial measure. See Appendix for
additional information.
8
___________________________1. Estimate as of 9/30/17. We are unable to provide a reconciliation of this forward-looking estimate of non-GAAP EBITDA because certain information needed to make a reasonable
forward-looking estimate is difficult to estimate and dependent on future events which may be uncertain or outside of our control, including with respect to unknown financing terms, acquisition timing, unanticipated acquisition costs, negotiation of acquisition terms and other potential variables. Accordingly, a reconciliation is not available without unreasonable effort.
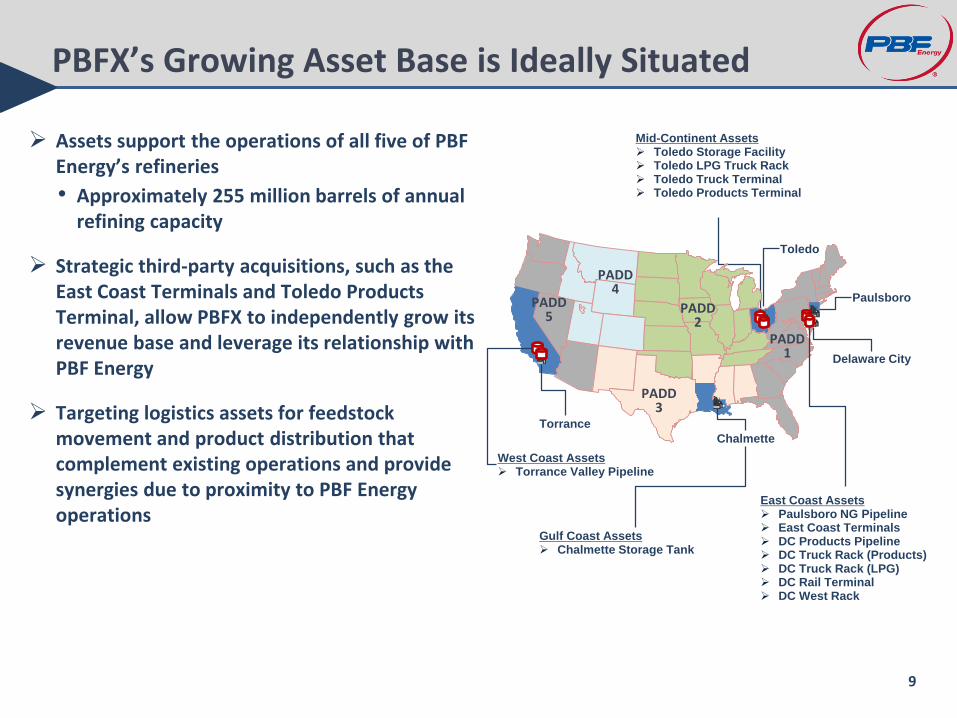
PBFX’s Growing Asset Base is Ideally Situated
Mid-Continent Assets Toledo Storage Facility Toledo LPG Truck Rack Toledo Truck Terminal Toledo Products Terminal
East Coast Assets Paulsboro NG Pipeline East Coast Terminals DC Products Pipeline DC Truck Rack (Products) DC Truck Rack (LPG) DC Rail Terminal DC West Rack
Assets support the operations of all five of PBF Energy’s refineries
• Approximately 255 million barrels of annual refining capacity
Strategic third-party acquisitions, such as the East Coast Terminals and Toledo Products Terminal, allow PBFX to independently grow its revenue base and leverage its relationship with PBF Energy
Targeting logistics assets for feedstock movement and product distribution that complement existing operations and provide synergies due to proximity to PBF Energy operations
Paulsboro
Toledo
Chalmette
Torrance
PADD 2
PADD 3
PADD 5
Delaware City
PADD 4
PADD 1
West Coast Assets Torrance Valley Pipeline
9
Gulf Coast Assets Chalmette Storage Tank

Macro Landscape Outlook
Abundant global supply of crude oil
• Increasing North American production
•OPEC cuts driving near-term tightness in L-H spread
Global product demand expected to outpace refinery capacity utilization and additions
•Global products inventories have reverted to the norm from a state of oversupply
IMO 2020 changing bunker fuel specification should drive increased diesel demand and support wider L-H differentials
10
Appendix
Our management uses EBITDA (earnings before interest, income taxes, depreciation and amortization) as a measureof operating performance to assist in comparing performance from period to period on a consistent basis and toreadily view operating trends, as a measure for planning and forecasting overall expectations and for evaluatingactual results against such expectations, and in communications with our board of directors, creditors, analysts andinvestors concerning our financial performance.
EBITDA is not a presentation made in accordance with GAAP and our computation of EBITDA may vary from others inour industry. EBITDA should not be considered as an alternative to operating income (loss) or net income (loss) asmeasures of operating performance. In addition, EBITDA is not presented as, and should not be considered, analternative to cash flows from operations as a measure of liquidity.
This presentation includes references to EBITDA and EBITDA attributable to PBFX, which is a non-GAAP financialmeasure that is reconciled to its most directly comparable GAAP measure in the quarterly and annual reports onForms 10-Q and 10-K for PBFX. We define EBITDA attributable to PBFX as net income (loss) attributable to PBFXbefore net interest expense, income tax expense, depreciation and amortization expense attributable to PBFX, whichexcludes the results attributable to noncontrolling interests and acquisitions from affiliate companies under commoncontrol prior to the effective dates of such transactions. With respect to projected MLP-qualifying EBITDA, we areunable to prepare a quantitative reconciliation to the most directly comparable GAAP measure without unreasonableeffort, as, among other things, certain items that impact these measures, such as the provision for income taxes,depreciation of fixed assets, amortization of intangibles and financing costs have not yet occurred, are subject tomarket conditions and other factors that are out of our control and cannot be accurately predicted.
Non-GAAP Financial Measures
12

PBF Energy 2018 Guidance
Initial guidance provided constitutes forward-looking information and is based on current PBF Energy operating plans, company assumptions and company
configuration. Except where noted, guidance expense figures include consolidated amounts for PBF Logistics LP. All figures are subject to change based on
market and macroeconomic factors, as well as company strategic decision-making and overall company performance.
(Figures in millions except per barrel amounts)FY 2018E Q1-2018E
East Coast Throughput 330,000 – 350,000 bpd 330,000 – 350,000 bpd
Mid-Continent Throughput 150,000 – 160,000 bpd 125,000 – 135,000 bpd
Gulf Coast Throughput 175,000 – 185,000 bpd 180,000 – 190,000 bpd
West Coast Throughput 160,000 – 170,000 bpd 160,000 – 170,000 bpd
Total Throughput 815,000 – 865,000 bpd 795,000 – 845,000 bpd
FY 2018E Notes
Refining operating expenses $5.25 - $5.50 / bbl
SG&A expenses $160 - $170 Excludes incentive and stock-based compensation
D&A $340 - $360
Interest expense, net $150 - $160
Capital expenditures $525 - $550 Excludes capital expenditures for PBF Logistics LP
Diluted shares outstanding at 12/31/2017 114
Turnaround Schedule Period Duration
Toledo – Hydrocracker / Crude / Reformer Q1 35 – 45 days
Chalmette – FCC / Alky Q1 – 2 30 – 40 days
Delaware City – CT / Alky units Q1 – 2 35 – 45 days
Delaware City – Cat Cracker Q4 30 – 35 days
Paulsboro – Crude / Coker Q3 – 4 30 – 40 days
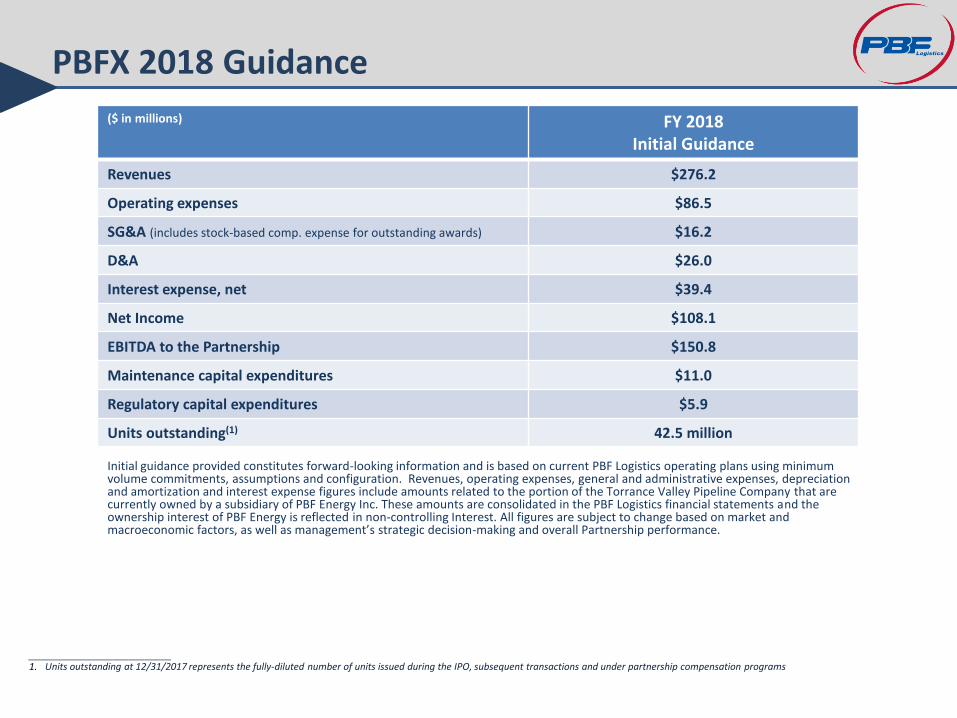
PBFX 2018 Guidance
Initial guidance provided constitutes forward-looking information and is based on current PBF Logistics operating plans using minimum volume commitments, assumptions and configuration. Revenues, operating expenses, general and administrative expenses, depreciation and amortization and interest expense figures include amounts related to the portion of the Torrance Valley Pipeline Company that are currently owned by a subsidiary of PBF Energy Inc. These amounts are consolidated in the PBF Logistics financial statements and the ownership interest of PBF Energy is reflected in non-controlling Interest. All figures are subject to change based on market and macroeconomic factors, as well as management’s strategic decision-making and overall Partnership performance.
($ in millions) FY 2018Initial Guidance
Revenues $276.2
Operating expenses $86.5
SG&A (includes stock-based comp. expense for outstanding awards) $16.2
D&A $26.0
Interest expense, net $39.4
Net Income $108.1
EBITDA to the Partnership $150.8
Maintenance capital expenditures $11.0
Regulatory capital expenditures $5.9
Units outstanding(1) 42.5 million
___________________________1. Units outstanding at 12/31/2017 represents the fully-diluted number of units issued during the IPO, subsequent transactions and under partnership compensation programs


![g]kfn ;/sf/ pBf]u, jfl)fHo tyf cfklt{ dGqfno pBf]u ljefu](https://img.dokumen.tips/doc/110x75/62571c4530b6b14b3b627649/gkfn-sf-pbfu-jflfho-tyf-cfklt-dgqfno-pbfu-ljefu.jpg)


![g]kfn ;/sf/ pBf]u dGqfno pBf]u ljefu](https://img.dokumen.tips/doc/110x75/61b4af4c99949b10312c9ada/gkfn-sf-pbfu-dgqfno-pbfu-ljefu.jpg)