Embed Size (px)
Citation preview

MARINE ECOLOGY PROGRESS SERIESMar Ecol Prog Ser
Vol. 365: 77–89, 2008doi: 10.3354/meps07559
Published August 18
INTRODUCTION
Settlement panels provide an ideal tool for investi-gating ecological patterns and processes of sessile en-crusting epifauna in benthic ecosystems (e.g. Stachow-icz et al. 2002). They have been used to studyenvironmental impacts in temperate environments, forexample of marinas (Glasby 1997, 1998), and the roleof urban structures as marine habitats (Connell 2001).They reduce heterogeneity associated with naturalsubstrata, provide a degree of uniformity and facilitatereplication, which is essential to estimate natural vari-ation in comparisons of different areas. Studies ofdeveloping epibiotic assemblages in temperate areashave found significant spatial variation at scales from
10s to 1000s of m (Keough 1983, Butler 1986, Glasby1998), but settlement panels are also suitable in testsfor differences and patterns at local scales (Glasby1998), making them useful in impact assessment andmonitoring.
Environmental impact studies in near-shore habitatscommonly focus on assemblages of soft-sedimentmacrofauna, largely because sediments accumulatecontaminants (Goldberg et al. 1975, Stark et al. 2003b).Less common is the use of assemblages on hard sub-strata, which provide different ecological information,as they are less likely to be affected by accumulatedcontaminants in sediments. Their development is moreresponsive to short-term or periodic environmentalchanges, such as waterborne pulsed pollution events,
© Inter-Research 2008 · www.int-res.com*Email: [email protected]
Patterns of higher taxon colonisation anddevelopment in sessile marine benthic assemblages
at Casey Station, Antarctica, and their use inenvironmental monitoring
Jonathan S. Stark*
Australian Antarctic Division, Channel Highway, Kingston, Tasmania 7050, Australia
ABSTRACT: Colonisation and development of sessile epibiotic assemblages on tiles was studied atCasey Station, East Antarctica, using a mix of higher taxon classifications (family to phylum). Tileswere deployed for 1 and 3 yr at 3 control and 2 impacted locations. Assemblages on upper and lowersurfaces of tiles were very different, with little colonisation of upper surfaces (0 to 11% after 3 yr) andextensive colonisation of lower surfaces (60 to 91% after 3 yr), which is greater than previouslyreported from Antarctica. Hypotheses were tested relating to spatial variation, depth, human impacts(a sewage outfall and a waste disposal site) and period of deployment. Differences between controllocations were only apparent after 3 yr, but there were significant differences between control andimpacted locations after 1 yr. There were differences between assemblages at 7 to 10 m and 19 to22 m. Assemblages were initially dominated by spirorbid polychaetes and bryozoans, but by 3 yrthere was significant sponge cover at some locations. Both impacted locations had significantlygreater cover on upper surfaces than controls. The waste disposal site had the least cover on lowersurfaces, with almost no sponge and less bryozoans than controls. The outfall had the greatest coveron the lower surfaces, the greatest cover of spirorbids and sponges but the least cover of bryozoans.Higher taxa assemblage patterns of colonisation on settlement panels are potentially useful as amedium- to long-term monitoring tool for sheltered Antarctic nearshore waters.
KEY WORDS: Marine benthos · Colonisation · Settlement panels · Environmental impact ·Assemblage succession · Monitoring
Resale or republication not permitted without written consent of the publisher

Mar Ecol Prog Ser 365: 77–89, 2008
which may occur when contaminants are introduced orresuspended. The few previous studies of epibioticassemblage development on hard substratum inAntarctica have reported very low colonisation rates(Dayton 1989, Rauschert 1991, Barnes 1996, Stanwell-Smith & Barnes 1997). Recently, however, Bowden etal. (2006) reported faster colonisation rates in Antarc-tica with assemblage development that was highlylocation-specific in terms of both composition andabundance, with significant spatial variability at scalesof <5 km, and also influenced by depth.
There is a need for techniques suitable for monitor-ing the impact of anthropogenic activities like sewagerelease and waste disposal on the Antarctic environ-ment. Antarctic stations established before the late1980s disposed of waste in convenient landfill sites,often close to shorelines. Abandoned waste disposalsites pose environmental threats to marine ecosystemsthrough runoff and leaching of contaminants into thesea during summer melt periods, creating pulsed pol-lution events. The effects of these waste disposal siteshas become a recent focus of research in areas ofAntarctica (Lenihan 1992, Lenihan & Oliver 1995,Stark et al. 2003a,b, 2004, 2005), but this research hasfocused exclusively on soft sediments. There has alsobeen research into the effects of sewage outfalls on softsediments in Antarctica (Green & Nichols 1995, Con-lan et al. 2004). Research at Casey Station has shownconclusive evidence of environmental impacts of awaste disposal site and the sewage outfall in soft sedi-ments (Stark et al. 2003a,b, 2004). However, there areno published studies of environmental impacts on ben-thic assemblages in hard substratum habitats inAntarctica, and settlement panels have not been usedthere for environmental monitoring or impact assess-ment.
Fauna in soft sediments exhibit a range of responsesto certain types of stressors, some of which can becharacterised at higher taxonomic levels, e.g. poly-chaetes and organic contamination (Pearson & Rosen-berg 1978). Despite species-level differences within ataxon in response to environmental influences, it hasbeen clearly demonstrated that there are generalizedhigher-level taxon responses to certain stressors (suchas pollution), some of which are apparent even at thephylum level (Lenihan et al. 2003). These higher-taxonresponses are generally driven by particular species orfamilies within the taxon, for which there may be con-trasting responses for other species or families withinthe same taxon (Lenihan et al. 2003). This does notinvalidate the higher-taxon pattern that is observed inresponse to a stressor. Whether the actual cause isdirect (e.g. sensitivity to pollution) or indirect (e.g. arelease from predation), such characteristic patternscan be valuable, e.g. in a monitoring context. These
quantitative observations not only provide the contextand basis for further understanding of the mechanismsand processes responsible (Underwood et al. 2000),but also provide important information in their ownright. Many studies have demonstrated little loss ofinformation by analysing data at higher taxonomic lev-els, even phylum (Warwick 1988, Somerfield & Clarke1995, Olsgard et al. 1998), but even where specieslevel patterns may be different, important informationcan be gained at higher levels. Working at higher lev-els may also reduced the noise and variability associ-ated with signals at species level (Warwick 1993).Additionally, the concept of identifying organisms to alevel sufficient to meet a study’s objectives, such as forenvironmental monitoring, or to streamline sampleprocessing is well known (Ellis 1985, Anderson et al.2005). Responses of biota on hard substrata to pollutionat higher taxononomic levels are less well known thanin sediments, but they have been shown to exhibitclear patterns in response to other environmental vari-ables from family level, e.g. spirorbid polychaetes(Glasby & Connell 2001), up to phylum level, e.g.sponges (Glasby 2001). While species identificationsare important to certain ecological questions, theextent to which assemblage patterns at higher taxo-nomic levels relate to environmental influences war-rants further investigation (Anderson et al. 2005).
The aim of this study was to determine whetherthere were general patterns of colonisation and devel-opment of Antarctic sessile benthic assemblagesapparent at higher taxonomic levels, using coarse res-olution of family, morphospecies/functional groupsand phylum and to determine how useful these mightbe for environmental monitoring. Five hypotheseswere tested relating to assemblage development ontiles: (1) spatial—that there would be differences inassemblages at scales of several km (between loca-tions), and at 10 to 50 m (between sites within loca-tions); (2) impact—that there would be differencesbetween impacted locations (adjacent to a waste dis-posal site and a sewage outfall) and control locations;(3) depth—that there would be differences betweendepths within locations; (4) temporal—that therewould be differences between assemblages at 1 and 3yr; and (5) variability—that there would be differencesin the variability of assemblages between control andimpacted locations.
MATERIALS AND METHODS
Study area. Casey Station (66° 17’ S, 110° 32’ E) is inthe Windmill Islands, East Antarctica (Fig. 1a,b). Lowrocky hills and ice cliffs border several bays aroundCasey, which contain smaller, inner bays. Sea ice cover
78

Stark: Colonisation of Antarctic marine benthic assemblages
in these bays is 1.2 to 2 m thick, and breakout at thesites in this study occurs between December and Feb-ruary in most years.
The old Casey waste disposal site is in Thala Valley,450 m northeast of Casey Station, adjacent to BrownBay (Fig. 1d). Waste material was dumped at the sea-ward end of Thala Valley and directly into the baybetween 1969 and 1986 (Deprez et al. 1999, Snape etal. 2001). During summer, melt water from the sur-rounding slopes runs through the valley and perco-lates through the site, entraining contaminants beforeentering the marine environment and depositing themin Brown Bay (Snape et al. 2001). Sediments in BrownBay are contaminated by metals and hydrocarbons(Stark et al. 2003b).
The Casey sewage outfall discharges secondarytreated and occasionally primary treated sewage ca.40 m from the edge of Shannon Bay into the ice cliff.Heated sewage has melted a hole in the ice down to
the rock ~5 m beneath, where it follows an unknownpath for 10s of m into Shannon Bay. A pilot study indi-cated that there was a distributed discharge along theshore of Shannon Bay rather than a point source, withsignificant levels of ammonia, phosphorous and bacte-ria in the water column (Morris et al. 2000).
Materials. The settlement panels consisted ofunglazed porcelain tiles (15 × 15 cm), with a slightlytextured upper surface and 3 × 3 cm slightly raisedgrid (~1 mm high) on the lower surface. Two tileswere attached 10 cm apart with silicon to the topedge of a trough made from one-half of a 40 cm long,15 cm diameter stormwater pipe (Fig. 2a). The endsof each trough were open, leaving a semi-cylindricalcavity under each tile. Thus, the upper and lower sur-faces were both exposed to predation and currents.The pipe was attached to the top of a mesh bag con-taining rocks as ballast and the tube was positionedhorizontally on the seabed. After collection, the tiles
79
WI
akm
Win
dmill
Isla
nds
Control-2Control-3
Shannon Bay
Newcomb Bay
O'Brien Bay
Brown Bay Casey Station
!.
a
b
c
Impacted-2
Impacted-1
Control-1
Sewage outfall Brown Bay
Casey waste disposal site
d
0
0 2.5 5 10
250 500125m
a
N
N
Fig. 1. (a) Windmill Islands (WI) region in Antarctica; (b) Casey station area (boxed) in the Windmill Islands; (c) Casey Stationand the tile deployment locations; (d) Casey Station and the deployment locations (Impacted-1, Impacted-2, Control-1) near
the sewage outfall and waste disposal site

Mar Ecol Prog Ser 365: 77–89, 2008
were photographed using a high-resolution (5 mega-pixel) digital camera while the organisms were stillalive and then preserved in alcohol for a future studyof species-level patterns. A grid of 100 evenly spacedpoints, excluding the outer 1 cm of each tile, wasoverlain on the photographs of the upper and lowersurfaces of each tile and the biota directly under eachpoint was identified using the cate-gories of taxon shown in Table 1.
Experimental design. Tiles weredeployed and collected by divers at 5locations. Two locations were adjacentto sources of contamination and areknown to have contaminated sedi-ments and disturbed soft-sedimentcommunities (Stark et al. 2003a, Starket al. 2003b): Impacted-1 was in BrownBay, ~50 m from the waste disposalsite; Impacted-2 was in Shannon Bay,~100 m from the sewage outfall(Fig. 1c,d). There were 3 uncontami-nated control locations: Control-1 wasin the outer part of Brown Bay, ~500 mfrom the waste disposal site; Control-2and Control-3 were in O’Brien Bay,south of Casey Station (Fig. 1c). Tileswere deployed at 2 depths at eachlocation (7 to 10 m and 19 to 22 m)except at Impacted-1 and Control-1.At each depth, tiles were deployed at2 sites ~20 m apart in groups of 8 tiles(4 troughs ~1 to 2 m apart), for a totalof 32 tiles at each location (Fig. 2b). Itwas not possible to deploy deep tiles atImpacted-1, as there is no deep habitatnear the waste disposal site, nor was itpossible to deploy shallow tiles at
Control-1. However, at these 2 locations, 2 groups of 8tiles (in plots of 4 troughs) were placed ~50 m apart toexamine small-scale spatial variation. Tiles weredeployed between 15 November and 31 December1997. Tiles were collected after 1 yr (between 1 and 23February 1999) and 3 yr (between 13 and 19 December2001). One tile was collected from each of 2 randomlyselected pipes at each site/depth at each sampling time(a total of 8 per location). Some tiles could not beretrieved, including 2 tiles at Impact-1 during the firstcollection, and all tiles at Control-2 and 2 tiles at Con-trol-3 during the second collection.
Statistical analyses. Tests of multivariate nullhypotheses of no differences among a priori definedgroups were done using analysis of similarities(ANOSIM, Clarke 1993) in PRIMER-6 (PlymouthMarine Laboratory). Similarity matrices were basedon the Bray-Curtis similarity measure on arcsin ofsquare-root (sin–1 √prop) transformed proportionalcover. This has the effect of decreasing the weightingof very abundant taxa and increasing the weightingof very rare taxa, with little effect on mid-range pro-portions (Quinn & Keough 2002). Many studies haveused fourth root transformed percentage cover oftaxa (e.g. Glasby 2001, Glasby & Connell 2001); how-
80
Description
Upper surfacesDiatoms Biofilm consisting mainly of diatomsMacroalgae Red macroalgae only, not possible to identify from
basal growthsSpirorbids All dextral coiling (clockwise spiral)Sponge Very little sponge recorded on upper surfaces,
mainly Homaxinella sp.Encrusting bryozoan Flat, prostrate cheilostomate coloniesLower surfacesMacroalgae Red macroalgae onlySpirorbids All dextral coiling (clockwise spiral)Encrusting bryozoans Flat, prostrate cheilostomate coloniesBranching bryozoans Upright, branching cyclostomate bryozoan,
mainly Hornera sp.Round bryozoans Uniformly round, domelike coloniesLumpy bryozoans Encrusting but not prostrate, lumpy in appearance,
mainly Beania sp.Sponge 1 White/beige small tube-forming spongeSponge 2 Beige spiky spongeSponge 3 White encrusting spongeSponge 4 Orange encrusting spongeEggs Possibly gastropod eggsHydroids Feather-like thecate hydroidsTerrebellids Tube-building terrebellid polychaetesAscidian 1 Clear, colourless ascidianAscidian 2 Pale green ascidianUnidentifiable All other organisms unidentifiable from photos
Table 1. Taxonomic categories used in analysis of tiles
Fig. 2. (a) Two tiles were situated in the top of a trough formedfrom one-half of a PVC pipe; (b) Experimental design at eachsite showing groups of 8 tiles, 2 shallow sites and 2 deep sites.At Impacted-1 and Control-1 there was no depth comparison(the seabed was flat) but the layout was the same to test for
spatial differences
Stark: Colonisation of Antarctic marine benthic assemblages
ever, this is an extreme transformation for percentagecover data, which essentially reduces abundancesinto 4 categories. Relationships between sampleswere represented graphically using non-metric multi-dimensional scaling (nMDS) ordinations. Taxa con-tributing to differences between groups were deter-mined using similarity of percentages analysis(SIMPER, Clarke 1993). A test for small-scale spatialvariation was done at 2 locations, Impacted-1 andControl-1, where no depth comparisons were possiblebut the additional sites provided the replication nec-essary for an ANOSIM test for differences betweensites. Where multiple comparisons were made, thesignificance level used was adjusted using thesequential Bonferroni correction (Rice 1989). Differ-ences in the variability of assemblages were testedusing the program PERMDISP2 (Anderson 2004),which compared the multivariate dispersions amonggroups on the basis of Bray-Curtis dissimilarity. Thetest calculates the distances from observations to theirgroup centroids and compares the average of thesedistances among groups, using ANOVA (Anderson2006). A p-value is then obtained using permutationsof the observations.
Univariate analyses were done using ANOVA onpercentage cover of major space occupants. Data wereanalysed by a 3 factor design, withTime (T), Location (L) and Depth(D) as fixed, orthogonal factors.Cochran’s C-test was used to test forhomogeneity of variances and, whereheterogeneous, data were trans-formed (Underwood 1981). Whereheterogeneity of variances could notbe removed by transformation andwere significant at p = 0.05, a prob-ability level of p = 0.01 was used.Multiple comparisons among meanswere done using the Student-Newman-Keuls test (SNK test). Tobalance the ANOVA for missingtiles, the averages of the other loca-tions (for the missing location Con-trol-2 at 3 yr) and the mean of the 6collected tiles at Control-3 weresubstituted in the analyses and thenumber of degrees of freedom ofthe residual was reduced in theANOVAs (Underwood 1981). Severalcomparisons were ignored in post-hoc tests of means (SNK), as theywere not possible to make, includingcomparisons of depth at Impacted-1and Control-1 or comparisons in-volving Control-2 at 3 yr.
RESULTS
Assemblage composition
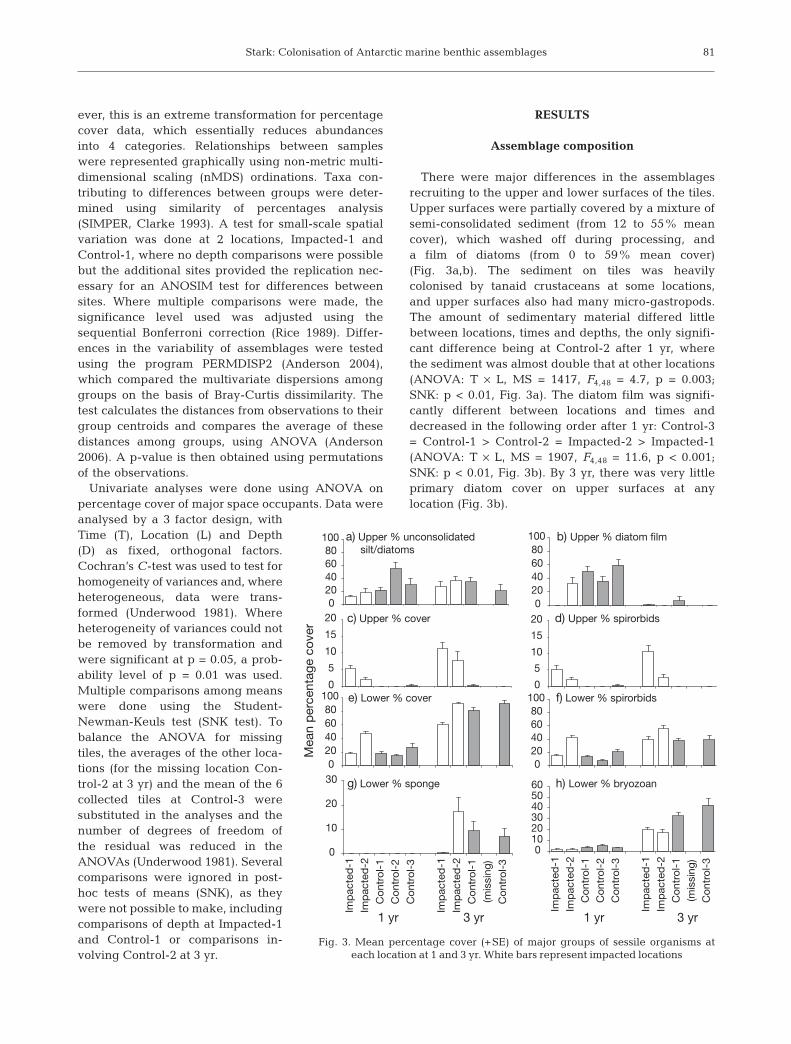
There were major differences in the assemblagesrecruiting to the upper and lower surfaces of the tiles.Upper surfaces were partially covered by a mixture ofsemi-consolidated sediment (from 12 to 55% meancover), which washed off during processing, anda film of diatoms (from 0 to 59% mean cover)(Fig. 3a,b). The sediment on tiles was heavilycolonised by tanaid crustaceans at some locations,and upper surfaces also had many micro-gastropods.The amount of sedimentary material differed littlebetween locations, times and depths, the only signifi-cant difference being at Control-2 after 1 yr, wherethe sediment was almost double that at other locations(ANOVA: T × L, MS = 1417, F4,48 = 4.7, p = 0.003;SNK: p < 0.01, Fig. 3a). The diatom film was signifi-cantly different between locations and times anddecreased in the following order after 1 yr: Control-3= Control-1 > Control-2 = Impacted-2 > Impacted-1(ANOVA: T × L, MS = 1907, F4,48 = 11.6, p < 0.001;SNK: p < 0.01, Fig. 3b). By 3 yr, there was very littleprimary diatom cover on upper surfaces at anylocation (Fig. 3b).
81
e) Lower % cover
020406080
100
c) Upper % cover
0
5
10
15
20 d) Upper % spirorbids
0
5
10
15
20
a) Upper % unconsolidated silt/diatoms
020406080
100
f) Lower % spirorbids
020406080
100
h) Lower % bryozoan
0102030405060
Imp
acte
d-1
Imp
acte
d-2
Co
ntro
l-1
Co
ntro
l-2
Co
ntro
l-3
Imp
acte
d-1
Imp
acte
d-2
Co
ntro
l-1
(mis
sing
)C
ont
rol-
3
g) Lower % sponge
0
10
20
30
Imp
acte
d-1
Imp
acte
d-2
Co
ntro
l-1
Co
ntro
l-2
Co
ntro
l-3
Imp
acte
d-1
Imp
acte
d-2
Co
ntro
l-1
(mis
sing
)
Co
ntro
l-3
1 yr 3 yr 1 yr 3 yr
Mea
n p
erce
ntag
e co
ver
b) Upper % diatom film
020406080
100
Fig. 3. Mean percentage cover (+SE) of major groups of sessile organisms ateach location at 1 and 3 yr. White bars represent impacted locations

Mar Ecol Prog Ser 365: 77–89, 2008
Total cover of sessile organisms on upper surfaces(excluding diatoms) ranged from 0 to 5% after 1 yr and0 to 11% after 3 yr (Fig. 3c) and consisted mainly ofspirorbid polychaetes (Fig 3d). There were significantdifferences between locations, with Impacted-1 havingsignificantly greater cover than Impacted-2, which wasgreater than all other locations at both times (SNK: p <0.01, Table 2a, Fig. 3c). Total cover on the upper sur-faces also increased significantly at the 2 impactedlocations from 1 yr to 3 yr (SNK: p < 0.01, Table 2a,Fig. 3c), but composition differed, with Impacted-1consisting mainly of spirorbid polychaetes (1 yr =5.2%, 3 yr = 10.6%) and Impacted-2 shifting fromspirorbids to macroalgae (1 yr = 2% spirorbids; 3 yr =2.6% spirorbids, 5% macroalgae). Little was foundgrowing on the upper surfaces at other locations(Fig. 3c).
Biotic assemblages on the lower surfaces occupiedbetween 15 and 47% mean total cover after 1 yr andbetween 60 and 91% after 3 yr and consisted almostentirely of spirorbids, bryozoans and sponges (Fig. 4).Bare space was predominant at 1 yr and spirorbids
were the dominant colonist, but by 3 yr bryozoans andsponges were significant components of the assem-blage and there was little remaining unoccupiedspace, except at Impacted-1 (Fig. 4). Total percentagecover on the lower surfaces was significantly greater at3 yr at all locations (SNK: p < 0.01, Table 2b, Fig. 3e).There were significant T × L interactions in lower total% cover: at 1 yr Impacted-2 > Control-3 > all others(SNK: p < 0.05 Table 2b, Fig. 3e); at 3 yr there werefewer differences in total cover, with Control-3 andImpacted-2 > all others, and Impacted-1 < all others(SNK: p < 0.05, Table 2b, Fig. 3e). The only effect ofdepth on total lower cover was at O’Brien-3, which hadgreater % cover at deep sites at 1 yr and greater %cover at shallow sites at 3 yr (T × L × D interaction,SNK: p < 0.05, Table 2b).
Percentage cover of spirorbids on the upper surfaceswas greatest at the 2 impacted locations, with very lit-tle recruitment at the other locations (Table 2c, Fig.3d). On the lower surfaces, spirorbid cover rangedfrom a mean of 8 to 43% after 1 yr, and after 3 yr wasvery similar at Impacted-1, Control-1 and Control-3
82
Source df MS F p MS F p
(a) Upper % cover (lnx + 1), (b) Lower % cover (untrans),(C = 0.33, p < 0.01) (C = 0.18, NS)Time 1 8.61 46.04 <0.0001 62435.66 1534.27 <0.0001Location 4 11.94 63.84 <0.0001 2108.44 51.81 <0.0001Depth 1 0.06 0.34 0.56 152.17 3.74 0.059Time × Location 4 2.23 11.93 0.0001 559.15 13.74 <0.0001Time × Depth 1 0.05 0.28 0.6 143.11 3.52 0.067Location × Depth 4 0.14 0.76 0.56 112.96 2.78 0.037Time × Location × Depth 4 0.05 0.29 0.88 329.95 8.11 <0.0001Residual 48 0.19 40.69(c) Upper spirorbids (lnx + 1), (d) Lower % spirorbids (sqrtx + 1), (C = 0.34, p < 0.01) (C = 0.23, p < 0.05)Time 1 3.05 26.27 <0.0001 94.10 265.63 <0.0001Location 4 11.00 94.84 <0.0001 13.31 37.59 <0.0001Depth 1 0.42 3.58 0.065 0.93 2.63 0.11Time × Location 4 1.76 15.20 <0.0001 4.44 12.53 <0.0001Time × Depth 1 0.45 3.87 0.055 2.57 7.25 0.01Location × Depth 4 0.19 1.66 0.18 0.79 2.22 0.08Time × Location × Depth 4 0.55 4.74 0.003 2.22 6.26 0.0004Residual 48 0.12 0.35(e) Lower % sponge (sqrtx + 1), (f) Lower % bryozoan (sqrtx + 1), (C = 0.36, p < 0.01) (C = 0.21, NS)Time 1 58.93 247.39 <0.0001 209.00 615.01 <0.0001Location 4 3.96 16.64 <0.0001 5.45 16.05 <0.0001Depth 1 10.93 45.88 <0.0001 0.10 0.28 0.6Time × Location 4 3.96 16.64 <0.0001 2.68 7.90 <0.0001Time × Depth 1 10.93 45.88 <0.0001 1.16 3.43 0.07Location × Depth 4 2.49 10.44 <0.0001 0.99 2.93 0.03Time × Location × Depth 4 2.49 10.44 <0.0001 0.77 2.27 0.075Residual 48 0.24 0.34
Table 2. Results of 3-factor ANOVA testing for differences in cover of major taxa between times, locations and depths. df: degreesof freedom; MS: mean square estimates; C: Cochran’s C-test result; untrans: data not transformed; sqrt: square root; NS: not
significant. Significant results in bold. F versus Residual in all cases

Stark: Colonisation of Antarctic marine benthic assemblages
(mean ~39%), with a mean of 56% cover at Impacted-2 (Fig. 3f). Spirorbid cover was significantly greater atImpacted-2, the sewage outfall (Fig. 3f), than all otherlocations at both times (T × L, SNK: p < 0.05, Table 2d).There was no consistent pattern of spirorbid recruit-ment in relation to depth.
Almost no sponge cover was recorded after 1 yr, butby 3 yr there had been significant recruitment on lowersurfaces (Fig. 3g). Recruitment was lowest after 3 yr atImpacted-1 (mean 0.37%) and highest at Impacted-2(mean 17.25%) (T × L, SNK: Impacted-2 > Control-1 =Control-3 > Impacted-1, p < 0.01, Table 2e). At the 2sites where a depth comparison was possible (Im-pacted-2 and Control-3) there was significantly greatersponge cover on tiles at the deep sites (T × L × D, SNK:deep > shallow at both locations, p < 0.01, Table 2e).
Bryozoan cover on the lower surfaces ranged from 2to 6% at 1 yr and 17 to 43% at 3 yr, and was least atboth impacted locations at 1 and 3 yr (Fig. 3h). At 1 yrthe only significant difference was that Control-2 hadgreater bryozoan cover than Impacted-1 (T × L, SNK:p < 0.05, Table 2f). After 3 yr there were significantdifferences among locations with Control-3 > Control-1 > Impacted-1 = Impacted-2 (T × L, SNK: p < 0.01,Table 2f). There were no significant differences be-tween depths.
Assemblage patterns
Most hypotheses were supported, with clear assem-blage patterns related to spatial effects, humanimpacts, period of deployment and depth, which canbe seen in nMDS ordinations of the combined upperand lower surfaces (Figs. 5 to 7). There were no signif-icant differences in assemblage variability at thishigher-taxon level.
Spatial patterns
Control locations were not significantly different at1 yr, but they were by 3 yr (Table 3), although Con-trol-2 was not sampled at this time. The overlap ofcontrol samples in the nMDS apparent at 1 yr isclearly not evident at 3 yr, when distinct separation isseen (Fig. 5). Differences between Control-1 andControl-3 were mainly due to the different bryozoancategories, with particular forms more abundant atone location. SIMPER analysis indicated that therewere large differences in cover of branching bryo-zoans and lumpy bryozoans, both of which arethought to represent single species. At the 2 locationswhere within-location, small-scale spatial variation
83
Fig. 4. Relative proportion of major taxa on lower surfaces of tiles at each location at 1 and 3 yr
1 yr - Impacted-1
1 yr - Control-1
1 yr - Control-2
1 yr - Control-31 yr - Impacted-2
3 yr - Impacted-1
3 yr - Control-1
3 yr - Control-3
3 yr - Impacted-2
Stress = 0.14
Fig. 5. Non-metric multidimensional scaling (nMDS) ordina-tion of assemblages (combined upper and lower surfaces) on
each tile at each location at 1 and 3 yr

Mar Ecol Prog Ser 365: 77–89, 2008
was tested (Impacted-1 and Control-1), there wereno significant differences in assemblages betweenthe 2 sites (~50 m apart) after 1 yr, but after 3 yrthere was a small difference at Control-1 (Table 4,Fig. 6).
Human impacts
Impacted-1 (the waste disposal site) was the loca-tion that differed the most from other locations atboth 1 and 3 yr (Table 3); it also differed significantlyfrom the controls as a group (1 yr: R = 0.99, p = 0.001;3 yr: R = 0.69, p = 0.001). It was also one of the leastvariable locations (Table 5). Impacted-2 (the sewageoutfall) was the most similar to Impacted-1 after 1 yrand was significantly different from allcontrols (Table 3, Fig. 5), and the con-trols as a group (1 yr: R = 0.51, p =0.001), although this also decreased by3 yr (R = 0.41, p = 0.001). Impacted-2was also the most variable location(Table 5). Impacted-1 and Impacted-2are distinct from all other locations in thenMDS ordination for 1 and 3 yr (Fig. 5).There is some overlap of samples fromImpacted-2 with those from control loca-tions, but no overlap of Impacted-1 withcontrols. The impacted locations alsochanged the least from 1 to 3 yr (Fig. 5)and had the lowest ANOSIM R-values inthe 1 and 3 yr comparisons (Impacted-1:
R = 0.94, p = 0.001; Impacted-2: R = 0.91, p = 0.001).Control-3 showed the greatest change from 1 to 3 yr(Fig. 5, R = 1.0, p = 0.001).
Although there was very little recruitment and veryfew taxa on the upper surfaces of the tiles, SIMPERanalysis indicated that the upper surfaces were impor-tant in contributing to differences between impacted
84
Stress = 0.1
1 yr Impact-1 Site 1
1 yr Impact-1 Site 2
1 yr Control-1 Site 1
1 yr Control-1 Site 2
3 yr Impact-1 Site 1
3 yr Impact-1 Site 2
3 yr Control-1 Site 1
3 yr Control-1 Site 2
Fig. 6. nMDS scaling ordination of assemblages (combinedupper and lower surfaces) on tiles at different sites (~50 m
apart) at Impacted-1 and Control-1 at 1 and 3 yr
Control-2 shallow
Control-2 deep Control-3 deep
Control-3 shallow
Impact-2 deep
Impact-2 shallow
Stress = 0.11a) 1 yr
Stress = 0.07b) 3 yr
Fig. 7. nMDS ordination of assemblages (combined upperand lower surfaces) on tiles at shallow and deep sites at
(a) 1 yr and (b) 3 yr
Impacted-1 Impacted-2 Control-1 Control-2
1 yrImpacted-2 0.83 (0.001)Control-1 1 (0.002) 0.54 (0.001)Control-2 1 (0.002) 0.63 (0.001) 0.06 (0.22)Control-3 0.99 (0.003) 0.37 (0.001) 0.15 (0.03) 0.21 (0.013)3 yrImpacted-2 0.89 (0.001)Control-1 0.71 (0.001) 0.62 (0.001)Control-3 0.98 (0.001) 0.43 (0.006) 0.47 (0.003)
Table 3. Results of analysis of similarities (ANOSIM) tests comparing loca-tions at 1 and 3 yr, showing R-value (with p-value). Significant results in
bold; significance level adjusted using sequential Bonferroni procedure

Stark: Colonisation of Antarctic marine benthic assemblages
and control locations. At 1 yr at Impacted-1 andImpacted-2, spirorbids on both surfaces and diatomson the upper surface cumulatively accounted for 82and 75%, respectively, to the total dissimilarity withthe controls. After 3 yr, spirorbids were the only taxaon the upper surfaces that were still an important con-tributor to differences between control and impactedlocations, although this contribution was muchreduced. Taxa such as sponges and bryozoans on thelower surfaces were much more important in discrimi-nating between controls and impacted locations at 3 yr.
Depth
At the locations where a depth comparison was pos-sible (Impacted-2, Control-2 and Control-3), therewere significant differences between assemblagesrecruiting to tiles at shallow and deep sites (Table 6,Fig. 7a) for all 3 locations at 1 yr and for Impacted-2and Control-3 at 3 yr (Fig. 7b). SIMPER analysis indi-cated that sponge cover was greater at deep sites thanshallow, and that spirorbids tended to have greatercover at shallow sites. Bryozoans were initially moreabundant at deep sites at 1 yr (except for Control-3),but at 3 yr they were more abundant at shallow sites.
DISCUSSION
This study demonstrated that there are patterns inthe recruitment and development of sessile epibioticassemblages in Antarctica at higher taxonomic levels.A mix of classification levels was used, including func-tional taxonomic units (such as encrusting bryozoans),but even when the data was aggregated at the phylumlevel the patterns were very similar.
There was no pattern of spatial differences betweencontrols after 1 yr, but by 3 yr assemblages recruitingto tiles showed clear differences between control loca-tions, separated by several km. This comparison mustbe interpreted with some caution due to the absence ofdata from the third control location. Differences be-tween controls at 3 yr were largely due to differencesin the cover of various bryozoan groups, which proba-bly reflect processes operating at small spatial scales,such as local differences in availability of recruits, orsmall-scale environmental differences, such as cur-rents. Spatial variability in developing epibiotic assem-blages is well-documented in non-polar regions, fromscales of 10s of m to km (Keough 1983, Butler 1986,Glasby 1998). At Ryder Bay on the Antarctic Peninsula,colonisation and assemblage development at specieslevel was highly site-specific and depth-dependant,but higher taxa patterns were not examined (Bowdenet al. 2006). The level of variability within locations atCasey generally increased from 1 to 3 yr as the com-munities became larger (occupied more space) andmore complex (more taxa). At the 2 sites where spatialvariation at small scales was examined there were nodifferences between sites ~50 m apart at 1 yr, due tovariation within sites at scales of 1 to 10 m, but by 3 yrthere were small but significant differences within thecontrol locations. The nMDS ordination of all locations,(Fig. 5) also illustrates the amount of variation thatoccurred between replicate samples within a location,and there was considerable spread of samples for somelocations. This demonstrates the need for adequatespatial replication when comparing locations, with
85
Site 1 vs. Site 2 R p
1 yr Impacted-1 –0.11 0.531 yr Control-1 –0.16 0.863 yr Impacted-1 –0.08 0.633 yr Control-1 –0.43 0.03
Table 4. ANOSIM results for comparison of sites within loca-tions. Significant results in bold, corrected for multiple
comparisons
Average SE
1 yrControl-1 12.23 1.49Impacted-1 (waste site) 12.62 2.14Control-3 13.49 3.22Control-2 17.15 1.04Impacted-2 (sewage) 18.18 3.133 yrImpacted-1 (waste site) 15.82 1.99Control-1 18.81 2.17Control-3 17.81 1.62Impacted-2 (sewage) 19.40 1.97
Table 5. PERMDISP2 multivariate analysis of mean distancefrom centroid and standard error for each location and time,
in ascending order
R p
1 yrControl-2 shallow vs. deep 0.90 0.03Control-3 shallow vs. deep 0.35 0.03Impacted-2 shallow vs. deep 0.35 0.053 yrControl-3 shallow vs. deep 0.93 0.07Impacted-2 shallow vs. deep 0.81 0.03
Table 6. ANOSIM results for tests of differences betweendepths at each location and time. All p-values represent best
possible result for the number of permutations possible

Mar Ecol Prog Ser 365: 77–89, 2008
replicates placed from 10 to 50 m apart to incorporatesmall-scale variability. Similar results were found byGlasby (1998) in a study of spatial variation in a tem-perate estuary, and other studies have also stressedthe importance of capturing small-scale variation inlarger-scale comparisons (Morrisey et al. 1992, Under-wood 1993). While it is clear that there was small-scalevariation within some locations in the present study,some of which may be attributed to depth effects, themost obvious pattern was the difference between con-trol and impacted assemblages.
Human impacts
The impacted locations were significantly differentfrom the control locations after 1 yr and while all loca-tions were significantly different from each other after3 yr, the impacted locations were still distinctly differ-ent from the control locations. The 2 differing types ofimpact also appear to have had different effects. Thesedifferences in assemblages may represent a responseto anthropogenic disturbance that can be charac-terised at higher-taxon levels. Patterns of response tocontamination at high taxonomic levels have beenfound in Antarctic soft-sediment assemblages (Leni-han et al. 2003), but hard substrata assemblages inAntarctica have not previously been examined in thisway.
After 1 yr the upper surfaces of tiles adjacent to thewaste disposal site at Brown Bay (Impacted-1) werevery different from those at the control locations, withgreater total cover, which consisted mainly of spiror-bids, but with little to no diatom film, and these differ-ences persisted after 3 yr. In contrast, the lower sur-faces of tiles adjacent to the waste disposal site had theleast cover of biota, almost no sponges and signifi-cantly less bryozoan cover than the controls, but thecover of spirorbids did not differ from the control loca-tions. These assemblages also exhibited the leastamount of change between 1 and 3 yr. The contami-nants in Brown Bay are mainly metals from the wastedisposal site, which leach into the bay during summermelt and are highly concentrated in sediments of thebay (Stark et al. 2003b). Bryozoans, in particular theirlarval stage, are sensitive to metals (Wisely & Blick1967, Henry et al. 1989), with reduced survivorship ofrecruits after exposure to dissolved metals (Ng &Keough 2003). Temperate sponges are also sensitive tometals, which can affect their growth, fecundity andsurvival (Cebrian et al. 2003). Sponges filter large vol-umes of water and accumulate and exhibit toxicresponses to metals (Patel et al. 1985, Hansen et al.1995). In a survey of temperate bays contaminated byindustrial pollution, very few species of sponges were
found (Pansini & Pronzato 1975). This study providespreliminary evidence that metals in Brown Bay, eitherdissolved or in resuspended sediments, are affectingthe recruitment and development of sponges and bry-ozoans.
Assemblages in Shannon Bay, the location of thesewage outfall, were more similar to the control loca-tions than the waste disposal site, but there were somesignificant differences. The lower surfaces of tiles atShannon Bay had the greatest total cover of biota, thegreatest cover of spirorbid polychaetes (2 to 5 timesthat recorded at control locations) and sponges (at leasttwice that recorded at controls by 3 yr), but the leastcover of bryozoans. In temperate ecosystems spongeshave been found to be generally tolerant of sewagepollution; for example, Terlizzi et al. (2002) found thata sewage outfall did not affect the distribution ofsponges, but affected the pattern of variability in thestructure of sponge assemblages around the outfallsite. Similarly, in this study, Shannon Bay had thegreatest variability in assemblage structure and com-position. In temperate marine bays heavily polluted bysewage, Pansini & Pronzato (1975) found rich assem-blages of sponges and Muricy (1991) found thatsewage did not affect the total percentage cover ofsponges on vertical subtidal surfaces, though it didreduce the diversity and evenness of sponge assem-blages. This study did not identify sponges to species,so it is not possible to determine whether spongeassemblages were less diverse at Shannon Bay, but theevidence suggests that the cover of sponges on tiles isgreater in the presence of sewage. Sewage may bebeing directly utilised as a food source or it may indi-rectly affects sponges by influencing local primary pro-duction and increasing available food. This may alsoexplain the increased cover of spirorbid polychaetes atthe outfall site. Conversely, bryozoan cover was muchlower than controls in a similar manner to the wastedisposal site, suggesting that bryozoans are possiblyintolerant of sewage or eutrophication in Antarctica.Alternatively, bryozoan recruitment at Shannon Baymay be inhibited by biological interactions, such asallelopathy (Davis et al. 1991, Dobretsov et al. 2004),although the low sponge and low bryozoan cover atBrown Bay does not support this hypothesis.
This study provides preliminary evidence thatAntarctic bryozoans and sponges are sensitive toanthropogenic disturbance. Sponges appear tolerantof sewage and may even respond positively toeutrophication, while bryozoans appear sensitive to it.Sponges and bryozoans appear to be intolerant of con-taminants from the waste disposal site, most of whichare metals, but some of which are hydrocarbons (Starket al. 2003b, 2005). Marine invertebrates exposed tostress (such as pollution) during their larval stage have
86

Stark: Colonisation of Antarctic marine benthic assemblages
been shown to exhibit impaired performance in laterlife stages (Maldonado & Young 1999, Ng & Keough2003). It is possible that larval/settlement-stage re-cruits are being affected by pollution at Casey, result-ing in differences in recruitment and assemblage de-velopment. However, there remains a distinct require-ment for ecotoxicological testing of these Antarctictaxa (Chapman & Riddle 2003). Some marine inverte-brates, particularly annelids, are tolerant of some pol-lutants and even posses detoxification mechanisms,(e.g. Marcano et al. 1996), which, combined withopportunistic life history strategies (e.g. high fecun-dity, short generation time, year-round breeding,widespread dispersal), see them successfully inhabitcontaminated areas. Spirorbids appear to be respond-ing in an opportunistic manner to both disturbancetypes at Casey, as they were more abundant at dis-turbed locations on both upper and lower surfaces. Onupper surfaces they were the main colonists, particu-larly at disturbed locations. There are tiles still in placeat all locations at Casey, and it will be interesting to seewhether these differences in assemblages are main-tained in the long term.
The deployment of settlement panels in monitoringexperiments appears to be a potentially useful methodin Antarctica. Patterns of differences between controland impacted locations were clear, even with coarsetaxonomic resolution. Coarse resolution in such moni-toring situations allows for fast analysis times after tilecollection and does not require expert taxonomicknowledge to identify to species level. However, fur-ther examination of species-level patterns wouldenable a better understanding of the processes influ-encing these assemblages. Other factors to considerwhen deploying settlement panels for monitoring inAntarctica include uniform depth, adequate small-scale spatial replication and analysis of both lower andupper surfaces. Ideally for monitoring they should besupplemented with other techniques to provide furtherinformation on ecosystem status, such as soft sedi-ments.
Colonisation and succession patterns in Antarctica
This study demonstrated some clear patterns of epi-faunal recruitment and assemblage development inAntarctica. Structurally, there was very little recruit-ment to upper surfaces and this seems to be a generalpattern for Antarctica (Stanwell-Smith & Barnes 1997,Bowden et al. 2006). This may be a result of either pre-settlement preferences to lower surfaces, or post-set-tlement mortality of recruits on upper surfaces. Bow-den (2005) found no evidence for settlementpreferences in a study of recruitment at monthly inter-
vals over 17 mo at Ryder Bay, Antarctic Peninsula, withcomparable rates of recruitment on upper and lowersurfaces and no species recruiting preferentially toupper or lower surfaces, other than algae. However,there were very different assemblages on upper andlower surfaces after 3 yr (Bowden et al. 2006), with sim-ilar patterns to those in the present study. Bowden(2005) suggested that these differences were mostlikely due to post-settlement mortality; however, plateswere replaced monthly, which would limit any buildupof sediment on the upper surfaces. In this study therewas significant accumulation of sediment on uppersurfaces—between 12 ± 1.7% (mean ± SE) and 55 ±8.2% cover. Thus, the presence of sediment may beinfluencing the settlement of larvae, with less availablehabitat (upper surfaces) and/or preferential habitatselection of sediment-free surfaces (lower surfaces).Alternatively, sediment deposition may cause post-set-tlement mortality via smothering. The effect of sedi-mentation on recruitment, however, has not beentested in Antarctica. In addition, the sediment on theupper surfaces was heavily colonised by tanaid crus-taceans of the genus Nototanais, which are voraciouspredators of juvenile and small invertebrates (Oliver &Slattery 1985).
The general pattern of assemblage development andsuccession at Casey is of diatoms and spirorbids as pio-neers on upper surfaces, with little development by3 yr. On lower surfaces spirorbids and bryozoans werethe pioneer colonists, and after 3 yr, spirorbids werestill dominant but bryozoans occupied significantlymore space and sponges also comprised a significantcomponent of the assemblage.
This study reports some recruitment patterns thatcontrast with those found in other areas of Antarctica.Signy Island has very slow rates of colonisation onlower surfaces at 5 and 25 m depth, with <2 to 6%cover after 15 mo deployment and <9% after 21 mo(Stanwell-Smith & Barnes 1997). This may be a consis-tent pattern for Signy Island, as Barnes (1996) reportedsimilar colonisation rates after 2 yr in an earlier study atthe same location. At Ryder Bay the mean cover onlower surfaces after 3 yr ranged from ~25 to 68% at 8m and ~6 to 70% at 20 m at 3 locations (Bowden et al.2006). Mean colonisation rates at Casey are greaterthan other areas previously reported in Antarctica,with mean cover after 3 yr ranging from 81 to 91% at 3control locations, with up to 98% mean cover at 7 to 10m and 79 to 81% cover at 19 to 22 m. Some areas ofAntarctica appear to be subject to considerable inter-annular variation in recruitment, possibly as a result oflarge-scale oceanographic variations. Settlement pan-els deployed at McMurdo Station in the 1970s hadalmost no recruitment after 5 yr, but 10 yr after deploy-ment were described as ‘well colonised’ by bryozoans,
87

Mar Ecol Prog Ser 365: 77–89, 2008
soft corals and sponges (Dayton 1989). The assemblagecomposition and structure at Casey is similar to boththe Signy Island and Ryder Bay assemblages, withspirorbids and bryozoans dominant in all 3 regions.However, at Casey after 3 yr, sponges were a notablecomponent of the assemblage (up to 17%), unlike theother 2 regions. Further evidence of regional differ-ences comes from King George Island, where after 3 yrthe substratum was almost entirely dominated by soli-tary ascidians (Rauschert 1991).
CONCLUSIONS
This study represents the first use of settlement pan-els in a monitoring context in Antarctica, which is avery difficult environment to work in, and where thereis a real need for simple, robust techniques suited to astandardised monitoring procedure. It is also the firststudy of epibiotic colonisation from East Antarctica.Clearly there are significant regional differences inrates of colonisation and in assemblage structure inAntarctica. Some broadly separated regions appear tohave similar dominant colonists (spirorbids and bry-ozoans) and colonisation rates, and thus the applicabil-ity of settlement panels for monitoring in other regionsmay be similar. Some tiles are still deployed at Caseyand will be sampled in the future, when species-levelanalyses will also be done for the entire collection. Fur-ther work at the species level will enable the mecha-nisms and processes behind such patterns to be betterunderstood, and will increase our understanding ofanthropogenic impacts on Antarctic ecosystems.
Acknowledgements. The author is grateful to G. Andersonand M. Riddle for assistance with setting up the experiment;P. Goldsworthy, A. Tabor, and M. Riddle for diving assistance;G. Johnstone and A. Lee for laboratory assistance; S. Pearceand members of the 50th and 51st ANARE expeditions toCasey; and G. Clark and G. Johnstone for commenting on themanuscript. This work was supported by the AustralianAntarctic Division (AAS project 2201).
LITERATURE CITED
Anderson MJ (2004) PERMDISP: a FORTRAN computer pro-gram for permutational analysis of multivariate disper-sions (for any two-factor ANOVA design) using permuta-tion tests. Department of Statistics, University ofAuckland
Anderson MJ (2006) Distance-based tests for homogeneity ofmultivariate dispersions. Biometrics 62:245–253
Anderson MJ, Diebel CE, Blom WM, Landers TJ (2005) Con-sistency and variation in kelp holdfast assemblages: spa-tial patterns of biodiversity for the major phyla at differenttaxonomic resolutions. J Exp Mar Biol Ecol 320:35–56
Barnes DKA (1996) Low levels of colonisation in Antarctica:the role of bryozoans in early community development. In:
Gordon DP, Smith AM, Grant-Mackie JA (eds) Bryozoansin space and time. National Institute of Water and Atmos-pheric Research, Wellington
Bowden DA (2005) Seasonality of recruitment in Antarcticsessile marine benthos. Mar Ecol Prog Ser 297:101–118
Bowden DA, Clarke A, Peck LS, Barnes DKA (2006) Antarcticsessile marine benthos: colonisation and growth on artifi-cial substrata over three years. Mar Ecol Prog Ser 316:1–16
Butler AJ (1986) Recruitment of sessile invertebrates at fivesites in Gulf St. Vincent, South Australia. J Exp Mar BiolEcol 97:13–36
Cebrian E, Martí R, Uriz J, Turon X (2003) Sublethal effects ofcontamination on the Mediterranean sponge Crambecrambe: metal accumulation and biological responses.Mar Pollut Bull 46:1273–1284
Chapman PM, Riddle MJ (2003) Missing and needed: polarmarine ecotoxicology. Mar Pollut Bull 46:927–928
Clarke KR (1993) Non-parametric multivariate analyses ofchanges in community structure. Aust J Ecol 18:117–143
Conlan KE, Kim SL, Lenihan HS, Oliver JS (2004) Benthicchanges during 10 years of organic enrichment byMcMurdo Station, Antarctica. Mar Pollut Bull 49:43–60
Connell SD (2001) Urban structures as marine habitats: anexperimental comparison of the composition and abun-dance of subtidal epibiota among pilings, pontoons androcky reefs. Mar Environ Res 52:115–125
Davis AR, Butler AJ, van Altena I (1991) Settlement behaviourof ascidian larvae: preliminary evidence for inhibition bysponge allelochemicals. Mar Ecol Prog Ser 72:117–123
Dayton PK (1989) Interdecadal variation in an Antarcticsponge and its predators from oceanographic climateshifts. Science 245:1484–1486
Deprez PP, Arens M, Locher H (1999) Identification and pre-liminary assessment of contaminated sites at Casey Sta-tion, Wilkes Land, Antarctica. Polar Rec 35:299–316
Dobretsov S, Dahms HU, Qian PY (2004) Antilarval andantimicrobial activity of waterborne metabolites of thesponge Callyspongia (Euplacella) pulvinata: evidence ofallelopathy. Mar Ecol Prog Ser 271:133–146
Ellis D (1985) Taxonomic sufficiency in pollution assessment.Mar Pollut Bull 16:459
Glasby TM (1997) Analysing data from post-impact studiesusing asymmetrical analyses of variance: a case study ofepibiota on marinas. Aust J Ecol 22:448–459
Glasby TM (1998) Estimating spatial variability in developingassemblages of epibiota on subtidal substrata. J MarFreshw Res 49:429–437
Glasby TM (2001) Development of sessile marine assem-blages on fixed versus moving substrata. Mar Ecol ProgSer 215:37–47
Glasby TM, Connell SD (2001) Orientation and position ofsubstrata have large effects on epibiotic assemblages. MarEcol Prog Ser 214:127–135
Goldberg ED, Beynon KI, de Groot AJ, Duinker JC and others(1975) Entry, distribution and fate of heavy metals andorganohalogens in the physical environment. In: McIntyreAD, Mills CF (eds) Ecological toxicology research. PlenumPress, New York, p 233–256
Green G, Nichols PD (1995) Hydrocarbons and sterols inmarine sediments and soils at Davis Station, Antarctica: asurvey for human derived contaminants. Antarct Sci 7:137–144
Hansen IV, Weeks JM, Depledge MH (1995) Accumulation ofcopper, zinc, cadmium and chromium by the marinesponge Halichondria panicea Pallas and the implicationsfor biomonitoring. Mar Pollut Bull 31:133–138
88

Stark: Colonisation of Antarctic marine benthic assemblages
Henry V, Bussers JC, Bouquegneau JM, Thomé JP (1990)Heavy metal and PCB contamination of Bryozoan coloniesin the River Meuse (Belgium). Hydrobiologia 202:147–152
Keough MJ (1983) Patterns of recruitment of sessile inverte-brates in two subtidal habitats. J Exp Mar Biol Ecol 66:213–245
Lenihan HS (1992) Benthic marine pollution aroundMcMurdo Station, Antarctica: a summary of findings. MarPollut Bull 25:318–323
Lenihan HS, Oliver JS (1995) Anthropogenic and natural dis-turbances to marine benthic communities in Antarctica.Ecol Appl 5:311–326
Lenihan HS, Peterson CH, Kim SL, Conlan KE and others(2003) Variation in marine benthic community composi-tion allows discrimination of multiple stressors. Mar EcolProg Ser 261:63–73
Maldonado M, Young C (1999) Effects of the duration of lar-val life on postlarval stages of the demosponge. J Exp MarBiol Ecol 232:9–21
Marcano L, Nusetti O, Rodriquez-Grau J, Vilas J (1996)Uptake and depuration of copper and zinc in relation tometal-binding protein in the polychaete Eurythoe compla-cata. Comp Biochem Physiol 114:179–184
Morris CE, George J, Tate PM, Cathers B (2000) Impacts ofwastewater discharge to the Antarctic marine environ-ment. In: Hughson T, Ruckstuhl C (eds) Proc Sixth Interna-tional Symp Cold Region Development. ISCORD, Hobart,p 155–158
Morrisey DJ, Howitt L, Underwood AJ, Stark JS (1992) Spatialvariation in soft sediment benthos. Mar Ecol Prog Ser 81:197–204
Muricy G (1991) Structure of sponge communities around thesewage out-fall at Cortiou (Marseille, France). Vie Milieu41:205–221
Ng TYT, Keough MJ (2003) Delayed effects of larval exposureto Cu in the bryozoan Watersipora subtorquata. Mar EcolProg Ser 257:77–85
Oliver JS, Slattery PN (1985) Effects of crustacean predatorson species composition and population structure of soft-bodied infauna from McMurdo Sound, Antarctica. Ophe-lia 24:155–175
Olsgard F, Somerfield PJ, Carr MR (1998) Relationshipsbetween taxonomic resolution, macrobenthic communitypatterns and disturbance. Mar Ecol Prog Ser 172:25–36
Pansini M, Pronzato R (1975) Preliminary analysis on the dis-tribution of Porifera in areas exposed to different types ofPollution. Boll Mus Ist Biol Univ Genova 43:21–32
Patel B, Balani M, Patel S (1985) Sponge ‘sentinel’ of heavymetals. Sci Total Environ 41:143–152
Pearson TH, Rosenberg R (1978) Macrobenthic succession inrelation to organic enrichment and pollution of the marineenvironment. Oceanogr Mar Biol Annu Rev 16:229–311
Quinn GP, Keough MJ (2002) Experimental design and dataanalysis for biologists. Cambridge University Press, Cam-bridge
Rauschert M (1991) Ergebrnisse der faunistischen Arbeitenim Benthal von King George Island (Südshetlandinseln,
Antarctis). Ber Polarforsch 76:1–75Rice WR (1989) Analyzing tables of statistical tests. Evolution
43:223–225Snape I, Riddle MJ, Stark JS, Cole CM, King CK, Duquesne S,
Gore DB (2001) Management and remediation of contam-inated sites at Casey Station, Antarctica. Polar Rec 37:199–214
Somerfield PJ, Clarke KR (1995) Taxonomic levels, in marinecommunity studies, revisited. Mar Ecol Prog Ser 127:113–119
Stachowicz JJ, Fried H, Osman RW, Whitlatch RB (2002) Bio-diversity, invasion resistance and marine ecosystem func-tion: reconciling pattern and process. Ecology 83:2575–2590
Stanwell-Smith D, Barnes DKA (1997) Benthic communitydevelopment in Antarctica: recruitment and growth onsettlement panels at Signy Island. J Exp Mar Biol Ecol212:61–79
Stark JS, Riddle MJ, Simpson RD (2003a) Human impacts insoft-sediment assemblages at Casey Station, East Antarc-tica: spatial variation, taxonomic resolution and datatransformation. Austral Ecol 28:287–304
Stark JS, Riddle MJ, Snape I, Scouller RC (2003b) Humanimpacts in Antarctic marine soft-sediment assemblages:correlations between multivariate biological patterns andenvironmental variables. Estuar Coast Shelf Sci 56:717–734
Stark JS, Riddle MJ, Smith SDA (2004) Influence of anAntarctic waste dump on recruitment to near-shoremarine soft-sediment assemblages. Mar Ecol Prog Ser 276:53–70
Stark JS, Snape I, Riddle MJ, Stark SC (2005) Constraints onspatial variability in soft-sediment communities affectedby contamination from an Antarctic waste disposal site.Mar Pollut Bull 50:276–290
Terlizzi A, Fraschetti S, Guidetti P, Boero F (2002) The effectsof sewage discharge on shallow hard substrate sessileassemblages. Mar Pollut Bull 44:542–548
Underwood AJ (1981) Techniques of analysis of variance inexperimental marine biology and ecology. Oceanogr MarBiol Annu Rev 19:513–605
Underwood AJ (1993) The mechanics of spatially replicatedsampling programmes to detect environmental impacts ina variable world. Aust J Ecol 18:96–116
Underwood AJ, Chapman MC, Connell SD (2000) Observa-tions in ecology: You can’t make progress on processeswithout understanding the patterns. J Exp Mar Biol Ecol250:97–115
Warwick RM (1988) The level of taxonomic discriminationrequired to detect pollution effects on marine benthiccommunities. Mar Pollut Bull 19:259–268
Warwick RM (1993) Environmental impact studies on marinecommunities: pragmatical considerations. Aust J Ecol 18:63–80
Wisely B, Blick A (1967) Mortality of marine invertebrate lar-vae in mercury, copper, and zinc solutions. Aust J MarFreshw Res 18:63–72
89
Editorial responsibility: Hans-Heinrich Janssen,Oldendorf/Luhe, Germany
Submitted: August 3, 2007; Accepted: April 30, 2008Proofs received from author(s): July 17, 2008