Embed Size (px)
Citation preview
International Journal of Advancements in Research & Technology, Volume 1, Issue 5, October-2012 1 ISSN 2278-7763
Copyright © 2012 SciResPub. IJOART
PATTERN OF INDIA’S FOREIGN TRADE IN PRE AND POST REFORM ERA: AN
EMPIRICAL INVESTIGATION
AMA NDEEP K AU R
RESEAR CH SCHOLL AR
ECONOM IC S DEPA RT MENT
KUR UKSHETR A U NI VERS ITY KUR UKSHET RA
ABSTRACT:-
The s tudy investigate the pat tern o f India’s foreign trade and share of india’s export and
import in world’s t rade dur ing the per iod 1960 -2010. India 's share in world 's exports has
shown a r is ing trend. I t s share was only 0 .5% in 1991. Dur ing the per iod fro m 1991 to 1997
i t s share was cont inuously rose from 0.50% to 0 .62% and per iod of 2009 - 2010 i t i s r ise
1 .25 %. Simi lar ly, India 's share in world impor ts has a lso sho wn a r i sing trend 1990 -2010. I t
was 1 .82% in 1960 -61. But in 1969 -70 I t was 0 .8%; i t has sho wn the decreas ing t rend. The
imports share in wor ld imports in 2000 -2001 is 0 .7% and 2009 -2010 the relat ive share i s
1 .9% show the increas ing t rend.The composi t ion of Ind ia 's expor ts and impor ts has grown up
signi ficant ly. But the imports o f food grains and consumer goods have dec line due to
adoption HYM technology in Indian agr iculture.
INTRODUCTION:
Fore ign Trade has been one of the most s igni f icant de terminants of economic
development in a country. The fore ign trade of a country consis ts o f inward and outward
movement o f goods and services, which result in to out f low and inf low of fore ign exchange
from one country to ano ther country. Dur ing present t imes, Inte rnat ional t rade i s a vi ta l par t
of development s tra tegy and i t can be an effect ive inst rument of econo mic gro wth,
employment genera t ion and pover ty al leviat ion in an economy. According to Tradit iona l
Pattern o f develop ment show that resources a re transfer red form the agr icultura l to the
manufac tur ing sector and then into services - sector in an economy.
The Process o f globalizat ion has got momentum through the process o f economic
Integra t ion, and in t he expansion of the volume of Internat ional Trade. Ind ia has been a
rela t ively new comer to the process o f expansion of Interna tional Trade since i t s opening up

International Journal of Advancements in Research & Technology, Volume 1, Issue 5, October-2012 2 ISSN 2278-7763
Copyright © 2012 SciResPub. IJOART
to wor ld trade only began after the cr i si s in 1991. the opening up to Interna tional Trade
should be seen as a cruc ial aspect o f the New approach to economic Pol icy and as an Integra l
par t o f the process o f re forms.
In 1991 , the government introduced some changes in i ts Policy on trade, foreign
Investment, Tari f fs and Taxes under the name of "New Economic Reforms" . The main focus
of these re forms has been on Liberal iza t ion, openness and export promotion ac tivi ty. India 's
foreign Trade has expor t s igni f icantly changed in the Post - re forms per iod. In abso lute terms,
Trade Volume rose and the composi t ion of expor ts has undergone several s igni f icant changes.
In Post - re form Period, the major contr ibutor to exports gro wth has been the manufac tur ing
sec tor .
Ind ia’s major Imports Inc lude Petro leum and Petroleum Products, fer t i l izers , go ld,
whereas Precious Stones, Machiner y, chemicals and electronic goods, Machinery and
software consist o f export . This i s rea l ly a welcome development and the trend needs to be
strengthened fur ther for the increased inco me through expor ts . The effect o f l ibera l izat ion on
ind ia’s fo reign trad e the economy has grea tly inf luenced.
The Fir s t important fea ture o f the opening of trade i s represented by changes in the
structure o f trade in goods. The some of agr iculture products has declined mainly to the
advantage of manufac tur ing pro ducts . This change i s espec ia l ly no ticeable for exports, where
the share o f manufactured good had increased to 75 Percent in 2002.Regarding Imports, no
signi ficant change have taken p lace. The share o f food products had decl ined from 25 percent
to about 10 percent o f impor ts in 2002 .
The secondly impor tant change has occurred during the 1990s in Ind ia 's direct ion
of Trade flo ws. Earl ier our exports were confined to OECD and OPEC countr ies . The U.S.A.
Germany Japan accounting for Major share B ut New East Asian Countr ies Par t icular ly china
has become major trading par tner . The most impor tant development regarding direct ion of
trade i s the rap id growth of Ind ia 's t rade with ASEAN Group, U.A.E. , Braz il , Mexico,
Colo mbia etc .
Ind ia 's foreign trade cont inuously increased . I t has show the posi t ion of export and
International Journal of Advancements in Research & Technology, Volume 1, Issue 5, October-2012 3 ISSN 2278-7763
Copyright © 2012 SciResPub. IJOART
Impor t o f Indian economy I t was 1 .33 b il l ion $US 1960 -61.But in 1980-81 expor t was
Increased to 8 .58 bil l ion US$ and af ter economic re form in 1991 -92 export goes up wi th 17.6
bi l l ion US$ af ter tha t a t present in 2010 -2011 expor t i s 157.2 b il l ion US$. Ind ian’s Impor t
also increased in t ime to t ime. In 1960 -61 India 's Impor t is 2 .3 bi l l ion US$ but in 1980 I t was
Increased wi th 14.86 b il l ion US$. After economic re form in 1991 -92 also Increased wi t h 20.4
Bil l ion US$ Now at Present in 2010 -2011 import is 245.6 bi l l ion US$.
The main object ive o f this s tudy i s to examine pattern o f India 's fore ign trade in the
Post - Reform Era and Pre Reform Era.
1) To assess the role o f Fore ign Trade in Ind ia 's in t erms of the ir share o f exports and
imports in World 's exports and Impor ts.
2) To analyze the changes that has occurred in the composit ion of Ind ia exports and Imports
dur ing the study per iod i .e . 1970 -2010 .
The s tudy has been d ivided into four sec t ions. Sect ion 1 has been devoted to survey of
l i tera ture. Sec tion II deals wi th the share o f India 's Expor ts and Impor ts in World 's Expor ts
and Impor ts Since: 1960 -2010. Sec tion III dea ls wi th the Composi t ion of India 's exports and
Impor ts since: 1970 -2010. Sect ion IV dea ls wi th the main conclus ion and policy Impl icat ion.
SECTION-I
REVIEW OF LITERATURE: -
Many theore tical and empir ical S tudies have been under - taken to assess the ro le o f
foreign trade and pat terns of t rade in India 's or any o ther country’s economic development.
Prominent among them are:
Ahluwal ia , M.S (2002) , "Economic re forms in India since 1991.Alcala, F. , and
ciccone,(2004) , " Trade and product ivi ty" ,Arora.A,Gambardel la , (2004)" The global iza t ion of
the software industry: perspect ives and oppor tuni t ies for developed and develop ing country" ,
Dol lar , D. and A Kraay. (2002) , " Inst i tut ions Trade and growth" . De long, B. (2004) " India
since independence , Kohl i , A. (2006 a) , "poli t ics o f economic gro wth in India" 1980 -2005
par t 1: econo mic and poli t ical weekly. Kalpana Kochhar , Utsav Kumar, Raghuram Rajan,
Arvind Subramanian, and Ioannis (2006) ,India’s Pattern o f Development : Krishanamur thy, K
International Journal of Advancements in Research & Technology, Volume 1, Issue 5, October-2012 4 ISSN 2278-7763
Copyright © 2012 SciResPub. IJOART
and Sastry, D.U. (1968) , “Inventor ies in the Organized Manufac tur ing Sec tor or the Ind ian
Economy”, Mal l ick, S .K (1996) . "Causa li ty be tween exports and economic growth in Ind ia :
Evidence from co -integrat ion-based error correction model" Michele Alessandr ini , Bassam
Fat touh, and Pasquale Scaramozzino; (2007) :The changing pat tern o f foreign t rade
spec ia l izat ion in Indian manufactur ing,Mathur , Vibha , (2006) , Fore ign Trade of Ind ia, 1947
to 2007, Trends, Pol ic ies and Prospects, Mihir Pandey (2004) , Impact o f Trade Libera l izat ion
in Manufactur ing Industry in Ind ia in the 1980s and 1990s,Nandi 's and B. Biswas,(1991)
"Exports and economic gro wth" .Nidugula, G.K. (2000) ,"Exports and economic growth in
Ind ia, An empir ica l Invest iga tion" .Nagraj , R. (2003) , “Fore ign Direct Inve s tment in Ind ia in
the 1990s: Trends and Issues”Nayyar , D. (1976) , India’s Export and Export Po lic ies in
1960’s,Panagaria , A. (2004) , India’s Trade Reform, Panchmukhi , V.R. (1979) , Trade Policies
in India; Raj , K.N. , (1966) , Food , Fer t i l izer and Fore ign Ai d, Mainstream,Rakshi t , M.,
(1994): I ssues in St ructura l Adjustment o f Indian Economy"Rodrik, D. (1992a) , The Limi t o f
Trade Policy Reform in Developing Countr ies, Sen, S and R.U. Das (1992) , Impor t
Libera l iza t ion as a Tool of Economic Policy in Ind ia – A Perspect ive from the Mid 1980s to
December 1991, Shafaeddin, S.M. (2005) , “Trade Liberal iza t ion and Economic Reform in
Developing Countr ies: Structura l Change or De -Industr ial iza t ion”,Singh Manmohan, (1964) ,
Ind ia’s Expor t Trends ,
All these s tudies ana lyze the relat ionship be tween foreign trade and growth in general
and per formance of foreign trade in India in p re and post re form era , these stud ies exp lain
the Pa tte rns o f trade and the Per formance of exports and Imports. These s tudies sho w
endogenous gro wth has argued that the long - term growth po tential o f an econo my can be
Posit ive ly re la ted to i ts specia l izat ion in technological ly advanced Sec tors and exp la in the
composit ion of India 's expor t and expor t per formance and result is based on industr ial iza t io n
and rap id growth in developed economies. a l l s tudies focused only on India 's external Sector
Performance espec ia l ly expor t per formance dur ing post Reform per iod.
Our s tudy i s in the footsteps o f ear l ier stud ies on Ind ia. I t is di fferent from ear l ier
stud ies in the sense that i t covers a per iod of six decades; and also more comprehensive.

International Journal of Advancements in Research & Technology, Volume 1, Issue 5, October-2012 5 ISSN 2278-7763
Copyright © 2012 SciResPub. IJOART
SECTION- II
THE SHARE OF INDIA'S EXPORTS AND
IMPORTS IN WORLD TRADE SINCE: 1960-2010
In this sect ion we have ana lyzed the share o f Ind ian exports and Imports in wor ld
expor ts and Impor ts . The analys is has been made by applying the l inear Regress ion Equation
X= b o +b 1 t
The annexure -1 sho ws that share o f Ind ia 's exports in wor ld export . Ind i a 's export
Increased from $1.333b in 1960 -1961 to $21 .3b in 1990 -91. Which fur ther Increased to
33.107 bil l ion US$ in 1996 and to 42.379 b$ in 2000 India 's exports are cont inuously
Increased during the per iod under study 1960 -2010;excep t the year 2009 -2010 dec lined to
157.2b US$ whereas in 2008 -09 India 's expor t were 194.5 b il l ion US$. The Share o f Ind ia’s
expor ts in wor ld’s expor ts has dec lined. The share o f India’s expor ts in World’s expor ts 1 .11
percent in 1960-61 which fal l to 0 .57 percent in 2005 and fu r ther the trend was reversed for
some years (1964, 1966 , 1976, 1977,1983,1984,1985 1990,1994, and 2006 to 2010) . But for
the study per iod as a whole the share dec lined. India 's ranking among world 's t rading nat ions
sl ipped fro m 16t h
in 1953 to 20t h
in 1983 and fur ther to 29t h
1991. i t s ranking among world’s
t rading nat ion is improved in 2010
The annexure -2 shows the share of Ind ia’s import in wor ld’s imports dur ing the many
Period 1960 -61 to 2009-10, World’s impor ts Increased. The share o f Ind ia’s i mpor ts in
world’s imports rose from 1.82 percent in 1960 -61 to 1 .98 in 2009 -2010,since 2001 -2002
to2009-2010.The impor ts o f Ind ia’s have been cont inuously r i sing expect the year 2009 -2010.
The Ind ia 's Share in wor ld 's expor ts and imports during the per iod 1991-92 to 2009 -10
shows an Increasing trend. The percentage share o f expor ts was 0 .52 Percent in 1991 , which
Increased to 0 .66 percent in 2000 and 1.25 percent in 2009 -2010 The percentage share o f
imports in 1991 was 0 .57 percent which increased to 1 .98 Percent in 2009-10. The r i sing
share of impor ts in world imports has signi f icance from the point of view of economic
gro wth.
We have applied regress ion the data on India 's expor ts ( imports) share in wor ld trade .

International Journal of Advancements in Research & Technology, Volume 1, Issue 5, October-2012 6 ISSN 2278-7763
Copyright © 2012 SciResPub. IJOART
The resul t s o f regress ion analys is are sho wn in table 2 .1 and 2.2 .

International Journal of Advancements in Research & Technology, Volume 1, Issue 5, October-2012 7 ISSN 2278-7763
Copyright © 2012 SciResPub. IJOART
TABLE- 2 .1
RESULTS OF REGRESSION EQUATIONS INDICATI NG INDIA'S SHARE OF EXPORTS
IN WORLD'S TRADE
(1960-2010)
Variable Time
Period
Bo B1 R2 R
2 F value
Expor t
share 's
as a % of
World
Trade
1960-
1970
1.234
(26.016)*
-4 .58e-02 ( -
5 .994)*
.81 .79 35.925*
1970-
1980
.645
(17.778)*
-1 .45e-02 ( -
2 .479)*
.43 .36 6.143*
1980-
1990
.455
(11.726)*
9.939e -03
(1.588)
.24 .14 2.522
1990-
2000
.499
(34.434)*
1.442e -02
(6.180)*
.82 .80 38.196*
2000-
2010
.527 (5.564)* 6.661e -02
(4.336)*
.70 .66 19.061*
1960-
2010
.740
(10.934)*
-1 .34e-03 ( -
5 .581)*
.007 -.014 .338
t*- Signi f icant at 5% level o f signi f icance
F*= Signi ficant a t 5% leve l o f s igni f icance
TABLE- 2.2
RESUTLS OF REGRESSION EQUATIONS INDICATING INDIA’S SHARE OF IMPORTS
OF WORLD'S TRADE
1960-2010
Variable Time
Period
Bo B1 R2 R
2 F va lue
Impor t
Share 's
as a %
of
World
Trade
1960-
1970
2.033
(16.810)*
-9 .29e-02 ( -
4 .767)*
.74 .70 22.725*
1970-
1980
.671 (15051)* -5 .45e-03 ( -
.759)
.06 - .049 .576
1980-
1990
.843
(25.369)*
-1 .52e-02
( -2 .835)*
.50 .43 8.040*
1990-
2000
.54.5
(16.828)*
2.212e-02
(4.234)*
.69 .65. 17.926*
2000-
2010
.485 (1.587) .116 (2.354)* .40 .33 5.541*
1960-
2010
1.126
(9.081)*
-7 .21e-03 ( -
1 .702)
.057 0.037 2.898
t*- Signi f icant at 5% level o f signi f icance
F*= Signi ficant a t 5% leve l o f s igni f icance
On the bas is of the above da ta, we have regressed India 's share in world 's t rade by using

International Journal of Advancements in Research & Technology, Volume 1, Issue 5, October-2012 8 ISSN 2278-7763
Copyright © 2012 SciResPub. IJOART
regress ion equat ion wi th the he lp o f annexure -1
In 1960-70 percentage share o f Expor t [ - 1 .234-458e-02t ] R2
F va lue
t - S tat i st ics ( -5 .994)* 0 .81 5 .925*
The value of b 1 shows a Negative trend which is s ta t i st ical ly s igni f icant and the R2
va lue i s very high and overa l l equation resul t is signi ficant a t 5% leve l of sta t i s t ical ly
signi ficant . During 1970 -1980 per iod a lso show the negat ive trends which i s t , F va lue i s
stat is t ical ly s igni f icant . R2 value is not high. But in 1960 -2010 overal l t imes Per iod I t i s
show the Negat ive trend but i t i s no t stat i s t ical ly s igni f icant . R2, R
2 i s very lo w. Show in the
table 2 .1 .The t ime per iods: 1980 -1990, 1990 -2000 and 2000 -2010 has sho wn the posi t ive
trend. But 1990 -2000, 2000-2010 has sho wn the value o f t and f is stat i st ica l ly signi ficant a t
5% level o f s igni f icant . In both t ime per iod R2 and R
2 i s very high tha t sho w the be tte r
goodness o f f i t .
In the table 2 .2 the growth ra tes o f share o f India 's import in wor ld trade have sho wn
a negat ive Trend in whole t ime per iod 1960 -2010. But i t i s not stat i s t ical ly s igni f icant . In
f irs t second, and third sub -per iod 1960 -1970,1970-1980 and 1980 -1990 also take Negat ive
trend in 1960 -70, 1980 -90 has s tat i st ica l ly s igni ficance and in sub per iod 1990 -2000 ,2000 -
2010 has take posi t ive t rend . I t has stat is t ica l ly s igni f icant a t 5% leve l of s igni f icance in t
and F- Value. The Ind icator R2
, R2 is a l so high.
SECTION- III
THE COMPSOITION OF INDIA'S EXPORTS
AND IMPORTS. SINCE 1970 -2010
The co mposit ion of fore ign t rade implies the composi t ion of exports and impor ts o f a
country. I t indicates through impor ts what types o f goods a country lacks and ho w much of
them it i s a ab le to ge t . Exports b r ing out the fact about the goods tha t a country has and
ho w much of these i t can and i s wi l l ing to sel l . Seen over a per iod of t ime changes in the
composit ion of trade mi rror the developments taking place in the domestic s truc ture o f the
production.

International Journal of Advancements in Research & Technology, Volume 1, Issue 5, October-2012 9 ISSN 2278-7763
Copyright © 2012 SciResPub. IJOART
The present sec tion ana lys is the composit ion of Ind ia’s expor ts and imports .
COMPOSITION OF EXPORTS: -
Composi t ion of expor ts means goods that we are sel l ing to o ther countr ies. At the
t ime of Independence; our exports consis ted mainly o f agr icultural produc ts l ike Tea, Sp ices ,
tobacco and other raw mater ia ls e tc . We were a lso export ing cot ton text i les and jute products
in large quant i t ies. With the indust r ia l izat ion of the economy, composit ion of exports have
under gone a change, Thereby the propor t ion of r aw mater ials in our expor ts has dec lined
whi le that o f manufac tured goods has increased. we are no w expor t ing large quant i t ies o f
i tems such as machinery and transpor t equipment , chemica ls al l ied products, marine
products, handicraf t s , f ish ho wever expor t of i tems such as cot ton fabric tea Jute
manufac tures, spices e tc also continues.
COMPOSITION OF INDIA'S EXPORTS
As per the lates t c lassi f icat ion of RBI, the joining the main category of expor t .
1) Agriculture and al l ied Products : -
This commodity group inc ludes Tea, coffee, sp ices, tobacco, o i l meal frui t s and
vegetab les, Marine products and raw mater ial .

International Journal of Advancements in Research & Technology, Volume 1, Issue 5, October-2012 10 ISSN 2278-7763
Copyright © 2012 SciResPub. IJOART
2) Ores and Minerals
This commodity group includes Iron ore, processed mineral and o ther ores and
minera ls l ike mica, Jute text i le fiber and waste.
3) Manufactured goods.
This group inc ludes lea ther and lea ther products, gems , Jewel lary, machinery and
Transport equipment, e lectronic goods, drugs, pharmaceut ica ls , cot ton year and fabrics ready
made garments and handicraf ts e tc .
4) Crude and petroleum products : -
This commodity group was at one t ime an Important par t o f India 's exports . Ho wever
wi th set t ing up of our own oi l re f iner ies, thei r expor t i s very ins igni f icant .
5) Other unclass if ied items: -
I tems tha t have no t been inc luded in any of the abov e ca tegor ies a re included in this
l i st . I t consti tutes a very ins igni f icant propor t ion of total export .

International Journal of Advancements in Research & Technology, Volume 1, Issue 5, October-2012 11 ISSN 2278-7763
Copyright © 2012 SciResPub. IJOART
TABLE- 2 .3
RESULTS OF LINEAR REGRESSION EQUATIN
x= ( b0+b1t) SHOWING COMPOSITION OF INDIA'S
EXPORTS: 1970-2010
Commodit ies Time per iod b0 b1 R2 R
2 F va lue
1) Tea
1970-2010 348.772
(9.070)*
3.141
(1.874)
.087 .062 3.513
1970-1980 103.073
(1.498)
39.490
(3.562)*
.61 .56 12.688*
1980-90 486.693
(8.884)*
.652
( .074)
.001 -.124 .005
1990-2000 436.793
(5.630)*
-3 .582
( - .286)
.01 - .11 .082
2000-2010 300.389
(8.622)*
23.820
(3.847)*
.67 .63 14.801*
2 .) Coffee
1970-2010 57.465
(2.149)
8 .643
(7.416)*
.59 .58 55.001*
1970-80 -18.987
(-.892)
22.579
(6.581)*
.84 .82 43.308*
1980-90 205.813
(8.990)*
- .170
- .046
.00 -.125 .002
1990-2000 93.813
(1.625)
36.830
(3.959)*
.66 .62 15.671*
2000-2010 139.869
(3.448)*
36.868
(5.115)*
.78 .75 26.161*
3.) SPICES 1970-2010 -73.369 ( -
1 .250)`
17.232
(6.735)*
.551 .539 45.366*
1970-80 5.200 ( .317) 16.782
(6.340)*
.83 .81 40.190*
1980-90 104.053
(3.491)*
11.930
(2.483)*
.43 .36 6.168*
1990-2000 58.200
(2.639)*
35.684
(10.039)*
.92 .91 100.785*
2000-2010 .875 ( .006) 119.012
(4.540)*
.74 .71 20.612*
4) Fruit and
vegetab les
1970-2010 70.721
(1.303)
9 .072
(3.836)*
.28 .26 14.713*
1970-80 64.967
(4.581)*
16.037
(7.016)*
.86 .84 49.223*
1980-90 360.920
(6.001)*
-20.722
( -2 .086)*
.35 .27 4.351
1990-2000 121.633
(11.100)*
3.263
(1.848)
29 .21 3.414
2000-2010 1.608 ( .029) 96.278
(9.852)*
.93 .92 97.072*
5.) Tabacco 1970-2010 42.003
(1.332)
7 .349
(5,306)*
.432 .41 28.158*
1970-80 42.540
(8.492)*
11.031
(13.663)*
.959 .95 186.666*

International Journal of Advancements in Research & Technology, Volume 1, Issue 5, October-2012 12 ISSN 2278-7763
Copyright © 2012 SciResPub. IJOART
1980-90 252.427
(10.515)*
-16.708
( -4 .319)*
.70 .66. 18.650*
1990-2000 112.287
(3.289)*
11.206
(2.036)
.34 .25 4.147
2000-2010 35.467
( .519)
59.433
(4.889)*
.77 .74 23.907*
6) Leather 1970-2010 -366.072
(-3 .609)*
78.986
(17.868)*
.89 .89 319.274-
1970-80 81.060
( .635)
42.731
(5.417)*
.78 .75 29.347*
1980-90 156.920
(5.706)*
88.569
(5.706)*
.80 .77 32.559*
1990-2000 1284.749
(14.152)*
42.244
(2.887)*
.51 .44 8.337*
2000-2010 1387.575
(9.531*
234.932
(9.081)*
.92 .91 82.465*
7) I ron and
Steel
1970-2010 -1068.304
(-2 .939)*
102.180
(6.451)*
.52 .51 41.612*
1970-80 35.920
( .465
24.847
(1.996)
.33 .29 3.982
1980-90 71.700
(4.189)*
-2 .078
( - .753)
.06 - .05 .568
1990-2000 125.687
(1.388)
76.617
(5.250)*
.77 .74 27.561*
2000-2010 -28.597
(-.092)
677.655
(12.257)*
.95 .94 150.245*
8) Petroleum 1970-2010 -4375.447
(-2 .376)
359.764
(4.483)*
.35 .33 20.100*
1970-80 11.800
(6.945)*
1.031
(3.765)*
.63 .59 14.175*
1980-90 31.080
( .494)
45.302
(4.463)*
.71 .67 19.921*
1990-2000 596.473
(7.784)*
-42.179
( -3 .415)*
. .59 .54 11.665*
International Journal of Advancements in Research & Technology, Volume 1, Issue 5, October-2012 13 ISSN 2278-7763
Copyright © 2012 SciResPub. IJOART
2000-2010 -6992.911
(-2 .347)*
3695.280
(6.979)*
.87 .85 48.708*
9) I ron and Ore 1970-2010 -637.009
(-1 .833)
77.175
(5.096)*
.41 .39 25.969*
1970-80 97.453
(6.841)*
22.983
(10.010)*
.92 .91 100.201*
1980-90 347.940
(14.672)*
14.824
(3.879)*
.65 .60 15.043*
1990-2000 569.427
(10.909)*
-21.243
( -2 .525)*
.44 .37 6.377*
2000-2010 -831.058
(-1 .654)
706.072
(7.908)*
.89 .88 62.530*
10) Mica 1970-2010 22.062
(11.178)*
- .230
( -2 .675)*
.16 .13 7.153*
1970-80 18.393
(9.188)*
.467
(1.446)
.20 .10 2.092
1980-90 27.333
(10.230)*
-1 .052
( -2 .442)*
.42 .35 5.96.*
1990-2000 13.940
(5.866)*
- .644
( -1 .680)
.26 .16 2.824
2000-2010 6.586
(2.053
2.058
(3.610)*
.65 .60 13.033
11) Chemicals 1970-2010 -4405.317
(-3 .756)*
426.475
(8.351)*
.65 .64 69.744*
1970-80 2.093
( .123)
21.138
(7.690)*
.88 .86 59.133*
1980-90 -15.180
(-.081)
110.731
(3.673)*
.62 .58 13.49*
1990-2000 812.293
( .676)
515.014
(2.659)*
.46 .40 7.071*
2000-2010 1551.308
(1.847)
2295.792)
(15.380)*
.97 .96 236.549*
t* -Signi f icant at 5% level o f signi f icance.
F* - Signi ficant at 5% level o f s igni f icance.
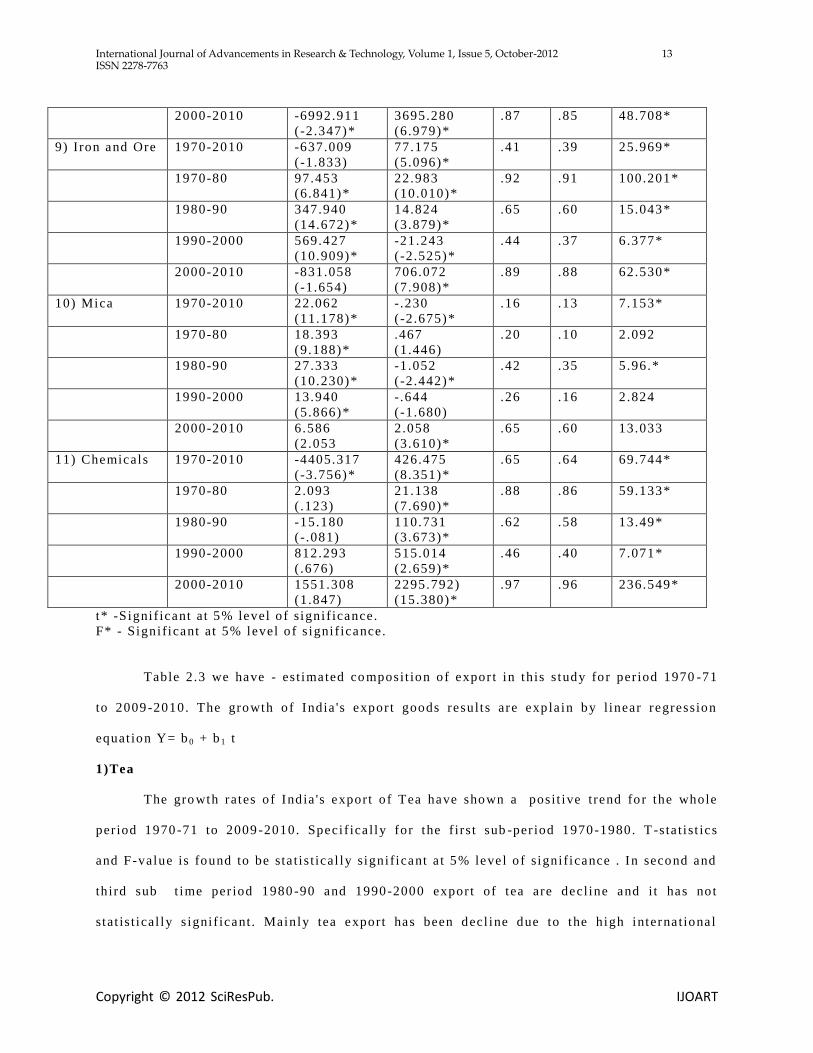
Table 2 .3 we have - es t imated co mposit ion of expor t in this s tudy for per iod 1970 -71
to 2009-2010. The growth of India 's expor t goods result s are exp la in by l inear regression
equat ion Y= b 0 + b 1 t
1)Tea
The gro wth rates o f Ind ia 's export o f Tea have shown a posi t ive trend for the whole
per iod 1970 -71 to 2009 -2010. Speci f ica l ly for the f irs t sub -per iod 1970-1980. T -s ta t i st ics
and F-value is found to be sta t i s t ical ly signi ficant a t 5% leve l o f signi ficance . In second and
third sub t ime per iod 1980 -90 and 1990-2000 expor t of tea are decline and i t has no t
stat is t ical ly s igni f icant . Mainly tea export has been decl ine due to the high interna tional
International Journal of Advancements in Research & Technology, Volume 1, Issue 5, October-2012 14 ISSN 2278-7763
Copyright © 2012 SciResPub. IJOART
compet i t ion. But last sub -period 2000 -2010 the gro wth ra te o f exports of tea have shown a
improvement and i t i s s tat i s t ical ly signi ficant at 5% leve l .
2) Coffee:
The gro wth ra te o f coffee have sho wn a posit ive trend for the whole per iod 1970 -
2010. In the f ir st sub per iod 1970 -80 t - stat i st ics and f -value i s found to be stat i st ica l ly
signi ficant at 5% level of signi ficance. But second sub per iod 1980 -90 have sho wn negat ive
trend and no t s tat i st ical ly signi ficant a t 5% level due to increased the inte rnat ional
comple tion. But in third and for th sub -period 1990-2000 and 2000 -2010 have shown wi th
posi t ive trend due to l iberal po lici es o f government and t and f tes t are sta t i s t ical ly
signi ficant at 5% level

International Journal of Advancements in Research & Technology, Volume 1, Issue 5, October-2012 15 ISSN 2278-7763
Copyright © 2012 SciResPub. IJOART
3) Spices: -
The gro wth rate o f spices have sho wn posit ive trend in whole t ime per iod 1970 -2010
and s tat i st ica l ly s igni f icant a t 5% level . and al l sub per iod of 1970 -80, 1980 -90 , 1990-
2000,2000-2010 have shown posit ive and r i s ing trend, t -sta t i s t ic and f -va lue i s found to be
stat is t ical ly signi ficant at 5% due to the divers i ficat ion of market and l iberal po lices o f the
government .
4) Fruits and vegetable: -
The growth ra te o f export o f frui t s and vegetable have shown posit ive t rend in whole
t ime per iod 1970 -2010 . The fir st sub per iod 1970 -80 have s igni f icant a t 5% level o f
signi ficance in t -tes t and f - test . But second sub -period 1980 -80 i t has take negat ive trend
due to less f lor icul tura l products. But in las t sub per iod 2000 -2010 have been shown wi th
posi t ive trend and high R2 and R
2. T and F sta t i st ics are stat is t ical ly signi f icant at 5% level .
Due to more product ions of f rui ts i t has take r i sing t rend.
5) Tobacco: -
The gro wth rate o f export o f Tobacco in 1970 -2010 in whole t ime per iod have sho wn
a posit ive trend. In f ir s t , and for th sub per iod 1970 -80, 2000 -2010 take a posi t ive t rend but
sub per iod 1980 -1990 take a negative trend but these sub per iod s ta t i st ica l ly s igni f i cant at
5% leve l . The lo w growth ra te o f Tobacco in sub per iod 1990 -2000 is due to Ant i -Smoking
dr ive, government res tr ict ion and increased complet ion.
6) Leather: -
The growth rate o f leather in whole t ime per iod 1970 -2010 have shown posit ive
trend and stat i st ica l ly s igni f icant at 5% leve l , the al l sub - per iod 1970-80, 1980 -90 , 1990 -
2000, 2000-2010 have sho wn posit ive trend and t -s tat i st ica l and F - va lue are signi ficant at
5% leve l . The reason of increas ing trend of leather has r i s ing the demand of this product .
7) Iron and stee l: -
The growth ra te o f I ron and Stee l have been show wi th posi t ive and increasing
t rend in whole t ime per iod 1970 -2010 but fir s t sub per iod 1970 -80 not stat is t ica l ly
signi ficant and second sub per iod 1980 -90 have been sho wn a negative trend and not

International Journal of Advancements in Research & Technology, Volume 1, Issue 5, October-2012 16 ISSN 2278-7763
Copyright © 2012 SciResPub. IJOART
stat is t ical ly signi ficant due to negative gro wth rate o f quantum index desp ite higher expor t
uni t va lue index.
8) Petroleum
The growth rate o f pet roleum have sho wn posi t ive and increas ing trend in whole
per iod 1970 -2010 ,and sub -period - 1970-80, 1980-90, 2000 -2010. t - S tat is t ic and F - va lue i s
stat is t ical ly s igni f icant at 5% level o f s igni f icance. In 2000 -2010 the growth ra te o f export o f
petroleum are increased due to a r i se in pe troleum pr ice and increas ing in Ind ia 's re fining
capac ity. But sub - per iod 1990-2000 has take a negat ive trend and i t has a lso s tat i st ica l ly
signi ficance.
9) Iron and ore
The growth ra te o f I ron and ore have been shown a posi t ive trend in whole per iod
1970-2010, speci f ica l ly for the sub per iod 1970-80, 1980 -90, 2000 -2010 also have show a
posi t ive trend and t - s ta t i st ics and F - value i s s tat i s t ical ly s igni f icant a t 5% leve l . But in sub
per iod 1990 -2000 have sho wn negative trend.
10) MICA:-
The gro wth rate o f MICA have sho wn negat ive trend in whole per iod 1970 -2010 But
sub per iod 1970-80 take a posit ive trend but i t has not stat is t ica l ly signi ficant . The
seconds and third sub per iod have sho wn negat ive trend and 1980 -90 i s sta t i s t ical ly
signi ficant . Decl ine growth ra te shown by in terna tional co mpet i t ion. In last sub per iod 2000 -
2010 have shown posit ive trend t stat i st ic and F - va lue also signi f icant a t 5% level .
11) Chemicals: -
The gro wth rate o f Chemicals have sho wn posit ive trend in whole t ime per iod 1970 -
2010 and al l sub - per iod 1970-80, 1980 -90 , 1990-2000, 2000to2010 , t and F -va lue are
stat is t ical ly signi ficant at 5% level . The main reason of increasing trend due to increas ing
rel iance of industr ia l ized countr ies on develop ing countr ies.
3.2 Composit ion of Import
Composi t ion of Impor ts means goods that we are buying from other countr ies. At the
t ime of independence, Our country was pr imar i ly an agr icul tura l economy. Industry was not

International Journal of Advancements in Research & Technology, Volume 1, Issue 5, October-2012 17 ISSN 2278-7763
Copyright © 2012 SciResPub. IJOART
so much developed. For economic development required set t ing up of new industr ies and also
Modernizat ion of agr iculture and Indust ry. After Moderniza tion capi ta l goods l ike machinery,
t ransport equip ment, and raw mater ials , chemicals and fer t i l izes, pe troleum products e tc . are
imported.
Composit ion of India's imports.
As per the la test c lassi f icat ion of RBI, the joining the main ca tegory of impor ts
1) Food and al l ied products: -
This commodity inc ludes cerea ls pulses, cashew nuts , ed ible oi ls etc .
2) Fuel: -
Coal and POL (Petroleum, Oil and Lubr icant) are the important sources o f energy.
After independence wi th the growth of indust ry and trade, the requi rement o f POL has
increased very fast . Our do mest ic product ion i s not suff ic ient . Now India 's impor ts
petro leum goods in such large quanti t ies tha t their share accounts for over one -fi f th o f our
tota l imports.
3) Ferti l izers: -
Fer t i l izers are very impor tant input o f agr iculture. Our domest ic production of
Fer t i l izers fa l l s short o f our requirements .
4) Paper boards manufactures and News prints: -
This commodity group accounted for 1 .3% in our total imports.
5) Capital goods: -
Capital goods include machinery transport equipment , e lec tronic goods e tc . wi th the
gro wing requirement o f India 's rapid ly developing e conomy, import of capi tal goods
continue to have a very high share o f our to ta l impor ts.
6) Other Bulk items: -
This commodity group inc ludes i tem l ike chemicals, Pear ls , p rec ious s tone iron, s teel
and non. Porous metals etc .
7) Unclassif ied items: -
Many o ther i tems of impor ts which have no t been covered in above categor ies

International Journal of Advancements in Research & Technology, Volume 1, Issue 5, October-2012 18 ISSN 2278-7763
Copyright © 2012 SciResPub. IJOART
consti tute unclass i fied i tems.
TABLE- 2 .4
RESULTS OF LINEAR REGRESSION EQUATION
x= ( b0+b1t)
SHOWING COMPOSITION OF INDIA'S IMPORTS
Commodit ies Time per iod B0 b1 R2 R
2 F va lue
1) Petroleum, Crude and
Products
1970-2010 -13149.8
( -2 .615*)
1285.287
(5.865*)
.48 .46 34.397*
1970-1980 -318.273
(-1 .555)
247.359
(7.499*)
.87 .86 56.239*
1980-90 4105.907
(8.390)*
-138.150
(-1 .752)
.27 .18 3.068
1990-2000 4335.940
(3.737)*
554.742
(2.967)*
.52 .46 8.801*
2000-2010 -9593.353
(-1 .262)
10183.752
(7.539)*
.89 .87 56.830*
2.)Fer t i l izers 1970-2010 -765.805
(-1 .201)
100.541
(3.618)*
.26 .24 13.093*
1970-80 81.320
( .832)
40.436
(2.568)*
.45 .38 6.594*
1980-90 456.900
(2.213)*
27.467
( .825)
.07 - .03 .681
1990-2000 892.407
(5.349)*
37.390
(1.391)
.19 .09 1.934
2000-2010 -2848.164
(-1 .380)
1202.028
(3.278)*
.606 .54 10.746*
3.) Paper , Paper Board,
Manufactures
1970-2010 -176.317
(-2 .293)*
27.184
(8.113)*
.64 .63 65.823*
1970-80 -.867
(- .048)
14.479
(4.972)*
.75 .72 24.719*
1980-90 210.340
(7.824)*
-2 .389
(- .551)
.03 - .08 .30
1990-2000 138.733
(2.504)*
38.118
(4.270)*
.69 .65 18.229*
2000-2010 62.656
( .576)
167.107
(8.648)*
.91 .90 74.791*
4) Text i le yarn, Fabrics,
Madeup
1970-2010 -501.656
(-3 .463)*
49.624
(7.861)*
.62 .61 61.789-*
1970-80 -6.820
(- .694)
5 .331
(3.368)*
.58 .53 11.341*
1980-90 73.433
(4.655)*
10.581
(4.162)*
.68 .64 17.322*
1990-2000 101.747
(2.802)*
39.892
(6.818)*
.85 .83 46.480*
2000-2010 247.003
(3.346)*
270.362
(20.608)*
.98 .98 424.706*
5.) Electr ical Machinery 1970-2010 -104.00 41.013 .39 .38 24.324*

International Journal of Advancements in Research & Technology, Volume 1, Issue 5, October-2012 19 ISSN 2278-7763
Copyright © 2012 SciResPub. IJOART
except elec tronic ( - .545) (4 .932)*
1970-80 77.220
(1.811)
22.347
(3.253)*
.56 .51 10.579*
1980-90 234.08
(5 .360)*
88.062
(12.512)*
.95 .94 156.551*
1990-2000 741.113
(5.153)*
-47.301
(-2 .041)
.34 .26 4.165*
2000-2010 -385.103
(-1 .263)
386.778
(7.137)*
.87 .86 50.932*
6) Manufactures o f
Metals
1970-2010 -404.61
(-2 .401)
40.644
(5.535)*
.45 .43 30.631*
1970-80 .540
( .071)
6 .873
(5.645)*
.79 .77 31.861*
1980-90 128.353
(10.42)*
1.814
( .914)
.09 - .01 .836
1990-2000 78.08
(3 .94)*
31.88
(9 .98)*
.92 .91 99.757*
2000-2010 -455.60
(-1 .48)
349.370
(6.424)*
.85 .83 41.268*
7) Metal l i ferous ores,
meta l scrap
1970-2010 -1322.876
(-2 .49)*
124.299
(5.37)*
.43 .42 28.841*
1970-80 -18.84
(-1 .39)
10.113
(4.636)*
.72 .69 21.488*
1980-90 53.113
(1.087)
46.214
(5.870)*
.81 .78 34.461*
1990-2000 598.88
(6 .11)*
21.315
(1.349)
.18 .08 1.821
2000-2010 -1639.14
(-1 .619)
1100.26
(6 .114)*
.84 .82 37.37*
8) Cerea ls and Cerea ls
prepara t ion
1970-2010 543.178
(5.845)*
-14.66
(-3 .62)*
.26 .24 13.119*
1970-80 502.380
(1.38)
.000
.000
.00 .00 0.00
1980-90 350.90
(2 .07)
-11.74
(- .430)
.02 - .10 .185
1990-2000 74.87
( .979)
15.290
(1.240)
.16 .05 1.538
2000-2010 11.09
(3 .50)*
3.732
(6.62)*
.86 .84 43.915*
9) Crude rubber ,
Inc luding synthe tic
and rec la imed
1970-2010 -111.42
(-2 .60)*
13.56
(7 .28)*
.58 .57 53.127*
1970-80 -11.220
(-1 .182)
4 .967
(3.24)*
.56 .51 10.538*
1980-90 50.08
(5 .913)*
5.93
(4 .344)*
.70 .66 18.868*
1990-2000 92.18
(3 .70)*
7.938
(1.979)
.32 .24 3.917
2000-2010 -42.742
(-.800)
94.995
(10.004)*
.93 .92 100.086*
10) Medicinal and
pharmaceut ica l
products
1970-2010 -245.159
(-2 .771)*
29.847
(7.743)*
.61 .60 59.951*
1970-80 12.040 7.362 .79 .76 30.121*

International Journal of Advancements in Research & Technology, Volume 1, Issue 5, October-2012 20 ISSN 2278-7763
Copyright © 2012 SciResPub. IJOART
(1 .447) (5 .488)*
1980-90 73.727
(4.033)*
11.964
(4.061)*
.67 .63 16.492*
1990-2000 221.553
(8.473)*
17.608
(4.178)*
.68 .64 17.459*
2000-2010 -5.750
(- .050)
192.597
(9.449)*
.92 .91 89.279*
11) Transport equipment 1970-2010 -1757.807
(-2 .390)*
175.397
(5.474)*
.44 .43 29.963*
1970-80 21.440
( .696)
33.275
(6.698)*
.849 .83 44.865*
1980-90 401.060
(3.664)*
25.805
(1.463)
.21 11 2.139
1990-2000 691.480
(3.086)*
51.058
(1.414)
.20 .10 1.999
2000-2010 -2002.672
(-1 .965)
1535.157
(8.476)*
.91 .89 71.844*
t* -Signi f icant at 5% level o f signi f icance.
F* - Signi ficant at 5% level o f s igni f icance.
Table 2 .4 Ind ica tes the gro wth of India 's imports result s o f l inear regression equat ion
(x = b0 + b1 t) showing the gro wth rate o f India 's imports co mmodi ty wi se.
1) Products of petroleum and crude: -
This tab le 2 .4 revea led tha t the growth rate o f petro leum and crude of product have
shown a posi t ive trend for the who le per iod 1970-2010 and t - s tat i s t ic and F -va lue i s
stat is t ical ly signi f icant . But Sub -per iod of 1970-80, 1990 -2000. 2000 -2010 is take posit ive
trend and t - s ta t i s t ic and F -value is take s igni f icant va lue of 5% leve l . But in 1980 -90 i s
not stat i st ica l ly signi ficant . The Impor t o f petro leum products has r ise due to i t has used not
only as fuel but a lso as an industr ia l raw mater ial . The second reason is rap id r ise in pr ice
in interna tional market .
2) Ferti l izers: -
The growth rate o f Fer t i l izers dur ing the whole per iod 1970 -2010; and al l sub per iod
has shown a posit ive trend . But 1970 -2010, 1970-80, 2000 -2010 are stat i s t ical ly s igni f icant
at 5% leve l . But 1980 -90, 1990-2000 is not stat is t ical ly s igni f icant . In 2000 -2010 sub per iod
take a r i s ing trend due to r i sing demand of this product .
3) Paper, Paper boards and Manufactures.
The gro wth ra te o f Paper , paper boards and manufac tures have take posi t ive trend
and s ta t i s t ical ly signi ficant at 5% level o f signi f icance in whole and sub per iod 1970 -2010,

International Journal of Advancements in Research & Technology, Volume 1, Issue 5, October-2012 21 ISSN 2278-7763
Copyright © 2012 SciResPub. IJOART
1970-80, 1990 -2000 , 2000-2010 is take posit ive trend and s ta t i st ica l ly s igni f icant a t 5% level
of s igni f icance. But 1980 -90 take negative trend and i t i s no t stat is t ica l ly s igni f icant .
4) Text i le yarn, Fabrics, Made up: -
The growth rate o f text i le ya rn, Fabrics, made up is sho wn have whole t ime per iod
1970-2010 and sub per iod 1970 -80, 1980 -90, 1990-2000, 2000 -2010 is take posi t ive t rend
and s ta t i st ica l ly s igni f icant a t 5% leve l o f signi f icance. R2, R
2 i s take high value.
5) Electr ica l Machinery except electronic
The gro wth rate o f e lec tr ical machinery excep t electronic shown posi t ive trend and
stat is t ical ly s igni f icant in whole t ime per iod and sub -period 1970 -2010, 1970-1980, 1980 -
1990 and 2000 -2010; but 1990 -2000 is take negat ive trend and no t s tat i s t ical ly signi ficant
at 5% leve l o f signi ficance.
6) Manufactures of metals.
The growth rate o f manufactures o f metals Shown posit ive t rend 1970 -2010 in whole
t ime per iod and sub per iod i s 1970 -80, 1990-2000, and 2000 -2010 is a lso sta t i s t ica l
s igni ficant but in 1980 -1990 is not s tat i st ica l ly signi f icant a t 5% leve l of t - s tat i st ic and F
va lue. I t has due to r i sing demand in the expor t - or iented industr ial and domestic .
7) Metall ic ferrous ores , meta l scrap:
The gro wth rate o f meta l l ic ferrous ores, Meta l , scrap has shown posi t ive trend in a l l
whole t ime per iod and sub t imeper iod. But in whole t ime per iod 1970 -2010 and sub per iod
1970-1980, 1980 -1990, 2000-2010 has a lso s tat i s t ical ly s igni f icant a t 5% level o f t –
stat is t ic and F -va lue . But in 1990 -2000 that t ime per iod i s no t s tat is t ical ly s igni f icant at
5% leve l .
8) Cereals and cereal preparat ion: -
The gro wth ra te o f cereals and cereal preparat ion show tha t two t ime per iod 1970 -
2010, 2000-2010 has stat i s t ical ly signi f ican t . But other sub -period 1970-1980, 1980 -1990,
1990-2000 is no t stat is t ica l ly signi ficant at 5% leve l . R2, R
2 i s take a very low value
dur ing the whole per iod 1970 -2010 take Negative trend due to the success o f green

International Journal of Advancements in Research & Technology, Volume 1, Issue 5, October-2012 22 ISSN 2278-7763
Copyright © 2012 SciResPub. IJOART
revo lut ion.
9) Crude rubber , including synthetic and rec laimed:
The growth rate o f crude rubber , includ ing synthe tic and recla imed has shown decl ine
trend in whole t ime per iod tha t 1970 -2010 , but in sub -t ime per iod 1970-80, 1980 -1990,
2000-2010 is s ta t i st ica l ly s igni f icant at 5% leve l o f signi ficant . R2 i s very high but 1990 -
2000 is not s igni f icant a t 5% level o f s igni f icance.
10) Medicinal and Pharmaceut ica l products .
The growth ra te o f medic ines and pharmaceut ical products has sho wn tha t the
increas ing t rend in whole t ime per i od1970-2010 and sub t ime per iod 1970 -80,1980-90 ,1990 -
2000,2000-2010, i t has s tat i st ica l ly s igni f icant a t 5% level o f s igni f icance o f t - s ta t i s t ic and
F- va lue . The R2 is very high due to increas ing rel iance of industr ial ized countr ies.
11) Transport equipment:-
The gro wth ra te o f Transport equipment has shown posi t ive trend or increasing trend
in the whole per iod and sub per iod is taking. But the t ime per iod 1970 -2010, 1970-80, 2000 -
2010 is sta t i s t ical ly signi f icant at 5% level o f signi ficance but in sub -period 1980 -90, 1990 -
2000 is no t s ta t i st ical ly signi f icant . Due to r i sing demand in the expor t or iented industr ia l
and domest ic .
SECTION- IV
CONCLUSIONS & POLICY IMPLICATIONS.
This sec tion has been Expla ined the main conclusions and the pol icy impl ica t ions
emerging from the study.
India 's share in world 's exports has shown a r i s ing trend. I t s share was only 0 .5% in
1991. Dur ing the per iod from 1991 to 1997 i t s share was continuously rose fro m 0.50% to
0 .62% and per iod of 2009 - 2010 i t i s r i se 1 .25 %. This r i se in Ind ia 's expor ts share in
world 's expor ts implies the gain in competi t iveness. S imi lar ly, Ind ia 's share in world impor ts
has a lso sho wn a r i sing trend 1990 -2010. I t was 1 .82% in 19 60-61. But in 1969 -70 I t was
0 .8%; i t has sho wn the decreas ing trend. In the t ime per iod 1960 -70, 1970-1980, 1980 -90 and
whole t ime per iod 1960 -2010 sho w that decreasing trend. But in 1990 -2000, 2000 -2010 show

International Journal of Advancements in Research & Technology, Volume 1, Issue 5, October-2012 23 ISSN 2278-7763
Copyright © 2012 SciResPub. IJOART
that r is ing trend. The impor ts share in wor l d impor ts in 2000 -2001 is 0 .7% and 2009 -2010
the re la t ive share i s 1 .9% show the increasing t rend .
The composi t ion of India 's expor ts has gro wn up signi ficantly the exports o f Tea,
coffee, sp ices, tabacco , Lea ther , I ron and ore, pe troleum and c hemica l have shown a
considerab le increasing trend.The composit ion of Ind ia 's impor ts has grown up signi ficant ly
. I t a l so shown a posit ive and increasing t rend dur ing the per iod under s tudy. The share o f
imports o f pe troleum and crude products, fer t i l ize rs paper , boards and manufac tures, Texti le
yarn, made up e lec tronic manufac tures o f meta ls, crude upper , medic ina l and pharmaceut ical
products, Transport equipment has increased s igni f icantly. The imports o f food grains and
consumer goods have decline due to adoption HYM technology in Indian agriculture.
Policy impl icat ion
The study a lso indicates that post l iberal iza t ion era has cer ta inly he lped
Ind ia in achieving high gro wth in the economy. Rapid growth of imports o f capi ta l goods,
technica l raw mater ials to meet the requiremen t o f industr ia l izat ion. Growing impor ts o f
petroleum products for meet ing industr ial and consumpt ion requirement . For the
expor ts so me commodi t ies have good exports potent ia l (handicraf t s , engineer ing pr oduct ,
readymade )and o ther i tems of expor ts (Sugar , Jute , I ron, and Stee l) Fluctuated
considerab ly. Major port ion Ind ian imports consis ts o f fuels, capi ta l goods chemicals e tc .
Major port ion of Ind ian expor ts in manufactured goods.

International Journal of Advancements in Research & Technology, Volume 1, Issue 5, October-2012 24 ISSN 2278-7763
Copyright © 2012 SciResPub. IJOART
BIBLIOGRAPHY
1. Ahluwal ia , M.S (2002) , "Econo mic re forms in Ind ia s ince 1991: Has
Gradualism worked?: Journa l o f economic perspec tives , 16 (3) summer
67-78.
2 . Alcala , F. , and c iccone,(2004) , " Trade and product ivi ty" , quarter ly
Journa l o f economics. 119(2) ,613 -46
3 . Arora.A,Gambardel la , (2004)" The globalizat ion of the sof tware industry:
perspect ives and opportunit ies for developed and develop ing country" ,
NBER working paper no. 10538.
4 . Dollar , D. and A Kraay. (2002) , " Inst i tut ions Trade and gro wth" . Paper
prepared for the Carnegie - Rochester conference ser ies on public policy,
World Bank, Washington D.C.
5 . De long, B. (2004) " Ind ia s ince independence, an ana lyt ic growth
nar rat ive, ch. 7 D. Rodrik (ed.) in search of p rosper i ty" , Pr inceton, NJ,
pr ince ton Univers i ty press 184 -204.
6 . Kohl i , A. (2006 a) , "poli t ics o f economic growth in India" 1980 -2005
par t 1 : econo mic and po li t ical weekly.
7 . Kalpana Kochhar , Utsav Kumar, Raghuram Rajan, Arvind Subramanian,
and Ioannis (2006) ,Ind ia’s Pat tern o f Development: What Happened,
What Fol lows”? , IMF Working Paper , WP/06/22.
8 . Krishanamurthy, K and Sastry, D.U. (1968) , “Inventor ies in the
Organized Manufactur ing Sec tor or the Ind ian Economy”, Ins t i tute of
Economic Gro wth, Delhi . 98
9 . Mallick, S.K (1996) . "Causa li ty be tween exports and economic growth in
Ind ia: Evidence from co -integrat ion-based error correc tion model" The
Ind ian Journa l o f economics Lxxv, 303 -318.
10. Michele Alessandr ini , Bassam Fattouh, and Pasquale
Scaramozzino ;(2007):The changing pa tte rn of fo reign trade

International Journal of Advancements in Research & Technology, Volume 1, Issue 5, October-2012 25 ISSN 2278-7763
Copyright © 2012 SciResPub. IJOART
spec ia l izat ion in Ind ian manu factur ing,Oxford Review of Economic
Policy, Volume 23, Number 2 , 2007, pp.270 –29
11. Mathur , Vibha, (2006) , Fore ign Trade of Ind ia, 1947 to 2007, Trends,
Policies and Prospec ts, New Century Publicat ions, New Delhi .
12. Mihir Pandey (2004) , Impact o f Trade Libera l i za t ion in Manufactur ing
Industry in India in the 1980s and 1990s, ICRIER Working Paper No.
140, New Delhi .
13. Nandi 's and B. Biswas,(1991) "Expor ts and economic gro wth" . The Ind ian
economic review journal 38, 3:53 -57.
14. Nidugula, G.K. (2000) ,"Exports and econo mic gro wth in Ind ia, An
empir ica l Invest igation" . The Indian economic Journa l 47, 3 : 67 -78.
15. Nagraj , R. (2003) , “Foreign Direc t Investment in Ind ia in the 1990s:
Trends and Issues”,Economic and Pol i t ica l Weekly, Vol. 38, No. 17,
Apri l 26.
16. Nayyar , D. (1976 ) , India’s Export and Export Polic ies in 1960’s,
Cambr idge Universi tyPress.
17. Panagaria , A. (2004) , India’s Trade Reform, in (ed.) S . Bery, B.
Boswor th and A Panagar ia ,Ind ian Pol icy Fourm, Vol. I , 1 -57.
18. Panchmukhi, V.R. (1979) , Trade Policies in India; A Qua nt i ta t ive
Analys is , ConceptPublishing, New Delhi .
19. Raj , K.N. , (1966) , Food, Fer t i l izer and Foreign Aid, Mainstream, 30,
Apri l .
20. Rakshit , M., (1994) : I ssues in Struc tura l Adjustment o f Ind ian Economy
( in ed.) Edmor L.Bacha .
21. Rodr ik, D. (1992a) , The Limi t of Tr ade Policy Reform in Develop ing
Countr ies, Journal o f Economic Perspect ives, 6 , 87 -105, Washington.
22. Sen, S and R.U. Das (1992) , Import Libera l izat ion as a Tool o f Economic
Policy in Ind ia – A Perspect ive from the Mid 1980s to December 1991, in

International Journal of Advancements in Research & Technology, Volume 1, Issue 5, October-2012 26 ISSN 2278-7763
Copyright © 2012 SciResPub. IJOART
B. Debroy (ed) , Global and Ind ian Trade Policy Changes, Commonwealth
Publ ishers.
23. Shafaeddin, S.M. (2005) , “Trade Libera l iza t ion and Economic Reform in
Developing Countr ies: St ructural Change or De -Industr ial iza t ion”?
UNCTAD, Discuss ion Paper No: 179.
24. Singh Manmohan, (1964) , Ind ia’s Expor t Trends, Oxford: Clarendon
press

International Journal of Advancements in Research & Technology, Volume 1, Issue 5, October-2012 27 ISSN 2278-7763
Copyright © 2012 SciResPub. IJOART
ANNEXURE-1
RELATIVE SHARE OF INDIA'S EXPORTS IN WORLD
EXPORTS (1960-2010) (Bil l ion US$)
Year World’s Exports India's Exports India's % Share In
world’s Exports
1960-61 118.8 1 .33 1.11
1961-62 123.5 1 .38 1.11
1962-63 128.9 1 .4 1 .08
1963-64 141.4 1 .62 1.14
1964-65 157.9 1 .7 1 .07
1965-66 172.8 1 .68 0.97
1966-67 189.5 1 .95 1.02
1967-68 198.5 1 .61 0.81
1968-69 221 1.76 0.79
1969-70 253 1.83 0.72
1970-71 289.7 2 .02 0.69
1971-72 326.3 2 .03 0.62
1972-73 388.9 2 .44 0.62
1973-74 540.1 2 .91 0.53
1974-75 805 3.92 0.48
1975-76 829.5 4 .35 0.52
1976-77 942.5 5 .54 0.58
1977-78 1068.3 6 .37 0.59
1978-79 1235.5 6 .67 0.53
1979-80 1576.7 7 .8 0 .49
1980-1981 1897.6 8 .58 0.45
1981-82 1865.1 8 .29 0.44
1982-83 1733.5 9 .35 0.53
1983-84 1681.9 9 .14 0.54
1984-85 1783.5 9 .91 0.55
1985-86 1808.1 9 .21 0.5
1986-87 1990.6 9 .49 0.47
1987-88 2342.1 11.37 0.48
1988-89 2694.1 13.31 0.49
1989-90 3037.5 19.5 0 .65
1990-91 3434.7 21.3 0 .52
1991-92 3478.1 17.6 0 .5
1992-93 3728.5 19.6 0 .52
1993-94 3724.1 21.5 0 .57
1994-95 4236.8 25 0.59

International Journal of Advancements in Research & Technology, Volume 1, Issue 5, October-2012 28 ISSN 2278-7763
Copyright © 2012 SciResPub. IJOART
1995-96 5089.5 30.6 0 .6
1996-97 5327.5 33.1 0 .62
1997-98 5505.7 35 0.63
1998-99 5426 33.4 0 .61
1999-2000 5657.9 35.6 0 .62
2000-2001 6373.1 42.3 0 .66
2001-2002 6124.2 43.4 0 .7
2002-2003 6435.5 50.4 0 .78
2003-2004 7474.6 59 0.78
2004-2005 9086.5 75.6 0 .83
2005-2006 10240.2 59.2 0 .57
2006-2007 11523.4 124 1.07
2007-2008 13774.2 150 1.08
2008-2009 15987.6 194.5 1 .21
2009-2010 12562.8 157.2 1 .25
Source: Yearbook of International f inancial stat ist ics , (Various i ssues) Publ ished by
International monetary fund (IMF) Washington D.C. U.S.A .

International Journal of Advancements in Research & Technology, Volume 1, Issue 5, October-2012 29 ISSN 2278-7763
Copyright © 2012 SciResPub. IJOART
ANNEXURE-2
RELATIVE SHARE OF INDIA'S IMPORTS IN WORLD'S IMPORTS: (1960 -2010)
(BILLION US$)
Year World’s
Imports
India’s imports India's % share in
world’s Imports .
1960-61 125.8 2 .3 1 .83
1961-62 130.5 2 .28 1.75
1962-63 137.3 2 .36 1.72
1963-64 149.3 2 .47 1.65
1964-65 166.8 2 .87 1.72
1965-66 181.6 2 .83 1.56
1966-67 199.6 3 .44 1.72
1967-68 209.1 2 .77 1.32
1968-69 232.1 2 .57 1.11
1969-70 264.2 2 .21 0.84
1970-71 303.7 2 .12 0.70
1971-72 338.7 2 .42 0.71
1972-73 397.1 2 .22 0.56
1973-74 547.6 3 .21 0.59
1974-75 805.7 5 .13 0.64
1975-76 836.6 6 .38 0.76
1976-77 946.8 5 .66 0.60
1977-78 1083.8 6 .64 0.61
1978-79 1259.3 7 .86 0.62
1979-80 1582.1 9 .82 0.62
1980-1981 1945.1 14.86 0.76
1981-82 1930 15.41 0.80
1982-83 1803.4 14.78 0.82
1983-84 1748.3 14.06 0.80
1984-85 1862.8 14.36 0.77
1985-86 1878.3 16.07 0.86
1986-87 2056.1 15.4 0 .75
1987-88 2408 16.72 0.69
1988-89 2787.3 19.16 0.69
1989-90 3154.3 20.53 0.65
1990-91 3563.3 23.29 0.65
1991-92 3540.4 20.4 0 .58
1992-93 3763.5 23.5 0 .62
1993-94 3973.6 22.7 0 .57
1994-95 4430.3 26.8 0 .60

International Journal of Advancements in Research & Technology, Volume 1, Issue 5, October-2012 30 ISSN 2278-7763
Copyright © 2012 SciResPub. IJOART
1995-96 5267.4 34.5 0 .65
1996-97 5532.1 37.3 0 .67
1997-98 5654.6 41.4 0 .73
1998-99 5586.7 43 0.77
1999-2000 5810.8 47 0.81
2000-2001 6584.2 51.5 0 .78
2001-2002 6340.9 50.4 0 .79
2002-2003 6577.2 56.5 0 .86
2003-2004 7654.6 71.2 0 .93
2004-2005 9365.9 99.8 1 .07
2005-2006 10638.9 142.8 1 .34
2006-2007 122081 172.8 0 .14
2007-2008 14057.5 216.3 1 .54
2008-2009 16211.1 291.7 1 .80
2009-2010 12384.9 245.6 1 .98
SOURCE: Yearbook of International f inancia l Stat ist ics, (Various i ssues) Publ ished by
International monetary f ind ( IMF) Washington D.C. USA.