Embed Size (px)
Citation preview
,
Paleomagnetic study anddating of core SOH4
Preliminary reportAugust 1993
University of HawaiiSOEST-HIGCorrea RoadHonoluluU.s .A
Centre des Faibles RadioactivitesLaboratoire mixte CNRS/CEAAvenue de la Terrasse91198 Cif-sur-Yvette CedexFrance
---------- 4

Paleomagnetic study and dating of core SOH4-----------
Preliminary report, August 1993------------
I - Sampling
The firs t sam pling of this core for a paleomagnetic study has been mad e by
Carlo LAJ (CFR, Cif-su r-Yvette) and Em ilio HERRERO-BERVERA (SOEST,
Honolu lu) in March 1993. Three short plugs were taken close to each other at each
level (abou t one se t in each box). A total of 494 plugs were taken from 180 different
levels (flows and very few intrusi ons). Each plug gave one specimen for the
paleom agnetic ana lyses. The sa mpled length of the core is about 2010 feet do wn
from the top of the core . Between 763 and 867 feet, only intrusions have been
sampled. The tab les in which the sampling is detailed are reported in Appendix 1.
Just above 1550 feet, a piece of core has been taken (abou t 7") for radiometric
dating.
II . Paleomagnetic study
Only the flows and not the intrusions have been studied so far.
II-I. Study of the Natural Remanent Magnetization (NRM)
One specimen per flow was analysed systematically at room temperature. Four
parameters were measured: the low-field susceptibility value, the declination and
the inclination values. All thenumerical tables are reported in Appendix S.
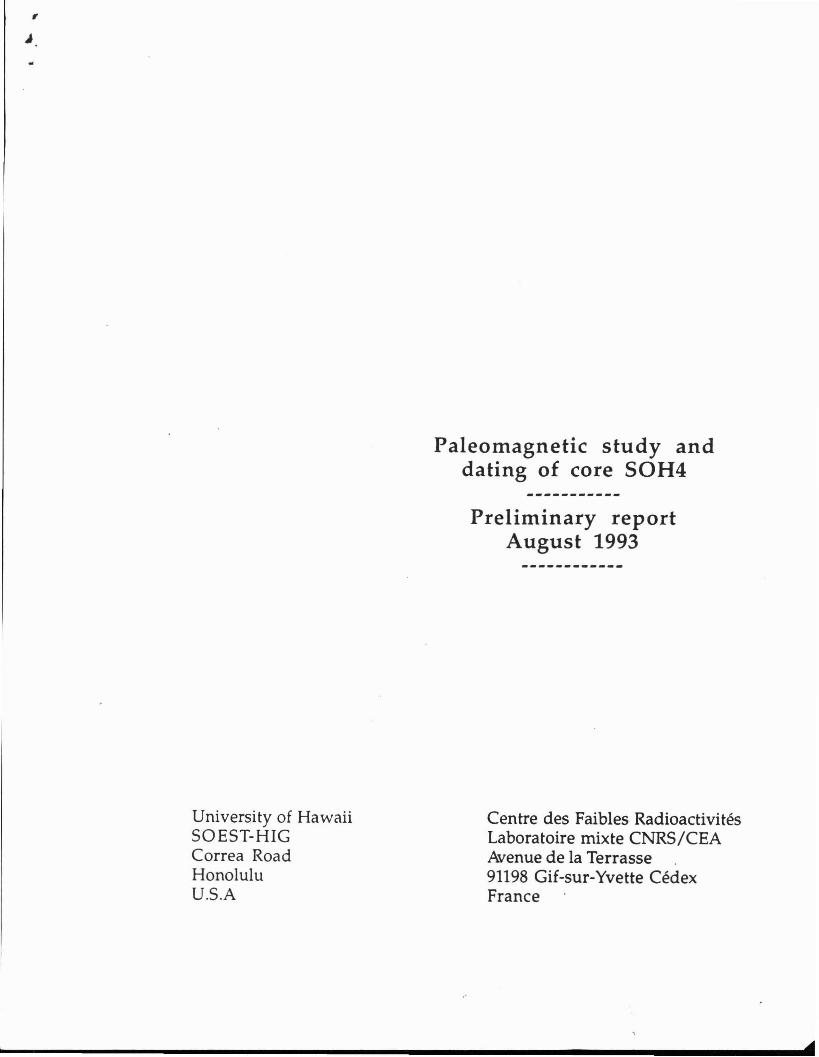
a) The low field susceptibility values has been normalized by the mass of the
samples so that the values are independant of the proportion of vesicules in the
rock. This parameter is highly variable along the core (Figure 1A). It ranges from 4.
10-5 51/ g to almost 300. 10-5 51/g. In order to have a better look of the majority of
the data that range between 4 and 100. 10-551/g, we have expanded this part of the
dia gram in Figure 1B. A value of 20. 10-551/g can be considered as the mean value
for the sampled length of the core.
b) The declination values have no meaning because the different segments are
) .
Low-field susceptibility valuesnormalized by the mass
Susc(20°C)/Mass00-5511g)
50 100oo-+--_--'-_--I---'--_---J
Sus c(20°C) I Mass0 0-5 SI/g)
o 100 200 300o+--.J._-'-----''----'-_.L..---J
......
y
...
...
...
...... ... ...
...............y
y~y'"y ,
y r
500
2000
1500
y
y y
500
1500
1000
2000
®Figure 1
J.
not oriented (Figure 2).
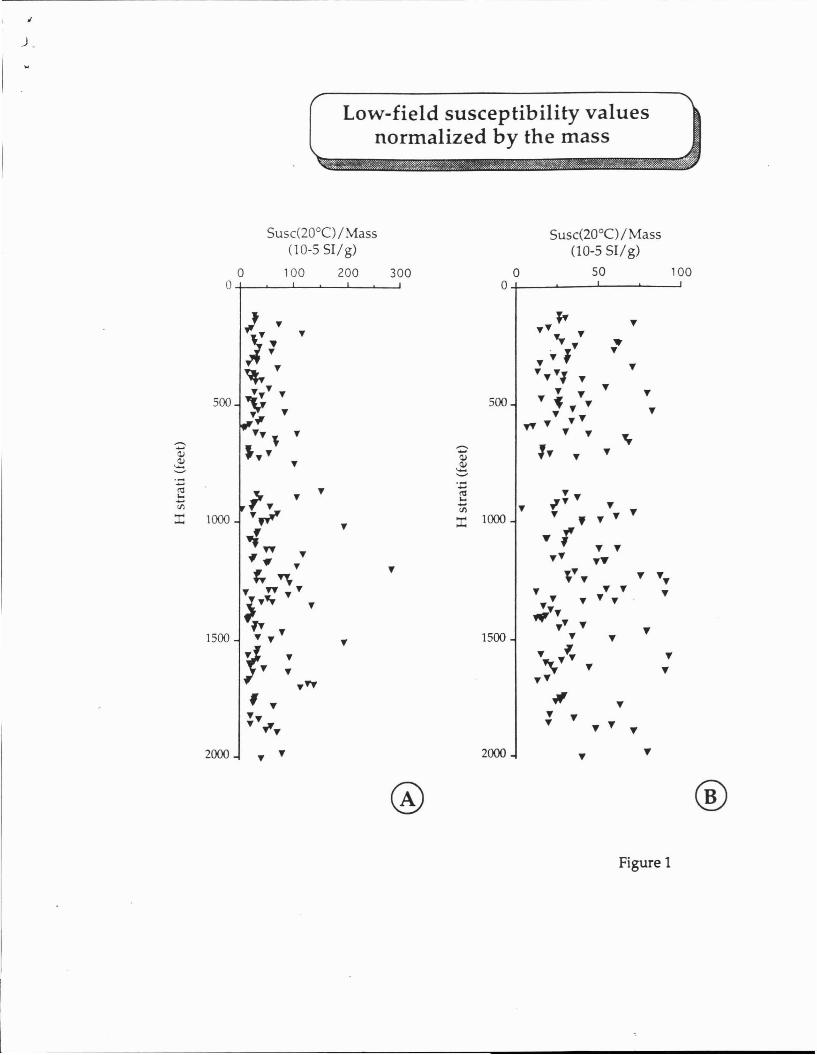
c) The inclina tion values are mainly positive (Figure 2). The top part of the
core (down to abo ut 900 feet) is consis ten t with the pr esent da y field inclina tion
value in Hawaii (about 36°). Below, the values are shallower. There are some
sp ecific points tha t show negative values of the NRM inclination: specimens n019,
142, 145, 232, 238 and 239,330 and 331, 336, 354, 492 that correspond to flows n07, 52,
54,83,85, 115,117,123,176 respectively. The se ne gative inclination values can be
due to secondary overprint and they must be checked as all the other directions by
ste pwise demagnetization.
II - 2. Therm al demagnetiza tion
As a first an alysis, 33 samples were thermally demagnetized. We chose one
specimen every 6 flows in order to get a first idea of the total sampled length of the
core. Each spe cimen has been demagnetized using 12 steps between room
tempera ture and 570°e. The steps are the following:
20°C - 120°C - IS0°C - 240°C - 300°C - 350°C - 400°C - 450°C - 500°C - 530°C - 550°C
570°e.
At each step the suscep tibility value has been measured in order to monitor
eventual cha nges in the magnetic mineralogy during heating. The results
obtained from each specimens are illustrated by the diagrams given in Appendix 2:
- the or thogonal projections demagnetization diagrams (block dots: projection
onto the horizon tal plane; white dots : projection onto the vertical planes).
- the curve of decrease of the intensity during heating OIJo; black dots) with the
evolution of the susceptibility value (X/Xo white dots).
- the stereographic projection of the paleomagnetic directions during the
demagnetization. The concentric circles indicate the direction at room
temperature. The vectorial differences are also reported with their associated
number. Below the stereographic projection, the numerical table is reported.
(Etape = step; Res = resultant intensity in A/m; Dec and Inc = declination and
incl ination values, DO and 01 = declination and the inclination values of the
vectorial d ifferences; DRE% = percentage of intensity decrease with respect to the
previous step.)
In the great ma jority of the cases, the direction of the magnetization does not
change significantly from room temperature up to 570°C. The intensity decreases
very little between 20°C and about 300°C and at 570°C, only about 1% of the initial
intensity value is left. The direction of the Characteristic Remanent Magnetization

.J
NRM declination and inclination values from flows ofcore SOH4
(2.000 feet from the top of the core)
Inclination val ues (20°C) Declina tion val ues (20°C)
-40 -20 0 20 40 60 80 0 90 180 270 3600
00
0 0· 0
· 0
· cd° .. • .,· o '000 • • •0 o :~ • • •0 •0 ;;,lo • &0 • •0 • .....·· .'·0 ~ :· •· • •500 0
o:>~ ! 0 500 • •· • •00
~~!, •0 ..0
0 .J •" 0
<9"0 ! • ••· •-::::- · 0· 0
C.i · 0 -:::-C.i
0 0C.i • •0 o dbi •••::::. ~ •0 o :ff' '-'" •~
10000
0 0 .- HXX> • • ••!'tI 0 ..... ••0... 0 ~ d !'tI •Vl 0 ... •• •0
~ : Vl ••:r: 0
0 0 :r: • ,0
"I0 •0 • ••0 ••0·· •· ., •· •b 0
~ iJ 0 • ••0 .-
1500 1500 • •~ • •
•o ;e -. ••o~ : •o d - •0
0
2000 0 :0 zcoo • •0
Figure 2
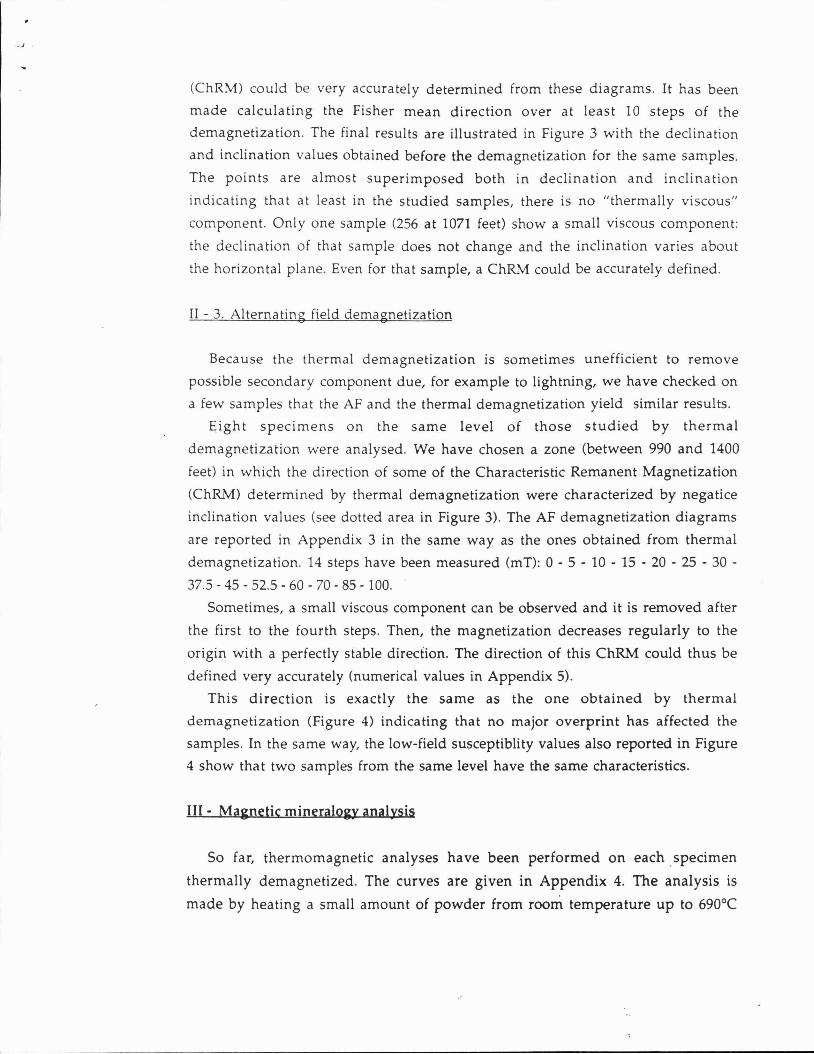
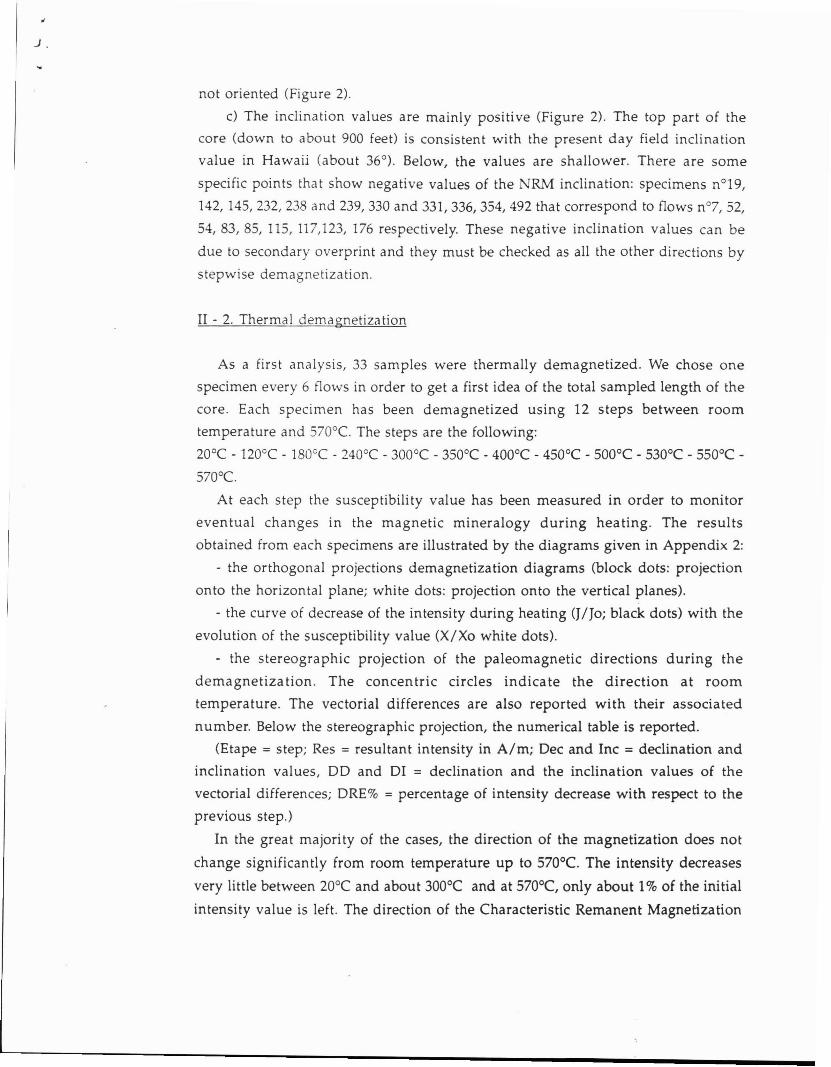
(ChRM) co uld be very accurately determined from these diagrams. It has been
made calculating the Fisher mean direction over at least 10 steps of the
demagnetization. The final results are illustrated in Figure 3 with the de clination
and inclination values obtained before the demagnetization for the same samples.
The points are almos t superim posed both in declination and incl ina tion
indica ting that at least in the studied samples, there is no "thermally viscous "
component. Onl y one sample (256 at 1071 feet) show a sma ll viscous component:
the declin at ion of that sample does not change and the incl ination varies about
the hori zontal plan e. Even for that sample, a ChRM could be accurately defined.
II - 3. Altern ating field demagnetization
Because the thermal demagnetization is sometimes unefficient to remove
possible secondary component due, for example to lightning, we have checked on
a few samples that the AF and the thermal demagnetization yield similar results.
Bight sp eci me ns on the same level of those studied by thermal
demagnetization were analysed . We have chosen a zone (between 990 and 1400
feet) in which the direction of some of the Characteristic Remanent Magnetization
(ChRM) determined by thermal demagnetization were characterized by negatice
incl ination values (see dotted area in Figure 3). The AF demagnetization diagrams
are reported in Appendix 3 in the same way as the ones obtained from thermal
demagnetization. 14 steps have been measured (mT): 0 - 5 - 10 - 15 - 20 - 25 - 30
37.5 - 45 - 52.5 - 60 - 70 - 85 - 100.
Sometimes, a small viscous component can be observed and it is removed after
the first to the fourth steps. Then, the magnetization decreases regularly to the
origin with a perfectly stable direction. The direction of this ChRM could thus be
defined very accurately (numerical values in Appendix 5).
This direction is exactly the same as the one obtained by thermal
demagnetization (Figure 4) indicating that no major overprint has affected the
samples. In the same way, the low-field susceptiblity values also reported in Figure
4 show that two samples from the same level have the same characteristics.
III - Magnetic mineralogy analysis
So far, thermomagnetic analyses have been performed on each .specimen
thermally demagnetized. The curves are given in Appendix 4. The analysis is
made by heating a small amount of powder from room temperature up to 690°C

PRELIMINARY RESULTS FROM CORE SOH4(about 1 sample every 6 flows)
Susc(20°C) I MassInclination values Declination values
0 0-5 S1/ g)
0 50 100 150 200 -40 -20 0 20 40 60 0 90 180 270 3600
~ tD~ en •~ •~ •
~ •~ •~
500 ~ •~ •~ a •........ ~ •CJ
• CJ~ •'-........
- DO •<':l....Vi::c a •
~ •HXXJ
1500
~
~
~
•~
~
2CXXJ
••• • ••c •c •
Figure 3
see Figure 4 o NRM Inclinationo ChRM Inclination
(after thermal demag.)
• NRM Declination• ChRM Declination
(after thermal demag.)

,--------- - - ---
• •COMPARISON OF THE ChRM DIRECTIONS
OBTAINED USING THERMAL AND AFDEMAGNETIZATIONS ON 8 SAMPLES FROM
CORE SOH4 (990 TO 1400 FEET)
360
Declinations
90 180 270
•
•
•
•
..••
•
•Declinations ChRMo Thermal demag.6 AFdemag.
40 020
Inclinations
-20 0t
D
0 ~
Il>
e-
lSI
eo
0>
t!
Inclinations ChRMo Thermal demag. -6 AFdemag.
5usc(20°C)/ Mass00-5 51/ g)
20 40 60 80 10040900 +O_-'--_'-----'-_-'------l
Figure 4
1100
....... ~ ~
~~::=-~
<':l...~
rJl
:r:1200
1000
1300
1400 ~

It •
(black dots) and to cool it down (w hite dots) using an horizontal Curie balan ce.
One measurement of the in tens ity is m ade every 5°C and the heating speed is 2SoC
per minute, in an Argon a tmosphe re to avoid possible oxydation of the samples.
Most of the . s tud ied sa mples sho w a perfectly re versible curve indicating th at
no new m ine ra l has been form ed during the heating process (Fig u re Sa).
Moreo ver, the final tem peratu re to w hich the m agnet ization is completely
removed is abou t 580°C. Th is is typi cal fo r low- Ti con ten t magnetite . Sometimes,
the coo ling curve does not reach the same poitn at room temperature ind ica ting
tha t even with Argon atmosphe re, a small part of the m a gne tites has been
oxy di zed in to hemat ite at high tem perature (Figure Sb)
Some cu rves a re cha racteriz ed by a change in the slope at abou t 300 - 450°C
sho w ing tha t a magne tic ph ase has been transformed (Figure Sc). The o n ly
remaining phase is magnetite as shown by the Curie temperature both at th e end
of the heating part and for the cooling par t.
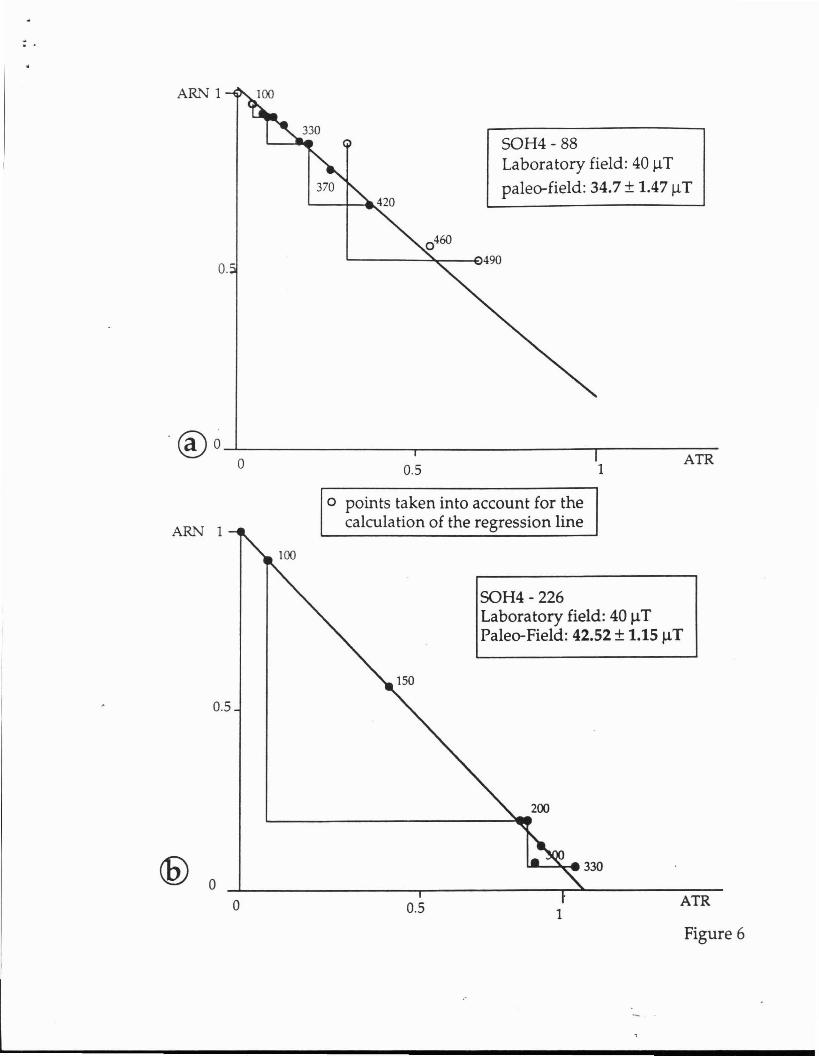
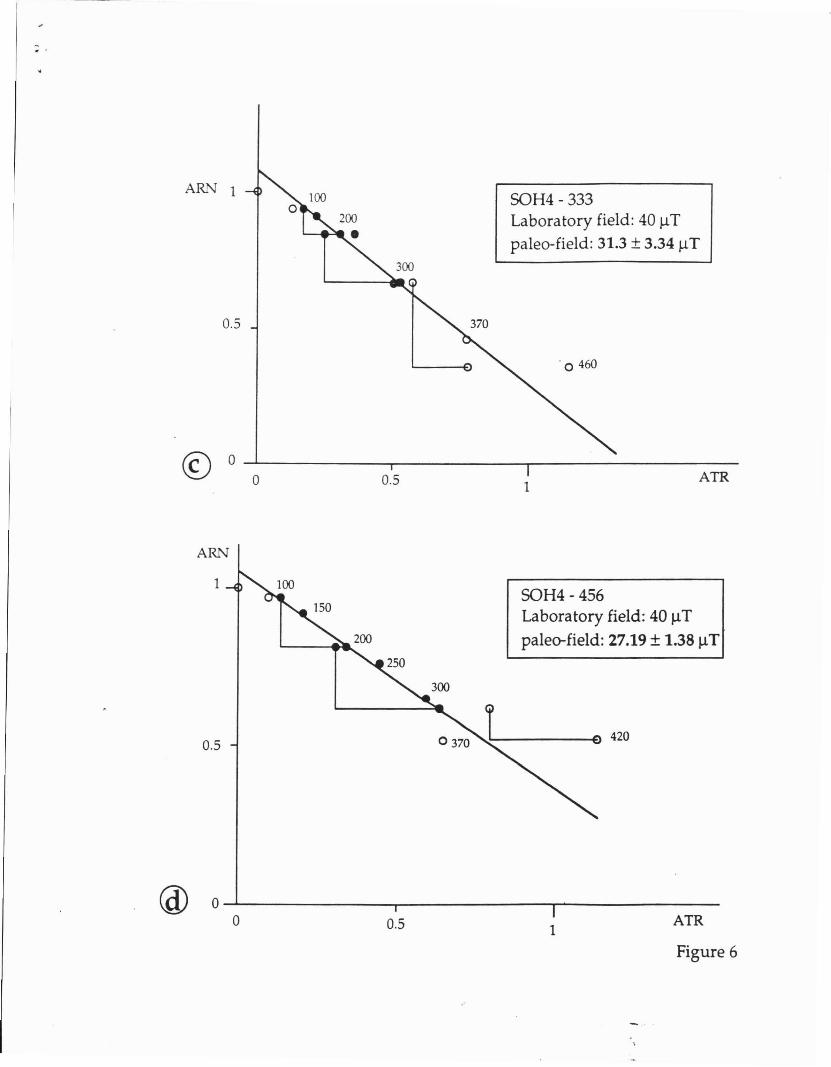
IV Paleointensity measurements
Because th e d e te rmi na tion of the geomagnetic paleointensities from lava
sam p les is a ve ry slow experiment, we have made th is determination on 4
sam ples so far. They have been selected a t different stratigraphic height. We have
used the Thell ier and Thellier method (1959) . The samples have been heated at
100 - 150 - 200 - 250 - 300 - 330 - 370 - 420 - 460°C with controls at 100°C after 200°C, at
200°C after 330°C and at 330°C after 420°C.
For three sa mples, about 50 to 70% of the ARN has been removed at 420-460 °C
(Figure 6a) . The fourth one (226 at 945 feet) show a much more rapid decrease of
the intensit y (Figu re 6d) . For all the samples, it has been possible to determine a
paleointensi ty val ue wi th a great accuracy. They are (Appendix 5):
sa mp les
88
226
333
456
strati. H (feet)
461
945
1352
1838
Paleointensity (JlT)
34.7 ± 1.47
42.5 ± 1.15
31.3 ± 3.3
27.2 ± 1.38
'-

r .
a
J/JO
0.5
o100 200 300
SOH.·381 prem iere chauNe400 500 600 700
T (0C)
b
J/JO
0 .5
c
100 200SOH.·268 premiere chauNt
J/JO
0 .5
o100 200
SOH.·282 prem i.rt chtuHt
300
300
400
400
500
500
100 700
T (OC)
100 700
T (OC)
Figure 5
ARL"J 1
o.s
SOH4 - 88Laboratory field: 40 I..ITpaleo-field: 34.7 ± 1.471lT
L....----~--E)490
ATR10.5
.® c.L, --.-- ---y- _
o
ATR1
..-...~.. 330
SOH4 - 226Laboratory field: 40 IlTPaleo-Field: 42.52 ±1.151lT
0.5
o points taken into account for thecalculation of the regression line
o
0.5
o
ARN 1
Figure 6
SOH4 - 333Laboratory field : 40 J.lTpaleo-field: 31.3 ± 3.34 J.lT
ARt'! 1
0.5
© a a
ARN
0.5 1
. 0 460
ATR
1
0.5
200
SOH4 - 456Laboratory field: 40 J.lT
paleo-field: 27.19 ± 1.38 J.lT
-------0 420
o 0.5 1ATR
Figure 6

FIRST RESULTS ONK/Ar DATING OF
SOH4 1550'7".
The sample of lava from SOH4 drill hole ( 1550'7" deep) have been dated according to the
technique developed at the CFR (CNRS-CEA) especially devoted to the detection of very low
radioge nic argon levels, generally applied to the dating of very young rocks. A reprint,
presenting the technique is joined to the present report.
1 . Analytical technique.
The main problems limiting the accurate dating of young volcanics is linked to:
-1) the increasing dilution of radiogenic argon in contaminating atmospheric
argon which needs the most accurate determination of a low radiogenic argon percentuale in the
total argon with increasing dilution rate within that contaminant argon component.
-2) the systematic error due to enclaves and possible inheritance from early
cristallisations and xenolits.
1.1 ')Error magnification with increasing contamination level.
In order to date accurately rocks of the recent period (0-200 Ka), we have developped a
particu lar technique for potassium-argon dating based on a double comparison between argon
extracted from the sample and atmospheric argon. This makes it possible to detect radiogenic
argon percentages down to 0.1 9'0. It corresponds typically to some thousand of years in a 1%
potassic lava and less than one thousand years in potassium rich minerals.
That accuracy has been cross-checked with other dating techniques (e.g.
thermolu minescence and radiocarbone ) and tested on zero age reference lavas. The above
mentioned precision depends on the total amount of argon present in the mineral essentially
contaminent atmospheric argon when processing very young rocks. That contamination depends
on the rock type. It increases drastically with the vesicular and glassy facies and rock types
resulting from intrusive and explosive activities. It depends also on the freshness of the material
and increases with alteration and deuieric evolution of the material.
2

The potassium is measured independently by flame photometry and/or atomic absorption
spectrophotometry. The latter analyt ical technique makes it possible to determine the K content
with a relative accuracy of 1'!o , within a range of K content of between 0.1 and 10%. The cross
checking of the two techniques - atomic absorption and flame photometry - permits to determine
precisely the K content and to identi fy possible matrix effect (flame photometry) and/or
interference effect linked to alkaline content (atomic absorption).
The whole technique is based on the selecti on of homogeneous mineral phases - allowing
the separate measurement of potassium and argon - significant of the event to be dated.
1.2) selectio n.of the mineral phases.
In order to date accurately the flowing or the deposits of a volcanic unit, the mineral phase
cooled and solidified at the surface, at atmosphe re during the volcanic event.must be selected.
The groundmass, made of microlits or glass, generally corresponds to.the phase solidified
during the emplacement. Moreover , it concentrates the potassium, which is an hygromagmaphile
element; in the microlitic groundmass it is distributed at the limit between the grains; the
selection of polycristalline microlitic groundmass grains offer the most homogeneous, potassium
rich phase for dating. In that purpose, the pheno- and xeno-crysts are eliminated which permits
to get rid of the possible inheritance of extraneous argon.from early cristallizations or litics from
the surroundings. This is obtained by means of combined grav imetric (heavy liquids, essentially
bromoform diluted in ethanol or diodomethane diluted in acetone) and magnetic separations.
When possible, a pure mineral phase (e.g.feldspars phenocrysts) is analyzed separately in
-order to check the con sistence between the pota ssium-argon ratios in two different mineral
phases with various K content, argon contamination level and cri stallisation cond itions.
1.3) Error estimate.
The age is calculated according to the formula :
'0t =4154 log (l + 142 .7" Ar*/K),
using the International Conventional Constants proposed by Steiger and Jager (1977) .
It can be simplified for very young rocks « 1 Ma) :
t =40Ar*/ 1.045 108 x K
Where 40Ar* is the amount of cc of radiogenic .+0 argon ,
and K the weight (g) of natural potassium
3

.. the radiogenic 40 argon is obtained by multiplying the total 40 argon by the radiogenic
percentage; the later is deduced from the comparison between atmospheric 40/36 isotopic ratio
(Ra) and sample argon 40/36 isotopic ratio (Re), according to the relation: T% = 100x(Re
Ra)/Re.
Our technique of measurement limits the errors to three terms :
- the error on K content estimated from standard replicate measurements to 1% in relative
(20") ;
- the error on the calibration of the total argon amount which corresponds to ± 0.5 % in
relative (2<J) deduced from replicate measurements of international reference material and
volumetrical calibration from a known amount of atmospheric argon;
- the relative error on the radiogenic 40 argon percentage deduced from the limit of
detectability when correcting for the atmospheric contamination; the limit of accuracy on 36Ar
measurement determines that absolute limit to ± 0.1 %, that is in relative e % =100 (0.1%ff%).
The error is calculating by making the quadratic sum of these three relative errors. When
dealing wi th very young rocks, the later error on radiogenic 40 Ar level is predominent and tends
to infinite close to zero. For increasing ages, its relative value decreases progressively and tends
to ± 1.12 % relative error on the age (20") for ages larger than some million years. All the errors
are quoted at 20" (95 % confidence level) .
4

,
•..
2 - Analyti cal results .
The results are reported in the following tables. They correspond to the mean value of at
least tworeplicate measurements independant for Potassium (0,1 to 0,3 g aliquotes) and the first
result for Argon (l to 3 g aliquotes) analysis.
Name
SOH41550'7"
Phase
Past
%K
0,500±0,005
% 40Ar* 40Ar* 101Oat.g-1 Age (Ka)+2cr
0,273 2,1909±O,802 42 ± 15
The following table gives theconditions of separtation of the measured phase.
Name
SOH4
1550'7"
Phase
past
Density
3,05-3 ,02
2)Concl usions
The mesured age is about 42 Ka with an estimate error of 15 Ka, which is quite important.
The facies of the dated sample was very vesicular and did include cumulative enclaves inherited
from early cristallisations. So i don't think that this age alone is significant and it has to be cross
cheked with other samples from the same and other drill-holes at close stratigraphical positions.
There is also an other problem with that sample. We have done a second measurement which
gave a negative age. That result is explain by the presence inside the gaz extracted from the rock
of an isotopic mass close to 36 which has not been eliminated during the purification of the gaz.
So the isotopic ratio 40Ar/36Ar of the sample has been under-estimated and did appear to be
lower than the isotopic ratio 40Ar/36Ar of the atmosphere.
So, as a first conclusion we can say that the most significative result of the measurement is
not the obtained age but the possibility to detect radiogenic argon in young tholeiitic basalts.
For the next samples, i propose to choose more massive samples and as unaltered as
possible.
5