Embed Size (px)
Citation preview
Tectonophysics, 17 (1973) 41-59 0 Elsevier Scientific Publishing Company, Amsterdam - Printed in The Netherlands
NEWER PALEOMAGNETIC RESULTS OF THE DECCAN TRAPS, INDIA
H. WENSINK
Geological Institute, Utrecht (The Netherlands)
(Accepted for publication August 2, 1972)
ABSTRACT
Wensink, H., 1973. Newer paleomagnetic results of the Deccan traps, India. Tectonophysics, 17: 41-59.
The paleomagnetic results are presented from a number of sections of the Deccan traps, distributed all over the area. All samples were subjected to partial progressive demagnetization with alternating magnetic fields and were measured with astatic magnetometers. From c. 14% of the collected material no characteristic directions of magnetization could be obtained. In the ultimate analyses the material of 84 individual flows with a total number of 470 samples is included. The virtual magnetic pole posi- tion computed by combining the virtual pole positions of the sections is located at 34.8” N, 80.3” W with Agg = 7.2”. Combined with the results of earlier obtained paleomagnetic data a preliminary pa- leomagnetic stratigraphy has been set up, where a subdivision into four paleomagnetic epochs has been proposed. The paleomagnetic results of the Deccan traps suggest that there was a fairly rapid drift of several tens of cm/year of the subcontinent during the period of extrusions; this seems to be compati- ble with the interpretation of the magnetic anomalies in the Indian Ocean, where a rapid N-S spread- ing took place from anomaly 30 through anomaly 21.
INTRODUCTION
In the Indian Deccan traps oriented samples were collected from successive lava flows
in a number of sections for paleomagnetic research. The results obtained from the materi-
al of five large sections in the Western Chats, south of Poona, were published earlier
(Wensink and Klootwijk, 1971). In this paper the results will be presented from three
other sections in the southern part of the Western Ghats, as well as from a number of
other sections, distributed all over the Deccan area (Fig.1).
Earlier paleomagnetic research on the Deccan lavas was carried out by Clegg et al.
(1956), by Deutsch et al. (1959) and by Sahasrabudhe (1963). Studies of the paleomag-
netism of the basalts have recently been published by members of the Hyderabad research
group (Athavale, 1970; Athavale and Verma, 1970; Pal et al., 1971).
GEOLOGY AND AGES OF THE DECCAN TRAPS
A nearly coherent area of c. 500,000 km2 taken up with basalts occupies a considerb
able part of the Indian peninsula. The volcanic region is called Deccan traps, after traps -
in order to indicate the terrace-like features, very typical for this region - of the “dakhan”,
42 H. WENSINK
24’
70’ 720 749 760 780 80’ I i...,.
24’
74’ 76’ 789 800
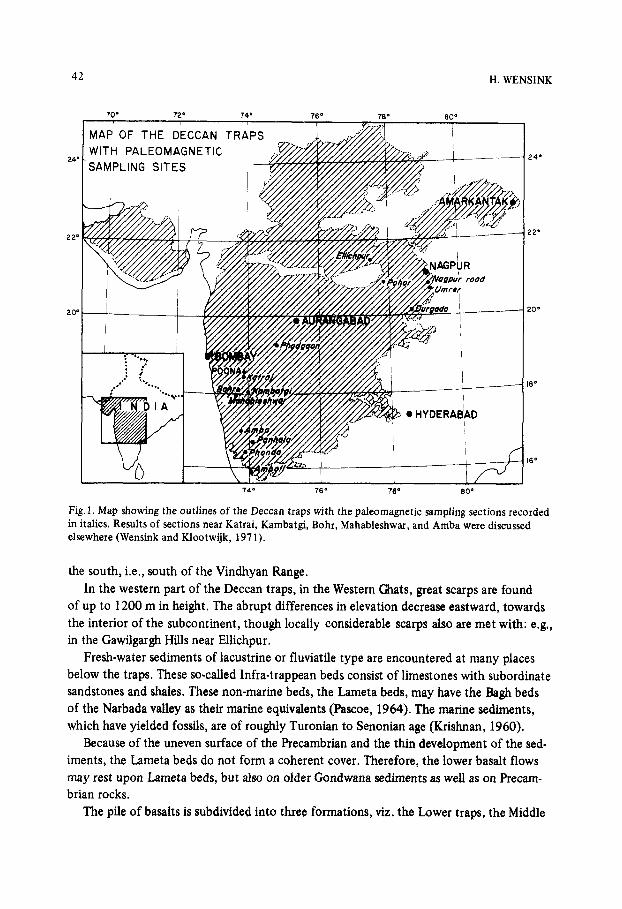
Fig.]. Map showing the outlines of the Deccan traps with the paleomagnetic sampling sections recorded in italics. Results of sections near Katrai, Kambatgi, Bohr, Mahableshwar, and Amba were discussed elsewhere (Wensink and Klootwijk, 1971).
the south, i.e., south of the Vindhyan Range. In the western part of the Deccan traps, in the Western Ghats, great scarps are found
of up to 1200 m in height. The abrupt differences in elevation decrease eastward, towards the interior of the subcontinent, though locally considerable scarps also are met with: e.g., in the Gawilgargh Hills near Ellichpur.
Fresh-water sediments of lacustrine or fluviatile type are encountered at many places below the traps. These so-called Infra-trappean beds consist of limestones with subordinate sandstones and shales. These non-marine beds, the Lameta beds, may have the Bagh beds of the Narbada valley as their marine equivalents (Pascoe, 1964). The marine sediments, which have yielded fossils, are of roughly Turonian to Senonian age (Krishnan, 1960).
Because of the uneven surface of the Precambrian and the thin development of the sed- iments, the Lameta beds do not form a coherent cover. Therefore, the lower basalt flows may rest upon Lameta beds, but also on older Gondwana sediments as well as on Precam- brian rocks.
The pile of basalts is subdivided into three formations, viz. the Lower traps, the Middle
NEWERPALEOMAGNETICRESULTSOFTHEDECCANTRAPS 43
traps, and the Upper traps with respective estimated thicknesses of 150 m, 1200 m, and 450 m (Pascoe, 1964). The Lower traps are believed to be confined to the eastern part,
whereas the Upper traps are restricted to the western part of the volcanic area. Non- marine sedimentary beds are intercalated in both the Lower and the Upper traps. The Lower Intertrappean beds, rarely exceeding 6 m in thickness, consist of fresh-water and ter- restrial sediments. Fossils do occur, which indicate a probable Early Tertiary age for these beds. The Upper Intertrappean beds, also of non-marine origin, which are much thicker, are mainly confined to the area around Bombay.
The Deccan basalts, which have a fairly uniform tholeiitic composition, are dark green to black volcanic rocks with a wide variety in textural character. Beds of volcanic ashes do occur, but mainly in the upper part of the sequence. Successive flows are very often sep- arated by red partings which may be old lateritic soils. These soils indicate that there have been significant time intervals between successive outpourings of lava.
One of the most impressive features of the Deccan traps is the consistent horizontality of the lava flows. The basalts near Bombay dipping up to 15” west form one of the very few exceptions to this rule. The Bombay basalts are separated from the main pile of flows by a gigantic N-S trending fault, which follows the great scarp of the Western Ghats.
In the interior there are a number of post-trappean E-W trending faults: e.g., the Ellichpur fault, situated at the southern foot of the Gawilgargh Hills, which has a down-
throw to the south. A more exact thickness of the total sequence of basalts than given above, cannot be
presented. In the Western Ghats near Mahableshwar, where one observes a vertical section of nearly 1400 m, the underlying rocks have not been reached. The estimated total thick- ness of 1800 m is considered to be the minimum value.
Radiometric age determinations of Deccan rocks were carried out by Rama (1964). He found ages of 65-60 m.y. and 45-42 m.y., which, in his opinion, may be indicative of two main phases of volcanic.activity. Newer dating results (Wellman and McElhinny, 1970) do not support this conclusion. According to these authors, the younger ages obtained by Rama are due to a loss of argon. The newly measured ages of samples from four critical localities in the Deccan area range from 64-59 m.y. Unfortunately, the values obtained do not support the general view that the lavas in the eastern part belong to the older phases of extrusions.
The Rajmahal traps, another plateau basalt area in India, situated in Bihar State some 200 km NNW of Calcutta, have an age of 100-105 m.y. (MC Dougall and McElhinny, 1970).
From the results of a paleomagnetic study on basaltic dykes of the Damodar valley Athavale and Verma (1970) concluded that there has been a continuous igneous activity
since the Rajmahal volcanic phase through the hypabyssal phase of the Damodar dykes to the Deccan effusions. However, the reliability of the paleomagnetic data is not beyond
doubt. The samples have been magnetically “cleaned” in a.c. fields up to only 200 Ge Peak value; at this value the specimens became very weak in intensity. We know by expe_
rknce from SUpkS of our Deccan collection as well as from those of the Sonhat s~ near
44 H. WENSINK
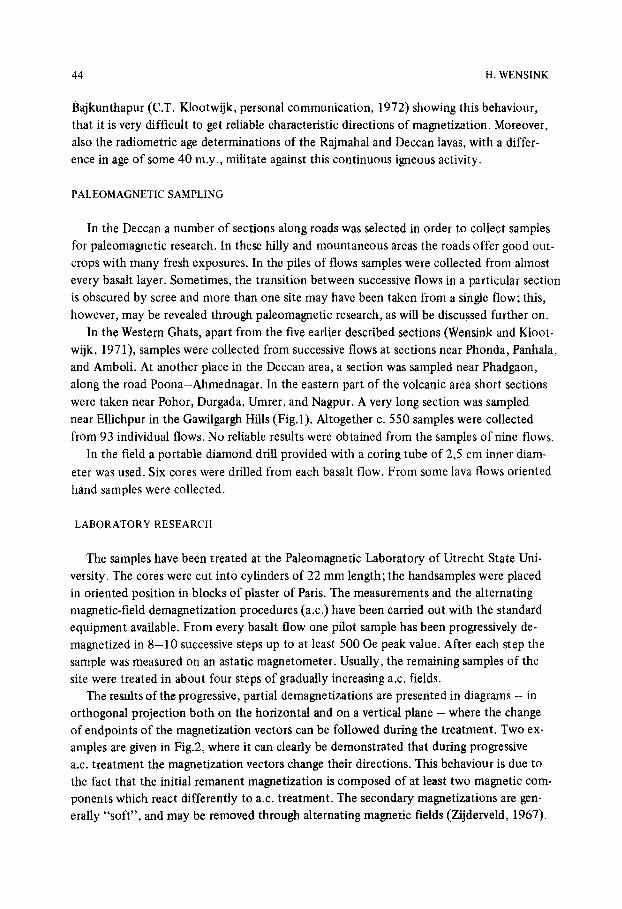
Bajkunthapur (C.T. Klootwijk, personal communication, 1972) showing this behaviour,
that it is very difficult to get reliable characteristic directions of magnetization. Moreover,
also the radiometric age determinations of the Rajmahal and Deccan lavas, with a differ-
ence in age of some 40 m.y., militate against this continuous igneous activity.
PALEOMAGNETIC SAMPLING
In the Deccan a number of sections along roads was selected in order to collect samples
for paleomagnetic research. In these hilly and mountaneous areas the roads offer good out-
crops with many fresh exposures. In the piles of flows samples were collected from almost
every basalt layer. Sometimes, the transition between successive flows in a particular section
is obscured by scree and more than one site may have been taken from a single flow; this,
however, may be revealed through paleomagnetic research, as will be discussed further on.
In the Western Chats, apart from the five earlier described sections (Wensink and Kloot-
wijk, 1971) samples were collected from successive flows at sections near Phonda, Panhala,
and Amboli. At another place in the Deccan area, a section was sampled near Phadgaon,
along the road Poona-Ahmednagar. In the eastern part of the volcanic area short sections
were taken near Pohor, Durgada, Umrer, and Nagpur. A very long section was sampled
near Ellichpur in the Gawilgargh Hills (Fig.1). Altogether c. 550 samples were collected
from 93 individual flows. No reliable results were obtained from the samples of nine flows.
In the field a portable diamond drill provided with a coring tube of 25 cm inner diam-
eter was used. Six cores were drilled from each basalt flow. From some lava flows oriented
hand samples were collected.
LABORATORY RESEARCH
The samples have been treated at the Paleomagnetic Laboratory of Utrecht State Uni-
versity. The cores were cut into cylinders of 22 mm length; the handsamples were placed
in oriented position in blocks of plaster of Paris. The measurements and the alternating
magnetic-field demagnetization procedures (a.c.) have been carried out with the standard
equipment available. From every basalt flow one pilot sample has been progressively de-
magnetized in 8-l 0 successive steps up to at least 500 Oe peak value. After each step the
sample was measured on an astatic magnetometer. Usually, the remaining samples of the
site were treated in about four steps of gradually increasing a.c. fields.
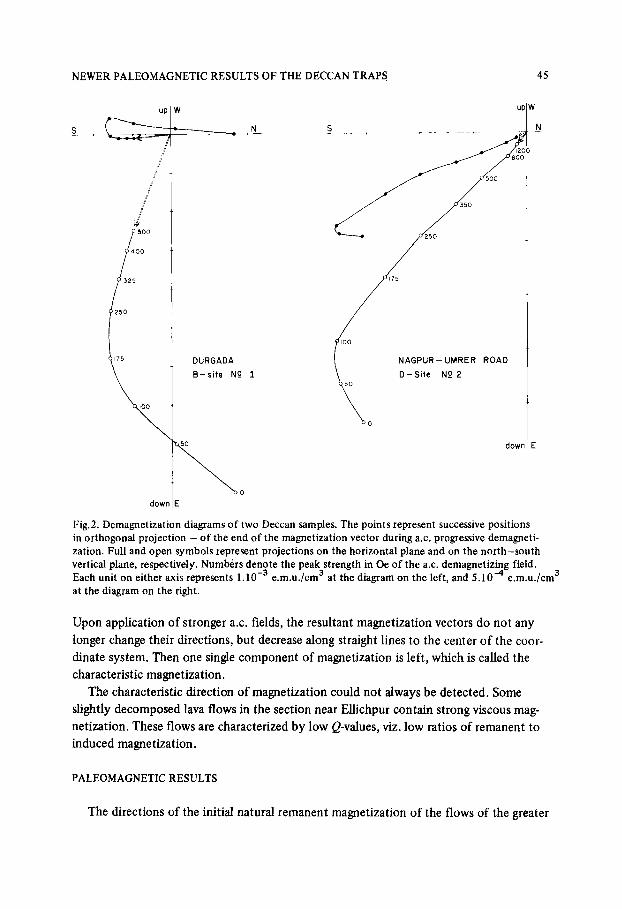
The results of the progressive, partial demagnetizations are presented in diagrams - in
orthogonal projection both on the horizontal and on a vertical plane - where the change
of endpoints of the magnetization vectors can be followed during the treatment. Two ex-
amples are given in Fig.%, where it can clearly be demonstrated that during progressive
a.c. treatment the magnetization vectors change their directions. This behaviour is due to
the fact that the initial remanent magnetization is composed of at least two magnetic com-
ponents which react differently to a.c. treatment. The secondary magnetizations are gen-
erally “soft”, and may be removed through alternating magnetic fields (Zijderveld, 1967).
NEWER PALEOMAGNETIC RESULTS OF THE DECCAN TRAPS
I
t
DURGADA
B-site NP 1
E
1 NAGPUR - UMRER ROAD
D-Site N? 2
down 1 E
Fig.2. Demagnetization diagrams of two Deccan samples. The points represent successive positions - in orthogonal projection - of the end of the magnetization vector during a.c. progressive demagneti- zation. Full and open symbols represent projections on the horizontal plane and on the north-south vertical plane, respectively. Numbers denote the peak strength in Oe of the a.c. demagnetizing field. Each unit on either axis represents 1.10e3 e.m.u./cm3 at the diagram on the left, and 5.104 e.m.u./cm3 at the diagram on the right.
Upon application of stronger a.c. fields, the resultant magnetization vectors do not any
longer change their directions, but decrease along straight lines to the center of the coor-
dinate system. Then one single component of magnetization is left, which is called the
characteristic magnetization.
The characteristic direction of magnetization could not always be detected. Some
slightly decomposed lava flows in the section near Ellichpur contain strong viscous mag-
netization. These flows are characterized by low Q-values, viz. low ratios of remanent to
induced magnetization.
PALEOMAGNETIC RESULTS
The directions of the initial natural remanent magnetization of the flows of the greater
46 11. WENSINK
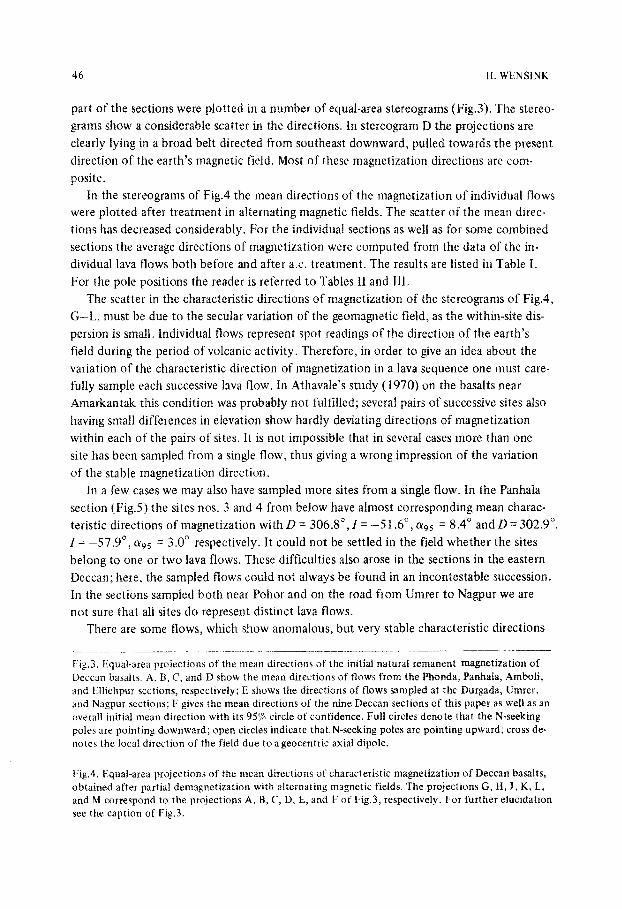
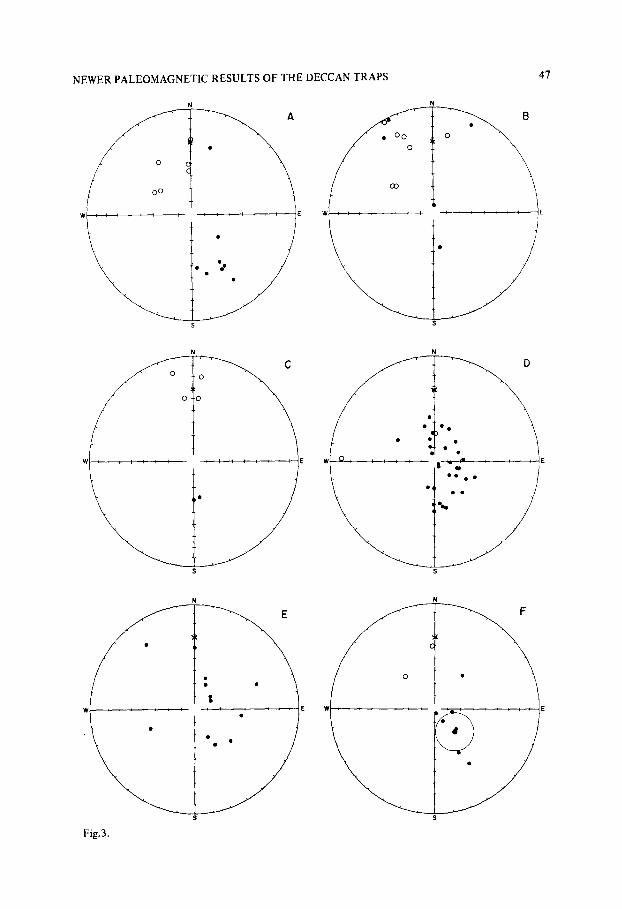
part of the sections were plotted in a number of equal-area stereograms (Fig.3). The stereo-
grams show a considerable scatter in the directions. In stereogram D the projections are
clearly lying in a broad belt directed from southeast downward, pulled towards the present
direction of the earth’s magnetic field. Most of these magnetization directions are com-
posite.
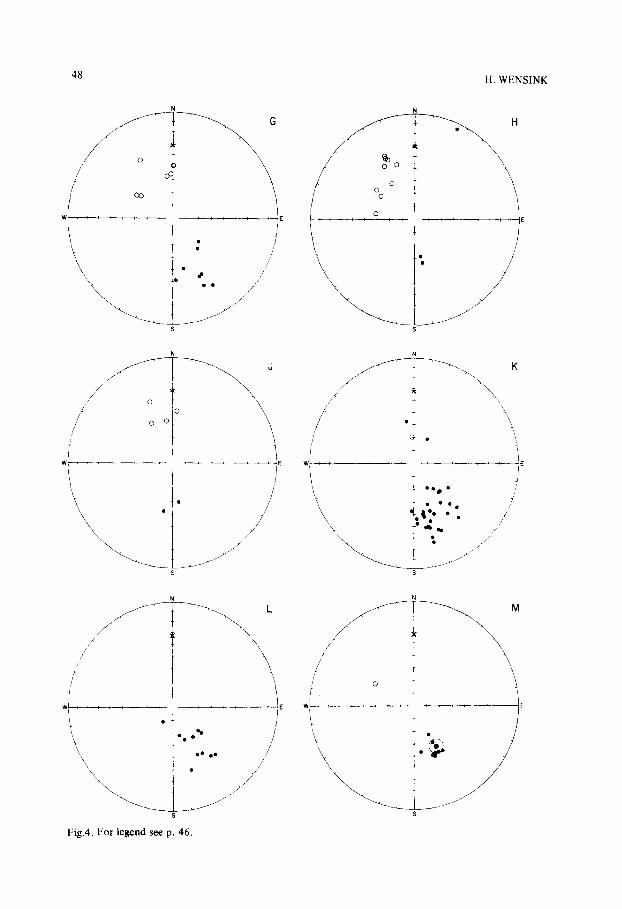
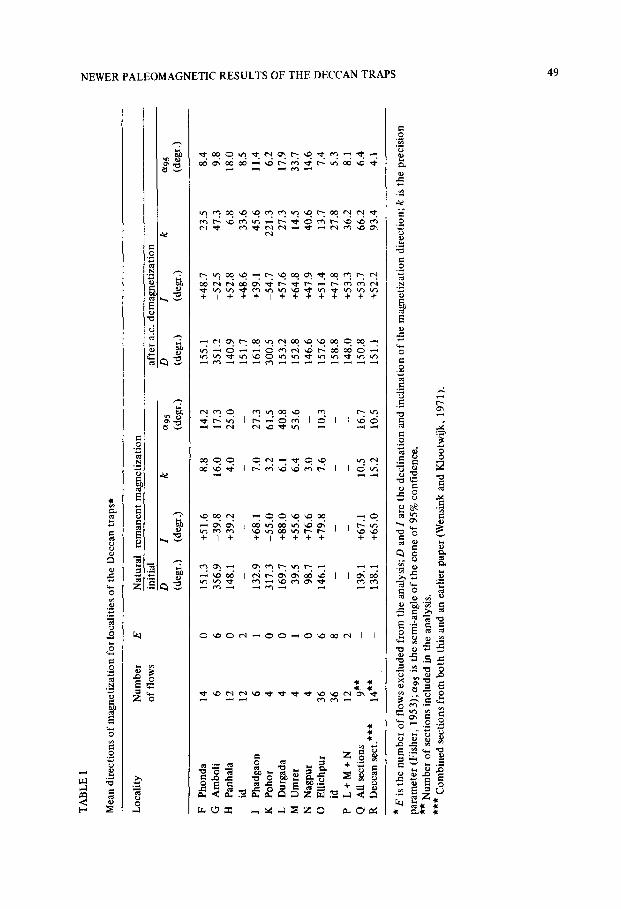
In the stereograms of Fig.4 the mean directions of the magnetization of individual flows
were plotted after treatment in alternating magnetic fields. The scatter of the mean direc-
tions has decreased considerably. For the individual sections as well as for some combined
sections the average directions of magnetization were computed from the data of the in-
dividual lava flows both before and after ax. treatment. The results are listed in Table I.
For the pole positions the reader is referred to Tables II and III.
The scatter in the characteristic directions of magnetization of the stereograms of Fig.4,
G-L, must be due to the secular v~iation of the geoma~etic field, as the within-site dis-
persion is small. Individual flows represent spot readings of the direction of the earth’s
field during the period of volcanic activity. Therefore, in order to give an idea about the
variation of the characteristic direction of magnetization in a lava sequence one must care-
fully sample each successive lava flow. In Athavale’s study (1970) on the basalts near
Amarkant~ this condition was probably not ful~lled; several pairs of successive sites also
having small differences in elevation show hardly deviating directions of ma~etization
within each of the pairs of sites. It is not impossible that in several cases more than one
site has been sampled from a single flow, thus giving a wrong impression of the variation
of the stable magnetization direction.
In a few cases we may also have sampled more sites from a single flow. In the Panhala
section (Fig.5) the sites nos. 3 and 4 from below have almost corresponding mean charac-
teristic directions of magnetization with D = 306.8”, 1 = -5 1.6”, 01~5 = 8.4” and D= 302.9”,
I = -57.9’, cxg5 = 3.0” respectively. It could not be settled in the field whether the sites
belong to one or two lava flows. These difficulties also arose in the sections in the eastern
Deccan; here. the sampled flows coufd not always be found in an incontestable succession.
In the sections sampled both near Pohor and on the road from Umrer to Nagpur we are
not sure that all sites do represent distinct lava flows.
There are some flows, which show anomalous, but very stable characteristic directions
Fig.3. Equal-area projections of the mean directions of the initial natural remanent magnetization of
Deccan basaits. A, B, C, and D show the mean directions of flows from the Phonda, Panhala, Amboli,
and Ellichpur sections, respectively; E shows the directions of flows sampled at the Durgada, Umrer,
and Nagpur sections; F gives the mean directions of the nine Deccan sections of this paper as well as an
overall initial mean direction with its 95% circle of confidence. Full circles denote that the N-seeking
poles are pointing downward; open circles indicate that N-seeking poles are pointing upward; cross de-
notes the local direction of the field due to ageocentric axial dipole.
Fig.4. Equal-area projections of the mean directions of ~~ra~t~risti~ magne~~zatjon of Deccan basal&
obtained after partial demagnetization with alternating magnetic fields. The projections G, H, 3, K, L, and M correspond to the projections A, B, C, D, E, and I- of Fig.3, respectively. For further elucidation
see the caption of Fig.3.
NEWER PALEOMAGNETIC RESULTS OF THE DECCAN TRAPS
N
it
d : : E
--.
s
N
w-::: : : : : I : E
s
N
/ .i \
Fig.3.
48 H. WENSINK
N
J i’ /
/ 0 / 0
0 0
i
Fig.4. For legend see p. 46
TA
BL
E I
Mea
n di
rect
ions
of
mag
netiz
atio
n fo
r lo
calit
ies
of t
he
Dec
can
trap
s*
Loc
ality
N
umbe
r E
of
flo
ws
Nat
ural
re
man
ent
mag
netiz
atio
n in
itial
af
ter
a.c.
dem
agne
tizat
ion
D
I k
‘y95
D
I
k “9
5
(deg
r.)
(deg
r.)
(deg
r .)
(deg
r.)
(deg
r .)
(dw
.I
F Ph
onda
14
G
A
mbo
li 6
H
Panh
ala
12
id
12
J Ph
adga
on
6 K
Po
hor
4 L
D
urga
da
4 M
U
mre
r 4
N
Nag
pur
4 0
Elli
chpu
r 36
id
36
P
L+
M+
N
12
Q
AU
sec
tions
9*
* R
D
ecca
n se
ct.*
**
14**
0 6 0 2 1 0 0 1 0 6 8 2 _ _
151.
3 +
51.6
35
6.9
-39.
8 14
8.1
+39
.2
_ -
132.
9 +
68.1
31
7.3
-55.
0 16
9.7
+88
.0
39.5
+
55.6
98
.7
+76
.6
146.
1 +
79.8
_
- -
_
139.
1 +
67.1
13
8.1
+65
.0
8.8
14.2
16
.0
17.3
4.
0 25
.0
- -
7.0
27.3
3.
2 61
.5
6.1
40.8
6.
4 53
.6
3.0
- 7.
6 10
.3
_ _
- -
10.5
16
.7
15.2
10
.5
155.
1 +
48.7
23
.5
8.4
351.
2 -5
2.5
47.3
9.
8 14
0.9
+52
.8
6.8
18.0
15
1.7
+48
.6
33.6
8.
5 16
1.8
+39
.1
45.6
11
.4
300.
5 -5
4.7
221.
3 6.
2 15
3.2
+57
.6
27.3
17
.9
152.
8 +
64.8
14
.5
33.7
14
6.6
+47
.9
40.6
14
.6
157.
6 +
51.4
13
.7
7.4
158.
8 +
47.8
27
.8
5.3
148.
0 +
53.3
36
.2
8.1
150.
8 +
53.7
66
.2
6.4
151.
1 +
52.2
93
.4
4.1
*E
is t
he n
umbe
r of
flo
ws
excl
uded
fr
om
the
anal
ysis
; D
and
I a
re t
he d
eclin
atio
n an
d in
clin
atio
n of
the
mag
netiz
atio
n di
rect
ion;
k
is t
he p
reci
sion
pa
ram
eter
(F
ishe
r,
1953
); (
~9s
is t
he s
emi-
angl
e of
the
con
e of
95%
con
fide
nce.
**
Num
ber
of s
ectio
ns
incl
uded
in
the
ana
lysi
s.
***
Com
bine
d se
ctio
ns
from
bot
h th
is a
nd a
n ea
rlie
r pa
per
(Wen
sink
and
Klo
otw
ijk,
1971
).
50 H. WENSINK
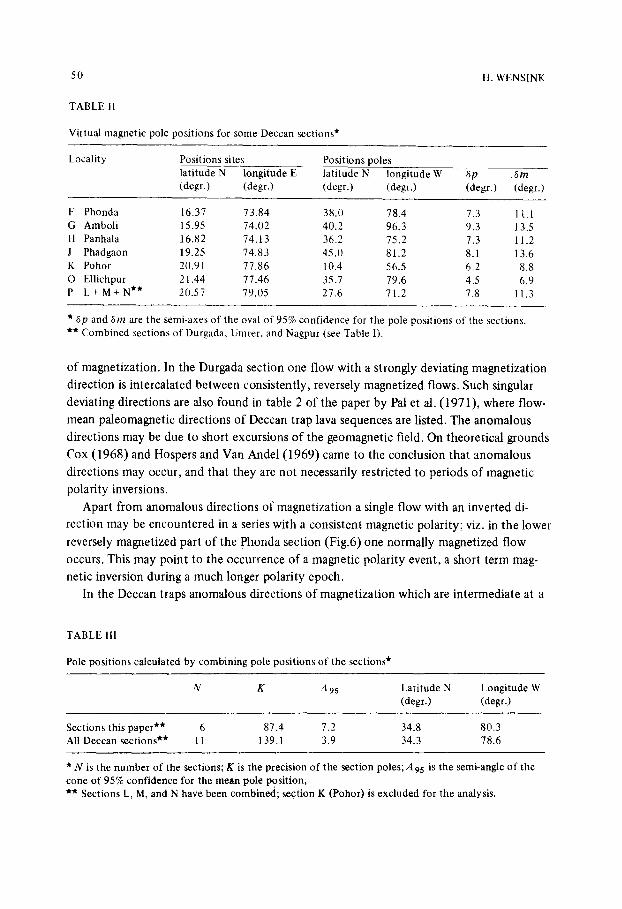
TABLE II
Virtual magnetic pole positions for some Deccan sections*
Locality Positions sites Positions poles
latitude N longitude E latitude N longitude W 6p .6rn -
(degr.) tdegr.) (degr.) (degr.) (degr.) (degr.)
F Phonda 16.37 73.84 38.0 78.4 1.3 11.1
G Amboli 15.95 14.02 40.2 96.3 9.3 13.5
H Panhala 16.82 74.13 36.2 75.2 7.3 11.2
J Phadgaon 19.25 74.83 45.0 81.2 8.1 13.6
K Pohor 20.9 1 77.86 10.4 56.5 6.2 8.8
0 Ellichpur 21.44 17.46 35.1 79.6 4.5 6.9
P L+M+N** 20.57 79.05 27.6 71.2 7.8 11.3
* 6p and Sm are the semi-axes of the oval of 95% confidence for the pole positions of the sections.
** Combined sections of Durgada, Umrer, and Nagpur (see Table I).
of magnetization. In the Durgada section one flow with a strongly deviating magnetization
direction is intercalated between consistently, reversely magnetized flows. Such singular
deviating directions are also found in table 2 of the paper by Pal et al. (197 l), where flow-
mean paleomagnetic directions of Deccan trap lava sequences are listed. The anomalous
directions may be due to short excursions of the geomagnetic field. On theoretical grounds
Cox (1968) and Hospers and Van Andel(1969) came to the conclusion that anomalous
directions may occur, and that they are not necessarily restricted to periods of magnetic
polarity inversions.
Apart from anomalous directions of magnetization a single flow with an inverted di-
rection may be encountered in a series with a consistent magnetic polarity; viz. in the lower
reversely magnetized part of the Phonda section (Fig.6) one normally magnetized flow
occurs. This may point to the occurrence of a magnetic polarity event, a short term mag-
netic inversion during a much longer polarity epoch.
In the Deccan traps anomalous directions of magnetization which are intermediate at a
TABLE III
Pole positions calculated by combining pole positions of the sections*
N K ,495 Latitude N
(degr.)
Longitude W
(degr.)
Sections this paper** 87.4 7.2 34.8 80.3
All Deccan sections** 1: 139.1 3.9 34.3 78.6
*N is the number of the sections; K is the precision of the section poles; A,, is the semi-angle of the
cone of 95% confidence for the mean pole position, l * Sections L, M, and N have been combined; section K (Pohor) is excluded for the analysis.
NEWER PALEOMAGNETIC RESULTS OF THE DECCAN TRAPS 51
INCLINATION
-_ I I I
DkLINATION , , 1 L -900 -60° -300 00 +30* +60°
----___ -_
\ 1
8OOm
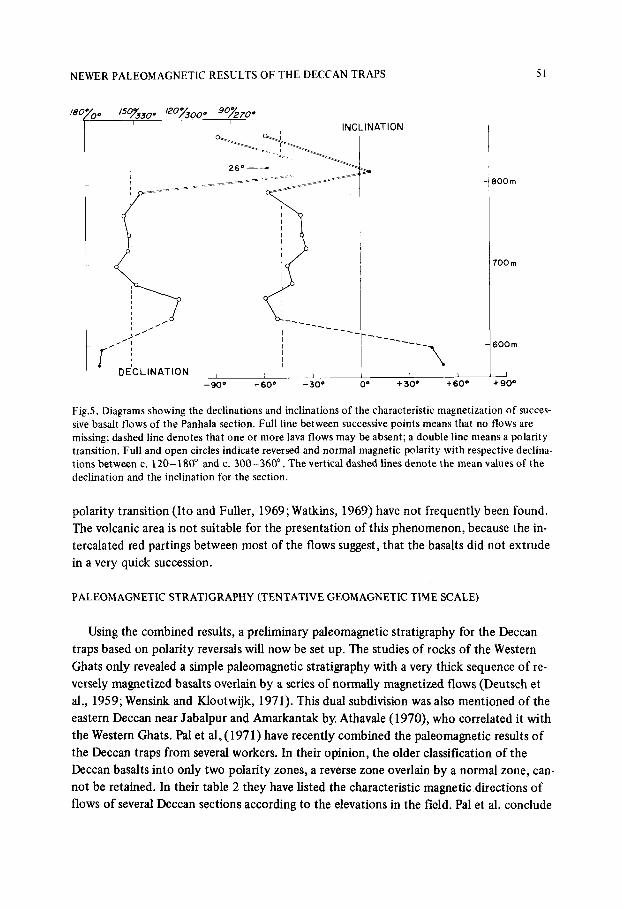
Fig.5. Diagrams showing the declinations and inclinations of the characteristic magnetization of succes- sive basalt flows of the Panhala section. Full line between successive points means that no flows are missing; dashed line denotes that one or more lava flows may be absent; a double line means a polarity transition. Full and open circles indicate reversed and normal magnetic polarity with respective declina- tions between c. 120-180” and c. 300-360”. The vertical dashed lines denote the mean values of the declination and the inclination for the section.
polarity transition (Ito and Fuller, 1969; Watkins, 1969) have not frequently been found.
The volcanic area is not suitable for the presentation of this phenomenon, because the in-
tercalated red partings between most of the flows suggest, that the basalts did not extrude
in a very quick succession.
PALEOMAGNETIC STRATIGRAPHY (TENTATIVE GEOMAGNETIC TIME SCALE)
Using the combined results, a preliminary paleomagnetic stratigraphy for the Deccan
traps based on polarity reversals will now be set up. The studies of rocks of the Western
Ghats only revealed a simple paleomagnetic stratigraphy with a very thick sequence of re-
versely magnetized basalts overlain by a series of normally magnetized flows (Deutsch et
al., 1959; Wensink and Klootwijk, 1971). This dual subdivision was also mentioned of the
eastern Deccan near Jabalpur and Amarkantak by Athavale (1970), who correlated it with
the Western Ghats. Pal et al, (1971) have recently combined the paleomagnetic results of
the Deccan traps from several workers. In their opinion, the older classification of the
Deccan basalts into only two polarity zones, a reverse zone overlain by a normal zone, can-
not be retained. In their table 2 they have listed the characteristic magnetic directions of
flows of several Deccan sections according to the elevations in the field. Pal et al. conclude
52 H. WENSINK
_& ~-1. -60°
i 200m
+Go”
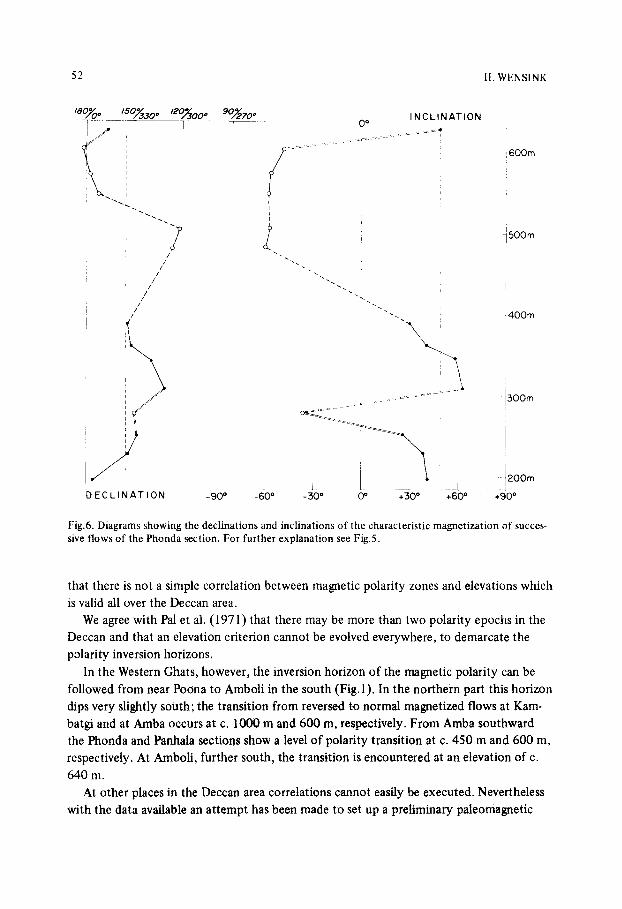
Fig.6. Diagrams showing the declinations and inclinations of the characteristic magnetization of succes- sive flows of the Phonda section. For further explanation see Fig.5.
that there is not a simple correlation between magnetic polarity zones and elevations which
is valid all over the Deccan area.
We agree with Pal et al. (1971) that there may be more than two polarity epochs in the
Deccan and that an elevation criterion cannot be evolved everywhere, to demarcate the
polarity inversion horizons.
In the Western Ghats, however, the inversion horizon of the magnetic polarity can be
followed from near Poona to Amboli in the south (Fig.1). In the northern part this horizon
dips very slightly south; the transition from reversed to normal magnetized flows at Kam-
batgi and at Amba occurs at c. 1000 m and 600 m, respectively. From Amba southward
the Phonda and Par&ala sections show a level of polarity transition at c. 450 m and 600 m,
respectively. At Amboli, further south, the transition is encountered at an elevation of c.
640 m.
At other places in the Deccan area correlations cannot easily be executed. Nevertheless
with the data available an attempt has been made to set up a preliminary paleomagnetic
NEWER PALEOMAGNETIC RESULTS OF THE DECCAN TRAPS 53
f x NIPANI
NORMAL T
EPOCH
___________-_.__-------------
I 3
1 2 j1 DECCAN
7 6 9
REVERSED
0
LA-& I
MAGNETIC
POLARITY
I
4 6
zoom EPOCH
1 ‘XxJm 5 _________--__-_-___ -------- ---_____
t Amboli 9 Phodgaon IO
P Phondo 10 Ellichpur
3 Panhalo I/ Pohor 1 iz
_____,,_ __--I_
: POHOR
NORMAL
_HQW___. 4 Ambo I.? Amarkantak
I NAGPUR 5 Mohobieshwar 13 Nagpur
6 Bohr !4 Umrer i4 REVERSED
7 Kombatgi 15 Durgodo I I3 EPOCH
B Katrai ~
I IS
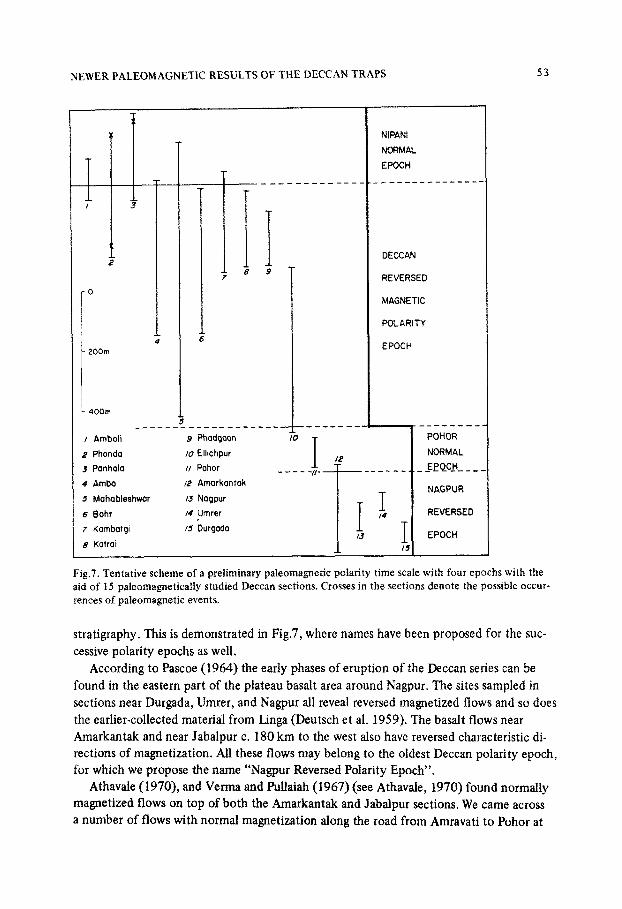
Fig.7. Tentative scheme of a preliminary paleomagnetic polarity time scale with four epochs with the aid of 15 paieoma~eticaIly studied Deccan sections. Crosses in the sections denote the possible occur- rences of paleomagnetic events.
stratigraphy. This is demonstrated in Fig.7, where names have been proposed for the suc- cessive polarity epochs as well.
According to Pascoe (1964) the early phases of eruption of the Deccan series can be found in the eastern part of the plateau basalt area around Nagpur. The sites sampled in sections near Durgada, Umrer, and Nagpur all reveal reversed magnetized flows and so does the earlier-collected material from Linga (Deutsch et al. 1959). The basalt flows near Amarkantak and near Jabalpur c. 180 km to the west also have reversed characteristic di- rections of magnetization. All these flows may belong to the oldest Deccan polarity epoch, for which we propose the name “Nagpur Reversed Polarity Epoch”.
Athavale (1970), and Verma and Puliaiah (1967) (see Athavale, 1970) found normally magnetized flows on top of both the Amarkantak and Jabalpur sections. We came across a number of flows with normal magnetization along the road from Amravati to Pohor at
&CLINATION INdLlNATlONi
- IOOOm
-- 600m
H. WENSINK
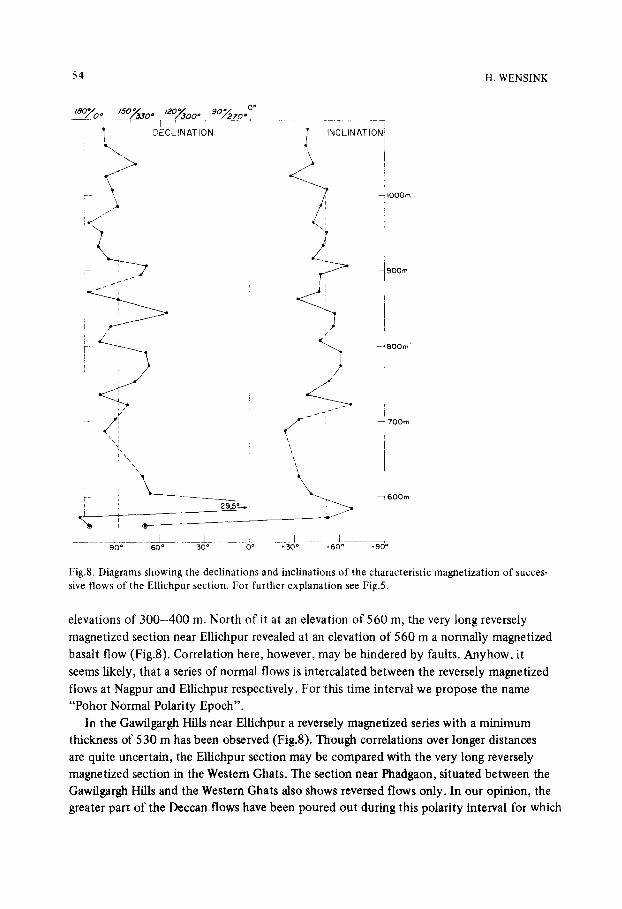
Fig.8. Diagrams showing the declinations and inclinations of the characteristic magnetization of succes.
sive flows of the Ellichpur section. For further explanation see Fig.5.
elevations of 300-400 m. North of it at an elevation of 560 m, the very long reversely
magnetized section near Ellichpur revealed at an elevation of 560 m a normally magnetized
basalt flow (Fig.8). Correlation here, however, may be hindered by faults. Anyhow, it
seems likely, that a series of normal flows is intercalated between the reversely magnetized
flows at Nagpur and Ellichpur respectively. For this time interval we propose the name
“Pohor Normal Polarity Epoch”.
In the Gawilgargh Hills near Ellichpur a reversely magnetized series with a minimum
thickness of 530 m has been observed (Fig.8). Though correlations over longer distances
are quite uncertain, the Ellichpur section may be compared with the very long reversely
magnetized section in the Western Ghats. The section near Phadgaon, situated between the
Gawilgargh Hills and the Western Ghats also shows reversed flows only. In our opinion, the
greater part of the Deccan flows have been poured out during this polarity interval for which
NEWJZRPALEOMAGNETICRESULTSOFTHEDECCANTRAPS 55
we propose the name “Deccan Reversed Polarity Epoch”.
In the Western Ghats a number of sections show top series with normally magnetized flows. In the southern part of the Western Ghats normal flows were aIso reported from Nipani, as well as three other localities by Deutsch et al. (1959). This interval we call the “Nipani Normal Polarity Epoch”.
During the discussion of the paleomagnetic results it has been pointed out that, within a paleomagnetic epoch, there are also short-term inversions of the geoma~etic field, the events, The example of one normal flow intercalated in an otherwise reversely ma~etized series in the Phonda section has been noted already (Fig.6). Most probably the reversely magnetized top flow in the Phonda section as well as the reversed flow in the Panhala sec- tion, also represent events.
In an earlier paper (Wensink and Klootwijk, 197 1) it was put forward that during the ~eccan volcanic activity the Indian subcontinent might have moved northward. The paleo* magnetic results of both the lower and the upper parts of equivalent stratigraphical units of the Western Ghats’ sections showed significant differences. On the other hand M&l- hinny (I 968) was of the opinion that fittle or no movement had taken place during this period, His arguments are based on an analysis of Sahasrabudhe’s material. Far stratigraph- ical studies Sahasrabudhe (I 963) collected c. 1000 samples at 7 1 sites from 30 lava flows and 13 dykes, spread all over the Deccan area. In his statistical analysis McElhinny com- bined the rock units on the basis of polarity irrespective of their location within the Dec- can traps area.
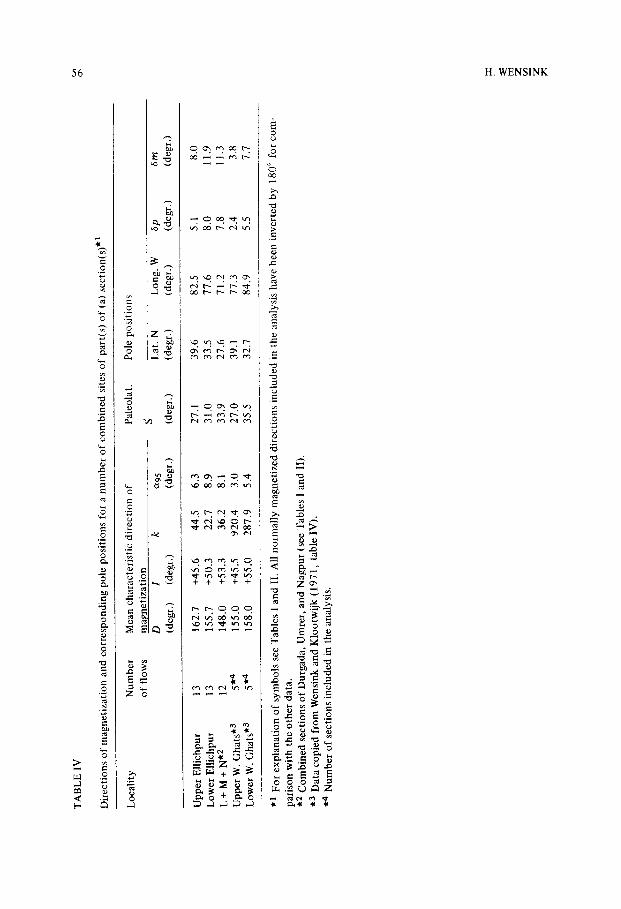
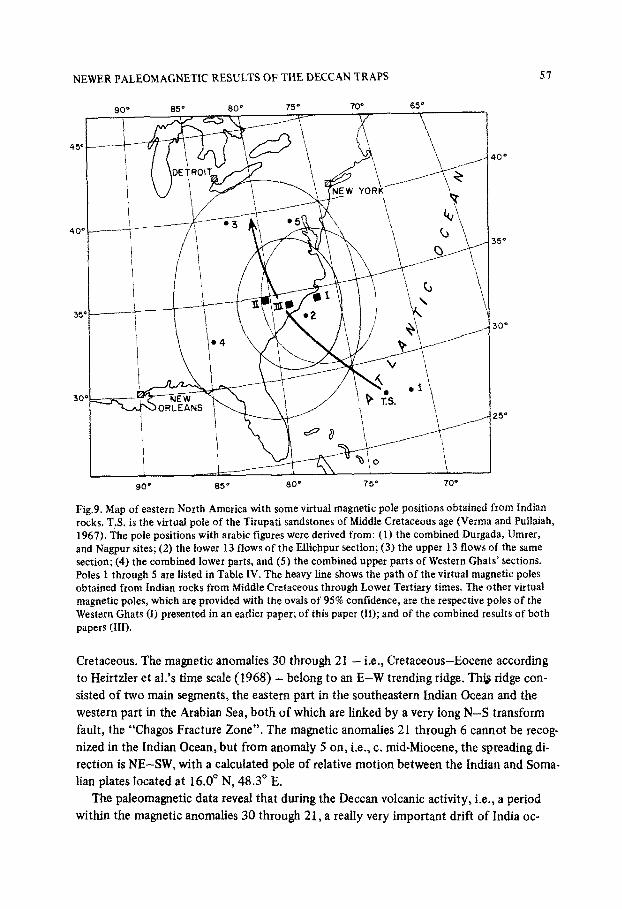
The sections presented in this paper are less suited to decide whether or not the Indian subcontinent has moved at the time of the extrusions than thase of the Western Chats. The Ellichpur section is the longest with 36 sampled flows. This section has been subdi- vided into both a lower and an upper unit of 13 flows each, with an intercalated free zone of c. 100 m in thickness. The virtual pole positions computed from the mean directions of magnetization (Table IV} of these units are given in Fig.9 (nos. 2 and 3). There is an indi- cation of a northward movement of the virtual poles during the period of extrusions, but their results are less reliable than those of the Western Ghats, because the Ellichpur units have quite large 95% ovals of confidence. In Table IV the combined paleomagnetic re- suits of the probably oldest Deccan flows of the sections near Durgada, Umrgr, and Nagpur are also given. Even though the number of flows included in the latter analysis is rather small, yet the virtual pole position (no. 1 in Fig.9) is compatible with the other results. The joint results imply a continuous northward movement of the subcontinent during the volcanic activity.
The floor of the Indian Ocean may definitely give informa~on on the drift af the Indian subcon~~ent. Fisher et al. (1971) studied the evolution of the Central Indian ridge by means of topographic, magnetic, and earthquake epicentre data. They found, that the In- dian MidwOceanic ridge had not been a zone of continuous sea-floor spreading since the
TA
BL
E
IV
Dir
ectio
ns
of
mag
netiz
atio
n an
d co
rres
pond
ing
pole
po
sitio
ns
for
a nu
mbe
r of
co
mbi
ned
site
s of
pa
rt(s
) of
(a
) se
ctio
n(s)
*’
Loc
ality
N
umbe
r M
ean
char
acte
rist
ic
dire
ctio
n of
Pa
leol
at
Pole
po
sitio
ns
of
flow
s m
agne
tizat
ion
D
I k
s 01
95
Lat
. N
L
ong.
W
6p
6m
(d
egr.
) (d
egr.
) (d
egr.
) (d
egr.
) (d
egr.
) (d
egr.
) (d
egr.
) (d
egr.
)
Upp
er
Elli
chpu
r 13
16
2.7
+45.
6 44
.5
6.3
27.1
39
.6
82.5
5.
1 8.
0 L
ower
E
llich
pur
13
155.
7 +5
0.3
22.7
8.
9 31
.0
33.5
77
.6
8.0
11.9
L
+M+N
*’
12
148.
0 +5
3.3
36.2
8.
1 33
.9
27.6
7
I .2
7.8
11.3
U
pper
W
. G
hats
*3
5*4
155.
0 +4
5.5
320.
4 3.
0 27
.0
39.1
77
.3
2.4
3.8
Low
er
W.
Gha
ts*j
5*
4 15
8.0
+55.
0 28
7.9
5.4
35.5
32
.7
84.9
5.
5 7.
7
l r
For
expl
anat
ion
of
sym
bols
se
e T
able
s I
and
II.
All
norm
ally
m
agne
tized
di
rect
ions
in
clud
ed
in t
he
anal
ysis
ha
ve
been
in
vert
ed
by
180”
fo
r co
rn.
pari
son
with
th
e ot
her
data
. l 2
Com
bine
d se
ctio
ns
of
Dur
gada
, U
mre
r,
and
Nag
pur
(see
T
able
s I
and
II).
l 3
Dat
a co
pied
fr
om
Wen
sink
an
d K
loot
wijk
(1
971,
ta
ble
IV).
l 4
Num
ber
of
sect
ions
in
clud
ed
in
the
anal
ysis
.
NEWER PALEOMAGNETIC RESULTS OF THE DECCAN TRAPS 57
45‘
40
3:
3c
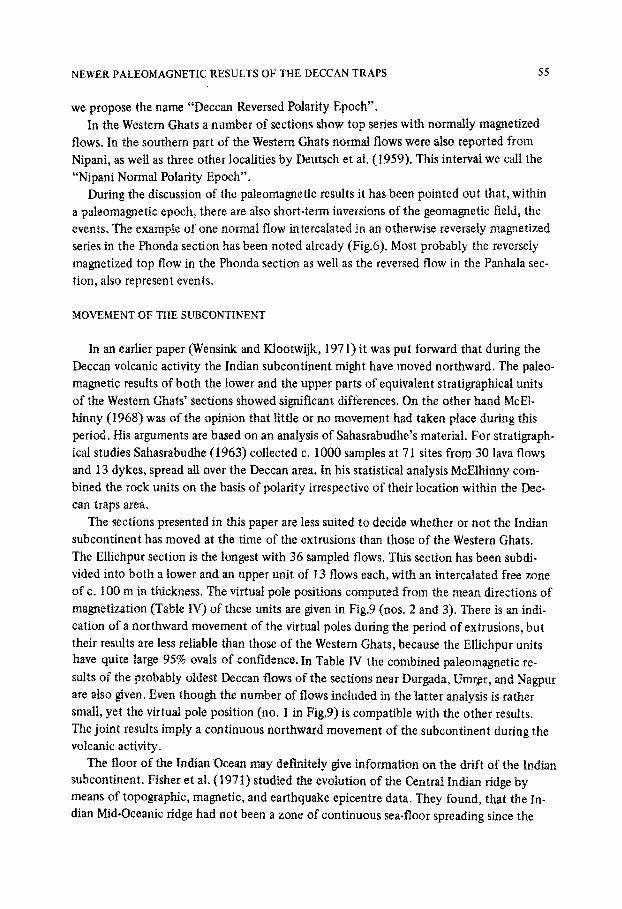
Fig.9. Map of eastern North America with some virtual magnetic pole positions obtained from Indian rocks, T.S. is the virtual pole of the Tirupati sandstones of Middle Cretaceous age (Verma and Pullaiah, 1967). The pole positions with arabic figures were derived from: (1) the combined Durgada, Umrer, and Nagpur sites; (2) the lower 13 flows of the Ellichpur section; (3) the upper 13 flows of the same section; (4) the combined lower parts, and (5) the combined upper parts of Western Chats’ sections. Poles 1 through 5 are listed in Table IV. The heavy line shows the path of the virtual magnetic poles obtained from Indian rocks from Middle Cretaceous through Lower Tertiary times. The other virtual magnetic poles, which are provided with the ovals of 95% confidence, are the respective poles of the Western Chats (I) presented in an earlier paper; of this paper (II); and of the combined results of both papers (III).
Cretaceous. The magnetic anomalies 30 through 21 - i.e., Cretaceous-Eocene according to Heirtzler et al’s time scale (1968) - belong to an E-W trending ridge. Thjs ridge con- sisted of two main segments, the eastern part in the southeastern Iruiian Ocean and the western part in the Arabian Sea, both of which are linked by a very long N-S transform fault, the “Chagos Fracture Zone”. The magnetic anomalies 21 through 6 cannot be recog nized in the Indian Ocean, but from anomaly 5 on, i.e., c. mid-Miocene, the spreading di- rection is NE-SW, with a calculated pole of reiative motion between the Indian and Soma- lian plates located at 16.0” N, 48.3” E.
The paleomagnetic data reveal that during the Deccan volcanic activity, i.e., a period within the magnetic anomalies 30 through 21, a really very important drift of India oc-
58 H. WENSINK
curred. The northward movement of the subcontinent is compatible with the N-S spread-
ing at that time. The paleomagnetic data do not furnish an exact amount of the drift dur-
ing the period of volcanic activity. However, from our paleomagnetic data one can try to
obtain a value for the rate of drift. The preliminary paleomagnetic stratigraphy based on
polarity reversals as proposed in this paper for the Deccan traps (Fig.7) may serve as a
starting point. We selected pole positions computed for the Nagpur Reversed Polarity
Epoch as well as from the combined Upper Western Ghats’ units (Table IV). According to
the time scale of Heirtzler et al. (1968) these poles may represent an age difference of
2-3 m.y., say 2.5 m.y. The mean inclination values of the selected units represent paleo-
latitudinal positions with a polar distance of 7”. From these data a drift movement of 30
cm/year can be deduced.*
About 60 m.y. ago the paleolatitudinal position of the Deccan area was 30” S; a con-
tinuous drift of India up to recent times means a northward movement of nearly 10
cm/year. If only intermittent movements have taken place, periods of very rapid drift must
have occurred. The paleomagnetic data of the Deccan traps are in favour of a rapid drift;
however, it must be emphasized that the accuracy of the data is not sufficiently large.
The sea-floor spreading since mid-Miocene times - from anomaly 5 on - may have
caused a further northward drift of the subcontinent with a slight anticlockwise rotation.
This is consistent with the preliminary paleomagnetic results obtained from the Miocene
Lower Siwaliks of Pakistan (Wensink, 1972), which indicate that the India - Pakistan sub-
continent was still far from its present position at that time.
ACKNOWLEDGEMENT
The author is much indebted to the late Prof. M.G. Rutten for his initiative to undertake
this work. I express my sincere appreciation to Prof. J. Veldkamp and Mr. J.D.A. Zijderveld
for critically reading the manuscript. Thanks are also due to Mr. C.T. Klootwijk who kind-
ly helped with the collection of samples.
REFERENCES
Athavale, R.N., 1970. Paleomagnetism and tectonics of a Deccan trap lava sequence at Amarkantak,
India. J. Geophys. Rex, 75: 4000-4006.
Athavale, R.N. and Verma, R.K., 1970. Paleomagnetic results on Gondwana dykes from the Damodar
valley coal-fields and their bearing on the sequence of Mesozoic igneous activity in India. Geophys.
J., 20: 303-316. Clegg, J.A., Deutsch, E.R. and Griffiths, D.H., 1956. Rock magnetism in India. PhiloseMag., 1: 419-
436.
Cox, A., 1968. Length ofgeomagnetic pblarity intervals. J. Geophys. Res., 73: 3247-3260. Deutsch, E.R., Radhakrishnamurty, C. and Sahasrabudhe, P.W., 1959. Paleomagnetism of the Deccan
traps.Ann. Geophys., 15: 39-59.
l If one uses the paleomagnetic data of the Western Chats only (Table IV), even an higher amount for
the rate of drift is obtained.
NEWER PALEOMAGNETIC RESULTS OF THE DECCAN TRAPS 59
Fisher, R.A., 1953. Dispersion on a sphere. Proc. R. SOC. Lond., Ser. A., 217: 295-305. Fisher, R.L., &later, J.G. and McKenzie, D.P., 1971. Evolution of the Central Indian Ridge, western
Indian Ocean. Geol. Sot. Am., Bull., 82: 553-562.
Heirtzler, J.R., Dickson, G.O., Herron, E.M., Pitman, WC. and Le Pichon, X., 1968. Marine magnetic
anomalies, geomagnetic field reversals, and motions of the ocean floor and continents. J. Geophys.
Rex, 13: 2119-2136.
Hospers, J. and Van Andel, S.I., 1969. Paleomagnetism and tectonics. Earth&i. Rev., 5: 5-44. Ito, H. and Fuller, M., 1970. A paleomagnetic study of the reversal process of the geomagnetic field.
In: S.K. Runcorn (Editor), Palueogeophysics. Academic Press, London, pp. 133-137.
Krishnan, M.S., 1960. Geology oflndia and Burma. Higginbotham, Madras, 4th ed., 604 pp.
McDougall, I. and McElhinny, M.W., 1970. The Rajmahal traps of India - K/Ar ages and paleomag-
netism. Earth Planet. Sci. Lett., 9: 371-378. McElhinny, M.W., 1968. Northward drift of India - Examination of recent paleomagnetic results.
Nature, 217: 342-344. Pal, PC., Bindu Madhav, U. and Bhimasankaram, V.L.S., 1971. Early Tertiary geomagnetic polarity
reversals in India. Nature (Phys. Sci.), 230: 133-135.
Pascoe, E.H., 1964. A Manualof the Geology of India and Burma, 3.Government of India Press, Cal-
cutta, pp. 1345-2130.
Rama, 1964. Potassium/argon dates of some samples from Deccan traps. Int. Geol. Congr., 22nd, New Delhi, 1964, Rep., VII: 139-140.
Sahasrabudhe, P.W., 1963. Paleomagnetism and the geology of the Deccan traps. Semin. Geophys. In- vest. Peninsular Shield. Osmania Univ., Hyderabad, pp. 226-243.
Verma, R.K. and Pullaiah, G., 1967. Paleomagnetism of Tirupati sandstones from Godavary valley, India. Earth Planet. Sci. Lett., 2: 310-316.
Watkins, N.D., 1969. Non-dipole behaviour during an Upper-Miocene geomagnetic polarity transition
in Oregon. Geophys. J., 17: 121-149.
WeIlman, P. and McEIhinny, M.W., 1970. K/Ar age of the Deccan traps, India. Nature, 227: 595-596. Wensink, H., 19f2. A note on the paleomagnetism of the Lower Siwaliks near Choa Saiden Shah, Pot-
war Plateau, West Pakistan. Pak. J. Sci. Ind. Res., 15: 89-91.
Wensink, H. and Klootwijk, C.T., 1971. Paleomagnetism of the Deccan traps in the Western Ghats near
Poona (India). Tectonophysics, 11: 175- 190.
Zijderveld, J.D.A., 1967. A.C. demagnetization of rocks. In: D.W. Collinson, K.M. Creer and S.K.
Runcorn (Editors), Methods in Palaeomagnetism. Elsevier, Amsterdam, pp. 254-286.