Embed Size (px)
Citation preview
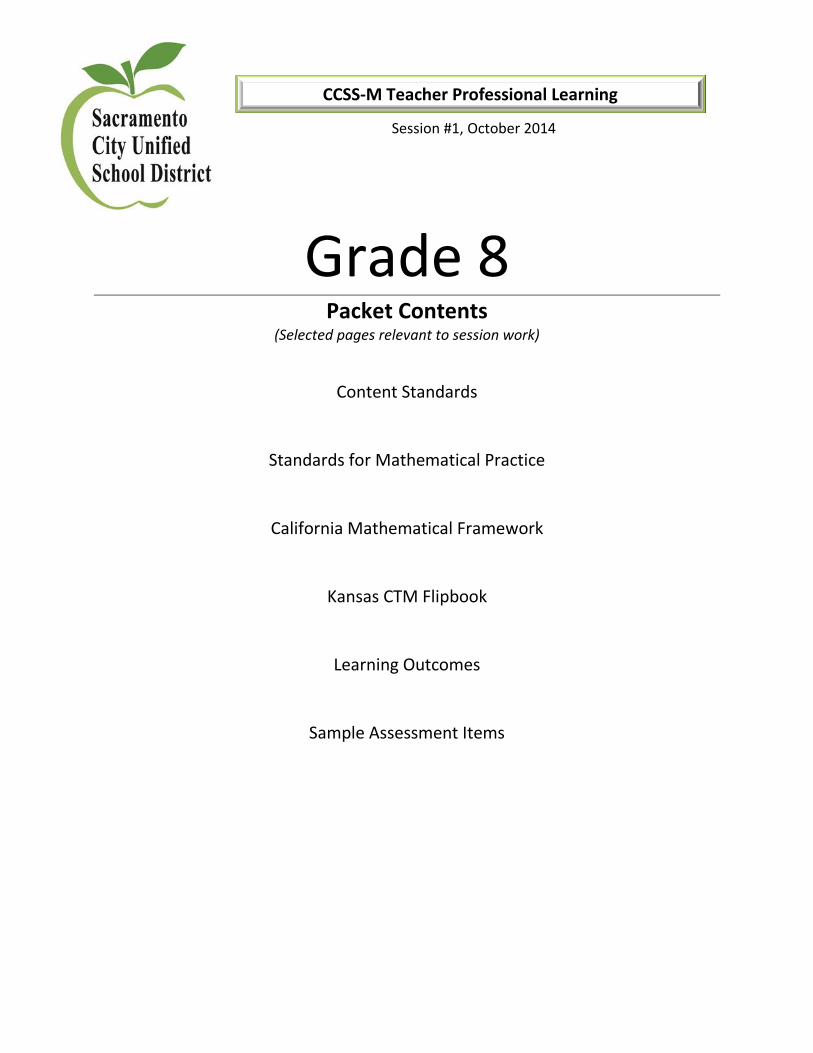
Session #1, October 2014
Grade 8
Packet Contents (Selected pages relevant to session work)
Content Standards
Standards for Mathematical Practice
California Mathematical Framework
Kansas CTM Flipbook
Learning Outcomes
Sample Assessment Items
CCSS-M Teacher Professional Learning

Grade 8
The Number System 8.NS Know that there are numbers that are not rational, and approximate them by rational numbers.
1. Know that numbers that are not rational are called irrational. Understand informally that every number has a decimal expansion; for rational numbers show that the decimal expansion repeats eventually, and convert a decimal expansion which repeats eventually into a rational number.
2. Use rational approximations of irrational numbers to compare the size of irrational numbers, locate them approximately on a number line diagram, and estimate the value of expressions (e.g., π2). For example, by truncating the decimal expansion of √2, show that √2 is between 1 and 2, then between 1.4 and 1.5, and explain how to continue on to get better approximations.
Expressions and Equations 8.EE Work with radicals and integer exponents.
1. Know and apply the properties of integer exponents to generate equivalent numerical expressions. For example, 32 × 3–5 = 3–3 = 1/33 = 1/27.
2. Use square root and cube root symbols to represent solutions to equations of the form x2 = p and x3 = p, where p is a positive rational number. Evaluate square roots of small perfect squares and cube roots of small perfect cubes. Know that √2 is irrational.
3. Use numbers expressed in the form of a single digit times an integer power of 10 to estimate very large or very small quantities, and to express how many times as much one is than the other. For example, estimate the population of the United States as 3 × 10⁸ and the population of the world as 7 × 10⁹, and determine that the world population is more than 20 times larger.
4. Perform operations with numbers expressed in scientific notation, including problems where both decimal and scientific notation are used. Use scientific notation and choose units of appropriate size for measurements of very large or very small quantities (e.g., use millimeters per year for seafloor spreading). Interpret scientific notation that has been generated by technology.
Understand the connections between proportional relationships, lines, and linear equations.
5. Graph proportional relationships, interpreting the unit rate as the slope of the graph. Compare two different proportional relationships represented in different ways. For example, compare a distance-time graph to a distance-time equation to determine which of two moving objects has greater speed.
6. Use similar triangles to explain why the slope m is the same between any two distinct points on a non-vertical line in the coordinate plane; derive the equation y = mx for a line through the origin and the equation y = mx + b for a line intercepting the vertical axis at b.
Analyze and solve linear equations and pairs of simultaneous linear equations.
7. Solve linear equations in one variable. a. Give examples of linear equations in one variable with one solution, infinitely many solutions,
or no solutions. Show which of these possibilities is the case by successively transforming the given equation into simpler forms, until an equivalent equation of the form x = a, a = a, or a = b results (where a and b are different numbers).
b. Solve linear equations with rational number coefficients, including equations whose solutions require expanding expressions using the distributive property and collecting like terms.
8. Analyze and solve pairs of simultaneous linear equations.
8
Prepublication Version, April 2013 California Department of Education 54 |
Com
mon
Cor
e St
ate
Stan
dard
s - M
athe
mat
ics
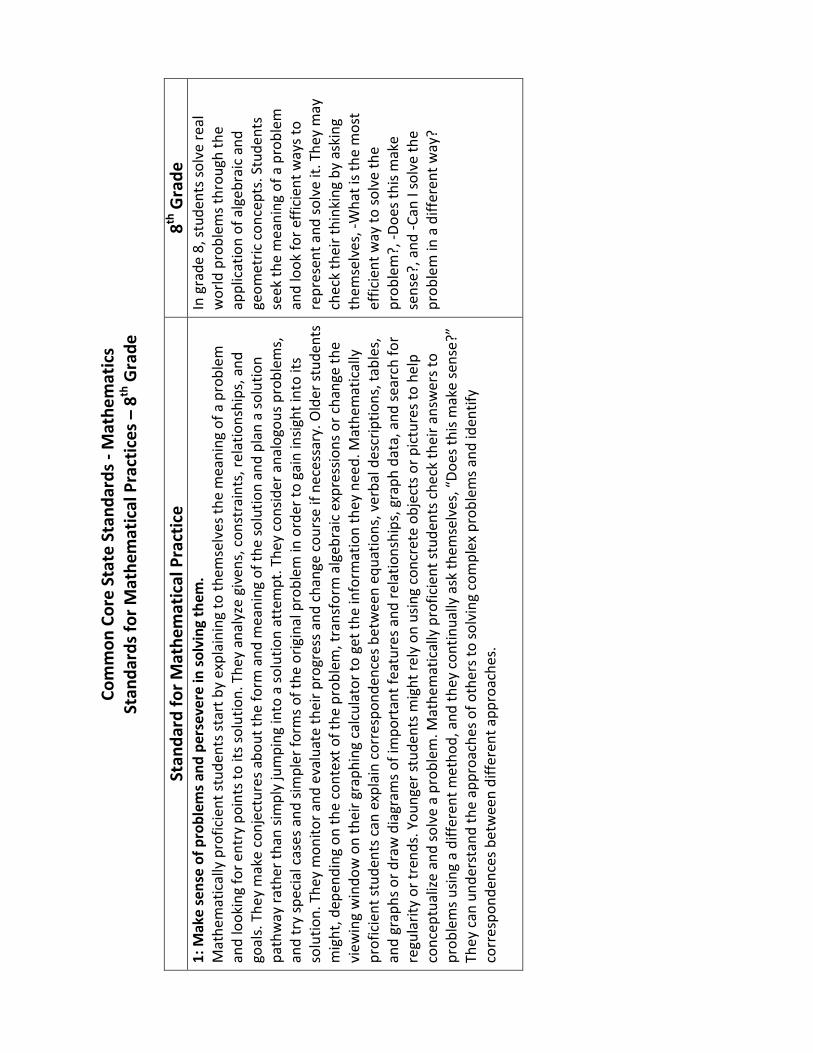
Stan
dard
s for
Mat
hem
atic
al P
ract
ices
– 8
th G
rade
Stan
dard
for M
athe
mat
ical
Pra
ctic
e 8th
Gra
de
1: M
ake
sens
e of
pro
blem
s and
per
seve
re in
solv
ing
them
. M
athe
mat
ical
ly p
rofic
ient
stud
ents
star
t by
expl
aini
ng to
them
selv
es th
e m
eani
ng o
f a p
robl
em
and
look
ing
for e
ntry
poi
nts t
o its
solu
tion.
The
y an
alyz
e gi
vens
, con
stra
ints
, rel
atio
nshi
ps, a
nd
goal
s. T
hey
mak
e co
njec
ture
s abo
ut th
e fo
rm a
nd m
eani
ng o
f the
solu
tion
and
plan
a so
lutio
n pa
thw
ay ra
ther
than
sim
ply
jum
ping
into
a so
lutio
n at
tem
pt. T
hey
cons
ider
ana
logo
us p
robl
ems,
and
try
spec
ial c
ases
and
sim
pler
form
s of t
he o
rigin
al p
robl
em in
ord
er to
gai
n in
sight
into
its
solu
tion.
The
y m
onito
r and
eva
luat
e th
eir p
rogr
ess a
nd c
hang
e co
urse
if n
eces
sary
. Old
er st
uden
ts
mig
ht, d
epen
ding
on
the
cont
ext o
f the
pro
blem
, tra
nsfo
rm a
lgeb
raic
exp
ress
ions
or c
hang
e th
e vi
ewin
g w
indo
w o
n th
eir g
raph
ing
calc
ulat
or to
get
the
info
rmat
ion
they
nee
d. M
athe
mat
ical
ly
prof
icie
nt st
uden
ts c
an e
xpla
in c
orre
spon
denc
es b
etw
een
equa
tions
, ver
bal d
escr
iptio
ns, t
able
s, an
d gr
aphs
or d
raw
dia
gram
s of i
mpo
rtan
t fea
ture
s and
rela
tions
hips
, gra
ph d
ata,
and
sear
ch fo
r re
gula
rity
or tr
ends
. You
nger
stud
ents
mig
ht re
ly o
n us
ing
conc
rete
obj
ects
or p
ictu
res t
o he
lp
conc
eptu
alize
and
solv
e a
prob
lem
. Mat
hem
atic
ally
pro
ficie
nt st
uden
ts c
heck
thei
r ans
wer
s to
prob
lem
s usin
g a
diffe
rent
met
hod,
and
they
con
tinua
lly a
sk th
emse
lves
, “Do
es th
is m
ake
sens
e?”
They
can
und
erst
and
the
appr
oach
es o
f oth
ers t
o so
lvin
g co
mpl
ex p
robl
ems a
nd id
entif
y co
rres
pond
ence
s bet
wee
n di
ffere
nt a
ppro
ache
s.
In g
rade
8, s
tude
nts s
olve
real
w
orld
pro
blem
s thr
ough
the
appl
icat
ion
of a
lgeb
raic
and
ge
omet
ric c
once
pts.
Stu
dent
s se
ek th
e m
eani
ng o
f a p
robl
em
and
look
for e
ffici
ent w
ays t
o re
pres
ent a
nd so
lve
it. T
hey
may
ch
eck
thei
r thi
nkin
g by
ask
ing
them
selv
es, -
Wha
t is t
he m
ost
effic
ient
way
to so
lve
the
prob
lem
?, -D
oes t
his m
ake
sens
e?, a
nd -C
an I
solv
e th
e pr
oble
m in
a d
iffer
ent w
ay?
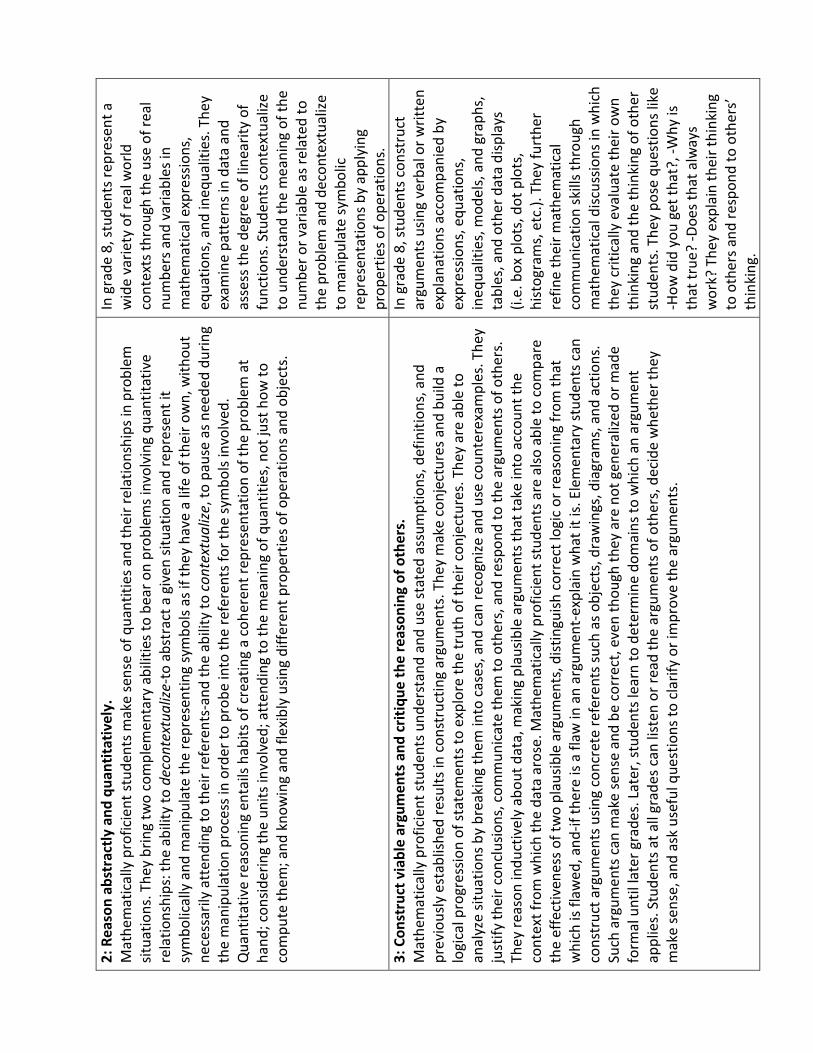
2: R
easo
n ab
stra
ctly
and
qua
ntita
tivel
y.
Mat
hem
atic
ally
pro
ficie
nt st
uden
ts m
ake
sens
e of
qua
ntiti
es a
nd th
eir r
elat
ions
hips
in p
robl
em
situa
tions
. The
y br
ing
two
com
plem
enta
ry a
bilit
ies t
o be
ar o
n pr
oble
ms i
nvol
ving
qua
ntita
tive
rela
tions
hips
: the
abi
lity
to d
econ
text
ualiz
e-to
abs
trac
t a g
iven
situ
atio
n an
d re
pres
ent i
t sy
mbo
lical
ly a
nd m
anip
ulat
e th
e re
pres
entin
g sy
mbo
ls as
if th
ey h
ave
a lif
e of
thei
r ow
n, w
ithou
t ne
cess
arily
att
endi
ng to
thei
r ref
eren
ts-a
nd th
e ab
ility
to c
onte
xtua
lize,
to p
ause
as n
eede
d du
ring
the
man
ipul
atio
n pr
oces
s in
orde
r to
prob
e in
to th
e re
fere
nts f
or th
e sy
mbo
ls in
volv
ed.
Qua
ntita
tive
reas
onin
g en
tails
hab
its o
f cre
atin
g a
cohe
rent
repr
esen
tatio
n of
the
prob
lem
at
hand
; con
sider
ing
the
units
invo
lved
; att
endi
ng to
the
mea
ning
of q
uant
ities
, not
just
how
to
com
pute
them
; and
kno
win
g an
d fle
xibl
y us
ing
diffe
rent
pro
pert
ies o
f ope
ratio
ns a
nd o
bjec
ts.
In g
rade
8, s
tude
nts r
epre
sent
a
wid
e va
riety
of r
eal w
orld
co
ntex
ts th
roug
h th
e us
e of
real
nu
mbe
rs a
nd v
aria
bles
in
mat
hem
atic
al e
xpre
ssio
ns,
equa
tions
, and
ineq
ualit
ies.
The
y ex
amin
e pa
tter
ns in
dat
a an
d as
sess
the
degr
ee o
f lin
earit
y of
fu
nctio
ns. S
tude
nts c
onte
xtua
lize
to u
nder
stan
d th
e m
eani
ng o
f the
nu
mbe
r or v
aria
ble
as re
late
d to
th
e pr
oble
m a
nd d
econ
text
ualiz
e to
man
ipul
ate
sym
bolic
re
pres
enta
tions
by
appl
ying
pr
oper
ties o
f ope
ratio
ns.
3: C
onst
ruct
via
ble
argu
men
ts a
nd c
ritiq
ue th
e re
ason
ing
of o
ther
s.
Mat
hem
atic
ally
pro
ficie
nt st
uden
ts u
nder
stan
d an
d us
e st
ated
ass
umpt
ions
, def
initi
ons,
and
prev
ious
ly e
stab
lishe
d re
sults
in c
onst
ruct
ing
argu
men
ts. T
hey
mak
e co
njec
ture
s and
bui
ld a
lo
gica
l pro
gres
sion
of st
atem
ents
to e
xplo
re th
e tr
uth
of th
eir c
onje
ctur
es. T
hey
are
able
to
anal
yze
situa
tions
by
brea
king
them
into
cas
es, a
nd c
an re
cogn
ize a
nd u
se c
ount
erex
ampl
es. T
hey
just
ify th
eir c
oncl
usio
ns, c
omm
unic
ate
them
to o
ther
s, a
nd re
spon
d to
the
argu
men
ts o
f oth
ers.
Th
ey re
ason
indu
ctiv
ely
abou
t dat
a, m
akin
g pl
ausib
le a
rgum
ents
that
take
into
acc
ount
the
cont
ext f
rom
whi
ch th
e da
ta a
rose
. Mat
hem
atic
ally
pro
ficie
nt st
uden
ts a
re a
lso a
ble
to c
ompa
re
the
effe
ctiv
enes
s of t
wo
plau
sible
arg
umen
ts, d
istin
guish
cor
rect
logi
c or
reas
onin
g fr
om th
at
whi
ch is
flaw
ed, a
nd-if
ther
e is
a fla
w in
an
argu
men
t-ex
plai
n w
hat i
t is.
Ele
men
tary
stud
ents
can
co
nstr
uct a
rgum
ents
usin
g co
ncre
te re
fere
nts s
uch
as o
bjec
ts, d
raw
ings
, dia
gram
s, a
nd a
ctio
ns.
Such
arg
umen
ts c
an m
ake
sens
e an
d be
cor
rect
, eve
n th
ough
they
are
not
gen
eral
ized
or m
ade
form
al u
ntil
late
r gra
des.
Lat
er, s
tude
nts l
earn
to d
eter
min
e do
mai
ns to
whi
ch a
n ar
gum
ent
appl
ies.
Stu
dent
s at a
ll gr
ades
can
list
en o
r rea
d th
e ar
gum
ents
of o
ther
s, d
ecid
e w
heth
er th
ey
mak
e se
nse,
and
ask
use
ful q
uest
ions
to c
larif
y or
impr
ove
the
argu
men
ts.
In g
rade
8, s
tude
nts c
onst
ruct
ar
gum
ents
usin
g ve
rbal
or w
ritte
n ex
plan
atio
ns a
ccom
pani
ed b
y ex
pres
sions
, equ
atio
ns,
ineq
ualit
ies,
mod
els,
and
gra
phs,
tabl
es, a
nd o
ther
dat
a di
spla
ys
(i.e.
box
plo
ts, d
ot p
lots
, hi
stog
ram
s, et
c.).
They
furt
her
refin
e th
eir m
athe
mat
ical
co
mm
unic
atio
n sk
ills t
hrou
gh
mat
hem
atic
al d
iscus
sions
in w
hich
th
ey c
ritic
ally
eva
luat
e th
eir o
wn
thin
king
and
the
thin
king
of o
ther
st
uden
ts. T
hey
pose
que
stio
ns li
ke
-How
did
you
get
that
?, -W
hy is
th
at tr
ue?
-Doe
s tha
t alw
ays
wor
k? T
hey
expl
ain
thei
r thi
nkin
g to
oth
ers a
nd re
spon
d to
oth
ers’
th
inki
ng.

4: M
odel
with
mat
hem
atic
s.
Mat
hem
atic
ally
pro
ficie
nt st
uden
ts c
an a
pply
the
mat
hem
atic
s the
y kn
ow to
solv
e pr
oble
ms
arisi
ng in
eve
ryda
y lif
e, so
ciet
y, a
nd th
e w
orkp
lace
. In
early
gra
des,
this
mig
ht b
e as
sim
ple
as
writ
ing
an a
dditi
on e
quat
ion
to d
escr
ibe
a sit
uatio
n. In
mid
dle
grad
es, a
stud
ent m
ight
app
ly
prop
ortio
nal r
easo
ning
to p
lan
a sc
hool
eve
nt o
r ana
lyze
a p
robl
em in
the
com
mun
ity. B
y hi
gh
scho
ol, a
stud
ent m
ight
use
geo
met
ry to
solv
e a
desig
n pr
oble
m o
r use
a fu
nctio
n to
des
crib
e ho
w
one
quan
tity
of in
tere
st d
epen
ds o
n an
othe
r. M
athe
mat
ical
ly p
rofic
ient
stud
ents
who
can
app
ly
wha
t the
y kn
ow a
re c
omfo
rtab
le m
akin
g as
sum
ptio
ns a
nd a
ppro
xim
atio
ns to
sim
plify
a
com
plic
ated
situ
atio
n, re
alizi
ng th
at th
ese
may
nee
d re
visio
n la
ter.
They
are
abl
e to
iden
tify
impo
rtan
t qua
ntiti
es in
a p
ract
ical
situ
atio
n an
d m
ap th
eir r
elat
ions
hips
usin
g su
ch to
ols a
s di
agra
ms,
two-
way
tabl
es, g
raph
s, flo
wch
arts
and
form
ulas
. The
y ca
n an
alyz
e th
ose
rela
tions
hips
m
athe
mat
ical
ly to
dra
w c
oncl
usio
ns. T
hey
rout
inel
y in
terp
ret t
heir
mat
hem
atic
al re
sults
in th
e co
ntex
t of t
he si
tuat
ion
and
refle
ct o
n w
heth
er th
e re
sults
mak
e se
nse,
pos
sibly
impr
ovin
g th
e m
odel
if it
has
not
serv
ed it
s pur
pose
.
In g
rade
8, s
tude
nts m
odel
pr
oble
m si
tuat
ions
sym
bolic
ally
, gr
aphi
cally
, tab
ular
ly, a
nd
cont
extu
ally
. Stu
dent
s for
m
expr
essio
ns, e
quat
ions
, or
ineq
ualit
ies f
rom
real
wor
ld
cont
exts
and
con
nect
sym
bolic
an
d gr
aphi
cal r
epre
sent
atio
ns.
Stud
ents
solv
e sy
stem
s of l
inea
r eq
uatio
ns a
nd c
ompa
re
prop
ertie
s of f
unct
ions
pro
vide
d in
diff
eren
t for
ms.
Stu
dent
s use
sc
atte
rplo
ts to
repr
esen
t dat
a an
d de
scrib
e as
soci
atio
ns b
etw
een
varia
bles
. Stu
dent
s nee
d m
any
oppo
rtun
ities
to c
onne
ct a
nd
expl
ain
the
conn
ectio
ns b
etw
een
the
diffe
rent
repr
esen
tatio
ns.
They
shou
ld b
e ab
le to
use
all
of
thes
e re
pres
enta
tions
as
appr
opria
te to
a p
robl
em c
onte
xt.
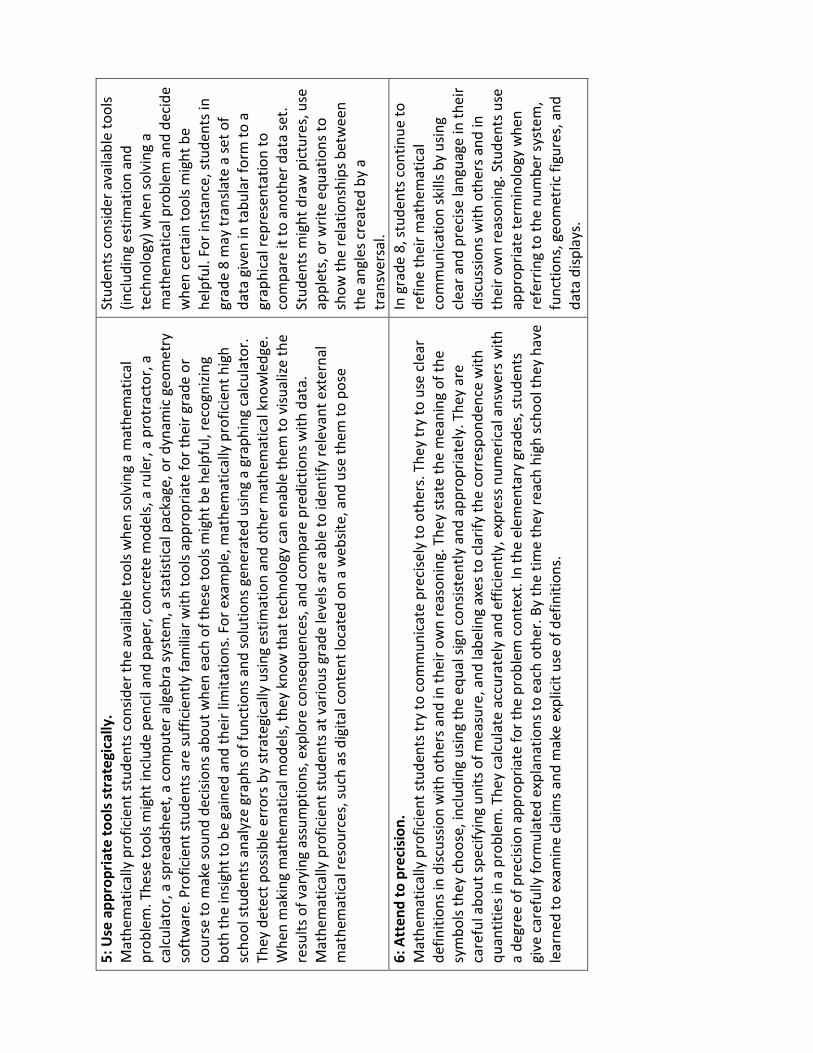
5: U
se a
ppro
pria
te to
ols s
trat
egic
ally
. M
athe
mat
ical
ly p
rofic
ient
stud
ents
con
sider
the
avai
labl
e to
ols w
hen
solv
ing
a m
athe
mat
ical
pr
oble
m. T
hese
tool
s mig
ht in
clud
e pe
ncil
and
pape
r, co
ncre
te m
odel
s, a
rule
r, a
prot
ract
or, a
ca
lcul
ator
, a sp
read
shee
t, a
com
pute
r alg
ebra
syst
em, a
stat
istic
al p
acka
ge, o
r dyn
amic
geo
met
ry
soft
war
e. P
rofic
ient
stud
ents
are
suffi
cien
tly fa
mili
ar w
ith to
ols a
ppro
pria
te fo
r the
ir gr
ade
or
cour
se to
mak
e so
und
deci
sions
abo
ut w
hen
each
of t
hese
tool
s mig
ht b
e he
lpfu
l, re
cogn
izing
bo
th th
e in
sight
to b
e ga
ined
and
thei
r lim
itatio
ns. F
or e
xam
ple,
mat
hem
atic
ally
pro
ficie
nt h
igh
scho
ol st
uden
ts a
naly
ze g
raph
s of f
unct
ions
and
solu
tions
gen
erat
ed u
sing
a gr
aphi
ng c
alcu
lato
r. Th
ey d
etec
t pos
sible
err
ors b
y st
rate
gica
lly u
sing
estim
atio
n an
d ot
her m
athe
mat
ical
kno
wle
dge.
W
hen
mak
ing
mat
hem
atic
al m
odel
s, th
ey k
now
that
tech
nolo
gy c
an e
nabl
e th
em to
visu
alize
the
resu
lts o
f var
ying
ass
umpt
ions
, exp
lore
con
sequ
ence
s, a
nd c
ompa
re p
redi
ctio
ns w
ith d
ata.
M
athe
mat
ical
ly p
rofic
ient
stud
ents
at v
ario
us g
rade
leve
ls ar
e ab
le to
iden
tify
rele
vant
ext
erna
l m
athe
mat
ical
reso
urce
s, su
ch a
s dig
ital c
onte
nt lo
cate
d on
a w
ebsit
e, a
nd u
se th
em to
pos
e
Stud
ents
con
sider
ava
ilabl
e to
ols
(incl
udin
g es
timat
ion
and
tech
nolo
gy) w
hen
solv
ing
a m
athe
mat
ical
pro
blem
and
dec
ide
whe
n ce
rtai
n to
ols m
ight
be
help
ful.
For i
nsta
nce,
stud
ents
in
grad
e 8
may
tran
slate
a se
t of
data
giv
en in
tabu
lar f
orm
to a
gr
aphi
cal r
epre
sent
atio
n to
co
mpa
re it
to a
noth
er d
ata
set.
Stud
ents
mig
ht d
raw
pic
ture
s, u
se
appl
ets,
or w
rite
equa
tions
to
show
the
rela
tions
hips
bet
wee
n th
e an
gles
cre
ated
by
a tr
ansv
ersa
l.
6: A
tten
d to
pre
cisi
on.
Mat
hem
atic
ally
pro
ficie
nt st
uden
ts tr
y to
com
mun
icat
e pr
ecise
ly to
oth
ers.
The
y tr
y to
use
cle
ar
defin
ition
s in
disc
ussio
n w
ith o
ther
s and
in th
eir o
wn
reas
onin
g. T
hey
stat
e th
e m
eani
ng o
f the
sy
mbo
ls th
ey c
hoos
e, in
clud
ing
usin
g th
e eq
ual s
ign
cons
isten
tly a
nd a
ppro
pria
tely
. The
y ar
e ca
refu
l abo
ut sp
ecify
ing
units
of m
easu
re, a
nd la
belin
g ax
es to
cla
rify
the
corr
espo
nden
ce w
ith
quan
titie
s in
a pr
oble
m. T
hey
calc
ulat
e ac
cura
tely
and
effi
cien
tly, e
xpre
ss n
umer
ical
ans
wer
s with
a
degr
ee o
f pre
cisio
n ap
prop
riate
for t
he p
robl
em c
onte
xt. I
n th
e el
emen
tary
gra
des,
stud
ents
gi
ve c
aref
ully
form
ulat
ed e
xpla
natio
ns to
eac
h ot
her.
By th
e tim
e th
ey re
ach
high
scho
ol th
ey h
ave
lear
ned
to e
xam
ine
clai
ms a
nd m
ake
expl
icit
use
of d
efin
ition
s.
In g
rade
8, s
tude
nts c
ontin
ue to
re
fine
thei
r mat
hem
atic
al
com
mun
icat
ion
skill
s by
usin
g cl
ear a
nd p
reci
se la
ngua
ge in
thei
r di
scus
sions
with
oth
ers a
nd in
th
eir o
wn
reas
onin
g. S
tude
nts u
se
appr
opria
te te
rmin
olog
y w
hen
refe
rrin
g to
the
num
ber s
yste
m,
func
tions
, geo
met
ric fi
gure
s, a
nd
data
disp
lays
.
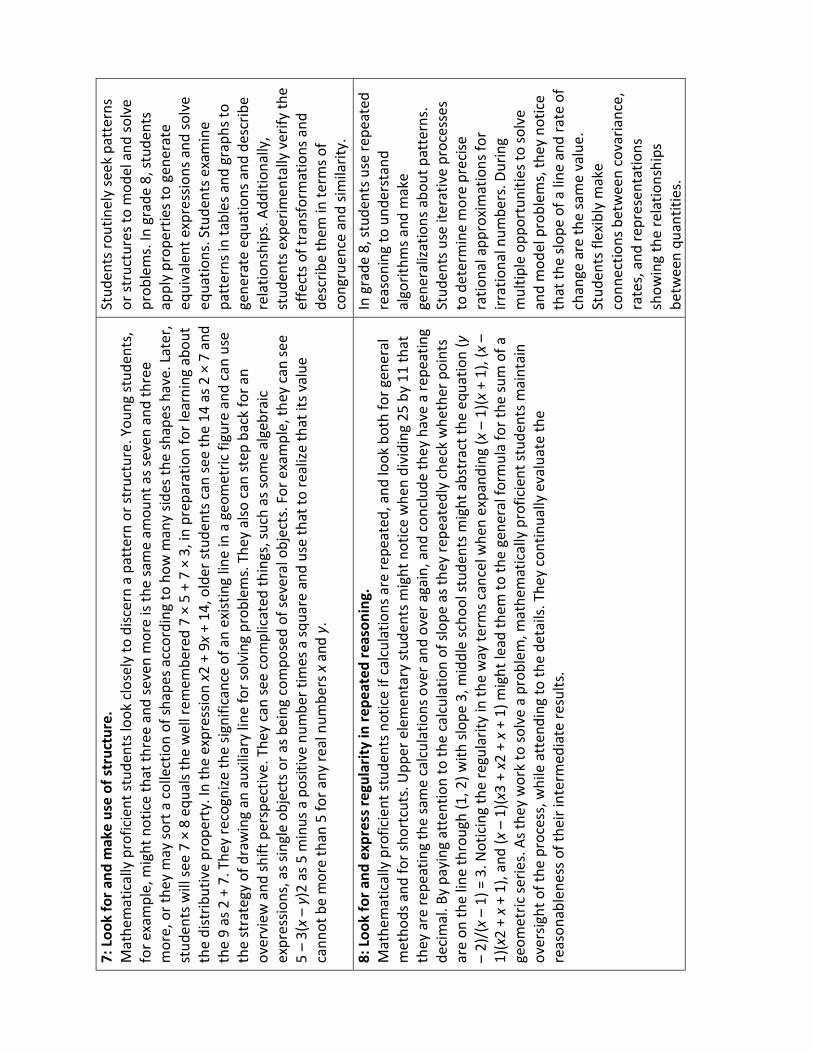
7: L
ook
for a
nd m
ake
use
of st
ruct
ure.
M
athe
mat
ical
ly p
rofic
ient
stud
ents
look
clo
sely
to d
iscer
n a
patt
ern
or st
ruct
ure.
You
ng st
uden
ts,
for e
xam
ple,
mig
ht n
otic
e th
at th
ree
and
seve
n m
ore
is th
e sa
me
amou
nt a
s sev
en a
nd th
ree
mor
e, o
r the
y m
ay so
rt a
col
lect
ion
of sh
apes
acc
ordi
ng to
how
man
y sid
es th
e sh
apes
hav
e. L
ater
, st
uden
ts w
ill se
e 7
× 8
equa
ls th
e w
ell r
emem
bere
d 7
× 5
+ 7
× 3,
in p
repa
ratio
n fo
r lea
rnin
g ab
out
the
dist
ribut
ive
prop
erty
. In
the
expr
essio
n x2
+ 9
x +
14, o
lder
stud
ents
can
see
the
14 a
s 2 ×
7 a
nd
the
9 as
2 +
7. T
hey
reco
gnize
the
signi
fican
ce o
f an
exist
ing
line
in a
geo
met
ric fi
gure
and
can
use
th
e st
rate
gy o
f dra
win
g an
aux
iliar
y lin
e fo
r sol
ving
pro
blem
s. T
hey
also
can
step
bac
k fo
r an
over
view
and
shift
per
spec
tive.
The
y ca
n se
e co
mpl
icat
ed th
ings
, suc
h as
som
e al
gebr
aic
expr
essio
ns, a
s sin
gle
obje
cts o
r as b
eing
com
pose
d of
seve
ral o
bjec
ts. F
or e
xam
ple,
they
can
see
5 –
3(x
– y)
2 as
5 m
inus
a p
ositi
ve n
umbe
r tim
es a
squa
re a
nd u
se th
at to
real
ize th
at it
s val
ue
cann
ot b
e m
ore
than
5 fo
r any
real
num
bers
x a
nd y
.
Stud
ents
rout
inel
y se
ek p
atte
rns
or st
ruct
ures
to m
odel
and
solv
e pr
oble
ms.
In g
rade
8, s
tude
nts
appl
y pr
oper
ties t
o ge
nera
te
equi
vale
nt e
xpre
ssio
ns a
nd so
lve
equa
tions
. Stu
dent
s exa
min
e pa
tter
ns in
tabl
es a
nd g
raph
s to
gene
rate
equ
atio
ns a
nd d
escr
ibe
rela
tions
hips
. Add
ition
ally
, st
uden
ts e
xper
imen
tally
ver
ify th
e ef
fect
s of t
rans
form
atio
ns a
nd
desc
ribe
them
in te
rms o
f co
ngru
ence
and
sim
ilarit
y.
8: L
ook
for a
nd e
xpre
ss re
gula
rity
in re
peat
ed re
ason
ing.
M
athe
mat
ical
ly p
rofic
ient
stud
ents
not
ice
if ca
lcul
atio
ns a
re re
peat
ed, a
nd lo
ok b
oth
for g
ener
al
met
hods
and
for s
hort
cuts
. Upp
er e
lem
enta
ry st
uden
ts m
ight
not
ice
whe
n di
vidi
ng 2
5 by
11
that
th
ey a
re re
peat
ing
the
sam
e ca
lcul
atio
ns o
ver a
nd o
ver a
gain
, and
con
clud
e th
ey h
ave
a re
peat
ing
deci
mal
. By
payi
ng a
tten
tion
to th
e ca
lcul
atio
n of
slop
e as
they
repe
ated
ly c
heck
whe
ther
poi
nts
are
on th
e lin
e th
roug
h (1
, 2) w
ith sl
ope
3, m
iddl
e sc
hool
stud
ents
mig
ht a
bstr
act t
he e
quat
ion
(y
– 2)
/(x
– 1)
= 3
. Not
icin
g th
e re
gula
rity
in th
e w
ay te
rms c
ance
l whe
n ex
pand
ing
(x –
1)(x
+ 1
), (x
–
1)(x
2 +
x +
1), a
nd (x
– 1
)(x3
+ x2
+ x
+ 1
) mig
ht le
ad th
em to
the
gene
ral f
orm
ula
for t
he su
m o
f a
geom
etric
serie
s. A
s the
y w
ork
to so
lve
a pr
oble
m, m
athe
mat
ical
ly p
rofic
ient
stud
ents
mai
ntai
n ov
ersig
ht o
f the
pro
cess
, whi
le a
tten
ding
to th
e de
tails
. The
y co
ntin
ually
eva
luat
e th
e re
ason
able
ness
of t
heir
inte
rmed
iate
resu
lts.
In g
rade
8, s
tude
nts u
se re
peat
ed
reas
onin
g to
und
erst
and
algo
rithm
s and
mak
e ge
nera
lizat
ions
abo
ut p
atte
rns.
St
uden
ts u
se it
erat
ive
proc
esse
s to
det
erm
ine
mor
e pr
ecise
ra
tiona
l app
roxi
mat
ions
for
irrat
iona
l num
bers
. Dur
ing
mul
tiple
opp
ortu
nitie
s to
solv
e an
d m
odel
pro
blem
s, th
ey n
otic
e th
at th
e slo
pe o
f a li
ne a
nd ra
te o
f ch
ange
are
the
sam
e va
lue.
St
uden
ts fl
exib
ly m
ake
conn
ectio
ns b
etw
een
cova
rianc
e,
rate
s, a
nd re
pres
enta
tions
sh
owin
g th
e re
latio
nshi
ps
betw
een
quan
titie
s.

State Board of Education-Adopted Grade Eight Page 11 of 42
• Taking the square root of the square of a number sometimes returns the number 182
back (e.g., √72 = √49 = 7, while �(−3)2 = √9 = 3 ≠ −3) 183
• Cubing a number and taking the cube root can be considered inverse operations. 184
185
Students expand their exponent work as they perform operations with numbers 186
expressed in scientific notation, including problems where both decimal and scientific 187
notation are used. Students use scientific notation to express very large or very small 188
numbers. Students compare and interpret scientific notation quantities in the context of 189
the situation, recognizing that the powers of ten indicated in quantities expressed in 190
scientific notation follow the rules of exponents shown above. (Adapted from CDE 191
Transition Document 2012, Arizona 2012, and N. Carolina 2013) 192
193
Example: Ants and Elephants. An ant has a mass of approximately 4 × 10⁻³ grams and an elephant
has a mass of approximately 8 metric tons. How many ants does it take to have the same mass as an
elephant?
(Note: 1 kg = 1000 grams, 1 metric ton = 1000 kg.)
Solution: To compare the masses of an ant and an elephant, we convert the mass of an elephant into
grams:
8 metric tons × 1000 kg
1 metric ton×
1000 g1 kg
= 8 × 103 × 103grams = 8 × 10⁶grams.
If we let 𝑁 represent the number of ants that have the same mass as an elephant, then (4 × 10⁻³)𝑁 is
their total mass in grams. This should equal 8 × 10⁶ grams. This gives us a simple equation:
(4 × 10⁻³)𝑁 = 8 × 10⁶ which means that 𝑁 =8 × 10⁶
4 × 10−3= 2 × 10⁶−(−3) = 2 × 10⁹
Thus, 2 × 10⁹ ants would have the same mass as an elephant.
(Adapted from Illustrative Mathematics, 8.EE Ant and Elephant.)
194
[Note: Sidebar] 195
Focus, Coherence, and Rigor:
As students work with scientific notation, they learn to choose units of appropriate size for measurement
of very large or very small quantities. (MP.2, MP.5, MP.6) 196
Expressions and Equations 8.EE Understand the connections between proportional relationships, lines, and linear equations. 5. Graph proportional relationships, interpreting the unit rate as the slope of the graph. Compare two The Mathematics Framework was adopted by the California State Board of Education on November 6, 2013. The Mathematics Framework has not been edited for publication.
State Board of Education-Adopted Grade Eight Page 12 of 42
different proportional relationships represented in different ways. For example, compare a distance-time graph to a distance-time equation and determine which of the two moving objects has greater speed.
6. Use similar triangles to explain why the slope m is the same between any two distinct points on a non-vertical line in the coordinate plane; derive the equation y = mx for a line through the origin and the equation y = mx + b for a line intercepting the vertical axis at b.
197
Students build on their work with unit rates from sixth grade and proportional 198
relationships in seventh grade to compare graphs, tables, and equations of proportional 199
relationships (8.EE.5▲). Students identify the unit rate (or slope) to compare two 200
proportional relationships represented in different ways (e.g., as graph of the line 201
through the origin, a table exhibiting a constant rate of change, or an equation of the 202
form 𝑦 = 𝑘𝑥). Students interpret the unit rate in a proportional relationship (e.g., 𝑟 miles 203
per hour) as the slope of the graph. They understand that the slope of a line represents 204
a constant rate of change. 205
206
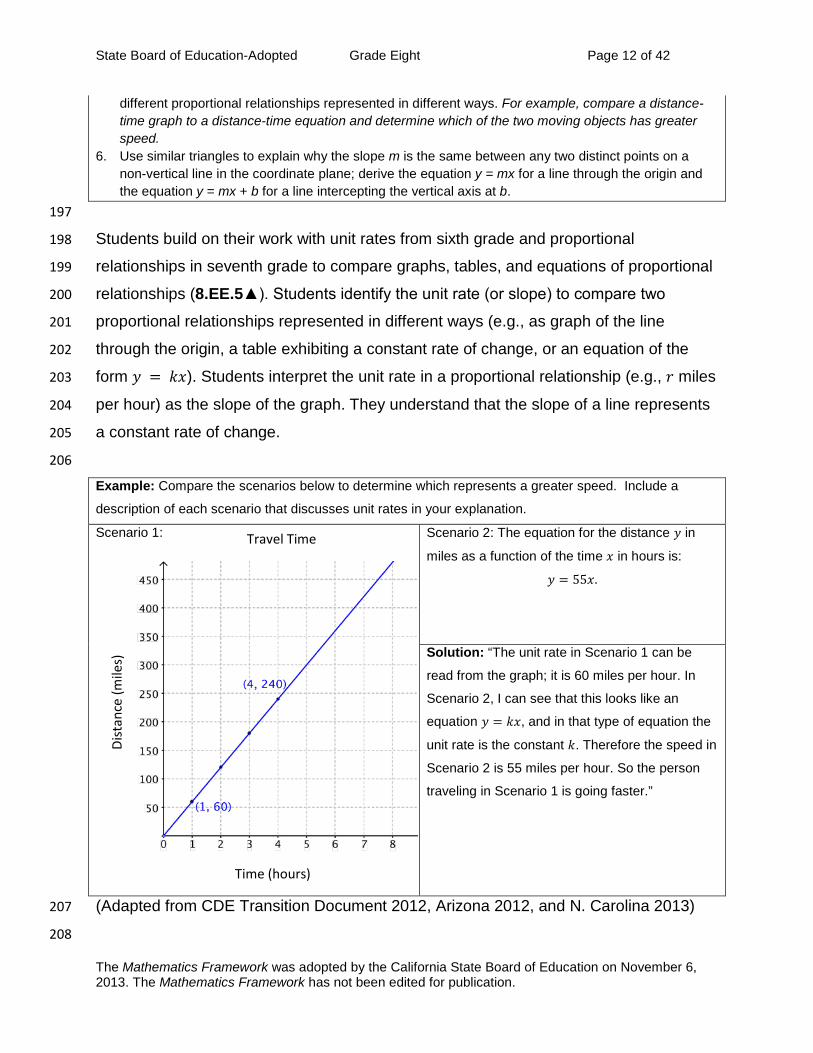
Example: Compare the scenarios below to determine which represents a greater speed. Include a
description of each scenario that discusses unit rates in your explanation.
Scenario 1:
Scenario 2: The equation for the distance 𝑦 in
miles as a function of the time 𝑥 in hours is:
𝑦 = 55𝑥.
Solution: “The unit rate in Scenario 1 can be
read from the graph; it is 60 miles per hour. In
Scenario 2, I can see that this looks like an
equation 𝑦 = 𝑘𝑥, and in that type of equation the
unit rate is the constant 𝑘. Therefore the speed in
Scenario 2 is 55 miles per hour. So the person
traveling in Scenario 1 is going faster.”
(Adapted from CDE Transition Document 2012, Arizona 2012, and N. Carolina 2013) 207
208
Dist
ance
(mile
s)
Time (hours)
Travel Time
The Mathematics Framework was adopted by the California State Board of Education on November 6, 2013. The Mathematics Framework has not been edited for publication.
State Board of Education-Adopted Grade Eight Page 13 of 42
Following is an example of connecting the Standards for Mathematical Content with the 209
Standards for Mathematical Practice. 210
The Mathematics Framework was adopted by the California State Board of Education on November 6, 2013. The Mathematics Framework has not been edited for publication.
State Board of Education-Adopted Grade Eight Page 14 of 42
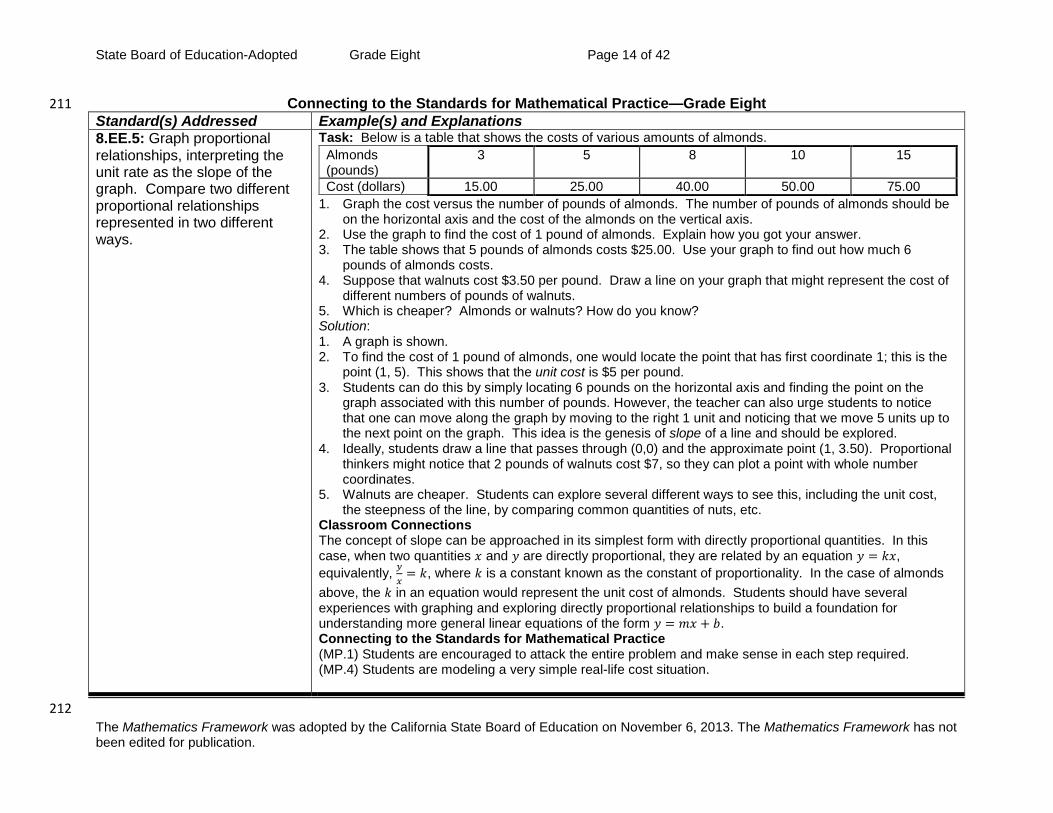
Connecting to the Standards for Mathematical Practice—Grade Eight 211 Standard(s) Addressed Example(s) and Explanations 8.EE.5: Graph proportional relationships, interpreting the unit rate as the slope of the graph. Compare two different proportional relationships represented in two different ways.
Task: Below is a table that shows the costs of various amounts of almonds. Almonds (pounds)
3 5 8 10 15
Cost (dollars) 15.00 25.00 40.00 50.00 75.00 1. Graph the cost versus the number of pounds of almonds. The number of pounds of almonds should be
on the horizontal axis and the cost of the almonds on the vertical axis. 2. Use the graph to find the cost of 1 pound of almonds. Explain how you got your answer. 3. The table shows that 5 pounds of almonds costs $25.00. Use your graph to find out how much 6
pounds of almonds costs. 4. Suppose that walnuts cost $3.50 per pound. Draw a line on your graph that might represent the cost of
different numbers of pounds of walnuts. 5. Which is cheaper? Almonds or walnuts? How do you know? Solution: 1. A graph is shown. 2. To find the cost of 1 pound of almonds, one would locate the point that has first coordinate 1; this is the
point (1, 5). This shows that the unit cost is $5 per pound. 3. Students can do this by simply locating 6 pounds on the horizontal axis and finding the point on the
graph associated with this number of pounds. However, the teacher can also urge students to notice that one can move along the graph by moving to the right 1 unit and noticing that we move 5 units up to the next point on the graph. This idea is the genesis of slope of a line and should be explored.
4. Ideally, students draw a line that passes through (0,0) and the approximate point (1, 3.50). Proportional thinkers might notice that 2 pounds of walnuts cost $7, so they can plot a point with whole number coordinates.
5. Walnuts are cheaper. Students can explore several different ways to see this, including the unit cost, the steepness of the line, by comparing common quantities of nuts, etc.
Classroom Connections The concept of slope can be approached in its simplest form with directly proportional quantities. In this case, when two quantities 𝑥 and 𝑦 are directly proportional, they are related by an equation 𝑦 = 𝑘𝑥, equivalently, 𝑦
𝑥= 𝑘, where 𝑘 is a constant known as the constant of proportionality. In the case of almonds
above, the 𝑘 in an equation would represent the unit cost of almonds. Students should have several experiences with graphing and exploring directly proportional relationships to build a foundation for understanding more general linear equations of the form 𝑦 = 𝑚𝑥 + 𝑏. Connecting to the Standards for Mathematical Practice (MP.1) Students are encouraged to attack the entire problem and make sense in each step required. (MP.4) Students are modeling a very simple real-life cost situation.
212 The Mathematics Framework was adopted by the California State Board of Education on November 6, 2013. The Mathematics Framework has not been edited for publication.
State Board of Education-Adopted Grade Eight Page 15 of 42
[Note: Sidebar] 213
Focus, Coherence, and Rigor: The connection between the unit rate in a proportional relationship and the slope of its graph
depends on a connection with the geometry of similar triangles. (See Standards 8.G.4-5▲.) The
fact that a line has a well-defined slope—that the ratio between the rise and run for any two points
on the line is always the same—depends on similar triangles (Adapted from Progressions 6-8 EE
2011). 214
Standard (8.EE.6▲) represents a convergence of several ideas in this and 215
previous grade levels. Students have graphed proportional relationships and 216
found the slope of the resulting line, interpreting it as the unit rate (8.EE.5▲). It is 217
here that the language of “rise over run” comes into use. In the Functions 218
domain, students will see that any linear equation 𝑦 = 𝑚𝑥 + 𝑏 determines a 219
function whose graph is a straight line (a linear function), and they verify that the 220
slope of the line is equal to 𝑚 (8.F.3). In standard (8.EE.6▲), students go further 221
and explain why the slope 𝑚 is the same through any two points on a line. They 222
justify this fact using similar triangles, which are studied in standards (8.G.4-5▲). 223
224
225
226
227
228
229
230
231
232
233
234
235
236
237
238
The Mathematics Framework was adopted by the California State Board of Education on November 6, 2013. The Mathematics Framework has not been edited for publication.
State Board of Education-Adopted Grade Eight Page 16 of 42
239
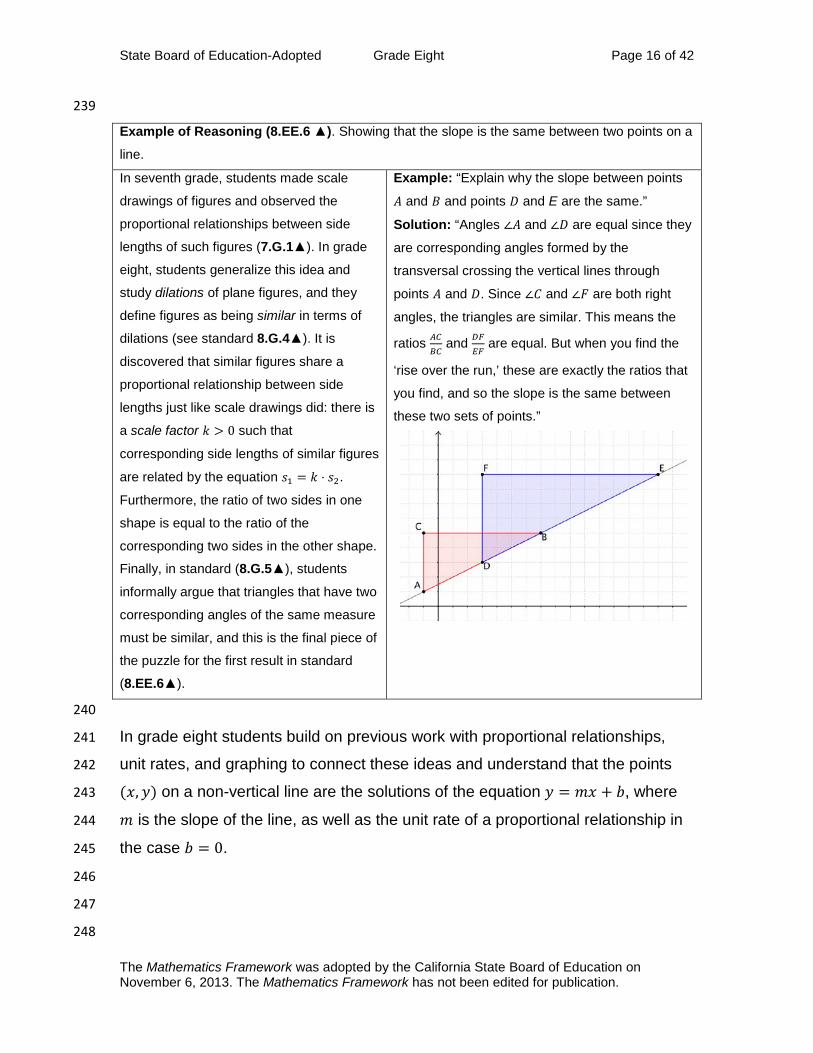
Example of Reasoning (8.EE.6 ▲). Showing that the slope is the same between two points on a
line.
In seventh grade, students made scale
drawings of figures and observed the
proportional relationships between side
lengths of such figures (7.G.1▲). In grade
eight, students generalize this idea and
study dilations of plane figures, and they
define figures as being similar in terms of
dilations (see standard 8.G.4▲). It is
discovered that similar figures share a
proportional relationship between side
lengths just like scale drawings did: there is
a scale factor 𝑘 > 0 such that
corresponding side lengths of similar figures
are related by the equation 𝑠1 = 𝑘 ⋅ 𝑠2.
Furthermore, the ratio of two sides in one
shape is equal to the ratio of the
corresponding two sides in the other shape.
Finally, in standard (8.G.5▲), students
informally argue that triangles that have two
corresponding angles of the same measure
must be similar, and this is the final piece of
the puzzle for the first result in standard
(8.EE.6▲).
Example: “Explain why the slope between points
𝐴 and 𝐵 and points 𝐷 and E are the same.”
Solution: “Angles ∠𝐴 and ∠𝐷 are equal since they
are corresponding angles formed by the
transversal crossing the vertical lines through
points 𝐴 and 𝐷. Since ∠𝐶 and ∠𝐹 are both right
angles, the triangles are similar. This means the
ratios 𝐴𝐶𝐵𝐶
and 𝐷𝐹𝐸𝐹
are equal. But when you find the
‘rise over the run,’ these are exactly the ratios that
you find, and so the slope is the same between
these two sets of points.”
240
In grade eight students build on previous work with proportional relationships, 241
unit rates, and graphing to connect these ideas and understand that the points 242
(𝑥,𝑦) on a non-vertical line are the solutions of the equation 𝑦 = 𝑚𝑥 + 𝑏, where 243
𝑚 is the slope of the line, as well as the unit rate of a proportional relationship in 244
the case 𝑏 = 0. 245
246
247
248
The Mathematics Framework was adopted by the California State Board of Education on November 6, 2013. The Mathematics Framework has not been edited for publication.
State Board of Education-Adopted Grade Eight Page 17 of 42
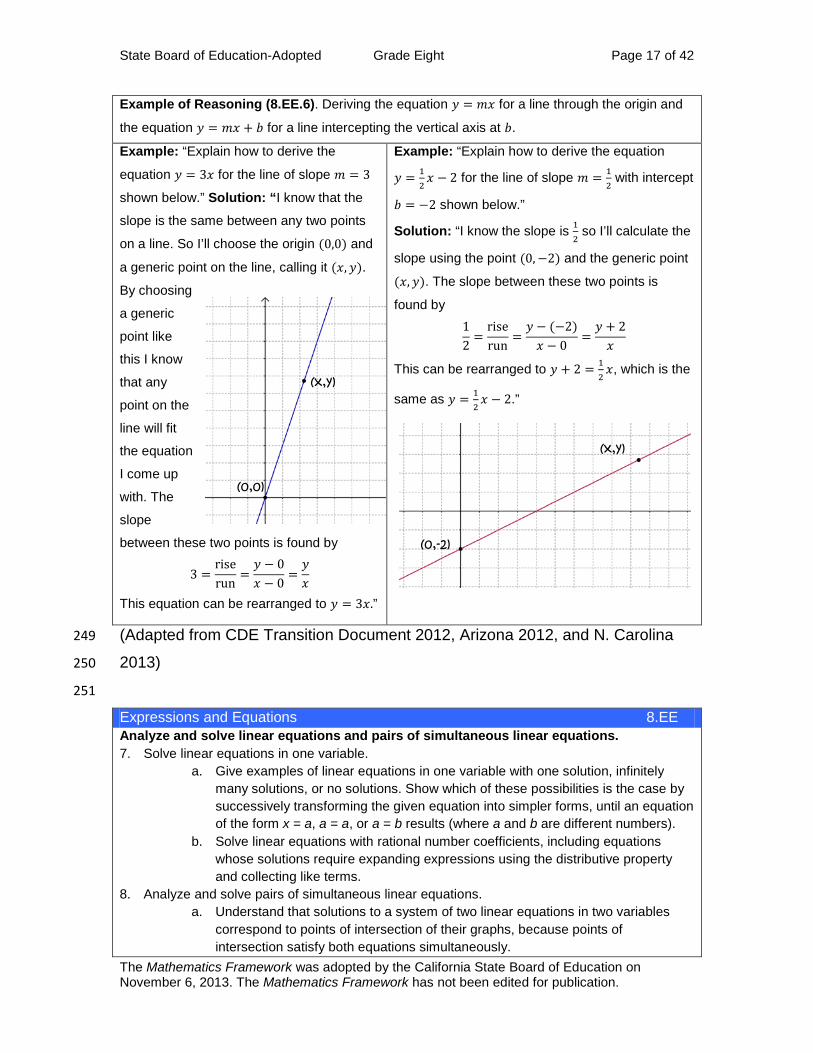
Example of Reasoning (8.EE.6). Deriving the equation 𝑦 = 𝑚𝑥 for a line through the origin and
the equation 𝑦 = 𝑚𝑥 + 𝑏 for a line intercepting the vertical axis at 𝑏.
Example: “Explain how to derive the
equation 𝑦 = 3𝑥 for the line of slope 𝑚 = 3
shown below.” Solution: “I know that the
slope is the same between any two points
on a line. So I’ll choose the origin (0,0) and
a generic point on the line, calling it (𝑥,𝑦).
By choosing
a generic
point like
this I know
that any
point on the
line will fit
the equation
I come up
with. The
slope
between these two points is found by
3 =riserun
=𝑦 − 0𝑥 − 0
=𝑦𝑥
This equation can be rearranged to 𝑦 = 3𝑥.”
Example: “Explain how to derive the equation
𝑦 = 12𝑥 − 2 for the line of slope 𝑚 = 1
2 with intercept
𝑏 = −2 shown below.”
Solution: “I know the slope is 12 so I’ll calculate the
slope using the point (0,−2) and the generic point
(𝑥,𝑦). The slope between these two points is
found by 12
=riserun
=𝑦 − (−2)𝑥 − 0
=𝑦 + 2𝑥
This can be rearranged to 𝑦 + 2 = 12𝑥, which is the
same as 𝑦 = 12𝑥 − 2.”
(Adapted from CDE Transition Document 2012, Arizona 2012, and N. Carolina 249
2013) 250
251
Expressions and Equations 8.EE Analyze and solve linear equations and pairs of simultaneous linear equations. 7. Solve linear equations in one variable.
a. Give examples of linear equations in one variable with one solution, infinitely many solutions, or no solutions. Show which of these possibilities is the case by successively transforming the given equation into simpler forms, until an equation of the form x = a, a = a, or a = b results (where a and b are different numbers).
b. Solve linear equations with rational number coefficients, including equations whose solutions require expanding expressions using the distributive property and collecting like terms.
8. Analyze and solve pairs of simultaneous linear equations. a. Understand that solutions to a system of two linear equations in two variables
correspond to points of intersection of their graphs, because points of intersection satisfy both equations simultaneously.
(0,0)
(x,y)
(x,y)
(0,-2)
The Mathematics Framework was adopted by the California State Board of Education on November 6, 2013. The Mathematics Framework has not been edited for publication.

14
Domain: Expressions and Equations (EE)
Cluster: Understand the connections between proportional relationships, lines, and linear
equations
Standard: 8.EE.5. Graph proportional relationships, interpreting the unit rate as the slope of the graph. Compare two different proportional relationships represented in different
ways. For example, compare a distance-time graph to a distance-time equation to determine which of two moving objects has greater speed.
Standards for Mathematical Practice (MP): MP.1. Make sense of problems and persevere in solving them. MP.2. Reason abstractly and quantitatively. MP.3. Construct viable arguments and critique the reasoning of others. MP.4. Model with mathematics.
MP.5. Use appropriate tools strategically. MP.6. Attend to precision. MP.7. Look for and make use of structure. MP.8. Look for and express regularity in repeated reasoning.
Connections: This cluster is connected to the Grade 8 Critical Area of Focus #1, Formulating and reasoning about expressions and equations, including modeling an association in bivariate data
with a linear equation, and solving linear equations and systems of linear equaitons and Critical Area of Focus #3, Analyzing two- and three-dimensional space and figures using
distance, angle, similarity, and congruence, and understanding and applying the Pythagorean Theorem.
Explanations and Examples 8.EE.5 Students build on their work with unit rates from 6 grade and proportional relationships in 7 grade to compare graphs, tables and equations of proportional relationships. Students identify
the unit rate (or slope) in graphs, tables and equations to compare two or more proportional relationships.
Using graphs of experiences that are familiar to students increases accessibility and supports understanding
and interpretation of proportional relationship. Students are expected to both sketch and interpret graphs.
Example:
Compare the scenarios to determine which represents a greater speed. Include a description of each
scenario including the unit rates in your explanation.
Scenario 1: Scenario 2:
y = 50x x is time in hours y is distance in miles
15
Instructional Strategies
This cluster focuses on extending the understanding of ratios and proportions. Unit rates have been explored in Grade 6 as the comparison of two different quantities with the second unit a unit of one, (unit rate). In seventh grade unit rates were expanded to complex fractions and percents
through solving multistep problems such as: discounts, interest, taxes, tips, and percent of increase or decrease. Proportional relationships were applied in scale drawings, and students
should have developed an informal understanding that the steepness of the graph is the slope or unit rate. Now unit rates are addressed formally in graphical representations, algebraic equations, and geometry through similar triangles.
Distance time problems are notorious in mathematics. In this cluster, they serve the purpose of illustrating how the rates of two objects can be represented, analyzed and described in different
ways: graphically and algebraically. Emphasize the creation of representative graphs and the meaning of various points. Then compare the same information when represented in an equation. By using coordinate grids and various sets of three similar triangles, students can prove that the
slopes of the corresponding sides are equal, thus making the unit rate of change equal. After proving with multiple sets of triangles, students can be led to generalize the slope to y = mx for a
line through the origin and y = mx + b for a line through the vertical axis at b. Instructional Resources/Tools Carnegie Math™
graphing calculators SMART™ technology with software emulator
National Library of Virtual Manipulatives (NLVM)©, The National Council of Teachers of Mathematics, Illuminations Annenberg™ video tutorials, www.nsdl.org
8.EE.5

16
Domain: Expressions and Equations
Cluster: Understand the connections between proportional relationships, lines, and linear equations.
Standard: 8.EE.6. Use similar triangles to explain why the slope m is the same between any two distinct points on a non-vertical line in the coordinate plane; derive the equation y = mx for a line through the origin and the equation y = mx + b for a line intercepting the vertical axis at b.
Standards for Mathematical Practice (MP): MP.2. Reason abstractly and quantitatively. MP.3. Construct viable arguments and critique the reasoning of others. MP.4. Model with mathematics. MP.5. Use appropriate tools strategically. MP.7. Look for and make use of structure. MP.8. Look for and express regularity in repeated reasoning.
Connections: See 8.EE.5.
Explanations and Examples 8.EE.6 Triangles are similar when there is a constant rate of proportion between them. Using a graph, students
construct triangles between two points on a line and compare the sides to understand that the slope (ratio of rise
to run) is the same between any two points on a line. The triangle between A and B has a vertical height of 2 and a horizontal length of 3. The triangle between B and
C has a vertical height of 4 and a horizontal length of 6. The simplified ratio of the vertical height to the
horizontal length of both triangles is 2 to 3, which also represents a slope of 2/3for the line. Students write equations in the form y = mx for lines going through the origin, recognizing that m represents the
slope of the line. Students write equations in the form y = mx + b for lines not passing through the origin,
recognizing that m represents the slope and b represents the y-intercept. Example:
Explain why is similar to , and deduce that has the same slope as . Express each
line as an equation.
Instructional Strategies See 8.EE.5.
Common Misconceptions: See 8.EE.5.
ACB DFE AB BE
8.EE.6
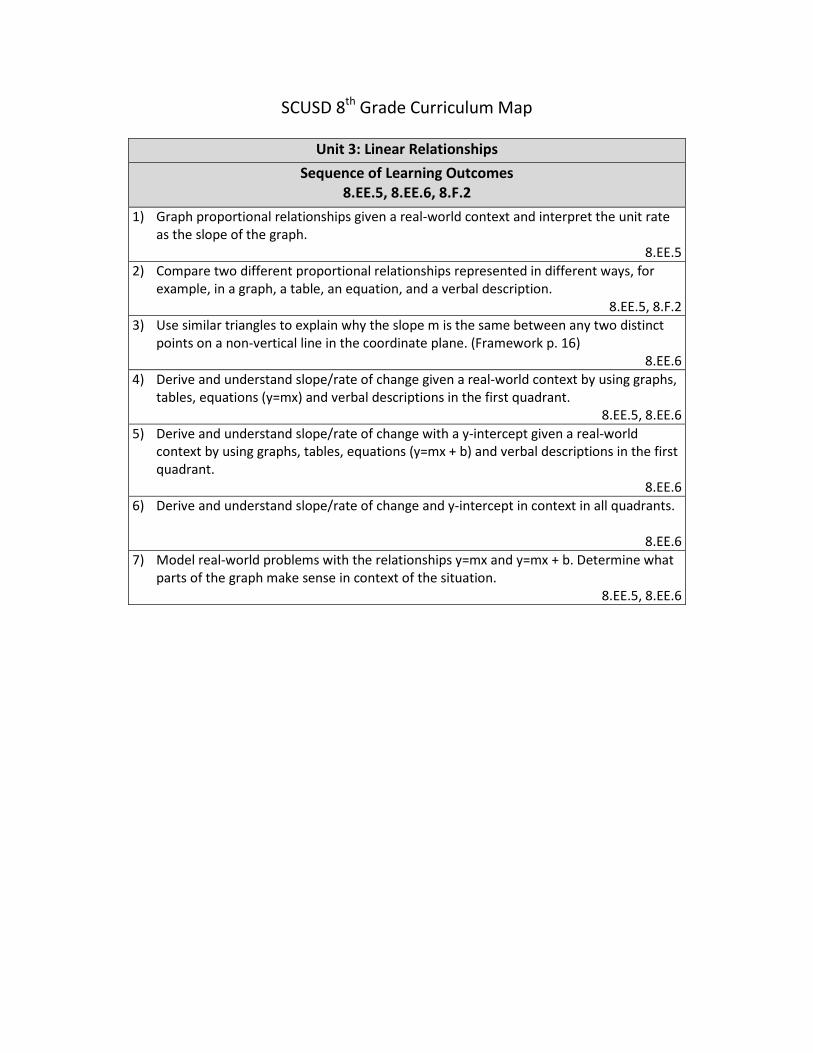
SCUSD 8th Grade Curriculum Map
Unit 3: Linear Relationships Sequence of Learning Outcomes
8.EE.5, 8.EE.6, 8.F.2 1) Graph proportional relationships given a real-world context and interpret the unit rate
as the slope of the graph. 8.EE.5
2) Compare two different proportional relationships represented in different ways, for example, in a graph, a table, an equation, and a verbal description.
8.EE.5, 8.F.2 3) Use similar triangles to explain why the slope m is the same between any two distinct
points on a non-vertical line in the coordinate plane. (Framework p. 16) 8.EE.6
4) Derive and understand slope/rate of change given a real-world context by using graphs, tables, equations (y=mx) and verbal descriptions in the first quadrant.
8.EE.5, 8.EE.6 5) Derive and understand slope/rate of change with a y-intercept given a real-world
context by using graphs, tables, equations (y=mx + b) and verbal descriptions in the first quadrant.
8.EE.6 6) Derive and understand slope/rate of change and y-intercept in context in all quadrants.
8.EE.6
7) Model real-world problems with the relationships y=mx and y=mx + b. Determine what parts of the graph make sense in context of the situation.
8.EE.5, 8.EE.6

Big Ideas Math Course 3
Chapter 4: Graphing and Writing Linear Equations Sequence of Learning Objectives
Lessons 4.1 – 4.5 Lesson 4.1 – Graphing Linear Equations In this lesson, you will
• Understand that lines represent solutions of linear equations • Graph linear equations
Preparing for Standard 8.EE.5
Lesson 4.2 – Slope of a Line In this lesson, you will
• Find slopes of lines by using two points • Find slopes of lines from tables
(Note: This lesson includes 1 activity in which students use similar triangles to understand slope, but no corresponding problems in the “Practice and Problem Solving” section.)
8.EE.6 Lesson 4.3 – Graphing Proportional Lines In this lesson, you will
• Write and graph proportional relationships (Note: This lesson includes 1 activity on comparing different proportional relationships represented in different ways, with a few corresponding practice problems.)
8.EE.5, 8.EE.6 Lesson 4.4 – Graphing Linear Equations in Slope-Intercept Form In this lesson, you will
• Find slopes and y-intercepts of graphs of linear equations • Graph linear equations written in slope-intercept form
8.EE.6 Lesson 4.5 – Graphing Linear Equations in Standard Form In this lesson, you will
• Graph linear equations written in standard form Applying Standard 8.EE.6
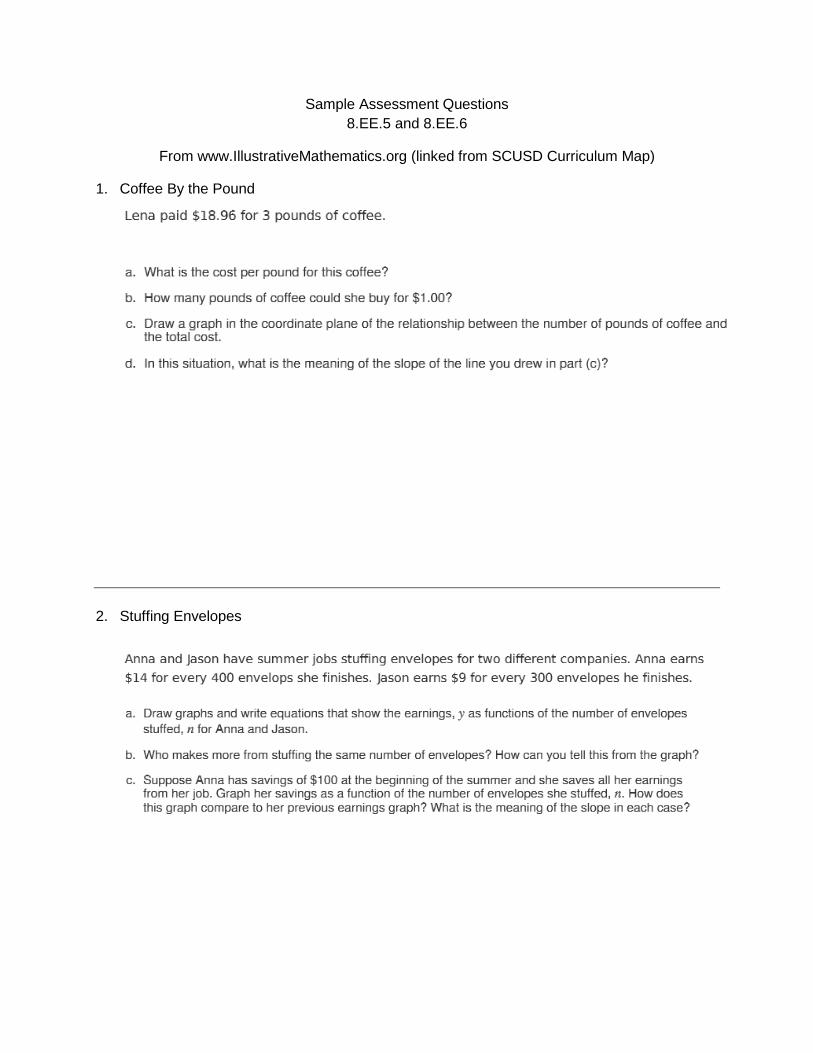
Sample Assessment Questions 8.EE.5 and 8.EE.6
From www.IllustrativeMathematics.org (linked from SCUSD Curriculum Map)
1. Coffee By the Pound
2. Stuffing Envelopes
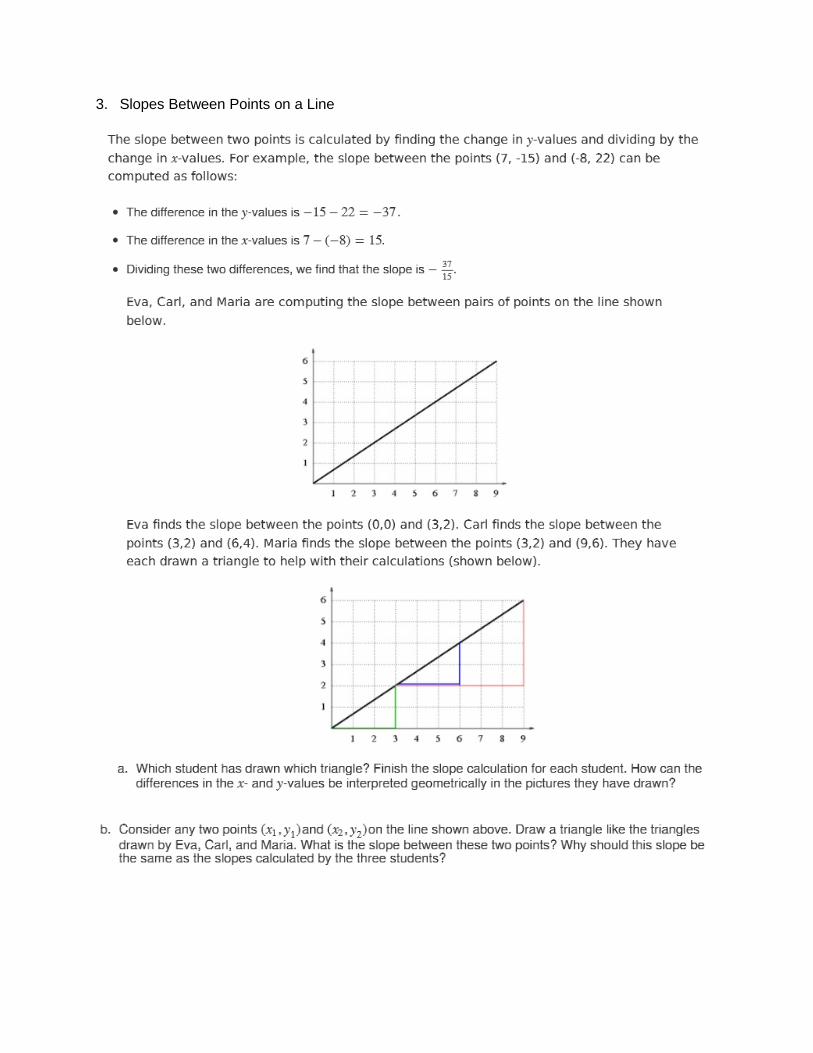
3. Slopes Between Points on a Line
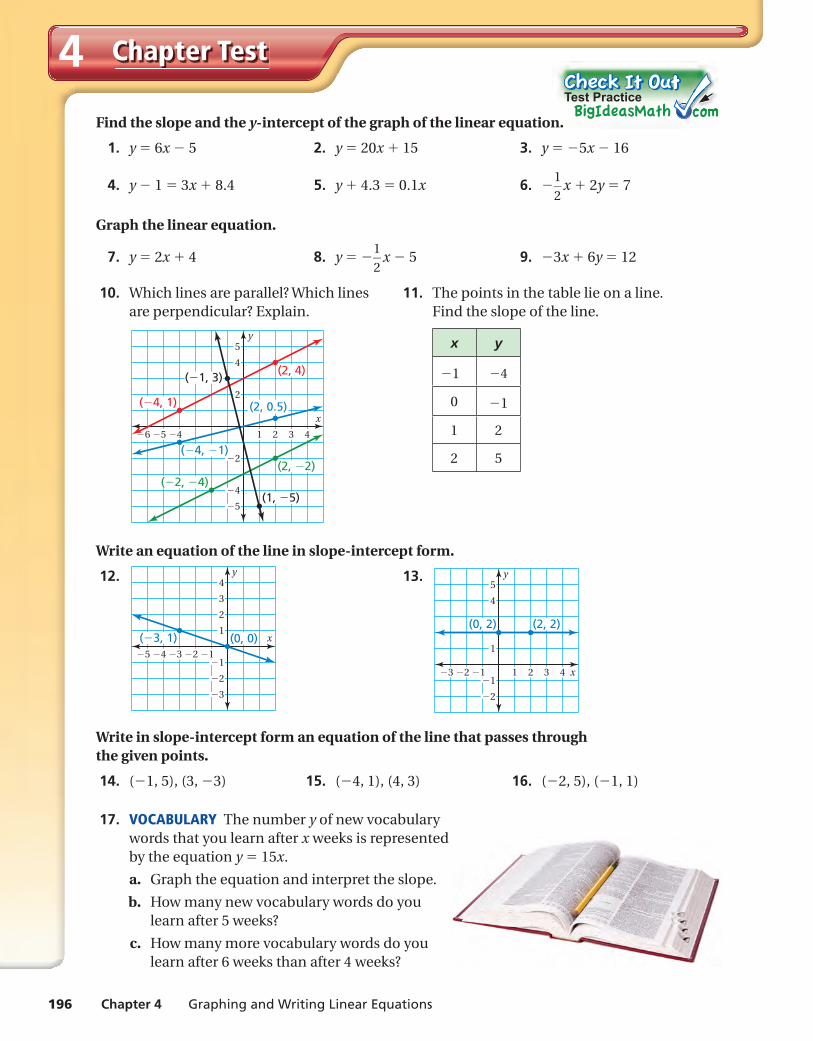
196 Chapter 4 Graphing and Writing Linear Equations
Chapter Test4Find the slope and the y-intercept of the graph of the linear equation.
1. y = 6x − 5 2. y = 20x + 15 3. y = −5x − 16
4. y − 1 = 3x + 8.4 5. y + 4.3 = 0.1x 6. − 1
— 2
x + 2y = 7
Graph the linear equation.
7. y = 2x + 4 8. y = − 1
— 2
x − 5 9. −3x + 6y = 12
10. Which lines are parallel? Which lines 11. The points in the table lie on a line. are perpendicular? Explain. Find the slope of the line.
x y
−1 −4
0 −1
1 2
2 5
2 3 41
x
y
56 4
2
4
5
5
4
2
(2, 4)
(2, 0.5)( 4, 1)
( 1, 3)
(2, 2)
(1, 5)
( 4, 1)
( 2, 4)
Write an equation of the line in slope-intercept form.
12.
x
y
12345
2
3
4
1
1
2
3
( 3, 1) (0, 0)
13.
x
y
123
4
5
1
1
2
(2, 2)(0, 2)
21 3 4
Write in slope-intercept form an equation of the line that passes through the given points.
14. (−1, 5), (3, −3) 15. (−4, 1), (4, 3) 16. (−2, 5), (−1, 1)
17. VOCABULARY The number y of new vocabulary words that you learn after x weeks is represented by the equation y = 15x.
a. Graph the equation and interpret the slope.
b. How many new vocabulary words do you learn after 5 weeks?
c. How many more vocabulary words do you learn after 6 weeks than after 4 weeks?
n.
Test Practice
MSCC3_BLUE_PE_04EC.indd 196MSCC3_BLUE_PE_04EC.indd 196 12/8/12 9:34:44 AM12/8/12 9:34:44 AM
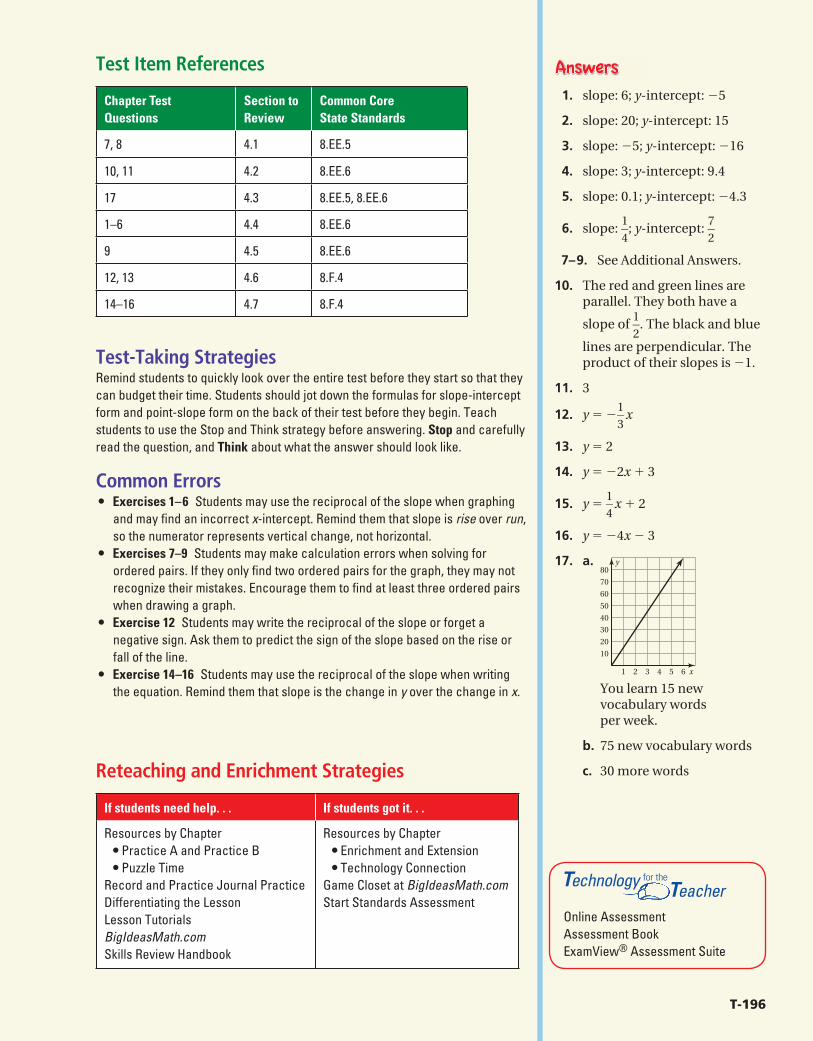
T-196
1. slope: 6; y-intercept: −5
2. slope: 20; y-intercept: 15
3. slope: −5; y-intercept: −16
4. slope: 3; y-intercept: 9.4
5. slope: 0.1; y-intercept: −4.3
6. slope: 1
— 4
; y-intercept: 7
— 2
7– 9. See Additional Answers.
10. The red and green lines are parallel. They both have a
slope of 1
— 2
. The black and blue
lines are perpendicular. The product of their slopes is − 1.
11. 3
12. y = − 1
— 3
x
13. y = 2
14. y = −2x + 3
15. y = 1
— 4
x + 2
16. y = −4x − 3
17. a. y
x1
10
20
30
40
50
60
70
80
2 3 4 5 6
You learn 15 new vocabulary words per week.
b. 75 new vocabulary words
c. 30 more wordsReteaching and Enrichment Strategies
If students need help. . . If students got it. . .
Resources by Chapter • Practice A and Practice B • Puzzle TimeRecord and Practice Journal PracticeDifferentiating the LessonLesson TutorialsBigIdeasMath.comSkills Review Handbook
Resources by Chapter • Enrichment and Extension • Technology ConnectionGame Closet at BigIdeasMath.comStart Standards Assessment
Test Item References
Chapter Test Questions
Section to Review
Common Core State Standards
7, 8 4.1 8.EE.5
10, 11 4.2 8.EE.6
17 4.3 8.EE.5, 8.EE.6
1–6 4.4 8.EE.6
9 4.5 8.EE.6
12, 13 4.6 8.F.4
14–16 4.7 8.F.4
Test-Taking StrategiesRemind students to quickly look over the entire test before they start so that they can budget their time. Students should jot down the formulas for slope-intercept form and point-slope form on the back of their test before they begin. Teach students to use the Stop and Think strategy before answering. Stop and carefully read the question, and Think about what the answer should look like.
Common Errors• Exercises 1– 6 Students may use the reciprocal of the slope when graphing
and may fi nd an incorrect x-intercept. Remind them that slope is rise over run, so the numerator represents vertical change, not horizontal.
• Exercises 7–9 Students may make calculation errors when solving for ordered pairs. If they only fi nd two ordered pairs for the graph, they may not recognize their mistakes. Encourage them to fi nd at least three ordered pairs when drawing a graph.
• Exercise 12 Students may write the reciprocal of the slope or forget a negative sign. Ask them to predict the sign of the slope based on the rise or fall of the line.
• Exercise 14–16 Students may use the reciprocal of the slope when writing the equation. Remind them that slope is the change in y over the change in x.
Online Assessment Assessment Book ExamView® Assessment Suite
Technology Teacherfor theogy
MSCC3_Blue_TE_04EC.indd 196MSCC3_Blue_TE_04EC.indd 196 2/12/13 2:45:08 PM2/12/13 2:45:08 PM


![Curriculum Map - scusd-mathscusd-math.wikispaces.com/file/view/Grade 1 CM... · Web viewSCUSD Curriculum MapGrade [Enter Grade] Mathematics. SCUSD Curriculum Map-Lasted Updated](https://img.dokumen.tips/doc/110x75/5a725c0f7f8b9a98538d7ceb/curriculum-map-scusd-mathscusd-mathwikispacescomfileviewgrade-1-cmdoc.jpg)