Embed Size (px)
Citation preview
Application: 15-09-001 (U 39 M) Exhibit No.: (PG&E-15) Date: November 20, 2015 Witness(es): Shelly J. Sharp
PACIFIC GAS AND ELECTRIC COMPANY
2017 GENERAL RATE CASE
SUPPLEMENTAL TESTIMONY
EXHIBIT (PG&E-15)
STATUS UPDATES TO LIBERTY AND CYCLA RECOMMENDATIONS SPECIFIED IN RATE CASE PLAN OIR DECISION 15-11-005
(PG&E-15)
PACIFIC GAS AND ELECTRIC COMPANY
SUPPLEMENTAL TESTIMONY IN RESPONSE TO RATE CASE
PLAN OIR DECISION 15-11-005
(PG&E-15)
-i-
PACIFIC GAS AND ELECTRIC COMPANY SUPPLEMENTAL TESTIMONY IN RESPONSE TO RATE CASE PLAN OIR
DECISION 15-11-005
TABLE OF CONTENTS
A. Introduction .......................................................................................................... 1
B. PG&E’s Status Report on the Liberty and Cycla Recommendations Included in OP 1 of D.15-11-005 ......................................................................... 1
1. Cycla Recommendation #5 – Establish a monitoring program to track progress in implementing activities funded through 2014 GRC deliberation. .................................................................................................. 2
2. Cycla Recommendation #6 – Work together with the Pipeline and Hazardous Materials Safety Administration (PHMSA), other state safety regulators, and the pipeline industry to promote advancements in pipeline system risk modeling. .................................................................. 3
3. Cycla Recommendation #7 – Work together with PHMSA, other state safety regulators and the pipeline industry to promote exchanges of information on industry best practices that have demonstrated superior impact on safety performance. ........................................................ 4
4. Liberty Recommendation #5 – Power Generation should modify the planning process in the future to: (a) provide allowances for new and carryover work and (b) provide the list of projects that are proposed to be deferred if less than requested funding is granted by the Commission. ................................................................................................. 7
5. Liberty Recommendation #8 – Executive sponsorship of risk management within the responsibility of the current incumbent would be enhanced by changing his reporting from the Chief Financial Officer to the Chief Executive Officer (CEO). ................................................ 8
6. Liberty Recommendation #9 – The corporate risk organization would be significantly enhanced with the addition of a person with long and senior utility operating experience. ................................................................ 9
7. Liberty Recommendation #10 – PG&E needs to recognize that the effective implementation of the program requires an inducement of culture change in how the Company assesses and uses risk considerations and a sense of greater urgency in moving toward its expected steady state. ................................................................................ 10
8. Liberty Recommendation #11 – PG&E should consider the addition of an “infrastructure sustainability risk” to its enterprise risks. For example: “The risk that infrastructure deteriorates (due to age and/or

(PG&E-15)
PACIFIC GAS AND ELECTRIC COMPANY SUPPLEMENTAL TESTIMONY IN RESPONSE TO RATE CASE PLAN OIR
DECISION 15-11-005
TABLE OF CONTENTS (CONTINUED)
-ii-
other factors) at a pace and to an extent that makes future recovery prohibitively expensive.” .............................................................................. 12
a. Exhibit (PG&E-3), Gas Distribution ....................................................... 13
b. Exhibit (PG&E-4), Electric Distribution .................................................. 14
c. Exhibit (PG&E-5), Energy Supply ......................................................... 15
d. Other Efforts to Address Infrastructure Sustainability ........................... 16
Appendix A – Key Programs and Projects to Address Infrastructure Sustainability in PG&E’s 2017 General Rate Case Forecast
(PG&E-15)
-1-
PACIFIC GAS AND ELECTRIC COMPANY 1
SUPPLEMENTAL TESTIMONY IN RESPONSE TO RATE CASE PLAN 2
OIR DECISION 15-11-005 3
A. Introduction 4
On November 5, 2015, the California Public Utilities Commission (CPUC or 5
Commission) issued Decision (D.) 15-11-005 in the Rate Case Plan Order 6
Instituting Rulemaking (OIR). This decision directed Pacific Gas and Electric 7
Company (PG&E or the Company) to consider additional testimony in its 8
2017 General Rate Case (GRC) to address certain recommendations made by 9
the Liberty Consulting Group (Liberty)1 and the Cycla Corporation (Cycla)2 in 10
PG&E’s 2014 GRC. Specifically, Ordering Paragraph (OP) 1 of 11
D.15-11-005 states: 12
To the extent Pacific Gas and Electric Company (PG&E) has not already 13
addressed certain of the recommendations contained in the consultants’ 14
reports, PG&E shall supplement its 2017 general rate case application 15
(Application 15-09-001) to include explanations on how it plans to, or how 16
it has addressed, the recommendations referenced in this decision as 17
Liberty recommendations 5, 8, 9, 10 and 11, and Cycla recommendations 18
5, 6 and 7. 19
PG&E’s September 1, 2015 testimony addressed the Liberty and Cycla 20
recommendations in Exhibit (PG&E-1), Chapter 1, Appendix A. Nonetheless, 21
PG&E has prepared this supplemental testimony to provide a status report on 22
PG&E’s response to the particular Liberty and Cycla recommendations cited in 23
OP 1, as well as additional information regarding how PG&E’s 2017 GRC 24
forecast addresses the infrastructure sustainability issue raised in Liberty’s 25
recommendation #11. 26
B. PG&E’s Status Report on the Liberty and Cycla Recommendations 27
Included in OP 1 of D.15-11-005 28
OP 1 of D.15-11-005 identified eight recommendations made by Liberty and 29
Cycla in PG&E’s 2014 GRC. The following sections address each of these 30
recommendations. 31
1 May 6, 2013 “Study of Risk Assessment and PG&E’s GRC.” References throughout this testimony to the Liberty report are to this report.
2 May 16, 2013 “Evaluation of PG&E’s 2014 Gas Distribution GRC Filing.” References throughout this testimony to the Cycla report are to this report.

(PG&E-15)
-2-
1. Cycla Recommendation #5 – Establish a monitoring program to track 1
progress in implementing activities funded through 2014 GRC 2
deliberation.3 3
As PG&E indicated in its 2014 GRC rebuttal testimony4 and PG&E’s 4
2017 GRC opening testimony, PG&E supports Cycla’s recommendation to 5
track progress in implementing activities funded through the GRC. The 6
2014 GRC decision adopted PG&E’s proposal to continue producing an 7
annual budget report to track the progress of activities funded in the GRC 8
and to explain areas where there is a variance between what was adopted 9
and what the Company implemented. 10
Workpapers WP 1-1 through WP 1-268 in PG&E’s 2017 GRC5 provide 11
PG&E’s annual budget compliance reports that track the progress on 12
activities funded in the 2014 GRC. As indicated in Exhibit (PG&E-2), 13
Chapter 1, PG&E will provide its report for 2015 expenditures in March 2016 14
through supplemental workpapers once 2015 recorded information is 15
available. PG&E has proposed to continue this annual budget reporting for 16
the 2017 GRC cycle.6 17
In addition to the annual budget report, PG&E has been filing semi-18
annual Gas Distribution Pipeline Safety Reports since September 2011 in 19
compliance with the 2011 GRC decision, D.11-05-018. PG&E has filed 20
nine semi-annual gas safety reports, including for the 2014 GRC period, that 21
describe in detail the funding for, and activities related to, gas distribution 22
safety and reliability. 23
3 Cycla, p. vii.
4 A.12-11-009, Exhibit (PG&E-16), Chapter 2, Table 2-2.
5 A.15-09-001, Exhibit (PG&E-1), Chapter 1 Workpapers.
6 Exhibit (PG&E-2), Chapter 1, p. 1-2.

(PG&E-15)
-3-
2. Cycla Recommendation #6 – Work together with the Pipeline and 1
Hazardous Materials Safety Administration (PHMSA), other state safety 2
regulators, and the pipeline industry to promote advancements in 3
pipeline system risk modeling.7 4
As PG&E indicated in its 2014 GRC rebuttal testimony and PG&E’s 5
2017 GRC opening testimony, PG&E supports this recommendation to 6
collaborate with PHMSA, other regulators and the pipeline industry to 7
advance pipeline risk modeling. 8
PG&E has participated in various benchmarking and industry 9
conferences—both inside and outside the natural gas industry—to advance 10
its knowledge of pipeline system safety. Some of these activities have 11
specifically focused on risk modeling. PG&E has also been working across 12
the natural gas pipeline industry to explore and leverage innovation in 13
developing methodologies to better inform risk modeling, including a 14
NYSEARCH project focused on interactive threats for gas transmission 15
pipelines. Further, Gas Operations is working with risk experts from 16
academia to leverage additional tools and techniques in risk modeling that 17
use simulation to better account for uncertainty and improve 18
decision-making. 19
PG&E is one of the first utilities in the nation to obtain Publicly Available 20
Specification (PAS) 55 and International Organization for 21
Standardization 55001 certification and PG&E is attempting to be the first 22
public utility in the world to achieve Responsible Care 14001 (RC 14001) 23
certification. Because of PG&E’s achievements and leadership in asset 24
management and improving safety performance, PG&E’s President of Gas 25
was asked to sit on the American Petroleum Institute (API) Committee 26
charged with developing an industry-wide Safety Management System. The 27
Committee is working with the National Transportation Safety Board 28
(NTSB), PHMSA, states and other industry representatives, in response to 29
NTSB recommendations resulting from the Enbridge pipeline incident. The 30
Committee’s efforts led to the development of Recommended Practice 1173, 31
released on July 8, 2015, to help operators create a framework for 32
7 Cycla, p. vii.
(PG&E-15)
-4-
developing a comprehensive, process-oriented approach to safety, 1
emphasizing continual assessment and improvement.8 PG&E has been 2
certified by the Lloyds Register for Certification of Compliance under API 3
Recommended Practice 1173 for the operations of gas transmission and 4
distribution pipeline assets. PG&E is the first company to earn this 5
distinction under the new recommended practice. 6
In addition, PG&E participated in a workshop hosted by PHMSA on 7
September 9-10, 2015, regarding risk modeling. This workshop was held in 8
response to the NTSB’s Safety Study regarding Transmission Integrity 9
Management. Representatives from other California operators, as well as 10
the CPUC, were in attendance. Probabilistic Risk Assessment (PRA) was 11
discussed as a tool to advance system risk modeling at the workshop.9 12
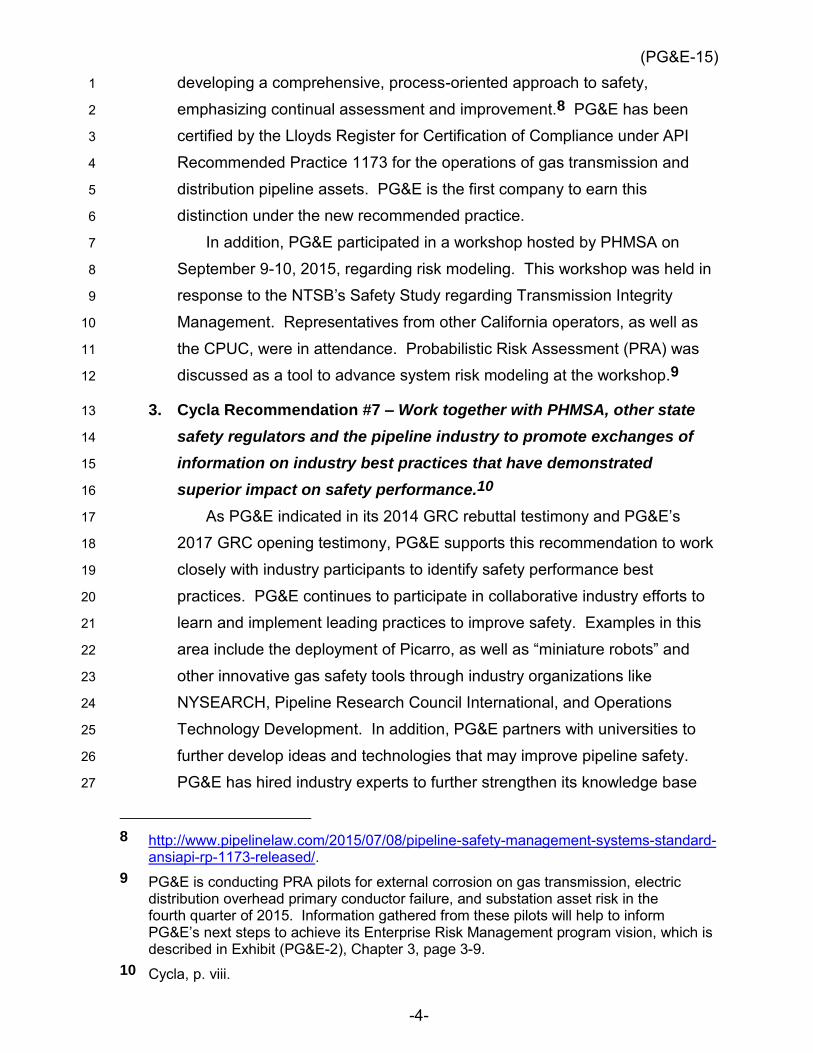
3. Cycla Recommendation #7 – Work together with PHMSA, other state 13
safety regulators and the pipeline industry to promote exchanges of 14
information on industry best practices that have demonstrated 15
superior impact on safety performance.10 16
As PG&E indicated in its 2014 GRC rebuttal testimony and PG&E’s 17
2017 GRC opening testimony, PG&E supports this recommendation to work 18
closely with industry participants to identify safety performance best 19
practices. PG&E continues to participate in collaborative industry efforts to 20
learn and implement leading practices to improve safety. Examples in this 21
area include the deployment of Picarro, as well as “miniature robots” and 22
other innovative gas safety tools through industry organizations like 23
NYSEARCH, Pipeline Research Council International, and Operations 24
Technology Development. In addition, PG&E partners with universities to 25
further develop ideas and technologies that may improve pipeline safety. 26
PG&E has hired industry experts to further strengthen its knowledge base 27
8 http://www.pipelinelaw.com/2015/07/08/pipeline-safety-management-systems-standard-ansiapi-rp-1173-released/.
9 PG&E is conducting PRA pilots for external corrosion on gas transmission, electric distribution overhead primary conductor failure, and substation asset risk in the fourth quarter of 2015. Information gathered from these pilots will help to inform PG&E’s next steps to achieve its Enterprise Risk Management program vision, which is described in Exhibit (PG&E-2), Chapter 3, page 3-9.
10 Cycla, p. viii.

(PG&E-15)
-5-
and actively shares experiences and best practices in the Commission’s 1
ongoing Safety Model Assessment Proceeding. 2
PG&E’s risk team and other utilities also meet regularly to discuss areas 3
of best practice and to work toward greater uniformity based on best 4
practices. An example of PG&E’s efforts to collaborate with others to 5
promote exchange of information on industry best practice is the risk 6
workshop PG&E and the Sempra utilities co-hosted for risk managers in the 7
utility and other industries to share best practices in June 2015. 8
Exhibit (PG&E-3), Chapter 1 provides an overview of Gas Operations’ 9
benchmarking efforts and includes a list of industry best practices 10
incorporated in the 2017 GRC testimony.11 Gas Operations’ benchmarking 11
efforts include participation in annual association best practices 12
benchmarking, such as the American Gas Association (AGA) and Public 13
Service Electric and Gas Company (PSE&G), roundtable events and 14
conferences organized by AGA, the Interstate Natural Gas Association of 15
America, the Southern Gas Association, NACE International, and others, as 16
well as benchmarking with individual companies. Gas Operations has also 17
asked various industry experts to perform an independent review and 18
evaluation of the proposed 2016 Risk Registers for each of the asset 19
families. The experts ensured that the relative rankings of Gas Operations’ 20
risks were consistent with industry incidents and that no risks were missing. 21
Most discussions with the industry experts and Gas Operations were around 22
the potential safety impacts of the asset failures. 23
Although this Cycla recommendation was addressed to Gas Operations, 24
Electric Operations also engages in best practices reviews related to safety. 25
For example, PG&E was instrumental in advocating for PSE&G member 26
utilities to benchmark wires down data. Beginning in 2012, PSE&G began 27
surveying utilities concerning the number of instances where an electric 28
transmission or primary distribution conductor is broken and falls from its 29
intended position to rest on the ground or a foreign object. PG&E continues 30
to work with PSE&G peer panel members to include more utilities in the 31
benchmark survey and ensure consistent measurement and reporting. In 32
11 Exhibit (PG&E-3), Chapter 1, pp. 1-15 through 1-16, and p. 1-19, Table 1-2.

(PG&E-15)
-6-
addition to wires down benchmarking, PG&E has also engaged in 1
benchmarking with the PSE&G peer utilities regarding the ability to respond 2
to potential hazards learned of through 911 calls. PG&E defines the metric 3
as the percent of time PG&E personnel respond (are on-site) within one 4
hour after receiving a 911 electric-related call, with on-site defined as 5
arriving at the premises where the 911 agency personnel are standing by. 6
PG&E is expected to achieve first quartile performance in this metric in 7
2015, and is driving further improvements in 2016. To further drive 8
performance in this area PG&E has begun measuring the percent of calls 9
responded to within 30 minutes. This tracking metric aligns with industry 10
best practice, as some of the best performers in this metric measure 11
response within 30 minutes. 12
Energy Supply is also active in industry benchmarking forums and 13
incorporates best practices into its operations. The Diablo Canyon Power 14
Plant (DCPP) is a member company of the Institute of Nuclear Power 15
Operations (INPO). INPO’s mission is to promote the highest levels of 16
safety and reliability in the operation of commercial nuclear power plants. 17
This is achieved by: 18
Establishing performance objectives, criteria and guidelines for the 19
nuclear power industry 20
Conducting regular detailed evaluations of nuclear power plants 21
Providing assistance to help nuclear power plants continually improve 22
their performance 23
Similarly, the Power Generation organization within Energy Supply has 24
benchmarked best safety practices through participation in several industry 25
groups such as the Electric Utility Cost Group, Center for Energy 26
Advancement through Technological Innovation, National Hydropower 27
Association, United States Society on Dams, Utility Public Safety Alliance, 28
and the Northwest Hydroelectric Association Operators Forum. Power 29
Generation has also specifically benchmarked dam safety with Southern 30
California Edison Company, PacifiCorp, and the East Bay Municipal 31
Utility District. 32
PG&E’s non-operating lines of business (LOBs) also engage in safety 33
benchmarking efforts. For example, the Workforce Health Department has 34

(PG&E-15)
-7-
benchmarked wellness and work conditioning programs with other large 1
employers and developed programs that will promote improved safety 2
through reduction in the number and severity of workplace injuries. The 3
Early Symptom Intervention and Work Conditioning programs target PG&E’s 4
physical field workforce.12 5
4. Liberty Recommendation #5 – Power Generation should modify the 6
planning process in the future to: (a) provide allowances for new and 7
carryover work and (b) provide the list of projects that are proposed to 8
be deferred if less than requested funding is granted by the 9
Commission.13 10
As described in PG&E’s September 1, 2015 testimony,14 Power 11
Generation updates its long-term plan three times a year to reflect newly 12
identified work, updates to project costs and schedules, and/or changes in 13
priorities or budgets. Additional information on Power Generation’s planning 14
process is discussed in Section E.3 of Exhibit (PG&E-5), Chapter 4. Details 15
for Parts a and b of Liberty’s Recommendation #5 are also incorporated in 16
PG&E’s September 1, 2015 testimony as follows: 17
(a) As described in the Energy Supply exhibit,15 Power Generation included 18
specific line items in its 2017 expense and capital forecasts for 19
emergent work. PG&E expects emergent capital work to result from 20
storms or other force majeure events in 2017. PG&E’s hydro facilities 21
are susceptible to damage during severe weather, seismic events, and 22
wildfires. Historically, such events have occurred annually but no 23
specific funding was set aside to repair or replace damaged facilities. 24
As a result, this emergent work has displaced other planned and needed 25
work. PG&E is proposing to establish a budget for emergent work going 26
forward so that other work can proceed as planned. 27
(b) All of the proposed work included in Power Generation’s expense and 28
capital forecasts was evaluated using the Risk Informed Budget 29
12 Exhibit (PG&E-8), Chapter 5, pp. 5-6 and 5-7.
13 Liberty, p. S-5.
14 Exhibit (PG&E-5), Chapter 4, p. 4-79.
15 Exhibit (PG&E-5), Chapter 4, p. 4-47, lines 22-29, and p. 4-58, lines 16-25.

(PG&E-15)
-8-
Allocation (RIBA) risk-scoring methodology described in Exhibit 1
(PG&E-2), Chapter 4. These scores were then used by management, 2
(along with other key data) to prioritize proposed work. Power 3
Generation provided a list of prioritized expense and capital work 4
activities for 2017 in the workpapers supporting Chapter 2 of the Energy 5
Supply exhibit.16 Power Generation will use this list of prioritized work 6
to determine what work would be rescheduled if its funding request is 7
not fully granted. 8
5. Liberty Recommendation #8 – Executive sponsorship of risk 9
management within the responsibility of the current incumbent would 10
be enhanced by changing his reporting from the Chief Financial Officer 11
to the Chief Executive Officer (CEO).17 12
As PG&E indicated in Attachment A of Exhibit (PG&E-1), Chapter 1, 13
while PG&E’s Chief Risk Officer does not directly report to the CEO, the 14
Enterprise and Operational Risk Management (EORM) Program is overseen 15
by the Audit Committee of the Board of Directors. Oversight of specific 16
enterprise-level risks is addressed by the various Board committees, 17
primarily the Nuclear, Operations, and Safety Committee. Senior 18
management also reviews progress to plan on risk management activities at 19
monthly Business Plan Review meetings, which are chaired by the 20
company’s Presidents and attended by the Chief Executive Officer. In 21
addition, each of the LOBs has a Risk and Compliance Committee (RCC) 22
chaired by a Senior Officer and includes the senior leadership team of the 23
LOB. For example, the Gas Operations RCC is chaired by PG&E’s Gas 24
Operations Senior Vice President and includes the President of the Gas 25
organization, all the Gas Operations Officers and Senior Directors. 26
Additional discussions on PG&E’s risk organization and risk 27
management framework are provided in the following chapters in PG&E’s 28
September 1, 2015 testimony: 29
Exhibit (PG&E-2), Chapter 3, Section B.b and workpapers WP 3-11 30
to 3-13; 31
16 Exhibit (PG&E-5), Chapter 2, workpapers WP 2-25 through WP 2-38.
17 Liberty, p. S-7.

(PG&E-15)
-9-
Exhibit (PG&E-2), Chapter 5, Section 5.3; 1
Exhibit (PG&E-3), Chapter 3; 2
Exhibit (PG&E-4), Chapter 2; and 3
Exhibit (PG&E-5), Chapter 2. 4
6. Liberty Recommendation #9 – The corporate risk organization would 5
be significantly enhanced with the addition of a person with long and 6
senior utility operating experience.18 7
As PG&E indicated in its 2014 GRC rebuttal testimony and PG&E’s 8
2017 GRC opening testimony, PG&E continues to support this 9
recommendation to staff the risk organization with individuals with utility 10
operating experience. PG&E has established a new EORM group within the 11
Corporate Risk organization. The current Senior Manager of the group has 12
approximately 15 years of experience working in PG&E’s Electric 13
Operations organization. Other members of the team have a combined 80+ 14
years of experience in utility operations, risk management, compliance 15
and auditing. 16
The EORM program is discussed in Exhibit (PG&E-2), Chapter 3 and 17
workpapers WP 3-11 to 3-13. Figure 1 is the organization structure for 18
PG&E’s EORM program with additional detail on the EORM team members’ 19
expertise and tenure in the utility business. 20
18 Liberty, p. S-7.

(PG&E-15)
-10-
FIGURE 1
ORGANIZATION CHART FOR EMPLOYEES WITHIN THE EORM TEAM
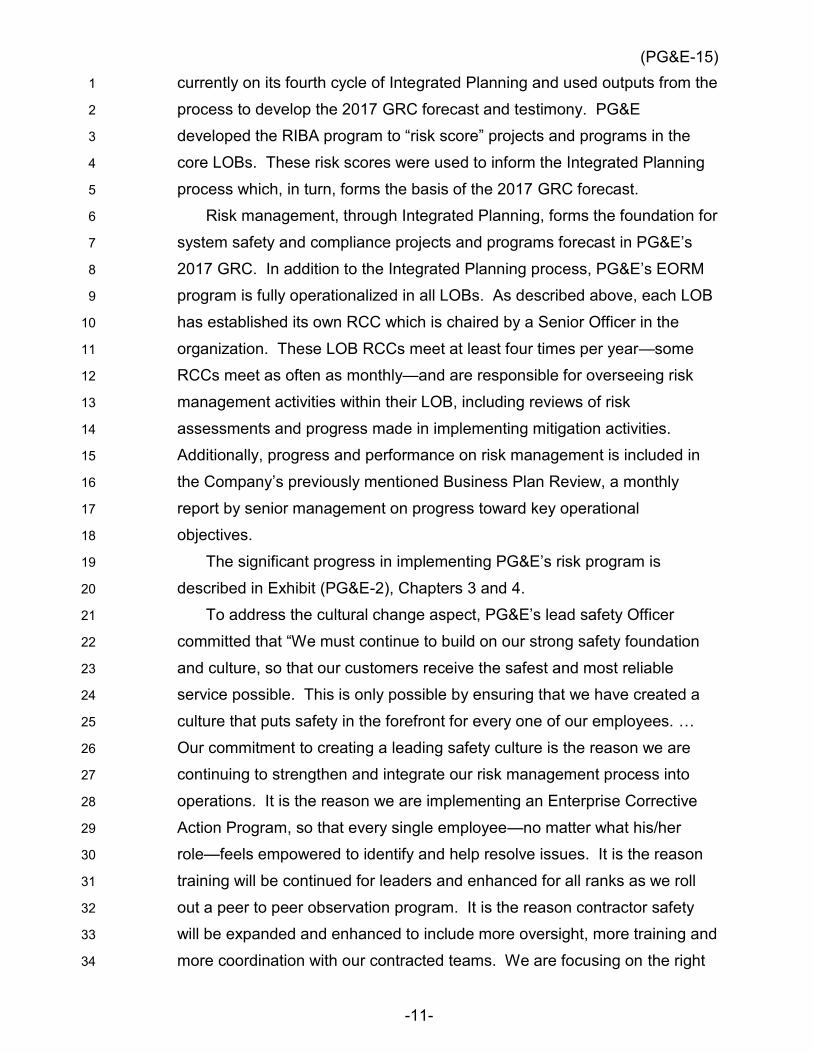
7. Liberty Recommendation #10 – PG&E needs to recognize that the 1
effective implementation of the program requires an inducement of 2
culture change in how the Company assesses and uses risk 3
considerations and a sense of greater urgency in moving toward its 4
expected steady state.19 5
As PG&E indicated in its 2014 GRC rebuttal testimony and PG&E’s 6
2017 GRC opening testimony, PG&E continues to support this 7
recommendation. 8
PG&E began implementing its expanded Integrated Planning process in 9
2012. The process includes a Company evaluation of risks and compliance 10
requirements (Session D), which then informs the Company’s strategy 11
discussions (Session 1) and resource allocation (Session 2). PG&E is 12
19 Liberty, p. S-7.
(PG&E-15)
-11-
currently on its fourth cycle of Integrated Planning and used outputs from the 1
process to develop the 2017 GRC forecast and testimony. PG&E 2
developed the RIBA program to “risk score” projects and programs in the 3
core LOBs. These risk scores were used to inform the Integrated Planning 4
process which, in turn, forms the basis of the 2017 GRC forecast. 5
Risk management, through Integrated Planning, forms the foundation for 6
system safety and compliance projects and programs forecast in PG&E’s 7
2017 GRC. In addition to the Integrated Planning process, PG&E’s EORM 8
program is fully operationalized in all LOBs. As described above, each LOB 9
has established its own RCC which is chaired by a Senior Officer in the 10
organization. These LOB RCCs meet at least four times per year—some 11
RCCs meet as often as monthly—and are responsible for overseeing risk 12
management activities within their LOB, including reviews of risk 13
assessments and progress made in implementing mitigation activities. 14
Additionally, progress and performance on risk management is included in 15
the Company’s previously mentioned Business Plan Review, a monthly 16
report by senior management on progress toward key operational 17
objectives. 18
The significant progress in implementing PG&E’s risk program is 19
described in Exhibit (PG&E-2), Chapters 3 and 4. 20
To address the cultural change aspect, PG&E’s lead safety Officer 21
committed that “We must continue to build on our strong safety foundation 22
and culture, so that our customers receive the safest and most reliable 23
service possible. This is only possible by ensuring that we have created a 24
culture that puts safety in the forefront for every one of our employees. … 25
Our commitment to creating a leading safety culture is the reason we are 26
continuing to strengthen and integrate our risk management process into 27
operations. It is the reason we are implementing an Enterprise Corrective 28
Action Program, so that every single employee—no matter what his/her 29
role—feels empowered to identify and help resolve issues. It is the reason 30
training will be continued for leaders and enhanced for all ranks as we roll 31
out a peer to peer observation program. It is the reason contractor safety 32
will be expanded and enhanced to include more oversight, more training and 33
more coordination with our contracted teams. We are focusing on the right 34
(PG&E-15)
-12-
things and encouraging the right behaviors. All of this work will continue to 1
drive a stronger safety culture, delivering safety results for our customers, 2
our employees and our contractors.”20 To this end, PG&E has partnered 3
with a world-wide leading workforce safety company—Behavioral Science 4
Technology (BST)—to develop PG&E’s new Safety Culture program. PG&E 5
leadership have attended conferences with other BST members to 6
benchmark and learn about best practices in the Safety Culture arena. 7
PG&E has also established a Safety Culture team to support the goal of 8
building within PG&E a workforce culture where all employees care about 9
and set high safety standards for themselves and for one another, and have 10
the knowledge, skills and desire to complete each task safely. See 11
Exhibit (PG&E-7), Chapter 2 for additional information on PG&E’s Safety 12
Culture team. 13
8. Liberty Recommendation #11 – PG&E should consider the addition of 14
an “infrastructure sustainability risk” to its enterprise risks. For 15
example: “The risk that infrastructure deteriorates (due to age and/or 16
other factors) at a pace and to an extent that makes future recovery 17
prohibitively expensive.”21 18
As PG&E indicated in its 2014 GRC rebuttal testimony and PG&E’s 19
2017 GRC opening testimony, although PG&E did not explicitly add an 20
“infrastructure sustainability risk” to its risk register, PG&E has been 21
addressing aging infrastructure issues for many years. Aging infrastructure 22
is addressed in PG&E’s risk management process through the evaluation of 23
asset condition, which is a key input for the process. Risk Registers in the 24
operating units are dominated by asset-related risks. Gas Operations 25
maintains its PAS 55 certification and uses the PAS 55 standards to 26
manage its physical assets. Electric Operations is developing the System 27
Tool for Asset Risk and Generation Risk Information Tool to facilitate the 28
20 Exhibit (PG&E-2), Chapter 2.
21 Liberty, p. S-7.
(PG&E-15)
-13-
management of asset-related risks for electric distribution and power 1
generation, respectively.22 2
The Chief Risk and Audit Officer is leading an assessment of natural 3
hazards that could also impact the sustainability of PG&E’s assets. This 4
effort is a multi-year, multi-department initiative to evaluate critical assets 5
and review climate change and geo sciences information to determine 6
assets that may be vulnerable to natural hazards such as earthquakes, 7
floods, sea-level rise, tsunamis etc. 8
Many of the programs implemented through PG&E’s Integrated 9
Planning process will address the risk of assets deteriorating due to age or 10
other factors. In PG&E’s 2017 GRC, PG&E has forecast programs and 11
projects that address aging infrastructure. Appendix A to this exhibit 12
includes a summary of key programs and projects by exhibit, chapter and 13
Major Work Category. Many of the programs and projects included in 14
Appendix A serve multiple purposes and address more than aging 15
infrastructure. Below is a high-level summary of PG&E’s approach and a 16
few key programs and projects by exhibit. 17
a. Exhibit (PG&E-3), Gas Distribution 18
Gas Operations maintains its PAS 55 certification and uses the PAS 19
55 standards to manage its physical assets. This includes optimized 20
and whole-life management of its physical assets. Through this life 21
cycle management of its assets and through the assessment and 22
mitigation of asset-related risks, Gas Operations addresses the 23
“infrastructure sustainability” risk. The Gas Pipeline Replacement 24
Program (GPRP), Aldyl-A Main Replacement Program and the 25
Reliability Main Replacement Program are prime examples. The GPRP 26
focuses on cast iron and pre-1940 steel pipeline and the Aldyl A Plastic 27
Replacement Program focuses on pre-1985 Aldyl A pipeline. The 28
Reliability Main Replacement Program focuses on the replacement of 29
pipeline not covered by these two programs. 30
22 PG&E has also provided detailed descriptions of PG&E’s asset management tools in its submission in the Safety Model Assessment Proceeding A.15-05-003.

(PG&E-15)
-14-
PG&E, like most utilities in the United States, is facing increasing 1
challenges with its aging infrastructure. There is no specific life 2
expectancy for any pipeline system. PG&E’s operating experience has 3
demonstrated that some pipelines may be operated up to 100 years 4
while others have life expectancies as short as 30 years. Using 5
100 years as a potential upper end of the life expectancy for legacy 6
pipelines, PG&E should be replacing on the order of 420 miles per year. 7
It is for these reasons that PG&E believes it should be systematically 8
increasing its pipeline replacement rates, to limit pipeline age while at 9
the same time managing risk and cost. 10
b. Exhibit (PG&E-4), Electric Distribution 11
As mentioned above, many of PG&E’s programs forecast in the 12
2017 GRC are intended to address aging infrastructure, along with other 13
risks. Most of PG&E’s electric distribution asset replacement programs 14
will address the risk of assets deteriorating due to age or other factors in 15
some way. The Pole Asset Management Program is a prime example. 16
Failing poles can pose a risk to public safety. The key risk drivers for 17
pole failure include deterioration, as well as third-party damage, 18
structural overload or equipment fire, vegetation, and natural hazards 19
including earthquake, wind, and fire. Through the Pole Asset 20
Management Program, PG&E inspects wood poles on a regular cycle 21
for early detection of deterioration, prolongs the service lives of wood 22
poles through reapplication of preservatives and/or restoration of 23
structural strength through reinforcement, identifies poles that are 24
nearing the end of their useful service lives, and replaces wood poles as 25
they approach the end of their service lives. 26
PG&E’s electric distribution system includes approximately 27
2.48 million poles. Each year, on a continuous 10-year cycle that moves 28
geographically through the service territory, PG&E intrusively inspects 29
roughly 10 percent of the wood distribution poles installed across its 30
service territory. PG&E removes and installs an average of 31
21,000 poles per year. While not driven exclusively by the age of poles, 32
the Pole Asset Management Program is an example of an infrastructure 33

(PG&E-15)
-15-
inspection and replacement program that is performed on a continuous 1
basis so future replacement is not prohibitively expensive. 2
Similarly, the Overhead (OH) Conductor Replacement Program 3
replaces, on a systematic and continuous basis, OH conductors that 4
have deteriorated. Deteriorated OH conductors are often characterized 5
by the unraveling of individual strands of wire, spans with multiple 6
splices, third-party damage, conductor corrosion and fault pitting. This 7
deterioration can be accelerated by agricultural chemical contamination 8
or sea spray conditions. PG&E’s electric distribution system includes 9
over 113,300 circuit miles of OH conductor. PG&E plans to replace an 10
average of 425,000 circuit feet of OH conductor annually from 11
2015-2019, to improve safety and system integrity. 12
c. Exhibit (PG&E-5), Energy Supply 13
The generation functions within Energy Supply replace equipment 14
based on its condition, not strictly its age. However, the condition of the 15
equipment is generally correlated with the age of the equipment, and as 16
Energy Supply replaces equipment, it addresses the age of the 17
equipment. For example, there are a number of projects identified to 18
replace equipment within DCPP’s Equipment Reliability Initiative (ERI). 19
The ERI strives to improve performance through a set of 23 action plans 20
that address station evaluation and prioritization practices as well as 21
maintenance plans and frequencies, and equipment replacement 22
schedules and inventoried spares. The ERI helps to ensure continued 23
safety and reliability at DCPP through projects such as replacing the 24
Unit 2 Main Generator Stator, Reactor Coolant Pump motor 25
replacements, purchase of spare Rod Control Cluster Assemblies, and 26
upgrades to all the major fuel handling components. 27
Another example is the replacement of aging hydroelectric 28
generating equipment, including, for example, generator windings, 29
turbine runners, seal rings, governors, exciters, wicket gates, valves, 30
breakers, switchgear, transformers, and station batteries. Power 31
Generation has also forecast other needed capital projects to address 32
dams, reservoirs, waterways, and other hydro-related infrastructure 33
(PG&E-15)
-16-
before equipment or infrastructure failure results in higher-cost emergent 1
work or reliability issues. 2
d. Other Efforts to Address Infrastructure Sustainability 3
While the majority of programs and projects included in the forecast 4
to address infrastructure sustainability are included in the core 5
operational LOBs, there are programs in other exhibits that also address 6
infrastructure sustainability. 7
For Shared Services, there are a few key programs and projects 8
forecasted in the 2017 GRC that address infrastructure risk due to age 9
or other factors. Transportation Services’ (Exhibit (PG&E-7), Chapter 3) 10
forecast includes significant capital for lifecycle replacement of PG&E 11
vehicles. Some of these vehicles are scheduled for replacement due to 12
normal lifecycle aging, and others are being replaced due to 13
environmental compliance with California Air Resource Board 14
regulations. Real Estate (Exhibit (PG&E-7), Chapter 6) also has 15
forecasted amounts for both expense and capital to address two areas 16
tied to infrastructure sustainability: facility asset upkeep and service 17
center optimization. Facility asset upkeep work is building maintenance 18
work on our real estate assets. Work is prioritized based on the risk to 19
the Company and is validated through physical inspections of each 20
asset to determine remaining useful life. Service center optimization 21
work will consolidate and relocate service centers based on several 22
factors, with age of facility assets being one of the factors considered. 23
PG&E’s Information Technology (IT) organization has included in its 24
forecast five initiatives whose chief aim is to address the sustainability of 25
the Company’s IT infrastructure. Three of these initiatives are part of 26
the IT organization’s ongoing Core Lifecycle asset replacement 27
program, while the other two address specific instances of obsolescence 28
in PG&E’s technology infrastructure. 29
The three Core Lifecycle initiatives—(1) Network Technologies Core 30
Lifecycle, (2) Data Center Technologies Core Lifecycle, and (3) User 31
Technologies Core Lifecycle—address the overall health of IT 32
infrastructure assets across the three largest IT asset families: Network 33
Technologies, Data Center Technologies, and User Technologies. 34

(PG&E-15)
-17-
These initiatives include reactive replacements for assets that break and 1
proactive replacements or upgrades for high risk assets. PG&E 2
determines if an asset is high-risk by examining a variety of health 3
indicators, including asset age, asset performance, asset stability, 4
vendor support for the asset, and cybersecurity vulnerabilities present in 5
the asset. By regularly replacing assets that reach or surpass the end of 6
their useful service life, these initiatives help to maintain current 7
operational, reliability, and security standards for PG&E’s IT 8
infrastructure. See Exhibit (PG&E-7), Chapter 9 for further discussion of 9
these initiatives and the infrastructure assets they address. 10
The last two initiatives—(4) Data Center Network Security and 11
Consolidation and (5) Legacy Carrier Technology Migration—address 12
critical IT infrastructure that needs to be modernized outside of the 13
typical asset replacement cycle. These initiatives will upgrade specific 14
components of PG&E’s IT infrastructure that have become obsolete due 15
to growing incompatibility with evolving technology in use at PG&E and 16
in the IT industry. The Data Center Network Security and Consolidation 17
initiative aims to modernize and align outdated network technology 18
assets in PG&E data centers with current architectural and cybersecurity 19
standards. The Legacy Carrier Technology Migration initiative, on the 20
other hand, will transition PG&E off of obsolete network infrastructure 21
and services soon to be retired by the third party carriers that provide 22
them. Both of these initiatives will allow the Company to retain access 23
to IT services critical to PG&E operations. Further discussion of these 24
initiatives can be found in Exhibit (PG&E-7), Chapter 9. 25
Within the Corporate Services organizational forecasts presented in 26
the Administrative and General exhibit, PG&E’s Corporate Security 27
Department is forecasting four projects to address the aging condition of 28
security equipment and technology. These projects are discussed in 29
Exhibit (PG&E-9), Chapter 3, and consist of the Security Asset 30
Management and Lifecycle Program to upgrade and replace aging 31
security technology and equipment in a planned, timely manner; the 32
Security Break/Fix Program to expedite the repair and replacement of 33
damaged or broken security technology and equipment; the Security 34

(PG&E-15)
-18-
Preventative Maintenance program to test security equipment on an 1
annual basis; and the Security Control Center Technology program to 2
modernize and integrate a number of older, disparate security control 3
systems. 4
(PG&E-15)
PACIFIC GAS AND ELECTRIC COMPANY
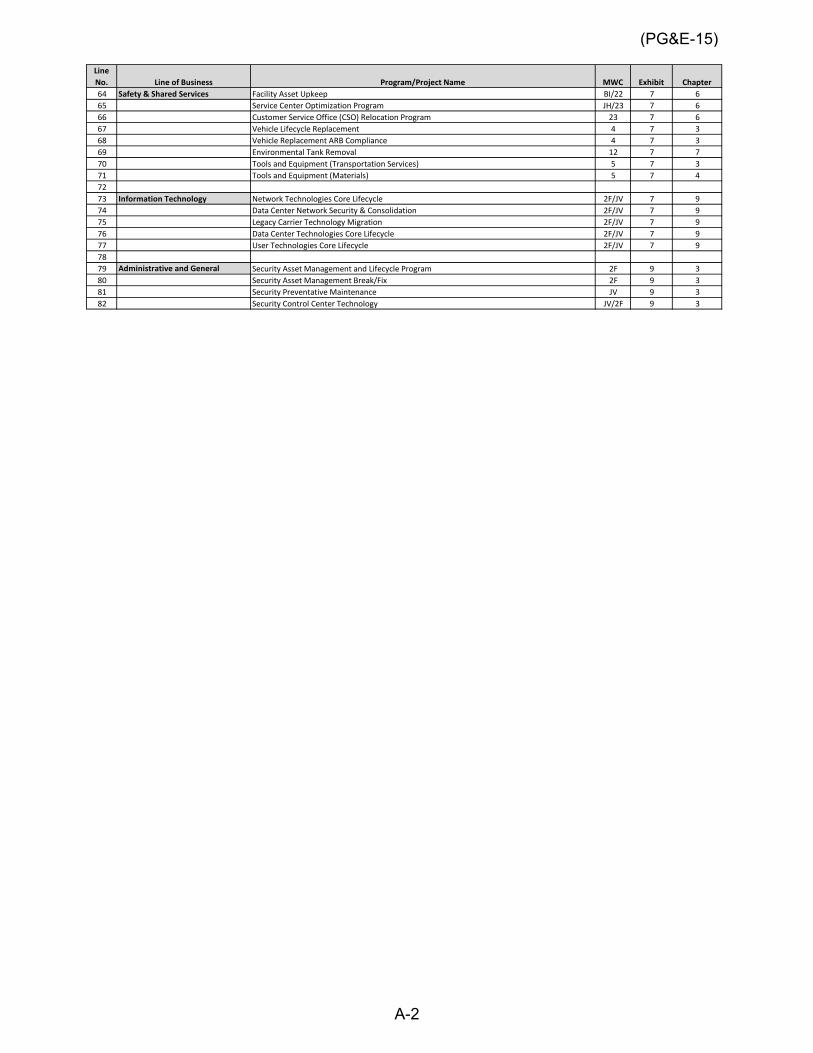
APPENDIX A
KEY PROGRAMS AND PROJECTS TO ADDRESS
INFRASTRUCTURE SUSTAINABILITY IN
PG&E’S 2017 GENERAL RATE CASE FORECAST

Line
No. Line of Business Program/Project Name MWC Exhibit Chapter
1 Electric Distribution Pole Intrusive Inspection Program GA 4 8
2 Pole Restoration Program GA 4 8
3 Regulated Output Streetlight Replacement 2A 4 6
4 San Francisco Decorative Streetlights 2A 4 6
5 Network Protector Relay Replacement 2C 4 6
6 Transformer and Protector Replacement 2C 4 6
7 Network SCADA Safety Monitoring Project 2C 4 6
8 Pole Replacement 07 4 8
9 Overhead Conductor Replacement Program 08 4 9
10 Grasshopper/Overhead Switch Replacement 08 4 9
11 Wires Down Generated projects 08 4 9
12 Recloser Control Upgrades 49 4 9
13 Replace Distribution Line SCADA 09 4 10
14 Replace Substation SCADA 09 4 10
15 Replace Substation Protective Relays 09 4 10
16 Reliability Cable Replacement 56 4 11
17 Cable Rejuvenation and Testing 56 4 11
18 Network Cable Replacement 56 4 11
19 LBOR Switch Replacements 56 4 11
20 Battery Replacement 48 4 12
21 Circuit Breaker Replacement 48 4 12
22 Other Equipment Replacement - Switches 48 4 12
23 Switchgear Replacement 48 4 12
24 Other Equipment Replacement - Civil Structures 48 4 12
25 Other Equipment Replacement - Insulators 48 4 12
26 Transformer Replacement 54 4 12
27 Substation Seismic Upgrades 58 4 12
28 SCADA Platform Upgrade and DMS Integration 2F 4 15
29 Energy Supply DCPP Capital 20 5 3
30 Maintain DCPP Plant Assets BS 5 3
31 Install/Replace Equipment for Hydro Safety & Regulatory 2L 5 4
32 Install/Replace Equipment Hydro Generating Equipment 2M 5 4
33 Install/Replace Reservoirs, Dams & Waterways 2N 5 4
34 Install/Replace Hydro Infrastructure 2P 5 4
35 Maintain Reservoirs, Dams & Waterways AX 5 4
36 Maintain Hydro Generating Equipment KH 5 4
37 Maintain Hydro Buildings and Infrastructure KI 5 4
38 Install/Replace Equipment for Fossil Safety & Regulatory 2R 5 5
39 Install/Replace Equipment Fossil Generating Equipment 2S 5 5
40 Install/Replace Fossil Infrastructure 2T 5 5
41 Install/Replace Equipment for Solar Safety & Regulatory 3A 5 5
42 Install/Replace Equipment Solar Generating Equipment 3B 5 5
43 Maintain Fossil Generating Equipment KL 5 5
44 Maintain Fossil Buildings and Infrastructure KM 5 5
45 Maintain Solar Generating Equipment KR 5 5
46 Maintain Solar Buildings and Infrastructure KS 5 5
47 IT Infrastructure - Nuclear 2F 5 7
48 IT Infrastructure - Power Generation 2f 5 7
49 Gas Operations Gas Pipeline Replacement Program (GPRP) 14 3 4
50 Aldyl-A Plastic Replacement Program 14 3 4
51 Main Replacement Reliability 50 3 4
52 Service Replacement Reliability 50 3 4
53 Regulator Rebuild/Component Replacement Program 50 3 5
54 High Pressure Regulator Replacement/Rebuild Program 2K 3 5
55 Compressed Natural Gas Fueling Station Infrastructure 31 3 5
56 Gas Regulator Replacement 74A 3 6A
57 GD Corrective Maintenance FI 3 6A
58 Maintain Gas Meters HY 3 6A
59 Cathodic Protection Systems Capital Projects 50 3 6B
60 Atmospheric Corrosion Mitigation FH 3 6B
61 Cathodic Protection Corrective Maintenance FI 3 6B
62 Service Replacement Reliability due to Leaks 50 3 6C
63 Complex Service Replacement Reliability due to Leaks 50 3 6C
Key Programs and Projects to Address Infrastructure Sustainability in PG&E's
2017 General Rate Case Forecast
(PG&E-15)
A-1
Line
No. Line of Business Program/Project Name MWC Exhibit Chapter
64 Safety & Shared Services Facility Asset Upkeep BI/22 7 6
65 Service Center Optimization Program JH/23 7 6
66 Customer Service Office (CSO) Relocation Program 23 7 6
67 Vehicle Lifecycle Replacement 4 7 3
68 Vehicle Replacement ARB Compliance 4 7 3
69 Environmental Tank Removal 12 7 7
70 Tools and Equipment (Transportation Services) 5 7 3
71 Tools and Equipment (Materials) 5 7 4
72
73 Information Technology Network Technologies Core Lifecycle 2F/JV 7 9
74 Data Center Network Security & Consolidation 2F/JV 7 9
75 Legacy Carrier Technology Migration 2F/JV 7 9
76 Data Center Technologies Core Lifecycle 2F/JV 7 9
77 User Technologies Core Lifecycle 2F/JV 7 9
78
79 Administrative and General Security Asset Management and Lifecycle Program 2F 9 3
80 Security Asset Management Break/Fix 2F 9 3
81 Security Preventative Maintenance JV 9 3
82 Security Control Center Technology JV/2F 9 3
(PG&E-15)
A-2