Embed Size (px)
Citation preview
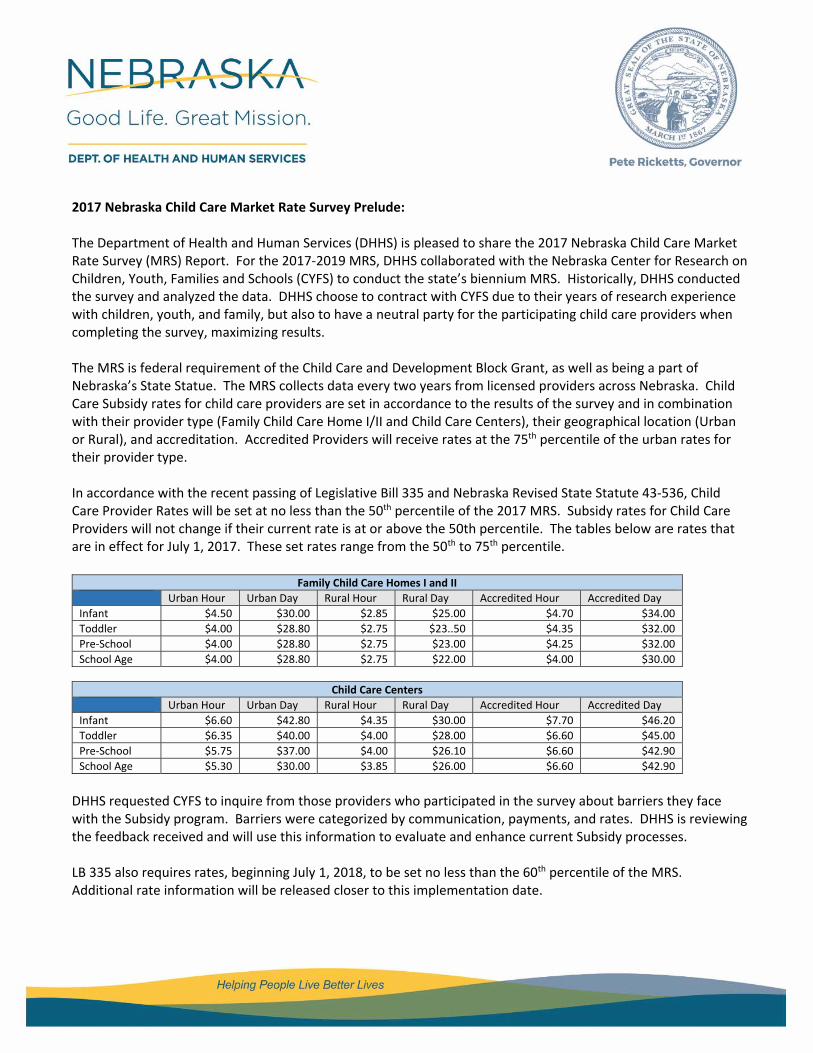
2017 Nebraska Child Care Market Rate Survey Prelude:
The Department of Health and Human Services (DHHS) is pleased to share the 2017 Nebraska Child Care Market Rate Survey (MRS) Report. For the 2017-2019 MRS, DHHS collaborated with the Nebraska Center for Research on Children, Youth, Families and Schools (CYFS) to conduct the state’s biennium MRS. Historically, DHHS conducted the survey and analyzed the data. DHHS choose to contract with CYFS due to their years of research experience with children, youth, and family, but also to have a neutral party for the participating child care providers when completing the survey, maximizing results.
The MRS is federal requirement of the Child Care and Development Block Grant, as well as being a part of Nebraska’s State Statue. The MRS collects data every two years from licensed providers across Nebraska. Child Care Subsidy rates for child care providers are set in accordance to the results of the survey and in combination with their provider type (Family Child Care Home I/II and Child Care Centers), their geographical location (Urban or Rural), and accreditation. Accredited Providers will receive rates at the 75th percentile of the urban rates for their provider type.
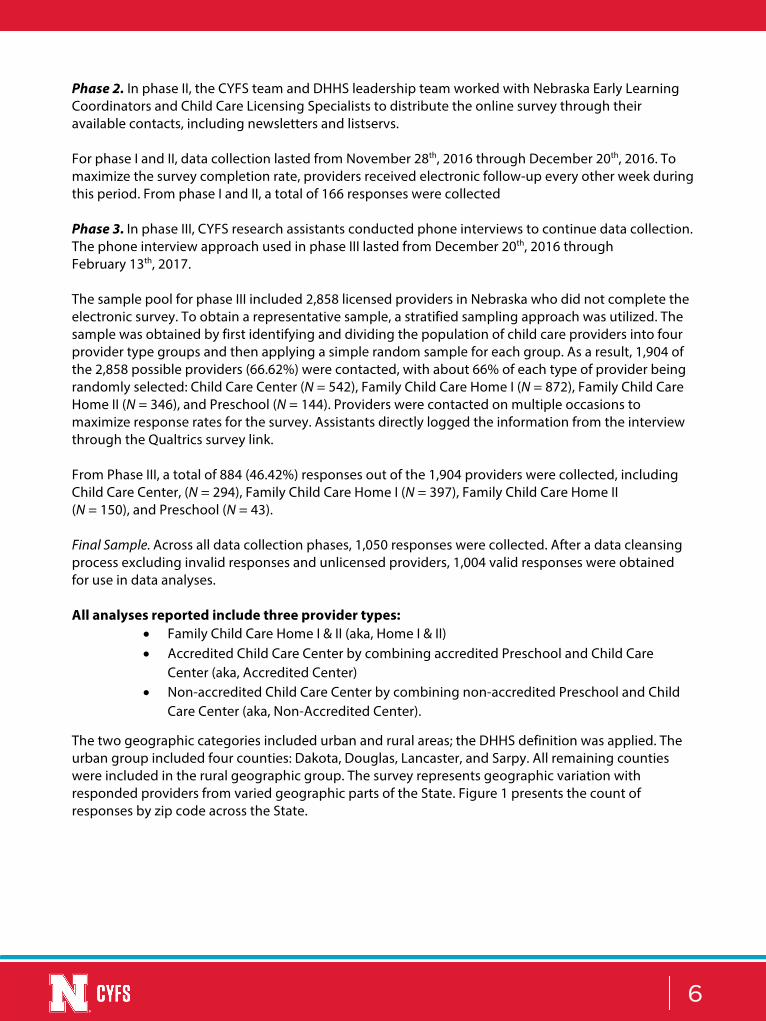
In accordance with the recent passing of Legislative Bill 335 and Nebraska Revised State Statute 43-536, Child Care Provider Rates will be set at no less than the 50th percentile of the 2017 MRS. Subsidy rates for Child Care Providers will not change if their current rate is at or above the 50th percentile. The tables below are rates that are in effect for July 1, 2017. These set rates range from the 50th to 75th percentile.
Family Child Care Homes I and II Urban Hour Urban Day Rural Hour Rural Day Accredited Hour Accredited Day Infant $4.50 $30.00 $2.85 $25.00 $4.70 $34.00Toddler $4.00 $28.80 $2.75 $23..50 $4.35 $32.00Pre-School $4.00 $28.80 $2.75 $23.00 $4.25 $32.00School Age $4.00 $28.80 $2.75 $22.00 $4.00 $30.00
Child Care Centers Urban Hour Urban Day Rural Hour Rural Day Accredited Hour Accredited Day Infant $6.60 $42.80 $4.35 $30.00 $7.70 $46.20 Toddler $6.35 $40.00 $4.00 $28.00 $6.60 $45.00 Pre-School $5.75 $37.00 $4.00 $26.10 $6.60 $42.90 School Age $5.30 $30.00 $3.85 $26.00 $6.60 $42.90
DHHS requested CYFS to inquire from those providers who participated in the survey about barriers they face with the Subsidy program. Barriers were categorized by communication, payments, and rates. DHHS is reviewing the feedback received and will use this information to evaluate and enhance current Subsidy processes.
LB 335 also requires rates, beginning July 1, 2018, to be set no less than the 60th percentile of the MRS. Additional rate information will be released closer to this implementation date.

2017 Nebraska Child Care Market Rate Survey Report
LISA L. KNOCHE Nebraska Center for Research on Children, Youth, Families, and Schools
University of Nebraska-Lincoln
GREG W. WELCH Buffett Early Childhood Institute
University of Nebraska
QIZHEN DENG Nebraska Center for Research on Children, Youth, Families, and Schools
University of Nebraska-Lincoln
Prepared for the Nebraska Department of Health and Human Services Division of Children and Family Services
June 2017

Suggested Citation: Knoche, L.L., Welch, G.W. & Deng, Q. (2017). 2017 Nebraska Child Care Market Rate Study. University of Nebraska-Lincoln: Nebraska Center for Research on Children, Youth, Families and Schools.

TABLE OF CONTENTS
INTRODUCTION ....................................................................................................................................................... 4
METHODOLOGY ...................................................................................................................................................... 5 Survey Development ............................................................................................................................................ 5 Survey Distribution and Sampling ................................................................................................................... 5 Data Management ............................................................................................................................................... 7
KEY FINDINGS ........................................................................................................................................................... 9 Survey Respondents ............................................................................................................................................. 9 Child Care Market Rates .................................................................................................................................... 10
Full-time Rates .............................................................................................................................................. 10
PROGRAM DESCRIPTIONS ................................................................................................................................. 15 Current Enrollment ............................................................................................................................................. 15 Accreditation ........................................................................................................................................................ 15
Funding .................................................................................................................................................................. 16 Staffing ................................................................................................................................................................... 16 Operational Hours .............................................................................................................................................. 17
Enrollment Fee ..................................................................................................................................................... 18 Child Care Subsidy Agreements ...................................................................................................................... 18
SPECIAL POPULATIONS: CHILDREN WITH SPECIAL NEEDS, ENGLISH LANGUAGE LEARNERS, MIGRANT CHILDREN, AND HOMELESS CHILDREN ................................................................................. 20

4
INTRODUCTION
To comply with Child Care and Development Fund (CCDF) regulations and state statute, the Department of Health and Human Services (DHHS) in Nebraska is required to oversee a child care Market Rate Survey (MRS) every two years. The purpose of the MRS is to guide Lead Agencies in setting payment rates within the context of market conditions so that rates are sufficient to provide equal access to the full range of child care services. Federal regulations do not dictate the level at which rates are set; however, parental choice of families is a basic tenet of the Child Care Subsidy Program. DHHS must guarantee that payment rates are sufficient to ensure that children receiving assistance through the Child Care Subsidy Program have access to the pool of providers that is equal to the access of provider-paying families.
In 2017, Nebraska Center for Research on Children, Youth, Families and Schools (CYFS) at the University of Nebraska-Lincoln agreed to conduct the MRS for child care in the state of Nebraska. The market rate survey meets the following benchmarks: (a) includes the priced child care market; (b) provides complete and current data; (c) represents geographic variations; (d) uses rigorous data collection procedures; and (e) analyzes data in a manner that captures market differences as a function of age group, provider type, and geographic location.
The CYFS agreed to perform the following specific services: 1. Survey the Licensed Child Care Providers across the state to obtain private pay child care rates
for children with or without special needs; 2. Collect and report on the following categories of data: (a) geographic location – rural/urban;
(b) type of child care provider – family child care home vs. child care center (accredited vs. non-accredited); (c) age group of children – infant, toddler, pre-school, and sc hool-age; and (d) special needs status – medical and behavioral.
3. Analyze data. Summarize data in a format and file type approved by the Department, summarizing o verall study findings as mentioned a bove. Analyses of rates will include the 50th , 55th, 60th, 65th, 70th, and 75th percentiles.
4. Produce a final report.

5
METHODOLOGY
Survey Development
This survey was conducted by the CYFS on behalf of the DHHS to study the 2017 market rate prices for child care in Nebraska to inform the reimbursement rates for the child care subsidy. The CYFS research team closely collaborated with the DHHS to develop a draft of the survey based on the State’s previous MRS in 2011 and 2015. The draft was then reviewed and discussed by a steering committee who provided additional guidance and facilitated in the decision-making process for the Nebraska MRS. The steering committee1 was composed of experts who are experienced with the MRS and child care in Nebraska. Final decisions on survey content were made by the DHHS.
With the collaboration among the CYFS research team, the DHHS leadership team and the steering committee, the final survey included questions related to (a) rate information by provider type, child age and rate type and special needs status; (b) program descriptors (i.e., zip code, staff, hour of part-time and full-time care, children enrolled, enrollment fee), (c) quality measures and participation (i.e., accreditation, funding), (d) child descriptive information (i.e. English language learners, children with special needs, homeless and migrant children); and (e) barriers for providers with a Child Care Subsidy agreement. The developed survey was imported into Qualtrics, a web-based survey software program. The survey was carefully tested internally prior to distributing a final, electronic version to child care providers. The final survey is included in Appendix A.
Survey Distribution and Sampling
The survey was initiated with child care providers on November 28th, 2016 and data collection remained active through February 13th, 2017. The total data collection window was 11 weeks. Participation in the survey was voluntary; providers could selectively choose to respond to each question. There were three phases in the survey distribution and sampling process; these are specified below.
Phase 1. In phase I, the team planned a census approach to surveying all 3,024 licensed child care providers in Nebraska. Given the child care roster2 provided by the DHHS does not include email information, email addresses were collected through other sources (e.g. internet searches). A total of 300 emails were obtained through this process. Official email invitations with a link to the electronic survey were then distributed to the targeted child care providers.
1 Brandee Lengel, Co-Executive Director at Nebraska Association for the Education of Young Children. Chrissy Tonkinson, Research Coordinator at Voices for Children in Nebraska. Jen Goettemoeller, Senior Policy Associate a t First Five Nebraska.
2 Refer to the link for the roster: http://dhhs.ne.gov/publichealth/Documents/ChildCareRoster.pdf
6
Phase 2. In phase II, the CYFS team and DHHS leadership team worked with Nebraska Early Learning Coordinators and Child Care Licensing Specialists to distribute the online survey through their available contacts, including newsletters and listservs.
For phase I and II, data collection lasted from November 28th, 2016 through December 20th, 2016. To maximize the survey completion rate, providers received electronic follow-up every other week during this period. From phase I and II, a total of 166 responses were collected
Phase 3. In phase III, CYFS research assistants conducted phone interviews to continue data collection. The phone interview approach used in phase III lasted from December 20th, 2016 through February 13th, 2017.
The sample pool for phase III included 2,858 licensed providers in Nebraska who did not complete the electronic survey. To obtain a representative sample, a stratified sampling approach was utilized. The sample was obtained by first identifying and dividing the population of child care providers into four provider type groups and then applying a simple random sample for each group. As a result, 1,904 of the 2,858 possible providers (66.62%) were contacted, with about 66% of each type of provider being randomly selected: Child Care Center (N = 542), Family Child Care Home I (N = 872), Family Child Care Home II (N = 346), and Preschool (N = 144). Providers were contacted on multiple occasions to maximize response rates for the survey. Assistants directly logged the information from the interview through the Qualtrics survey link.
From Phase III, a total of 884 (46.42%) responses out of the 1,904 providers were collected, including Child Care Center, (N = 294), Family Child Care Home I (N = 397), Family Child Care Home II (N = 150), and Preschool (N = 43).
Final Sample. Across all data collection phases, 1,050 responses were collected. After a data cleansing process excluding invalid responses and unlicensed providers, 1,004 valid responses were obtained for use in data analyses.
All analyses reported include three provider types: • Family Child Care Home I & II (aka, Home I & II) • Accredited Child Care Center by combining accredited Preschool and Child Care
Center (aka, Accredited Center) • Non-accredited Child Care Center by combining non-accredited Preschool and Child
Care Center (aka, Non-Accredited Center).
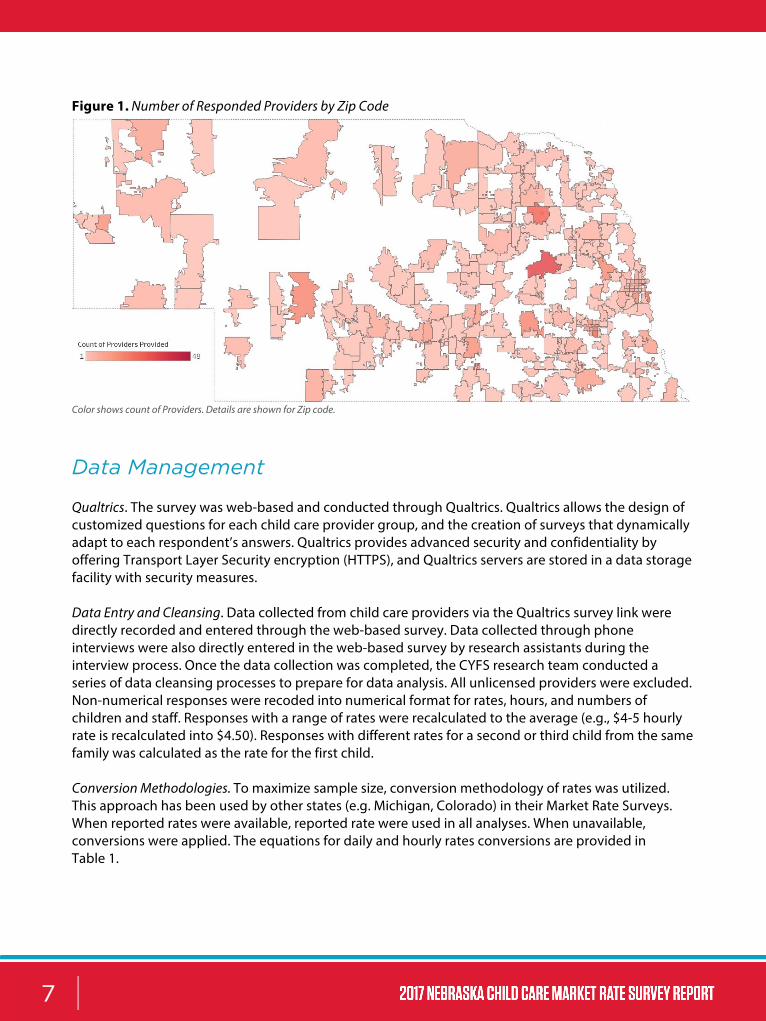
The two geographic categories included urban and rural areas; the DHHS definition was applied. The urban group included four counties: Dakota, Douglas, Lancaster, and Sarpy. All remaining counties were included in the rural geographic group. The survey represents geographic variation with responded providers from varied geographic parts of the State. Figure 1 presents the count of responses by zip code across the State.
7
Figure 1. Number of Responded Providers by Zip Code
Color shows count of Providers. Details are shown for Zip code.
Data Management
Qualtrics. The survey was web-based and conducted through Qualtrics. Qualtrics allows the design of customized questions for each child care provider group, and the creation of surveys that dynamically adapt to each respondent’s answers. Qualtrics provides advanced security and confidentiality by offering Transport Layer Security encryption (HTTPS), and Qualtrics servers are stored in a data storage facility with security measures.
Data Entry and Cleansing. Data collected from child care providers via the Qualtrics survey link were directly recorded and entered through the web-based survey. Data collected through phone interviews were also directly entered in the web-based survey by research assistants during the interview process. Once the data collection was completed, the CYFS research team conducted a series of data cleansing processes to prepare for data analysis. All unlicensed providers were excluded. Non-numerical responses were recoded into numerical format for rates, hours, and numbers of children and staff. Responses with a range of rates were recalculated to the average (e.g., $4-5 hourly rate is recalculated into $4.50). Responses with different rates for a second or third child from the same family was calculated as the rate for the first child.
Conversion Methodologies. To maximize sample size, conversion methodology of rates was utilized. This approach has been used by other states (e.g. Michigan, Colorado) in their Market Rate Surveys. When reported rates were available, reported rate were used in all analyses. When unavailable, conversions were applied. The equations for daily and hourly rates conversions are provided in Table 1.

8
Table 1. Rate Conversion Methodology Reported Rate Conversion Equation for Daily Rates Conversion Equation for Hourly Rates Hourly Hourly rate x # of hours in operation
per day n/a
Daily n/a (converted daily rate)/(hours per day) Weekly Weekly rates/days per week (weekly rates)/(hours per week) Monthly [Monthly rate/4.00]/ # of days in
operation per week None
Additionally, respondents reported on “hours of full time care”. In order to use this variable in conversions, the following assumptions were applied:
• If a provider reported 6 or more hours constituting full time care, this value was considered “full time hours per week”.
• If a provider reported 5.99 or less hours constituting full time care, this value was considered “full time hours per day”.
The conversion values that were included in analyses fell within the values range reported by providers and are therefore representative of the true market range. That is, if the reported range in hourly infant care rate was $2-$10/hour, only converted values that fell within this rate range were used.
Therefore, the rates provided are a combination of both reported rates and converted rates. Table 2 displays the percentage of converted rates.
Table 2. Percent of Rates Calculated via Conversion Methodology Infant Toddler Preschool School Age
Hourly 73.6% 74.1% 73.2% 68.9% Daily 70.6% 70.0% 69.5% 64.3%
Notes on Conversion Methodology. The methodology we utilized to compute rates was consistent with the approach that has been used in other states (e.g. Oregon, Colorado, Michigan) in their recent Market Rate Studies. This approach is rigorous and, as applied to available data, will yield accurate results. It was intended to meet the Federal Guidance. This methodology is different than what has been used in the past Nebraska Market Rate Studies, and therefore variation in results from previous years could be attributed to the change in methodology used to derive the rates.
As previously indicated a conversion methodology was required and applied to achieve a sufficient sample size by cell (age group x provider type x geographic setting). The variability in the pattern of rates across age groups could be attributed to the conversion steps that were necessary to achieve a sufficient sample size to establish rates for all age groups, provider types and geographic settings.
As we have discussed, other options are available for analyzing the data. One option is weighting the data by age group so as to report a price per child care slot. Information on the number of children served per age group, however, was not available through child care licensing and not collected as part of the survey and therefore the DHHS team determined that insufficient information was available to proceed with the weighted analytic approach. Should this data become available, the rates could be recomputed.

9
We feel it is important to be cautious in interpreting the findings given the small number of providers that responded to key questions in the survey. Although the reported response rate of 1,004 is consistent with previous MRSs in Nebraska, in our study this value represents the number of providers that responded to any portion of the survey. This does not mean t he provider responded t o a ll of the survey questions. In f act, the number of providers responding t o k ey questions about hourly/daily rates charged was much smaller than the total reported response rate. While the conversion methodology we employed is a justifiable methodological approach given it relied on observed responses to minimize error, a degree of uncertainly still exists about the accuracy of the calculated rates.
Data Analyses. We used the SPSS software (version 23) and the Tableau (version 10) to conduct descriptive data analyses and provide a geographic display of key findings.
KEY FINDINGS
Findings are provided across four key areas: (a) a description of the survey respondents; (b) the child care market rates; (c) program descriptions; and (d) special populations served.
Survey Respondents
Table 3a presents the number and percentage of responded providers who serve children at each age group by provider type and geographic location. Table 3b presents the number of responded providers by age group and provider type. Figure 2 presents the distribution of the sample by provider type.
Table 3a. Number (%) of Providers Serving Each Age Group by Provider Type and Geographic Location Infant Toddler Preschool Age School Age
Providers Urban Rural Urban Rural Urban Rural Urban Rural Home I & II 203 345 207 357 205 358 149 330
(27.54%) (46.81%) (26.85%) (46.30%) (24.61%) (42.98%) (19.25%) (42.64%) Accredited 12 0 13 1 15 2 12 2 Centers (1.63%) (-) (1.69%) (.13%) (1.80%) (.24%) (1.55%) (.26%) Non- 100 77 112 81 132 121 173 98 Accredited (13.57%) (10.45%) (14.53%) (10.51%) (15.85%) (14.53%) (22.35%) (12.66%) Centers Total 315 422 332 439 352 481 344 430
Note. Percentage is calculated by dividing the n umber of providers within each cell by the to tal number of each child type (Ninfant= 737; Ntoddler = 771; Npreschool = 833; Nschool-age = 774).

10
Table 3b. Number of Responded Providers by Age Group and Provider Type Infant Toddler Preschool Age School Age
Home I & II 548 (74.36%)
564 (73.51%)
563 (67.59%)
497 (64.21%)
Accredited Centers
13 (1.76%)
14 (1.82%)
17 (2.04%)
14 (1.81%)
Non-Accredited Centers
112 (15.20%)
193 (25.03%)
253 (30.37%)
271 (35.01%)
Total 737 771 833 774 Note. Percentage is calculated by dividing the number of providers within each cell by the total number of each child type (Ninfant= 737; Ntoddler = 771; Npreschool = 833; Nschool-age = 774).
Figure 2. Distribution and Percentage of the Sample by Provider Type
n=607 Home I & II
(60%)n=48 Non-Accredited
Centers (5%)
n=349 Accredited
Centers (35%)
Child Care Market Rates
Full-time Rates Tables 4 & 5 show the full-time rates at the 50th, 55th, 60th, 65th, 70th, and 75th percentile by provider type (Home I & II, accredited center, non-accredited center), age level of child (infant, toddler, preschool age, school age), and by pricing modes (hourly, daily). The 75th percentile of rates is the price at which 75% of child care slots may be purchased. Several trends are apparent in Tables 4 & 5. Regardless of pricing mode, geographic area, or age level of children, the rates for Home I & II are generally consistently lower than that for both accredited or non-accredited centers; the rates for nonaccredited centers are lower than that for accredited centers; rates in rural areas are lower than rates in urban areas; and the rates for infants and toddlers tend to be slightly higher than that for preschool and school age children. The rates for accredited centers are higher than others; this finding is based on a very limited number of responses and therefore should be interpreted with caution.

11

-
-
-
-
12
Sample Sizes Used to Compute Daily and Hourly Rates - Hourly
Table 6a. Sample Size and Range of Rates – Hourly for Urban Settings Urban Hourly Infant Toddler Preschool School Age Home 128 130 130 70
$2.00-$10.00 $2.00-$10.00 $2.00-$10.00 $2.00-$10.00 Center (Accred) 5 5 6 7
$3.80-8.10 $3.80-7.53 $3.46-7.53 $2.23-7.17 Center (Non) 45 52 58 64
$2.29-9.50 $2.07-9.00 $2.21-8.50 $2.04-8.00
Table 6b. Sample Size and Range of Rates – Hourly for Rural Settings Rural Hourly Infant Toddler Preschool School Age Home 227 232 237 187
$2-$10 $2-$10 $2-$10 $2-$10 Center (Accred) 4 5 5 5
$2.42-4.31 $2.08-3.91 $2.78-3.86 $2.44-3.86 Center (Non) 50 51 54 45
$2.00-9.19 $2.00-8.92 $2.00-8.65 $2.00-5.00
Table 6c. Sample Size and Range of Rates – Daily for Urban Settings Urban Daily Infant Toddler Preschool School Age Home 178 183 183 94
$20.00-58.33 $20.00-58.33 $18.00-50.00 $5.00-50.00 Center (Accred) 5 9 11 9
$38.00-55.35 $38.00-57.45 $34.00-51.95 $24.00-71.00 Center (Non) 67 78 81 89
$29.71-60.00 $26.86-60.00 $20.00-60.00 $5.00-65.00
Table 6d. Sample Size and Range of Rates – Daily for Rural Settings Rural Daily Infant Toddler Preschool School Age Home 245 251 254 193
$17.00-50.00 $16.00-45.00 $14-45.00 $4.00-40.00 Center (Accred) 5 6 6 6
$25.00-33.50 $25.00-33.50 $23.00-33.50 $18-26.40 Center (Non) 48 49 48 45
$22.00-45.60 $20.00-45.60 $14.00-42.60 $5.00-42.60

13
When the rates were analyzed by zip codes, distinct patterns of rates across the state appeared. Figures 3a-3d depict how the rates vary across the state by child age.
Figure 3a. Infant Hourly Rate by Geographic Location
Color shows average of infant hourly rate. Details are shown for zip code.
Figure 3b. Toddler Hourly Rate by Geographic Location
Color shows average of toddler hourly rate. Details are shown for Zip code.

14
Figure 3c. Preschool Hourly Rate by Geographic Location
Color shows average of preschool hourly rate. Details are shown for Zip code.
Figure 3d. School Age Hourly Rate by Geographic Location
Color shows average of school-age hourly rate. Details are shown for Zip code.
15
PROGRAM DESCRIPTIONS
This section includes information on (1) current enrollment; (2) accreditation; (3) funding; (4) staffing; (5) operational hours; (6) enrollment fe es; and (7) child care subsidy agreements.
Current Enrollment
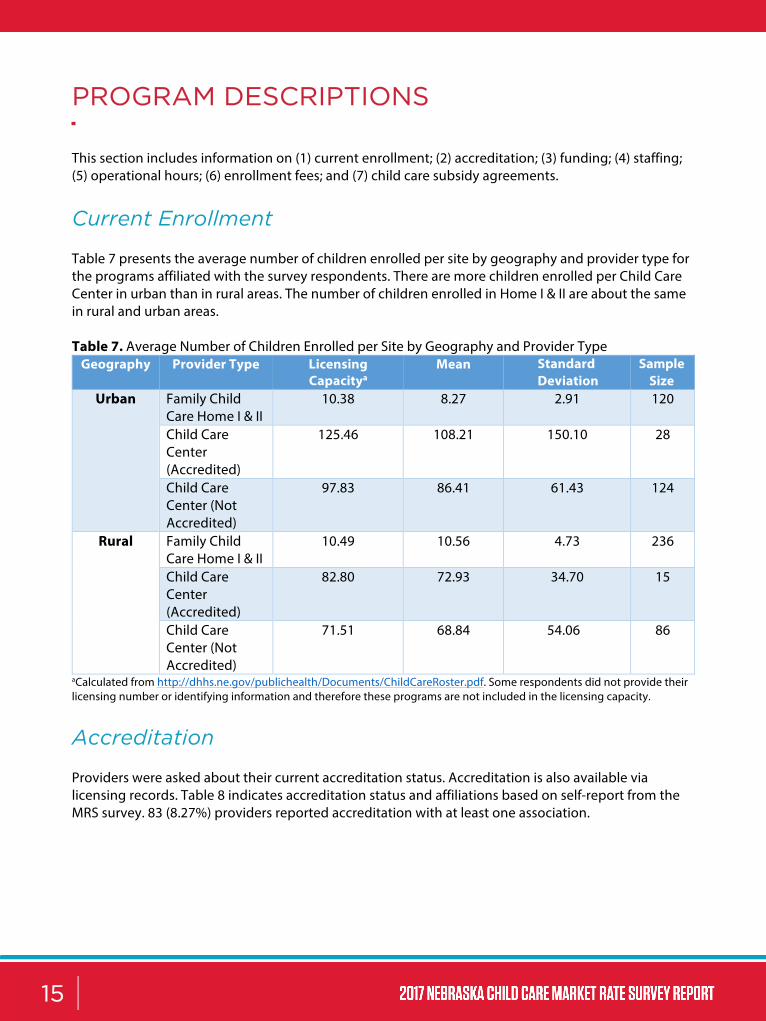
Table 7 presents the average number of children enrolled per site by geography and provider type for the programs affiliated with the survey respondents. There are more children enrolled per Child Care Center in urban than in rural areas. The number of children enrolled in Home I & II are about the same in rural and urban areas.
Table 7. Average Number of Children Enrolled per Site by Geography and Provider Type Geography Provider Type Licensing
Capacitya Mean Standard
Deviation Sample Size
Urban Family Child Care Home I & II
10.38 8.27 2.91 120
Child Care Center (Accredited)
125.46 108.21 150.10 28
Child Care Center (Not Accredited)
97.83 86.41 61.43 124
Rural Family Child Care Home I & II
10.49 10.56 4.73 236
Child Care Center (Accredited)
82.80 72.93 34.70 15
Child Care Center (Not Accredited)
71.51 68.84 54.06 86
aCalculated from http://dhhs.ne.gov/publichealth/Documents/ChildCareRoster.pdf. Some respondents did not provide their licensing number or identifying information and therefore these programs are not included in the licensing capacity.
Accreditation
Providers were asked about their current accreditation status. Accreditation is also available via licensing records. Table 8 indicates accreditation status and affiliations based on self-report from the MRS survey. 83 (8.27%) providers reported accreditation with at least one association.

-
-
16
Table 8. Child Care Providers’ Accreditation by Provider Type Association Home I & IIa Accredited
Centerb Non Accredited Center
National Association for Family Child Care (NAFCC)
14 (2.31%) 1 (2.08%) 0
National Association for the Education of Young Children (NAEYC)
31 (5.11%) 14 (29.17%) 0
National Accreditation Commission for Early Care and Education Program (NACECEP)
5 (.82%) 1 (2.08%) 0
National Early Childhood Program Accreditation (NECPA)
8 (1.32%) 2 (4.17%) 0
Association Montessori International (AMI) 0 0 0 National After School Association (NASA) 0 1 (2.08%) 0 American Montessori Society (AMS) 0 2 (4.17%) 0
Note. The result is based on self-report. a Number of funded providers divided by the total number of Home I & II providers n=607; b Divided by the total number of accredited centers n=48.
Funding
Overall, there were 143 providers (14.24%) out of the 1,004 respondents who reported receiving funding from at least one of the following: Head Start, Early Head Start, Sixpence, and/or Step Up to Quality. The following table presents the number and percentage of programs receiving each category of funding.
Table 9. Child Care Providers’ Reported Funding Sources Funding Home I & II Accredited Centers Non Accredited Centers
Head Start 3 (.49%a) 7 (14.58%b) 17 (4.87%c) Early Head Start 3 (.49%a) 2 (4.17%b) 9 (2.58%c) Sixpence 12 (1.98%a) 2 (4.17%b) 8 (2.29%c) Step up to Quality 55 (9.06%a) 14 (29.17%b) 42 (12.03%c)
Note. a Number of funded providers divided by the total number of Home I & II providers n=607; b Divided by the total number of accredited centers n=48; c Divided by the total number of non-accredited centers n=349.
Staffing
Among the 1,004 providers, 526 (52.39%) providers responded on the number of employed part-time staff and 772 (76.89%) providers responded on the number of employed full-time staff. On average, there are more part-time staff per site for accredited centers, followed by non-accredited centers and Home I & II, regardless of geographic location. There are more full time staff per site for centers than Home I & II. In urban areas, there are more full time staff per site for accredited centers than nonaccredited centers. In rural areas, there is a consistent staffing pattern difference between accredited centers and non-accredited centers in terms of full time staff. Table 10 presents the means and standard deviations for staff by provider type and geography. These patterns are depicted in Figure 4.

- - -
30
Home I & II Center (Accredited) Center (Non-Accredited)
25
20
15
10
5
0 Urban Rural Urban Rural
Part Time Full Time
17
Table 10. Means and Standard Deviations for Part Time and Full Time Staff by Provider Type and Geography
Part Time Staff Full Time Staff
Provider Type Urban Mean (SD)
Rural Mean (SD)
Urban Mean (SD)
Rural Mean (SD)
Home I & II 1.07 (3.27) .54 (1.15) 2.23(5.14) .97 (.75) Center (Accredited) 21.79 (34.15) 17.87 (15.82) 25.47 (33.10) 7.31 (10.49) Center (Not Accredited) 15.77 (23.76) 5.96 (6.70) 12.38 (9.77) 8.51 (11.35)
Figure 4. Staffing by Provider Type and Geography
Operational Hours
On average, part-time care was 5.17 hours or less per day reported by 290 providers (28.88%). On average, the hours constituting full time care were 47.37 hours per week reported by 390 providers (38.84%). On average, a weekly rate covers 4.95 days per week (M = 4.95, SD = .29) from 429 responses (42.73%). Table 11 presents the average hours constituting part time care per day and full time care per week by provider type and geographic location.
Table 11. Mean and Standard Deviations of hours for part time per day and full time per week Provider Part time hours per day Full time hours per week Full time hours per day
M(SD) Urban n Rural n Urban n Rural n Urban n Rural n Home I & II 5.49
(1.99) 65 5.11
(1.47) 108 48.16
(6.79) 94 46.02
(7.04) 176 8.33
(2.22) 57 8.59
(1.96) 82
Center (Accredited)
4.15 (.30)
4 4.00 (-)
1 48.33 (11.86)
9 50 (-) 1 9.50 (2.16)
7 8.00 (1.83)
4
Center (Non-Accredited)
4.95 (2.01)
56 5.20 (2.24)
56 51.18 (9.09)
65 45.27 (11.57)
45 8.34 (2.75)
22 8.28 (3.04)
27
18
Enrollment Fee
A total of 905 out of the 1004 respondents reported on the enrollment fee. Among them, 345 (38.12%) out of the 905 providers charged an enrollment fee. Table 12 presents the means and standardizations of the enrollment fee by provider type and geographic location. Findings indicate that the providers in urban areas charge a higher enrollment fee than providers in rural areas. Family child care Home I & II providers charge a higher enrollment fee than Child Care Centers regardless of their accreditation status.
Table 12. Means and Standard Deviations for the Enrollment Fee by Provider Type and Geography Provider Type Urban Rural
N M (SD) N M (SD)
Home I & II 68 $74.60 (53.05)
37 $58.24 (40.66)
Center (Accredited) 13 $49.62 (26.02)
3 $38.33 (10.41)
Center (Non-Accredited) 167 $45.53 (27.08)
57 $37.28 (28.52)
Child Care Subsidy Agreements
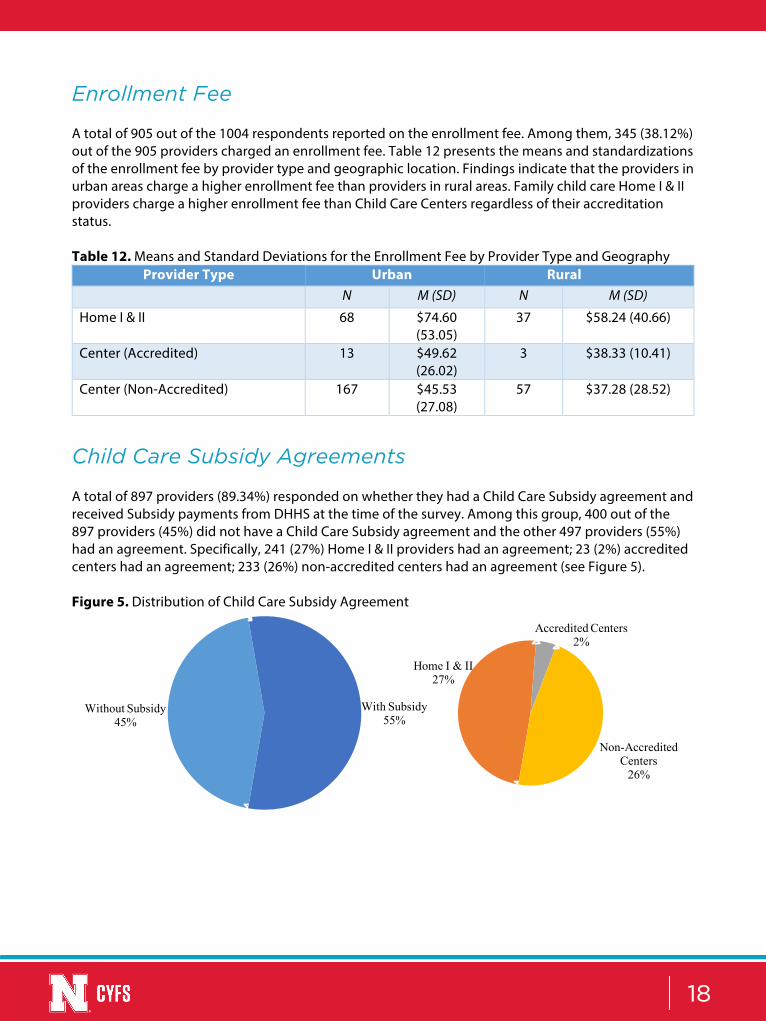
A total of 897 providers (89.34%) responded on whether they had a Child Care Subsidy agreement and received Subsidy payments from DHHS at the time of the survey. Among this group, 400 out of the 897 providers (45%) did not have a Child Care Subsidy agreement and the other 497 providers (55%) had an agreement. Specifically, 241 (27%) Home I & II providers had an agreement; 23 (2%) accredited centers had an agreement; 233 (26%) non-accredited centers had an agreement (see Figure 5).
Figure 5. Distribution of Child Care Subsidy Agreement
Without Subsidy 45%
Home I & II 27%
Accredited Centers 2%
Non-Accredited Centers
26%
With Subsidy 55%

19
Providers were asked about the barriers to the Subsidy program. These barriers were categorized. The providers reported barriers related to communication, payments and rates. These categories are detailed below.
Communication
a) Difficulty with the current automated communication system was expressed. This included challenges with paperwork, online billing, confusion with family authorization fees, slow r esponse, lack of au thorization or delay in receiving, no response through calling or lack of knowledge by persons answering the phone);
b) Provider reported concerns with never being contacted or informed when changes happen.
Payments a) Not receiving payments on-time or not receiving at all due to difficult system; b) Delay in transferring children from center to center and therefore payment is
delayed; c) A recommendation for monthly payments to be changed to more frequent
payment (e.g. weekly or twice a month); d) No payment for transporting or feeding children; e) Parents not paying co-pays; f) When a few parents did not get credit for the first month, provider was not
paid.
Rates a) Provider indicated it is difficult to keep the center open when not getting paid
if children with Subsidy do not show up consistently. Children will take the spot (e.g., holidays, sick days, quit unexpectedly) and therefore the spot cannot be given to other children.
b) Centers lose money when centers are paid for less hours than the children were actually at the centers; providers said they do not receive enough reimbursement to cover costs;
c) Reimbursement rate is lower than regular rate.

20
SPECIAL POPULATIONS: Children with Special Needs, English Language Learners, Migrant Children, and Homeless Children
A total of 874 providers responded whether they had enrolled children with diverse background at the time of the survey. Among them, 348 (39.82%) providers serve children with special needs (medical and/or behavioral); 220 (25.17%) providers have English Language Learners (ELLs) enrolled; 116 (13.27%) providers have migrant children enrolled; 111 (12.70%) providers have homeless children (see Figure 6).
Figure 6. Number and % of Providers with Special Population
800
700
600
500
400
300
200
100
0
348 (39.82%)
Children with Special Needs
220 (25.17%)
116 (13.27%)
ELLs Migrant Children
111 (12.70%)
Homeless Children
Table 13 presents the percentage of providers who reported currently enrolling children with diverse backgrounds by provider type and geographic location; these values are presented visually in Figure 7. The highest percentage of sites serving diverse children are Child Care Centers, followed by Home I & II. The percentage of providers serving d iverse children in urban areas is higher than that in rural areas regardless of provider type. This pattern varies slightly for accredited centers.
Table 13. Percentage of Providers with Currently Enrolled Children with Special Needs, Homeless Children, Migrant Children, ELLs by Provider Type and Geography
Children with Special Needs
Homeless Children Migrant Children ELLs
Provider Type Urban Rural Urban Rural Urban Rural Urban Rural Home I & II 39 58 10 3 6 4 21 19
(16.88%) (15.89%) (4.33%) (0.82%) (2.60%) (1.10%) (9.09%) (5.21%) Center 15 14 7 8 5 6 12 8 (Accredited) (65.22%) (63.64%) (30.43%) (36.36%) (21.74%) (27.27%) (52.17%) (36.36%) Center (Not 144 74 64 17 73 18 119 36 Accredited) (71.64%) (56.49%) (31.84%) (12.89%) (36.32%) (13.74%) (59.20%) (27.48%)

Figure 7. Percentage of Providers Serving Diverse Children by Provider Type and Geographic Location
100%
90%
Home I & II Center (Accredited) Center (Not Accredited) 80%
70%
60%
50%
40%
30%
20%
10%
0% Urban Rural Urban Rural Urban Rural Urban Rural
Children with Special Needs Homeless Children Migrant Children ELLs
21
Among the 348 sites (34.66%) who serve children with special needs, 36 sites (3.59%) reported they charged varied rates based on severity of behavioral and/or medical special needs. Among the 36 sites, only 12 sites reported their rates for children with behavioral special needs and 9 sites reported their rates for children with medical special needs. The rates for children with behavioral special needs ranged from $3 to $15 per hour (M = 9.21, SD = 4.68) and from $24 to $70 per day (M = 49.49, SD = 17.35). The rates for children with medical special needs ranged from $3 to $15 per hour (M = 12.58, SD = 4.80).