Embed Size (px)
Citation preview

Owede, Tope (2010) Relationship between key economic indicator,(GDP) and ISO certification take-up in selected developing economies. [Dissertation (University of Nottingham only)] (Unpublished)
Access from the University of Nottingham repository: http://eprints.nottingham.ac.uk/24117/1/Disseration.pdf
Copyright and reuse:
The Nottingham ePrints service makes this work by students of the University of Nottingham available to university members under the following conditions.
This article is made available under the University of Nottingham End User licence and may be reused according to the conditions of the licence. For more details see: http://eprints.nottingham.ac.uk/end_user_agreement.pdf
For more information, please contact [email protected]

1
Nottingham University Business School
Relationship between key economic indicator, (GDP) and ISO
certification take up in selected developing economies
By
Tope Owede
2010
A Dissertation presented in part consideration for the degree of MSC
Supply Chain and Operations Management
2
ABSTRACT
In an economic environment characterised in recent years by globalization and
the integration of economic processes, standardization in Quality Managements
Systems has had a high growth. In this context, there has been a remarkable
increase in the number of certifications issued by International organizations
especially to countries known and defined as “developing”. Amongst these
standards, one stands out which is issued by the International Organization for
standardization (ISO), this is known as the family of ISO 9000 standards.
The ISO 9001 series has seen an increase in the number of certification obtained
by developing countries. This adoption, gives developing countries the
opportunity to compete in global market place as being ISO 9000 certified is
seen as an entry qualifier into the global market place.
The purpose of this study is to observe and analyze the relationship between the
economies of selected developing countries and ISO take up in the selected
countries (Nigeria, Kenya, Egypt, Mexico and China), with the aim of finding a
possible relationship between these country‟s economic development and its ISO
9001 certification status. Having this in mind, the research employs the use of
primarily quantitative techniques with some qualitative elements in order to
achieve its objectives.
Particularly, a linear regression analysis is run using the data collected by using
Pearson‟s technique for calculating the correlation coefficient (r) and (r^2) using
Microsoft excel. This particular technique for calculating correlation coefficient
was chosen because it is more suitable to measure the strength and the
direction of a linear relationship between two variables when ratio-typed data
are used.
From this study, it has been discovered that there is a linear and strong
correlation between ISO certification take up in the selected developing countries
across continents and their GDP which signifies the level of economic growth of
countries.Moreso, it also found out that the main reason why developing
countries get ISO 9000 certificates is because of customer pressure and the also
the ability to compete in the global market.

3
Acknowledgements
I would like to thank Dr James Tannock for his guidance and support during the
course of writing this dissertation. Thank you so much.
To my darling husband, Eseoghenene Owede.Thank you so much for believing in
me. I love you so much.
To my princes, Tega and Leroy, thank you so much for the understanding shown
during the period of this study.
Finally, I will like to say a big thank you to my parents, Mr and Mrs Oyinloye.You
made this dissertation possible.

4
TABLE OF CONTENTS
CHAPTER 1: INTRODUCTION AND BACKGROUND .................................... 7
1.1 General overview ............................................................................ 8
1.2 Research Objectives ........................................................................... 8
1.3 Research methodology ....................................................................... 9
1.3.1 Data Collection .......................................................................... 10
1.4 The development of Quality Managements standards .......................... 10
1.5 Developing country overview ............................................................ 13
1.6 Reason for selecting this topic ........................................................... 14
1.7 Users of Dissertation findings ............................................................ 15
1.8 Dissertation structure ....................................................................... 16
CHAPTER 2: LITERATURE REVIEW ......................................................... 18
2.1 Historical overview of ISO 9000 ......................................................... 18
2.2 ISO 9000 in figures .......................................................................... 20
2.3 ISO 9001:2008 (Revision) overview ................................................... 22
2.4 ISO 9001: 2000 .............................................................................. 23
2.4.1 System‟s Requirements ............................................................... 25
2.5 Implementation Process ................................................................. 30
2.6 Driving forces for seeking certification ................................................ 31
2.7 Barriers to ISO effective implementation .......................................... 33
2.8 Benefits from ISO registration ........................................................... 35

5
2.8.1 Internal Benefits ........................................................................ 37
2.8.2 External Benefits ........................................................................ 38
2.9: Criticism of ISO certification............................................................. 38
2.10 How developing countries benefit from ISO standardization ............... 40
CHAPTER 3: ECONOMIC HISTORY AND OVERVIEW ................................ 42
3.1 Overview of China’s economy ............................................................ 42
3.2 Overview of Kenya’s economy ........................................................... 44
3.3 Overview of Nigeria’s economy .......................................................... 46
3.4 Overview of Mexico’s economy .......................................................... 48
3.5 Overview of Egypt’s economy ............................................................ 50
CHAPTER 4: RESULTS AND DISCUSSIONS ............................................. 53
4.1 ISO 9001 certififcation take-up trend in Nigeria, Kenya, Egypt, Mexico and
China. (1999-2008) ............................................................................... 53
4.2 The relationship intensity on a ratio-type basis using the number of ISO
certification per country and the GDP data. .............................................. 58
4.3 The analysis of the relationship, if any between the levels of ISO
certification take up and the economies of these selected countries. ............ 63
4.3.1 Analysis and Interpretation of results............................................ 66
4.4 Summary ....................................................................................... 68
Appendix ............................................................................................... 71
6
List of Figures
Figure 1:Number of organizations certified ISO 9001 .................................... 13
Figure 2: Evolution of quality standards ...................................................... 19
Figure 3: Top 10 countries for ISO 9001:2000/2008 certificates .................... 22
Figure 4: ISO 9001:2000 /2008 process-based quality management system
................................................................... Error! Bookmark not defined.
Figure 5: GDP-China, (1999-2008) ............................................................. 44
Figure 6:GDP-Kenya (1999-2008) .............................................................. 46
Figure 7: GDP-Nigeria (1999-2008) ............................................................ 48
Figure 8: GDP-Mexico (1999-2008) .................. Error! Bookmark not defined.
Figure 9: GDP-Egypt (1999-2008) .............................................................. 51
Figure 10a: Number of ISO 9001 certification in Nigeria ................................ 54
Figure 10b: Number of ISO 9001 certification in Kenya ................................. 54
Figure 10c: Number of ISO 9001 certification in Egypt .................................. 55
Figure 10d: Number of ISO 9001 certification in Mexico .... Error! Bookmark not
defined.
Figure 10e: Number of ISO 9001 certification in China .................................. 56
Figure 11a: GDP/ISO 9001 intensity ratio for Nigeria .................................... 59
Figure 11b: GDP/ISO 9001 intensity ratio for Kenya ..................................... 59
Figure 11c: GDP/ISO 9001 intensity ratio for Egypt ...................................... 60
Figure 11d: GDP/ISO 9001 intensity ratio for China ...................................... 60
Figure 11e: GDP/ISO 9001 intensity ratio for Mexico .................................... 61
Figure 12a: Regression result for Nigeria. ................................................... 64
Figure 12b: Regression result for Kenya. ..................................................... 64
Figure 12c: Regression result for Egypt. ...................................................... 65
Figure 12d: Regression result for China ...................................................... 65
Figure 12e: Regression result for Mexico ..................................................... 66

7
List of Tables
Table 1: ISO 9001:2000/2008 principal results
Table2: ISO 9000 regional share (expressed in percentage)
Table 3: Driving forces for ISO 9001:2000 certification
Table 4: Barriers to ISO 9001:2000 implementation
Table 5: GDP/ISO intensity data

8
CHAPTER 1: INTRODUCTION AND BACKGROUND
1.1 General overview
In an economic environment characterised in recent years by globalization and
the integration of economic processes, standardization in Quality Managements
Systems has had a high growth. In this context, there has been a remarkable
increase in the number of certifications issued by International organizations
especially to countries known and defined as “developing”. Amongst these
standards, one stands out which is issued by the International Organization for
standardization (ISO), this is known as the family of ISO 9000 standards.
According to ISO website write up,” Giving fish” is one way of assisting
developing countries. By implementing International standards and participating
in their development, developing countries learn to fish for themselves. This
simply implies that in the face of globalisation, developing countries have the
opportunity to compete in the global market place if they adopt the ISO 9001
series as it is regarded now as the entry qualifier into the global market place.
1.2 Research Objectives
The aim/objective of this dissertation is to observe and analyze the relationship
between the economy of selected developing countries and ISO take up in the
selected countries, with the aim of finding a possible relationship between a
country‟s economic development and its ISO 9001 certification status.
In particular, it seeks to establish and observe how the take up of a Quality
Management system such as ISO 9001 series is related to the economy of the
developing countries compared with standard economic indicators such as GDP.
It also seeks to benchmark the trend of ISO take up in these three developing
countries that is Nigeria, Kenya and Egypt to its corresponding developing
countries in other continents namely Mexico and China which were chosen
because of their relative size of economies and it‟s level of ISO take up amongst
developing countries.

9
It will finally look at the pros and cons of ISO certification take up to developing
economies in terms of advantages and cost.
1.3 Research methodology
In the process of my research, the research method used is primarily
quantitative in nature, with some qualitative elements for explanation.
In order to achieve the objective of this research, an exhaustive literature review
of ISO 9000 studies has been carried out. For this purpose, articles were
analysed, which were sorted in the following categories, according to the used
methodology: surveys; analysis of financial indicators; case studies; interviews;
literature review; and statistical data analysis.
Qualitative includes past literature review by both native and foreign quality
management authorities which may be in form of books, newspapers,
presentations and journals .This qualitative method is to give a general overview
of ISO development,criteria,advantages and disadvantages in the context of
developing countries and the cultural issues of ISO take up in developing
economies.
Quantitative methods such as the use of statistical tools i.e. excel was used for
regression to get the co-efficient of correlation which shows the level of
relationship between the dependent and the independent variable. Also,
tables/scatter diagrams and graphs were used to show the trend and conduct a
time series analysis for a period of 10years for ISO intensity in the five countries
studied.
The quantitative tool that was decided as the most appropriate for the present
study basically consist of using the Pearson‟s technique for calculating the
correlation coefficient (r) and (r^2) using Microsoft excel .This particular
technique for calculating correlation coefficient was chosen because it is more
suitable to measure the strength and the direction of a linear relationship
between two variables when ratio-typed data are used.

10
The main result of a correlation is called the correlation coefficient (or "r"). It
ranges from -1.0 to +1.0. The closer r is to +1 or -1, the more closely the two
variables are related. If r is close to 0, it means there is no relationship between
the variables. If r is positive, it means that as one variable gets larger the other
gets larger. If r is negative it means that as one gets larger, the other gets
smaller (often called an "inverse" correlation).
Also, a coefficient of determination was calculated. This was done by squaring
“r”, which makes them easier to understand. The coefficient of determination (r-
squared) is the square of the correlation coefficient and its value may vary from
zero to one. It has the advantage over the correlation coefficient in that it may
be interpreted directly as the proportion of variance in the dependent variable
that can be accounted for by the regression equation. For example, an r-squared
value of .49 means that 49% of the variance in the dependent variable can be
explained by the regression equation. The other 51% is unexplained.
1.3.1 Data Collection
The data used in the research was obtained from relevant literatures, WebPages
such as the United Nations website, ISO website, UNESCO, Country specific
websites and previous journals and articles that may be relevant. Of particular
interest will be data obtained from ISO webpage and UN websites as I believe
they provide robust and best verified result s and also contains less or no errors.
1.4 The development of Quality Managements standards (ISO
9000series overview)
Quality Management Systems are defined in ISO 9000 series as “the
organisation structure, responsibilities, procedures, processes and resources for
implementing quality management”.
Quality systems standards are based on accepted, rational, Scientific
Management principles such as the assignment of individual activities, the
maintenance of records and the development of effective administrative

11
procedures. Manufacturing and service organizations must implement a quality
system according to the requirement of the appropriate standard to receive
recognition and be certified or register to the standard.
Quality Management System is referred to as a business management system
that can be applied to all business sectors and all sizes of companies. If you
think of a business as a set of processes it identifies the key process areas that
need to be addressed to ensure quality is managed effectively. Moreover, quality
management systems are designed to provide the support and mechanism for
the effective accomplishment of quality-related activities in organizations. It is
recognized as a systematic means to manage quality in organizations (Kolka,
2002). In broader sense, Goetsch and Davis (2005, p. 174) indicated that the
quality management system “consists of all the organization‟s policies,
procedures, plans, resources, processes, and delineation of responsibility and
authority, all deliberately aimed at achieving product or service quality levels
consistent with customer satisfaction and the organization‟s objectives. When
these policies, procedures, plans, etc. are taken together, they define how the
organization works, and how quality is managed.” An example of quality
management system is the well known ISO 9001:2000.
Amongst others, Tsekouras et al. (2002) suggest that a company‟s effort can be
strengthened through applying QS 9000, the European commitment to
excellence award (EFQM), the Malcolm Baldbridge award in the USA and the
Deming price in Japan. Nevertheless, the most prestigious and widely
implemented quality management standards is said to be the ISO 9000 series of
certificates. The contribution of ISO 9000 to business excellence has been
extensively discussed in the quality literature (Van der Wiele et al., 2000:
Boutler and Bendel, 2002; Bendell, 2000; Magd and Curry, 2003).
The world-wide introduction of quality systems standards is one of the most
successful efforts at international standardisation resulting from globalisation.
Current national and international quality systems standards have developed
from those introduced in the 1950s by the US armed forces in order to ensure

12
that defence suppliers adopted an effective system for the management of
product quality assurance.
All industrialised and most developing countries now have civil quality systems
standards, issued by a national standardisation body. The growth in companies
which are certified to have a quality system according to their national quality
systems standard has been remarkable. All these national standards are
compatible with, and are largely identical to, the ISO 9000 series. Hence a
company in the UK can readily accept that a supplier in Nigeria has an
acceptable quality assurance system, without the need to perform a quality audit
on that company by themselves. This has greatly facilitated global trade.
In 1987, the International Organisation for Standardisation (ISO)
(http://www.iso.ch/), after consultation with national standardisation bodies,
introduced the ISO standards 9000, 9001, 9002, 9003 and 9004.In 2000 revised
versions of the ISO 9000 standards appeared which are still in use by many
companies. A new version of the standard with more significant changes
was issued in late 2008, which should be adopted world-wide by all
certified companies during the period up to 2010.
The ISO 9000 series no doubt is the most successful global Quality management
System ever has backed up by the rapid rate at which is been taken up by
organizations in different countries all over the world. For example, in 2002, the
number of organization certified was 167,124 which in the year 2008 has risen
tremendously to 982,832 according to the ISO certification survey statistics for
2008
The importance of effective accreditation in developing and newly industrialised
countries cannot be over-emphasized. This is because ISO 9001 certification is
nowadays a qualifier to entry to lucrative global markets. As stated by Tannock.
(2010),”countries must have regulation of certification bodies, to avoid abuses
and corruption (such as purchase of certificates, which was rife in India in the
1990s)”.

13
Figure 1: Number of organizations certified ISO 9001
YEAR 2002 2003 2004 2005 2006 2007 2008
NO.OF ISO
CERT
167,12
4
497,91
9
660,13
2
773,86
7
897,86
6
951,48
6
982,83
2
Source: ISO Certification Survey 2001-2008
1.5 Developing country overview
Developing country is a term generally used to describe a nation with a low
level of material well-being (not to be confused with third world countries)
.Countries with more advanced economies than other developing nations, but
which have not yet fully demonstrated the signs of a developed country, are
categorized under the term newly industrialized countries
Developing countries are in general countries which have not achieved a
significant degree of industrialization relative to their populations, and which
have, in most cases a medium to low standard of living. There is a strong
correlation between low income and high population growth

14
The development of a country is measured with statistical indexes such as
income per capita (per person) (GDP), life expectancy, the rate of literacy, et
cetera. The UN has developed the HDI, a compound indicator of the above
statistics, to gauge the level of human development for countries where data is
available.
The following are considered emerging and developing economies according to
the International Monetary Fund's World Economic Outlook Report, October
2009: Nigeria, Mexico, China, Brazil, Egypt, Tanzania, Pakistan, Egypt, Argentina
etc
The benefit of ISO 9000 series in developing economies in terms of
standardization cannot be overemphasized. According to United Nations, since
developing countries have scarce resources, there is need for them to invest
them wisely. Making wrong choices may have serious economic and social
consequences to such economies.
If there is no standardization in place, the effort to export local product comes to
nothing because they do not meet the regulations/criteria for foreign market.
Also, imported technology turns out to be unsuitable for local conditions and
therefore drains investment in an investment development program which in
turn affects the GDP and other economic indices of developing economies.
1.6 Reason for selecting this topic
The importance of applying ISO 9001 series has been increasing over the past
few years, not only in the developed economies but also in the developing
countries all around sub-Saharan Africa, This is evident by the increase in the
number of certifications by developing economies in Africa. As earlier discussed
that the ISO 9001 series is been regarded as the entry qualifier into the global
market place to trade, for the developing country, the added cost to certify and
then maintain certification may not be justified if product end user countries do
not require or derive the full advantages ISO 9000.Hence the need to observe
and establish the degree of relationship, if any , between this QMS and the

15
economy of the selected developing countries by using an economic indicator
such as GDP as a measuring index.
Current literatures although few, focus on the advantages of ISO take up to
developing economies on a macro level but there are no current literatures that
looks at the level of relationship between ISO certification take up and selected
economic indicators regarding Africa so as to determine if getting certified has a
major impact on the economy by using economic indicators such as GDP and
Export as a measuring device. This dissertation seeks to provide such
information.
1.7 Users of Dissertation findings
At the end of the study, the findings of this dissertation will be useful to the
following:
Government of the selected country- the information provided about the
relationship between ISO 9000 series and economic indicators of the selected
countries will help in the formation of public policies. Arms of government such
as chambers of commerce and departments involved in economic policy
formations can use the statistical ratios that will be offered, for international
comparism i.e. benchmarking against other countries and to provide the
necessary assistance to encourage more certifications if needed.
Prospective international investors-Companies wishing to conduct
international operations from the selected developing countries been observed
will also benefit from the findings of this dissertation. Insight will be gained on
the importance of a worldwide Quality Management system such as
ISO9001certification, the advantages to businesses and how to get certified
Academics-Scholars and academic who wish to study more about the ISO
9000 series and developing countries will find the dissertation helpful in terms of
understanding relationships between some economic indicators and ISO

16
certification take up of the selected countries by way of using the data that is
collected and analyzed.
Developers of related standards-I believe the findings of this dissertation will
be useful to competitors to ISO 9000 series who also develop related standards.
The statistical data and the fashion trend of ISO take up in the studied countries
will help them project and understand how companies in these countries would
react to related standards.
1.8 Dissertation structure
Chapter 1 contains brief introduction and background to the dissertation topic
(Relationship between key economic indicators and ISO certification take up in
selected developing economies).In addition, it gives an overview of the definition
of developing countries and a historical review for the development of Quality
Management Systems is presented where the ISO 9000 series of standards is
identified as the most helpful and widely implemented standard.
In this chapter, the research methodology which is primarily quantitative is
described. A statistical software package was used to perform a regression so as
to show the relationship between the economic indicators and number of ISO
certifications. Also, tables/scatter diagrams and graphs was used to show the
trend and conduct a time series analysis for a period of 10years for ISO intensity
in the five countries studied.
Chapter 2 is the literature review. This has to do with an in depth analysis of
the ISO 9000 certification and covers all aspects including a brief overview,
reasons for seeking ISO certification, benefits and cons to developing economies.
Chapter 3 gives an introduction into the political history, background and the
economies of Nigeria, Kenya , Egypt, Mexico and China.Finally,the trend of ISO
9001 take up in the counties listed above will be shown and the economic
indicator i.e. GDP data will be introduced. Mexico and China will then be used
for comparism with the above listed African countries.

17
Chapter 4 is the analysis, results and discussion section which involves the
process of analyzing the collected data and discussing the findings. Results will
be analysed in both qualitative and quantitative terms for better understanding.
Finally, chapter 5 provides conclusions and recommendations to the prospective
users of this dissertation finding. This is then followed by the References section
and the Appendix.

18
CHAPTER 2: LITERATURE REVIEW
This chapter deals with an in-depth analysis of ISO 9000 including an overview,
principles and implementation process, reasons for seeking ISO certification,
benefits and cons to developing economies. However, since the most viable
certificate today is the revised version 2008 as other users of version 2000 are
in the process of updating, this chapter will provide discussion of post 2000
versions as all versions before this period will be considered outdated, hence not
discussed.
2.1 Historical overview of ISO 9000
The history behind the ISO 9001 of standard can be traced to the USA - during
World War II. From the USA, the concept of quality assurance spread to Europe
via NATO where it evolved into the Allied Quality Assurance Publication (AQAP).
This series of documents discussed everything from production efficiency to
selection of suppliers. The AQAP series were adopted by the UK Ministry of
Defence for the British Armed Forces. This series had a trickledown effect as
organizations began to require quality assurance programs from their suppliers.
The problem was that there was much diversity in the requirements for different
organizations. The diversity issue was addressed by the British Standard BS
5750 which was based on the AQAP series and was introduced in 1979. The BS
5750 standard was considered so effective that it was adopted almost without
change by ISO in 1987 as ISO 9000.
ISO 9000 comprises of a series of international standards and supplementary
guidelines on quality management and quality assurance. Typically, an ISO 9001
certificate proclaims to the world that an organization has a standard procedure
for every part of its business. In a broader sense, the basic task of ISO 9000
series is to ensure that product and services are designed, created and delivered
in conformance to certain standards and specifications (Buttle, 1997).According
to (Anderson et al., 1999),”ISO 9000 standards are management tools based on

19
the systemization and formalization of tasks in order to obtain uniformity in the
product and to conform to specifications established by the customer”.
The ISO 9001:2008 is an international standard on quality management system
(QMS) that promotes a systematic approach towards the management of
product quality. It was first published by the International Organization for
Standardization (ISO) in 1987 and later revised in 1994 and 2000. In 2008, it
went through another revision in order to accommodate current needs. Hence, it
is now referred to as ISO 9001:2008. Within each published version of the ISO
9000 family, various standards are included.
The newest edition includes three different standards namely ISO 9000, 9001
and 9004.Among them, the core of the quality management system is ISO 9001,
while the others provide helpful information and guidance. Hence ISO 9001 will
be our focus during the course of this study as it is the core of quality
management system.
Below is the simple evolution diagram of ISO 9001 from inception till date
Figure 2: Evolution of quality standards
Source: Modified from QualityGurus.com
It should be noted that the ISO standards are revised because the ISO standards
development rule requires periodic review to keep the standards up to date. This
must be initiated within a maximum of five years after the publication of the
standard. Also the ISO 9001 standards are revised to keep up with recent
Evolution of ISO 9001 quality standards
ISO 9001
1987
ISO 9001
1994
ISO 9001
2000
ISO 9001
2008

20
development in management practice and to accommodate user input
suggestion.
2.2 ISO 9000 in figures
With the central secretariat in Geneva, Switzerland, ISO has managed over the
years to establish the most recognized and helpful quality management scheme
globally. As a proof of its success, ISO conducts a survey at the end of each year
aiming to highlight the continual rise of ISO 9000 users. The latest survey of
certification is that of 2008,which reveals that by the end of 2008,the worldwide
total of ISO 9000:2000 certificates was at least 982,832 in 176 countries and
economies, an increase of 3% over 2007,when the total was 951 ,486 in 175
countries and economies.
It should be noted that the total includes ISO 9001:2000 and ISO 9001:2008
certificates, which have been culminated because ISO 9001:2008 which was
published on 15 November 2008, contains no new requirement compared with
the older 2000 edition which it replaced.
Moreover, it may be appreciated from the following table below that the big
bulge in ISO 9001: 2000 registrations took place in 2003,and this can be
explained by the fact that this was the final change-over date from the 1994
version to the 2000 version.
Table 1: ISO 9001:2000/2008 principal results
Source: ISO survey of certificates (2008)
Based on continent, the leading continent in ISO 9001 registration has always
been Europe. As at December 2008, the share in percent for Europe was

21
46.33% followed by Far East with 36.28% and North America with 4.87%.But a
closer look points out that a rapid lift up has been taking place in the far east for
the past five years whilst the European continent has seen a slow decline in
numbers of certification gained. Of particular interest is the slow but steady
increase in the no. of ISO certification in the Africa and West Asia continent,
which now has a share of 7.44% as against 4.76% in 2004. See table below.
Table2: ISO 9000 regional share (expressed in percentage)
Source: ISO survey of certificates (2008)
Finally, according to the 2008 ISO certification of survey, the Top 10 countries
which makes up for the total number of ISO certificates are china who is the
lead, Italy, Spain, Japan, Germany, United Kingdom and Korea. As we can see
from the table below, it is interesting to note has China has risen steadily over
time to become the number one country with the highest number of certification
in the world. One can argue that the reason for this is because china is fast
becoming highly industrialized nation with so many companies and organizations
especially from the western world outsourcing their production activities to China
to take advantage of cheap labour cost and the local know-how of china. The
results below reflect the huge importance that the Chinese economy is assuming
on global trade and worldwide quality.

22
Figure 3: Top 10 countries for ISO 9001:2000/2008
certificates
Source: ISO survey of certificates (2008)
2.3 ISO 9001:2008 (Revision) overview
ISO 9001:2008 is part of the ISO document that lists the requirements an
organization must comply with 9000 family of standards, and is the to become
ISO 9001 Registered.ISO 9001:2008 provides a valuable process approach to
quality management, by better understanding the "horizontal" interaction of
departments or business units within your organization, you can ensure that all
of their functions create real value for your customers.
ISO 9001:2008 was published on 15 November 2008. As of 15 November 2009,
all audits must be performed against the requirements of this new version of the

23
standard, any remaining ISO 9001:2000 certificates will become invalid on 15
November 2010. Until then, certificates to ISO 9001:2000 are still considered
equal to certificates to ISO 9001:2008.
Compared to the 2000 revision of ISO 9001, ISO 9001: 2008 – the fourth
edition of the standard – represents fine tuning, rather than a thorough
overhaul. It introduces clarifications to the existing requirements in ISO
9001:2000, based on user experience over the last eight years, and changes
that are intended to improve further compatibility with the ISO 14001: 2004
standard for environmental management systems. The new edition of ISO 9001
does not introduce additional requirements, nor does it change the intent of the
ISO 9001: 2000 standard. No new requirements have been introduced in the
new edition, but in order to obtain the maximum benefit from the clarifications in
ISO 9001: 2008, the users of the 2000 edition must consider whether the
clarifications have an impact on their current interpretation of ISO 9001:2000. If
that is the case, some modifications to the implementation of their quality
management system (QMS) based on ISO 9001:2000 may be necessary. As with
the preceding editions, certification is not a requirement of ISO 9001:2008.
Organizations are free to implement the standard for the internal and external
benefits that it brings to them and to their clients. However, it is recognized that
hundreds of thousands of ISO 9001 user organizations have chosen to have their
QMS independently certified as conforming to the requirements of ISO 9001.
The appendix 1 contains annex B of ISO 9001:2008 which has a full, detailed list
of the changes from ISO 9001:2000.
2.4 ISO 9001: 2000
The ISO 9001:2000 has formalized an effective system for evaluating the ability
of any firm to consistently design, produce, and deliver quality products/services
(Fuentes et al., 2000; Martinez-Lorente and Martinez-Costa, 2004; Terziovski et
al., 2003; Wayhan et al.,2002). ISO 9001:2000 provides guidelines for
organizations to establish their quality systems by focusing on procedures,
control, and documentation (Sun et al., 2004).

24
Therefore, the objectives of ISO 9001:2000 is the provision of consistency in
products, meeting customer and regulatory requirements and having systems
that address customer satisfaction, continual improvement, prevention of non-
conformity, and the adoption of a system approaching Total Quality
management (TQM) (Goetsch and Davis, 2005). The ISO 9001:2000 is based on
the concept that certain minimum characteristics of a quality management
system could be usefully standardized, giving mutual benefit to suppliers and
customers, and focusing on process rather than product/service quality (Van der
Wiele et al., 2005; Dick et al., 2002). ISO 9000:2000 is perceived as a
management control tool, a driver of innovation, and plays a strategic role within
organizations in focusing and ensuring the delivery of quality products/or
services (Van der Wiele et al., 2005). This is seen through the fact that ISO
9001:2000 encourages the adoption of the “process approach” for the
management of the organization and its processes, and as a means of
identifying and managing opportunities for improvement. The processes
approach is developed based on the belief that a desired result is achieved more
efficiently when activities and related resources are thought of as a process
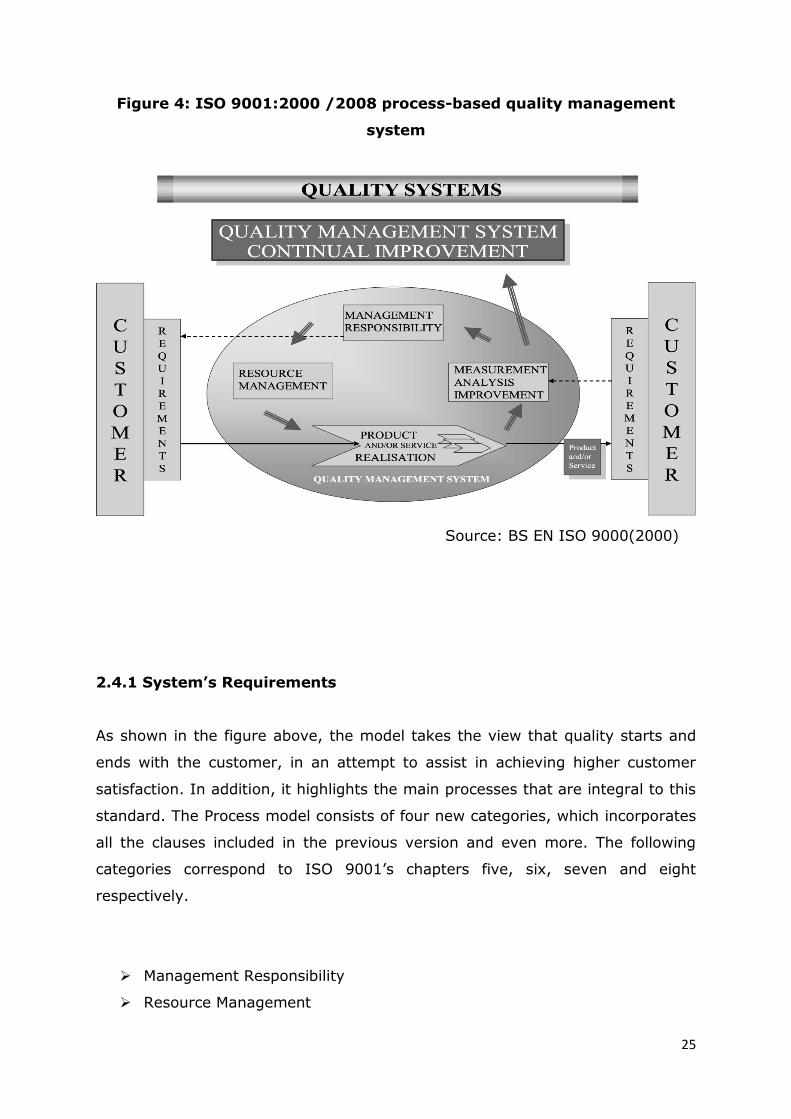
(Bhuiyan and Alam, 2004). Figure 4 illustrates the model of the process-based
quality management system approach recommended by ISO 9001:2000, where
the process-based model defines a quality management system as a single large
process which links sub-processes in a continuous improvement cycle.
The utilization of process approach emphasizes the importance of understanding
and fulfilment of requirements, the need to consider processes in terms of added
values, obtaining results of processes and continual improvement of process
based on objective measures (Tan et al., 2003). Moreover the generic
requirements of the new edition are depicted as linked processes (Janas and
Luczak, 2002). Figure 4 illustrated the process approach, which include the
following as briefly explained by Biazzo and Bernardi (2003, p. 156):
25
Figure 4: ISO 9001:2000 /2008 process-based quality management
system
Source: BS EN ISO 9000(2000)
2.4.1 System’s Requirements
As shown in the figure above, the model takes the view that quality starts and
ends with the customer, in an attempt to assist in achieving higher customer
satisfaction. In addition, it highlights the main processes that are integral to this
standard. The Process model consists of four new categories, which incorporates
all the clauses included in the previous version and even more. The following
categories correspond to ISO 9001‟s chapters five, six, seven and eight
respectively.
Management Responsibility
Resource Management

26
Product realization
Measurement Analysis and Improvement
Each one of these categories has a number of sub-clauses. A detailed analysis of
the standard that shows that it contains at least 22 smaller processes as
identified by Praxiom Research Group Ltd; a Canadian based company (Bhuiyan
and Alam, 2005). Nevertheless, the total amount of requirements incorporated
in the actual ISO 9001 is more than fifty.
Documentation Requirements
The fourth chapter of ISO 9001 quality management system describes the
documentation requirements for implementing the scheme. Particularly the
organisation is obliged to present written statements of quality policy and quality
objectives, quality manual. Documented procedures required by the standard
and records keeping for planning, operating, and controlling all processes.
However, while the included documentation clauses are mandatory to all
organisations, the extend of detail may vary depending on the firm‟s size and
type of activities, the complexity of processes and their interaction, and the
competence level of the workforce (ISO,2006).
Management responsibility
According to this category of the model, senior management should provide
evidence of its commitment to the successful and effective development and
continuous improvement of the scheme. In addition, since this is a customer-
driven system, it should be indicated that top management ensures the
determination of customer requirements and expectations. Another significant
aspect of management responsibility, that is also mandatory for ISO 9001
registration, is the promotion if internal communication among all involved
parties so that all processes and procedures are ensured to operate at the
highest degree of effectiveness.
One way of documenting these requirements is through the firm‟s quality policy
which represents the basic aims and goals with regards to quality. Another proof

27
could be through presenting evidence that quality objectives are defined and
reviewed periodically. Nevertheless, written statements are not enough. Actions
such as conducting internal audits or customer surveys, concerning their
satisfaction and loyalty towards the firm‟s products or services, are essential.
Even more, a management review of the organization‟s quality management
system should be planned at frequent intervals so that suitability, adequacy and
effectiveness are ensured.
Resource Management
The intent of this clause is to make sure that the audited firm provides the
resources required for implementing, maintaining and continually improving the
quality system. In this context, human resources, infrastructure and working
environment should be managed at the most competent level. This means that
evidence has to be provided that the organisation aims at improving the
performance of its employees, equipment, supporting services as well as the
workplace.
As essential part of good plan, regarding personnel performance is to
appropriately plan work allocation. In this way, an employee is ensured to carry
out the job that he knows best. Moreover, education and training should be
fundamental elements in the firm‟s agenda, in order to enhance its overall
operational performance and avoid nonconformity. For the case of infrastructure,
which basically consists of the premises and machinery, a good plan would be to
develop various investment initiatives such as expansion of buildings or
purchases of new equipment. Similarly, it is important to ensure that working
conditions within the organisation are suitable. Actually, international legislation
nowadays, places strong focus to be addressed could be involved with providing
the appropriate lighting or air quality in the work environment and performing
frequent maintenance to the plants and equipments.
Product Realisation
Since all organisations are involved in the production of either products or
services, it is essential for them to be able to effectively manage all aspects of
the production process, from the determination of customers‟ desires and

28
through to the design and development, production and final preservation of the
finished output. Indeed, this clause is solely dedicated to product realisation
having as a target to verify that product or services conformity is achieved.
Simply put, it is required that the organisation monitors and keeps records for
the process of transforming inputs into end-products or services.
The process initiates from the development of an effective communication
channel with customers which is necessary for determining the requirements
specified by then as regard to products specification, delivery or post-delivery
activities. Furthermore, it encompasses the documented procedure required for
providing that the organisation keeps track of the production process. This
includes the design and development of product, purchasing and verification of
purchased products, control of production and validation of processes for
production and service provision. In addition, product identification and
traceability is necessary so as to be able to recognise the status of the
product/service at all times. Actually, this attribute finds god use in the case of
need for product withdrawal from the market. After the production process is
complete, the organisation is obliged to ensure the preservation of the output in
terms of providing efficient storage areas and appropriate handling equipment
and following all regulations on packaging, storage periods and delivery.
Measurement, Analysis and Improvement
Although the aspect of conducting market surveys, aiming to determine
customers‟ requirements, is important to the standard, the process of measuring
and analysing the collected data is even more vital. In line with this suggestion,
the organisation shall be keen in evaluating its position against customers,
having as a target to instil their satisfaction. Furthermore, monitoring and
measurement should be conducted on products and processes, so as to verify
their conformance to specifications. Audited enterprises are expected to
undertake periodic internal audits and provide evidence for documented
corrective and preventive actions. Additionally, they have to be able identify and
control non-conforming products and further to follow procedure to follow
procedures for correcting or even avoiding their occurrence.

29
One of the most critical modifications, within the revised ISO 9000:2000, is the
addition of the continuous improvement sub-clause. According to this request,
companies shall take all appropriate measures to endlessly advance the QMS,
through the use of quality objectives, analysis of data, audit results, corrective
and preventive actions and management review. Once again, it is suggested that
any improvement activities should be taken step-by-step. What is meant by this,
is that when opportunities for improvement are identified, they should be
implemented based on the available resource and in alignment with the
regulations. Even more, it might sometimes be needed to prioritize the
application of such activities.
Finally,ISO 9001:2000 uses the PDCA (Plan-Do-Act-Check) improvement circle
to enclose the four blocks of management responsibilities, resource
management, process management, measurement, analysis and improvement
(Ho, 2002). The PDCA methodology can be applied to all processes and can
briefly be described as follows:
(1) Plan. Establish the objectives and processes necessary to deliver results in
accordance with customer requirements and the organization policies.
(2) Do. Implement the processes.
(3)Check. Monitor and measure processes and products against policies,
objectives and requirements for the product and report the results.
(4) Act. Take actions to continually improve process performance.
ISO 9000 certification supposed to help companies to identify mistakes,
streamline their operations, and be able to guarantee a consistent level of
quality products/services (Kartha, 2002). In support of this further, Dick (2000,
p. 368) stated that: “you should expect greater responsibility, accountability and
quality consciousness among your staff, better use of time and resources,
greater consistency and traceability of product/service, less wastage through
product or service failure, continual improvement to your quality and efficiency,
improved profit and wider market opportunities”.

30
2.5 Implementation Process
Following the principle that the development of any quality management scheme
should not be made through hasty radical changes, it can be realised that in
order for ISO 9001 to perform more efficiently, its implementation should be
based on a gradual step-by-step build up. Interestingly, a study by Motwani et al
(1996), which is one of the most often cited in the literature, reveals that the
path towards certification is on average, a two years long process, and it
consists of eight distinct stages. Of course, it is possible that some companies
will manage to achieve registration earlier while others are likely to face more
difficulties and thus extend the registration period even longer. In any case, it is
essential that the organisation matures enough so that to clearly anticipate what
is involved within the system, what are the requirements, and prepare
appropriately.
According to Motwani et al‟s(1996) model, when initially starting to get ready for
ISO 9000, the organisation needs to go through the awareness stage. At this
point, information needs to be obtained by attending seminars on ISO 9000.
Following the organisation moves on the management decision and commitment
stage where they shall set the deadlines and goals regarding the scheme‟s
implementation. An essential part of this stage involves the in-depth analysis of
the standards and decisions should be made as to if the system will affect the
firm‟s activities and related processes. If the organisation wishes to proceed with
the application of the standard, the next step involves the initial preparation.
Some of the key elements incorporated within this stage are the establishment
of task teams and quality control council, the familiarization of the personnel
with the system and the selection of a third party association body that will
provide some guidance along the way and will perform the final audit and
assessment. The next stage is the most challenging and time consuming and it
has to do with the preparation of the quality manual. In fact, this is where the
guidance from the independent association bodies comes in handy. Notably,
based on their suggestions, and after the determination of the processes that
need to be modified so they comply with ISO 9001‟s requirements, the
organisation shall establish audit procedures, upgrade procedures and provide
basic training to its employees. After that, a pre-audit assessment stage follows

31
aiming to ensure the adequacy and compliance of the applied procedures. Even
more, at this point the organisation needs to develop appropriate corrective
actions that would provide the flexibility to respond rapidly to potential
inefficiencies and breakdowns.
The next step involves an initial quality audit that basically serves as a rehearsal
for the final assessment. According to Juran(1998), a quality audit can be
defined as an independent re-evaluation which is conducted in order to compare
some aspects of a firm‟s quality performance with the standards for that
performance. Typically, there are two types of audit namely the internal audit;
where the organisations quality management system comes under the scrutiny
of a third party accreditation body or even the customers‟ (Tannock, 2010). In
the case of the initial internal audit, the organisation shall inspect the efficiency
of the applied scheme and in case of non-conformance; it shall develop a
corrective action plan. If any types of deficiencies occur, a follow-up audit and
final assessment takes place so as to ensure that scarcities are corrected.
Despite the fact that this is not common, sometimes, companies may get it right
from the first time. If that is so, a follow-up audit is not required, and they move
to the final step of the implementation process. This involves the final
assessment and registration to ISO 9001:2000. At this point, it is suggested by
the standard that the effort should not be abandoned as certification is achieved,
but rather the accredited firms shall maintain registration and ensure that
further internal audits are planned at frequent time intervals. Even more, they
should set continuous improvement goals so that overall quality will be
enhanced ubiquitously.
2.6 Driving forces for seeking certification
Although the motive for implementing an ISO quality management scheme are
usually concerned with cost reduction, productivity improvement and quality
improvement, surveys point out that companies select to do it for other reasons
as well.Yahya and Goh(1999) note that the reasons that push companies to
achieving ISO 9000 certification can vary depending on the type of firm and can
be grouped into categories.Lipovatz et al (1999) indicate two main groups,

32
namely external or market related and internal reasons. In addition, Jones et al.
(1997) identify three main categories namely developmental, on-developmental
and mixed reasons. According to them, on-developmental reasons are linked to
the external environment of the firm and are driven mainly by major customer‟s
requirements and the desire not to be locked out of the market. On the other
hand, developmental reasons have to do with the desire to enhance the overall
competitive performance of the organization and to improve internal process.
Consequently, it can be extracted that although researchers may use different
terms, they all concur to external circumstances, internal procedures or a
mixture of both as being the prime drivers towards ISO certification.
However, empirical evidence shows the dominance of external factors. A study
conducted by Fuentes et al.(2000) indicates that most companies apply a quality
management system such as ISO 9000,because of their customer‟s requirement
meaning that they mainly aim at improving their image in order to enter new
markets.Furthermore,this is supported by the studies of Vouzas and Gotzamani
(2005),Bhuiyan and Alam (2005),and Lipovatz et al.(1999).Other than customer
requirement, a survey undertaken by the intercollege (2003) in Cyprus, shows
that many companies also choose to initiate the ISO 9000 due to the fact that
competitor companies has already done so.Actually,this motive reflects on their
desire not to be perceived as inferior against rival firms in terms of quality.
There are various literatures that have suggested many reasons as to why
companies seek ISO certification (Buttle, 1997; Magd, 2004). These reasons
from various literature were condensed to 14 reasons in the survey carried out
on Egyptian companies(see Table 3), the driving forces were adapted from a
similar study performed on an African country by Magd (2004).Participants were
asked to rate the importance of these reasons on a five-point scale.
Table 3 presents the driving forces as identified by the participants in terms of
mean score and standard deviation. It also presents rank ordered responses. It
is clear from Table 3 that the most important driving forces for seeking ISO
9001:2000 certification are to improve the efficiency of the quality system; to
achieve customer satisfaction; pressures from competitors/foreign partners; to
maintain/increase market share; avoid potential export barrier and to meet
government demands requirements or pressure.

33
Improving the efficiency of the quality system and achieving customer
satisfaction appear to be the leading driving forces for seeking ISO 9001:2000.
It is clear that Egyptian managers recognized that the standard is geared
towards quality system efficiency and customer satisfaction rather than
achieving quality improvement ranked seventh place. Seeking ISO 9001:2000 as
a step towards Total Quality Management (TQM) was not a significantly
important driving force for seeking certification. This is an interesting
observation, as it reflects the Egyptian manufacturing companies‟ level of
ambition with regard to quality as well as their awareness and understanding of
the possibilities of using the standard as a tool for internal growth.
Table 3: Driving forces for ISO 9001:2000 certification
Source: Modified from Magd, 2006
2.7 Barriers to ISO effective implementation
Evidently, the path towards ISO 9000 registration is not always pleasant or
easy. A survey of Singapore industries identifies that the main barriers against
the implementation of the scheme are lack of management support and
commitment, employee resistance to change, lack of understanding of the ISO
9000 system and constraints of resources (Quazi and Padibjo, 1998).Moreover,
Lipovatz et al. (1999) expose difficulty in training of personnel and allocation of
workforce responsibilities as prime complications in Greek companies. For

34
Cyprus enterprises, the study conducted by the intercollege (2003) reveals that
the system‟s bureaucracy and the addition of time consuming procedures were
the major road blocks.Yet,the above finding seems to depict only general
difficulties of ISO 9000 certification and they do not offer any information on the
level of difficulty in fulfilling each of the scheme‟s requirements (yahya and
Goh,2001).having this in mind, they note that studies on this area will be
valuable for those companies that are preparing for ISO 9000 accreditation.
In comparison with other studies (Mezher et al., 2004; Ruzevicius et al., 2004;
Bhuiyan and Alam, 2005; Magd, 2004; Chow-Chua et al., 2003; Lee, 2004;
Yahya and Goh, 2001;Calisir et al., 2001), these studies suggested the most
important barriers to ISO implementation are top management commitment,
financial resources and training and education. It is clear that the present
findings are consistent with previous studies, which focused on ISO 9001:2000
and ISO 9000: 1994, which confirmed that top management commitment,
financial resources and training and educations are reported as the main barriers
for the effective implementation. The findings are extremely significant for policy
makers, whom can easily identify which barriers can be reduced or eliminated to
produce an effective implementation of ISO 9001:2000.
Below is the result of the analysis carried out by a team of researchers who
found out by their research that lack of top management commitment was the
most important barrier to implementing ISO 9001:2000 whilst the least
important factor as found out was deficient supplier control

35
Table 4: Barriers to ISO 9001:2000 implementation
Source: Adapted from Magd,2005
Based on the data collected and provided, it was suggested that the barriers
listed above can be classified into three major ones, which are as follows:
(1) Organizational commitment through top management commitment; failure
to define responsibility and authority for personnel; organizational resistance to
change; and difficulties in motivating staff participation.
(2) Resources through lack of financial resources; insufficient quality education
and training; and lack of qualified personnel.
(3) Quality system and suppliers through scratchy documentation, procedures
and records; and poor supplier involvement.
Certainly, not only obstacles occur prior to registration. According to chin et al.
(2000), the maintenance of the system after certification is also crucial. Their
study suggest that the most significant clauses in maintaining ISO 9000 are
corrective and preventive actions, internal quality audits, management
responsibility, document and data control and control of quality records.
2.8 Benefits from ISO registration
The international Standards Organisation, national accreditation registrars and
the third party accreditation bodies in Europe and the USA all make claims for
ISO 9000 certification leading to business performance improvement. Even so,

36
ISO‟s claims are very subjective and mainly concerned with “doing things better”
and providing real benefits to all businesses, customers, governments, trade
officials, consumers, developing countries and the entire planet as a whole(ISO,
2006). On the contrary, the British Standards Institute claims more objective
benefits such as greater responsibility, accountability and quality consciousness
among staff, better use of time and resources, greater consistency and
traceability of product of service, less wastage through product or service failure,
continual improvement to quality and efficiency, increased profitability and wider
market opportunities (Dick, 2000). In addition, the American National
Accreditation Board (ANAB), The US accreditation body for quality management
systems, states that the most substantial benefits from implementing a scheme
based on ISO 9000 includes increased operational efficiency, cost savings from
less scrap and rework, cost savings from fewer warranty claims, a competitive
edge, perceived higher quality, and increased market share( ANAB, 2006). In
the same line, the UK-based National Quality Assurance (NQA) institute, an
accredited certification body carrying out third party assessment in both the UK
and the USA, makes specific states. Particularly, it claims that ISO 9000
reinforces a company‟s management system, provides a framework for
controlling and improving business activities, adds value to products and
services, adds to competitiveness and provides a market edge (NQA, 2006)
Besides the opinions of these international accreditation bodies, various scholars
and researchers have conducted surveys in order to determine whether ISO
9000 registration is beneficial or not. Actually, it has been confirmed that ISO‟s
successes is not without reason. Without doubt, the findings of such surveys
should be considered much more objective and helpful since they are based on
real world organisations that have already implemented the scheme and thus
observed its effects. At this point, it should be states that the overall benefits the
organisations gain from the standard are related to the motive that initiated the
drive for the certification. Therefore, just as the motives for seeking
accreditation are grouped into internal or market related, most studies focus on
the benefits achieved either in the internal or external organisational
environment. Poksinska et al..,(2006) argues that the organisations that seek
certification due to the desire to enhance internal processes usually achieves
higher overall benefits. Conversely, companies that apply ISO 9000 because of

37
the market pressure, achieve major benefits mostly in the fields concerned with
corporate image and market position.
Comparing the findings on the main positive outcomes of implementing ISO in
Egyptian manufacturing organizations and other studies on ISO 9000: 1994,
Magd (2004), Magd and Curry (2003); Dissanayaka et al. (2001), Ragothaman
and Korte (1999), Van Der Wiele et al. (2000), Yahya and Goh (2001), Dick et
al. (2001) and McAdam and Fulton (2002) investigated the main benefits of
implementing ISO in Egypt, Hong Kong, the USA, Malaysia, The Netherlands,
Spain, the UK, and the Republic of Ireland. These studies were similar to the
present study, and it should be made clear that the methodology is different, but
the results are comparable with the present study. They suggested that the
most important benefits occurring from implementing the standard were:
Improves documentation; improves the efficiency of the quality system; clearer
work instruction/procedures and job responsibilities; helps supplier selection;
improves product/service quality; helps develop quality management;
promotional tool; improves export potential; improves profitability; expansion to
international markets; customer satisfaction; increase quality awareness;
improves employee relations; improves employee motivation; and improves
employee productivity.
Magd (2004), Brown and Van der wiele (1995) and Vloeberghs and Bellens
(1996) concluded that improving the efficiency of the quality system was a very
important benefit of ISO implementation, which is consistent with the present
study and also it demonstrated that the internal perceived benefits were highly
appreciated and presented. Therefore, it can be concluded that the results of the
present study are strongly supported and consistent with the findings of
Previous studies on ISO 9000: 2000.
2.8.1 Internal Benefits
Generally, the main kinds of internal benefits that occur from ISO 9000
certification can be grouped under the headings of quality improvement,
employee‟s development and operations efficiency. According to casdesus and
38
Karapetrovic (2005), companies find most positive impact on the reduction of
non conformities and health and safety at work. Interestingly, the second factor
represents a new addition to the requirements of ISO 9000:2000 as compared to
the previous version. Furthermore, Gustafsson et al..,(2001) also identifies the
reduction of scrap and defects as significant internal effects but also reveal
improved traceability as an additional gain. Additionally, Brown (1998) notes
that the most important benefits mentioned include not only improvements in
the quality of products and services, but also improved management control and
quality awareness. Improved quality awareness by employees was also one of
the most important benefits found by Nwankwo(2000). Other than the already
stated, Dissanayaka et al.(2001) in their study of Hong Kong constructors,
highlights the most substantial benefits as more systematic record keeping,
improved internal communication, improvement in internal performance
appraisal systems, enhanced competitiveness of company and continual
improvement of operation.
2.8.2 External Benefits
The most often mentioned external effects are improved image and the
opportunity to use ISO 9000 as a marketing tool (Nwankwo, 2000). In addition,
Casdesu and Karapetrovic‟s (2005) survey exposes that a total of 66% have
enhanced relationships with their suppliers. This is further supported by
Dissanayaka et al.(2001) who identify greater client satisfaction, having a
valuable marketing tool, clients‟ perception of higher quality of work done, and
better access to domestic markets as the principal positive external outcomes
from ISO 9000 certified quality systems.
2.9: Criticism of ISO certification
Despite the numerical success of ISO 9000, a considerable number of criticisms
of the certification exist, as it is not a risk-free undertaking. ISO 9000
registration does not guarantee improved performance due to the high explicit
and implicit costs associated with implementation (Van der Wiele et al., 2005;

39
Curkovic and Pagell, 1999). Van der Wiele et al. (2005), and Bhuiyan and Alam
(2005) indicated that ISO 9000: 2000 perceived as having higher development
and maintenance costs. The cost of certification can be very high ranging from
$10,000 to $250,000 (Withers and Ebrahimpour, 2001). The variation in costs
depends on the suitability and efficiency of existing systems and the competence
of the employees (McAdam and Jackson, 2002: Mo and Chan, 1997) Stevenson
and Barnes (2001) identified four factors that tend to generate costs in achieving
certification: time, training, consultants and the registration itself. Moreover,
another perceived criticism of the ISO 9000 was the primary concern with the
generation of documentation to describe steps to be taken when problems are
encountered (Bhuiyan and Alam, 2005). This is evident through a survey of UK
quality management which concluded that ISO 9000 had been reduced to a
“mechanical approach” and as being “paperwork driven” (Wilkinson et al., 1994).
Furthermore, the standard may interfere with new and better ways of operating,
quality by inspection is not quality, and too heavy reliance on people‟s and in
particular assessors‟ interpretation of quality (Seddon, 1997; Stevenson and
Barnes, 2001; Douglas et al., 2003). Also the certifications tend to provide
indicators that the certified organization has complied with process
requirements, but they do not guarantee that the supplier produces quality
products and/or services that actually meet customer requirements (Abraham et
al., 2000; Singels et al., 2001), and may discourage creative and critical
thinking, because employees are forced to work according to well-described
procedures and rules (Casadesus and Karapetrovic, 2005).
Recently, various studies have confirmed that ISO 9000 certifications are too
expensive, too time consuming, resource-consuming, too formalized and
impersonal and that costs are greater than the benefits derived (Casadesus and
Karapetrovic, 2005; Bhuiyan and Alam, 2005; Dick, 2000; Augustyn and Pheby,
2000).

40
2.10 How developing countries benefit from ISO standardization
According to ISO website, “Giving fish" is one way of assisting developing
countries. By implementing International Standards and participating in their
development, developing countries learn how to fish for themselves.
Developing countries generally have scarce resources. Therefore, the need to
invest them wisely is more acute than in stronger economies because there is no
cushion for absorbing mistakes. Making the wrong choice may have serious
economic or social consequences, as, for example, when:
an imported technology turns out to be unsuitable for local conditions
and drains the investment in an industrial development programme
an effort to export local products comes to nothing because they do not
meet regulations or consumer criteria on foreign markets
precious foreign currency is wasted on importing over-sophisticated
health care products because technical criteria for evaluating the market
offerings are not available locally.
The International Standards developed by ISO offer developing countries
practical solutions to such problems because they represent a reservoir of
technological know-how and of product, performance, quality, safety and
environmental specifications. These standards have the advantage of
being backed by an international consensus on the state of the art.
Implementing ISO standards brings advantages such as the following to
developing countries:
avoiding the waste of resources by "reinventing the wheel"
transferring state-of-the-art technological know-how
supplying criteria for making reasoned choices when evaluating foreign
market offerings, whether of technology or consumer products
safeguarding public health and safety by establishing a base of
requirements for application to local or imported products in these
regulated areas
providing internationally accepted specifications that can be applied to
the development, manufacturing and marketing of local goods and

41
services, thus raising the country's ability to compete on export markets
worldwide.
By actually participating in the development of International Standards,
developing countries can realize other benefits, such as the opportunity
to:
acquire technological know-how directly
influence the technical content of standards important to their economy
gain "hands-on" experience in standardization work that can be put to
use in building up their own national infrastructures.

42
CHAPTER 3: ECONOMIC HISTORY AND OVERVIEW
This chapter provides a brief description of the economic overview of the
countries under review and presents the trend of the (GDP) i.e. economic
indicator used in this dissertation. The aim of this chapter is to give a
background into the economies of these countries as it will later form part of the
bedrock for my discussion in chapter four. See appendix 3 for the GDP raw data.
3.1 Overview of China’s economy
China's economy during the past 30 years has changed from a centrally planned
system that was largely closed to international trade to a more market-oriented
economy that has a rapidly growing private sector and is a major player in the
global economy. Reforms started in the late 1970s with the phasing out of
collectivized agriculture, and expanded to include the gradual liberalization of
prices, fiscal decentralization, increased autonomy for state enterprises, the
foundation of a diversified banking system, the development of stock markets,
the rapid growth of the non-state sector, and the opening to foreign trade and
investment.
Annual inflows of foreign direct investment rose to nearly $108 billion in 2008.
China has generally implemented reforms in a gradualist or piecemeal fashion.
In recent years, China has re-invigorated its support for leading state-owned
enterprises in sectors it considers important to "economic security," explicitly
looking to foster globally competitive national champions. After keeping its
currency tightly linked to the US dollar for years, China in July 2005 revalued its
currency by 2.1% against the US dollar and moved to an exchange rate system
that references a basket of currencies. Cumulative appreciation of the renminbi
against the US dollar since the end of the dollar peg was more than 20% by late
2008, but the exchange rate has remained virtually pegged since the onset of
the global financial crisis.
The restructuring of the economy and resulting efficiency gains have contributed
to a more than tenfold increase in GDP since 1978. Measured on a purchasing
power parity (PPP) basis that adjusts for price differences, China in 2009 stood

43
as the second-largest economy in the world after the US, although in per capita
terms the country is still lower middle-income. The Chinese government faces
numerous economic development challenges, including: (a) reducing its high
domestic savings rate and correspondingly low domestic demand through
increased corporate transfers and a strengthened social safety net; (b)
sustaining adequate job growth for tens of millions of migrants and new entrants
to the work force; (c) reducing corruption and other economic crimes; and (d)
containing environmental damage and social strife related to the economy's
rapid transformation levels. In 2009, the global economic downturn reduced
foreign demand for Chinese exports for the first time in many years.
Foreign investment remains a strong element in China's rapid expansion in world
trade and has been an important factor in the growth of urban jobs. In 1998,
foreign-invested enterprises produced about 40% of China's exports, and foreign
exchange reserves totalled about $145 billion. Foreign-invested enterprises
today produce about half of China's exports (the majority of China's foreign
investment come from Hong Kong, Macau and Taiwan), and China continues to
attract large investment inflows. However, the Chinese government's emphasis
on guiding FDI into manufacturing has led to market saturation in some
industries, while leaving China's services sectors underdeveloped. From 1993 to
2001, China was the world's second-largest recipient of foreign direct investment
after the United States. China received $39 billion FDI in 1999 and $41 billion
FDI in 2000. China is now one of the leading FDI recipients in the world,
receiving almost $80 billion in 2005 according to World Bank statistics. In 2006,
China received $69.47 billion in foreign direct investment.
Outward foreign direct investment is a new feature of Chinese globalization,
where local Chinese firms seek to make investments in both developing and
developed countries. The government vowed to continue reforming the economy
and emphasized the need to increase domestic consumption in order to make
China less dependent on foreign exports for GDP growth in the future.
Below is a graph of the Chinese economy for a 10year period (1999-
2008),showing the growth in the Chinese economy in terms of GDP .From the
graph below, it can be said that between 1999-2008,china‟s economy has
experienced a speedy growth to their economy.

44
Figure 4: GDP-China, (1999-2008)
Source: CIA,World fact book.
3.2 Overview of Kenya’s economy
Although the regional hub for trade and finance in East Africa, Kenya has been
hampered by corruption and by reliance upon several primary goods whose
prices have remained low.
Kenya is one of the few countries in the world that grew faster in 2009
compared to 2008, according to a December 2009 Kenya Economic Update
published by the World Bank Kenya Office in Nairobi. The projected growth rate
of 2.5 percent in 2009, compared to 1.7 percent in 2008, followed a slow
recovery from a quadruple shock: post election violence in early 2008, oil and
food price increases, and the global financial crisis; and in 2009, the worst
drought in a decade. But the growth rate was lower than its population growth
rate and per capita income remained unchanged. The impact of the multiple
shocks were particularly felt in the third quarter of the year, when the economy

45
stagnated, compared to a growth rate of 4.0 percent and 2.1 percent in the first
and second quarters respectively. Output of goods and services remained at the
same level as for the same quarter in 2008.
Agriculture, the mainstay of the economy accounting for 23.4percent of GDP,
contracted by 3.5percent. The drought also affected water and electricity supply.
High cost of electricity in turn had a negative impact on manufacturing and
transport. Manufacturing, transport and communications, and construction,
which combined account for 25percent of GDP, declined by 2.4percent,
1.8percent and 1.1percent respectively in the third quarter. However, the
services sector remained robust, with hotels and restaurants registering a
growth rate of 44percent. The expectation is that the economy will return to the
earlier trend of recovery, as agricultural production, water and electricity supply
have improved following heavy rains in most parts of the country since
December 2009. The government has adopted an expansionary fiscal policy
including a fiscal stimulus targeted at infrastructure and agriculture to cushion
the economy from further contraction.
Finally, it will be ideal to look into the recent political development that
happened in Kenya as this has its impact on the economy. The Grand Coalition
Government was sworn in on April 17, 2008 and it continues to address short
term issues of national reconciliation and resettlement of internally displaced
persons. The coalition was established under a National Accord and
Reconciliation Agreement with an equally shared portfolio balance between PNU
and ODM (two most active political groups), following a political crisis and
violence that followed the announcement of the results of the prudent.
The trend of Kenya‟s economy in terms of GDP for a 10 year period (1999-2008)
is shown below. One thing that can be noted from this diagram is the steady but
increased growth in the Kenyan economy during the years in review.

46
Figure 5:GDP-Kenya (1999-2008)
Source: CIA,World fact book.
3.3 Overview of Nigeria’s economy
The Nigerian economy is one of the most developed economies in Africa.
According to the UN classification, Nigeria is a middle-income nation with
developed financial, communication and transport sectors. It has the second
largest stock exchange in the continent.
The petroleum industry is central to the Nigerian economic profile. It is the 12th
largest producer of petroleum products in the world. The industry accounts for
almost 80% of the GDP share and above 90% of the total exports. Outside the
petroleum sector, the Nigerian economy is highly amorphous and lacks basic
infrastructure. Several failed efforts have been made after 1990 to develop other
industrial sectors
Oil-rich Nigeria, long hobbled by political instability, corruption, inadequate
infrastructure, and poor macroeconomic management, has undertaken several
reforms over the past decade. Nigeria's former military rulers failed to diversify

47
the economy away from its overdependence on the capital-intensive oil sector,
which provides 95% of foreign exchange earnings and about 80% of budgetary
revenues. The largely subsistence agricultural sector has failed to keep up with
rapid population growth - Nigeria is Africa's most populous country - and the
country, once a large net exporter of food, now must import food. Following the
signing of an IMF stand-by agreement in August 2000, Nigeria received a debt-
restructuring deal from the Paris Club and a $1 billion credit from the IMF, both
contingents on economic reforms. Nigeria pulled out of its IMF program in April
2002, after failing to meet spending and exchange rate targets, making it
ineligible for additional debt forgiveness from the Paris Club. Since 2008 the
government has begun showing the political will to implement the market-
oriented reforms urged by the IMF, such as to modernize the banking system, to
curb inflation by blocking excessive wage demands, and to resolve regional
disputes over the distribution of earnings from the oil industry.
In 2003, the government began deregulating fuel prices, announced the
privatization of the country's four oil refineries, and instituted the National
Economic Empowerment Development Strategy, a domestically designed and
run program modelled on the IMF's Poverty Reduction and Growth Facility for
fiscal and monetary management. In November 2005, Abuja won Paris Club
approval for a debt-relief deal that eliminated $18 billion of debt in exchange for
$12 billion in payments - a total package worth $30 billion of Nigeria's total $37
billion external debt. The deal subjects Nigeria to stringent IMF reviews. Based
largely on increased oil exports and high global crude prices, GDP rose strongly
in 2007-09. President YAR'ADUA has pledged to continue the economic reforms
of his predecessor with emphasis on infrastructure improvements. Infrastructure
is the main impediment to growth. The government is working toward
developing stronger public-private partnerships for electricity and roads.
Figure 8 below is a graph of the Nigerian economy for a 10year period showing
the growth in the Nigerian economy in terms of GDP over these periods. A few
ups and down can be noticed along the years between 1999-2008.For example,
in the year 2007,there was a slight drop in the GDP and this can be argued to be
caused by a rapid drop in the international price of crude oil in that particular
year.
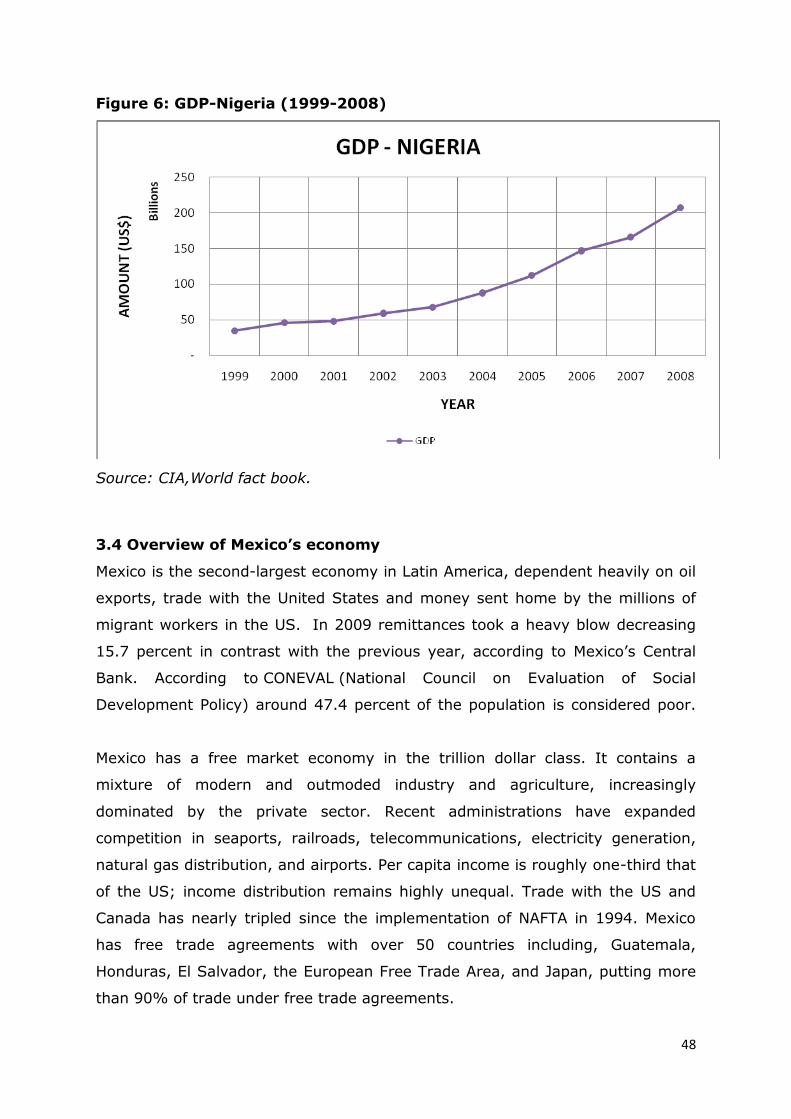
48
Figure 6: GDP-Nigeria (1999-2008)
Source: CIA,World fact book.
3.4 Overview of Mexico’s economy
Mexico is the second-largest economy in Latin America, dependent heavily on oil
exports, trade with the United States and money sent home by the millions of
migrant workers in the US. In 2009 remittances took a heavy blow decreasing
15.7 percent in contrast with the previous year, according to Mexico‟s Central
Bank. According to CONEVAL (National Council on Evaluation of Social
Development Policy) around 47.4 percent of the population is considered poor.
Mexico has a free market economy in the trillion dollar class. It contains a
mixture of modern and outmoded industry and agriculture, increasingly
dominated by the private sector. Recent administrations have expanded
competition in seaports, railroads, telecommunications, electricity generation,
natural gas distribution, and airports. Per capita income is roughly one-third that
of the US; income distribution remains highly unequal. Trade with the US and
Canada has nearly tripled since the implementation of NAFTA in 1994. Mexico
has free trade agreements with over 50 countries including, Guatemala,
Honduras, El Salvador, the European Free Trade Area, and Japan, putting more
than 90% of trade under free trade agreements.

49
In 2007, during its first year in office, the Felipe CALDERON administration was
able to garner support from the opposition to successfully pass pension and
fiscal reforms. The administration passed an energy reform measure in 2008 and
another fiscal reform in 2009. Mexico's GDP plunged 6.5% in 2009 as world
demand for exports dropped and asset prices tumbled, but GDP is expected to
post positive growth late in 2010. The administration continues to face many
economic challenges, including improving the public education system,
upgrading infrastructure, modernizing labour laws, and fostering private
investment in the energy sector.
Mexico was hard hit by the global economic crisis and the collapse of
international trade during the last quarter of 2008 and the first quarter of 2009.
The Mexican economy is starting to rebound. In line with a global recovery in
production and trade, economic activity in Mexico picked up in the second half of
2009 and is off to a strong start this year. A 4 percent growth is expected for
2010.
The recovery is led by resurgence in the demand for exports. Manufactured
exports were down by 25 percent during the first half of 2009 compared to the
same period of the previous year.
Figure 8: GDP-Mexico (1999-2008)
Source: CIA,World fact book.

50
3.5 Overview of Egypt’s economy
Egypt is the world's largest exporter of cotton and its textile industry is large.
Other industries include the production of cement, iron and steel, chemicals,
fertilizers, rubber products, refined sugar, tobacco, canned foods, cottonseed oil,
small metal products, shoes, and furniture. Although the agriculture sector
continues to employ almost one-third of the workforce, most of the arable land
is used to cultivate cotton, and Egypt must import about half of its food
requirements. Unemployment in 1998 was reported at 20 percent, and the
income disparity between the highest and lowest strata of society remains high.
By contrast, unemployment in the United States in 1999 was just 4.2 percent.
Today, Egypt is primarily a free-market economy with some state control.
Despite occasional outbreaks of political violence, it has a reasonably stable
multiparty system and is strongly supported by the United States and the
European Union. The economy's main exports are crude oil and petroleum
products, cotton, textiles, metal products, and chemicals. Agriculture today
accounts for 17 percent of GDP, industry for another 32 percent, while the
services sector provides 51 percent.
Until 2003, Egypt's economic structure was hostile to foreign investment. The
economy suffered from high interest rates and tariff barriers. However, a series
of economic reforms were introduced in 2005 to address these issues. With
major tax cuts and trade tariff cuts, the economy was made more open to
foreign direct investment (FDI). These proactive steps from the government
helped to restore investor trust in the economy. FDI reached US$6 billion in
2006.
Cairo from 2004 to 2008 aggressively pursued economic reforms to attract
foreign investment and facilitate GDP growth. The global financial crisis has
slowed, but not stopped, the reform efforts. The international economic
downturn slowed Egypt's GDP growth to 4.7% in 2009, predominately affecting
export-oriented sectors, including manufacturing and tourism, and Suez Canal
revenues. Growth in domestic sectors, including energy, transportation,
telecommunications, retail trade, and construction kept economic growth from
falling further in 2009.

51
According to the 2009 estimates, Egypt‟s export trade grossed over US$29
billion, a 22% surge from the previous year‟s level. Oil export is central to the
Egyptian economy. Based on the 2007 figures, Egypt is the 55th largest oil
exporting country. It exports 155,200 barrels per day, approximately. However,
the country has huge oil reserves which can act as fuel for the economy for
coming decades. Apart from crude oil and petroleum products, the country also
exports metal products, cotton, textiles and chemicals.
EU and the US are the biggest exporting markets for Egyptian products. Italy
has the largest share of the Egyptian export pie, accounting for 9% of the total
volume. It is followed by the US, Spain, India, Syria, Germany and Saudi Arabia.
Figure 7: GDP-Egypt (1999-2008)
Source: CIA,World fact book.
The diagram above shows the trend of the Egyptian economy between 1999-
2008, of particular interest is the dip in the economy between 2002-2005.This
was caused by the lack of foreign investors due to the hostility of the economic
structure of Egypt. However in 2005, the economy was made more open to

52
foreign direct investment (FDI), and this can be said to be the reason for the
sharp growth experienced from 2005 upwards.

53
CHAPTER 4: RESULTS AND DISCUSSIONS
This chapter presents the main findings of the primary research. In order to
achieve the purpose of this research, the finding and discussions will be
deployed in three phases so as to get the explicit analysis. The phases are:
Phase 1: The trend of ISO 9001 certification take up in selected developing
economies
Phase 2: The analysis of the relationship intensity on a ratio-type basis using the
number of ISO certification per country and the GDP data.
Phase 3: The analysis of the relationship, if any between the levels of ISO
certification take up and the economies of these selected countries.
4.1 ISO 9001 certififcation take-up trend in Nigeria, Kenya, Egypt,
Mexico and China. (1999-2008)
This particular section discusses and analysis the trend of ISO take up in the
countries listed above with particular interest to the direction of the trend and it
also tries to look at the reason for such direction.The number of ISO certification
per country for a period of 10years (1999-2008) is looked into.
It should be noted that the graphs have been presented individually in order to
make the slope for the individual graphs more pronounced as the graphs have
different scalling due to large differences in the number of certification between
the countries in view.
ISO does not itself issue certificates of conformity to ISO 9000, this is carried
out independently of ISO by certification bodies in different
countries.Currently,the Nigeria‟s representative accreditation body for ISO is the
standards organization of Nigeria (SON),the kenyan Bureau of standars (KEBS)
for kenya,Egyptian Organization for standardization and QC (EO) for

54
Egypt,Direccion Generalde Normas (DGN) for Mexico and finally,the
Standardization Administration of China (SAC) for china.
The number of certificates obtained by organizations in these countries over the
past 10years(1999-2008) are presented in the diagram below for
dissussions,comments and comparism.See appendix 2 for data.
Figure 8a: Number of ISO 9001 certification in Nigeria
Source: ISO Survey of Certification (1999-2008)
Figure 10b: Number of ISO 9001 certification in Kenya

55
Source: ISO Survey of Certification (1999-2008)
Figure 10c: Number of ISO 9001 certification in Egypt
Source: ISO Survey of Certification (1999-2008)
Figure 10d: Number of ISO 9001 certification in Mexico
Source: ISO Survey of Certification (1999-2008)

56
Figure 10e: Number of ISO 9001 certification in China
Source: ISO Survey of Certification (1999-2008)
A historical review exposes the fact that the first Nigerian and kenyan‟s
organization was accredited to an ISO 9000 standards in 1995,with just 1
organization each respectively(ISO survey,10th cycle).From there after,a
continous and gradual increase of certification is observed.In fact,by the end of
2008,at least 163 Nigerian firms and 257 kenyan firms were registered to the
revised ISO 9000:2000(ISO survey,2008).
As shown in figure 10a and 10b below,a rapid increase in certification took place
in 2003. There was an increase from 3 certificates in 2002 to 49 in 2003 for
Ngeria and 11 to 29 certificates from 2002 to 2003 for kenya, this can be
supported by the fact that 2003 was the final change over date from the
previous 1994version to the 2000 standards. It is still believed that the number
of certifications in Nigeria is too low and not growing at the supposed rate
because of lack of training and awareness on QMS like ISO and also because of
lack of infrastructure to meet up to ISO standards(XVII IMEKO World Congress).
Obviously, a lot needs to be done by the Nigerian government by encouraging

57
companies to be ISO certified through giving financial support and educating the
companies on the need for a QMS such as ISO 9000 series
Furthemore,certifications by the first nine countries in Egypt, first took place in
1994 and ever since it has also experienced a continous and fast increase in the
number of organization getting the certifications.From figure 10c,we can see that
by the end of 2008 as many as 1,944 certificates were obtained by Egyptian
organization.This is indeed very impressive and the reason is not farfetched.
According to Magd,(2006),the Egyptian government and the business
community have placed a greater emphasis on achieving superior quality in
order to compete in both domestic and foreign markets through a quality
assurance system (ISO 9001:2000),hence the reason for the continuous
increase in the number of certifications in Egypt.
It should be noted that the reason for the dip in certification between 2001-2003
for Egypt as seen in figure 10c above, is the same as discussed for the Nigeria
and Egyptian dip.
Again,taking a look at figure 10d and 10e,which shows the ISO certification
trend in Mexico and China respectively,we can see that for china,there was an
explosive growth in the number of certification beetween 1999 and 2008,that is
from 15,109 to 224,616 which is an increase of about 94%.This tremendous
level of increase in the number of certification is because China is fast becoming
a highly industrialized nation with so many companies and organizations
especially from the western world outsourcing their production activities. Hence,
due to customer specification for quality, certification is obtained to prove their
quality standards. As at 2008, ISO survey of certification, china has the highest
number of certification in the world and is still rising.
For México, the number of ISO certification has also been on the rise in the last
10 years. In figure 10e, we see that the number of certification has increased by
almost 63% between 1999 and 2008.The reason for this increase can be argued
to be the increased level of trading activities between the United states and
México due to the trade liberalization policy in 1994 and also, because most
multinational car manufacturing companies have their hub in México, hence the
increase in certification.

58
4.2 The relationship intensity on a ratio-type basis using the number of
ISO certification per country and the GDP data.
This particular section is the phase two of the findings and discussions chapter
and it looks at what is called “ISO intensity” for the purpose of this research. The
ISO intensity is calculated against the nominal number of certification so as to
give a better understanding on the degree of intensity, that is, how much of the
GDP of an economy does 1 ISO 9001 certification represent. This was done by
dividing GDP per country by the number of ISO certifications for different years
(see appendix for the table of ratio result).The ratio results derived is used to
plot the Intensity graph for the five countries examined between 1999-2000.The
ISO intensity data table and graphs are shown below followed by a detailed
analysis.
Table 5: GDP/ISO intensity data
GDP/ISO CERTIFICATION RATIO DATA
COUNTRY 1999 2000 2001 2002 2003
CHINA
71,697,664 46,711,619 178,713,072 35,461,863 16,966,965
MEXICO
309,255,784 315,478,025 7,874,594,937
2,449,343,39
6 487,352,122
NIGERIA
1,738,802,010 2,299,180,016 0
19,705,615,9
40 1,380,735,170
KENYA
30,778,163 73,359,994 1,623,314,982
1,195,387,58
2 513,918,429
EGYPT
139,769,960 213,330,216 5,424,000,447 395,723,786 109,978,356
COUNTRY 2004 2005 2006 2007 2008
CHINA 14,531,694 15,546,262 16,380,478
16,046,932 19,263,988
MEXICO 223,952,226 293,076,125 204,673,210
259,204,257 218,062,124
NIGERIA
887,327,480 1,111,376,238 1,112,628,788
1,113,563,75
8 1,270,662,577
KENYA 101,874,112 110,875,281 122,963,060
132,962,719 118,111,871
EGYPT 97,339,735 67,636,293 55,748,981
84,998,628 83,478,666

59
Figure 11a: GDP/ISO 9001 intensity ratio for Nigeria
Figure 11b: GDP/ISO 9001 intensity ratio for Kenya

60
Figure 11c: GDP/ISO 9001 intensity ratio for Egypt
Figure 11d: GDP/ISO 9001 intensity ratio for China

61
Figure 11e: GDP/ISO 9001 intensity ratio for Mexico
Figure 11a to 11e above is the graphical representation of the intensity data
presented in the table above. Data between 2001-2003 have been deliberately
omitted in order not to distort my graphs as it is believed it does not give true
figures of certification of the survey of certificates between 2001 and 2003
because this period was characterised by the changeover from the different
series of ISO 9000 into just one called ISO 9000:2000.Hence, those organization
who were using the older versions of the certification were not counted in some
countries whilst some were counted.
As seen from the GDP/ISO certification table, taking an example from China in
the year 2008, it can be interpreted as ratio 1: 19,263,988 which means 1 unit
ISO certification represents $19,263,988 of china‟s economy. This simply means
that china‟s level of ISO certification is keeping up with its economy, this can be
as a direct result of foreign direct investment in form of outsourcing by western
countries which forces Chinese companies to take up certification as a proof of
competency.
62
For Kenya in 2008, the ratio as seen from the intensity table above is
1:118,111,871 which means for every 1unit of ISO certification represents
$118,111,871 of Kenya‟s GDP.Kenya is not doing well in terms of getting the
ISO 9001 certification. This is a bit strange as Kenya is said to be one of the
fastest growing economies in the world according to Kenya‟s economic update
report and one major reason for this low number of certification may be the fact
that the government is not sensitizing the SMEs to get a QMS certification or it
may be that Kenya‟s accreditation policy might be too hostile towards
consultants who would have encouraged certification. It can therefore be
concluded that Kenya‟s GDP has outgrown its number of ISO 9001 certification.
Furthermore, Nigeria‟s intensity ratio in terms of ISO certification to GDP in
2008 was 1: 1,270,662,577.This can again be interpreted to mean that for every
1 unit of ISO certification, GDP is 1,270,662,577 .For such a country with a large
economy, one would expect a far higher level of ISO certification but as seen by
figure 11a, the number of ISO certification has remained at almost the same
level for the past five years. One major reason for such a trend in the case of
Nigeria may be the fact that only one sector of their economy, that is, oil and
gas is mainly responsible for their GDP growth, hence most certifications only
come from this sector. In conclusion, Nigeria‟s economy is not keeping up with
its ISO certification.
For Egypt, it has seen a great increase in its number of ISO certification between
2004-2008 and that explains the reason why the GDP/ISO intensity is relatively
strong. From the table above, the ratio of the intensity in 2008 is 1: 83, 478,
666, which simply means that 1 unit of ISO 9001 certificate represents
$83,478,666 of Egypt‟s GDP.This is a relatively strong intensity and the reason
may be the fact the Egyptian government and the business community have
placed a greater emphasis on achieving superior quality in order to compete in
both domestic and foreign markets, and as a result promoted the need for
certification.
Finally, the ratio intensity analysis for Mexico shows that ISO certification take-
up is keeping up with its GDP. From the intensity data table above, the ratio of
ISO to GDP in 2008 is 1:218,062,124.This means that for every 1 unit of ISO

63
certification obtained, GDP is 218,062,124.A look at figure11e shows that Mexico
in terms of economic growth is keeping up with its level of ISO certification.
4.3 The analysis of the relationship, if any between the levels of ISO
certification take up and the economies of these selected countries.
This section, which is the third phase of chapter 4 looks at the regression
analysis of our ISO intensity data with the aim of finding a possible relationship
between a country‟s economic development and its ISO 9001 certification status.
Using the Pearson‟s technique, a simple linear regression was performed using
excel in order to get the correlation coefficient (r) and the coefficient of
determination(r^2). The correlation coefficient indicates whether there is a
relationship and to what degree, between the two variables, and whether the
relationship is a positive or a negative number. Whilst the coefficient of
determination tells us what proportion of the variation between the data points
is explained or accounted for by the best fit line fitted to the points. It indicates
how close the points are to the line.
A best-fit line was also drawn to show the trend of the relationship. It should be
noted that before drawing a best-fit line, a scatter plot is first drawn as this
allows us to visually inspect the data prior to running a regression analysis.
Often this step allows us to see if the relationship between the two variables is
increasing or decreasing and gives only a rough idea of the relationship.
Below is the result of the regression analysis showing the coefficient correlation,
the coefficient of determination and the best fit lines for all the five countries
studied in this dissertation. These graphs are first presented and then
discussions follow. The data used were gathered over a period of 10years,
(1999-2008)

64
Figure 12a: Regression result for Nigeria.
Figure 12b: Regression result for Kenya.
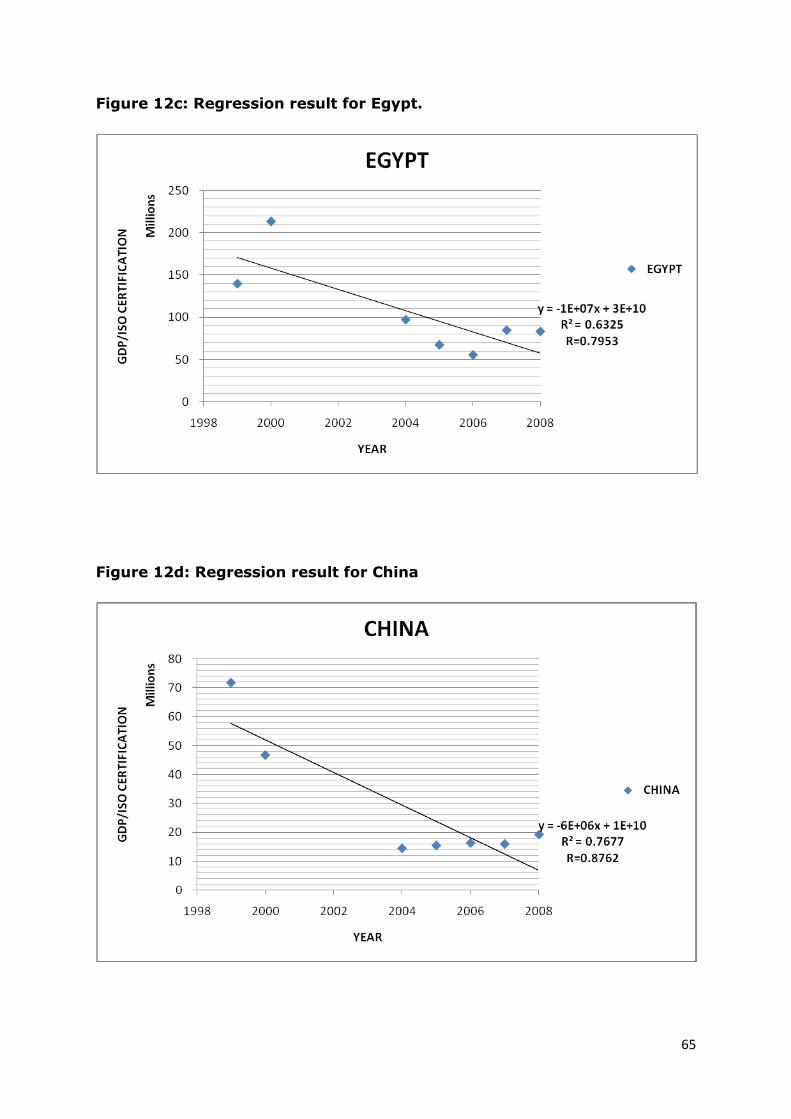
65
Figure 12c: Regression result for Egypt.
Figure 12d: Regression result for China

66
Figure 12e: Regression result for Mexico
4.3.1 Analysis and Interpretation of results
Figure 12a above, shows the regression result for Nigeria. It should be noted
that the data between 2001-2003 were deliberately omitted as these data are
believe to be less accurate due to loss of some ISO data which was caused by
the transition from the previous ISO standards to that of 2000 series.
From the graph above, it can be seen that the trend of the relationship between
GDP and number of ISO certification is a linear one as shown by the best fit line.
The coefficient of correlation (r) was 0.7416 whilst (r^2) was 0.55.From (r), it
simply means that there exist a fairly strong relationship between GDP and
number of ISO certification take up in Nigeria and (r^2) can be interpreted to be
that 55% of the total variation in y which is our regression function is related
whilst the other 45% remains unexplained.
One thing to be noted is that the average R^2 of .55 is thought to have been
caused by the fluctuations in the GDP/ISO intensity result which though follows a
particular trend, is still scattered along the best fit line as seen from the graph
above. This ups and down is often synonymous with countries whose economy is

67
largely dependent on only one sector of the economy as the case is in Nigeria,
which is largely dependent on crude oil.
It can therefore be concluded the number of ISO certification is keeping with the
GDP of Nigeria, though at a slow pace.
Furthermore, figure 12b shows the regression result for Kenya and we can see
that there is a linear and positive relationship between GDP and number of ISO
9001 certification in Kenya. The correlation coefficient (r) is 0.9324 whilst r^2 is
0.8693, therefore we can say that there exist a very strong relationship between
our x and y variables, and r^2 shows that almost 87% of the total variation in
our y function is related whilst the other 13% remains unexplained.
The Kenya graph shows a positive upward trend which may be interpreted to be
that the GDP of Kenya has outgrown the number of ISO certificates. Although
the Kenyan economy is one of the fastest growing economies in Africa, the
number of certification is been outgrown by the GDP.The reason for this may be
due to the fact that the Kenyan government has not done enough to sensitise
the local SME‟s to get certification and also, the government policies regarding
foreign QMS consultants may not be favourable.
In the case of Kenya, we can conclude that there is definitely a positive
relationship between its GDP and it ISO certification take-up.
Likewise, figure 12c shows the result of the regression analysis for Egypt with
r=0.7953 and r^2=0.6325, and has a result, there is a fairly strong correlation
between the economies of Egypt and the ISO certification take up. The
coefficient of determination explains that 63% of the total variation is related
whilst 37% remains unexplained.
There is definitely a fairly strong relationship between GDP and ISO certification
take up in Egypt but it is working at keeping up with the pace as there is a
strong sensitization by the Egyptian government to encourage increased QMS
certification.
Finally figures 12d and 12e show the regression result for China and Mexico
simultaneously and as seen by these graphs above, there is a linear relationship
between the GDP and ISO certification take up of these two economies.

68
For china, (r) is 0.8762 which shows that there is such a strong relationship
between GDP and ISO certification take up and its r^2 which is 0.7677 can be
interpreted to be that almost 77% of the total variation is related whilst the
other 23% remains unexplained.
As for Mexico, (r) is 0.7548 which shows that the degree of relationship is fairly
strong between GDP and ISO take up whilst r^2 is 0.5697 and can be
interpreted to be that 56% of the total variation in y is related whist the
remaining 44% is unexplained.
4.4 Summary
It was discovered in the phase one of this chapter that the numbers of ISO
certification in all the countries in discussion have grown through the past 10
years in review. For some countries such as china and México, the rates of
certification has increase tremendously over the last 10 years because of
increased foreign direct investment in china and increase US activities with
Mexico. Whilst for countries such as Nigeria and Kenya, though number of
certification has increased, but at a slow pace. Egypt has remained fairly
balanced in terms of number of certification.
In the phase two and three of this chapter, it is evident that there is definitely a
correlation between the GDP of the countries in discussion and their ISO 9001
certification take-up
Finally, as a rule of thumb, it should be noted that just because two variables
are correlated, does not mean that one of the variables is the cause of the other.
It could be the case, but it does not necessarily follow
69
CHAPTER 5: RECOMMENDATIONS AND CONCLUSIONS
In today‟s globalised business world, quality assurance emerges as one of the
leading themes in organizations and economies who are in pursuit of global
competitiveness. As a result, a wide range of systems for managing quality have
been developed during the last few decades. Among them, the most prestigious
and widely implemented Quality Management Systems is said to be the ISO
9000 series of standards.
Within the last 10 years, there has been a remarkable increase in the number of
certifications issued by International organizations of standardization to
developing and transiting economies. This increase in certification, gives
developing countries the opportunity to compete in global market place as being
ISO 9000 certified is seen as an entry qualifier into the global market place.
The increased ISO certification in developing economies has drawn my attention
into willing to study five developing countries, namely, Nigeria, Kenya, Egypt,
China and Mexico. This study is to observe the trend of their ISO 9001
certification pick up, the relationship between the economy of these countries
and their ISO certification pick up, if any and also the advantages and
disadvantages of ISO certification to developing economies.
Based on the findings of my study, implementing ISO standards in developing
countries brings advantages such as providing internationally accepted
specifications that can be applied to the development, manufacturing and
marketing of local goods and services, thus raising the country's ability to
compete on export markets worldwide.Also,waste of countries resources are
avoided and state-of-the-art technological know-how is transferred.
Moreso, from this study, which employed mostly a quantitative technique by
carrying out a regression analysis using Pearson‟s correlation technique, it was
discovered that there is a strong correlation between the economies of all the
countries in review in terms of GDP and their ISO certification take up. By
calculating the GDP/ISO intensity ratio for these five countries, it was
discovered that countries such as China, Mexico and Egypt‟s economy are
actually keeping up to their level of ISO certification take up whilst Nigeria is
70
way behind and not keeping up. Of particular interest is the intensity result
obtained for Kenya, it shows that the economy in terms of GDP has outgrown
the level of ISO certification.
Since in the course of this study, it has been proven that there is a relationship
between the level of economic growth of developing countries and their ISO
9001 certification take up, I therefore recommend that policy makers and
government of various developing countries should sensitise and encourage the
take up of ISO 9001 certifications in order to be able to compete in the global
village. Also the dissemination of the results of this study will enable other
developing countries to understand the benefits achieved from implementing
ISO 9001:2000 in terms of economic growth.

71
REFERENCES
Advice for Users on ISO 9001; 2008. Retrieved from
http://www.scribd.com/doc/35700392/Advice-for-Users-on-ISO9001-
2008, assessed on 27th of July 2010
Anderson, S W, Daly, J D and Johnson, M F (1999), „Why Firms Seek ISO
9000 Certification: Regulatory Compliance or Competitive Advantage?‟
Production & Operations Management Journal, Vol. 8 No. 1, pp. 28-43.
Augustyn, M M and Pheby, D J (2000), „ISO 9000 and Performance of
Small Tourism Enterprises: A Focus on Westons Cider Company‟, Journal
of Managing Service Quality, Vol. 10, No. 6, pp. 374-88.
Bhuiyan, N and Alam, N (2004), „ISO 9001:2000 Implementation – The
North American Experience‟, International Journal of Productivity and
Performance Management, Vol. 53 No. 1, pp. 10-17.
Biazzo, S and Bernardi, G (2003), „Process Management Practices and
Quality Systems Standards: Risks and Opportunities of the New ISO 9001
Certification‟, Journal of Business Process Management, Vol. 9, No. 3, pp.
273-85.
Brown, A and Van der wiele, T (1995), „Industry Experience with ISO
9000‟, Asia Pacific Journal of Quality Management, Vol. 4, No. 2, pp. 8-17.
Buttle, F (1997), ‟ISO 9000: Marketing Motivations and Benefits‟,
International Journal of Quality and Reliability Management, Vol. 14,
pp.936-947.
Calisir, F, Bayraktar, A C and Beskese, B (2001), „Implementing the ISO
9000 Standards in Turkey: A Study of Large Companies‟ Satisfaction with
ISO 9000‟, Journal of Total Quality Management, Vol. 12, No. 4, pp. 429-
38.

72
Casadesus, M and Karapetrovic, S (2005), „An Empirical Study of the
Benefits and Costs of ISO 9001:2000 Compared to ISO 9001/2/3:1994‟,
Journal of Total Quality Management, Vol. 16 No. 1, pp. 105-20.
Chin, S K and Choi, W T (2003), „Construction in Hong Kong: Success
Factors for ISO 9000 Implementation‟, Journal of Construction
Engineering and Management, November/December, pp. 599-609.
Chow-Chua, C, Goh, M and Wan, B T (2003), „Does ISO 9000 Certification
Improve Business Performance?‟ International Journal of Quality &
Reliability Management, Vol. 20 No. 8, pp. 936-53.
Creative Research Systems, Statistical Techniques, Rating Scales and
Correlation Coefficients, http://www.surveysystem.com/correlation.htm,
assessed on 20th of July 2010.
Dick, G P M (2000), „ISO 9000 Certification Benefits, Reality or Myth?‟,
The TQM Magazine, Vol. 12, No. 6, pp. 365-71.
Dick, G, Gilmore, K and Brown, C J (2002), „Does ISO 9000 Accreditation
Make a Profound Differences to the Way Service Quality is Perceived and
Measured?, Managing Service Quality‟, Vol. 12 No. 1, pp. 30-42.
Dissanayaka, M S, Kumaraswamy, M M, Karim, K and Marosszeky, M
(2001), „Evaluating Outcomes from ISO 9000 Certified Systems of Hong
Kong Constructors‟, Total Quality Management, Vol. 12, No. 1, pp. 29-48.
Douglas, A, Coleman, S and Oddy, R (2003), „The Case for ISO 9000‟, The
TQM Magazine, Vol. 15, No. 5, pp. 316-24.

73
Economy watch- Nigeria Economy .Retrieved from
http://www.economywatch.com/world_economy/nigeria/, assessed on
24th of August 2010.
Fuentes, M C, Benavent, B F, Moreno, M, Cruz, T and Pardodelval, M
(2000), „Analysis of the Implementation of ISO 9000 Quality Assurance
Systems‟, Work Study, Vol. 49, No. 6, pp. 229-41.
Fuentes, M C, Benavent, B F, Moreno, M, Cruz, T and Pardodelval, M
(2000), „Analysis of the Implementation of ISO 9000 Quality Assurance
Systems‟, Work Study, Vol. 49, No. 6, pp. 229-41.
Goetsch, D and Davis, S (2005), Understanding and Implementing ISO
9000: 2000, Prentice Hall, Englewood Cliffs, NJ.
International Organisation for Standardization (ISO) (2004), „ISO Action
Plan for Developing Countries 2005-2010‟, ISO Publications, Geneva.
International Organisation for Standardization (ISO) Website, „Resources
for Developing Countries: How Developing Countries Benefit from
Standardization‟,http://www.iso.org/iso/resources/developing_countries/is
o_and_developing_countries/how_developing_countries_benefit_from_sta
ndardization.htm, assessed on 20th of July 2010.
International Organization for Standardization (ISO), „How Developing
Countries Benefit from Standardization, Available at:
http://www.iso.org/iso/resources/developing_countries/iso_and_developin
g_countries/how_developing_countries_benefit_from_standardization.htm
, assessed on 24th of August 2010.
ISO 9000 -Technical Change Associates. Retrieved from
http://www.technicalchange.com/lean-terms-definitions/iso-9000.html,
assessed on 27th of July 2010.

74
ISO 9001 Certification. Retrieved from
http://www.intertek.com/auditing/iso-9001, assessed on the the 27th of
July 2010.
Janas, I and Luczak, H (2002), „Explorative Study of the Expected
Consequences for Existing Quality Management Systems Due to the
Revision of ISO 9001 in Certified Companies in Germany‟, The TQM
Magazine, Vol. 14 No. 2, pp. 127-32.
John Ndanusa Akanya, Activities of Standards Organisation of Nigeria,
XVII IMEKO World Congress, Metrology in the 3rd Millennium, June
22−27, 2003, Dubrovnik, Croatia.
Kartha, C P (2002), „ISO 9000: 2000 Quality Management Systems
Standards: TQM Focus in the New Revision‟, The Journal of American
Academy of Business, September, pp. 1-6.
Kenya -Country Brief. Retrieved from
http://web.worldbank.org/WBSITE/EXTERNAL/COUNTRIES/AFRICAEXT/KE
NYAEXTN/0,,menuPK:356520~pagePK:141132~piPK:141107~theSitePK:
356509,00.ht, assessed on 11th of August 2010.
Magd, H (2004), „ISO and Quality Emphasis in the Hotel Sector: an
Empirical Analysis of Egypt‟, Paper Presented at the International
Conference on Productivity and Quality Research, 15-19 February, Miami,
FL.
Magd, H and Curry, A (2003), „An Empirical Analysis of Management
Attitudes: Towards ISO 9001:2000 in Egypt‟, The TQM Magazine, Vol. 15,
No. 6, pp. 381-90.
Martinez-Lorente, A and Martinez-Costa, M (2004), „ISO 9000 and TQM:
Substitutes or Complementaries? An Empirical Study in Industrial

75
Companies‟, International Journal of Quality and Reliability Management,
Vol. 21 No. 3, pp. 260-76.
McAdam, R and Fulton, F (2002), „The impact of the ISO 9000: 2000
Quality Standards in Small Software firms‟, Managing Service Quality, Vol.
12, No. 5, pp. 336-45.
Mezher, T, Ajam, M and Shehab, M (2004), „The Historical Impact of ISO
9000 on Lebanese Firms‟, Journal of Quality Assurance, Vol. 11, pp. 25-
42.
Mo, J P T and Chan, A M S (1997), “Strategy for the Successful
Implementation of ISO 9000 in Small and Medium Manufacturers‟, The
TQM Magazine, Vol. 9, No. 2, pp. 135-45.
Ragothaman, S and Korte, L (1999), „The ISO 9000 International Quality
Registration: An Empirical Analysis of Implications for Business Firms‟,
International Journal of Applied Quality Management, Vol. 2 No. 1, pp. 59-
73.
Ruzevicius, J, Adomaitiene, R and Sirvidaite, J (2004), „Motivation and
Efficiency of Quality Management Systems Implementation: A Study of
Lithuanian Organizations‟, Journal Total Quality, Vol. 15, Issue 2.
Sampaio, P, Saraiva, P & Rodrigues, A G, (2009), „ISO 9001 Certification
Research: Questions, Answers and Approaches‟, International Journal of
Quality & Reliability Management, Vol. 26 Issue: 1, pp.38 – 58.
Seddon, J (1997), „Ten Arguments against ISO 9000‟, Managing Service
Quality, Vol. 7 No. 4, pp. 162-8.
Singels, J, Ruel, G and Van de Water, H (2001), „ISO 9000 Series:
Certification and Performance, International Journal of Quality & Reliability
Management, Vol. 18, No. 1, pp. 62-75.

76
StatPac Survey Software, Correlation and Regression, Retrieved from
http://www.statpac.com/statistics-calculator/correlation-regression.htm,
assessed on 24th of July 2010.
Sun, H, Li, S, Ho, K, Gertsen, F, Hansen, P and Frick, J (2004), „The
Trajectory of Implementing ISO 9000 Standards Versus Total Quality
Management in Western Europe‟, International Journal of Quality &
Reliability Management, Vol. 21 No. 2, pp. 131-53.
Tan, B, Lin, C and Hung, C H (2003), „An ISO 9001:2000 Quality
Information System in E-commerce Environment‟, Industrial Management
and Data Systems, Vol. 103 No. 9, pp. 666-76.
Terziovski, M, Power, D and Sohal, AS (2003), „The Longitudinal Effects of
the ISO 9000 Certification Process on Business Performance‟, European
Journal of Operational Research, Vol. 146, pp. 580-95.
Textile World, „Congressmen Mounts Attack on Textile Fraud‟,
http://www.textileworld.com/Articles/2010/June/Congressmen_Mount_Att
ack_On_Textile_Fraud.html, assessed on 21st of July 2010.
The central Intelligence Agency-The world fact book
The ISO Survey of ISO 9000 and ISO 14000 Certificates. Retrieved from
http://www.iso.org/iso/survey10thcycle.pdf, assessed on 11th of August
2010.
Tourism ROI | CIA - The World Fact book - Kenya | Africa. Retrieved from
http://www.tourismroi.com/InteriorTemplate.aspx?id=27142, assessed on
11th of August 2010.
Tsekouras, K, Dimara, E and Skuras, D (2002), ‟Adoption of a Quality
Assurance Scheme and its Effect on Firm Performance: A Case Study of
Greek Firms Implementing ISO 9000‟, Total Quality Management Journal,
Vol. 13, Issue 6, pp.827-842.

77
Van Der Wiele, T, Iwaarden, V J, Williams, R and Dale, B (2005),
„Perceptions about the ISO 9000 (2000) Quality System Standard Revision
and its Value: the Dutch Experience‟, International Journal of Quality and
Reliability Management, Vol. 22 No. 2, pp. 101-19.
Viadiu F, Casadeus F, Saizarbitoria I (2006), „ISO 9000 and ISO 14000
standards: an international diffusion model‟, International Journal of
Operations and Production Management, Vol. 26, pp.144.
Vloeberghs, D and Bellens, J (1996), „Implementing the ISO 9000
Standards in Belgium‟, Journal of Quality Progress, Vol. 29, No. 6, pp. 43-
8.
Wayhan, V B, Kirche, C T and Khumawala, B M (2002), „ISO 9000
Certification: the Financial Performance Implications‟, Total Quality
Management Journal, Vol. 13 No. 2, pp. 217-231.
Wilkinson, A, Redman, T and Snape, E (1994), „What is Happening in
Quality Management? Findings from an IM survey‟, The Journal of Total
Quality Management, Vol. 6 No. 1, pp. 55-8.
Yahya, S and Goh, K W (2001), „The Implementation of an ISO 9000
Quality System‟, International Journal of Quality & Reliability
Management, Vol. 18, No. 9, pp. 941-66.
Tannock, J (2010), „Themes in the Management of Quality, Lecture
Handout, The University of Nottingham, UK.
78
Appendix 1
The following is a clause-by-clause overview of the exact changes:
0.1 - General
The standard provides the ability to meet any statutory requirements along with
regulatory requirements.
It's also clarified that these requirements are restricted to those which are
applicable to the product.
0.2 – Process approach Text added to identify a process as "an activity or set
of activities."
0.3 - Relationship with ISO 9004 Revised to emphasize continual
improvement. Specifies that ISO 9004 can be used "to move beyond the
requirements of ISO 9001."
0.4 - Compatibility with other management systems Added reference to
Annex A, which compares ISO 9001:2008 and ISO 14001:2004.
1.1 and 1.2 - Scope
First note clarifies that the term product can be any intended output from the
product realization process.
Second note explains that a statutory requirement can also be a legal
requirement.
2 - Normative references Clarification for current reference - the ISO
9000:2000 is now replaced by ISO 9000:2005.
3 - Terms and definitions Explanation of "customer," "organization" and
"supplier" terms have been removed.

79
4.1 - General requirements Clause a - The word "determine" replaces the
word "identify" for processes.Notes cover definition of outsourced process and
types of control that may be applied to these processes. Reference to clause 7.4
has been added.
4.2.1 – Documentation requirements, general Clarification that QMS
documentation also includes records. Note 1 was changed - a single document
may address the requirements for one or more procedures, and a requirement
for a documented procedure may be covered by more than one document.
4.2.3 (f) - Control of documents Clarification that only external documents
determined by the organization to be necessary for the planning and operation
of the QMS need to be identified and have their distribution controlled.
4.2.4 - Control of records Editorial changes to better align with ISO 14001.
5.5.2 - Management representative Additional clarification that the
management representative be a member of the organization‟s management.
6.2.2 - Competence, training and awareness Clause b – "provide training or
take other actions to satisfy these needs" changed to "where applicable, provide
training or take other action to achieve the necessary competence"
6.3 - Infrastructure Clause c – Clarification that "information systems" are
included as part of the infrastructure.
6.4 - Work environment Clarification of "work environment" to include
conditions under which work is performed. These conditions include noise,
temperature, humidity, lighting, and weather as part of the working
environment.
7.1 (c) - Planning of product realization The term "measurement" had been
added to the activities.
7.2.1 - Determination of requirements related to the product Note
includes clarification of the meaning of "post delivery activities."

80
7.3.1 - Design and development planning A note has been added clarifying
that design and development review, verification and validation have distinct
purposes. However, they can be conducted and recorded separately or in any
combination, as suitable for the product and the organization.
7.3.3 - Design and development outputs Note added to clarify that
information needed for production and service provision may include details for
preservation of the product.
7.5.3 - Identification and traceability Added/clarified that the organization
shall identify product status with respect to monitoring and measuring
requirements throughout product realization.
7.5.4 - Customer property Slight wording change in the requirement to inform
the customer of any problem regarding his property. The note has been
amended to specify that personal data is "customer property."
7.5.5 - Preservation of product Slight wording changes:
– Added "in order to maintain conformity to requirements."
– Addition of the term "As applicable," preservation shall include …
7.6 - Control of monitoring and measuring equipment7.6 has changed
from monitoring and measuring “devices” to “equipment”.
The reference to paragraph 7.2.1 has been removed.
Clause a – Changed "and/or" to "or," so it now reads "be calibrated or verified,
or both."
Clause c – from "be identified to enable the" to "have identification in order to".
Note 1 – the references to ISO 10012-1 and ISO 10012-2 have been removed.
Note added – Confirmation of the ability of computer software to satisfy the
intended application would typically include its verification and configuration
management to maintain its suitability for use.
8.2.1 - Customer satisfaction Note added to explain that monitoring of
customer perception can include input from sources such as customer
satisfaction surveys, customer data on delivered product quality, user opinion

81
surveys, lost business analysis, compliments, warranty claims, and dealer
reports.
8.2.2 - Internal audit The management responsible for the area being audited
shall ensure that any necessary corrections and corrective actions are taken
without undue delay to eliminate detected nonconformities and their causes.
Records of audits include audit results.
The references to ISO 10011-1, ISO 10011-2, and ISO 10011-3 are now
changed to ISO 19011.
8.2.3 - Monitoring and measurement of processes A change of words: "to
ensure conformity of the product" was removed at the end of the last sentence.
Note added: "When determining suitable methods, it is advisable that the
organization should consider the type and extent of monitoring or measurement
appropriate to each of its processes in relation to their impact on the conformity
to product requirements and on the effectiveness of the quality management
system."
8.3 - Control of nonconforming product Editorial changes only –
rearrangement of the paragraphs.
8.4 - Analysis of data References to other clauses updated in items b), c), and
d).
8.5.2 - Corrective action Item f) updated to read "reviewing the effectiveness
of the corrective action taken."
8.5.3 - Preventive action Item e) updated to read "reviewing the effectiveness
of the preventative action taken."
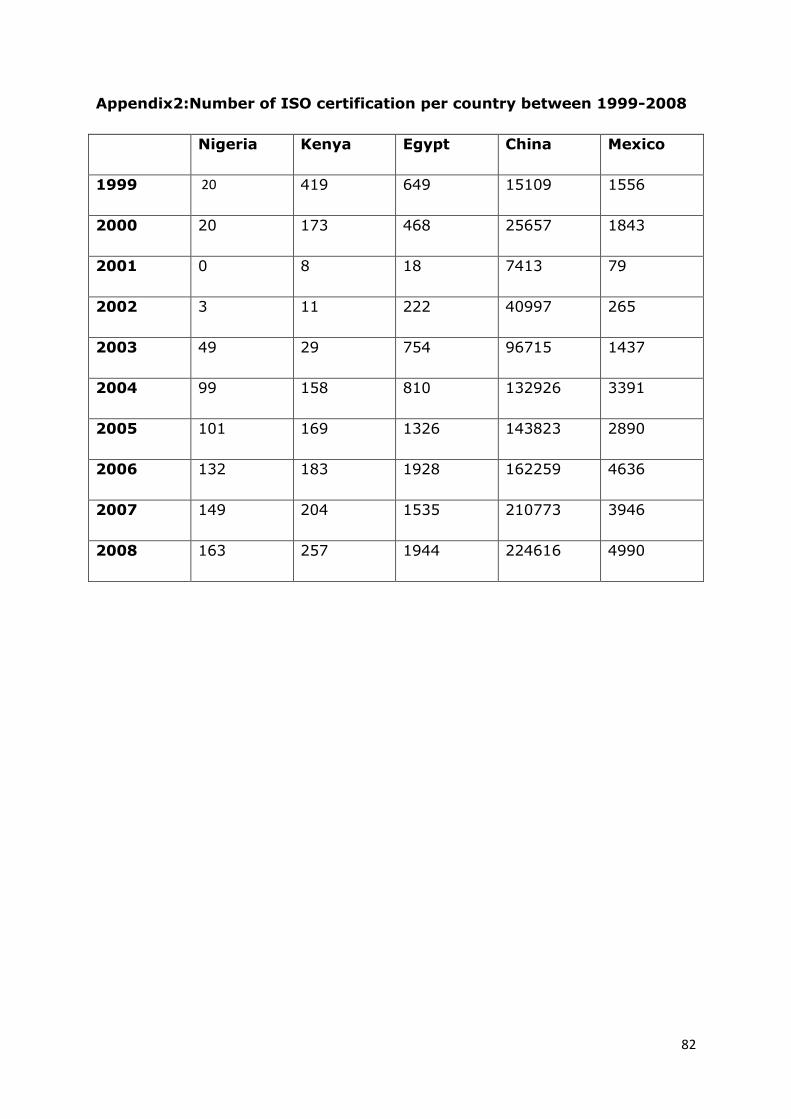
82
Appendix2:Number of ISO certification per country between 1999-2008
Nigeria Kenya Egypt China Mexico
1999 20 419 649 15109 1556
2000 20 173 468 25657 1843
2001 0 8 18 7413 79
2002 3 11 222 40997 265
2003 49 29 754 96715 1437
2004 99 158 810 132926 3391
2005 101 169 1326 143823 2890
2006 132 183 1928 162259 4636
2007 149 204 1535 210773 3946
2008 163 257 1944 224616 4990

83
Appendix 3:GDP per country between 1999-2003
1999 2000 2001 2002 2003
Nigeria
34,776,040,200.
45,983,600,313.
622,093,000,000.
649,076,000,000.
700,325,000,000.
Kenya
12,896,050,252.
12,691,278,914.
12,986,519,857.
13,149,263,399.
14,903,634,448.
Egypt 90,710,703,939
99,838,540,997
97,632,008,051
87,850,680,573
82,923,680,622
China
1,083,280,000,000.
1,198,480,000,000.
1,324,800,000,000.
1,453,830,000,000
1,640,960,000,000
Mexico
481,202,000,000.
581,426,000,000.
622,093,000,000.
649,076,000,000.
700,325,000,000.

84
GDP per country between 2004-2008
2004 2005 2006 2007 2008
Nigeria
87,845,420,492.
112,249,000,000
146,867,000,000.
165,921,000,000.
207,118,000,000.
Kenya
16,096,109,637.
18,737,922,545.
22,502,239,913.
27,124,394,664.
30,354,750,901.
Egypt 78,845,185,709
89,685,724,889
107,484,034,648
130,472,894,495
162,282,527,273
China
1,931,640,000,000.
2,235,910,000,000
2,657,880,000,000.
3,382,260,000,000
4,327,000,000,000.
Mexico
759,422,000,000.00
846,990,000,000.
948,865,000,000.00
1,022,820,000,000
1,088,130,000,000.

85