Embed Size (px)
Citation preview

Halfman et al., Owasco Lake Water Quality - 1 Finger Lakes Institute, Hobart & William Smith Colleges
OWASCO LAKE, NEW YORK: WATER QUALITY AND NUTRIENT SOURCES.
John D. Halfman, Evan S. Brown (H’08), Tara F. Ware (WS’08), Kerry A. O’Neill (WS’09), Rachael E. Dye (WS’10) and Casey K. Franklin (WS’10)
Department of Geoscience & Environmental Studies Program Finger Lakes Institute
Hobart and William Smith Colleges Geneva, NY 14456 [email protected]
1/28/08 – Revised 3/20/09 INTRODUCTION Water quality of the eleven Finger Lakes, in western and central New York State, is critical to the health, well-being and economy of the region. Created by glacial ice and melt-water erosion approximately 15,000 years ago, all eleven Finger Lakes: Conesus, Hemlock, Canadice, Honeoye, Canandaigua, Keuka, Seneca, Cayuga, Owasco, Skaneateles, and Otisco, contain approximately 8 trillion gallons of water (30.8 km3), and occupy a 2,630 square mile (4,970 km2), 14-county region. Most of these lakes are a source of Class AA (NYS DEC) drinking water for the 1.5 million residents in the surrounding communities with total permitted withdrawals of nearly 200 million gallons of water per day. Tourism and water-based recreation, sport fisheries, wildlife habitat, and diverse industrial and agricultural sectors, including an internationally known winery industry, comprise the important economic, social, ecologic and occasionally environmentally competing attributes within these watersheds.
Unfortunately, all of the Finger Lakes are subjected to a variety of environmental threats including: agricultural runoff, shoreline development, recreational use, storm water runoff, aging municipal wastewater treatment and individual onsite treatment facilities, and the introduction of exotic species, such as spiny waterflea, zebra mussel and Eurasian watermilfoil. A 2005 water quality survey, conducted under the direction of Dr. John Halfman, Finger Lakes Institute at Hobart and William Smith Colleges, ranked water quality parameters from the seven
central Finger Lakes. The ranking was based on the analysis of monthly surface and bottom water samples, CTD profiles and secchi disk depths from at least two mid-lake, deep-water sites in each lake. Water samples were analyzed for total coliform and E. coli bacteria, algae concentrations (chlorophyll-a), nutrient concentrations (dissolved phosphates, nitrates and silica), and suspended sediment concentrations. It was determined that Owasco, Honeoye and Seneca Lakes had the worst water quality, whereas Skaneateles, Canandaigua and Keuka Lakes had the best water quality. Cayuga Lake Fig. 1. The 2005 water quality ranking of 7 Finger Lakes.

Halfman et al., Owasco Lake Water Quality - 2 Finger Lakes Institute, Hobart & William Smith Colleges
ranked in between the end-members (Fig. 1., Halfman and Bush, 2006). The 2005 preliminary report noted a correlation between the ranking and a first-order, qualitative assessment of water quality protection legislation. However, more study is required to determine the significance of this correlation as it may alternatively reflect, for example, land use activities and/or the impact of recent exotics like zebra and quagga mussels. The 2006 and 2007 Finger Lakes data suggest that Owasco Lake remained within the most impaired group of lakes in 2006, but improved a few steps in 2007.
Owasco Lake, one of the smaller Finger Lakes, has a volume of 0.78 km3, surface area of 26.7 km2, length of 17.9 km, maximum depth of 54 meters, and watershed area of 470 km2 (Bloomfield, 1978; Mullins et al., 1998). It has the largest watershed surface area to lake volume ratio (17:1) of the Finger Lakes, which plays a critical role in the lake’s short water residence time of 1 to 3 years (Callinan, 2001). This suggests that the lake is quickly influenced by runoff and associated pollutant threats from the watershed, but also may more quickly respond to remediation efforts to improve water quality in the lake. Owasco Lake provides drinking water to approximately 44,000 people in Cayuga County, supplying Class AA water to City of Auburn, Towns of Owasco, Sennett, Fleming, Aurelius, Springport, Brutus, Throop, Montezuma, Mentz, Port Byron, and other lakeshore residents, with total permitted withdrawals of 16 million gallons of water per day. The lake is also essential for the economic and social structure of the region for it supports an agricultural and tourism based economy. Water quality concerns exist. Owasco Lake is on NYS DEC’s Priority Waterbodies List for bacterial impairment of the northern swimming beaches, excessive growth of aquatic vegetation and algae, particularly at the southern end and other concerns. Last year (2007) saw manure spills from concentrated animal feedlot operations (CAFOs) in the watershed.
Funding from the Fred L. Emerson Foundation, Auburn, NY, enabled an expansion of the Finger Lakes water quality survey to include a detailed investigation of Owasco Lake and its watershed in the summer of 2006. The sampling scheme was expanded to include 11 lake and 7 stream sites within the Owasco Watershed which were sampled every two weeks through the 2006 field season. The objectives of the 2006 study were to:
(1) establish consistent and comprehensive monitoring to document spatial and temporal trends in nutrient concentrations and other water quality parameters in the lake;
(2) bring particular focus to the extent and sources of nutrients from the watershed to the lake and associated watershed-lake interactions; and
(3) promote the development of effective and comprehensive watershed management policies to initiate the remediation of Owasco Lake.
The conclusions of the 2006 study are outlined below (Halfman et al., 2007): (1) Owasco Lake is a borderline oligotrophic – mesotrophic ecosystem. None of the water
quality parameters are life threatening at the present time. (2) Water quality was impaired at the southern end of the lake and most severe during
significant runoff events. The degraded water quality is interpreted to reflect, and consistent with, the delivery of point and nonpoint sources of nutrients and suspended sediments from the Owasco Inlet.
(3) Nutrients and suspended sediments originated from a wastewater treatment facility, and agricultural runoff and other sources, such as onsite wastewater systems, soil erosion, fertilized lawns, roadside ditches and/or construction activities.

Halfman et al., Owasco Lake Water Quality - 3 Finger Lakes Institute, Hobart & William Smith Colleges
(4) State, county and local officials, Owasco Watershed Lake Association members, and other concerned citizens have banned together to develop and act on a number of avenues to improve water quality including:
a. a proposed reduction of nutrient loading from the Groton wastewater treatment facility;
b. initiation of an Owasco Flats wetlands revitalization program; c. establishment and hire of a Watershed Inspector; and d. implementation of improved guidelines, inspections processes and educational
opportunities for agricultural, lawn care, septic system, and stormwater management, especially related to construction practices.
(5) Finally, Senator Michael F. Nozzolio secured NYS funding to enable an interdisciplinary and multi-institutional team of scientists to expand this investigation of water quality concerns in the Owasco watershed during 2007. This report presents our findings.
This chapter discusses the lake and stream water quality measurements from the 2005, 2006 and 2007 field seasons. WATER QUALITY Water is a critical resource that is susceptible to abuse and pollution. Pollutants are categorized in a number of ways. Point source pollutants are discharged from an identifiable spot, like the outlet of a municipal wastewater treatment plant, a factory drain pipe, or power plant cooling-water outflow. These identifiable sources are typically regulated, monitored and controlled. For example, the treatment of organic wastes by a municipal wastewater treatment plant is regulated by the New York State Pollutant Discharge Elimination System (SPDES), a permit program approved by the US Environmental Protection Agency in accordance with the Clean Water Act. SPDES Permits are designed to limit and/or monitor the quality and quantity of discharges to a water body and maintain water quality standards consistent with public health and economic considerations (NYS DEC website http://www.dec.ny.gov/permits/6308.html). Nonpoint source pollutants originate from large or dispersed land areas, such as runoff of road salt or agricultural fertilizer. Due to the diffuse nature, nonpoint source pollutants are more difficult to regulate, monitor and control, but are increasingly becoming the focus of EPA and State legislation.
Pollutants are also categorized into organic, agricultural, and industrial wastes. Organic wastes are primarily materials sent down the drain or flushed down the toilet by humans. Agricultural wastes include, for example, the runoff of soils, fertilizers, herbicides and pesticides. Industrial wastes include, for example, the disposal of heavy metals, manufactured organic compounds and their byproducts, and heat. Each group has its own degree of input, legislation and control, and the first two are more relevant to the agriculturally-rich, Owasco watershed.
Both municipal wastewater treatment facilities, in high population density areas, and individual onsite wastewater systems, in low population density areas (e.g., a rural septic system), are designed to remove solid and dissolved organic materials from wastewater by settling out the particulates in primary systems. They utilize aerobic bacterial respiration to decompose dissolved organics in secondary systems, which converts the organic matter into carbon dioxide (colorless and odorless) and dissolved nutrients. Smaller or older facilities will then discharge the nutrient-rich effluent to the environment. Larger municipal systems and more sophisticated onsite systems include additional tertiary treatments that chemically reduce nutrients and other
Halfman et al., Owasco Lake Water Quality - 4 Finger Lakes Institute, Hobart & William Smith Colleges
compounds in the effluent to more environmentally friendly concentrations before discharging the treated wastewater into the environment.
In a similar light, the disposal of organic wastes from Confined Animal Feeding Operations (CAFOs) and other forms of animal husbandry is a concern because their use has increased in the region over the past decade. Runoff of soils, fertilizers, pesticides and herbicides from agricultural land is also a concern. Current legislation attempts to control the impact from crop and animal farms through various recommended “best management practices” (BMPs), such as contour plowing, settling ponds, buffer vegetation strips, minimal tillage farming, manure digesters, and other methods. BMPs often reduce agricultural impact on nearby waterway, however, at a cost to the farmer.
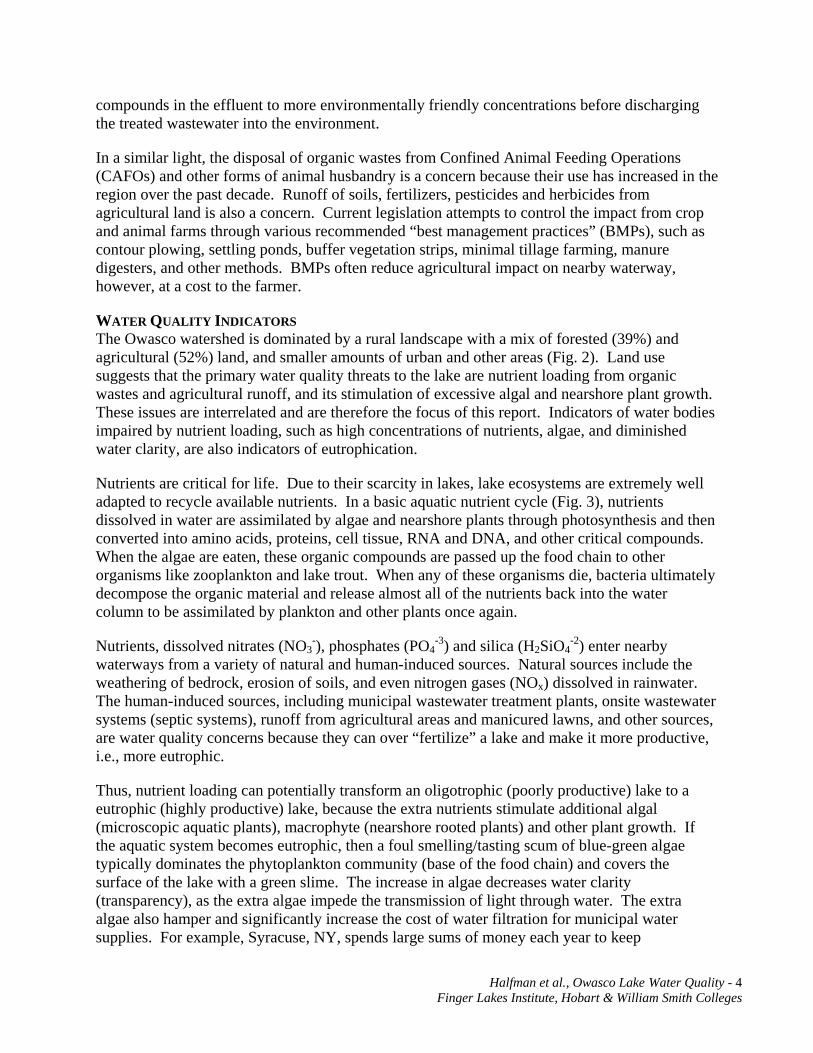
WATER QUALITY INDICATORS The Owasco watershed is dominated by a rural landscape with a mix of forested (39%) and agricultural (52%) land, and smaller amounts of urban and other areas (Fig. 2). Land use suggests that the primary water quality threats to the lake are nutrient loading from organic wastes and agricultural runoff, and its stimulation of excessive algal and nearshore plant growth. These issues are interrelated and are therefore the focus of this report. Indicators of water bodies impaired by nutrient loading, such as high concentrations of nutrients, algae, and diminished water clarity, are also indicators of eutrophication.
Nutrients are critical for life. Due to their scarcity in lakes, lake ecosystems are extremely well adapted to recycle available nutrients. In a basic aquatic nutrient cycle (Fig. 3), nutrients dissolved in water are assimilated by algae and nearshore plants through photosynthesis and then converted into amino acids, proteins, cell tissue, RNA and DNA, and other critical compounds. When the algae are eaten, these organic compounds are passed up the food chain to other organisms like zooplankton and lake trout. When any of these organisms die, bacteria ultimately decompose the organic material and release almost all of the nutrients back into the water column to be assimilated by plankton and other plants once again.
Nutrients, dissolved nitrates (NO3-), phosphates (PO4
-3) and silica (H2SiO4-2) enter nearby
waterways from a variety of natural and human-induced sources. Natural sources include the weathering of bedrock, erosion of soils, and even nitrogen gases (NOx) dissolved in rainwater. The human-induced sources, including municipal wastewater treatment plants, onsite wastewater systems (septic systems), runoff from agricultural areas and manicured lawns, and other sources, are water quality concerns because they can over “fertilize” a lake and make it more productive, i.e., more eutrophic.
Thus, nutrient loading can potentially transform an oligotrophic (poorly productive) lake to a eutrophic (highly productive) lake, because the extra nutrients stimulate additional algal (microscopic aquatic plants), macrophyte (nearshore rooted plants) and other plant growth. If the aquatic system becomes eutrophic, then a foul smelling/tasting scum of blue-green algae typically dominates the phytoplankton community (base of the food chain) and covers the surface of the lake with a green slime. The increase in algae decreases water clarity (transparency), as the extra algae impede the transmission of light through water. The extra algae also hamper and significantly increase the cost of water filtration for municipal water supplies. For example, Syracuse, NY, spends large sums of money each year to keep
Halfman et al., Owasco Lake Water Quality - 5 Finger Lakes Institute, Hobart & William Smith Colleges
Fig. 2. Land use in the Owasco Watershed.

Halfman et al., Owasco Lake Water Quality - 6 Finger Lakes Institute, Hobart & William Smith Colleges
Fig. 3. A typical nutrient cycle for lake ecosystems (yellow boxes). Typical human-induced additions (green boxes), their impact (orange box), and natural sinks (red boxes) from the nutrient
cycle are also shown.
Skaneateles and Otisco Lakes clean, clean enough to minimize filtration costs and save the residents of Syracuse money on their water bills. When the algae die (algae live for only a few days), bacteria naturally decompose the organic material while consuming dissolved oxygen and recycling the nutrients back into the environment. If the removal of oxygen from the summer-time bottom waters (depths below the thermocline) is severe enough (somewhere below 6 mg/L, as each species has its own level of tolerance), it places respiratory stress on all aquatic animals like lake trout, crawfish and worms, because dissolved oxygen is required for survival. Complete de-oxygenation of the bottom waters in eutrophic lakes induce fish kills, and, if sulfur is available, releases a “rotten egg” odor caused by the bacterial creation of hydrogen sulfide. Unfortunately, once nutrients enter a lake, the ecosystem typically remains enriched in nutrients because nutrients are continually and efficiently recycled, and continue to “fertilize” plant growth at enhanced levels. Anoxic bottom waters also allow phosphates, previously buried in the sediments as oxides in oxygen-rich oligotrophic systems, to dissolve and re-enter the water column.
Are excess nutrients human health threats? Excess nitrates in a human’s system, especially infants, induce a risk for blue-baby syndrome or methemoglobinemia. The EPA has set a maximum contaminant level (MCL) for nitrate concentrations at 10 mg/L for safe drinking water. Phosphate and silica, at natural concentrations of up to 100 μg/L (P) and 100 mg/L (Si), respectively, do not pose health risks. Phosphates however do contribute to the fertilization and eutrophication of waterways for it is typically the limiting nutrient for algal growth.
Halfman et al., Owasco Lake Water Quality - 7 Finger Lakes Institute, Hobart & William Smith Colleges
Phosphorus limits aquatic growth in most temperate lakes because the natural sources of phosphates are limited to the weathering of relatively rare rocks. Once weathered, phosphate delivery to a lake is even further hampered, because phosphates easily bind to soil particles, are nearly insoluble in water, and typically absorb onto sediment particles and thus buried in the sediment. Dissolved silica is a nutrient that is required by diatoms, a form of algae found in most lakes, to form their frustules (shells). Silica will limit diatom growth if concentrations are below 500 μg/L. If dissolved silica is scarce, then other forms of algae that do not build silica tests will dominate in the lake. In contrast, nitrates are typically non-limiting because they are released by certain plants and bacteria, do not bind to soil particles, are water soluble, and are delivered to the lake via rainfall. Thus, NYS DEC uses a phosphate concentration of 20 μg/L (P) as the threshold to exceed in classifying nutrient-rich, impacted and overly productive lakes.
Algal concentrations, measured directly by the concentration of chlorophyll, and indirectly by fluorometer, total suspended solids and secchi disk depths, are all indicators of water clarity, lake productivity, and the ecological health of a lake. Chlorophyll content is a direct measure of algal concentrations, as all algae utilize chlorophyll to harness energy from sunlight to perform photosynthesis. Its measurement, however, requires filtration of water samples and digestion of the algae with acetone in the laboratory before analysis. A fluorometer measures the concentration of algae in situ or on water samples in the laboratory. Algal concentrations are proportional to the intensity of the fluoresced red light after excitation by blue light. Total suspended solids (TSS) analysis filters a known volume of water and measures the dry mass of the filtered material, thus measuring everything suspended in the water column; both algae and sediments. The secchi disk is a weighted disk, 20 cm in diameter, painted with two black and two white quadrants. It is slowly lowered into the water column until it disappears, and this water depth is noted. The disk is lowered some more, and then slowly pulled up until it reappears, and this second depth is noted. The secchi disk depth is the average of these two depths. In very transparent waters (plankton poor, ultra-oligotrophic, very low productivity systems), a secchi disk depth can be 100 feet (30 m) or more. Whereas in eutrophic, highly productive systems, like ponds on farms, secchi disk depths can be as shallow as a few centimeters. Secchi disk depths, however, are also influenced by suspended sediments delivered by streams or resuspended by waves and currents. Careful comparison of these parameters differentiates if the impairment to water clarity is due to algae, suspended sediments, or both.
Dissolved oxygen (DO) concentrations are another indicator of primary productivity and the trophic status of lakes. Oxygen enters the epilimnion of a lake by algal photosynthesis and diffusion from the atmosphere. DO is consumed by respiration, especially bacterial respiration, through out the water column of a lake. DO sources exceed sinks (removal) in the epilimnion of lakes, and the epilimnion is typically at or occasionally exceeds 100% saturation. However, DO sinks predominate in the dark hypolimnion of the lake, and DO concentrations may become progressively depleted below saturated concentrations during the stratified season. The degree of DO depletion in the hypolimnion is typically proportional to the supply of dead algae to decompose, and thus primary productivity, assuming standard basin geometries and minimal inputs of terrestrial organic matter. Dissolved oxygen depletes from saturated concentrations (~14 mg/L) in the spring to anoxic conditions (0 mg/L) by mid- to late summer in the hypolimnion of eutrophic lakes.

Halfman et al., Owasco Lake Water Quality - 8 Finger Lakes Institute, Hobart & William Smith Colleges
Typically, a combination of nutrient concentrations, algal concentrations, secchi disk depths, and dissolved oxygen concentrations are utilized to document the degree of productivity (Trophic Status) in aquatic systems (Table 1).
Table 1. Typical concentrations for oligotrophic (low productivity) and eutrophic (high productivity) lakes (EPA). Trophic Status Secchi Depth Total Nitrogen Total Phosphate Chlorophyll a Oxygen
(m) (N, mg/L, ppm) (P, μg/L, ppb) (μg/L, ppb) (% saturation) Oligotrophic > 4 < 2 < 10 < 4 > 80 Mesotrophic 2 to 4 2 to 5 10 to 20 4 to 10 10 to 80
Eutrophic < 2 > 5 > 20 (> 30) > 10 < 10 Poor water quality can be reversed by removing nutrients and aquatic organisms through an outlet or burial of organic matter into the sediments before complete decomposition by bacteria. Chemical treatments, such as adding alum to a lake, may aid in the burial of phosphates into the sediments, making it unavailable to plant and algae. For Owasco Lake, the natural flushing or residence time of water (~1 to 3 years), is significantly faster than the other Finger Lakes, and suggests that the outlet transfers an important fraction of the dissolved nutrients and organic matter out of the lake. If the sources of nutrients to the lake are reduced so that the sources (inputs) are well below the removal mechanisms (outputs), then the amount of nutrients in the lake will become progressively smaller over time, and as a consequence, water quality in the lake will improve over time. Please note: Nutrient inputs must be consistently and persistently maintained below the outputs on a multiple residence time, time-scale to reduce the amount of nutrients in a lake’s ecosystem.
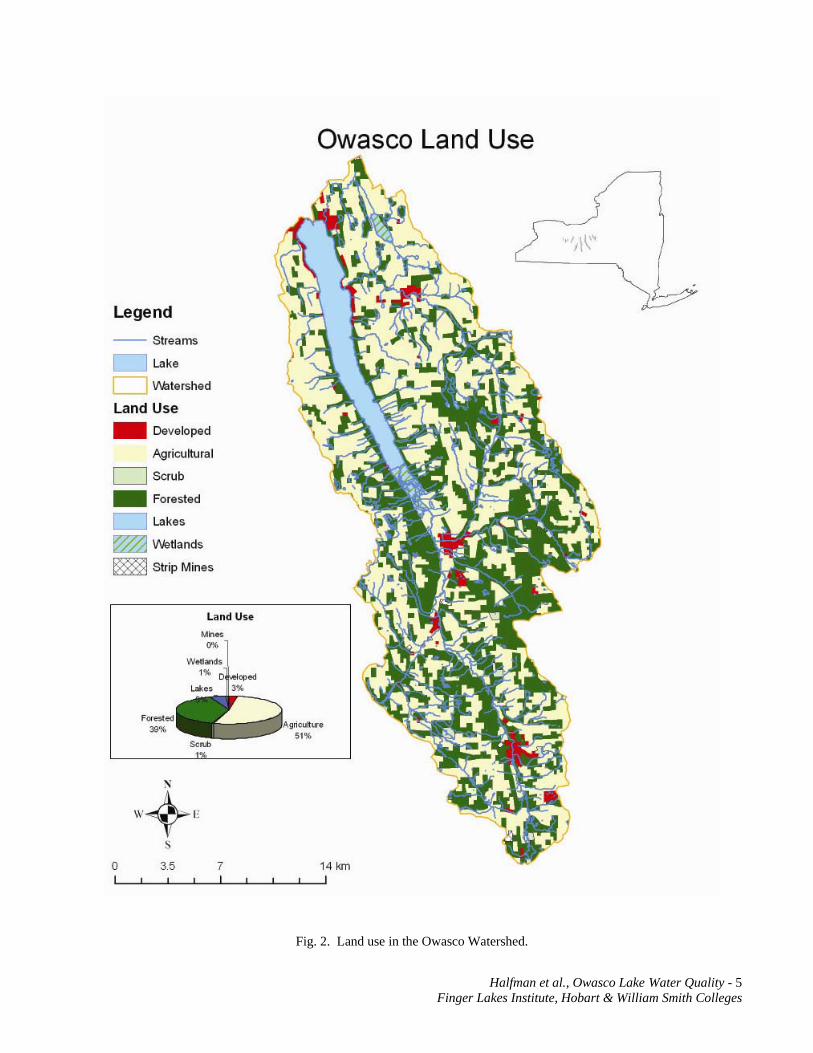
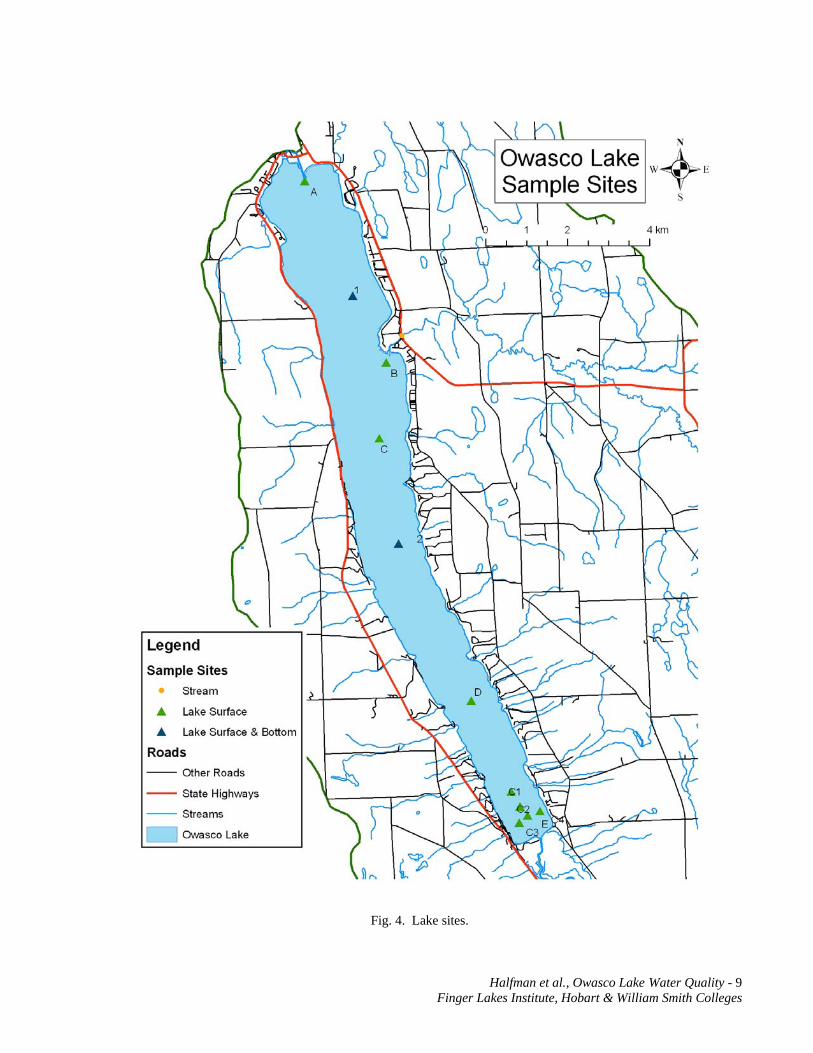
METHODS Lake Research: The 2007 investigation used identical lake sites as in 2006, and improved the methodologies. Site selection focused on lake-wide spatial coverage and potential pollutant sources to the lake (Table 2, Fig. 4). The first six sites (1 & 2, A, C – E) were distributed mid-lake, along the elongated, north-south axis of the lake starting just offshore of the outlet (Site A) and extending just offshore of the Owasco Inlet (Site E). One additional site was offshore of Dutch Hollow Brook (Site B), and four additional sites were clustered at the southern end of the lake (Sites CC1 – CC4), just offshore of Owasco Inlet at the recommendation of NYS DEC. Water quality samples were collected from surface and bottom water depths at Sites 1 & 2, sites used for the Finger Lakes Institute’s comparative water quality survey. Surface water samples were collected from the other sites. All sites were sampled every two to three weeks from May through the end of September 2007.
A conductivity, temperature and depth (CTD) water quality profile, secchi disk depth, vertical and horizontal plankton tows, and water samples were collected at each site. The CTD (SeaBird SBE-25 CTD, an upgrade from last years SBE-19) electronically collected water column profiles
Table 2. Lake site locations and maximum water depths. Site Name Latitude Longitude Water Depth
Site A 42° 53.9’ N 76° 32.25’ W 6 m Site 1 42° 52.4’ N 76° 31.35’ W 34 m Site B 42° 51.6’ N 76° 30.7’ W 16 m Site C 42° 50.35’ N 76° 30.85’ W 50 m Site 2 42° 49.15’ N 76° 30.45’ W 52 m Site D 42° 47.1’ N 76° 29.0’ W 45 m
Site CC1 42° 45.9’ N 76° 28.35’ W 29 m Site CC2 42° 45.7’ N 76° 32.2’ W 18 m
Site E 42° 45.5’ N 76° 28.0’ W 3 m Site CC3 42° 45.5’ N 76° 28.2’ W 2 m Site CC4 42° 45.75’ N 76° 27.85’ W 2 m
Halfman et al., Owasco Lake Water Quality - 9 Finger Lakes Institute, Hobart & William Smith Colleges
Fig. 4. Lake sites.
Halfman et al., Owasco Lake Water Quality - 10 Finger Lakes Institute, Hobart & William Smith Colleges
of temperature, conductivity (reported as specific conductance), dissolved oxygen, pH, turbidity, photosynthetically active radiation (PAR), and chlorophyll-a by fluorescence. The 2006 CTD lacked PAR and fluorescence sensors. In both years, the CTD was lowered from the surface to ~1m above the lake floor, collecting data every 0.5 seconds along the downcast. The data were subsequently uploaded to a computer for analysis. Water samples were analyzed onsite for temperature, conductivity, dissolved oxygen, pH and alkalinity using hand-held Oakton probes and field titrations, and analyzed in the laboratory for nutrients (total phosphate, dissolved phosphate, nitrate and silica), chlorophyll-a, total suspended solids, and major ions, specifically, sodium (Na+), calcium (Ca+2), magnesium (Mg+2), potassium (K+), chloride (Cl-), and sulfate (SO4
-2). In 2007, the collection and analysis of additional water samples for total organic matter, dissolved organic matter, total Trihalomethane potential, total coliform, E. coli and fecal bacteria counts was discontinued because the 2006 results were inconclusive.
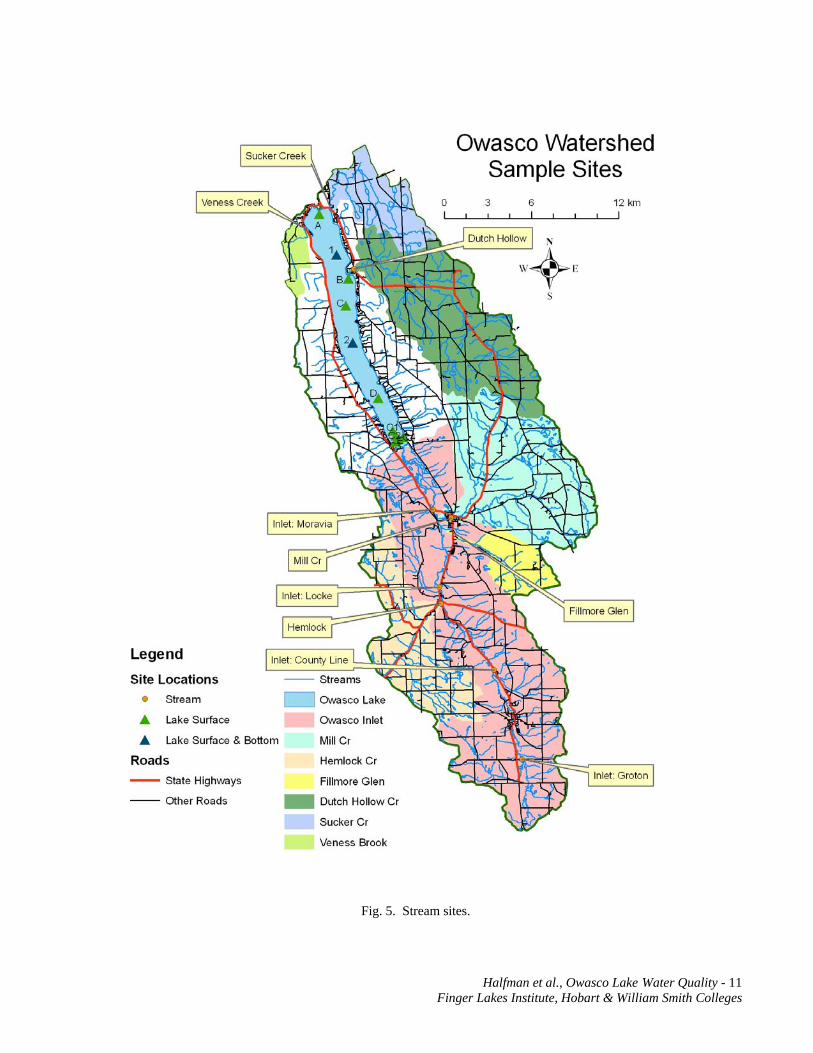
Stream Research: Stream and lake samples were collected on the same day to associate water quality observations in the lake to data from adjacent streams. The number and location of stream sites was expanded from seven sites in the 2006 survey that were focused on Dutch Hollow Brook and Owasco Inlet, to also include Veness (Dry) Brook and Sucker Brooks in the north and Fillmore Creek, another tributary to Owasco Inlet, in the south (Fig. 5). Individual stream sites were chosen to emphasize watershed size and land use activities. Larger watersheds typically deliver more nonpoint source pollutants to a lake. Streams within agriculturally-rich watersheds typically deliver more nutrients, soil particles, herbicides and pesticides to a lake. Dutch Hollow Brook is the 2nd largest tributary to Owasco Lake and drains an agriculturally-rich landscape (64% of the land use in this watershed) of both crop and animal husbandry. Owasco Inlet drains the largest fraction of the Owasco Watershed, contains a mixture of agricultural (46%) and forested land, and two wastewater treatment facilities. Veness Brook, Sucker Brook and Fillmore Creeks were added in 2007 to investigate residential (Veness), agricultural (Sucker) and forested watersheds (Fillmore).
The northern sites were located near the terminus of Dutch Hollow Brook (at Rt. 38A), Veness Brook (along Silver Street Road), and Sucker Brook (Oakridge Road at the Owasco Country Club). The southern sites were distributed within the Owasco Inlet watershed along Rt. 38 starting just downstream of Moravia, Locke and Groton (near and referenced as the County Line site), to just upstream of Groton. The Groton site was repositioned from Stevens Road bridge during 2006 to the Rt 38 bridge near Spring Street in Groton during 2007. Three major tributaries to Owasco Inlet, Mill and Fillmore Creeks (flow into Owasco Inlet between the Moravia and Locke sites), and Hemlock Creek (flows into Owasco Inlet between Locke and County Line sites), were also sampled along Rt. 38 just upstream of the tributary's confluence with Owasco Inlet.
Distributing seven sites along the Owasco Inlet enabled a stream segment analysis and potential delineation of point and perhaps nonpoint sources to the Inlet. The concentration of any pollutant increases downstream from the source. Thus, if the concentration of a pollutant increases from one site to the next downstream site, it indicates that the source of that pollutant, is somewhere between those two sites. In this case, the site selection bracketed the two municipal wastewater treatment facilities (Groton and Moravia), and sampled the major tributaries to Owasco Inlet for their respective additions of water and pollutants to the Inlet.
Halfman et al., Owasco Lake Water Quality - 11 Finger Lakes Institute, Hobart & William Smith Colleges
Fig. 5. Stream sites.

Halfman et al., Owasco Lake Water Quality - 12 Finger Lakes Institute, Hobart & William Smith Colleges
Water samples were measured onsite for temperature, conductivity, dissolved oxygen, pH and alkalinity using hand-held Oakton probes or field titrations. Water samples were also transported to the laboratory and analyzed for nutrients (total phosphate, dissolved phosphate, nitrate and silica), total suspended solids and major ion concentrations. Most importantly, stream discharge (the volume of water per unit time) was calculated from measured stream width, depth and velocity (using a Marsh-McBirney flow meter). Both velocity and depth were typically measured at five equally distributed locations aligned perpendicular to stream flow. Ten equally distributed locations were utilized at the Moravia site because the stream was much wider at this site.
Stream discharge (water volume per unit time) is a critical measurement because it is one of two variables, the other being concentration, required to calculate the flux or loading of any substance (e.g., phosphates, nitrates, suspended solids, etc.). Flux is defined as the mass of pollutant per unit time, or mass/time, delivered to a lake. Water analyses measure the concentration of the pollutant, thus provide a mass per unit volume of water, e.g., mass/volume. The flux of a substance is calculated by multiplying its concentration by the stream discharge, or dimensionally, multiplying mass/volume by volume/time, resulting in a mass/time. This distinction is important because a stream with a large concentration, but small discharge, will provide a similar flux as another stream with a small concentration and large discharge.
Two stream states are critical to characterize and sample, base flow and peak (storm) flow. When it rains, runoff quickly adds water to a stream, which swells to a peak discharge (or perhaps floods) a day or more after the rainstorm. Once the peak flow recedes, streams typically continue to flow at a lower discharge, fed by more slowly moving groundwater inputs. This groundwater fed state is the base flow. The distinction is necessary because it influences the transport of point and nonpoint source materials. Peak flow samples primarily deliver nonpoint source materials that are assimilated by the runoff of rain water along the land surface. These include agricultural and lawn care fertilizers, herbicides and pesticides, and CAFO wastes spread on fields. Base flow samples however, highlight point source materials like effluent from wastewater treatment plants, and materials transported to the stream by groundwater and are diluted to lower concentrations during peak flow events by the runoff. For streams typical of central New York, the total annual flux from a few flood events typically exceeds the contributions from base flow flux in any given year. Plots of rainfall over the field seasons and sample dates are shown in Appendix A.
Laboratory Analyses: Laboratory procedures for nutrient, chlorophyll-a, and total suspended solid concentrations followed standard limnological techniques (Wetzel and Likens, 2000). Once in the lab, a known volume of sample water was immediately filtered through a pre-weighed 0.45 μm glass-fiber filter. The filter and residue were dried at 80°C overnight and the weight gain and filtered volume were used to determine the total suspended sediment concentrations (mg/L). Another known volume of lake water was immediately filtered through a Gelman HA 0.45 μm membrane filter. The filtered residue was kept frozen until chlorophyll analysis, by acetone extraction and analysis by spectrophotometer. The filtrate was stored at 4°C for subsequent soluble reactive (dissolved) phosphate (SRP) (μg/L), nitrate (mg/L) and silica (μg/L) colorimetric analyses by spectrophotometer. A third unfiltered water sample was analyzed for total phosphates (μg/L) colorimetrically by spectrophotometer after digestion in potassium persulfate at 100ºC for 1 hour. Laboratory precision was determined by analyzing
Halfman et al., Owasco Lake Water Quality - 13 Finger Lakes Institute, Hobart & William Smith Colleges
replicate tests on the same water sample on a number of occasions: total suspended solids 0.2 mg/L, phosphate 0.1 μg/L, nitrate 0.1 mg/L, and silica 5 μg/L. All water samples were kept at 4°C until analysis and typically analyzed within a week of collection.
For quality control, over 100, randomly selected, sample splits were analyzed by Life Science Laboratories, a commercial laboratory, for total phosphate, dissolved phosphate and nitrates within a few weeks of sample collection. The results indicate that the HWS Laboratory results are statistically equivalent to the Life Science Laboratory results (r2 = 0.84 for nitrate, r2 = 0.93 for dissolved phosphate (SRP) and r2 = 0.76 for total phosphate (TP)). The correlations were hampered by the time delay between sample date and analysis at either lab, a few TP outliers, and most importantly, the analytical detection limits at each lab. Life Science Laboratory has a much higher detection limit for all three nutrients and could not detect nitrate concentrations below 0.2 mg/L compared to the 0.1 mg/L HWS detection limit or phosphate concentrations below 3 μg/L for TP and SRP compared to the 1 μg/L HWS detection limit. Thus, Life Sciences could not provide data for 15% of the nitrate samples, 70% of the SRP samples, and 40% of the TP samples.
Surface and depth integrative (20 m) horizontal and vertical plankton tows were collected using 85 μm, 0.2m diameter, mesh nets, preserved in a formalin/alcohol solution, and ~100 individuals identified, to species level, under a microscope for relative species enumerations. Major ions (chloride, sulfate, sodium, potassium, calcium and magnesium) concentrations (mg/L) were also measured on filtered (0.45 μm) water samples by Dionex DX-120 ion chromatograph, and alkalinity measured by titration. Plankton data (averaged by site and date) and major ion data (averaged by site) are tabulated in Appendix B, C & D but are not elaborated on in this report.
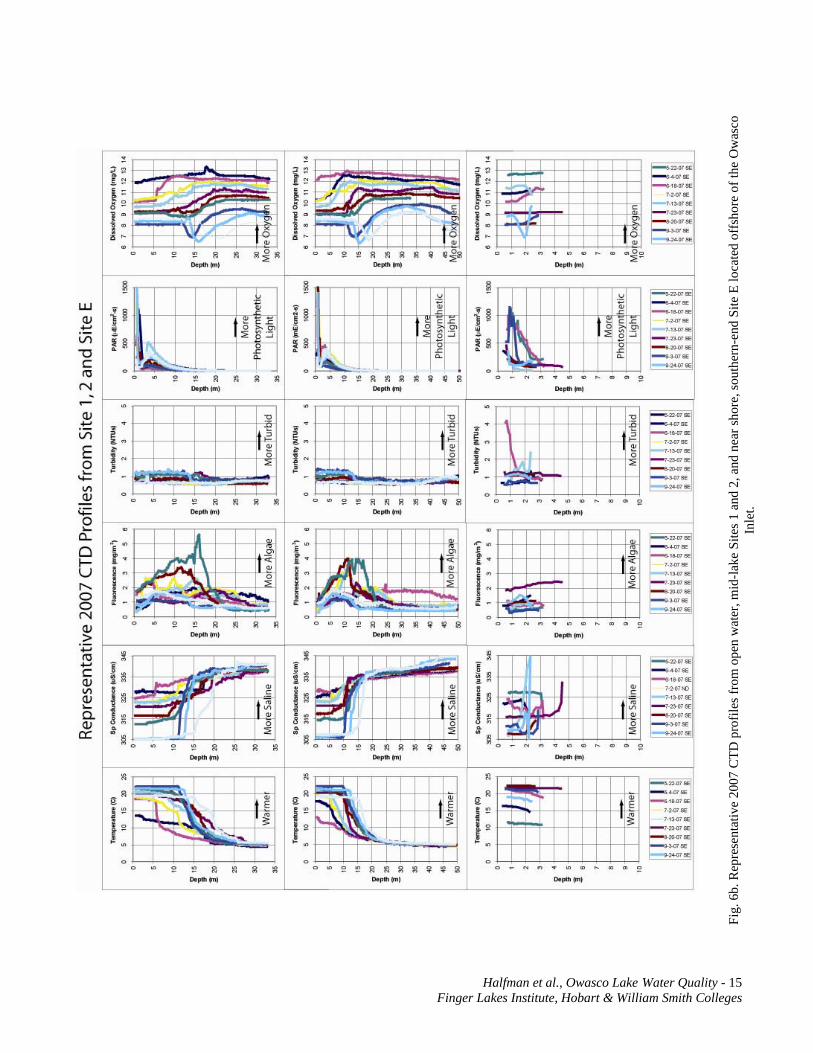
LAKE RESULTS & INTERPRETATIONS Lake CTD Profiles: The water temperature profiles were typical for any summer season (Figs. 6a & 6b). A well defined thermocline, the depth in the water column that separates the warmer, surface-water epilimnion from the colder, bottom-water hypolimnion, was observed at each deep lake site. In 2006, the thermocline was typically at 10 meters, and ranged from 7 to 13 m and occasionally farther due to seiche activity, and/or surface water cooling and vertical mixing in the fall season. The thermocline was much deeper (27 m) on 9/30/06 at Site 1. This occurred when strong southerly winds were blowing towards the northern end of the lake, and probably depressed the thermocline downward due to the accumulation of warmer, epilimnetic surface water towards the northern end of the lake and initiation of internal seiche activity. The thermocline was slightly deeper in 2007, averaging 15 meters, and ranging from 5 to 20 meters. Bottom temperatures were a constant 4 to 5°C. Water temperatures at Site E, located at the southern end of the lake near the Owasco Inlet, were uniform with water depth on any given day, reflecting the site’s shallow depth and similar to the open water epilimnion.
Conductivity data from the epilimnion of the open lake ranged from 317 to 332 μS/cm in 2006, and 306 to 328 μS/cm in 2007, persistently decreasing through both summer seasons. Hypolimnetic conductivities were more uniform, only changed from 335 to 340 μS/cm, and lacked seasonal trends. The majority of the Site E conductivities were similar to the open water concentrations, except for much lower surface water concentrations, as low as 305 μS/cm, on 6/27/06 and an occasional increase at the bottom of the profile. The increase in specific

Halfman et al., Owasco Lake Water Quality - 14 Finger Lakes Institute, Hobart & William Smith Colleges
Fig. 6a. Representative 2006 CTD profiles from open water, mid-lake Sites 1 and 2, and near shore, southern-end Site E located offshore of the Owasco Inlet.
Halfman et al., Owasco Lake Water Quality - 15 Finger Lakes Institute, Hobart & William Smith Colleges
Fig.
6b.
Rep
rese
ntat
ive
2007
CTD
pro
files
from
ope
n w
ater
, mid
-lake
Site
s 1 a
nd 2
, and
nea
r sho
re, s
outh
ern-
end
Site
E lo
cate
d of
fsho
re o
f the
Ow
asco
In
let.
Halfman et al., Owasco Lake Water Quality - 16 Finger Lakes Institute, Hobart & William Smith Colleges
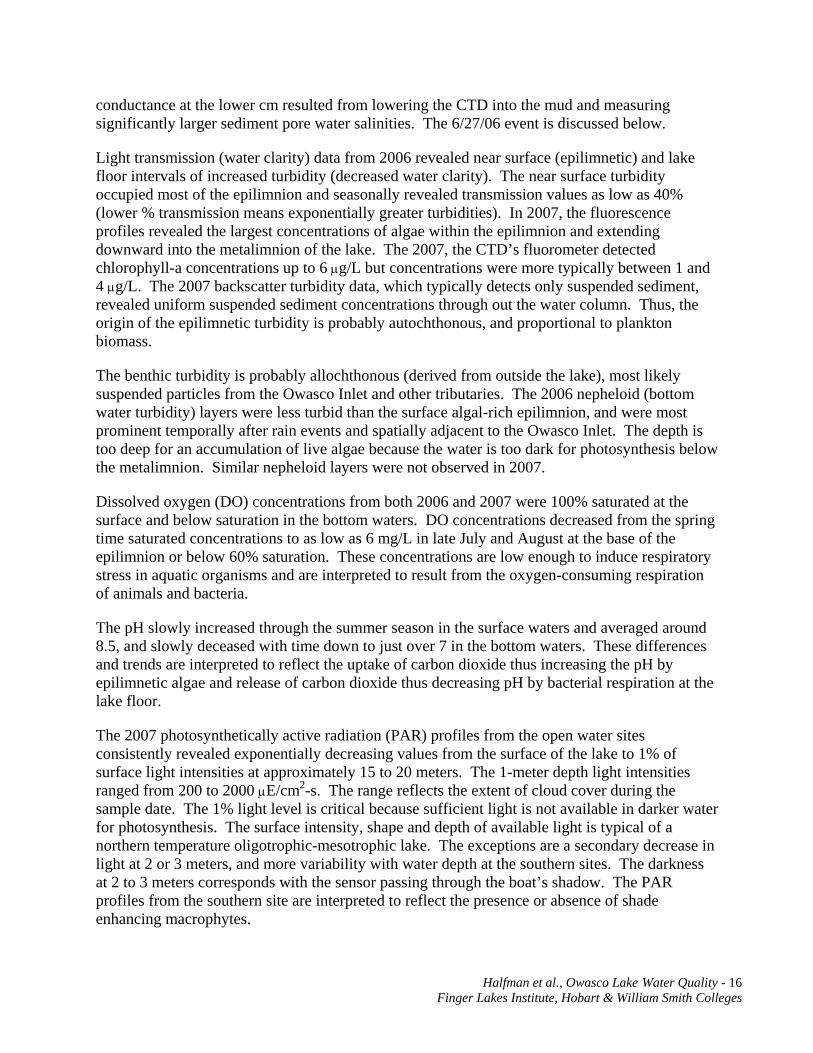
conductance at the lower cm resulted from lowering the CTD into the mud and measuring significantly larger sediment pore water salinities. The 6/27/06 event is discussed below.
Light transmission (water clarity) data from 2006 revealed near surface (epilimnetic) and lake floor intervals of increased turbidity (decreased water clarity). The near surface turbidity occupied most of the epilimnion and seasonally revealed transmission values as low as 40% (lower % transmission means exponentially greater turbidities). In 2007, the fluorescence profiles revealed the largest concentrations of algae within the epilimnion and extending downward into the metalimnion of the lake. The 2007, the CTD’s fluorometer detected chlorophyll-a concentrations up to 6 μg/L but concentrations were more typically between 1 and 4 μg/L. The 2007 backscatter turbidity data, which typically detects only suspended sediment, revealed uniform suspended sediment concentrations through out the water column. Thus, the origin of the epilimnetic turbidity is probably autochthonous, and proportional to plankton biomass.
The benthic turbidity is probably allochthonous (derived from outside the lake), most likely suspended particles from the Owasco Inlet and other tributaries. The 2006 nepheloid (bottom water turbidity) layers were less turbid than the surface algal-rich epilimnion, and were most prominent temporally after rain events and spatially adjacent to the Owasco Inlet. The depth is too deep for an accumulation of live algae because the water is too dark for photosynthesis below the metalimnion. Similar nepheloid layers were not observed in 2007.
Dissolved oxygen (DO) concentrations from both 2006 and 2007 were 100% saturated at the surface and below saturation in the bottom waters. DO concentrations decreased from the spring time saturated concentrations to as low as 6 mg/L in late July and August at the base of the epilimnion or below 60% saturation. These concentrations are low enough to induce respiratory stress in aquatic organisms and are interpreted to result from the oxygen-consuming respiration of animals and bacteria.
The pH slowly increased through the summer season in the surface waters and averaged around 8.5, and slowly deceased with time down to just over 7 in the bottom waters. These differences and trends are interpreted to reflect the uptake of carbon dioxide thus increasing the pH by epilimnetic algae and release of carbon dioxide thus decreasing pH by bacterial respiration at the lake floor.
The 2007 photosynthetically active radiation (PAR) profiles from the open water sites consistently revealed exponentially decreasing values from the surface of the lake to 1% of surface light intensities at approximately 15 to 20 meters. The 1-meter depth light intensities ranged from 200 to 2000 μE/cm2-s. The range reflects the extent of cloud cover during the sample date. The 1% light level is critical because sufficient light is not available in darker water for photosynthesis. The surface intensity, shape and depth of available light is typical of a northern temperature oligotrophic-mesotrophic lake. The exceptions are a secondary decrease in light at 2 or 3 meters, and more variability with water depth at the southern sites. The darkness at 2 to 3 meters corresponds with the sensor passing through the boat’s shadow. The PAR profiles from the southern site are interpreted to reflect the presence or absence of shade enhancing macrophytes.
Halfman et al., Owasco Lake Water Quality - 17 Finger Lakes Institute, Hobart & William Smith Colleges
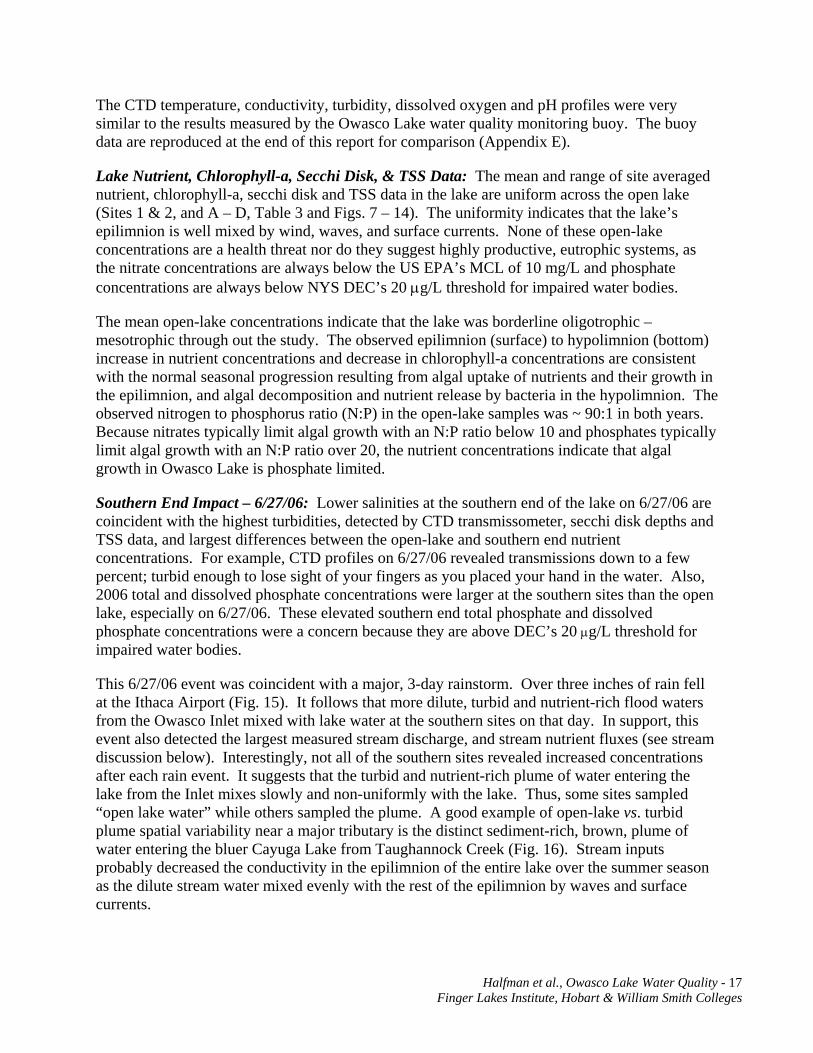
The CTD temperature, conductivity, turbidity, dissolved oxygen and pH profiles were very similar to the results measured by the Owasco Lake water quality monitoring buoy. The buoy data are reproduced at the end of this report for comparison (Appendix E).
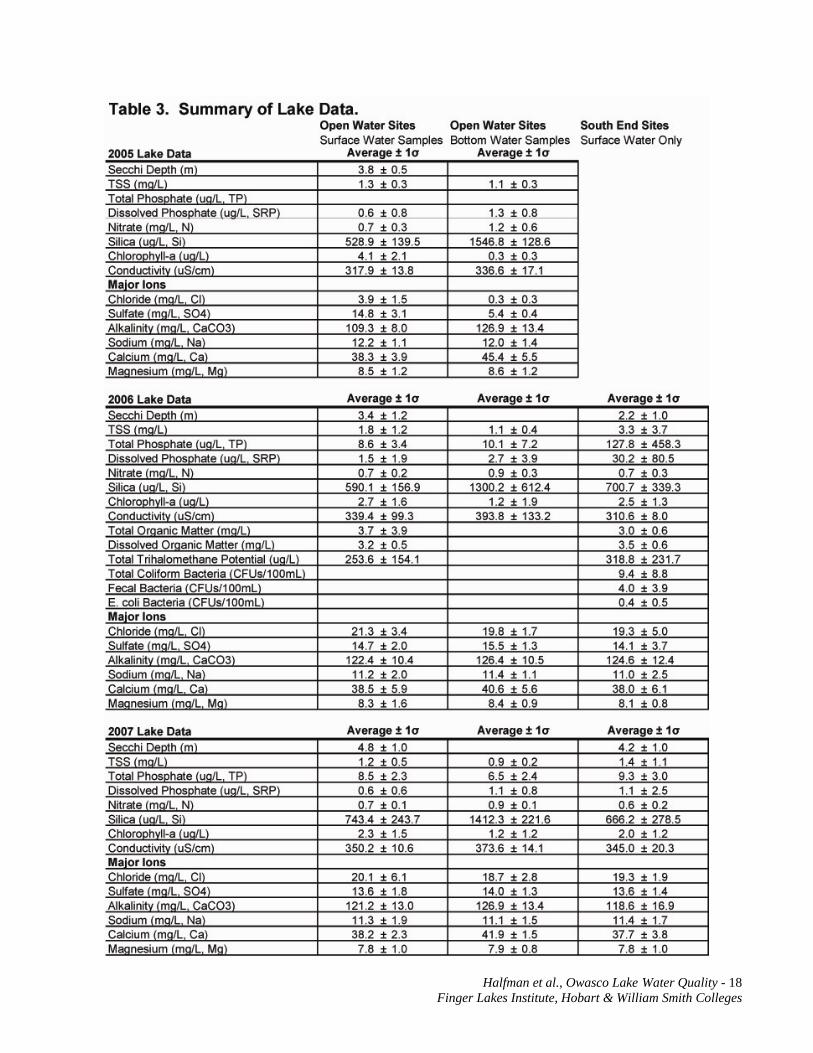
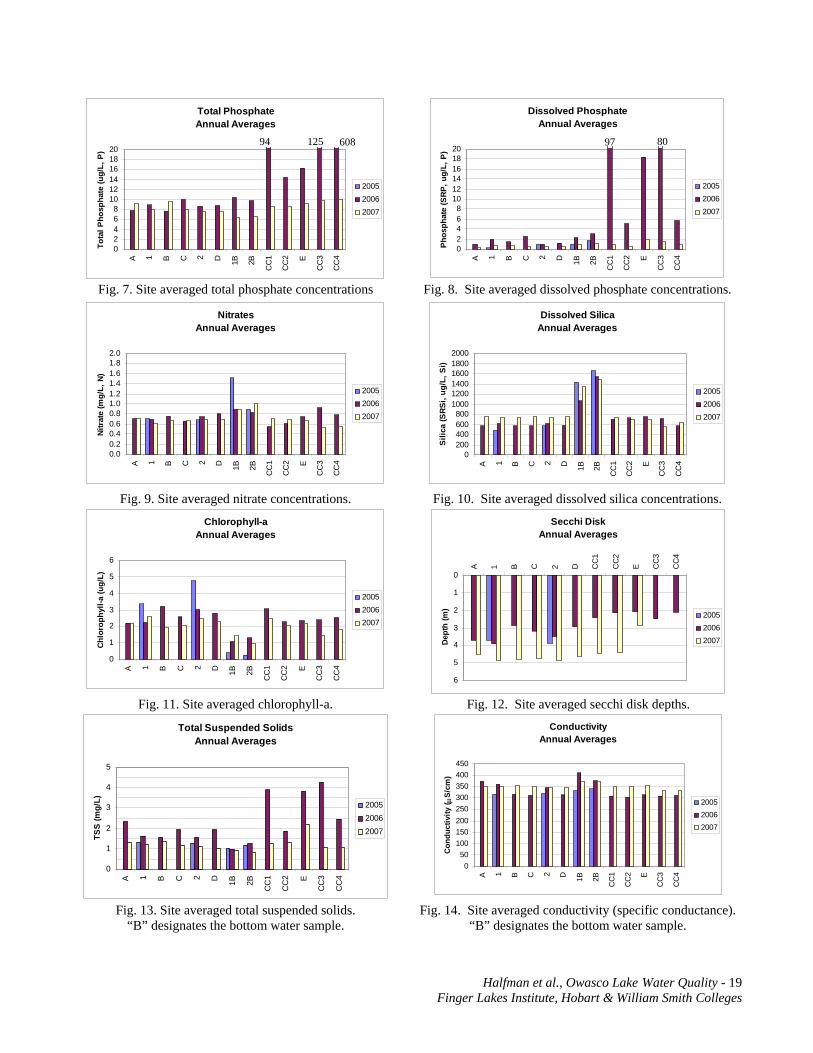
Lake Nutrient, Chlorophyll-a, Secchi Disk, & TSS Data: The mean and range of site averaged nutrient, chlorophyll-a, secchi disk and TSS data in the lake are uniform across the open lake (Sites 1 & 2, and A – D, Table 3 and Figs. 7 – 14). The uniformity indicates that the lake’s epilimnion is well mixed by wind, waves, and surface currents. None of these open-lake concentrations are a health threat nor do they suggest highly productive, eutrophic systems, as the nitrate concentrations are always below the US EPA’s MCL of 10 mg/L and phosphate concentrations are always below NYS DEC’s 20 μg/L threshold for impaired water bodies.
The mean open-lake concentrations indicate that the lake was borderline oligotrophic – mesotrophic through out the study. The observed epilimnion (surface) to hypolimnion (bottom) increase in nutrient concentrations and decrease in chlorophyll-a concentrations are consistent with the normal seasonal progression resulting from algal uptake of nutrients and their growth in the epilimnion, and algal decomposition and nutrient release by bacteria in the hypolimnion. The observed nitrogen to phosphorus ratio (N:P) in the open-lake samples was ~ 90:1 in both years. Because nitrates typically limit algal growth with an N:P ratio below 10 and phosphates typically limit algal growth with an N:P ratio over 20, the nutrient concentrations indicate that algal growth in Owasco Lake is phosphate limited.
Southern End Impact – 6/27/06: Lower salinities at the southern end of the lake on 6/27/06 are coincident with the highest turbidities, detected by CTD transmissometer, secchi disk depths and TSS data, and largest differences between the open-lake and southern end nutrient concentrations. For example, CTD profiles on 6/27/06 revealed transmissions down to a few percent; turbid enough to lose sight of your fingers as you placed your hand in the water. Also, 2006 total and dissolved phosphate concentrations were larger at the southern sites than the open lake, especially on 6/27/06. These elevated southern end total phosphate and dissolved phosphate concentrations were a concern because they are above DEC’s 20 μg/L threshold for impaired water bodies.
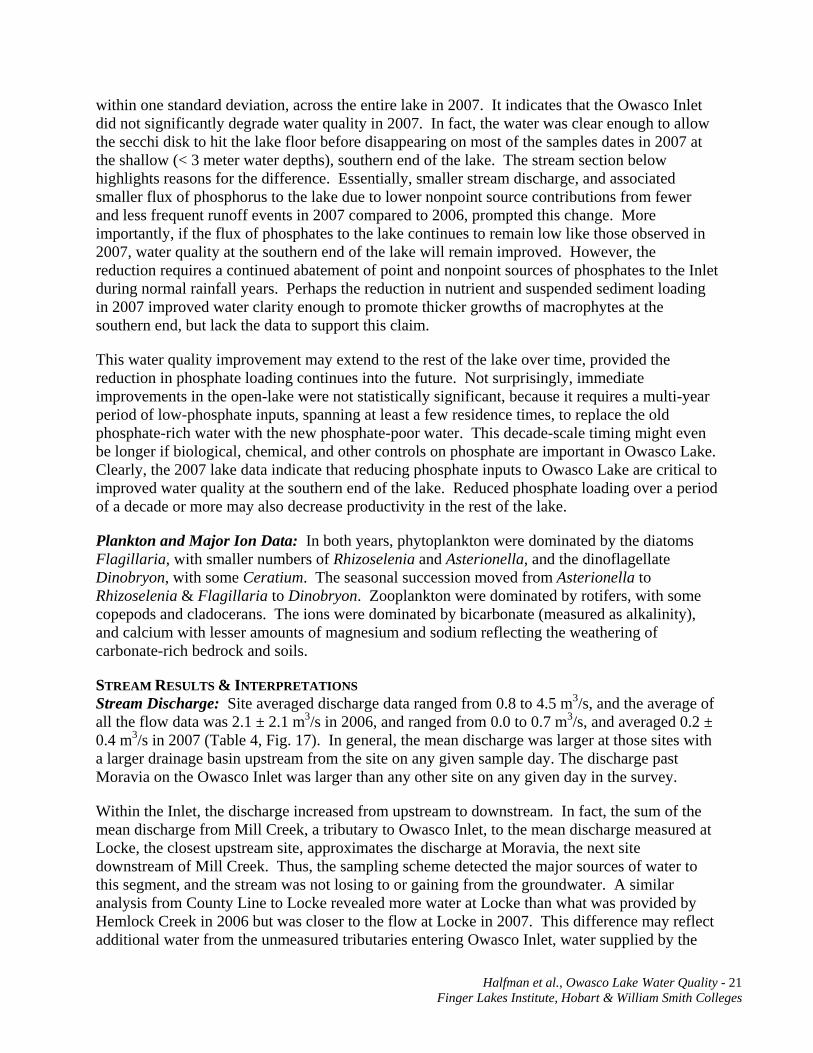
This 6/27/06 event was coincident with a major, 3-day rainstorm. Over three inches of rain fell at the Ithaca Airport (Fig. 15). It follows that more dilute, turbid and nutrient-rich flood waters from the Owasco Inlet mixed with lake water at the southern sites on that day. In support, this event also detected the largest measured stream discharge, and stream nutrient fluxes (see stream discussion below). Interestingly, not all of the southern sites revealed increased concentrations after each rain event. It suggests that the turbid and nutrient-rich plume of water entering the lake from the Inlet mixes slowly and non-uniformly with the lake. Thus, some sites sampled “open lake water” while others sampled the plume. A good example of open-lake vs. turbid plume spatial variability near a major tributary is the distinct sediment-rich, brown, plume of water entering the bluer Cayuga Lake from Taughannock Creek (Fig. 16). Stream inputs probably decreased the conductivity in the epilimnion of the entire lake over the summer season as the dilute stream water mixed evenly with the rest of the epilimnion by waves and surface currents.
Halfman et al., Owasco Lake Water Quality - 18 Finger Lakes Institute, Hobart & William Smith Colleges
Halfman et al., Owasco Lake Water Quality - 19 Finger Lakes Institute, Hobart & William Smith Colleges
Total Phosphate Annual Averages
02468
101214161820
A 1 B C 2 D 1B 2B
CC
1
CC
2 E
CC
3
CC
4
Tota
l Pho
spha
te (u
g/L,
P)
200520062007
Dissolved Phosphate Annual Averages
02468
101214161820
A 1 B C 2 D 1B 2B
CC
1
CC
2 E
CC
3
CC
4
Pho
spha
te (S
RP,
ug/
L, P
)
200520062007
Fig. 7. Site averaged total phosphate concentrations Fig. 8. Site averaged dissolved phosphate concentrations.
Nitrates Annual Averages
0.00.20.40.60.81.01.21.41.61.82.0
A 1 B C 2 D 1B 2B
CC
1
CC
2 E
CC
3
CC
4
Nitr
ate
(mg/
L, N
)
200520062007
Dissolved Silica Annual Averages
0200400600800
100012001400160018002000
A 1 B C 2 D 1B 2B
CC
1
CC
2 E
CC
3
CC
4
Sili
ca (S
RSi
, ug/
L, S
i)
200520062007
Fig. 9. Site averaged nitrate concentrations. Fig. 10. Site averaged dissolved silica concentrations.
Chlorophyll-a Annual Averages
0
1
2
3
4
5
6
A 1 B C 2 D 1B 2B
CC
1
CC
2 E
CC
3
CC
4
Chlo
roph
yll-a
(ug/
L)
200520062007
Secchi Disk Annual Averages
0
1
2
3
4
5
6
A 1 B C 2 D CC
1
CC
2
E CC
3
CC
4
Dep
th (m
)
200520062007
Fig. 11. Site averaged chlorophyll-a. Fig. 12. Site averaged secchi disk depths.
Total Suspended Solids Annual Averages
0
1
2
3
4
5
A 1 B C 2 D 1B 2B
CC
1
CC
2 E
CC
3
CC
4
TSS
(mg/
L) 200520062007
Conductivity Annual Averages
050
100150200250300350400450
A 1 B C 2 D 1B 2B
CC
1
CC
2 E
CC
3
CC
4
Con
duct
ivity
( μS/
cm)
200520062007
Fig. 13. Site averaged total suspended solids.
“B” designates the bottom water sample. Fig. 14. Site averaged conductivity (specific conductance).
“B” designates the bottom water sample.
97 80 125 94 608
Halfman et al., Owasco Lake Water Quality - 20 Finger Lakes Institute, Hobart & William Smith Colleges
The differences were not observed in the nitrate, silica and chlorophyll-a concentrations. These nutrients might not change as quickly as phosphate because phosphate is the limiting nutrient in the lake, and would be quickly assimilated by algae and other plants as the plume enters the lake, whereas the other nutrient concentrations would remain relatively unchanged. The lack of covariance between phosphates and algae concentrations was, at first, surprising because large
phosphate concentrations should promote more algal growth. Perhaps algal growth at the southern end was limited by the lack of light in 2006, since less light penetrates the water column when full of suspended sediments. The excess nutrients are being assimilated somewhere within the lake before the plume extends northward to the open lake. Perhaps the phosphates absorb onto the sediment particles and settle out onto the lake floor, fertilizing the macrophyte growth in the southern end of the lake. Nevertheless, it indicates that Owasco Inlet is a real threat to water quality at the southern end of the lake.
In contrast, no differences were observed in any of the CTD, nutrient and other data at Site B, just offshore of Dutch Hollow Brook, compared to open-lake sites in both 2006 and 2007. The similarity offshore of Dutch Hollow Brook reflects the smaller impact Dutch Hollow Brook and smaller watersheds have on the lake.
2006 to 2007 Differences: Water quality at the southern end of the lake improved from 2006 to 2007. The CTD profiles, site averaged nutrient, chlorophyll-a, TSS concentrations, and secchi disk depths were uniform, i.e.,
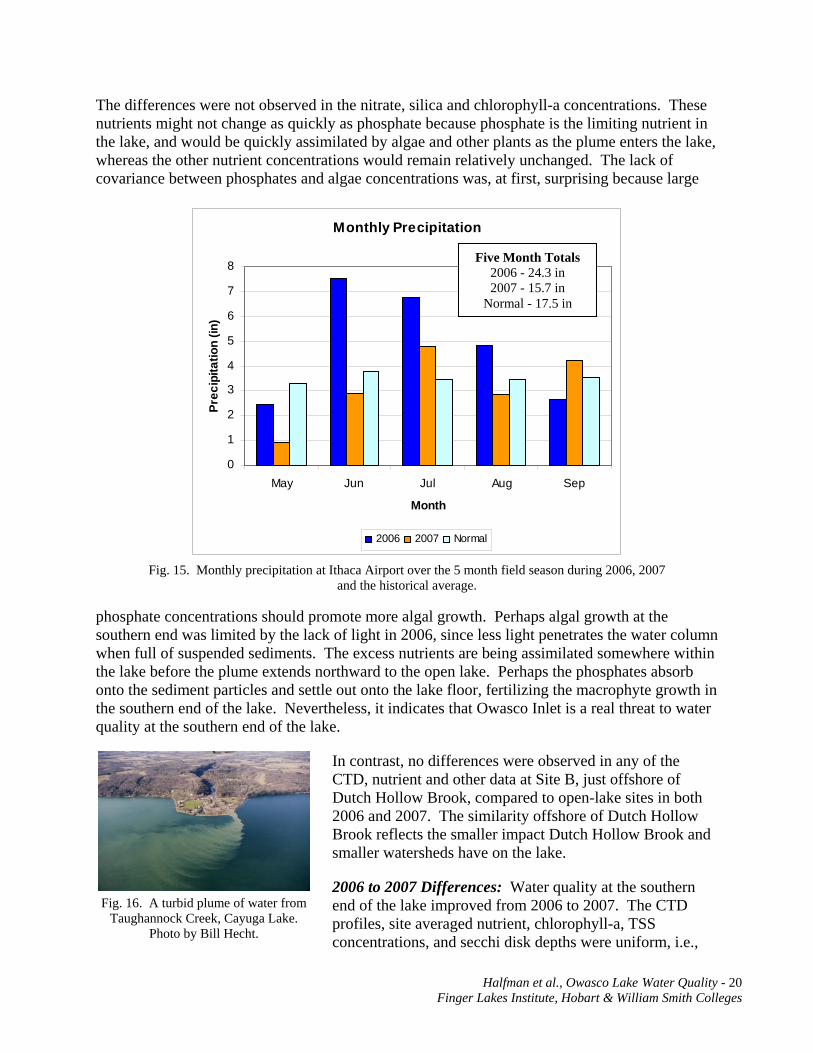
Fig. 15. Monthly precipitation at Ithaca Airport over the 5 month field season during 2006, 2007
and the historical average.
Fig. 16. A turbid plume of water from
Taughannock Creek, Cayuga Lake. Photo by Bill Hecht.
Monthly Precipitation
0
1
2
3
4
5
6
7
8
May Jun Jul Aug Sep
Month
Prec
ipita
tion
(in)
2006 2007 Normal
Five Month Totals 2006 - 24.3 in 2007 - 15.7 in
Normal - 17.5 in
Halfman et al., Owasco Lake Water Quality - 21 Finger Lakes Institute, Hobart & William Smith Colleges
within one standard deviation, across the entire lake in 2007. It indicates that the Owasco Inlet did not significantly degrade water quality in 2007. In fact, the water was clear enough to allow the secchi disk to hit the lake floor before disappearing on most of the samples dates in 2007 at the shallow (< 3 meter water depths), southern end of the lake. The stream section below highlights reasons for the difference. Essentially, smaller stream discharge, and associated smaller flux of phosphorus to the lake due to lower nonpoint source contributions from fewer and less frequent runoff events in 2007 compared to 2006, prompted this change. More importantly, if the flux of phosphates to the lake continues to remain low like those observed in 2007, water quality at the southern end of the lake will remain improved. However, the reduction requires a continued abatement of point and nonpoint sources of phosphates to the Inlet during normal rainfall years. Perhaps the reduction in nutrient and suspended sediment loading in 2007 improved water clarity enough to promote thicker growths of macrophytes at the southern end, but lack the data to support this claim.
This water quality improvement may extend to the rest of the lake over time, provided the reduction in phosphate loading continues into the future. Not surprisingly, immediate improvements in the open-lake were not statistically significant, because it requires a multi-year period of low-phosphate inputs, spanning at least a few residence times, to replace the old phosphate-rich water with the new phosphate-poor water. This decade-scale timing might even be longer if biological, chemical, and other controls on phosphate are important in Owasco Lake. Clearly, the 2007 lake data indicate that reducing phosphate inputs to Owasco Lake are critical to improved water quality at the southern end of the lake. Reduced phosphate loading over a period of a decade or more may also decrease productivity in the rest of the lake.
Plankton and Major Ion Data: In both years, phytoplankton were dominated by the diatoms Flagillaria, with smaller numbers of Rhizoselenia and Asterionella, and the dinoflagellate Dinobryon, with some Ceratium. The seasonal succession moved from Asterionella to Rhizoselenia & Flagillaria to Dinobryon. Zooplankton were dominated by rotifers, with some copepods and cladocerans. The ions were dominated by bicarbonate (measured as alkalinity), and calcium with lesser amounts of magnesium and sodium reflecting the weathering of carbonate-rich bedrock and soils.
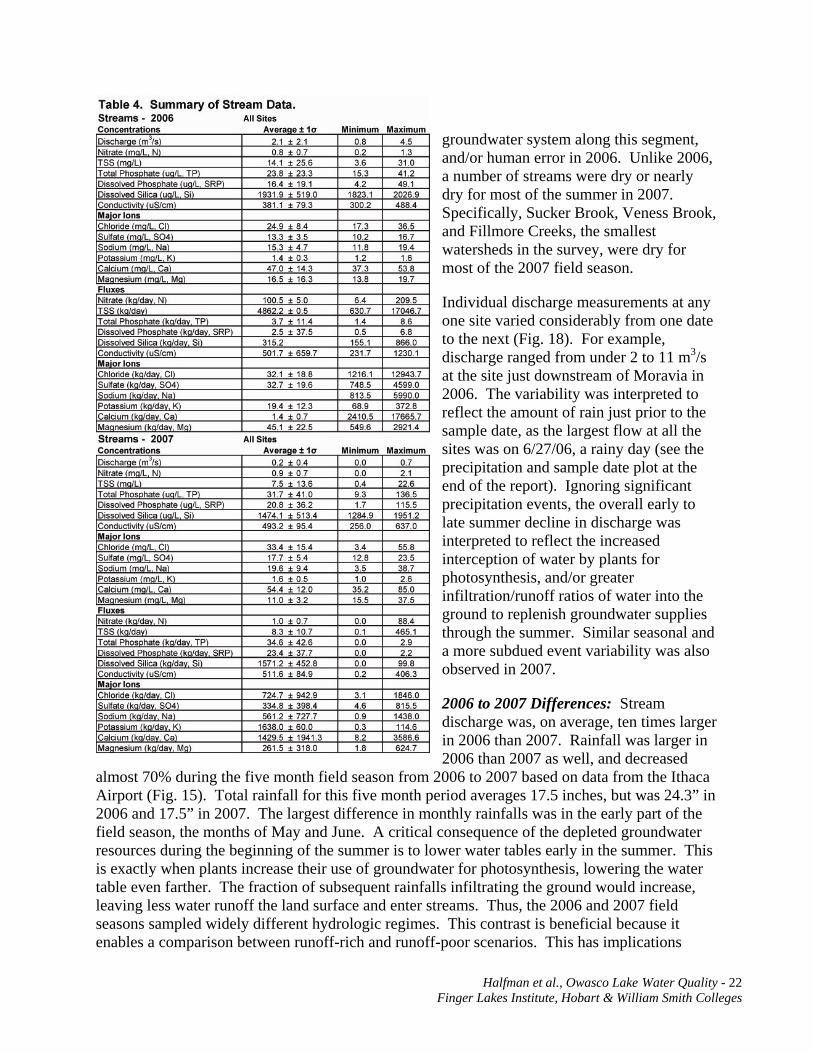
STREAM RESULTS & INTERPRETATIONS Stream Discharge: Site averaged discharge data ranged from 0.8 to 4.5 m3/s, and the average of all the flow data was 2.1 ± 2.1 m3/s in 2006, and ranged from 0.0 to 0.7 m3/s, and averaged 0.2 ± 0.4 m3/s in 2007 (Table 4, Fig. 17). In general, the mean discharge was larger at those sites with a larger drainage basin upstream from the site on any given sample day. The discharge past Moravia on the Owasco Inlet was larger than any other site on any given day in the survey.
Within the Inlet, the discharge increased from upstream to downstream. In fact, the sum of the mean discharge from Mill Creek, a tributary to Owasco Inlet, to the mean discharge measured at Locke, the closest upstream site, approximates the discharge at Moravia, the next site downstream of Mill Creek. Thus, the sampling scheme detected the major sources of water to this segment, and the stream was not losing to or gaining from the groundwater. A similar analysis from County Line to Locke revealed more water at Locke than what was provided by Hemlock Creek in 2006 but was closer to the flow at Locke in 2007. This difference may reflect additional water from the unmeasured tributaries entering Owasco Inlet, water supplied by the
Halfman et al., Owasco Lake Water Quality - 22 Finger Lakes Institute, Hobart & William Smith Colleges
groundwater system along this segment, and/or human error in 2006. Unlike 2006, a number of streams were dry or nearly dry for most of the summer in 2007. Specifically, Sucker Brook, Veness Brook, and Fillmore Creeks, the smallest watersheds in the survey, were dry for most of the 2007 field season.
Individual discharge measurements at any one site varied considerably from one date to the next (Fig. 18). For example, discharge ranged from under 2 to 11 m3/s at the site just downstream of Moravia in 2006. The variability was interpreted to reflect the amount of rain just prior to the sample date, as the largest flow at all the sites was on 6/27/06, a rainy day (see the precipitation and sample date plot at the end of the report). Ignoring significant precipitation events, the overall early to late summer decline in discharge was interpreted to reflect the increased interception of water by plants for photosynthesis, and/or greater infiltration/runoff ratios of water into the ground to replenish groundwater supplies through the summer. Similar seasonal and a more subdued event variability was also observed in 2007.
2006 to 2007 Differences: Stream discharge was, on average, ten times larger in 2006 than 2007. Rainfall was larger in 2006 than 2007 as well, and decreased
almost 70% during the five month field season from 2006 to 2007 based on data from the Ithaca Airport (Fig. 15). Total rainfall for this five month period averages 17.5 inches, but was 24.3” in 2006 and 17.5” in 2007. The largest difference in monthly rainfalls was in the early part of the field season, the months of May and June. A critical consequence of the depleted groundwater resources during the beginning of the summer is to lower water tables early in the summer. This is exactly when plants increase their use of groundwater for photosynthesis, lowering the water table even farther. The fraction of subsequent rainfalls infiltrating the ground would increase, leaving less water runoff the land surface and enter streams. Thus, the 2006 and 2007 field seasons sampled widely different hydrologic regimes. This contrast is beneficial because it enables a comparison between runoff-rich and runoff-poor scenarios. This has implications

Halfman et al., Owasco Lake Water Quality - 23 Finger Lakes Institute, Hobart & William Smith Colleges
when comparing the flux of nutrients and other parameters from the watershed to the lake, and what can happen to the lake if the nutrient loading from the watershed is turned off.
The flux of nutrients, suspended solids and other materials, from all the streams to the lake, greatly decreased from 2006 to 2007 as well. For example, the average flux of total phosphates decreased from 6.2 to 2.9 kg/day, dissolved phosphate from 6.8 to 1.6 kg/day, nitrate from 210 to 88 kg/day, and total suspended solids from 17,000 to 465 kg/day past Moravia from 2006 to 2007. Significant 2006 to 2007 decreases were also observed at the other stream sites. Clearly, the fluxes of these materials were larger everywhere in 2006 because all sites experienced higher rainfall in 2006 compared to 2007. The larger runoff in 2006 increased the assimilation and transport of nonpoint source materials from the watersheds to the lake than in 2007.
The differences from one year to the next can be explained by the change in runoff and differences in land use within each subwatershed. For example, Dutch Hollow Brook delivered a larger percentage of nitrates and salts than Owasco Inlet in 2006 than 2007. Dutch Hollow Brook has more agricultural land than Owasco Inlet (64% vs. 46%), and agricultural land is an important nonpoint source for nitrates and major ions. Thus, more rainfall in 2006 collected and transported more water-soluble materials from the agriculturally-rich, Dutch Hollow Brook subwatershed, thus increasing the relative importance of Dutch Hollow Brook for the delivery of water-soluble items in 2006. The decrease in suspended solids delivery from 2006 to 2007, that
2006 Stream DischargeAverage
0
1
2
3
4
5
Dut
chH
ollo
wIn
let
(Mor
avia
)
Mill
Cr
Fillm
ore
Inle
t(L
ocke
)
Hem
lock
Inle
t(C
ount
yIn
let
(Gro
ton)
Suc
ker
Ven
ess
Dis
char
ge (m
3/s)
2006 average
Site+Trib
2006 Stream DischargeIndividual Measurements
0
2
4
6
8
10
12
Dut
chH
ollo
wIn
let
(Mor
avia
)
Mill
Cr
Fillm
ore
Inle
t(L
ocke
)
Hem
lock
Inle
t(C
ount
yIn
let
(Gro
ton)
Suc
ker
Ven
ess
Dis
char
ge (m
3/s)
5/29/06
6/5/06
6/27/067/5/06
7/18/06
8/14/069/12/06
2007 Stream DischargeAverage
0
1
2
Dut
chH
ollo
wIn
let
(Mor
avia
)
Mill
Cr
Fillm
ore
Inle
t(L
ocke
)
Hem
lock
Inle
t(C
ount
yIn
let
(Gro
ton)
Suc
ker
Ven
ess
Dis
char
ge (m
3/s)
2007 average
Site+Trib
2007 Stream DischargeIndividual Measurements
0
1
2
Dut
chH
ollo
wIn
let
(Mor
avia
)
Mill
Cr
Fillm
ore
Inle
t(L
ocke
)
Hem
lock
Inle
t(C
ount
yIn
let
(Gro
ton)
Suc
ker
Ven
ess
Dis
char
ge (m
3/s)
5/28/07
6/4/07
6/18/077/2/07
7/13/07
7/23/078/20/07
9/3/07
9/24/07
Fig. 17. 2006 & 2007 site averaged stream discharge. Note scale
change. Fig. 18. 2006 and 2007 stream discharge. Note scale change.
Halfman et al., Owasco Lake Water Quality - 24 Finger Lakes Institute, Hobart & William Smith Colleges
was observed in the more agricultural watersheds, can also be attributed to the parallel decrease in runoff from 2006 to 2007. The change in suspended solids may also reflect a change in the extent and location of construction and other activities causing high susceptibility to erosion.
Sampling two widely different hydrological years was ideal because it allowed direct observations of the lake when the delivery of nonpoint source pollutants to the lake is significantly reduced. The 2007 lake data indicated that water quality improved in the southern end of the lake. The lake data also hinted that water quality will improve when the lake is flushed with nutrient-poor water for a number of residence times, approximately a decade, or perhaps longer. Therefore, significant effort must be made to reduce the source of the primary pollutants for a long period of time to significantly improve water quality in Owasco Lake.
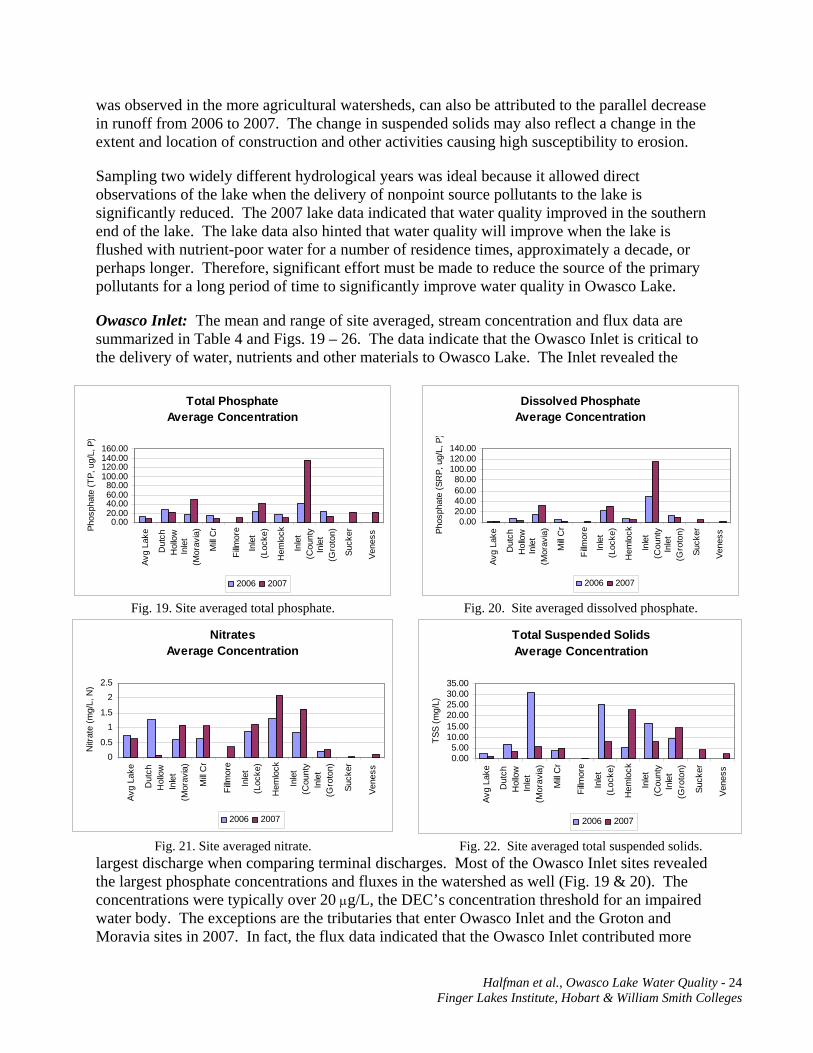
Owasco Inlet: The mean and range of site averaged, stream concentration and flux data are summarized in Table 4 and Figs. 19 – 26. The data indicate that the Owasco Inlet is critical to the delivery of water, nutrients and other materials to Owasco Lake. The Inlet revealed the
largest discharge when comparing terminal discharges. Most of the Owasco Inlet sites revealed the largest phosphate concentrations and fluxes in the watershed as well (Fig. 19 & 20). The concentrations were typically over 20 μg/L, the DEC’s concentration threshold for an impaired water body. The exceptions are the tributaries that enter Owasco Inlet and the Groton and Moravia sites in 2007. In fact, the flux data indicated that the Owasco Inlet contributed more
Total Phosphate Average Concentration
0.0020.0040.0060.0080.00
100.00120.00140.00160.00
Avg
Lake
Dut
chH
ollo
wIn
let
(Mor
avia
)
Mill
Cr
Fillm
ore
Inle
t(L
ocke
)
Hem
lock
Inle
t(C
ount
yIn
let
(Gro
ton)
Suck
er
Vene
ss
Phos
phat
e (T
P, u
g/L,
P)
2006 2007
Dissolved Phosphate Average Concentration
0.0020.0040.0060.0080.00
100.00120.00140.00
Avg
Lake
Dut
chH
ollo
wIn
let
(Mor
avia
)
Mill
Cr
Fillm
ore
Inle
t(L
ocke
)
Hem
lock
Inle
t(C
ount
yIn
let
(Gro
ton)
Suck
er
Vene
ssPhos
phat
e (S
RP,
ug/
L, P
)
2006 2007
Fig. 19. Site averaged total phosphate. Fig. 20. Site averaged dissolved phosphate.
Nitrates Average Concentration
00.5
11.5
22.5
Avg
Lake
Dut
chH
ollo
wIn
let
(Mor
avia
)
Mill
Cr
Fillm
ore
Inle
t(L
ocke
)
Hem
lock
Inle
t(C
ount
yIn
let
(Gro
ton)
Suck
er
Vene
ss
Nitr
ate
(mg/
L, N
)
2006 2007
Total Suspended Solids Average Concentration
0.005.00
10.0015.0020.0025.0030.0035.00
Avg
Lake
Dut
chH
ollo
wIn
let
(Mor
avia
)
Mill
Cr
Fillm
ore
Inle
t(L
ocke
)
Hem
lock
Inle
t(C
ount
yIn
let
(Gro
ton)
Suck
er
Vene
ss
TSS
(mg/
L)
2006 2007
Fig. 21. Site averaged nitrate. Fig. 22. Site averaged total suspended solids.

Halfman et al., Owasco Lake Water Quality - 25 Finger Lakes Institute, Hobart & William Smith Colleges
Total Phosphate w/out 6/27/06 FloodAverage Flux
012345678
Dut
chH
ollo
wIn
let
(Mor
avia
)
Mill
Cr
Fillm
ore
Inle
t(L
ocke
)
Hem
lock
Inle
t(C
ount
yIn
let
(Gro
ton)
Suck
er
Vene
ss
Phos
phat
e (T
P, k
g/da
y, P
)
2006 Average
Stream+Trib Sum
Total PhosphateAverage Flux
012345678
Dut
chH
ollo
wIn
let
(Mor
avia
)
Mill
Cr
Fillm
ore
Inle
t(L
ocke
)
Hem
lock
Inle
t(C
ount
yIn
let
(Gro
ton)
Suck
er
Vene
ss
Phos
phat
e (T
P, k
g/da
y, P
)
Site Average
Stream+Trib Sum
Fig. 23. 2006 & 2007 Site averaged total phosphate flux.
Dissolved PhosphateAverage Flux
012345678
Dut
chH
ollo
wIn
let
(Mor
avia
)
Mill
Cr
Fillm
ore
Inle
t(L
ocke
)
Hem
lock
Inle
t(C
ount
yIn
let
(Gro
ton)
Suck
er
Vene
ss
Phos
phat
e (S
RP,
kg/
day,
P)
2006 Average
Stream+Trib Sum
Dissolved PhosphateAverage Flux
012345678
Dut
chH
ollo
wIn
let
(Mor
avia
)
Mill
Cr
Fillm
ore
Inle
t(L
ocke
)
Hem
lock
Inle
t(C
ount
yIn
let
(Gro
ton)
Suck
er
Vene
ss
Phos
phat
e (S
RP,
kg/
day,
P)
2007 Average
Stream+Trib Sum
Fig. 24. 2006 & 2007 Site averaged dissolved phosphate flux. Nitrates
Average Flux
0
50
100
150
200
250
Dut
chH
ollo
wIn
let
(Mor
avia
)
Mill
Cr
Fillm
ore
Inle
t(L
ocke
)
Hem
lock
Inle
t(C
ount
yIn
let
(Gro
ton)
Suck
er
Vene
ss
Nitr
ate
(kg/
day,
N)
2006 Average
Stream+Trib Sum
NitratesAverage Flux
0
50
100
150
200
250
Dut
chH
ollo
wIn
let
(Mor
avia
)
Mill
Cr
Fillm
ore
Inle
t(L
ocke
)
Hem
lock
Inle
t(C
ount
yIn
let
(Gro
ton)
Suck
er
Vene
ss
Nitr
ate
(kg/
day,
N)
2007 Average
Stream+Trib Sum
Fig. 25. 2006 & 2007 Site averaged nitrate flux.
Total Suspended SolidsAverage Flux
02000400060008000
1000012000140001600018000
Dut
chH
ollo
wIn
let
(Mor
avia
)M
ill C
r
Fillm
ore
Inle
t(L
ocke
)H
emlo
ckIn
let
(Cou
nty
Inle
t(G
roto
n)Su
cker
Vene
ss
TSS
(kg/
day)
2006 Average
Stream+Trib Sum
Total Suspended SolidsAverage Flux
0200400600800
10001200140016001800
Dut
chH
ollo
wIn
let
(Mor
avia
)
Mill
Cr
Fillm
ore
Inle
t(L
ocke
)H
emlo
ckIn
let
(Cou
nty
Inle
t(G
roto
n)
Suck
er
Vene
ss
TSS
(kg/
day)
2007 Average
Stream+Trib Sum
Fig. 26. 2006 & 2007 Site averaged total suspended solids flux.

Halfman et al., Owasco Lake Water Quality - 26 Finger Lakes Institute, Hobart & William Smith Colleges
total phosphates (2x), dissolved phosphates (10x), total suspended solids (17x), dissolved silica (4.5x), nitrates (1.5x), and major ions (conductivity 2.5x) than Dutch Hollow Brook, the second largest streams in the Owasco watershed in 2006. In 2007, even though the total flux decreased from 2006 values, the Owasco Inlet dominance over Dutch Hollow Brook increased in total phosphates (2 to 9x), dissolved phosphates (10 to 45x) and nitrates (1.5 to 15x), decreased in total suspended solids (17 to 7x), and remained the same for dissolved silica (4.5 to 4x), and major ions (conductivity 2.5 to 4.8x).
One reason for the Owasco Inlet dominance is because it drains the largest portion (57%) of the watershed. It is approximately 4 times larger than Dutch Hollow Brook, the second largest drainage in the watershed. However, the Inlet delivered more dissolved phosphates and other materials, especially in 2007, than a linear interpolation based on drainage basin area would predict. It indicates that an additional source (or sources) of phosphate exist in this drainage, that is not present in the other subwatersheds. TSS decreased because runoff decreased, and silica and major ions remained the same because they enter the stream from groundwater flow.
Groton Wastewater Treatment Facility: The segment analysis pinpoints the largest phosphate concentrations at the County Line site where site averaged TP and SRP concentrations exceeded 40 μg/L in 2006, and 110 μg/L in 2007. Most of the fluxes increased downstream along the Owasco Inlet. For example, the flux of most of the parameters measured between County Line and Locke and between Locke and Moravia increased by the measured flux of material delivered by the major tributary(ies) between these sites. Tributaries are lacking to explain the increase in total phosphate, dissolved phosphate and nitrate flux from Groton to County Line, upstream and downstream of the Groton Wastewater Treatment Facility, respectively. This segment is critical to the input of nutrients to the lake because it delivers approximately 20% of the total phosphates, 50% of the dissolved phosphates, and 30% of the nitrates discharged past Moravia in 2006 and 87% of the total phosphates, 100% of the dissolved phosphates, and 45% of the nitrates in 2007. Because tributaries are absent and can not account for a nutrient source, it was determined that a major point source for P and N exists along this stretch, likely the Groton Municipal Wastewater Treatment Facility.
The Groton wastewater treatment facility discharged approximately 4 to 5 lbs. of phosphorus per day or approximately 2 kg/day to the stream in its treated wastewater effluent in 2006 (Bruce Natale, personal communication). This load is similar to the 3.3 kg/day, site-averaged increase in dissolved phosphate flux between the Groton and County Line sites. In 2007, the facility decreased phosphorus in its effluent to approximately 3 lbs/day (1.4 kg/day) while testing potential tertiary treatment systems. Interestingly, the increase in SRP flux between Groton and County Line was only 2.1 kg/day, a reduction from 2006. The similarity between the facility’s contribution to the Inlet and the detected change in dissolved phosphate flux in the stream, and their mutual decrease from 2006 to 2007 is very compelling. Similar results are observed in the total phosphate and nitrate data. Other probably sources can explain any unaccounted phosphate or nitrate along this stretch. In conclusion, the Owasco Inlet segment analysis identified a critical point source of nutrients, the Groton Municipal Wastewater Treatment Facility. It suggests that the facility should decrease phosphorus loading to as low as economically possible to improve water quality at the southern end of the Owasco Lake, and in the years to come, to the rest of the lake.
Halfman et al., Owasco Lake Water Quality - 27 Finger Lakes Institute, Hobart & William Smith Colleges
Interestingly, a similar increase in nutrient loading is not observed in the Owasco Inlet data between Locke (upstream) and Moravia (downstream); Inlet sites that bracket Moravia's Municipal Wastewater Treatment Facility. Present phosphorus load by the Moravia facility is limited by DEC permit to 2 lbs/day (0.9 kg/day) and most of the loading from this facility during 2006 was lower than allowed by their permit. The Moravia facility is an excellent example of how municipal tertiary treatment systems can effectively remove nutrients from its effluent at minimal cost to the general public.
Even though the Groton Municipal Wastewater Treatment Facility is a major point source of nutrients, it does not supply all of the nutrients delivered by Owasco Inlet to the lake. This survey indicated that Dutch Hollow Brook, Mill Creek, Hemlock Creek, and the rest of Owasco Inlet deliver a significant share, especially nitrates, during wet years. Data are inconclusive for Sucker Brook, Veness Brook and Fillmore Creeks due to the dry climate/weather in 2007. Other nutrient and suspended sediment sources are significant and must be addressed to reduce the nutrient and suspended sediment loading to the lake. These nonpoint sources may include runoff from agricultural land, manicured lawns, and individual onsite septic systems. Major sediment sources may include agricultural land, construction projects, and roadside ditches.
Do the nutrients added to in the Inlet get mitigated before reaching the lake? The nutrient concentrations decreased from County Line downstream to Moravia. The downstream decrease may be caused by the assimilation and removal of phosphates by the aquatic life and other processes or by the dilution of phosphorus with tributary water with smaller phosphate concentrations downstream of County Line. The concentration trends, without supporting flux data, incorrectly suggest that phosphate added upstream of Locke is significantly removed before entering the lake. However, the total and dissolved phosphate fluxes increased downstream (Figs. 23 & 24). Thus, the Owasco Inlet gained more phosphate downstream of County Line than it lost, with most of this downstream gain originating from the major tributaries. These tributaries added dilute phosphate to the Inlet, which increased the flux, but diluted the concentration in the Inlet downstream of the confluence. This is a prime example where measuring concentrations and stream discharge to calculate fluxes is essential to establish the source, fate and environmental impact of a pollutant that enters the lake. The flux data correctly indicate that any phosphate discharged into the Inlet makes it past the Moravia site, and is not reduced to manageable and environmental friendly inputs.
The flux of total suspended solids from Hemlock Creek falls short of the measured increase in TSS flux between County Line and Locke in 2006. This suggested that the Inlet is actively gaining additional suspended sediments along this stretch of stream. Perhaps the Inlet gains suspended sediments by enhanced stream bank erosion, enhanced delivery of eroded sediments by roadside ditches, or erosion from construction activities and other non-vegetated areas of ground along this stretch of the Inlet. No difference was observed in 2007.
In summary, the watershed analyses indicate both point and nonpoint sources of nutrients exist in the watershed. Owasco Inlet and, to a lesser extent, Dutch Hollow Brook contributed the majority of the nutrients to the lake. In 2006, both point and nonpoint sources impact water quality in the lake, especially during major runoff events. In fact, the flux of materials on any given day over the two year study was largest during the 6/27/06 flood event. It suggests that a mechanism to alleviate nutrient and sediment loading to Owasco Lake is to mitigate the impact
Halfman et al., Owasco Lake Water Quality - 28 Finger Lakes Institute, Hobart & William Smith Colleges
of flood events in this watershed. However, mitigation of flood events does not remove the entire flux from this watershed because base flow contributed its share of nutrients and suspended sediments to Owasco Lake, and the sum of the daily fluxes from all the other sample dates exceeds the flux from the 6/27/06 event. In 2007, a drier year, less rainfall reduced the assimilation and delivery of nonpoint sources and by default highlighted the persistent point source contributions from Groton. The reduced nutrient load allowed water quality in the southern end of the lake to improve. Thus the 2007 fluxes provide a valuable benchmark to achieve to facilitate continued water quality improvements into the future.
Lake and watershed monitoring should continue into the future, and the sampling scheme should take advantage of the lessons learned by this survey. First, the biweekly/periodic nature of the 2006 and 2007 sampling scheme and lack of significant rainfall events in 2007 dictated that this study was biased to base flow rather than peak flow contributions to the lake. Thus, samples should be divided between base and peak flows to determine the relative contributions of both on the lake. Second, the seasonal restriction of this survey missed the contribution from the late fall through early spring contributions. It dictates that water quality monitoring of selected streams and lake sites should expand throughout the year. Third, the bulk of the point and nonpoint sources enter the lake from Owasco Inlet and Dutch Hollow Brook. It suggests that future monitoring in the watershed could be limited to a single site at the terminus of these two drainages. Fourth, the critical variables to monitor were total and dissolved phosphates, suspended sediments, and perhaps nitrates. This plan enables effective monitoring of the largest percentage of the Owasco Watershed at minimal cost and allows for future evaluation of any implemented pollutant reduction strategies. The Finger Lakes Institute at Hobart and William Smith Colleges will continue, as funding permits, its monitoring of Owasco Lake at Sites 1 and 2, as part of it’s long-term Finger Lakes Water Quality Survey in hopes of gathering enough data to determine an annual phosphate budget for Owasco Lake.
Phosphate Budget: Phosphate is critical in the health and well-being of Owasco Lake. It limits algal growth, and reductions in stream inputs from 2006 to 2007 improved water quality in the southern end of the lake. However, the stream inputs are only one part of the equation. The phosphorus budget must also include sinks like flow through the outlet and burial into the sediments. Once inputs and outputs are estimated, then a comparison of inputs to outputs predicts if phosphate will increase (Inputs > Outputs), decrease (Inputs < Outputs) or remaining the same (Inputs = Outputs) in the lake. To improve water quality, inputs must be smaller than outputs. The inputs and outputs are difficult to estimate from “seasonal” data and very limited sediment data, so take the following budget as only estimates.
The Inputs: The concentration and stream discharge data collected by this study suggests that Owasco Inlet adds on average 3 to 6 kg/day, and Dutch Hollow Brook adds 0.5 to 4 kg/day, based on the 2006 and 2007 average fluxes. This suggests that the entire watershed adds approximately 1.5 to 5 metric tons of phosphorus each year, assuming a linear extrapolation of the measured Dutch Hollow Brook and Owasco Inlet mean fluxes to the entire watershed by basin size and a constant flux through out the year. The high value was from 2006, and low value from 2007. Please note: These fluxes are minimum values as base flow conditions dominated the data, and peak flow/flood events typically dominate nutrient fluxed from watershed.

Halfman et al., Owasco Lake Water Quality - 29 Finger Lakes Institute, Hobart & William Smith Colleges
The Outputs: The Outlet removes algae and dissolved phosphates. Assuming a mean, open-lake, total phosphate concentration of 8.5 μg/L, P, and the daily discharge data from the USGS gauge station on the Outlet, the outlet removes approximately 2.5 to 3 metric tons of phosphorus each year.
Based on this input and output, it is interesting that the lake gained phosphate in 2006 and the southern end was impaired, but lost phosphate in 2007 and water quality improved at the southern end. The accuracy of these estimates would be greatly improved, if additional stream and lake samples were measured in the late fall through early spring months and during peak flow.
Burial in the sediments is a second output to remove phosphates from the lake. Unfortunately, limited sediment data are available to make an informed calculation. Extrapolating the two piston core organic matter and sedimentation rate data to the entire lake, and assuming unmeasured but probable sediment porosities, area of the lake floor accumulating sediments, the ratio of terrestrial to aquatic organic matter, and phosphorus remaining in the buried organic matter, the flux from the lake to the sediments is approximately 0.5 to 1 metric tons of phosphorus each year.
HISTORICAL TRENDS: Is water quality getting progressively better or worse in Owasco Lake? Have zebra and quagga mussels altered the ecology of the lake? Figure 27 reveals historical chlorophyll-a, total phosphate, nitrate and secchi disk depth data from various County and NYS publications that summarized data collected from the early 1970s by Cornell, 1980s by Upstate Freshwater Institute, and 1990s by NYS DEC. Most of the open-water data are consistent over time. A few exceptions are observed: (1) the southern end has significantly larger phosphate concentrations and shallower secchi disk depths than all of the other data but only in 2006; and, (2) chlorophyll-a concentrations decreased from approximately 5 μg/L in the 1970s down to 2 μg/L since the 1970s. Has water quality actually changed? The decrease in chlorophyll-a concentrations since the 1970s likely reflects the legislative ban on the use of phosphate in household soaps and increased emphasis on nutrient removal from wastewater effluent to combat the Great Lakes eutrophication of the 1960s. Have the nearshore macrophytes and/or zebra mussels sequestered enough nutrients over the past few years to mask the delivery of the excess nutrients from Owasco Inlet? Alternatively, is the quick water residence time significant in the nutrient budget? Additional information gathered from continued research and a complete assessment is required to make those determinations. Continued monitoring of aquatic systems is needed to scientifically assess changes in water quality over time.
Historical Limnological Data
02468
101214
Nitrate
(mg/L
)
TP (u
g/L, P
)
SRP (ug/L
, P)
Secchi
(m)
Chlorop
hyll (
ug/L)
Con
cent
ratio
n
1955
1968
19711972
1973
1985
19861997
2005
20062006 S End
2007
2007 S End
128 30
Fig. 27. Historical lake data.
Halfman et al., Owasco Lake Water Quality - 30 Finger Lakes Institute, Hobart & William Smith Colleges
CONCLUSIONS & RECOMMENDATIONS: Owasco Lake is a borderline oligotrophic – mesotrophic ecosystem. None of the water quality parameters are life threatening at the present time. Water quality is worse at the southern end of the lake, especially during wet years. The degraded water quality is interpreted to reflect, and consistent with, measured runoff events from the Owasco Inlet. The delivery of extra nutrients and suspended sediments will further degrade water quality in the lake into the future if not addressed in a meaningful and sustainable manner. However, the 2007 data indicate that if the nutrient sources are turned off, then water quality will improve in the southern end of the lake, and probably will improve throughout the open lake, a decade or so into the future while the nutrient-rich water is replaced with nutrient-poor water. The sources of nutrients and suspended sediments include point sources from a wastewater treatment facility, and nonpoint sources from onsite wastewater systems, agricultural activities, soil erosion, fertilized lawns, roadside ditches and construction activities. This report has documented that a number of these sources are impacting water quality in the Owasco watershed.
Due to the variety of the pollutant sources, remediation efforts should be multifaceted to improve water quality in Owasco Lake and its tributaries. A number of remediation efforts outlined below are already proposed or recently initiated in the watershed to help improve water quality in the lake. This is good!
Groton Wastewater Effluent: The Groton wastewater treatment plant has tested a number of methods to reduce nutrients in its effluent. Selection of the best method must balance the effectiveness of the removal process with its costs. Any additional treatment procedure adds to the capital and operating costs of running the facility, costs that will be passed on to the users of the Groton facility. The 2007 data clearly supports that reduced loading by the plant resulted in reduced phosphates flowing past Moravia. Groton should continue its efforts to economically reduce its nutrient loading to the Inlet. We recommend that the Groton Facility reduce its phosphorus loading to the standards observed at the Moravia Facility.
Owasco Inlet Floodplain: The floodplain/wetland geomorphology of the Inlet, from Moravia to the lake, has the potential to remediate the impact of future flood events, similar to the 6/27/06 event. Floodplains and wetlands, such as the Owasco Flats, have the potential to be excellent natural systems to maximize flood water storage, reduce the peak discharge of flood events, and reduce the associated nutrient and suspended sediment loads from the floodwaters, but only if floodwaters are permitted to utilize the natural floodplain by decreasing the volume of surface water and increasing the lag time to deliver this water to Owasco Lake, and removing nutrients and suspended sediments from the flood waters by allowing the assimilation of nutrients by plant life in the floodplain and sediments to settle on the floodplain. Currently, man-made levees along the Inlet prevent the natural flooding of the floodplain and enabled homeowners and farmers to utilize the fertile floodplains with a lower risk of loss. Remediation of the floodplain would be an ambitious effort with the purchase of the floodplain and removal of the artificial levees without undue hardships to the local residents. Both tasks are costly, and this plan only addresses the excess nutrients and suspended sediments provided by the flood events and not base flow. Before huge sums of money are spent on a wetland conversion project, a detailed analysis is required to asses the relative importance of flood vs. base flow fluxes and the cost of the remediation efforts. In addition, modeling could assess the effectiveness of the flood plain conversion on the reduction of phosphorus and sediments to the lake.
Halfman et al., Owasco Lake Water Quality - 31 Finger Lakes Institute, Hobart & William Smith Colleges
Watershed Inspector: A Watershed Inspector, along with the planned update of watershed rules and regulations for the Owasco Watershed, are excellent steps towards reducing nutrient loading and increasing water quality of the lake. These steps might, in fact, save the water users money by reducing the cost of filtering algae from the water before it is delivered to the consumer. The hire of additional inspectors and empowering inspectors with enforcement capabilities would increase these benefits at minimal cost to the public.
Agricultural BMPs: Various “best management practices” (BMPs) are available to reduce the nonpoint source contributions from the agricultural sector, both crop farming and animal husbandry. Implemented BMPs can include contour plowing, installation of settling ponds, buffer vegetation strips, minimal tillage farming, manure digesters, and others. Steps should be taken to investigate which are practices most effective for this watershed and which mechanisms must be in place so that the entire economic burden is not placed solely on the farmer. In some cases education is critical to gain acceptance and follow through with adaptation of these practices. Continued expansion of the Agricultural Environmental Management (AEM) program in the Owasco watershed by cost-sharing BMP implementation will contribute to this process. Perhaps the ongoing, USDA funded-research on various BMPs in the Conesus watershed by SUNY Brockport, County Soil and Water, and colleagues, will shed light on practical systems to use in the Owasco watershed.
Education: Education is also critical for local residents to understand the need for properly functioning onsite wastewater treatment systems and environmentally friendly (less fertilized) lawns to help reduce the seepage and runoff of nutrients to the lake. The education starts at primary and secondary levels but should also include the average homeowner, government officials, and environmental protection associations. The Finger Lakes Institute has an active K-12 outreach program that offers various exercises that teachers can bring into their classrooms and teacher development opportunities.
Stream and Lake Monitoring: Finally, water quality monitoring of selected streams and lake sites should continue into the future. At a minimum, both peak flow and base flow samples, measured for phosphates, total suspended solids and perhaps nitrates, should be taken from both Dutch Hollow Brook and Owasco Inlet. This minimal plan enables effective evaluation of the implemented pollutant reduction strategies in the two largest tributaries to the lake. Lake sites should also be monitored, and the Finger Lakes Institute plans to continue its monitoring of the lake at Sites 1 and 2 as part of the Finger Lakes survey in the years to come as long as funding permits. We hope to redo this detailed survey in 2009 or 2010.
ACKNOWLEDGEMENTS The research was supported by grants from the Fred L. Emerson Foundation, John Ben Snow Foundation, Hobart & William Smith Colleges, New York State, and the Andrew Mellon Foundation. We thank members of the Cayuga County Planning Department, Cayuga County Water Quality Management Agency, Cayuga County Health Department, the Owasco Watershed Lake Association, the Institute for the Application of Geospatial Data, and NYS Department of Environmental Conservation for their help and specifically, Senator Mike Nozzolio, Barbara Halfman, Sarah Meyer, Joe Wasileski, Jessica Miles, Marion Balyszak and numerous undergraduate students for their field support, data analysis, and encouragement throughout this study.
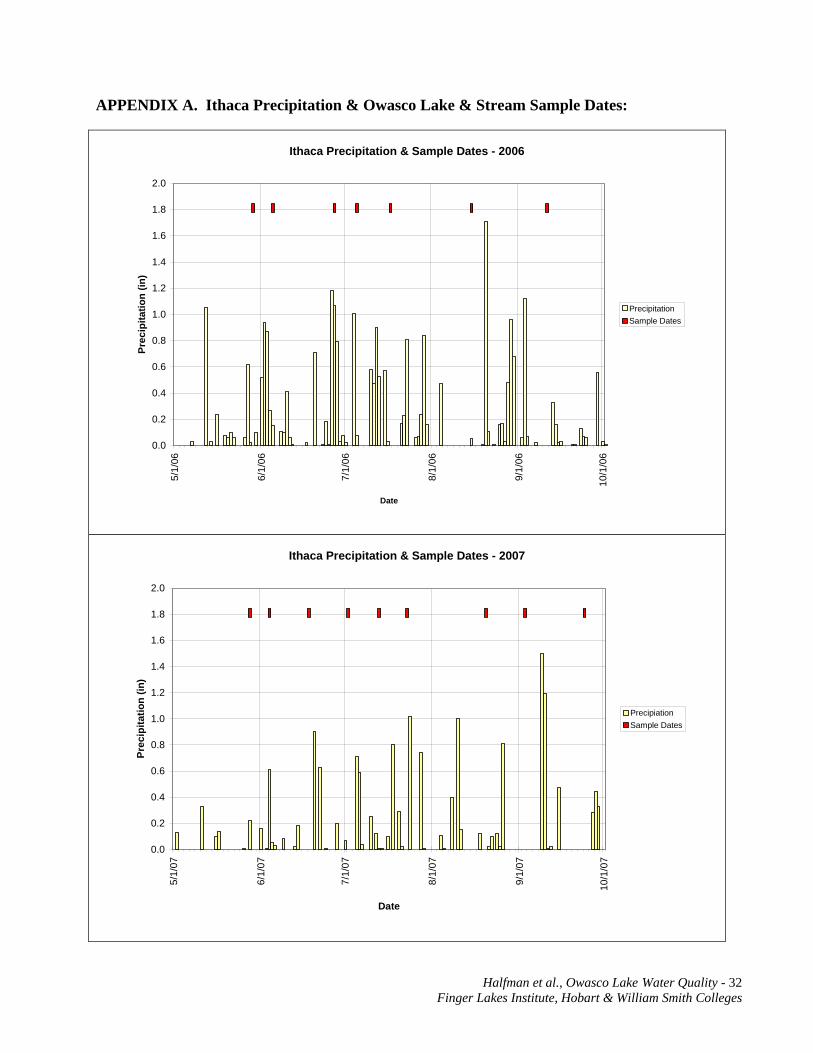
Halfman et al., Owasco Lake Water Quality - 32 Finger Lakes Institute, Hobart & William Smith Colleges
APPENDIX A. Ithaca Precipitation & Owasco Lake & Stream Sample Dates:
Ithaca Precipitation & Sample Dates - 2006
0.0
0.2
0.4
0.6
0.8
1.0
1.2
1.4
1.6
1.8
2.05/
1/06
6/1/
06
7/1/
06
8/1/
06
9/1/
06
10/1
/06
Date
Prec
ipita
tion
(in)
PrecipitationSample Dates
Ithaca Precipitation & Sample Dates - 2007
0.0
0.2
0.4
0.6
0.8
1.0
1.2
1.4
1.6
1.8
2.0
5/1/
07
6/1/
07
7/1/
07
8/1/
07
9/1/
07
10/1
/07
Date
Prec
ipita
tion
(in)
PrecipiationSample Dates

Halfman et al., Owasco Lake Water Quality - 33 Finger Lakes Institute, Hobart & William Smith Colleges
APPENDIX B: Owasco Lake, Site Averaged Concentration Data – 2005, 2006 & 2007:
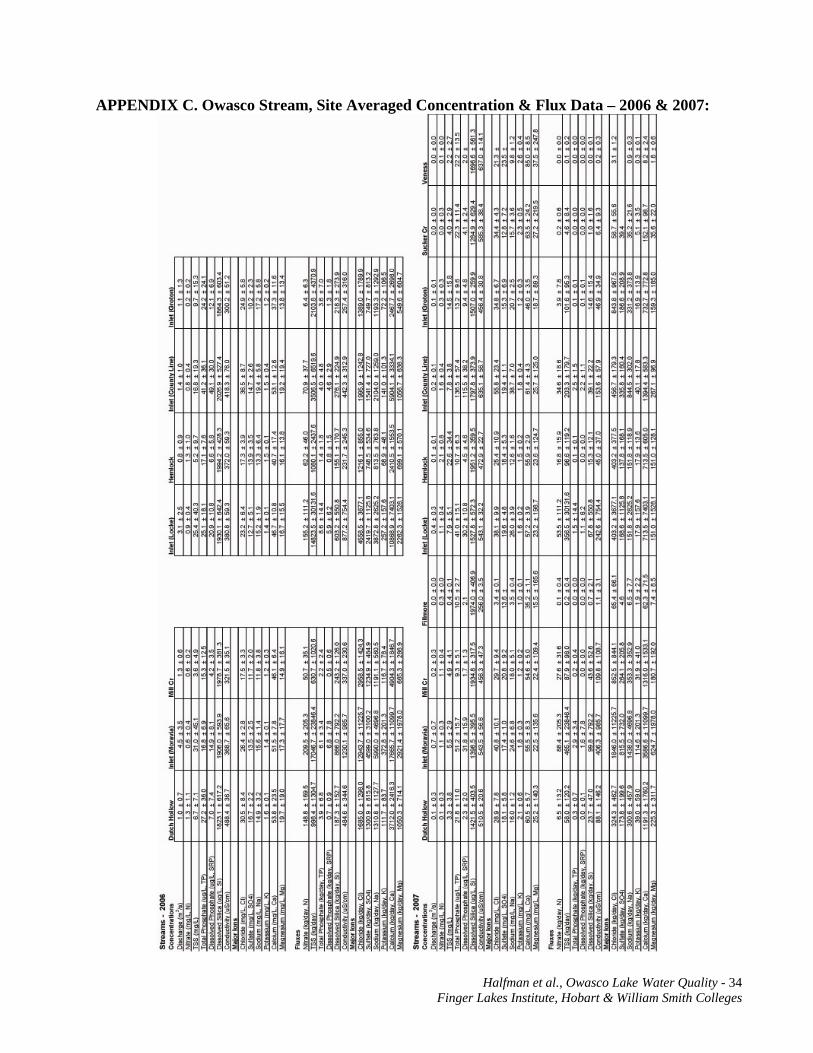
Halfman et al., Owasco Lake Water Quality - 34 Finger Lakes Institute, Hobart & William Smith Colleges
APPENDIX C. Owasco Stream, Site Averaged Concentration & Flux Data – 2006 & 2007:

Halfman et al., Owasco Lake Water Quality - 35 Finger Lakes Institute, Hobart & William Smith Colleges
APPENDIX D: Owasco Lake, Date & Site Averaged Plankton Data – 2005, 2006 & 2007.
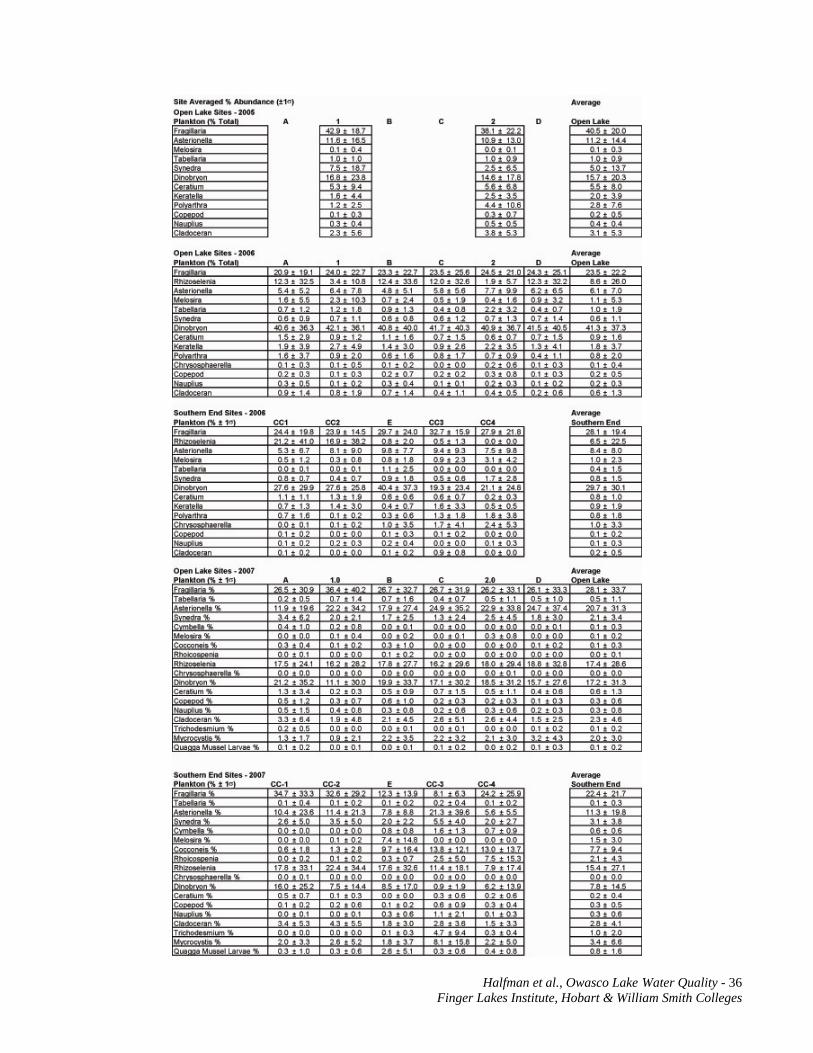
Halfman et al., Owasco Lake Water Quality - 36 Finger Lakes Institute, Hobart & William Smith Colleges
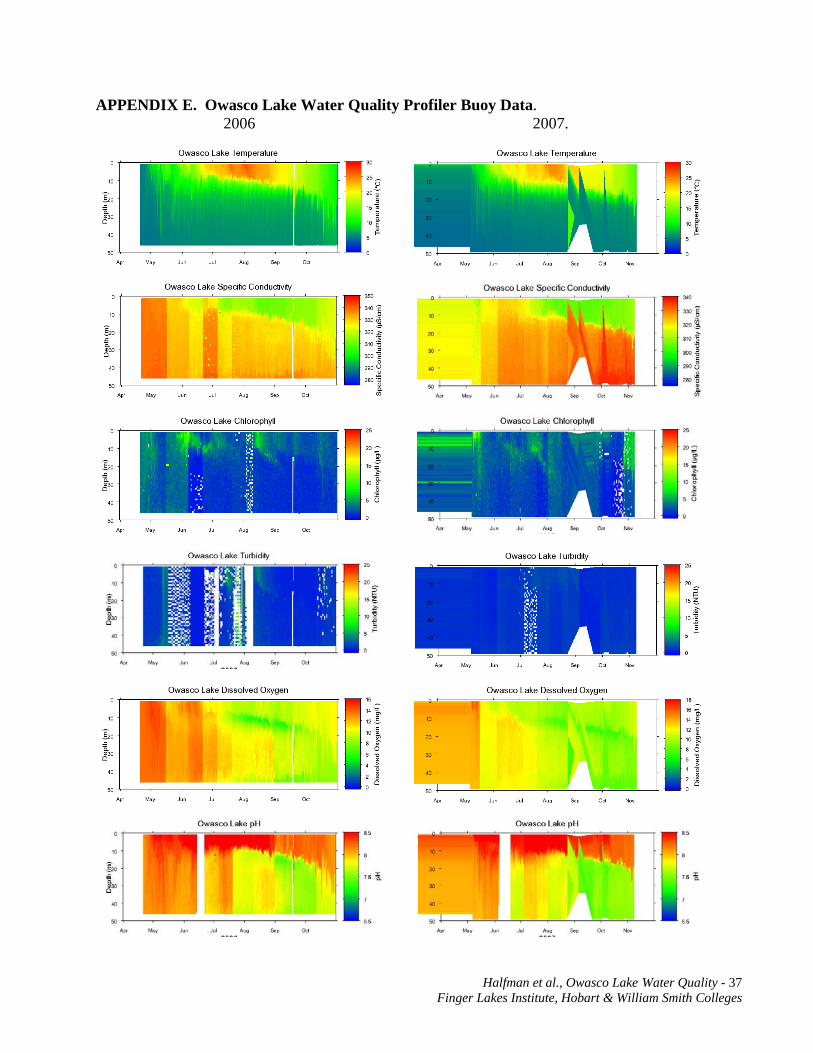
Halfman et al., Owasco Lake Water Quality - 37 Finger Lakes Institute, Hobart & William Smith Colleges
APPENDIX E. Owasco Lake Water Quality Profiler Buoy Data. 2006 2007.