Embed Size (px)
Citation preview

Halfman et al., 2016 Water Quality Report Owasco Lake - 1
Finger Lakes Institute, Hobart & William Smith Colleges
THE 2016 WATER QUALITY REPORT FOR OWASCO LAKE, NY.
John D. Halfman1,2,4, Harrison A. Simbliaris1, Briana (Breezy) N. Swete1,2, Serena Bradt1,
Mary Catherine Kowalsky3, Peter Spacher5& Ileana Dumitriu5
Department of Geoscience1, Environmental Studies Program2, Department of Economics3,
Finger Lakes Institute4 & Department of Physics5
Hobart and William Smith Colleges
Geneva, NY 14456
12/30/2016
INTRODUCTION
Since the initial Finger Lake Institute (FLI) water quality survey of the eastern Finger Lakes in
2005, Owasco Lake and its watershed has been the focus of additional research due to the lake’s
poor water quality in comparison to neighboring Finger Lakes. This focus established a
monitoring program of Owasco Lake and its watershed to: (1) document spatial and temporal
trends in pertinent water quality / water clarity / limnological parameters; (2) investigate the
source and magnitude of nutrients in the watershed, as their inputs to the lake promote algal
growth and thus degrade water quality; (3) investigate associations between the water quality
data and the recent rise in blue-green algae and their associated toxins; and, (4) promote the
development of comprehensive and effective watershed management policies to improve water
quality in Owasco Lake. This multi-year effort was supported, in part, by the Fred L. Emerson
Foundation, Auburn, NY, New York State funds secured by New York State Senator Michael
Nozzolio, the Owasco Lake Watershed Association (OWLA), the Town of Fleming, Cayuga
County Soil and Water Conservation District, Finger Lakes – Lake Ontario Watershed Protection
Alliance and the Cayuga County Legislature. Thank you all for your support.
The ongoing monitoring effort has highlighted the following results to date:
The trophic status (productivity level) of Owasco Lake fluctuates above and below the
oligotrophic (good water quality) – mesotrophic (intermediate water quality) boundary.
Phosphorus is the limiting nutrient in Owasco Lake. Additional inputs of phosphorus
would stimulate additional algal growth and degrade water quality.
The lake has experienced late-summer blooms of blue-green algae. Blue-green algae are
a concern due to their affiliation with impaired / eutrophic (poor water quality) water
bodies, their ability to form unsightly, surface water, algal scums, and some species of
blue-greens may produce toxins that have health implications for humans and other warm
blooded organisms.
Nutrient and sediment sources include point sources like wastewater treatment facilities
and onsite wastewater (septic) systems, and nonpoint sources like animal and crop farms,
lawn fertilizers, soil erosion, stream bank erosion, roadside ditches, and construction
activities.
A DEC mandated reduction of phosphorus by the Groton Wastewater Treatment Facility
effluent has reduced nutrient loading to the Owasco Inlet and thus to Owasco Lake. The
adoption of some agricultural best management practices in the watershed and
establishment and follow through on recommendations made by the Watershed

Halfman et al., 2016 Water Quality Report Owasco Lake - 2
Finger Lakes Institute, Hobart & William Smith Colleges
Inspector’s Office and the Owasco Lake Watershed Management Council should also
have reduced nutrient loads to the lake as well.
Streams and tributaries are the primary source of nutrients and sediments to the lake,
even during “dry” years.
Event vs. base flow analyses indicated that over 90% of the nutrient and sediment loads
are delivered during precipitation/runoff events, especially in the spring season.
Annual nutrient load estimates positively correlated to precipitation totals, especially
precipitation in the spring season.
Since 2011, annual phosphorus budgets for Owasco Lake estimated larger inputs than
outputs in all but 2012, a very dry year. The continued net addition of phosphorus to the
lake will degrade water clarity and water quality.
Phosphorus loading must be curtailed to move Owasco Lake into a recovery phase, and
better water quality. If the loads were curtailed today, it would take a minimum of five
water retention times, i.e., decades, before the lake would naturally cleanse itself of
phosphorus and display improvements in water quality.
The water quality research is also passing
into an exciting phase. NY State funds to
Cayuga County Soil and Water
Conservation District and Owasco Lake
Watershed Association should establish
preliminary BMPs in the Owasco Lake
watershed. Support has also been secured
by Cayuga County Planning to expand on
the recent Owasco Lake Watershed
Management & Waterfront Revitalization
Plan and develop an EPA Nine Key
Elements Plan. Let’s keep this momentum
going.
Numerous economic reasons mandate
remediation efforts in the watershed. First
and foremost, the lake supplies drinking
water to Auburn, Owasco and neighboring
communities, and numerous private
systems for lakeshore residents. Second,
the lake is the focus for recreational, sports
fisheries, and other tourism industries in
the region. In both cases, poor water
quality would yield economic challenges. Declining water quality will also negatively impact
local property values and tax revenues. Recent1 property assessments in the watershed, like
other Finger Lake watersheds, reveal significantly larger property assessments per acre for
parcels adjacent to the lakeshore than parcels away from the lake (Fig. 1). Municipal budgets are
therefore reliant on the revenue from the lakeshore acreage. This revenue should decline as
property values decline in the wake of deteriorating water quality. A survey of selected real
estate venues indicated that lakeshore properties have recently declined in value, and have taken
1 Assessment data and parcel’s map acquired from Cayuga County in the summer 2016.
Fig. 1. Owasco Lake property assessments per
acre of land. Lakeshore property assessments are
significantly larger than properties away from the
lake.

Halfman et al., 2016 Water Quality Report Owasco Lake - 3
Finger Lakes Institute, Hobart & William Smith Colleges
longer to sell once put on the market in the watershed. Therefore, municipal officials should do
everything in their power to maintain water quality in the lake. More importantly, we owe it to
future generations to leave this lake in better shape than when we got it.
METHODS
The sample sites and field/laboratory methods used in 2016 were similar to the 2005 – 2015
programs.
Owasco Lake: The 2016 lake survey sampled Sites 1 and 2 on a monthly basis from late May
through late September (Table 1, Fig. 2). These are the same sites utilized since the 2005 survey,
and are representative of the open water limnology in Owasco Lake. The specific 2016 survey
dates were: 5/24, 6/14, 7/19, 8/19 & 10/1.
The lake-monitoring field methods were identical to the earlier research. A CTD water quality
profile, Secchi disk depth, vertical plankton tow (80-m mesh), and surface and bottom water
samples were collected at each site. A fluoroprobe collected algal profiles on 8/19 and 20/1.
The CTD electronically gathers water column profiles of temperature (°C), conductivity
(reported as specific conductance, S/cm, a measurement proportional to salinity), dissolved
oxygen (mg/L), pH, turbidity (NTUs), photosynthetic active radiation intensities (PAR, E/cm2-
s), and fluorescence (a measure of chlorophyll-a, g/L) using a SeaBird SBE-25 CTD. The CTD
was lowered from the surface to ~1m above the lake floor, collecting data every 0.5 seconds
(~0.2 meters) along the downcast. The bbe fluoroprobe measures four different algal groups
based on their accessory pigments and distinguishes among: ‘green’ algae (Chlorophyta and
Euglenophyta), ‘brown’ algae (diatoms: Baccillariophyta, Chyrsophyta, and Dinophyta), ‘blue-
green’ algae (Cyanophyta), and ‘red’ algae (Cryptophyta). The plankton collected by each tow
were preserved in an alcohol-formalin solution and typically identified and enumerated to
species level back in the laboratory under a microscope. Water samples were analyzed onsite for
temperature (°C), conductivity (specific conductance, S/cm), pH, dissolved oxygen (mg/L), and
alkalinity (mg/L, CaCO3) using hand-held probes and field titration kits, and analyzed back in
the laboratory for total phosphate (g/L, P), dissolved phosphate (SRP, g/L, P), nitrate (mg/L,
N), chlorophyll-a, and total suspended solid (mg/L) concentrations. Lab samples were stored at
4°C until analysis.
Table 1. Owasco Lake monitoring site locations and water depths.
Site Name Latitude Longitude Water Depth
Site 1 42° 52.4’ N 76° 31.35’ W 34 m
Site 2 42° 49.15’ N 76° 30.45’ W 52 m
Buoy Site 42° 50.35’ N 76° 30.85’ W 49 m
Drone Flights: Drones were flown at 100 m above nearshore and open water locations to
investigate their suitability to measure various water quality parameters in 2016 (Fig. 3). Two
drones were used, DJI’s Matrice 100 with a gimbaled Zenmuse Z3 camera and DJI’s Phantom 3
Advanced with a Sony EXMOR gimbaled camera. Both drones captured 12 megapixel digital
photographs. Each image spanned an area of ~200 by 300 meters at a flight altitude of 100 m.
Photographs were collected along the lakeshore at and just offshore of Emerson Park (east side)
and Martin Point (south side) to investigate nearshore attached algae and macrophyte
distributions, and open water algal concentrations. The nearshore photographs were spatially
georeferenced in ArcGIS to 2015 satellite digital orthoimagery (NYS Clearinghouse data).
Flights dates were: 8/7, 8/9, 8/10, 8/11, 8/19, 8/22, & 10/1.

Halfman et al., 2016 Water Quality Report Owasco Lake - 4
Finger Lakes Institute, Hobart & William Smith Colleges
Fig. 2. The 2016 lake and stream sites. The 2016 stream sites focused on previously sampled sites within Dutch
Hollow Brook and the Owasco Inlet. The small tributary near the terminus of Fire Lane 20 was also sampled.

Halfman et al., 2016 Water Quality Report Owasco Lake - 5
Finger Lakes Institute, Hobart & William Smith Colleges
Fig. 2 continued. 2016 site locations (yellow boxes) and land use within Dutch Hollow Brook and Owasco Inlet
watersheds. Subwatersheds are identified by green boxes.

Halfman et al., 2016 Water Quality Report Owasco Lake - 6
Finger Lakes Institute, Hobart & William Smith Colleges
Fig. 3. The two drones used in this study, Matrice 100 (left) and Phantom 3 Advanced (right).
Owasco Buoy: The FLI meteorological and water quality monitoring buoy manufactured by
YSI/Xylem was redeployed at its mid-lake site from 4/23 through 10/25 (Fig. 2, & Table 1). The
buoy was programmed to collect water column profiles every 12 hours (noon and midnight) of
temperature (°C), conductivity (S/cm, reported as specific conductance), dissolved oxygen
(mg/L & % saturation, by optical sensor), turbidity (NTUs by backscattering), and fluorescence
measuring both total chlorophyll and blue-green algae phycocyanin (g/L, after specific pigment
excitation by different wavelengths of light). Data was collected every 1.5 meters down the
water column starting at 1 m using a YSI/Xylem EXO2 water quality sonde. The buoy also
contained a standard suite of meteorological sensors that recorded five-minute mean air
temperature, barometric pressure, relative humidity, light intensity and wind speed and direction
data every 30 minutes. All of the data were periodically transferred to HWS by cellular phone
~1 hour after collection. Buoy hardware and software issues prevented collection of water
quality data from 4/28 to 5/11, 5/13 to 5/16, 5/18, and 9/29 to 10/5, and meteorological data from
4/23 to 4/25 in 2016.
Owasco Streams: The 2016 stream monitoring focused on Dutch Hollow Brook, Owasco Inlet,
and a small tributary at the end of Fire Lane 20 West. The stream sites were visited six times,
specifically 4/13, 6/1, 6/6, 6/28, 7/11 and 10/24, for onsite analyses and collection of water
samples for nutrient and sediment analyses back in the laboratory. The 4/13 and 10/24 dates
were sampled by the Owasco Watershed Inspection Office team (thanks guys). Halfman’s
Environmental Hydrology class also sampled three sites along Dutch Hollow Brook, 38A, North
Rd and Old State Rd sites, on 3/31 at no cost to this project.
Dutch Hollow Brook was sampled at six sites in 2016 (Fig. 2). Progressing upstream, four sites
were sequentially located along 38A, including the terminus at Rt 38A, and sequentially
upstream at North Rd, Benson Rd, and near Old State Rd. Two unnamed tributaries in the
watershed were also sampled. The South tributary was sampled along Rt 38A just east of the
Owasco town center. The Benson tributary was sampled along Benson Rd just north of the
Benson Rd site. These sites were also used in the past.
Owasco Inlet was sampled at nine sites in 2016 (Fig. 2). Proceeding upstream, five sites were
sequentially located along the main stream starting at Moravia on Rt 38, Aurora St in Moravia,
VFW just upstream of Fillmore Cr, north of Locke, the County Line, and just upstream of
Groton (near Spring St). Three tributaries, Mill, Fillmore, and Hemlock Creeks, were also
sampled just upstream from where they join the Inlet. These sites were also used in the past.

Halfman et al., 2016 Water Quality Report Owasco Lake - 7
Finger Lakes Institute, Hobart & William Smith Colleges
Samples were not collected at VFW on 4/13 and 10/24, the high flow dates, due to a
communication error.
The small tributary at the end of Fire Lane 20 was also sampled.
Stream discharge, water temperature, conductivity, dissolved oxygen, pH and alkalinity were
measured onsite using hand-held probes or field titration kits. Only discharge was measured
onsite during the 10/24 survey. Water samples were also collected and analyzed in the
laboratory for total phosphate (TP), dissolved phosphate (SRP), nitrate and total suspended
sediment (TSS) concentrations. Laboratory samples were stored at 4°C until analysis. Stream
discharge (the volume of water per unit time flowing past a site) was calculated from measured
stream width, depth and velocity data (using a 30 m tape, wading rod and HACH FH950 portable
velocity flow meter with electromagnetic sensor). Both velocity and stream depth were
measured at ten (or five) equally distributed segments aligned perpendicular to stream flow. The
velocity was measured at ~60% of the stream depth to acquire an average velocity for each
segment. Ten segments were utilized when the stream was wide or more accuracy was
necessary, e.g., some of the Inlet sites and the Dutch Hollow Brook at 38A and North Rd.
Stream discharge (water volume per unit time, e.g., m3/s) is required for the flux (loading)
calculations of nutrients and suspended sediments, because flux of a substance (its mass/time,
e.g., kg/day) is stream discharge (volume water/time, e.g., m3/s) times its concentration
(mass/volume water, e.g., mg/L).
Runoff/Event Flow versus Base Flow Variability: A Teledyne ISCO automated water sampler,
one In Situ Aqua Troll 200 data logger and a pair of ONSET HOBO U290L-04 loggers were
deployed at the Rt 38A site in Dutch Hollow Brook from 4/13 to 10/25 to investigate the impact
of event versus base flow variability on the delivery of nutrients and sediments to the lake (Figs.
4a & 4b). Another automated sampler and two pairs of HOBO data loggers were deployed
upstream from Rt 38A at North Rd to investigate event versus base flow variability along Dutch
Hollow Brook. A pair of Hobo loggers were required at each deployment, one deployed in air
and the other underwater to subtract changes in atmospheric pressure from changes in water level
detected by HOBO’s unvented pressure transducers. The In Situ pressure transducer is vented,
thus automatically compensates for changes in atmospheric pressure, and does not require paired
deployment. Deploying multiple loggers at each site hedged against logger malfunctions.
At both sites, the autosamplers were programmed to collect 1-L of water every day (4 am). This
frequency collected both event and base flow samples in previous years. At each site, stream
discharge was measured and autosamplers were serviced bi-monthly. Each sample was analyzed
for suspended sediment and nutrients. The daily sample frequency in 2016 was reduced from 8-
hours to daily samples in response to funding issues. Over the 182 day deployment at 38A and
North Rd, a few water samples (9/7 to 9/20) were lost at 38A due to a pinched water hose.
The data loggers were programmed to record hourly stream stage (height), temperature and
specific conductance (only by the In Situ logger). The stage data and bi-monthly stream
discharge measurements established a rating curve, a relationship between stream height and
stream discharge to estimate a stream discharge for every ISCO water sample at each site. Data
logger data were missing from the end of the survey at 38A because the large precipitation event
and resulting flood on 10/21 uprooted the data loggers from their poles.

Halfman et al., 2016 Water Quality Report Owasco Lake - 8
Finger Lakes Institute, Hobart & William Smith Colleges
Laboratory Analyses: Laboratory analyses for nutrient, chlorophyll-a (only lake samples), and
total suspended sediment concentrations followed standard limnological techniques. An aliquot
of each sample was processed for total phosphate colorimetric analysis by spectrophotometer
after digestion of any organic-rich particles in hot (100ºC) persulfate for 1 hour. Additional
sample water was filtered through pre-weighed, 0.45 m glass-fiber filters. The filter and residue
were dried at 80°C for at least 24 hours. The weight gain and filtered volume determined the
total suspended sediment concentration. Lake water was also filtered through a Gelman HA 0.45
m membrane filter, and the filtered residue was kept frozen until chlorophyll-a analysis by
spectrophotometer after acetone extraction. The filtrate was saved and stored at 4°C until
dissolved phosphate (SRP), nitrate and dissolved silica colorimetric analyses by
spectrophotometer. Laboratory precision was determined by periodic replicate analyses resulting
in the following mean standard deviations: total suspended sediments ±0.2 mg/L, phosphate
±0.1 g/L (both TP and SRP), silica ±5 g/L, and nitrate ±0.1 mg/L. For the plankton
enumerations, over 100 individuals were identified to genus (and typically species) level and
reported as date averaged relative percentages.
LAKE MONITORING RESULTS & DISCUSSION
Lake CTD & Fluoroprobe Profiles: The 2016 water temperature profiles were typical for any
late spring through early fall transition (Fig. 5). The 5/24 cast revealed the initial establishment
of seasonal stratification, the initiation of less dense and warmer epilimnion (surface water)
overlying the denser and uniformly cold hypolimnion (bottom water). Epilimnetic temperatures
ranged from 11ºC (~50ºF) in late-May to 24ºC (~75ºF) in June, and cooled to 18ºC (~65ºF) by
the last cruise of the survey (10/1). Hypolimnetic temperatures remained a uniform 5ºC (~39ºF)
through the survey.
Epilimnetic salinity (specific conductance) ranged from ~295 to 335 S/cm in 2016 (~150 ppm
TDS). Like previous years, epilimnetic salinity in 2016 decreased by ~25 S/cm (~10 ppm TDS,
a small amount) from the largest values detected in the late spring into the early fall as the
epilimnion was progressively diluted by less saline precipitation and stream runoff. The 2016
early spring specific conductance was similar to those detected in 2015, and both years were
slightly larger previous years. The annual change in salinity is interpreted to reflect the extent of
road salt application during the preceding winter, e.g., the larger salinity in 2015 was due to more
snowfall and road salt the previous winter, concentrations which carried over into the spring of
2016.
Fig. 4a. Servicing “R2D2” the Teledyne ISCO automated
water sampler located at the Rt 38A site. It collected 1-
liter of water daily (4 am) and was serviced bi-monthly.
Fig. 4b. In Situ Aqua Troll 200 and ONSET HOBO
U20L-04 data loggers. Both logged hourly stream
height (to estimate hourly stream discharge) and
temperature. The Aqua Troll also measured hourly
specific conductance of the stream.

Halfman et al., 2016 Water Quality Report Owasco Lake - 9
Finger Lakes Institute, Hobart & William Smith Colleges
Fig. 5. 2016 CTD profiles from Sites 1 & 2. The PAR (light) data are plotted on an exponential scale, so that
exponential changes with water depth appear as straight lines. The dissolved oxygen sensor malfunctioned this year.

Halfman et al., 2016 Water Quality Report Owasco Lake - 10
Finger Lakes Institute, Hobart & William Smith Colleges
The 2015 hypolimnetic specific conductance data were just above 340 S/cm and remained
relatively uniform over time and depth (Fig. 5). These values were similar to those in 2015 and
both years were 10 to 20 S/cm larger than previous years. Again, the use of an estimated
10,000 tons of additional road de-icing salt from the larger and more frequent snowfall in 2014
& 2015 probably maintained the slightly larger hypolimnetic salinity in 2014 &5 than earlier
years, and the concentrations carried over into 2016.
The dissolved oxygen sensor malfunctioned in 2016, and resources were not available to fix it.
Profiles of photosynthetic available radiation (PAR), i.e., light intensity, in 2016 were similar to
earlier results (Fig. 5). Available light decreased exponentially with water depth from a
maximum intensity of a few 100 to a few 1,000 E/cm2-s at the surface to 1% of surface light
intensities within the epilimnion at water depths of 10 to 15 m. The observed decrease in light
reflects the normal exponential absorption and conversion of longer wavelengths of light
(infrared, red, orange, yellow) to heat, and scattering of shorter wavelengths of light (ultraviolet,
violet, blue) back to the atmosphere. The range in surface intensities reflected the season, the
extent of cloud cover, and the turbidity of the water (suspended sediment and/or algal density) on
the survey date. The 1% of surface light threshold represents the minimum amount of light
required for algae to photosynthesize enough biomass to survive. Thus, algal photosynthesis and
growth was restricted by light to the epilimnion in Owasco Lake. Many of the profiles revealed
a marked decrease in light at 2 or 3 meters. It corresponded to the sensor passing through the
shadow of the boat.
Fluorescence, a measure of algal concentrations, revealed peaks in chlorophyll abundance within
the epilimnion at approximately 5 to 15 m below the lake’s surface (Fig. 5). Peak concentrations
exceeded 4 g/L (mg/m3) on 7/19, above 3 g/L (mg/m3) on 6/14 but were lower, between 1 and
2 g/L on the other survey dates. The 2016 epilimnetic data were similar to previous years.
Hypolimnetic concentrations were consistently below 1 g/L, i.e., algae are typically absent in
the dark bottom waters.
The turbidity profiles revealed uniform or nearly uniform turbidities from 1 to just above 2
NTUs down to the lake floor at Site 1 and down to just above (5 to 10 m) the lake floor at Site 2
(Fig. 5). At Site 2, turbidity then increased by ~one NTU by the lake floor. The exception to
these generalizations was on 7/19 when epilimnetic turbidities rose above 3 NTUs due to an
intense but brief algal bloom. The lake floor increase in turbidity at Site 2 was much less
pronounced in 2016 than those observed in 2014 and especially 2015. The change from year to
year parallels the change in rainfall and wind velocities as the primary source of suspended
sediments (turbidity) is runoff events from precipitation and snowmelt and resuspension events
by waves. Algae and algal blooms provide another source of turbidity.
The fluoroprobe data revealed the dominance of diatoms/dinoflagellates (up to 2 g/L),
cryptophytes (up to 3.2 g/L) and green algae (up to 1 g/L) in the epilimnion (Fig. 6). Site 1
also revealed small concentrations of blue-green algae (below 0.5 g/L) in the epilimnion. More
persistent concentrations of BGA (up to 0.4 g/L) were detected in the hypolimnion but these
results were an artifact of the colder water temperature, as the BGA sensor is temperature
sensitive. Algae should not be alive in the dark hypolimnion.

Halfman et al., 2016 Water Quality Report Owasco Lake - 11
Finger Lakes Institute, Hobart & William Smith Colleges
Limnology & Trophic Status: The 2016 chlorophyll and nutrient data indicated that the lake was
not a health threat or significantly impaired (Table 2 in appendix, Fig. 7). Annual mean
chlorophyll concentrations in the epilimnion ranged from 0.9 to 3 g/L on all survey dates except
for 7/19 where concentrations spiked to 9 g/L. The annual mean of 3.5 remained below the 4 to
6 g/L not to exceed DEC threshold for potable water bodies2, except for the 7/19 date-averaged
concentration. Nitrate concentrations ranged from 0.5 to 0.8 mg/L and an order of magnitude
(10 times) below the 10 mg/L maximum contaminant level (MCL) established by the EPA. The
lake was not impaired due to phosphorus, as the annual mean total phosphate concentration was
14.9 g/L, below the 20 g/L total phosphate (TP) threshold established for impaired water
bodies by the DEC. The 10/1 date was an exception, with a date-averaged TP concentration of
21 g/L. This date was just after a recent rainfall and the last of the detected blue-green algae
blooms. Secchi disk depths ranged from 1.8 to 8.1 meters, and averaged 5.6 meters (Fig. 7).
This was the deepest annual average measured by the FLI monitoring effort. Total suspended
sediments date averaged concentrations ranged from 0.6 to 4.9 mg/L and averaged 1.8 mg/L.
The large value resulted from the large bloom on 7/19.
From one year to the next, annual average Secchi disk data suggest improving water clarity from
2009 through 2013 but declining water clarity in 2014 and 2015. The 2016 data revealed a
return to improving conditions. It suggests that the major trigger for the decline in water quality
during 2014 and 2015 was the larger rains in those years, and associated nutrient loads. It was
very dry in 2016, allowing the lake to recover. The influence of precipitation, stream runoff and
water quality in the lake will be discussed future in a later section of this report.
Since 2005, annual mean total phosphate concentrations have increased from ~8 to over 17 g/L
in 2015 with a slight dip in 2013, and another dip in 2016 (Fig. 7). Dissolved phosphate
concentrations were larger in 2006, 2011, 2013 and 2015 than other years, but never as large as
those in 2014 (Fig. 7). The large 2014 mean value was biased by a sample collected
immediately after the intense May rains. The 2015 and 2016 mean SRP concentrations returned
to the pre-2014 concentrations. Chlorophyll-a concentrations were larger in 2009, 2010, and
again in 2014 and 2015 (3.9, 3.7, 3.2 & 3.8 g/L, respectively) than other years (1.9 to 2.3 g/L;
Fig. 7). The 2016 concentration decreased to 3.5 g/L. Total suspended sediment (TSS) annual
mean concentrations continued their decline since 2014 from a peak of 3.5 in 2014, down to 2.1
in 2015, and 1.8 mg/L in 2016 (Fig. 7). In summary, 2014 and 2015 revealed the worst water
quality for the lake. These two years also experienced the largest spring rainfall totals. It
indicates that the intense spring rain impact water quality. The following dry year, 2016 allowed
the lake return to pre-2014 conditions. The nutrient loading information presented below support
this conclusion.
The 2016 annual mean Secchi disk, nitrate and chlorophyll-a data place Owasco Lake below the
oligotrophic-mesotrophic trophic boundary (Table 3, Fig. 7). The 2016 annual mean TP
concentration and hypolimnetic dissolved oxygen concentration placed Owasco Lake in the
mesotrophic range. Thus, the trophic status of Owasco Lake remains borderline oligotrophic-
mesotrophic, and slightly improved since 2015. The fluctuations above and below the boundary
indicate that the lake is in a delicate balance. Any increase or decrease in nutrient loads from
one year to the next influence the lake’s water quality.
2Callinan, C.W., J.P Hassett, J.B. Hyde, R.A. Entringer & R.K. Klake. 2013. Proposed nutrient criteria for water
supply lakes and reservoirs. American Water Works Association Journal, E157-E172.

Halfman et al., 2016 Water Quality Report Owasco Lake - 12
Finger Lakes Institute, Hobart & William Smith Colleges
Fig. 6. Fluoroprobe data from Sites 1 & 2 that reveal concentration profiles of four major algal groups.
A few additional observations about the limnological data are noteworthy. First, the mean,
surface water, dissolved phosphate to nitrate ratio in the lake, the two nutrients that typically
limit algal growth, averaged 1:710 in 2016. The P:N ratio required by algae is 1:7 (Redfield
Ratio). The measured ratios indicate that phosphate was still, by far, the limiting nutrient in
Owasco Lake. The limiting nature of phosphorus is unlikely to change because fluvial sources
yield 30 times more nitrogen than phosphorus, and fluvial sources of nitrates are augmented by
additional sources of nitrogen to the lake (e.g., acid rain nitrates) not available to phosphorus.

Halfman et al., 2016 Water Quality Report Owasco Lake - 13
Finger Lakes Institute, Hobart & William Smith Colleges
Second, variability was observed in every parameter from one survey date to the next. The
variability is best observed in the box and whiskers plots (Fig. 8). It reflects, for example, algal
blooms that do not last the entire summer but are instead episodic and last for a week or two at a
time. Third, the dissolved nutrient concentrations revealed nearly uniform or slightly larger
concentrations between the epilimnion to the hypolimnion, rather than noticeably depleted
epilimnion and enriched hypolimnion concentrations detected in earlier years. The annual mean
surface and bottom water concentrations were 0.9 and 0.7 g/L for SRP, 0.7 to 0.9 mg/L for
nitrate, and 1,020 to 1,280 g/L for dissolved silica. The difference in SRP is unclear at this
time, but might be related to the dry year in 2016. Chlorophyll-a concentrations revealed a small
decrease from 3.5 and 1.0 g/L from the epilimnion to the hypolimnion, a similar trend as earlier
years.
Fig. 7. Annual average surface water concentrations since 2005 (blue), for 2016 (orange), and date averaged surface
water data from 2016 (yellow). When appropriate, boundaries for oligotrophic, mesotrophic and eutrophic
concentrations are marked.

Halfman et al., 2016 Water Quality Report Owasco Lake - 14
Finger Lakes Institute, Hobart & William Smith Colleges
Fig. 8. Box and whisker plots of the lake data.
Table 3. Concentration ranges for Oligotrophic (low productivity), Mesotrophic (mid-range productivity),
and Eutrophic (high productivity) lakes. The bold entries in the table reflect Owasco’s 2016 mean values.
Trophic Status Secchi Depth Total Nitrogen Total Phosphate Chlorophyll a Oxygen
(m) (N, mg/L, ppm) (P, g/L, ppb) (g/L, ppb) (% saturation)
Oligotrophic > 4 < 2 < 10 < 4 > 80
Mesotrophic 2 to 4 2 to 5 10 to 20 4 to 10 10 to 80 Eutrophic < 2 > 5 > 20 (> 30) > 10 < 10
Plankton Data: The phytoplankton (algal) species in Owasco Lake during 2016 were dominated
by diatoms, primarily Flagillaria and Asterionella, with smaller numbers of Diatoma, Melosira,
Tabellaria, Rhizoselenia, and Synedra (Table 4 in appendix, Fig. 9). Like previous years,
Asterionella and Fragillaria dominated in the spring and early summer, Tabellaria and Diatoma
replaced Asterionelia. Dinobryon (a dinoflagellate) dominated in the late summer. Two blue-
greens, Anabaena and Microcystis dominated in the fall. In the past, Tabellaria instead of
Asterionella occasionally dominated the algae population (e.g., 2011, 2012). Other

Halfman et al., 2016 Water Quality Report Owasco Lake - 15
Finger Lakes Institute, Hobart & William Smith Colleges
phytoplankton species included a few Ceratium and Coalcium. Zooplankton species were
dominated by rotifers, namely Polyarthra and Vorticella with some cladocerans, like Copepods,
Nauplius, and Cercopagis, the fishhook water flea. Zebra and quagga mussel larvae were also
detected in the plankton tows.
Fig. 9. Date averaged plankton data for 2016 (left) and the mean annual abundance of blue-green algae species
since 2005 (right).
Mycrocystis and Anabaena were detected in the late summer and early fall surveys in 2016 (Fig.
9). This is not new. Blue-green algae (BGA) were always detected in the open water of Owasco
Lake since the initial FLI surveys in 2005. However, the annual means never exceeded 10% for
any BGA species at these open water sites (Fig. 9). Typically the largest proportions were
restricted to the late summer and/or early fall, with Mycrocystis representing up to 40% of the
plankton counts during a survey in 2007, 2010, 2014 and 2015, and Anabaena making up 30% of
the late-summer counts in 2013. In fact, blue-green species were detected in a neighboring
Finger Lake as long ago as 19143. It is disturbing that very large BGA blooms were recently
detected in the oligotrophic and mesotrophic Finger Lakes, as BGA were thought to only impact
eutrophic systems. Owasco Lake is among the impacted systems, as major blooms of BGA have
been increasingly detected along the shoreline in Owasco Lake since 20124. The BGA section
below has more details.
Finger Lake Water Quality Ranks: The 2016 Finger Lakes water quality ranks still place
Owasco Lake as one of the worst lakes among the eight easternmost Finger Lakes (Table 5 in
appendix, Figs. 10 & 11). The ranks were based on annual average Secchi disk depths, and
surface water concentrations of chlorophyll-a, total and dissolved phosphate, nitrate and total
suspended sediments collected by the monthly, May through October, FLI survey. The in-house
ranks revealed similar trends as other comparative water quality / trophic state methods like the
oligotrophic-eutrophic trophic states, and Carlson’s Trophic Indices (combines chlorophyll-a,
total phosphorus and Secchi depth data). In 2016, water quality in Owasco ranked poorer than
Canandaigua, Keuka, and Skaneateles, similar or slightly better than Cayuga and Seneca Lakes
and better than Honeoye and Otisco Lakes. Interestingly, all of the lakes revealed better water
quality in 2016 than in 2014 and 2015, and 2016 rankings were more similar to the mean rank of
the earlier years. It indicates that the 2014 & 2015 rains and the associated nutrient and sediment
loading have degraded water quality in all the Finger Lakes, and 2016 was a year of recovery.
3 Bloomfield, J.A. (ed.), 1978. Lakes of New York State. Vol.1: The Ecology of the Finger Lakes. Academic Press. 4 http://www.dec.ny.gov/chemical/83332.html

Halfman et al., 2016 Water Quality Report Owasco Lake - 16
Finger Lakes Institute, Hobart & William Smith Colleges
The change in water quality
among lakes is influenced
by a number of competing
and intertwined factors.
First and foremost, the
degree of water quality
protection legislation and its
implementation. They are
important to protect the
lakes from nutrient and
sediment loading issues. So
does ecological, “top-down”
pressures by zebra and
quagga mussels, Asian
clams and Cercopagis, the
fishhook water flea.
Fig. 10. Annual Water Quality Ranks from 2005 – 2016 for the eight
easternmost Finger Lakes. The “mean” dark blue bar averaged the 2005 -
2013 ranks for each lake with a 1 standard deviation error bar.

Halfman et al., 2016 Water Quality Report Owasco Lake - 17
Finger Lakes Institute, Hobart & William Smith Colleges
DRONE FLIGHTS
Drone photographs appeared to map the distribution and aerial extent of encrusting algae and
other macrophytes along the shoreline (Fig. 12)5. Mapping algal distributions and concentrations
in the open water was promising as well. The digital cameras recorded the red, green and blue
bands of the color spectrum that enabled further computer analysis back in the laboratory. The
results suggest that green (algae) to blue (clear water) intensity ratios were proportional to
chlorophyll-a abundance and inversely proportional to Secchi disk depths. The impact of
numerous variables, e.g., glare from the sun, camera tilt angle, cloudiness, and extent and size of
wind driven waves, however still needs further investigation. The promising results indicate that
drone photography can map aquatic organisms in the Finger Lakes. Future monitoring should
include drones flights to assess water quality in Owasco and neighboring lakes and, e.g., map the
distribution and concentration of nearshore blue-green algae blooms in the years ahead.
Fig. 12. Georeferenced drone photos from 8-19-16 superimposed on a 2015 satellite image of the eastern side of
Emerson Park (left) and southern side of Martin Pt (right). Each figure has five overlapping photographs
5 Swete, B., Bradt, S., Halfman, J.D., I. Dumitriu, 2016. Exploratory drone research on water quality of the Finger
Lakes. Rochester Academy of Science 43rd Annual Fall Conference.
Fig. 11. Annual mean limnological data from selected Finger Lakes. When appropriate, boundaries for oligotrophic,
mesotrophic and eutrophic conditions are shown.

Halfman et al., 2016 Water Quality Report Owasco Lake - 18
Finger Lakes Institute, Hobart & William Smith Colleges
THREE YEARS OF BUOY DATA
The FLI meteorological and water quality monitoring buoy was redeployed in Owasco Lake
during the 2016 field season. It revealed higher resolution but otherwise consistent changes in
the water column as described above (Fig. 13). Epilimnetic (surface water) temperatures
increased from mid-May through early August to 26⁰C (77⁰F), then fluctuated between 22.5 and
25⁰C to 9/21 until cooling down to 14⁰C (55⁰F) by the end of the deployment (Fig. 13). These
changes are expected and related to the daily, weekly and seasonal changes in climate.
Hypolimnetic temperatures slowly increased from 4 to 6.6⁰C (40⁰F) during the deployment. In
comparison to 2014 & 2015, both the epilimnion and hypolimnion were slightly warmer in 2016.
The timing of the epilimnetic peak temperatures were similar to 2015, warming to 25⁰C by Late
July whereas it warmed to 25⁰C by early July in 2014. The seasonal cooling in the fall started
earlier in 2014 as well, i.e., the surface waters cooled below 20⁰C by mid-September in 2014 but
was two weeks later in 2015 & 2016. The change probably reflected the earlier onset and longer
duration of the very cold 2014/2015 winter season.
The depth of the thermocline, the boundary between the epilimnion and hypolimnion, gradually
increased through the field season from < 10 m to > 20 m. The thermocline depth deepened
faster during September and October reflecting the vertical mixing of surface water to deeper
depths as the epilimnion cooled into the fall, i.e., the gradual decay of summer stratification. It
also revealed daily oscillations of 1 to 2 meters in response to internal seiche and/or wave
activity. Similar oscillations were detected in 2014 and 2015.
The epilimnetic specific conductance decreased from just over 330 S/cm in early June to 300
S/cm by early October, and then increased by ~15 S/cm by the end of October (Fig. 13).
These changes are small and the decrease reflects the dilution of the epilimnion by stream inputs
and rainfall. The subsequent increase reflects the mixing of slightly more saline hypolimnetic
water into the epilimnion as the surface waters cool and vertically mixed with deeper water in the
fall. The hypolimnetic salinity increased from ~340 S/cm by just over 10 S/cm from late
April to early October, then decreased by a few S/cm until recovery in late October. Similar
hypolimnetic trends were observed in 2014 and 2015, although salinities were slightly larger in
2015 than both 2014 and 2016.
The turbidity in the epilimnion remained relatively constant in 2016 until late September when it
increased by ~1 NTU perhaps reflecting the rainfall in the fall season (Fig. 13). A turbidity spike
was observed in mid-July, and corresponded to an intense algal bloom. The values were similar
in 2014 and significantly less than 2015. The larger 2015 turbidities most likely reflect the
runoff from spring rains and subsequent resuspension events, and the late summer algal
populations. Lake-floor turbidities were much larger in 2015 than 2014 and 2016. The change is
interpreted to reflect the early spring rains and wind/wave resuspension events in 2015 supplying
suspended sediment to the nepheloid layer.

Halfman et al., 2016 Water Quality Report Owasco Lake - 19
Finger Lakes Institute, Hobart & William Smith Colleges
Fig. 13. Buoy water quality data for 2016. Note, algal concentrations shown above are under-estimates. The buoy
website will have corrected values shortly but the correction did not influence the relative changes. The red lines
depict the monthly monitoring cruise dates.

Halfman et al., 2016 Water Quality Report Owasco Lake - 20
Finger Lakes Institute, Hobart & William Smith Colleges
The chlorophyll-a concentrations changed significantly from ~2 to over 18 g/L on different
temporal scales (Fig. 13). One to two week long blooms with concentrations exceeding 10 g/L
were detected in May, early to mid-June, late July/early August and early September. The algae
were typically concentrated within the upper epilimnion (10 m), however the late July bloom
extended down to 15 meters. The September and October algal bloom probably responded to
nutrients from rain events and the thermal decay of the season stratification, and mixing of
nutrient-rich hypolimnetic waters into the epilimnion.
The blue-green algae sensor detected an increase in epilimnetic BGA concentrations in
September (Fig. 13). However, BGA concentrations at the buoy never exceeded 1.5 g/L,
compared to the nearshore concentrations up to 16,700 g/L in 2016 (DEC and Watershed
Inspector data, by permission). The low open-water BGA concentrations were confirmed by
fluoroprobe water column profiles collected during 8/16 and 10/1 surveys (Fig. 6). The
discrepancy therefore reflects the surface and nearshore hugging distribution of BGA blooms, as
the buoy BGA sensor and fluoroprobe started measuring concentrations at a water depth of 1
meter and both were deployed at a central, open-lake location. It confirms that the minimal
response of the BGA sensor on the buoy in 2014 and 2015 was also due to the mid-lake
deployment of the buoy. The increase in BGA concentrations below the thermocline by the buoy
and fluoroprobe is an artifact of the instrumentation, i.e., a sensor response to a change in
temperature and not an actual change in the BGA concentrations. BGA are also unlikely to
survive in the dark hypolimnion. The nearshore/offshore separation should be investigated in the
years ahead by deploying of a number of BGA sensors along the shoreline.
Finally, epilimnetic dissolved oxygen (DO) concentrations in 2016 were at or just above
saturation throughout the deployment (Fig. 13). Hypolimnetic DO concentrations decreased
from nearly saturated concentrations in early June to nearly 40% below saturation just below the
thermocline and down to 50% saturation along the lake floor by the end of September. The
depletion reflects the respiration of algae by bacteria, zooplankton and other animals at these
oxygen depleted depths. A similar pattern in DO was observed in 2014 and 2015 but the
depletion was more severe, i.e., to 30% in 2015, and extended later into the fall, i.e., into
September in 2015 than 2014 and 2016.

Halfman et al., 2016 Water Quality Report Owasco Lake - 21
Finger Lakes Institute, Hobart & William Smith Colleges
BLUE-GREEN ALGAE AND HARMFUL ALGAL BLOOMS
Owasco Lake experienced significant surface-water, blue-green algal blooms in 2016 (Fig. 14).
Blue-green algae (BGA) contain gas vacuoles that enable them to float at or near the surface of a
lake as surface water, smelly scums, whereas, other algae live at deeper depths within the
epilimnion, and typically out of sight of humans in boats or onshore. BGA do this to outcompete
other algal species for light. Unlike other algae, BGA can vertically migrate during a 24-hour
day. During the daytime, their photosynthesis of dense carbohydrates forces BGA to sink by
mid-day or late afternoon. After sinking to low light levels, BGA respire and consume their
carbohydrates, create carbon dioxide gas, which accumulates in their tissues, and thus enables
them to buoyantly rise to the surface by early to late morning during calm days. Mixing by
wind-driven waves can retard the upward migration.
Fig. 14. Maps of the 2016, 2015 & 2014 BGA bloom dates, BGA concentrations and BGA toxin concentrations (data from
the Owasco Lake Watershed Inspector & DEC). Total phosphate data for these samples were only available in 2015.

Halfman et al., 2016 Water Quality Report Owasco Lake - 22
Finger Lakes Institute, Hobart & William Smith Colleges
Some BGA species like those in the Anabaena genus can “fix” atmosphere nitrogen (N2) for
their source of nitrogen, whereas most other forms of algae including some forms of BGA like
Mycrocystis cannot “fix” N2 and are instead dependent on the dissolved forms of nitrogen like
nitrate (NO3-) or ammonium (NH4
+) to photosynthesize organic matter. Nitrogen fixing BGA
have an ecological edge in nitrogen-starved lakes like Honeoye. Nitrogen starvation is not a
concern in Owasco and the other phosphorus-limited Finger Lakes. BGA may also disrupt food
chain dynamics, because they are avoided, i.e., preferentially not eaten, by zooplankton and fish.
More importantly, some species of BGA produce a variety of toxins that in turn generate various
health threats to humans and other warm blooded animals (e.g., dogs). BGA taxa that can
produce toxins do not synthesize toxins all the time. When toxins are produced the blooms are
called harmful algal blooms (HABs). Different toxins are synthesized by different BGA taxa
that impact different parts of the body, most notably, the liver, the nervous system, and/or
gastrointestinal system. Liver cyanotoxins like mycrocystins are most commonly found in HAB
blooms, and at high doses can cause organ damage, heart failure and death in lab animals.
Mycrocystins can be synthesized by various species of Mycrocystis and Anabaena genera. Both
genera of BGA have been detected in all the Finger Lakes including Owasco Lake. Anatoxins
impact the nervous system and can be synthesized by Anabaena and other BGA genera. Their
impact on humans at low concentrations still remains elusive. The World Health Organization
(WHO) has issued a provisional finished drinking water guideline of 1 g/L for chronic exposure
to mycrocystin, and recreational exposure limit of 20 g/L6. The EPA’s drinking water limit for
mycrocystin is 0.3 g/L for infants and 1.6 g/L for school-age children and adults; their
recreational contact limit is 4 g/L. No thresholds are set for anatoxins yet, although 4 g/L may
be used. The half-life of anatoxins are very short, thus difficult to monitor.
The blooms are not unique to Owasco Lake. In 2016, major BGA blooms were also confirmed
in Conesus (4 weeks), Honeoye (9 weeks), Canandaigua (3 weeks), Seneca (2 weeks), Cayuga (7
weeks) and Owasco (9 weeks)7. Over 140 lakes in New York State had confirmed BGA blooms
in 2016 out of the tens of thousands of lakes in the state (Rebeca Gorney, DEC, person. comm.).
The DEC defines a BGA bloom when BGA chlorophyll-a concentrations exceed 25 g/L. Even
more disturbing is that that many blooms contained toxins above the World Health Organization
advisory threshold of 1 g/L and DEC’s MCL of 0.3 g/L for safe drinking water.
In Owasco Lake, BGA occurrences as conformed by the DEC has increased from one week in
2012 (9/6 – 9/27), to two weeks in 2013 (8/25 – 10/3), to six weeks in 2014 (8/22 – 10//12), and
to nine weeks in both 2015 (7/10 – 10/16) and 2016 (7/29 – 10/14). The length of time detected
in each lake might only reflect the intensity and number of people looking for blooms.
Notwithstanding, the past three years have detected the largest concentrations of BGAs and
HABs. Measured concentrations ranged from 0 to 1,100 g/L and averaged 165 g/L in 2014,
from 2 to 4,500 g/L and averaged 820 g/L in 2015, and, 60 to 16,800 g/L and averaged 3,150
g/L in 2016 (Fig. 14). The nearshore blooms were more common along the northern margins of
the lake although this may be an artifact of the detected occurrences. Toxin concentrations
ranged from 0 to 75 g/L in 2014, 0 to 860 g/L in 2015 and up to 1,800 g/L in 2016. The
DEC lists Owasco Lake as impaired by excessive BGA concentrations, using their BGA
chlorophyll-a concentration threshold of 25 g/L, and a mycrocystin recreational concentration
6 WHO, 2011. Guidelines for Drinking Water Quality. 4th Edition. World Health Organization. Switzerland. 7www.dec.ny.gov/docs/water_pdf/habsarchive2016.pdf

Halfman et al., 2016 Water Quality Report Owasco Lake - 23
Finger Lakes Institute, Hobart & William Smith Colleges
threshold of 20 g/L. Toxin concentrations up to 0.22 g/L were detected in the Auburn and/or
Town of Owasco municipal water supplies for ~45,000 residents and drawn from Owasco Lake
eleven (11) times between 9/22 through 10/10. All detections were just below the EPA’s
drinking water threshold of 0.30 g/L for the most vulnerable populations, the elderly and under
3-years of age. Strategies to eliminate BGA from the municipal drinking water supplies are
under development for the coming year. Lakeshore residents with private water systems should
make sure they can remove BGAs from the drinking water without busting the organism apart
and releasing toxins into their drinking water. It is not easy8.
The magnitude of the largest BGA and TP concentrations are, at first glance, staggering. In the
open water, algal and TP concentrations rarely exceed 10 to 20 g/L. However, some of the
measured BGA concentrations exceeded these “typical” concentrations by nearly 1,000 times. It
is a limnological challenge to increase a localized algal population with nutrients or other growth
stimulants by 1,000 times using normal ecological scenarios. Existing BGA can be concentrated
into smaller volumes of water, however.
Two mechanisms concentrate algae into a smaller volume of water. First, as they buoyantly rise
from deeper depths to the surface of the lake, they concentrate in smaller volumes of water.
Second, when light winds push and accumulate the algae against the shoreline, they again
concentrate in smaller volumes of water. Once against the shoreline, the lake floor would also
restrict the bloom’s depth and thus restrict/reduce the bloom’s water volume some more.
Accurate wind speed and direction data and depth profiles of BGA concentrations during the
formation of a bloom are required to confirm this hypothesis. The buoy collects hourly wind
information but the exact time of the bloom formation is lacking, and nearly calm winds are
rarely constant in speed or direction across the lake. Multiple BGA sensors along with
meteorological wind speed and direction sensors distributed around the shoreline should be
deployed to confirm this hypothesis.
Scientists have generalized that BGA blooms prefer the following conditions:
warm water, temperatures between 60 and 80⁰ F (15 to 30⁰C);
elevated (eutrophic) concentrations of nutrients, especially waters rich in phosphorus, the
limiting nutrient for many BGAs;
lake stratification, as BGA buoyancy regulation provides a competitive edge in a
stratified, warm, water column;
calm or near-calm conditions as turbulence disrupts buoyancy and light limits their
growth;
rainfall events, as events deliver nutrients to the lake; and,
other potential factors may include pH.
However, predicting their occurrence remains a challenge due to the large number of BGA
species and the diversity of their habitats. BGA blooms in the Finger Lakes are a larger
challenge because most of these lakes are oligotrophic or mesotrophic systems, and not the
eutrophic lakes that BGA blooms were commonly found in earlier.
8 A Water Utility Manger’s Guide to Cyanotoxins. 2015. Water Research Foundation, American Water Works
Association, 18 pgs. www.waterrf.org
Halfman et al., 2016 Water Quality Report Owasco Lake - 24
Finger Lakes Institute, Hobart & William Smith Colleges
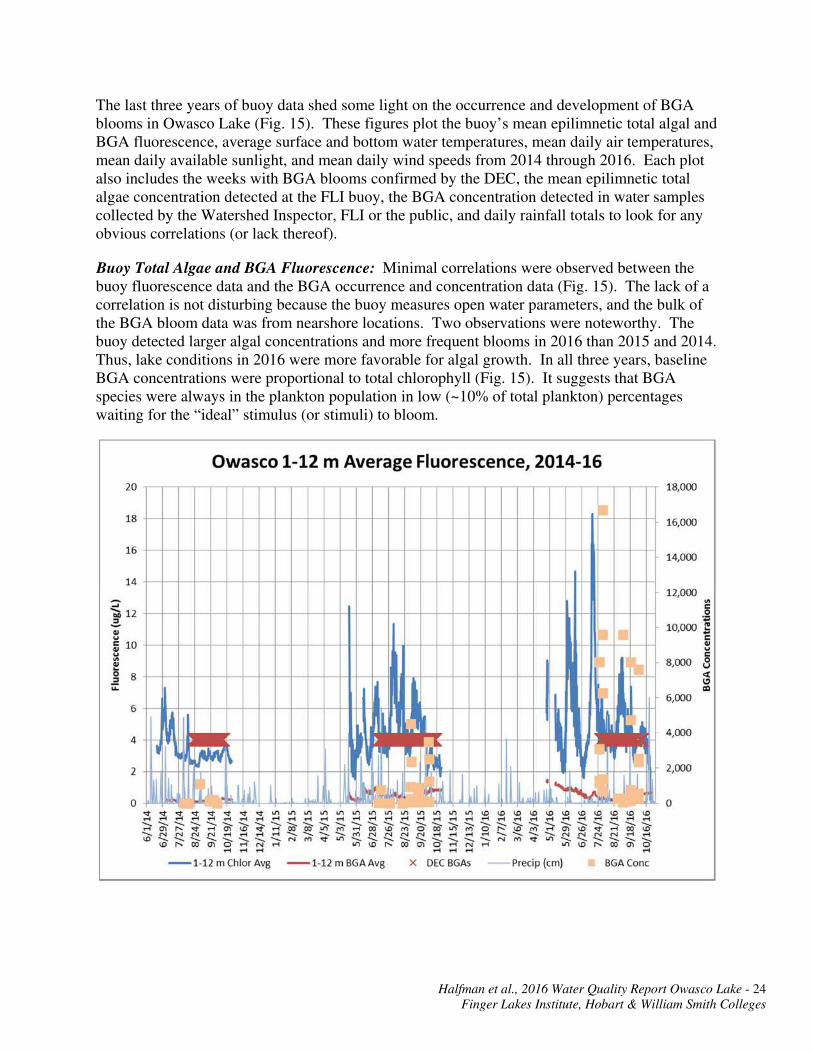
The last three years of buoy data shed some light on the occurrence and development of BGA
blooms in Owasco Lake (Fig. 15). These figures plot the buoy’s mean epilimnetic total algal and
BGA fluorescence, average surface and bottom water temperatures, mean daily air temperatures,
mean daily available sunlight, and mean daily wind speeds from 2014 through 2016. Each plot
also includes the weeks with BGA blooms confirmed by the DEC, the mean epilimnetic total
algae concentration detected at the FLI buoy, the BGA concentration detected in water samples
collected by the Watershed Inspector, FLI or the public, and daily rainfall totals to look for any
obvious correlations (or lack thereof).
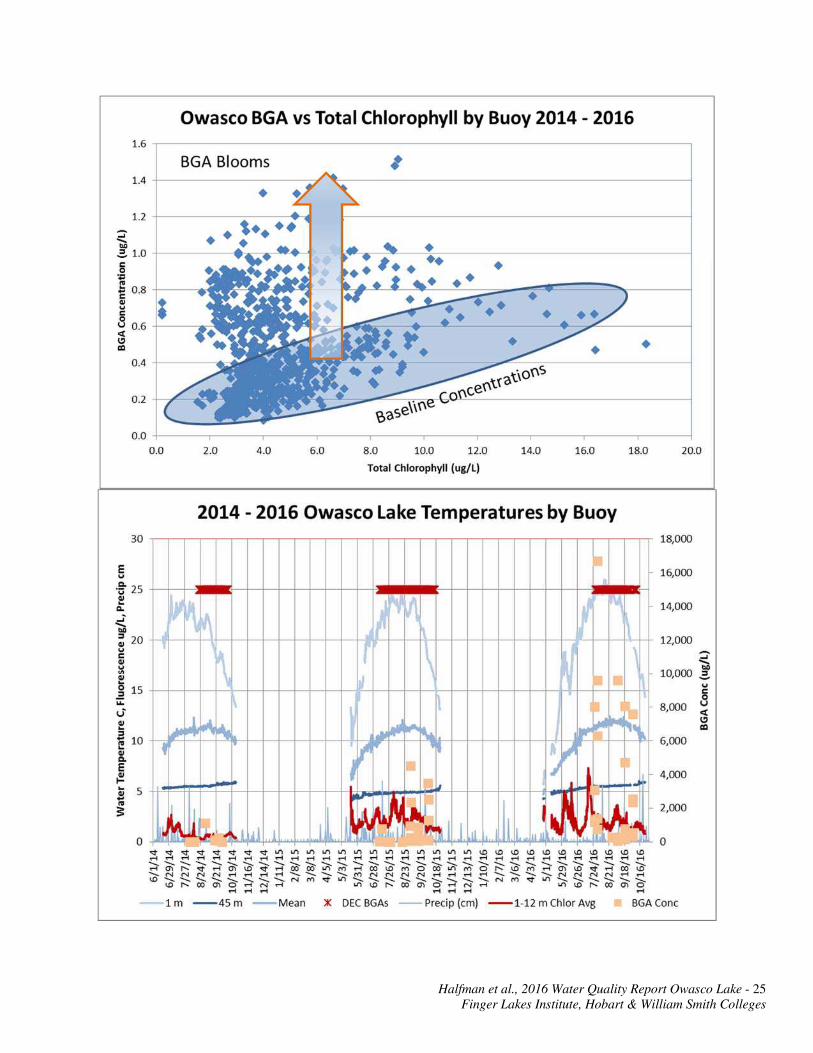
Buoy Total Algae and BGA Fluorescence: Minimal correlations were observed between the
buoy fluorescence data and the BGA occurrence and concentration data (Fig. 15). The lack of a
correlation is not disturbing because the buoy measures open water parameters, and the bulk of
the BGA bloom data was from nearshore locations. Two observations were noteworthy. The
buoy detected larger algal concentrations and more frequent blooms in 2016 than 2015 and 2014.
Thus, lake conditions in 2016 were more favorable for algal growth. In all three years, baseline
BGA concentrations were proportional to total chlorophyll (Fig. 15). It suggests that BGA
species were always in the plankton population in low (~10% of total plankton) percentages
waiting for the “ideal” stimulus (or stimuli) to bloom.
Halfman et al., 2016 Water Quality Report Owasco Lake - 25
Finger Lakes Institute, Hobart & William Smith Colleges

Halfman et al., 2016 Water Quality Report Owasco Lake - 26
Finger Lakes Institute, Hobart & William Smith Colleges
Halfman et al., 2016 Water Quality Report Owasco Lake - 27
Finger Lakes Institute, Hobart & William Smith Colleges
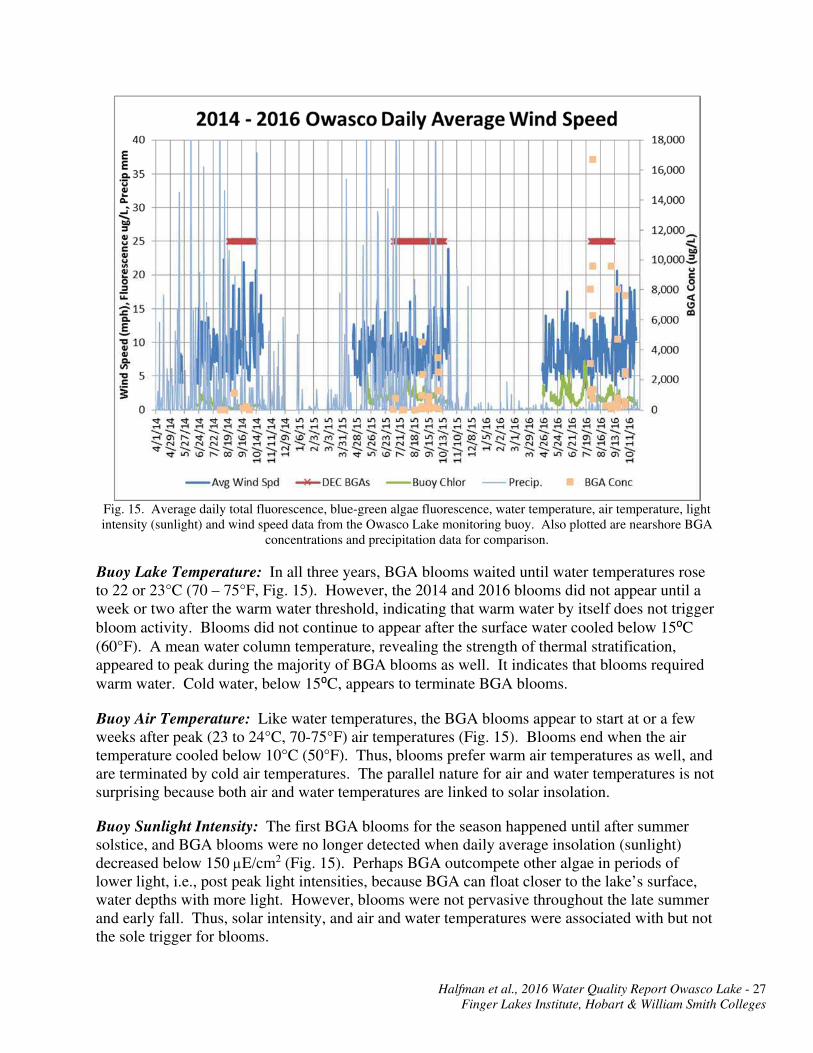
Fig. 15. Average daily total fluorescence, blue-green algae fluorescence, water temperature, air temperature, light
intensity (sunlight) and wind speed data from the Owasco Lake monitoring buoy. Also plotted are nearshore BGA
concentrations and precipitation data for comparison.
Buoy Lake Temperature: In all three years, BGA blooms waited until water temperatures rose
to 22 or 23°C (70 – 75°F, Fig. 15). However, the 2014 and 2016 blooms did not appear until a
week or two after the warm water threshold, indicating that warm water by itself does not trigger
bloom activity. Blooms did not continue to appear after the surface water cooled below 15⁰C
(60°F). A mean water column temperature, revealing the strength of thermal stratification,
appeared to peak during the majority of BGA blooms as well. It indicates that blooms required
warm water. Cold water, below 15⁰C, appears to terminate BGA blooms.
Buoy Air Temperature: Like water temperatures, the BGA blooms appear to start at or a few
weeks after peak (23 to 24°C, 70-75°F) air temperatures (Fig. 15). Blooms end when the air
temperature cooled below 10°C (50°F). Thus, blooms prefer warm air temperatures as well, and
are terminated by cold air temperatures. The parallel nature for air and water temperatures is not
surprising because both air and water temperatures are linked to solar insolation.
Buoy Sunlight Intensity: The first BGA blooms for the season happened until after summer
solstice, and BGA blooms were no longer detected when daily average insolation (sunlight)
decreased below 150 E/cm2 (Fig. 15). Perhaps BGA outcompete other algae in periods of
lower light, i.e., post peak light intensities, because BGA can float closer to the lake’s surface,
water depths with more light. However, blooms were not pervasive throughout the late summer
and early fall. Thus, solar intensity, and air and water temperatures were associated with but not
the sole trigger for blooms.

Halfman et al., 2016 Water Quality Report Owasco Lake - 28
Finger Lakes Institute, Hobart & William Smith Colleges
Rainfall: In all three years, BGA blooms appeared after a storm (Fig. 15). It suggests that the
rainfall and associated storm induced runoff brought in sufficient nutrients to stimulate a bloom.
Interestingly, the algae appeared to “wait” for the subsequent calm, sunny day after the rain to
bloom. In support, the bloom activity in 2016 was absent until mid-August, and only detected
after the first rain events, late in the summer season. The decreased spring and summer rainfall
2016 compared to 2014 and 2015 suggests that high annual rainfall totals, “wet” years, are not
important for individual bloom genesis. However, the significant spring rains of 2014 and 2015
and their associated nutrient/sediment loads may have provided enough nutrients to the lake to
trigger the intermittent BGA blooms along the shoreline in Owasco and the neighboring Finger
Lakes during the past three years.
Buoy Wind Speed & Direction: Both 2016 and 2015 were not as windy as 2014, especially
when BGA blooms were detected (Fig. 15). The wind speed in 2015 and 2016 was at or below
10 mph (small waves) with only a few days with wind speeds above 15 mph (large waves with
white caps). 2014 had fewer calm to light-breeze days and multiple days with wind speeds
above 15 mph. It suggests that BGA bloom development was more likely during calm or light-
breeze days. However, BGA blooms were not detected on every available calm or nearly calm
day in August and September, so calm days are not the sole trigger but windy days prevent
nearshore blooms. Winds above 20 mph (very large waves with white caps) coincide with the
end of the bloom activity in 2015 and 2016 but not 2014. Thus larger wind speeds probably
retarded BGA blooms by mixing BGA throughout the epilimnion and towards open water thus
mixing the blue-green algae into a larger volume of water and decreased its concentration.
The average wind direction blew from the south and did not appreciably change over the three
years (Fig. 16). The direction was consistent with the majority of the BGA concentrations along
the northern margins of Owasco Lake (Fig. 14). A similar BGA lakeshore bloom distribution
and wind direction connection was observed in Seneca Lake.
Fig. 16. Wind rose diagrams showing frequency of wind direction and speed for 2014 (left), 2015 (center) and 2016
(right) from the Owasco Lake buoy.
Summary: The buoy water quality and meteorological data indicate that BGA blooms occurred
between the summer solstice and a few weeks after the fall equinox, coincident with the warmest
and subsequent decline in air and water temperatures. They favor periods of calm or nearly calm
weather, but were not detected during every calm day. Sunny, calm days after a recent runoff
event typically coincides with each bloom but did not consistently initiate a bloom. The
southerly wind direction was consistent with the northerly location of the majority of the
nearshore blooms. The decay of the epilimnetic thermal stratification in the fall season, due to

Halfman et al., 2016 Water Quality Report Owasco Lake - 29
Finger Lakes Institute, Hobart & William Smith Colleges
cooler temperatures and wind events, can also mix more nutrients into the epilimnion and
stimulate additional bloom growth. Strong winds were also coincident with the last bloom in any
given year. It again suggests the importance to investigate the spatial and temporal
characteristics of BGA blooms along the shoreline in relation to local metrological conditions by
deploying numerous BGA, wind and temperature sensors at different locations around the
shoreline.
Please note: all of these observations/correlations are tentative at this time. They were
coincident with BGA blooms but coincidence does not mean causation. These associations also
lacked a consistent and unique event to trigger the large blooms detected since 2014, as previous
summers also experienced calm sunny days after some rain near the end of the summer but
lacked intense BGA blooms. It indicates the importance of the significant rain events and the
associated nutrient delivery during 2014 and 2015 were important.
Do not lose sight of the bigger picture! The focus should not only be predicting blooms and
understanding their ecology but more importantly eliminating blooms from the lake. The
ultimate means to limit any algae bloom is to limit nutrients in the watershed.

Halfman et al., 2016 Water Quality Report Owasco Lake - 30
Finger Lakes Institute, Hobart & William Smith Colleges
STREAM MONITORING RESULTS & DISCUSSION
Stream Discharge: Stream discharge data from the six survey dates in 2016 ranged from dry
(0.00) conditions at Fillmore Creek and South Tributary to 13.2 m3/s in Owasco Inlet at Moravia
(Table 6 in appendix, Fig. 17). These flows revealed typical seasonal variability but significantly
smaller discharges than previous years.
Spatial patterns in discharge were consistent over time. The 2016 mean and individual discharge
measurements were larger at those sites with a larger drainage basin upstream from the site on
any given sample day as in previous years (Fig. 18, r2 = 0.97). The annual mean measured
discharge of Owasco Inlet (299 km2), Dutch Hollow Brook (77 km2), Mill (78 km2), Hemlock
(47 km2) and Fillmore Creek (16.5 km2) were 3.9, 0.65, 1.26, 0.34 and 0.26 m3/s, respectively.
Discharge was always larger at successively downstream sites along Owasco Inlet but this trend
was occasionally not true for Dutch Hollow Brook.
Within Dutch Hollow Brook, mean annual discharge at each site typically equaled or was
slightly larger than the sum of the discharges at the next upstream site and any measured
tributaries entering along the segment between sites. For example, the sum of the mean annual
discharge at North Rd was similar to the sum of the discharges at South, Benson tributary, and
Benson Rd sites. Discharge decreased slightly from North Rd to 38A on all but one sample date
which had the largest measured discharge. It suggests that surface runoff persistently contributed
to and increased stream discharge during events from North down to Rt 38A. In contrast, the
stream probably lost water to instream plants along this stretch of stream, and into the permeable
sand of gravel groundwater system of the Dutch Hollow Brook delta, during base flow.
Within Owasco Inlet, tributary inputs typically accounted for the majority of the observed
downstream increases in discharge. For example, the mean discharge at the Locke site was
slightly smaller than the sum of the mean discharge upstream of Locke and Hemlock Creek. The
discharge at Moravia (at Rt 38) was slightly smaller than the combined discharge at Mill Creek,
a tributary to Owasco Inlet, and at Aurora St, the next upstream site. Groundwater inputs
probably provided the difference, and were especially important this year, a very dry year. The
exception was VFW which revealed smaller mean annual discharge than Locke and other
Fig. 17. Annual average stream discharge at each stream
site in the Dutch Hollow Brook (purple), Owasco Inlet
(pink) and Fire Lane 20 watersheds based on the 6 grab
sample survey dates. Tributary sites are stippled. Sites are
arranged, left to right, from downstream to upstream.
Fig. 18. Discharge vs. Basin Size.

Halfman et al., 2016 Water Quality Report Owasco Lake - 31
Finger Lakes Institute, Hobart & William Smith Colleges
upstream sites. The smaller annual discharge at VFW was most likely due to not collecting
samples at the VFW site on the two “high flow” survey dates, 4/13 and 10/1.
Seasonal Variability: The largest discharges of 2016 were detected in the spring and smallest in
the summer using the bi-monthly discharge data for Dutch Hollow at the Rt 38A site and the
USGS gauge data for Owasco Inlet (Fig. 19). The spring dominance in flow was also detected in
previous years. The seasonal pattern between the summer and fall discharges varies from year to
year but always paralleled the seasonal change in precipitation and evapotranspiration (Fig. 20).
Differences to Earlier Years: The 2016 annual mean discharge was the smallest detected at
Dutch Hollow Brook and 2nd smallest at Owasco Inlet over the past six years (Fig. 21). These
differences are explained by parallel changes in precipitation. The 2016, May through June, and
the 5-month field season precipitation totals were small, 43% and 41% of normal as measured at
the Ithaca Airport, and the driest year since 2006 (Fig. 22). It designates 2016 and 2012 as “dry”
years, 2013 and 2014 as “in-between” years, and 2011 and 2015 as “wet” years. As noted
before, differences in discharge parallel changes in precipitation.
The Owasco Inlet (USGS Gauge, 4235299) eight month, field season, annual discharge of 2.0
m3/s revealed a “dry” year for 2016 compared to 5.1, 1.7, 3.9, 3.0 and 5.4 m3/s in 2011 through
2015, respectively (Fig. 23). Similar variability was observed for the Owasco Outlet (USGS
Fig. 19. Seasonal averaged stream discharge for the Rts.
38A and 38 sites, the terminal sites on Dutch Hollow
Brook and Owasco Inlet, respectively.
Fig 20. Monthly and “normal” precipitation
totals for the Ithaca Airport.
Fig. 21. Field season annual average stream discharge for
the Rts. 38A and 38 sites. This plot used the estimated
Dutch Hollow Brook data logger and USGS daily Owasco
Inlet discharge data.
Fig. 22. Annual precipitation totals during the 8-
month, March – October, field season, and during
May & June at the Ithaca Airport.

Halfman et al., 2016 Water Quality Report Owasco Lake - 32
Finger Lakes Institute, Hobart & William Smith Colleges
Gauge, 4235440). Annual mean daily outflows were 11.4, 8.4, 8.3, 8.7, 8.4, 9.2 and 6.1 m3/s for
2011 through 2016, respectively. Clearly, 2013 and 2014 were “in between” and perhaps more
typical for Owasco Lake compared to the 2011 and 2015 “wet”, and 2012 and 2016 “dry” years.
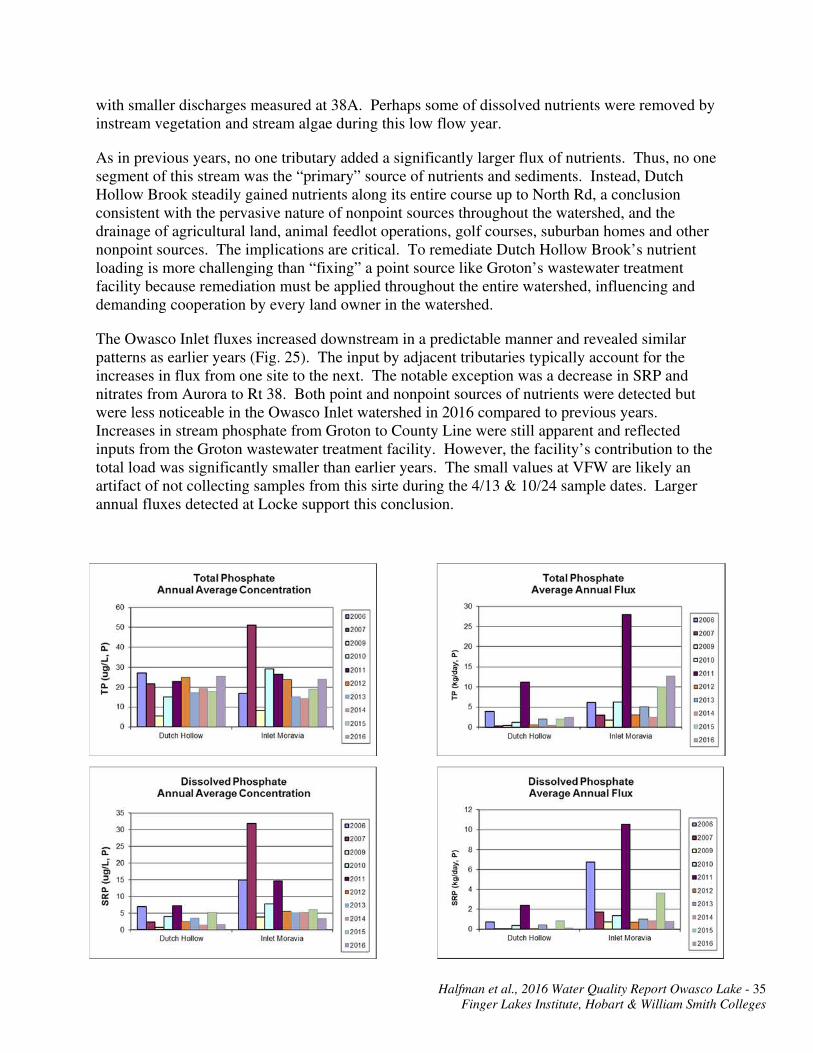
Stream Concentration Data: Total phosphate (TP) concentrations in 2016 ranged from 1.5 to
nearly 59 g/L, and averaged 22 g/L in Dutch Hollow Brook; and it ranged from 0 (dry) to 68
g/L, and averaged 24.6 g/L in Owasco Inlet (Table 6 in appendix, Fig. 24). Along Dutch
Hollow Brook, the 38A, South, and Benton Rd tributary sites revealed the largest annual mean
TP concentrations of ~22 to 28 g/L, whereas the North Rd, Benson Rd and Old State Rd sites
revealed slightly smaller mean TP concentrations (just under 20 g/L). Of note, the Benson
tributary did not have significantly larger TP concentrations as detected in earlier years. Thus, it
suggests that recent remediation efforts within the Benson Tributary watershed, i.e., at Young’s
Farm, and on other agriculturally-rich sub-basins in this watershed decreased nutrient loading
from the watershed.
Fig. 23. Annual average stream discharge for the Owasco Inlet near Moravia – USGS Stream Gauge 4235299 and
the Owasco Outlet – USGS Stream Gauge 4235440.

Halfman et al., 2016 Water Quality Report Owasco Lake - 33
Finger Lakes Institute, Hobart & William Smith Colleges
Total suspended sediment (TSS) concentrations were largest at the 38A, North, Benson Rd and
Old State Rd sites (4.5 to 7.2 mg/L). The agriculturally-rich tributaries, South and Benson Rd
tributaries, were lowest (1.7 & 3.2 mg/L). A notable increase in TSS from North Rd to Rt 38A,
was not observed in 2016 as in previous years. It suggests that recent agricultural BMPs are
decreasing suspended sediment in the runoff and/or lower rainfalls in 2016 decreased the erosion
of soils from these watersheds compared to previous years. Alternatively, the high flows of 2014
and 2015 washed out all of the easily erodible materials from the agriculturally-rich watershed.
Dissolved phosphate (SRP), nitrate and specific conductance (salinity) concentrations were
larger at the South and Benson tributary sites compared to the other sites but the difference was
much less in 2016 and the concentrations were smaller in 2016 than earlier years.
Along the Owasco Inlet, nutrient and sediment concentrations were similar to those at Dutch
Hollow Brook. Mean annual TP and SRP concentrations increased slightly from Groton to
County Line, and from Locke to Aurora, as in past years. The increase between these sites was
not as dramatic as in past years, especially the notable increase in phosphorus between Groton
and County Line before 2007 attributed to the Groton WWTF effluent. The TP and SRP
concentrations were typically smaller at Mill, Fillmore, and Hemlock Creeks than the
neighboring main stream sites but these differences were small. Mean annual total TSS
concentrations did not reveal consistent patterns, except that Fillmore Creek had the smallest
concentrations.
Fire Lane 20 was routinely sampled every year since 2012. It revealed the largest salinities and
nitrate concentrations but similar TSS, TP and SRP concentrations as the other sites. It appears
Fig. 24. Site averaged lake (light blue) and stream nutrient and
suspended sediment concentrations for Dutch Hollow Brook
(blue), Owasco Inlet (pink), and Fire Lane 20 (green).
Tributary sites are stippled. Sites are arranged from
downstream (left) to upstream (right).

Halfman et al., 2016 Water Quality Report Owasco Lake - 34
Finger Lakes Institute, Hobart & William Smith Colleges
that the agricultural impact on this watershed has decreased in 2016 compared to earlier years
and/or the easily eroded materials were already flushed during the 2014 and 2015 high flows.
Stream Fluxes: Owasco Inlet revealed larger fluxes of nutrients and sediments than Dutch
Hollow Brook (TP 8.1 vs. 1.4 kg/day; SRP 1.1 vs. 0.1 kg/day; TSS 3,400 vs. 254 kg/day; N
1,160 vs. 110 kg/day, respectively, Fig. 25). Similar concentrations of nutrients and sediments
between these two streams, but significantly larger discharges down the larger Owasco Inlet
resulted in its larger fluxes to the lake. As before, fluxes in the Owasco Lake watershed were
sensitive to discharge and basin size. The fluxes measured in 2016 were smaller than those in
previous years, highlighting the 2016 “dry” year (Fig. 26).
At the small end of the spectrum, fluxes at the Dutch Hollow Brook tributary sites (Benson and
South sites) and Fire Lane 20 were smaller than the other sites in the survey. The small fluxes
paralleled the smallest discharges at these sites. It follows that smaller watersheds with smaller
discharges delivered the smallest fluxes, and larger watersheds with larger discharges delivered
the largest fluxes. However, many small, 1st or 2nd order, tributaries (~40 in Fig. 1) like Fire
Lane 20 drain into Owasco Lake. The combined TP load by all these small tributaries is
comparable to the load from Dutch Hollow Brook.
Nutrient fluxes increased slightly from the headwaters of Dutch Hollow Brook to the North Rd
site, and SRP and nitrate decreased downstream of North Rd to the 38A site. The losses
downstream of North Rd can be attributed to the parallel change in concentrations combined
Fig. 25. Site averaged nutrient and sediment fluxes for Dutch Hollow (blue), Owasco Inlet (orange), and Fire Lane
20 (green). Tributary sites are stippled. Sites are arranged from downstream to upstream. Samples were not
collected from the VFW site during the two largest “event” dates during 2016, which influenced the mean
concentration and discharge and thus flux at this site
Halfman et al., 2016 Water Quality Report Owasco Lake - 35
Finger Lakes Institute, Hobart & William Smith Colleges
with smaller discharges measured at 38A. Perhaps some of dissolved nutrients were removed by
instream vegetation and stream algae during this low flow year.
As in previous years, no one tributary added a significantly larger flux of nutrients. Thus, no one
segment of this stream was the “primary” source of nutrients and sediments. Instead, Dutch
Hollow Brook steadily gained nutrients along its entire course up to North Rd, a conclusion
consistent with the pervasive nature of nonpoint sources throughout the watershed, and the
drainage of agricultural land, animal feedlot operations, golf courses, suburban homes and other
nonpoint sources. The implications are critical. To remediate Dutch Hollow Brook’s nutrient
loading is more challenging than “fixing” a point source like Groton’s wastewater treatment
facility because remediation must be applied throughout the entire watershed, influencing and
demanding cooperation by every land owner in the watershed.
The Owasco Inlet fluxes increased downstream in a predictable manner and revealed similar
patterns as earlier years (Fig. 25). The input by adjacent tributaries typically account for the
increases in flux from one site to the next. The notable exception was a decrease in SRP and
nitrates from Aurora to Rt 38. Both point and nonpoint sources of nutrients were detected but
were less noticeable in the Owasco Inlet watershed in 2016 compared to previous years.
Increases in stream phosphate from Groton to County Line were still apparent and reflected
inputs from the Groton wastewater treatment facility. However, the facility’s contribution to the
total load was significantly smaller than earlier years. The small values at VFW are likely an
artifact of not collecting samples from this sirte during the 4/13 & 10/24 sample dates. Larger
annual fluxes detected at Locke support this conclusion.

Halfman et al., 2016 Water Quality Report Owasco Lake - 36
Finger Lakes Institute, Hobart & William Smith Colleges
Fig. 26. Annual average stream grab sample concentrations (left) and fluxes (right).

Halfman et al., 2016 Water Quality Report Owasco Lake - 37
Finger Lakes Institute, Hobart & William Smith Colleges
EVENT SAMPLING ALONG DUTCH HOLLOW BROOK
Detailed Stage Data @ 38A along Dutch Hollow Brook: Data logger data was recovered from
both loggers at the 38A and North Rd sites, and rating curves using the mean stage data were
independently established for each site.
The 2016 38A and North Rd stage data revealed textbook responses to precipitation events (Fig.
27). Each increase in stage corresponded to a precipitation event, and the change in stream
height ranged from 5 to more than 100 cm above base flow levels. Not all precipitation events
induced a proportional stream response, especially during the spring when increases in stage
were larger for similar sized precipitation events than the other seasons. The differences are
interpreted to reflect seasonal changes in, for example, ground saturation, rainfall intensity,
runoff/infiltration ratios and evapotranspiration. Similar seasonal and day to day,
precipitation/event influenced changes in stage, conductivity and temperature were detected
during the past four years as well although far fewer significant events were detected in 2016
than previous years (Figs. 27 & 28).
Fig. 27. Dutch Hollow Brook
estimated discharge, precipitation,
stream sample dates and measured
discharge data: 2016 Rt 38A data
(left); North Rd 2015 data, (right).
Precipitation data was from NY-CY-8,
a station within the DH watershed, part
of CoCoRaHS collaboration.
Fig. 28a. Data logger stage and water & air temperature data
at 38A. The seasonal cold to warm to cold cycle prevails.
Fig. 28b. Data logger stage and water & air temperature data
at North Rd. The seasonal cold to warm to cold cycle prevails.

Halfman et al., 2016 Water Quality Report Owasco Lake - 38
Finger Lakes Institute, Hobart & William Smith Colleges
Detailed “Event vs Base Flow” Results @ 38A: Despite being a “dry” year with noticeably
fewer precipitation events, nutrients and sediments responded to the occasional event throughout
the 2016 deployment (Fig. 29). Total suspended sediments (TSS) increased dramatically from
an average base flow concentration of ~20 mg/L to an average event flow concentration of 370
mg/L, and rose to a maximum of 1,460 mg/L on 10/21. These large TSS concentrations were
restricted to the runoff portion of the storm event, and declined quickly to base flow turbidities
before the stream stage returned to base flow. It indicates that runoff events compared to base
flow transported significantly more soil particles to and had a greater impact on water quality in
the stream. The base flow concentrations were larger than previous years, and probably resulted
from algae and rooted vegetation growing in the numerous pools of water. The peak TSS
concentrations were significantly smaller than previous years, as well. The difference parallels
the difference in rainfall between years.
As mentioned in previous reports, the event versus base flow results suggests a number of
potential remediation practices to reduce TSS impairments. For example, roadside ditches
should be hydro-seeded and/or utilize other flow reducing structures to decrease water velocities
and the erosion potential of the draining water. In agricultural areas, buffer strips of vegetation
alongside each stream course, where the vegetation reduces the velocity of the runoff and allows
particles to settle out before entering the stream. Installation of gully plugs and retention ponds
Fig. 29. Rt 38A nutrient and suspended sediment concentrations.
Halfman et al., 2016 Water Quality Report Owasco Lake - 39
Finger Lakes Institute, Hobart & William Smith Colleges
in low lying areas provide another mechanism to retard the movement of suspended sediments
before the runoff spills into the nearby stream. Alternatively, farmers could plant a winter crop
cover, that reduces topsoil erosion from their fields during the late fall, winter and early spring
seasons. This is most critical in the early spring when the soils are thawed and still saturated,
conditions ripe for the largest erosion rates. These practices however remove tillable acreage
from the farmer and/or require additional time on the fields to, e.g., plant winter cover crops, and
thus reduce her/his annual income.
Total (TP) and dissolved (SRP) phosphates revealed event responses as well. Mean TP and SRP
event concentrations were significantly larger than base flow concentrations, increasing from
base flow means of 20.0 and 2.5 g/L to event means of 49.8 and 22.6 g/L, respectively.
Maximum event concentrations were 270 g/L for TP and 86 g/L for SRP. Again, 2016 event
concentrations suggest a direct linkage to and the importance of precipitation induced runoff
events for phosphorus loading to the lake, even during this “dry” year. Thus, the remediation
steps to reduce phosphate loading are similar to remediating suspended sediment, i.e., reduce the
movement of soil particles from runoff events in the Owasco watershed.
Nitrates, once again, revealed a slightly different response to events than TSS, TP and SRP. The
largest nitrate concentrations still correlated with events with mean event concentrations of 20.4
and base flow concentrations of 1.6 mg/L, however this difference was much smaller than those
observed in the TSS, TP and SRP data. The increase to the peak concentration and subsequent
decline to base flow conditions took slightly longer for nitrates as well. It indicates that runoff
provided extra nitrates to the stream. However, the precipitation rejuvenated near-surface
groundwater flow contributed a portion of the nitrate load as well, extending the nitrate response
to the event as runoff flows faster than groundwater flow. Nitrates have a different event/base
flow response than TSS, TP and SRP because nitrates are water soluble and not bound to
particles, thus they can enter a stream by both runoff and groundwater routes. In contrast,
phosphates are typically particle bound, thus groundwater does not transport TP, SRP and TSS.
Please note, the nitrate base flow to event response was more subdued in 2016 than earlier years,
suggesting a smaller impact from and/or depleted groundwater source due to the dry conditions.
Event vs. Base Flow Fluxes @ 38A: To calculate fluxes for the daily samples, a discharge must
be determined for each sample. A best-fit, 2nd order, polynomial relationship between the bi-
monthly discharge measurements at 38A (r2 = 0.99) and North Rd sites (r2 = 0.95) established a
stage/discharge rating curve for both sites (Fig. 30). Even though previous years employed a
linear relationship, a 2nd-order, polynomial fit provided a better match to 2016’s low-flow data.
The fluxes of TSS, TP, SRP and nitrates were clearly event driven (Table 7, Fig. 31). In 2016,
TSS, TP and SRP event vs. base flow fluxes at 38A averaged 25,844 vs. 137, 4.7 vs. 0.1, and 2.3
vs. 0.0 kg/day, respectively. During the entire 2016 deployment, Dutch Hollow provided
1,343,000 kg of sediment to the lake during events, and only 17,800 kg during base flow
conditions. In a similar light, the 2016 events delivered 243 kg of TP and 118 kg of SRP to the
lake compared to base flow contributions of 18 kg of TP and 2 kg of SRP. In conclusion, each
year revealed significantly larger event than base flow loads for TSS, TP and SRP, and to a
lesser degree nitrates along Dutch Hollow Brook (Table 7).
Annual changes were also observed. The 2016 event and base flow fluxes for TSS and TP were
much smaller in 2016 than previous years, reflecting the reduced rainfall in 2016 (Fig. 32). This

Halfman et al., 2016 Water Quality Report Owasco Lake - 40
Finger Lakes Institute, Hobart & William Smith Colleges
trend is even more striking when rainfall totals focus on April, May and June; a time frame when
soils are saturated and thus directing more rain into runoff than infiltration, but thawed enough to
enable soil erosion. Plant life is also absent or just rebounding from winter dormancy at this
time, and thus are not available to retard runoff velocities and volumes from increase
evapotranspiration. Farm fields are typically tilled bare of vegetation in preparation for planting
increasing their potential for erosion at this time as well (Fig. 33).
The event versus base flow data also indicate that grab samples underestimated annual fluxes
down a stream. For example, the 2016 autosampler estimated a sediment mean flux of 8,850
kg/day, total phosphates 1.4 kg/day, dissolved phosphates 0.7 kg/day, and nitrates 1,300 kg/day;
whereas the grab sampling estimated an annual mean flux of 470 kg/day for sediments, 2.5
kg/day for total phosphates, 0.1 kg/day for dissolved phosphates, and 240 kg/day for nitrates.
The grab samples typically estimated smaller fluxes because these samples were usually biased
to base flows. In 2016, however a larger percentage of the grab samples were collected during
events causing the TP discrepancy. Regardless, grab samples could be used but are less reliable
for detailed flux estimates compared to the daily data collected by the autosampler and data
loggers. Instead grab samples are essential and reliable tools for stream segment analysis and the
investigation of nutrient and sediment sources.
Fig. 30. Best fit correlations between bi-monthly measured discharge and data logger stage data at both 38A and North Rd sites.
.

Halfman et al., 2016 Water Quality Report Owasco Lake - 41
Finger Lakes Institute, Hobart & William Smith Colleges
Table 7: 2011 – 2015 Autosampler Fluxes at Dutch Hollow Brook.
2011 (6/9-11/4) TSS Nitrate TP SRP
Mean (kg/day) 8,700 75 2.7 1.7
Event (kg/day) 24,500 180 6.9 4.5
Base Flow (kg/day) 115 19 0.4 0.1
% by events 99% 84% 90% 96%
2012 (3/20-11/2) TSS Nitrate TP SRP
Mean (kg/day) 2,400 69 1.9 0.4
Event (kg/day) 6,850 150 4.0 0.6
Base Flow (kg/day) 190 28 0.9 0.2
% by events 95% 73% 70% 60%
2013 (4/10-10/29) TSS Nitrate TP SRP
Mean (kg/day) 7,550 270 4.4 1.3
Event (kg/day) 12,000 370 6.4 1.8
Base Flow (kg/day) 290 100 1.3 0.3
% by events 99% 85% 89% 91%
2014 (4/19-10/28) TSS Nitrate TP SRP
Mean (kg/day) 14,600 115 3.5 1.6
Event (kg/day) 36,000 185 6.5 3.2
Base Flow (kg/day) 300 67 1.5 0.5
% by events 99% 65% 74% 81%
2015 (4/19-10/28) TSS Nitrate TP SRP
Mean (kg/day) 35,600 180 3.7 2.3
Event (kg/day) 81,500 370 7.7 5.2
Base Flow (kg/day) 185 27 0.5 0.0
% by events 99% 93% 94% 99%
2016 (4/13-10/25) TSS Nitrate TP SRP
Mean (kg/day) 7,482 1,323 1.4 0.7
Event (kg/day) 25,844 4,602 4.7 2.3
Base Flow (kg/day) 137 11 0.1 0.0
% by events 99.5 99.8 97.1 99.2
Fig. 31. Autosampler nutrient and suspended sediment fluxes.

Halfman et al., 2016 Water Quality Report Owasco Lake - 42
Finger Lakes Institute, Hobart & William Smith Colleges
DETAILED ANALYSIS @ NORTH RD:
Fig. 32. Estimated annual total phosphorus loads vs field season
(5-month) rainfall at the Ithaca Airport.
Fig. 33. Estimated annual total phosphorus loads vs May-June (3-
month) spring-time rainfall at the Ithaca Airport.
Fig. 34. North Rd nutrient and sediment fluxes.

Halfman et al., 2016 Water Quality Report Owasco Lake - 43
Finger Lakes Institute, Hobart & William Smith Colleges
A best fit, 2nd order, polynomial relationship was used to define the stage/discharge rating curve
at North Rd. The detailed TSS, TP and SRP concentration data revealed event signatures at this
site that paralleled those at 38A (Fig. 34, Table 8). This is not new. The fluxes, both event and
base flow fluxes, were slightly but not significantly larger at the North Rd Site than downstream
at Rt 38A. The primary difference was the amount of material delivered during the late October
storm (10/21). In fact, without this event, event fluxes would not have exceeded base flow
fluxes in 2016.
Table 8: 2014, 2015 & 2016 Daily Fluxes at 38A & North Rd.
38A (2014) TSS Nitrate TP SRP
Mean (kg/day) 10,500 83 2.3 0.7
Event (kg/day) 28,200 150 5.0 1.8
Base Flow (kg/day) 285 45 0.8 0.1
% by events 98% 66% 78% 88%
North Rd (2014) TSS Nitrate TP SRP
Mean (kg/day) 10,900 67 2.1 0.6
Event (kg/day) 22,000 100 3.5 1.1
Base Flow (kg/day) 270 35 0.8 0.2
% by events 99% 74% 81% 88%
38A (2015) TSS Nitrate TP SRP
Mean (kg/day) 35,600 180 3.7 2.3
Event (kg/day) 81,500 370 7.7 5.2
Base Flow (kg/day) 185 27 0.5 0.0
% by events 99% 93% 94% 99%
North Rd (2015) TSS Nitrate TP SRP
Mean (kg/day) 25,000 155 3.2 2.0
Event (kg/day) 64,000 310 7.4 4.5
Base Flow (kg/day) 168 38 0.5 0.1
% by events 99.7% 89% 94% 99%
38A (2016) TSS Nitrate TP SRP
Mean (kg/day) 7,482 1,323 1.4 0.7
Event (kg/day) 25,844 4,602 4.7 2.3
Base Flow (kg/day) 137 11 0.1 0.0
% by events 99.5 99.8 97.1 99.2
North Rd (2016) TSS Nitrate TP SRP
Mean (kg/day) 8,847 1,610 1.8 1.3
Event (kg/day) 53,044 9,764 9.7 7.9
Base Flow (kg/day) 224 19 0.3 0.1
% by events 99.6 99.8 97.2 99.3
PHOSPHORUS BUDGET:
Phosphorus load reductions are critical to the health and water quality of Owasco Lake because
phosphorus limits algal growth and thus impairs water quality and clarity. The development of
blue-green algae blooms, some with life threatening concentrations of toxins, also highlight its
importance. Clearly, stream loads dominate the inputs, even in “dry” years. However, the
stream inputs are only one part of the equation. A complete budget must also include other
inputs like atmospheric loading, onsite septic systems and lakeshore lawns. Outputs must also be

Halfman et al., 2016 Water Quality Report Owasco Lake - 44
Finger Lakes Institute, Hobart & William Smith Colleges
calculated to estimate the net change in phosphorus for the lake (Fig. 35). The net change is
paramount because the amount of phosphorus will increase in the lake, if inputs exceed outputs.
Phosphorus will decrease in the lake, if inputs are less than outputs. Alternatively, phosphorus
remains the same, i.e., at equilibrium, when inputs to equal outputs. To improve water quality,
inputs of phosphorus must be smaller than outputs for a number of years (multiple water
retention times). A sustained reduction allows existing phosphorus to leave by the outlet or be
buried in the sediments, and eventually limit algal growth and improve water quality and clarity.
The required “cleansing” time frame in the Owasco watershed is a decade or more.
Fig. 35. The Owasco Lake phosphorus budget: Sources and sinks for phosphorus in Owasco Lake.
Water quality improves if inputs are less than outputs, for a number of years.
The Inputs: The 38A autosampler estimated a mean total phosphate flux of 1.4 kg/day from
Dutch Hollow Brook in 2016. Owasco Inlet delivered 12.7 kg/day based on the available 2016
stream grab data. The 2016 load from Owasco Inlet was estimated at 7.1 kg/day assuming a
proportional change between the mean grab sample total phosphorus loads to the detailed
autosampler loads from Dutch Hollow Brook. An extrapolation of fluxes and surface areas from
Dutch Hollow Brook, Mill Creek, Hemlock Creek and Owasco Inlet to the entire Owasco
watershed, estimated an input of 4.4 metric tons of phosphorus to the lake in 2016. This
extrapolation incorporates all the 1st and 2nd order (small) tributaries like Fire Lane 20. The 2011
report estimated atmospheric and septic system inputs at 0.1 metric tons/year and ~1 metric
tons/year. These estimates are again used below.
The total 2016 influx of phosphorus was estimated at 5.5 metric tons/year.
The Outputs: Phosphorus is lost from the lake through the Outlet in the form of algae, dissolved
organic-rich compounds, organic-rich particulates, and the occasional larger organism (e.g.,
fish). Approximately 1.9 metric tons of phosphorus escaped out the Outlet in 2016 assuming a
2016 annual mean total phosphate concentration in the lake of 10.1 g/L, and a 2016 mean daily
discharge of 6.1 m3/s through the Owasco Outlet (USGS Owasco Outlet Gauge #04235440).
The 2011 report estimated the flux of phosphorus to the sediments of a few metric tons per year
and this estimate is again used here. The earlier report cautioned that more work was required to
firm up this sediment burial estimate, because the flux was based on only a few sediment cores.
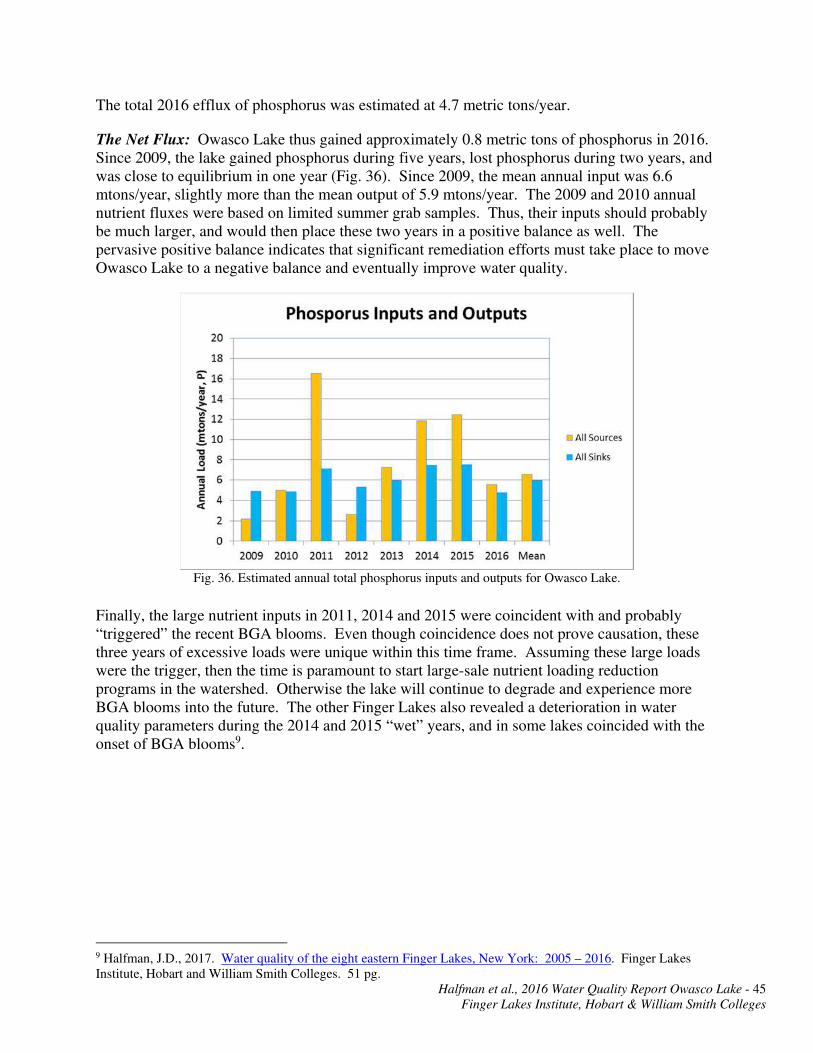
Halfman et al., 2016 Water Quality Report Owasco Lake - 45
Finger Lakes Institute, Hobart & William Smith Colleges
The total 2016 efflux of phosphorus was estimated at 4.7 metric tons/year.
The Net Flux: Owasco Lake thus gained approximately 0.8 metric tons of phosphorus in 2016.
Since 2009, the lake gained phosphorus during five years, lost phosphorus during two years, and
was close to equilibrium in one year (Fig. 36). Since 2009, the mean annual input was 6.6
mtons/year, slightly more than the mean output of 5.9 mtons/year. The 2009 and 2010 annual
nutrient fluxes were based on limited summer grab samples. Thus, their inputs should probably
be much larger, and would then place these two years in a positive balance as well. The
pervasive positive balance indicates that significant remediation efforts must take place to move
Owasco Lake to a negative balance and eventually improve water quality.
Fig. 36. Estimated annual total phosphorus inputs and outputs for Owasco Lake.
Finally, the large nutrient inputs in 2011, 2014 and 2015 were coincident with and probably
“triggered” the recent BGA blooms. Even though coincidence does not prove causation, these
three years of excessive loads were unique within this time frame. Assuming these large loads
were the trigger, then the time is paramount to start large-sale nutrient loading reduction
programs in the watershed. Otherwise the lake will continue to degrade and experience more
BGA blooms into the future. The other Finger Lakes also revealed a deterioration in water
quality parameters during the 2014 and 2015 “wet” years, and in some lakes coincided with the
onset of BGA blooms9.
9 Halfman, J.D., 2017. Water quality of the eight eastern Finger Lakes, New York: 2005 – 2016. Finger Lakes
Institute, Hobart and William Smith Colleges. 51 pg.

Halfman et al., 2016 Water Quality Report Owasco Lake - 46
Finger Lakes Institute, Hobart & William Smith Colleges
CONCLUSIONS & RECOMMENDATIONS:
This report confirms and expands on earlier findings.
Owasco Lake is a borderline oligotrophic – mesotrophic lake. The improvements in water
quality from 2011 through 2013 were lost in 2014 and 2015 but regained in 2016.
Phosphorus is still the limiting nutrient for algae growth.
The water quality degradation in 2014 and 2015 is attributed to the heavy rains in those
years. The rebound in 2016 is attributed to the diminished rainfall in 2016.
The water quality buoy provided a more robust view of water quality in the lake by detecting
algal blooms and other events missed by the monthly lake surveys over the past three years.
Blue-green algae concentrations were small at the open-water sites, much smaller than
almost all of the nearshore blooms.
Nearshore blue-green algae blooms were detected after the summer solstice when the lake
was warm, calm or nearly calm, typically on a sunny day after an influx of nutrients from a
recent runoff event and/or the seasonal decay of the epilimnion. No blooms were detected
after water temperatures cooled below 15°C, mean daily sunlight declined below 150
E/cm2, and a strong wind event (> 20 mph). Funds should be secured to deploy this buoy in
future years to confirm these correlations.
Unfortunately, no one parameter consistently triggered the onset of nearshore blooms.
Nearshore BGA, water temperature and wind (speed and direction) sensor arrays would
establish a more robust spatial and temporal inventory for BGA blooms to learn more about
their ecology.
The excessive nutrient loads during 2014 and 2015 were also coincident with and perhaps
triggered the onset of the large blooms of blue-green algae in Owasco and many other Finger
Lakes. It suggests that the excess nutrients triggered the new era of BGA blooms, although
coincidence does not dictate causation. It does however highlight the need to quickly and
decisively abate nutrient loading to the lake.
Segment analysis highlighted the lack of significant point sources along either Dutch Hollow
Brook or Owasco Inlet. It highlighted successful remediation efforts, like reducing loads
from the Groton wastewater treatment facility. Fortunately, 2016 was also a “dry” year, so
the total nutrient and sediment loads to the lake from nonpoint agricultural sources were
smaller than previous years.
The event versus base flow analysis at Dutch Hollow Brook highlight the dominance of
events and associated runoff of nonpoint sources to the delivery of phosphates and sediments
to the lake. It also provided more accurate load estimates than grab samples, especially in
those years when surveys were limited to the summer months. Event and base flow loads in
2016 were below those determined for earlier years and correlated very well to field-season
and May-June rainfall. It pinpoints potential remediation strategies to decrease the erosive
powers of runoff.
Similar event signatures were observed at North Rd and Rt 38A along Dutch Hollow Brook.
Differences between sites in 2016 were small and less significant than previous years due to
the 2016 dry year.
The estimated phosphate budget for Owasco Lake indicated that the lake gained some
phosphorus in 2016 but gained much less phosphorus in this “dry” year than all but one year
since 2011. The exception is 2012, another “dry” year, when sources were smaller than
sinks.
Streams were the primary source of nutrients and sediments to the lake.

Halfman et al., 2016 Water Quality Report Owasco Lake - 47
Finger Lakes Institute, Hobart & William Smith Colleges
o More BMPs should be installed, where necessary, to reduce nutrient and sediment
loading from agriculturally-rich watersheds, while at the same time monitoring
downstream of these remediation projects to assess their effectiveness. The critical areas
to install BMPs along stream banks and in the low lying and other water saturated areas
in each field.
o The financial burden to install the BMPs cannot be placed solely on the farmer and other
landowners. Water quality is a watershed-wide issue. Everyone benefits from a cleaner
lake. Thus everyone must support the remediation efforts.
o Please use the funds awarded to Cayuga Soil and Water and the Owasco Lake Watershed
Association for such remediation efforts wisely.
ACKNOWLEDGEMENTS
The 2016 research was supported by Cayuga County Legislature, and a promise of funding from the Owasco lake
Watershed Association. We thank members of the Cayuga County Planning Department, Cayuga County Water
Quality Management Agency, Owasco Lake Watershed Management Council, Cayuga County Health Department,
Owasco Watershed Lake Association, the Cayuga County Soil and Water District, the Institute for the Application
of Geospatial Data, the Finger Lakes – Lake Ontario Watershed Protection Alliance, and NYS Department of
Environmental Conservation for their help. Numerous individuals helped with many aspects of this study including
Senator Mike Nozzolio, Barbara Halfman, Peter Spacher, Steven Cuddeback, Bill Graney, Mike Didio, Gary
Searing, Ed Wagner, Keith Batman, Eileen O-Connor, Bruce Natale, Steve Lynch, Anthony DeCaro, Katie Jakaub,
Charlie Green, Jim Beckwith, Bob Brower, Ron Podolak, Judy Wright, Doug Kierst, Andrew Snell, Timothy
Schneider, Michele Wunderlich, Marion Balyszak, Lisa Cleckner, Roxanne Razavi, Martha Bond, Scott Kishbaugh,
Todd Walter and David Eckhardt. Hopefully, I didn’t forget to acknowledge someone, and my apologies to those I
omitted.

Halfman et al., 2016 Water Quality Report Owasco Lake - 48
Finger Lakes Institute, Hobart & William Smith Colleges
Table 2. 2016 Lake Data.

Halfman et al., 2016 Water Quality Report Owasco Lake - 49
Finger Lakes Institute, Hobart & William Smith Colleges
Table 4. Annual Average Plankton Data from 2005 through 2016, and Daily Average Data
for 2016.
Table 5: Annual Average 2016 Lake Data from the Finger Lake Survey.

Halfman et al., 2016 Water Quality Report Owasco Lake - 50
Finger Lakes Institute, Hobart & William Smith Colleges
Table 6. 2016 Stream Data.

Halfman et al., 2016 Water Quality Report Owasco Lake - 51
Finger Lakes Institute, Hobart & William Smith Colleges
Table 6. 2016 Stream Data (continued)