Embed Size (px)
Citation preview
Overview of Overview of Overview of Overview of
Safety FUNDA-Safety FUNDA-Safety FUNDA-Safety FUNDA-
MENTALS OF MENTALS OF MENTALS OF MENTALS OF
PROJECT MAN-PROJECT MAN-PROJECT MAN-PROJECT MAN-
AGEMENTAGEMENTAGEMENTAGEMENT
Fundamentals Fundamentals Fundamentals Fundamentals
of Project of Project of Project of Project
ManagementManagementManagementManagement

Fundamentals of Project Management
WHO ARE WE? IDC Technologies is internationally acknowledged as the premier provider of practical, technical training
for engineers and technicians.
We specialize in the fields of electrical systems, industrial data communications, telecommunications,
automation and control, mechanical engineering, chemical and civil engineering, and are continually
adding to our portfolio of over 60 different workshops. Our instructors are highly respected in their fields
of expertise and in the last ten years have trained over 200,000 engineers, scientists and technicians.
With offices conveniently located worldwide, IDC Technologies has an enthusiastic team of professional
engineers, technicians and support staff who are committed to providing the highest level of training and
consultancy.
TECHNICAL WORKSHOPS TRAINING THAT WORKS We deliver engineering and technology training that will maximize your business goals. In today’s
competitive environment, you require training that will help you and your organization to achieve its goals
and produce a large return on investment. With our ‘training that works’ objective you and your
organization will:
• Get job-related skills that you need to achieve your business goals
• Improve the operation and design of your equipment and plant
• Improve your troubleshooting abilities
• Sharpen your competitive edge
• Boost morale and retain valuable staff
• Save time and money
EXPERT INSTRUCTORS We search the world for good quality instructors who have three outstanding attributes:
1. Expert knowledge and experience – of the course topic
2. Superb training abilities – to ensure the know-how is transferred effectively and quickly to you in
a practical, hands-on way
3. Listening skills – they listen carefully to the needs of the participants and want to ensure that you
benefit from the experience.
Each and every instructor is evaluated by the delegates and we assess the presentation after every class to
ensure that the instructor stays on track in presenting outstanding courses.
HANDS-ON APPROACH TO TRAINING All IDC Technologies workshops include practical, hands-on sessions where the delegates are given the
opportunity to apply in practice the theory they have learnt.
REFERENCE MATERIALS A fully illustrated workshop book with hundreds of pages of tables, charts, figures and handy hints, plus
considerable reference material is provided FREE of charge to each delegate.
ACCREDITATION AND CONTINUING EDUCATION Satisfactory completion of all IDC workshops satisfies the requirements of the International Association
for Continuing Education and Training for the award of 1.4 Continuing Education Units.
IDC workshops also satisfy criteria for Continuing Professional Development according to the
requirements of the Institution of Electrical Engineers and Institution of Measurement and Control in the
UK, Institution of Engineers in Australia, Institution of Engineers New Zealand, and others.
THIS BOOK WAS DEVELOPED BY IDC TECHNOLOGIES

CERTIFICATE OF ATTENDANCE Each delegate receives a Certificate of Attendance documenting their experience.
100% MONEY BACK GUARANTEE IDC Technologies’ engineers have put considerable time and experience into ensuring that you gain
maximum value from each workshop. If by lunchtime on the first day you decide that the workshop is not
appropriate for your requirements, please let us know so that we can arrange a 100% refund of your fee.
ONSITE WORKSHOPS All IDC Technologies Training Workshops are available on an on-site basis, presented at the venue of
your choice, saving delegates travel time and expenses, thus providing your company with even greater
savings.
OFFICE LOCATIONS AUSTRALIA • INDIA • IRELAND • MALAYSIA • NEW ZEALAND • SINGAPORE •
SOUTH AFRICA • UNITED KINGDOM • UNITED STATES
On-Site Training
All IDC Technologies Training Workshops are available on an on-site basis, presented at the venue of
your choice, saving delegates travel time and expenses, thus providing your company with even
greater savings.
For more information or a FREE detailed proposal contact Kevin Baker by e-mailing:
[email protected] www.idc-online.com
Visit our website for FREE Pocket Guides IDC Technologies produce a set of 6 Pocket Guides used by
thousands of engineers and technicians worldwide. Vol. 1 – ELECTRONICS Vol. 4 – INSTRUMENTATION Vol. 2 – ELECTRICAL Vol. 5 – FORMULAE & CONVERSIONS Vol. 3 – COMMUNICATIONS Vol. 6 – INDUSTRIAL AUTOMATION
To download a FREE copy of these internationally best selling pocket guides go to:
www.idc-online.com/downloads/
SAVE MORE THAN 50% OFF the per person
cost
CUSTOMISE the training to YOUR WORKPLACE!
Have the training delivered WHEN
AND WHERE you need it!

IDC TECHNOLOGIES Worldwide Offices
AUSTRALIA
Telephone: 1300 138 522 • Facsimile: 1300 138 533
West Coast Office
1031 Wellington Street, West Perth, WA 6005 PO Box 1093, West Perth, WA 6872
INDIA
Telephone : +91 44 3061 8525 131 G.N. Chetty Road, Chennai 600017
IRELAND
Telephone : +353 1 473 3190 • Facsimile: +353 1 473 3191 Caoran, Baile na hAbhann, Co. Galway
MALAYSIA
Telephone: +60 3 5192 3800 • Facsimile: +60 3 5192 3801 26 Jalan Kota Raja E27/E, Hicom Town Center
Seksyen 27, 40400 Shah Alam, Selangor
NEW ZEALAND Telephone: +64 9 263 4759 • Facsimile: +64 9 262 2304
Parkview Towers, 28 Davies Avenue, Manukau City PO Box 76-142, Manukau City
SINGAPORE
Telephone: +65 6224 6298 • Facsimile: + 65 6224 7922 100 Eu Tong Sen Street, #04-11 Pearl’s Centre, Singapore 059812
SOUTH AFRICA
Telephone: +27 87 751 4294 or +27 79 629 5706 • Facsimile: +27 86 692 4368 68 Pretorius Street, President Park, Midrand
PO Box 389, Halfway House 1685
UNITED KINGDOM Telephone: +44 20 8335 4014 • Facsimile: +44 20 8335 4120
Suite 18, Fitzroy House, Lynwood Drive, Worcester Park, Surrey KT4 7AT
UNITED STATES Toll Free Telephone: 1800 324 4244 • Toll Free Facsimile: 1800 434 4045
10685-B Hazelhurst Dr. # 6175, Houston, TX 77043, USA
Website: www.idc-online.com Email: [email protected]

Presents
Practical
Project Management for Engineers and Technicians
Revision 6
Website: www.idc-online.com
E-mail: [email protected]
IDC Technologies Pty Ltd
PO Box 1093, West Perth, Western Australia 6872
Offices in Australia, New Zealand, Singapore, United Kingdom, Ireland, Malaysia, Poland, United States of
America, Canada, South Africa and India
Copyright © IDC Technologies 2012. All rights reserved.
First published 2002
ISBN: 978-1-921716-54-6
All rights to this publication, associated software and workshop are reserved. No part of this publication
may be reproduced, stored in a retrieval system or transmitted in any form or by any means electronic,
mechanical, photocopying, recording or otherwise without the prior written permission of the publisher. All
enquiries should be made to the publisher at the address above.
Disclaimer
Whilst all reasonable care has been taken to ensure that the descriptions, opinions, programs, listings,
software and diagrams are accurate and workable, IDC Technologies do not accept any legal responsibility
or liability to any person, organization or other entity for any direct loss, consequential loss or damage,
however caused, that may be suffered as a result of the use of this publication or the associated workshop
and software.
In case of any uncertainty, we recommend that you contact IDC Technologies for clarification or assistance.
Trademarks All logos and trademarks belong to, and are copyrighted to, their companies respectively.
Acknowledgements
IDC Technologies expresses its sincere thanks to all those engineers and technicians on our training
workshops who freely made available their expertise in preparing this manual.
Contents
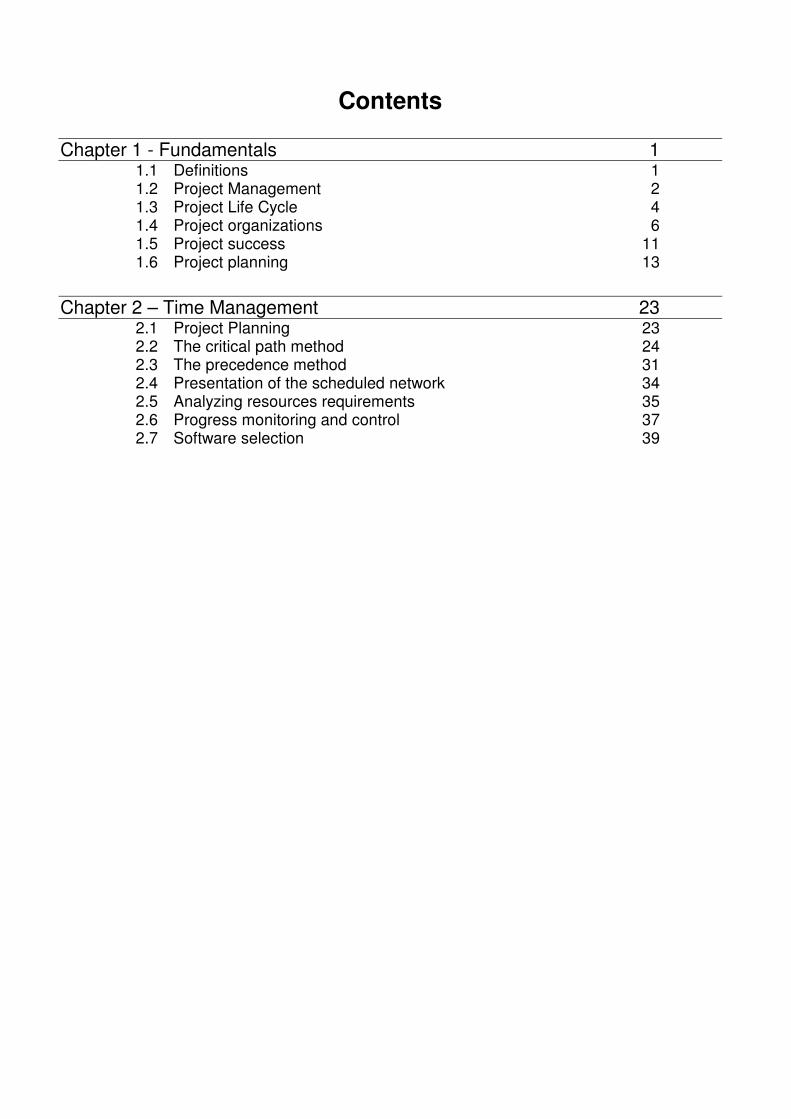
Chapter 1 - Fundamentals 1 1.1 Definitions 1 1.2 Project Management 2 1.3 Project Life Cycle 4 1.4 Project organizations 6 1.5 Project success 11 1.6 Project planning 13
Chapter 2 – Time Management 23 2.1 Project Planning 23 2.2 The critical path method 24 2.3 The precedence method 31 2.4 Presentation of the scheduled network 34 2.5 Analyzing resources requirements 35 2.6 Progress monitoring and control 37 2.7 Software selection 39
1
Fundamentals
Learning objectives
The objective of this chapter is to:
• Provide an introduction to the concept of project management. This includes
fundamental definitions, basic project management functions, project life cycles
and phases
• Review the types and influences of alternative organization structures, with respect
to both the organizations within which projects are undertaken, and the
organization of the project team
• Review the issues fundamental to successful project outcomes
• Review the essential elements of effective project planning and control
This overview will show how the specific planning and control techniques introduced during the
course are incorporated into the project management function.
These concepts are applicable to the management of projects of any type. While specific industries
and certain types of projects will often require specialist knowledge to effectively plan and control
the project, the principles outlined in this course will generally apply in all cases.
The definitions and techniques presented here are generally accepted within the project
management discipline. That is; their application is widespread, and there is consensus about their
value.
1.1 Definitions
1.1.1 Project
Performance of work by organisations may be said to involve either operations or projects,
although there may be some overlap.
Operations and projects share a number of characteristics in that they are:
• Planned, executed, and controlled
• Constrained by resource limitations
• Performed by people
2 Practical project management for engineers and technicians
2
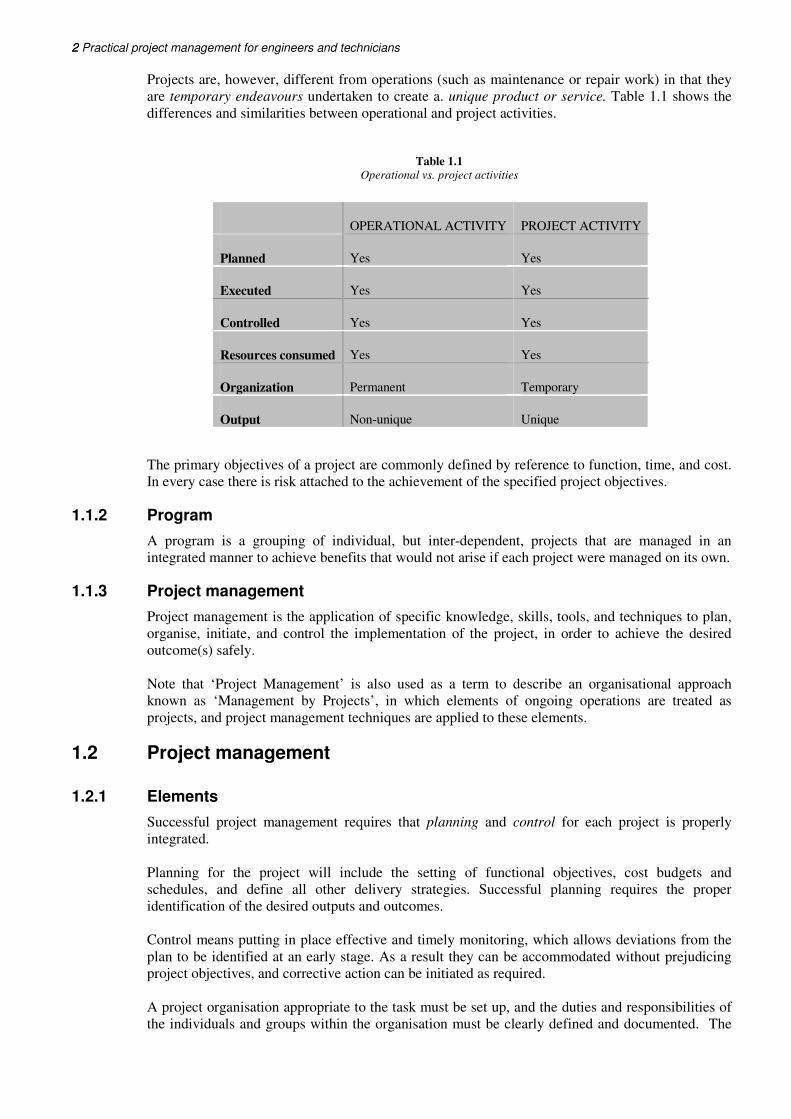
Projects are, however, different from operations (such as maintenance or repair work) in that they
are temporary endeavours undertaken to create a. unique product or service. Table 1.1 shows the
differences and similarities between operational and project activities.
Table 1.1
Operational vs. project activities
The primary objectives of a project are commonly defined by reference to function, time, and cost.
In every case there is risk attached to the achievement of the specified project objectives.
1.1.2 Program
A program is a grouping of individual, but inter-dependent, projects that are managed in an
integrated manner to achieve benefits that would not arise if each project were managed on its own.
1.1.3 Project management
Project management is the application of specific knowledge, skills, tools, and techniques to plan,
organise, initiate, and control the implementation of the project, in order to achieve the desired
outcome(s) safely.
Note that ‘Project Management’ is also used as a term to describe an organisational approach
known as ‘Management by Projects’, in which elements of ongoing operations are treated as
projects, and project management techniques are applied to these elements.
1.2 Project management
1.2.1 Elements
Successful project management requires that planning and control for each project is properly
integrated.
Planning for the project will include the setting of functional objectives, cost budgets and
schedules, and define all other delivery strategies. Successful planning requires the proper
identification of the desired outputs and outcomes.
Control means putting in place effective and timely monitoring, which allows deviations from the
plan to be identified at an early stage. As a result they can be accommodated without prejudicing
project objectives, and corrective action can be initiated as required.
A project organisation appropriate to the task must be set up, and the duties and responsibilities of
the individuals and groups within the organisation must be clearly defined and documented. The
OPERATIONAL ACTIVITY PROJECT ACTIVITY
Planned Yes Yes
Executed Yes Yes
Controlled Yes Yes
Resources consumed Yes Yes
Organization Permanent Temporary
Output Non-unique Unique
Fundamentals
3
lack of clear definition of structure and responsibilities leads to problems with authority,
communication, co-ordination and management.
The project management procedures put in place for the project must ensure that monitoring is
focused on the key factors that the results obtained by monitoring are timely as well as accurate,
and that effective control systems are established and properly applied by the project team. Project
management involves five basic processes:
• Initiating: Undertaking the necessary actions to commence the project or
project phase
• Planning: Identifying objectives and devising effective means to achieve them
• Executing: Co-ordinating the required resources to implement the plan
• Controlling: Monitoring of the project and taking corrective action where
necessary
• Closing: Formalising the acceptance of the project or phase deliverables (the
‘handover’), and terminating the project in a controlled manner
Within each of these processes there are a number of sub-process involved, all linked via their
inputs and outputs. Each sub-process involves the application of skills and techniques to convert
inputs to outputs. An example of this is the preparation of a project network diagram (output) by
the application of the precedence method (technique) to the identified project activities (input).
1.2.2 The professional body of knowledge
Project management has developed as a professional discipline since the 1950s. It is claimed,
reasonably, that the military was the first institution that adopted planning and control processes
that could be characterized as formal project management – specifically for the Normandy
invasion, and subsequently for the Manhattan Project. Since the 1970s there has been a sustained
development of project management as a professional discipline.
There are professional project management bodies in most countries. In Australia the professional
organisation is the Australian Institute for Project Management. In New Zealand it is the New
Zealand Chapter of the Project Management Institute (PMI). The international body is the
International Project Management Association.
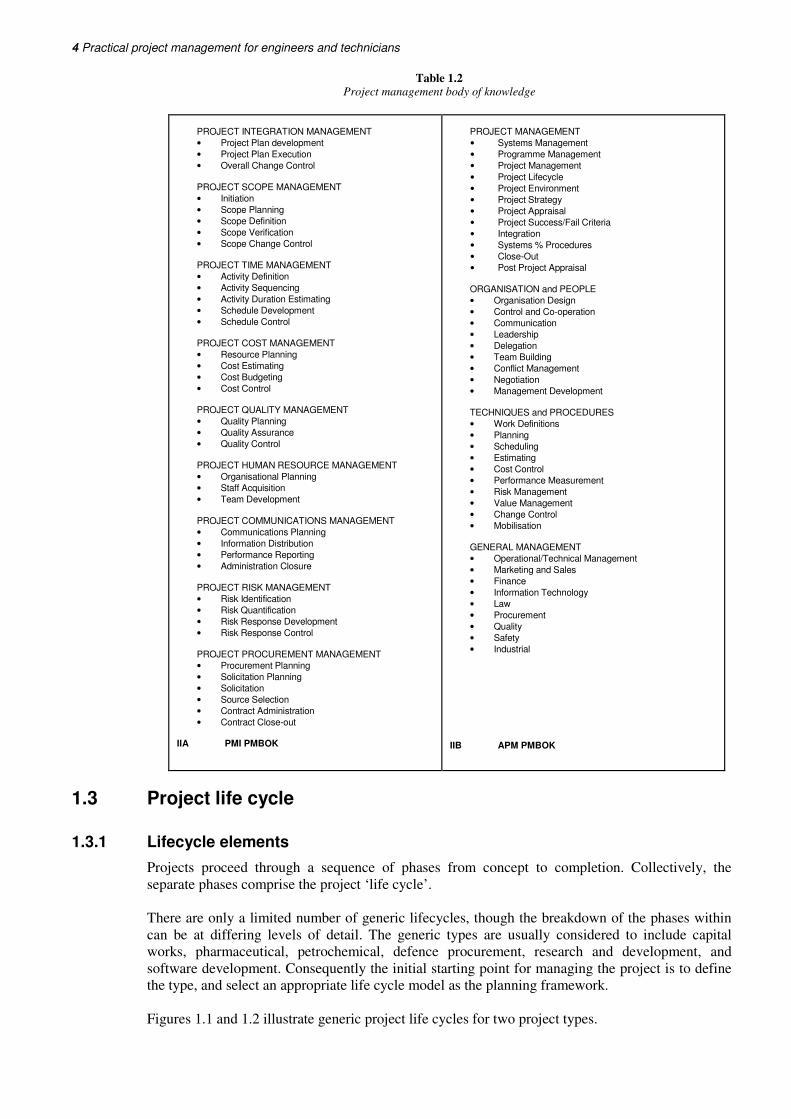
In defining the knowledge base for project management it is useful to refer to the structures
adopted by the PMI in the USA and the Association for Project Management (APM) in the UK.
Their web addresses are www.pmi.org and www.apm.org.uk respectively.
4 Practical project management for engineers and technicians
4
Table 1.2 Project management body of knowledge
PROJECT INTEGRATION MANAGEMENT
• Project Plan development
• Project Plan Execution
• Overall Change Control PROJECT SCOPE MANAGEMENT
• Initiation
• Scope Planning
• Scope Definition
• Scope Verification
• Scope Change Control PROJECT TIME MANAGEMENT
• Activity Definition
• Activity Sequencing
• Activity Duration Estimating
• Schedule Development
• Schedule Control PROJECT COST MANAGEMENT
• Resource Planning
• Cost Estimating
• Cost Budgeting
• Cost Control PROJECT QUALITY MANAGEMENT
• Quality Planning
• Quality Assurance
• Quality Control
PROJECT HUMAN RESOURCE MANAGEMENT
• Organisational Planning
• Staff Acquisition
• Team Development PROJECT COMMUNICATIONS MANAGEMENT
• Communications Planning
• Information Distribution
• Performance Reporting
• Administration Closure PROJECT RISK MANAGEMENT
• Risk Identification
• Risk Quantification
• Risk Response Development
• Risk Response Control PROJECT PROCUREMENT MANAGEMENT
• Procurement Planning
• Solicitation Planning
• Solicitation
• Source Selection
• Contract Administration
• Contract Close-out
IIA PMI PMBOK
PROJECT MANAGEMENT
• Systems Management
• Programme Management
• Project Management
• Project Lifecycle
• Project Environment
• Project Strategy
• Project Appraisal
• Project Success/Fail Criteria
• Integration
• Systems % Procedures
• Close-Out
• Post Project Appraisal ORGANISATION and PEOPLE
• Organisation Design
• Control and Co-operation
• Communication
• Leadership
• Delegation
• Team Building
• Conflict Management
• Negotiation
• Management Development TECHNIQUES and PROCEDURES
• Work Definitions
• Planning
• Scheduling
• Estimating
• Cost Control
• Performance Measurement
• Risk Management
• Value Management
• Change Control
• Mobilisation GENERAL MANAGEMENT
• Operational/Technical Management
• Marketing and Sales
• Finance
• Information Technology
• Law
• Procurement
• Quality
• Safety
• Industrial
IIB APM PMBOK
1.3 Project life cycle
1.3.1 Lifecycle elements
Projects proceed through a sequence of phases from concept to completion. Collectively, the
separate phases comprise the project ‘life cycle’.
There are only a limited number of generic lifecycles, though the breakdown of the phases within
can be at differing levels of detail. The generic types are usually considered to include capital
works, pharmaceutical, petrochemical, defence procurement, research and development, and
software development. Consequently the initial starting point for managing the project is to define
the type, and select an appropriate life cycle model as the planning framework.
Figures 1.1 and 1.2 illustrate generic project life cycles for two project types.
Fundamentals
5
Pre-feasibility
Feasibility
Planning
Implementation
Handover
Close Out
Figure 1.1 Project life cycle: capital works project
Needs Determination
Concept Exploration and Definition
Demonstration and Validation
Engineering and Manufacturing Development
Production and Deployment
Operations and Support
Figure 1.2 Project life cycle: defence acquisition project
1.3.2 Project phases
Different industries generally have specific standard definitions for each phase, but a generic
description of each phase identified in Figure 1.1 for a capital works project is:
• Pre-feasibility: Identification of needs, and preliminary validation of concept
options
• Feasibility: Detailed investigation of feasibility, including preliminary brief,
project estimate and investment analysis
• Planning: Detailed definition of the project with respect to scope,
organisation, budget, and schedule, together with definition of all control
procedures
• Implementation: The execution of the scoped project. The components of
this phase will depend upon the nature of the project
• Handover: Passing the facility into the control of the principal. This includes
formal handover of the facilities, user training, operating and maintenance
documentation etc.
6 Practical project management for engineers and technicians
6
• Close out: Archiving of the project records, establishing appropriate
performance evaluations, capturing and transferring lessons learned, and
dissolving the project organisation
Project phases share defined characteristics.
• In every instance project management processes undertaken with a specific
phase comprise initiating, planning, executing, controlling, and closing.
• A project phase will have one or more tangible deliverables. Typical
deliverables include work products such as feasibility studies, software
functional specifications, product designs, completed structures, etc.
• Outputs from a phase are typically the inputs to the succeeding phase
Normally, deliverables from any phase require formal approval before the succeeding phase
commences. This can be imposed through the scheduling of compulsory ‘milestones’ (e.g. design
reviews) between phases.
1.4 Project organizations
1.4.1 General
Where projects are set up within existing organisations, the structure and culture of the parent
organisation has great influence on the project, and will be a deciding factor in whether or not there
is a successful outcome. Where the project team is outside the sponsoring or client organisation,
that organisation may exert significant influence on the project.
The organisation of the project team also directly influences the probability of achieving a
successful outcome. The benefits and disadvantages of the various options for project team
organization need to be appreciated.
1.4.2 Projects within existing organizations
Organisational structures have traditionally been defined within the spectrum from fully functional
to fully project oriented. Between those extremes lie a range of matrix structures.
The classic functional structure is a hierarchy, with staff grouped within specialist functions (e.g.
mechanical engineering, accounting etc.), with each staff member reporting directly to one
superior. Such organisations do manage projects that extend beyond the boundaries of a division,
but within a division the scope of the project is considered only as it exists within the boundary of
that division. Project issues and conflicts are resolved by the functional heads.
In a project management organization the staff are grouped by project, and each group headed by a
project manager who operates with a high level of authority and independence. Where departments
co-exist with the project groups, these generally provide support services to the project groups.
Matrix organisations may lie anywhere between the above. A matrix approach applies a project
overlay to a functional structure. Characteristics of matrix organisations may be summarised as
follows:
• Weak matrix organizations are those closely aligned to a functional
organization, but with projects set up across the functional boundaries under
the auspices of a project co-ordinator. The project co-ordinator does not have
the authority that would be vested in a project manager
• A strong matrix organization would typically have a formal project group as
one of the divisions. Project managers from within this group (often with the
necessary support staff) manage projects where specialist input is provided
from the various functional groups. The project managers have considerable
authority, and the functional managers are more concerned with the technical
standards achieved within their division than with the overall project execution
Fundamentals
7
• In a balanced matrix the project management is exercised by personnel within
functional divisions who have been given the appropriate authority necessary
to manage specific projects effectively
The different organizational structures, and the corresponding project organization options, are
identified in Figure 1.3. In many cases an organization may involve a mix of these structures at
different levels within the hierarchy. For example, a functional organization will commonly set up
a specific project team with a properly authorized project manager to handle a critical project.
The influence of the organisation structure on various project parameters is illustrated in Figure 1.3.
While a matrix approach may be seen as providing an inadequate compromise, in reality it is often
the only realistic option to improve the performance of a functional organization. It does work, but
there are some trade-offs. One factor critical to the effectiveness of the matrix structure is the
authority vested in the person responsible for delivery of the project. A key predictor of project
performance is the title of this person i.e. whether he/she is identified as a ‘project manager’, or
something else.
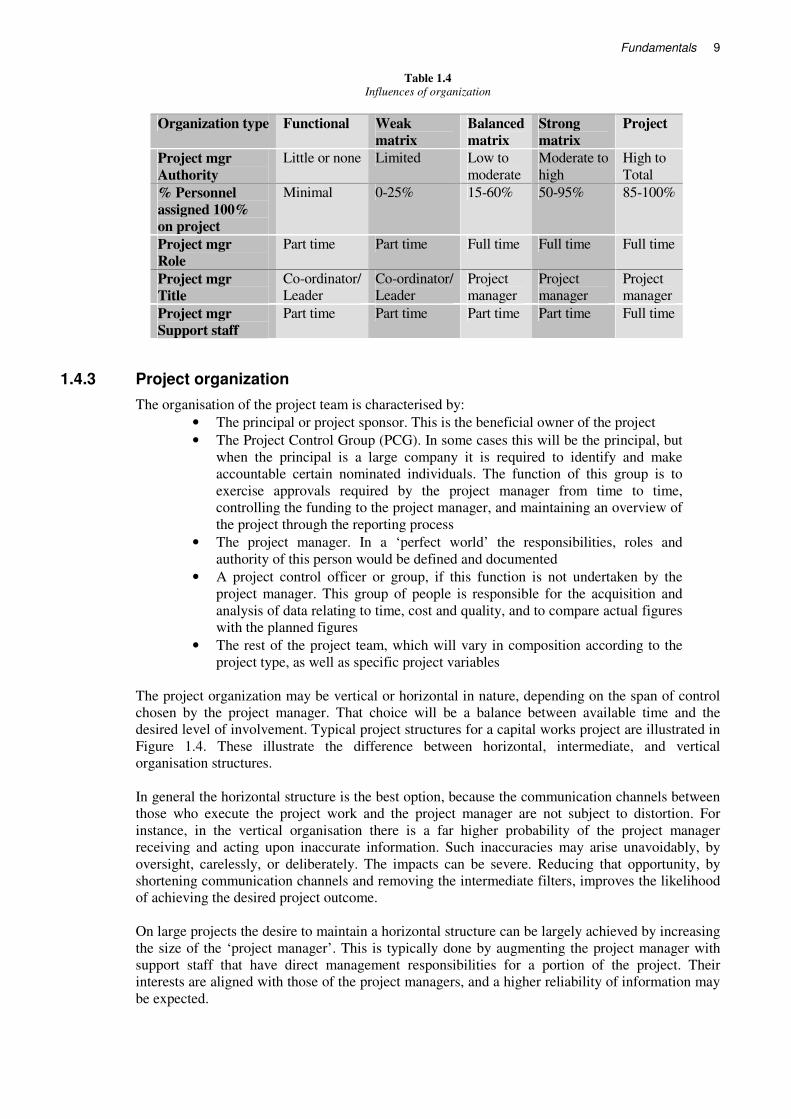
Briefly, the benefits and disadvantages of the matrix approach include (see Table 1.3), also see
Table 1.4: Table 1.3
Matrix benefits and disadvantages
Benefits Disadvantages
All projects can access a strong technical base Dual reporting structures causes conflict
Good focus on project objectives Competition between projects for resources
Sharing of key people is efficient There may be duplication of effort
Rapid responses to changes Management and project goals in conflict
Individuals have a protected career path
8 Practical project management for engineers and technicians
8
CEO
Functional Manager
A: Functional Organization
Functional Manager
Functional Manager
Staff
Staff Staff
Staff Staff
CEO
Project Manager
B: Project Organization
Project Manager
Staff Staff
Staff Staff
Staff Staff
Staff
Staff
Staff
Staff
Staff
Staff
Staff
Project Manager
CEO
Functional Manager
C: Weak Matrix Organization
Functional Manager
Functional Manager
Staff Staff Staff
Staff Staff Staff
CEO
Functional Manager
D: Balanced Matrix
Functional Manager
Functional Manager
Staff Staff Staff
Staff Staff Staff
StaffStaff Pri-Coord’r StaffStaff P Mgr
CEO
Functional Manager
E: Strong Matrix Organization
Functional Manager
Functional Manager
Staff Staff Staff
Staff
Staff Staff Staff
Proj Mgt Manager
Proj Mgr
Proj Mgr
Proj Mgr
Project
KEY
Span of Project
Personnel assigned to Project
StaffStaff Staff
Figure 1.3 Project structures within organizations
Fundamentals
9
Table 1.4 Influences of organization
Organization type Functional Weak
matrix
Balanced
matrix
Strong
matrix
Project
Project mgr
Authority
Little or none Limited Low to
moderate
Moderate to
high
High to
Total
% Personnel
assigned 100%
on project
Minimal 0-25% 15-60% 50-95% 85-100%
Project mgr
Role
Part time Part time Full time Full time Full time
Project mgr
Title
Co-ordinator/
Leader
Co-ordinator/
Leader
Project
manager
Project
manager
Project
manager
Project mgr
Support staff
Part time Part time Part time Part time Full time
1.4.3 Project organization
The organisation of the project team is characterised by:
• The principal or project sponsor. This is the beneficial owner of the project
• The Project Control Group (PCG). In some cases this will be the principal, but
when the principal is a large company it is required to identify and make
accountable certain nominated individuals. The function of this group is to
exercise approvals required by the project manager from time to time,
controlling the funding to the project manager, and maintaining an overview of
the project through the reporting process
• The project manager. In a ‘perfect world’ the responsibilities, roles and
authority of this person would be defined and documented
• A project control officer or group, if this function is not undertaken by the
project manager. This group of people is responsible for the acquisition and
analysis of data relating to time, cost and quality, and to compare actual figures
with the planned figures
• The rest of the project team, which will vary in composition according to the
project type, as well as specific project variables
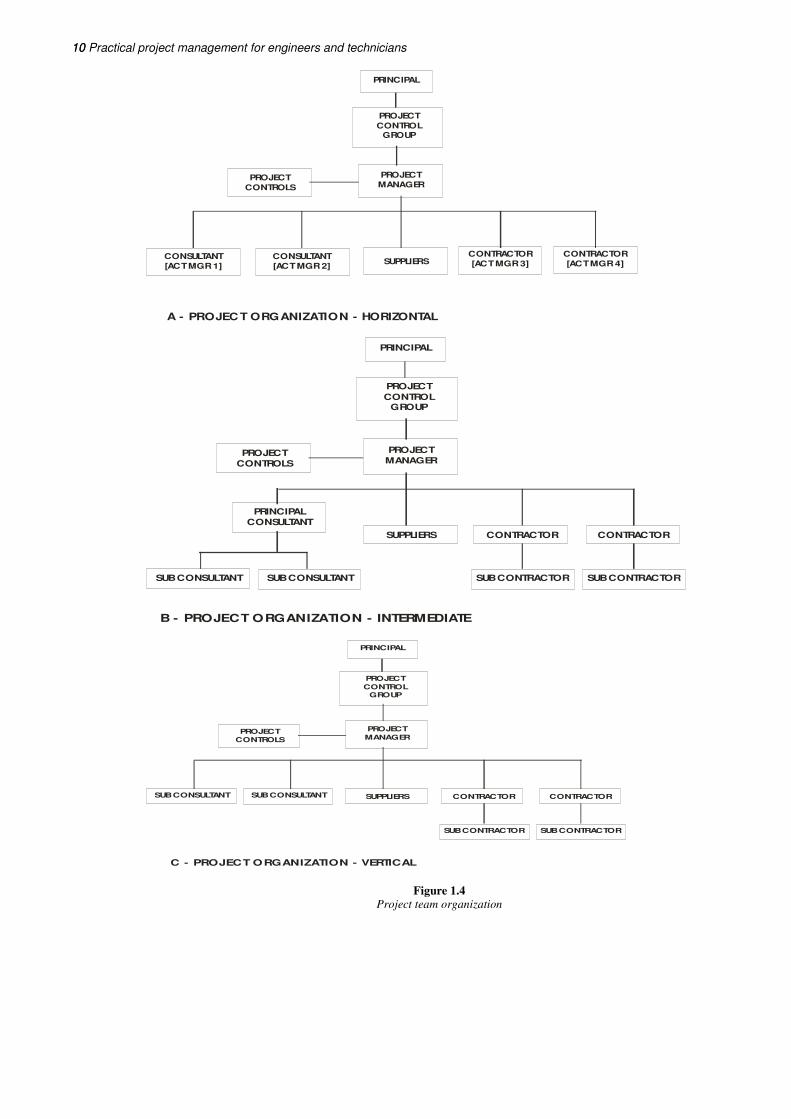
The project organization may be vertical or horizontal in nature, depending on the span of control
chosen by the project manager. That choice will be a balance between available time and the
desired level of involvement. Typical project structures for a capital works project are illustrated in
Figure 1.4. These illustrate the difference between horizontal, intermediate, and vertical
organisation structures.
In general the horizontal structure is the best option, because the communication channels between
those who execute the project work and the project manager are not subject to distortion. For
instance, in the vertical organisation there is a far higher probability of the project manager
receiving and acting upon inaccurate information. Such inaccuracies may arise unavoidably, by
oversight, carelessly, or deliberately. The impacts can be severe. Reducing that opportunity, by
shortening communication channels and removing the intermediate filters, improves the likelihood
of achieving the desired project outcome.
On large projects the desire to maintain a horizontal structure can be largely achieved by increasing
the size of the ‘project manager’. This is typically done by augmenting the project manager with
support staff that have direct management responsibilities for a portion of the project. Their
interests are aligned with those of the project managers, and a higher reliability of information may
be expected.
10 Practical project management for engineers and technicians
10
PRINCIPAL
PROJECT
CONTROLGROUP
PROJECT
MANAGERPROJECT
CONTROLS
SUPPLIERSCONTRACTOR
[ACT MGR 3]
CONTRACTOR
[ACT MGR 4]CONSULTANT
[ACT MGR 1]
A - PROJECT ORGANIZATION - HORIZONTAL
CONSULTANT
[ACT MGR 2]
PRINCIPAL
PROJECT
CONTROLGROUP
PROJECT
MANAGERPROJECT
CONTROLS
PRINCIPAL
CONSULTANT
SUPPLIERS CONTRACTOR CONTRACTOR
SUB CONTRACTORSUB CONTRACTORSUB CONSULTANTSUB CONSULTANT
B - PROJECT ORGANIZATION - INTERMEDIATE
PRINCIPAL
PROJECT
CONTROLGROUP
PROJECT
MANAGERPROJECT
CONTROLS
SUPPLIERS CONTRACTOR CONTRACTOR
SUB CONTRACTORSUB CONTRACTOR
SUB CONSULTANTSUB CONSULTANT
C - PROJECT ORGANIZATION - VERTICAL
Figure 1.4 Project team organization
Fundamentals
11
1.5 Project success
1.5.1 General
Many projects qualify as successes, but we all have experience, anecdotal or otherwise, of projects
that have gone severely wrong. Project failures exist within all industries. Even today, with the
level of awareness for project management processes as well as advanced tools, there are
spectacular failures. These occur even on very large projects where it is assumed that the
investment in management is high. The consequences of failure can be significant to the sponsoring
organisations as well as project personnel.
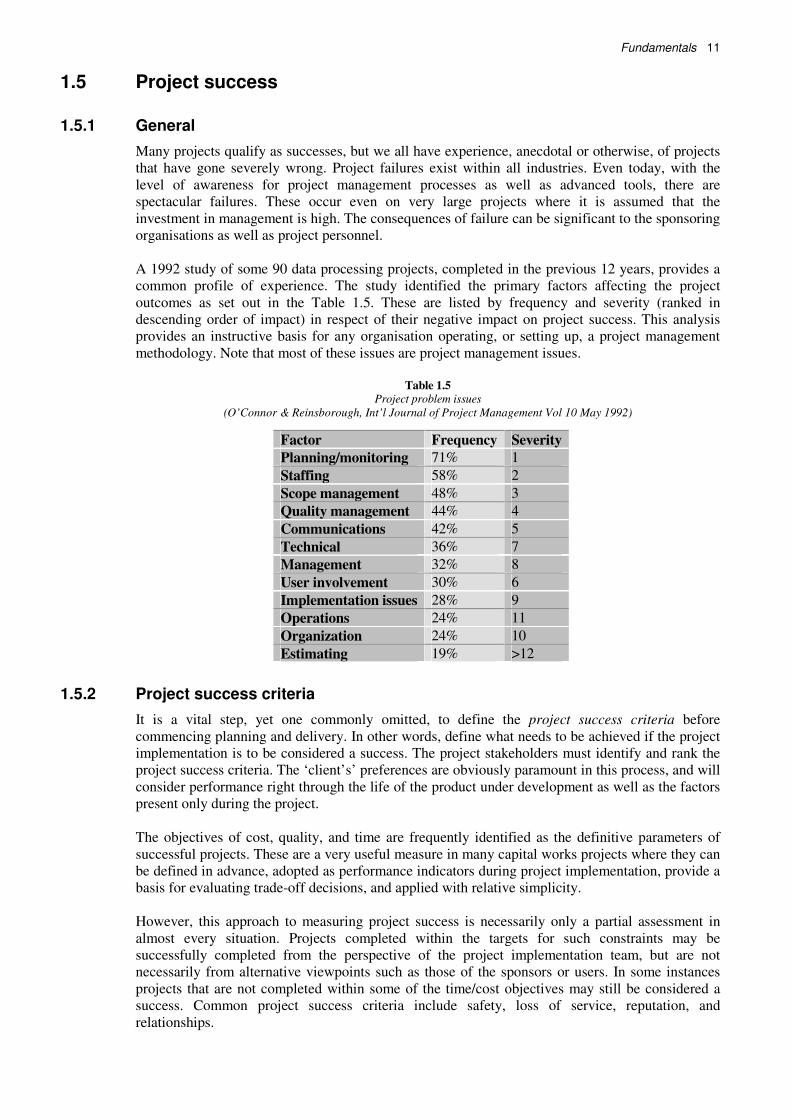
A 1992 study of some 90 data processing projects, completed in the previous 12 years, provides a
common profile of experience. The study identified the primary factors affecting the project
outcomes as set out in the Table 1.5. These are listed by frequency and severity (ranked in
descending order of impact) in respect of their negative impact on project success. This analysis
provides an instructive basis for any organisation operating, or setting up, a project management
methodology. Note that most of these issues are project management issues.
Table 1.5
Project problem issues
(O’Connor & Reinsborough, Int’l Journal of Project Management Vol 10 May 1992)
1.5.2 Project success criteria
It is a vital step, yet one commonly omitted, to define the project success criteria before
commencing planning and delivery. In other words, define what needs to be achieved if the project
implementation is to be considered a success. The project stakeholders must identify and rank the
project success criteria. The ‘client’s’ preferences are obviously paramount in this process, and will
consider performance right through the life of the product under development as well as the factors
present only during the project.
The objectives of cost, quality, and time are frequently identified as the definitive parameters of
successful projects. These are a very useful measure in many capital works projects where they can
be defined in advance, adopted as performance indicators during project implementation, provide a
basis for evaluating trade-off decisions, and applied with relative simplicity.
However, this approach to measuring project success is necessarily only a partial assessment in
almost every situation. Projects completed within the targets for such constraints may be
successfully completed from the perspective of the project implementation team, but are not
necessarily from alternative viewpoints such as those of the sponsors or users. In some instances
projects that are not completed within some of the time/cost objectives may still be considered a
success. Common project success criteria include safety, loss of service, reputation, and
relationships.
Factor Frequency Severity
Planning/monitoring 71% 1
Staffing 58% 2
Scope management 48% 3
Quality management 44% 4
Communications 42% 5
Technical 36% 7
Management 32% 8
User involvement 30% 6
Implementation issues 28% 9
Operations 24% 11
Organization 24% 10
Estimating 19% >12
12 Practical project management for engineers and technicians
12
The process of defining ranked success criteria provides surprising insights in many instances, and
enhances project planning. During project implementation the project success criteria provide a
meaningful basis for establishing project performance indicators to be incorporated within project
progress reports. They are also helpful in making trade-offs, should that become necessary.
1.5.3 Critical success factors
The results of a study of the critical success factors in projects, published in the June 1996 issue of
the International Journal of Project Management, proposes a framework for determining critical
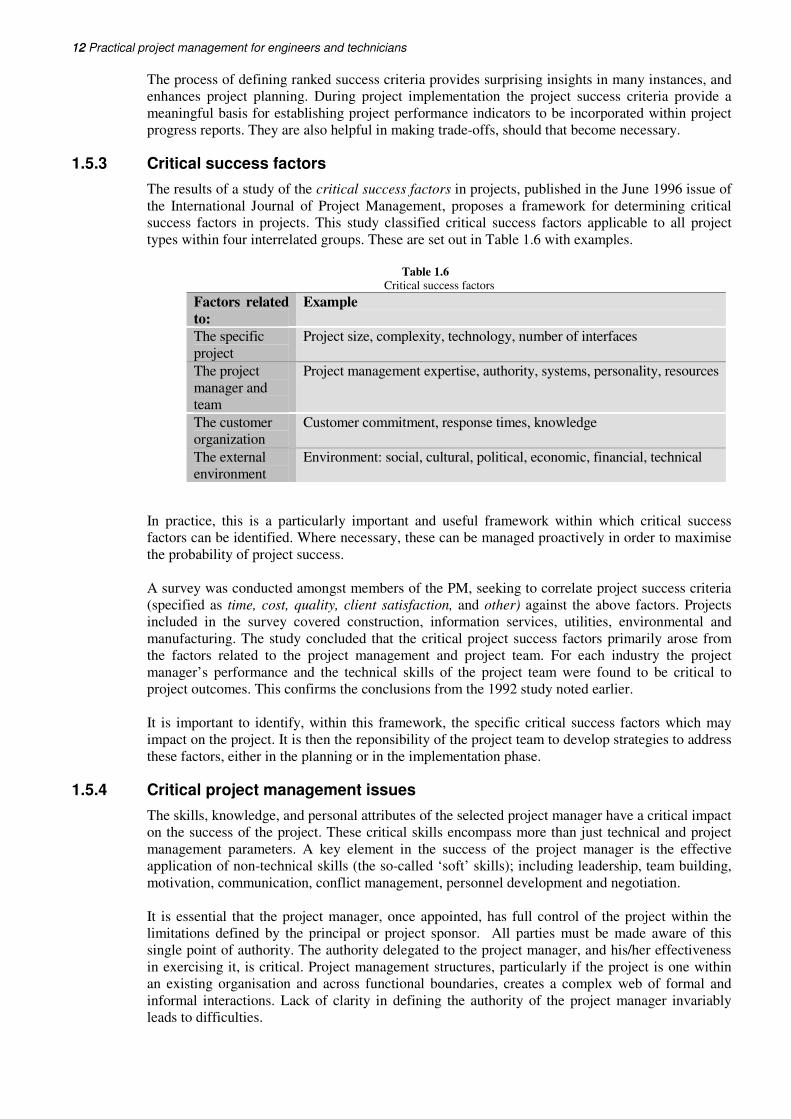
success factors in projects. This study classified critical success factors applicable to all project
types within four interrelated groups. These are set out in Table 1.6 with examples.
Table 1.6
Critical success factors
Factors related
to:
Example
The specific
project
Project size, complexity, technology, number of interfaces
The project
manager and
team
Project management expertise, authority, systems, personality, resources
The customer
organization
Customer commitment, response times, knowledge
The external
environment
Environment: social, cultural, political, economic, financial, technical
In practice, this is a particularly important and useful framework within which critical success
factors can be identified. Where necessary, these can be managed proactively in order to maximise
the probability of project success.
A survey was conducted amongst members of the PM, seeking to correlate project success criteria
(specified as time, cost, quality, client satisfaction, and other) against the above factors. Projects
included in the survey covered construction, information services, utilities, environmental and
manufacturing. The study concluded that the critical project success factors primarily arose from
the factors related to the project management and project team. For each industry the project
manager’s performance and the technical skills of the project team were found to be critical to
project outcomes. This confirms the conclusions from the 1992 study noted earlier.
It is important to identify, within this framework, the specific critical success factors which may
impact on the project. It is then the reponsibility of the project team to develop strategies to address
these factors, either in the planning or in the implementation phase.
1.5.4 Critical project management issues
The skills, knowledge, and personal attributes of the selected project manager have a critical impact
on the success of the project. These critical skills encompass more than just technical and project
management parameters. A key element in the success of the project manager is the effective
application of non-technical skills (the so-called ‘soft’ skills); including leadership, team building,
motivation, communication, conflict management, personnel development and negotiation.
It is essential that the project manager, once appointed, has full control of the project within the
limitations defined by the principal or project sponsor. All parties must be made aware of this
single point of authority. The authority delegated to the project manager, and his/her effectiveness
in exercising it, is critical. Project management structures, particularly if the project is one within
an existing organisation and across functional boundaries, creates a complex web of formal and
informal interactions. Lack of clarity in defining the authority of the project manager invariably
leads to difficulties.
Fundamentals
13
The appointment of the project manager should ideally be made sufficiently early in the project to
include management of the feasibility studies. The project manager should be appointed in order to
undertake the project definition. If the project manager is not involved in the project definition
phase, the outputs of this phase (project plan, control procedures, etc.) must be specifically signed
off by the project manager when subsequently appointed to that role.
1.6 Project planning
1.6.1 The project quality plan
“PROJECTS BADLY PLANNED ARE PROJECTS PLANNED TO FAIL”
The project planning phase is critical to the effective implementation and control of the project and
the basis for project success is established during this phase. The planning undertaken at this stage
is the responsibility of the project manager. The primary output from this phase is the Project
Quality Plan (PQP). The basic element required to properly define the PQP is the Work Breakdown
Structure or WBS.
The PQP comprises the following:
• The PQP sign-off
• The statement of project objectives
• The project charter
• The project plan
• Project control procedures
Note: here lies an inconvenience of terminology. The PQP is much more than a plan for
incorporating quality into the project. There is a comnponent within the PQP that deals exclusively
with quality issues per se.
1.6.2 PQP sign off, project objectives, project charter
PQP sign-off
This is a formal record of the agreement, signed by the Project Manager as well as the PCG of the
PQP. It is confirmation of approval of the plan (e.g. what is to be done, when, who, at what cost
etc) and the processes involved if the desired outcomes are to be achieved.
Project objectives
This is a statement defining the project objectives. The confirmed Project Success Criteria should
be included, together with quantified measures. Unquantified objectives introduce a high degree of
risk to the process, by reducing the ability to measure divergences at an early stage.
Project charter
Management’s commitment to internal projects (and hence the willingness to make available the
required resources), as well as formal delegation of authorities to the project manager, are recorded
here.
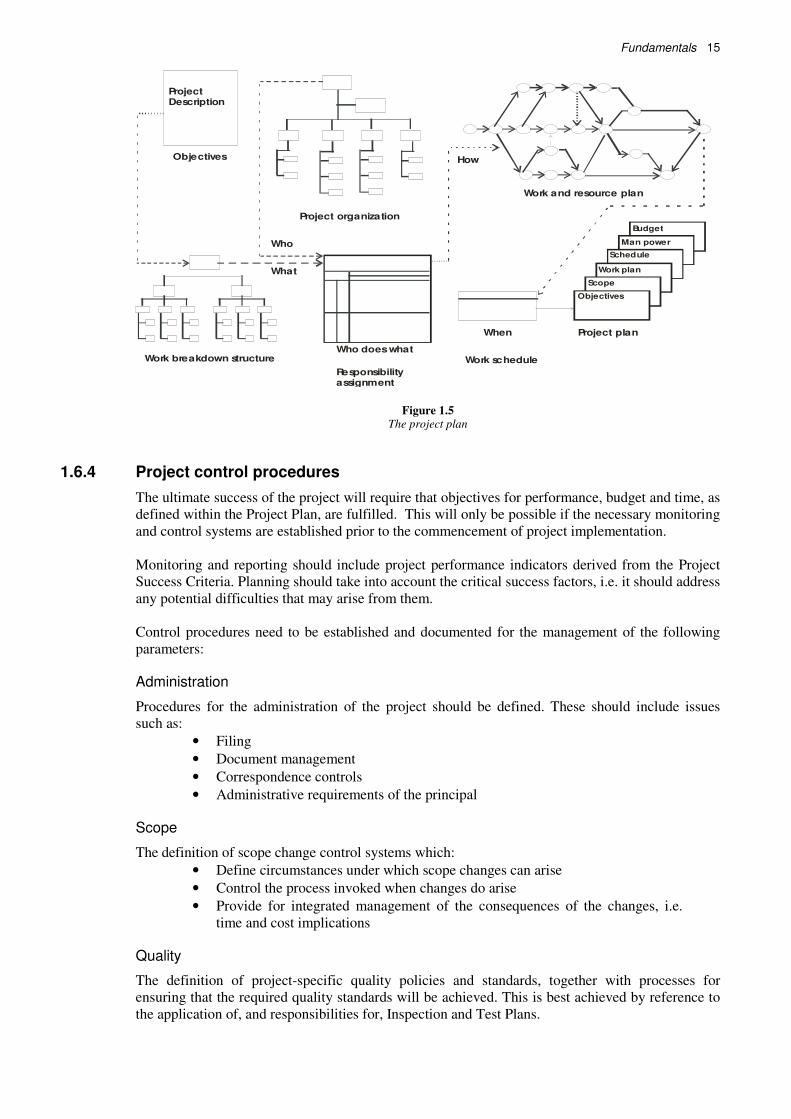
1.6.3 The project plan
The Project Plan is the master plan for the execution of the project, and provides the framework
from which the implementation will develop in a co-ordinated and controlled manner. The project
scope definition, programme and budget are established at this time. These provide the baseline
against which performance can be measured, and against which approved changes to the project
baseline can be properly evaluated. The Project Plan comprises the following components:
14 Practical project management for engineers and technicians
14
Scope definition
A written scope statement that defines, in appropriate detail, the scope of every project component
and identifies all significant project deliverables. In this context ‘scope’ includes features and
functions of products and/or services, and work to be undertaken to deliver a conforming output
Work breakdown structure
A Work Breakdown Structure (WBS) is the breakdown of the project into the separate activities
that can be considered entities for the purpose of task assignment and responsibilities. The WBS is
generally presented in a product-oriented hierarchical breakdown. Successive levels include
increasingly detailed descriptions of the project elements. The lowest level items are referred to as
work packages and these are assignable to individuals within the project team, or to subcontractors.
Orgonization breakdown structure
The Organization Breakdown Structure (OBS) involves the definition of the project structure,
setting out the parties and individuals involved in the execution of the project. It also formalizes the
lines of communication and control that will be followed.
Task assignment
This is a list of the assignment tasks and responsibilities. All tasks and activities previously
defined become the responsibility of specified parties. The WBS and OBS may be extended to
define a ‘task assignment matrix’.
Project schedule
The preliminary master schedule for the project identifies the target milestones for the project, and
the relative phasing of the components.
Project budget
In some cases a project budget is established during the feasibility study, without the benefit of
adequate detail of the concepts evaluated. At that stage a maximum cost may have been
established, because expenditure above that figure would cause the project not to be economically
viable. Where such a constraint exists, and if the feasibility study has not reliably established the
cost of the project, it will be necessary to further develop the design before committing to the
project.
Miscellaneous plans
Additional plans may need to be documented here. These include, inter alia, consultations and
risk management. Alternatively, a strategy for these can be defined in the section dealing with
project controls.
Documentation
All of the above project elements must be documented in the Project Plan. Figure 1.5 shows the
inter-relationships of all these entities.
Fundamentals
15
ProjectDescription
Objectives
Project organization
Objectives
Scope
Work plan
Schedule
Man power
Budget
Who
What
Work breakdown structureWho does what
Responsibilityassignment
Work schedule
When Project plan
How
Work and resource plan
Figure 1.5 The project plan
1.6.4 Project control procedures
The ultimate success of the project will require that objectives for performance, budget and time, as
defined within the Project Plan, are fulfilled. This will only be possible if the necessary monitoring
and control systems are established prior to the commencement of project implementation.
Monitoring and reporting should include project performance indicators derived from the Project
Success Criteria. Planning should take into account the critical success factors, i.e. it should address
any potential difficulties that may arise from them.
Control procedures need to be established and documented for the management of the following
parameters:
Administration
Procedures for the administration of the project should be defined. These should include issues
such as:
• Filing
• Document management
• Correspondence controls
• Administrative requirements of the principal
Scope
The definition of scope change control systems which:
• Define circumstances under which scope changes can arise
• Control the process invoked when changes do arise
• Provide for integrated management of the consequences of the changes, i.e.
time and cost implications
Quality
The definition of project-specific quality policies and standards, together with processes for
ensuring that the required quality standards will be achieved. This is best achieved by reference to
the application of, and responsibilities for, Inspection and Test Plans.
16 Practical project management for engineers and technicians
16
Cost
The definition of control procedures which should include:
• Budget and commitment approvals for design, procurement and construction
functions
• The issue and control of delegated financial authority, to the project manager
controlling consultants and contractors, as well as to consultants controlling
contractors
• Variation control for changes arising during project implementation
• Value engineering
• Cost monitoring, reporting and control systems and procedures
Time
The definition of strategies and procedures for scheduling, monitoring and reporting, likely to
include:
• Programming methods and strategies for master and detail programmes, i.e.
definition of programming techniques as well as the frequency of review and
updating
• Progress monitoring and reporting systems and procedures.
Risk
The definition of objectives and procedures for putting in place effective risk management. Note
that there may be a Risk Management activity schedule in the PQP.
Communications
This specifies all requirements for communications within the project and to the client/sponsor, and
is likely to include:
• Meetings – schedules and processes
• Reporting requirements
• Document distribution
• Handover
• Close out
Procurement
This defines strategies and procedures for tendering, as well as for the selection and management of
consultants, suppliers and contractors.
Tendering
This covers documented standardized tendering procedures, tender documentation, and tender
evaluation procedures for each contract type (i.e. service, procurement, construction etc).
The tendering process is often a very sensitive one, especially if public funds are involved.
Appropriate attention must be paid to ensure that the legal aspects of the process are properly
addressed, and that the process is applied with demonstrable fairness. Recent changes in the laws
applying to tendering should be noted.
Consultants
This refers to a standardized document dealing with the use of consultants. It should cover issues
such as consultants’ briefs and terms of engagement. Consultants’ briefs would typically include
the following items:
• The scope of the work to be undertaken, and any limitations thereon
• The type of services to be provided and the deliverables required (this will be
defined within the WBS for the specific work package)
• Approvals required from the client
Fundamentals
17
• Approvals to be exercised on behalf of the client
• Special requirements of a management, technical or financial nature, for
example quality assurance/quality control programmes, variation control
procedures etc.
• Reporting requirements
• Project schedule requirements, for service delivery as well as implementation
phases
• Budgets for the proposed implementation deliverables or capital items
• Basis of payment for services to be provided by the consultant
Contracts
The terms of engagement and conditions of contract should be based on standard documents where
these exist. The level of documentation should be appropriate to the values of contracts let, and
usually a number of options are required.
1.6.5 Work breakdown structures
Developing the WBS is fundamental to effective planning and control for the simple reason that the
derived work packages are the primary logical blocks for developing the project time lines, cost
plans and allocation of responsibilities.
Many people either miss out this key step in the project management process, or undertake the step
informally without appreciating how important it is.
Definition and terminology
PMI PMBOK 1996 provides the following definition for a WBS:
A deliverable oriented grouping of project elements which organizes and defines the total scope of
the project: work not in the WBS is outside the scope of the project. Each descending level represents
an increasingly detailed description of the project elements.
The WBS is created by decomposition of the project, i.e. dividing the project into logical
components, and subdividing those until the level of detail necessary to support the subsequent
management processes (planning and controlling) is achieved.
Terminology varies in respect of defining project elements. The use of the terms ‘project’, ‘phase’,
‘stage’, ‘work package’, ‘activity’, ‘element’, ‘task’, ‘sub-task’, ‘cost account’, and ‘deliverable’ is
common:
PMBOK terminology provides the following definitions:
• A work package is a deliverable at the lowest level of the WBS
• A work package can be divided into activities
• An activity is an element of work performed; with associated resource
requirements, durations and costs
• An activity can be subdivided into tasks
A properly developed WBS provides a basis for:
• Defining and communicating the project scope
• Identifying all components of work within the project
• Identifying the necessary skills and resources required to undertake the
project
• Effective planning of the project (scheduling, resource planning, cost
estimating)
The WBS does not identify dependencies between the components, nor does it identify timing for
the components. These are, for example shown in the PERT and Gantt charts (see next chapter).
18 Practical project management for engineers and technicians
18
Creating the WBS
There are many valid approaches for the decomposition of a project. In many cases there will be
semi-standard WBS templates that can be used or adapted. The WBS should generally identify
both the project management and project deliverables, and should always be defined to reflect the
particular way in which the project is to be managed.
The appropriate level of detail will vary between projects, and at different times within the same
project. Future project phases may need less definition than the current phases – so the WBS may
be progressively developed as the project develops – but this requires a flexible WBS structure to
be selected in the first instance.
In planning the WBS, criteria can be adopted to ensure that the level of detail is appropriate and
consistent. Such criteria might include:
• Are the packages of work in the WBS sensible?
• Can any package be broken down further into sensible components?
• Is each package the responsibility of only one organizational group?
• Does every package represent a reasonable quantity of work?
• Does any package constitute more than, say, 5% (or 10%) of the project?
• Does any package constitute less than, say, 1% (or 2.5%) of the project?
• Does every package provide the basis for effective cost estimating and
scheduling?
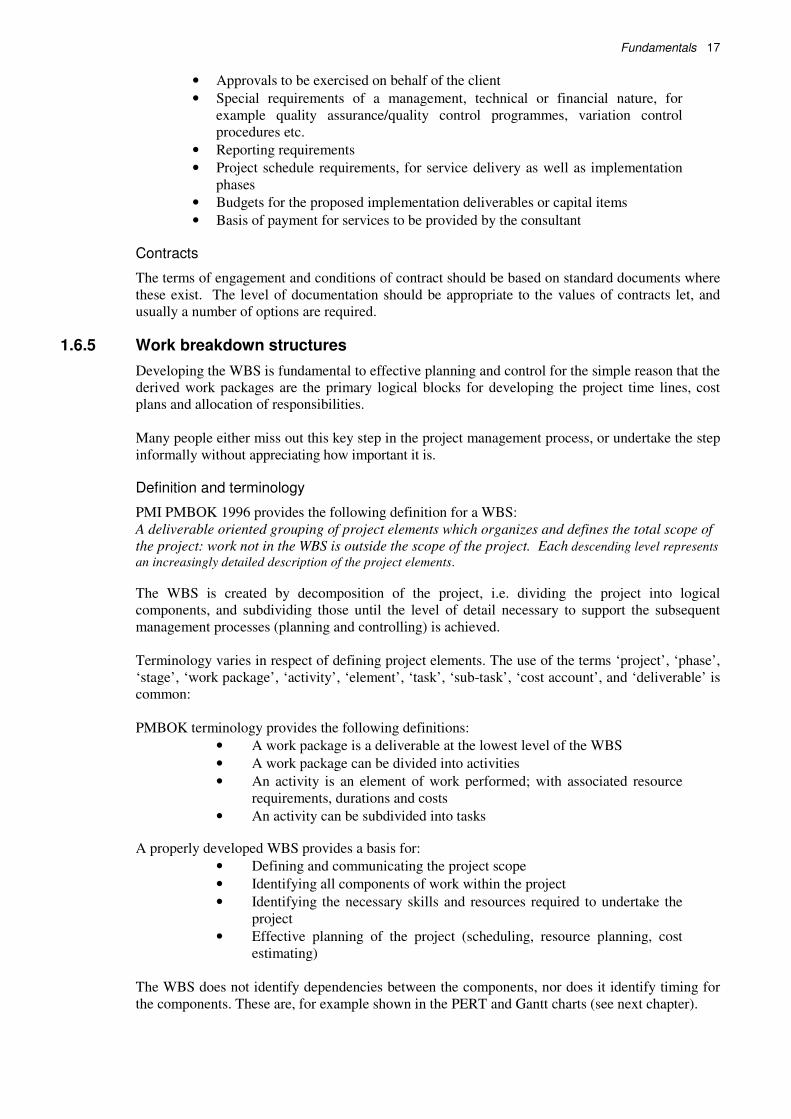
The following example shows the WBS of a project with geographical location at the second level
(see Figure 1.6).
Figure 1.6
WBS for restaurants project
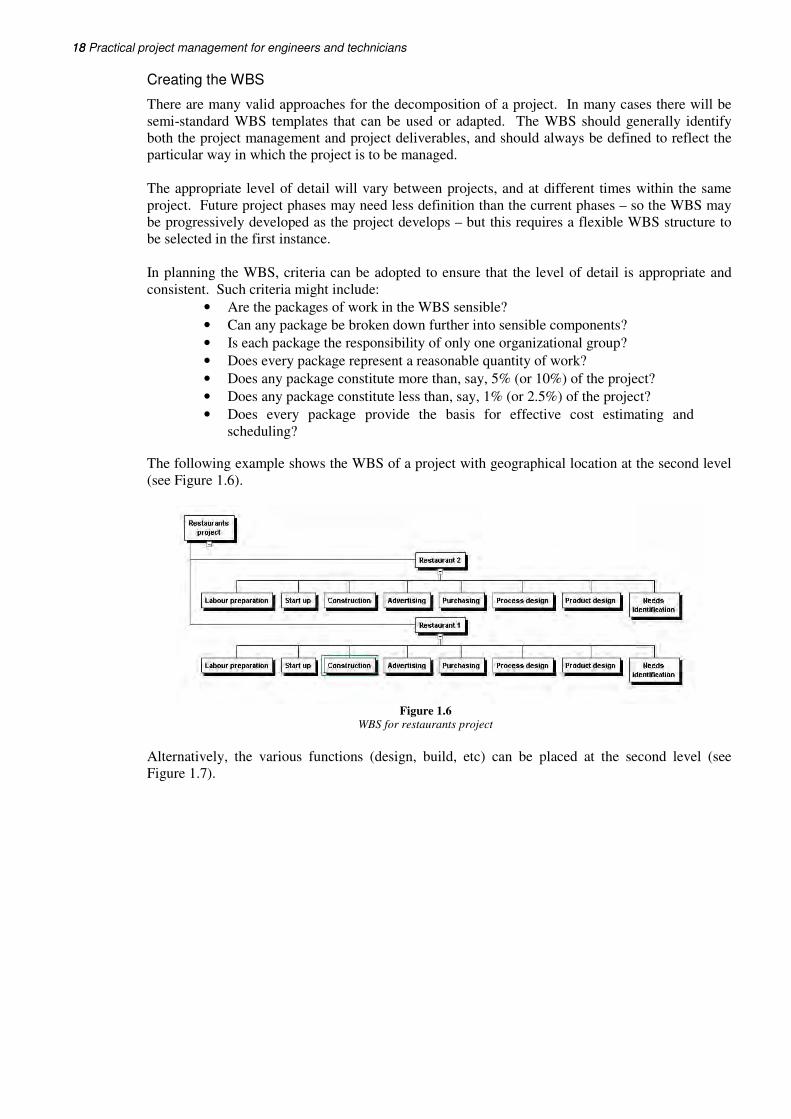
Alternatively, the various functions (design, build, etc) can be placed at the second level (see
Figure 1.7).
Fundamentals
19
Figure 1.7
Alternative WBS for restaurants project
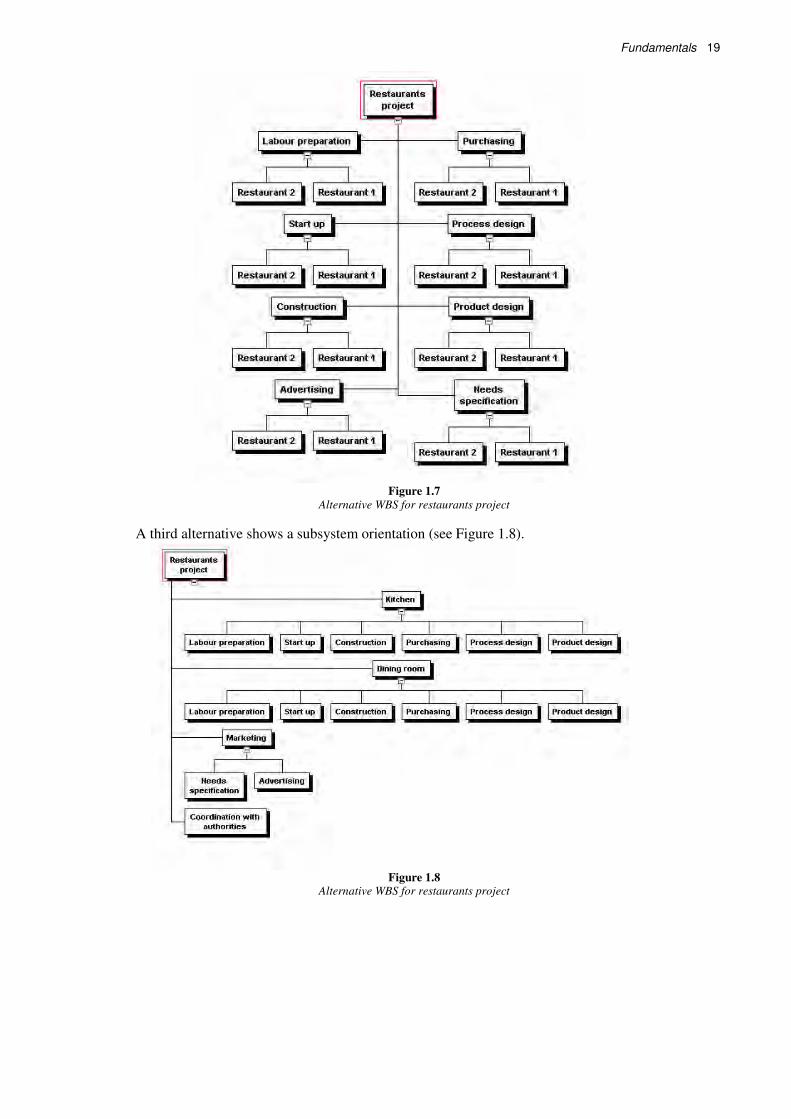
A third alternative shows a subsystem orientation (see Figure 1.8).
Figure 1.8
Alternative WBS for restaurants project
20 Practical project management for engineers and technicians
20
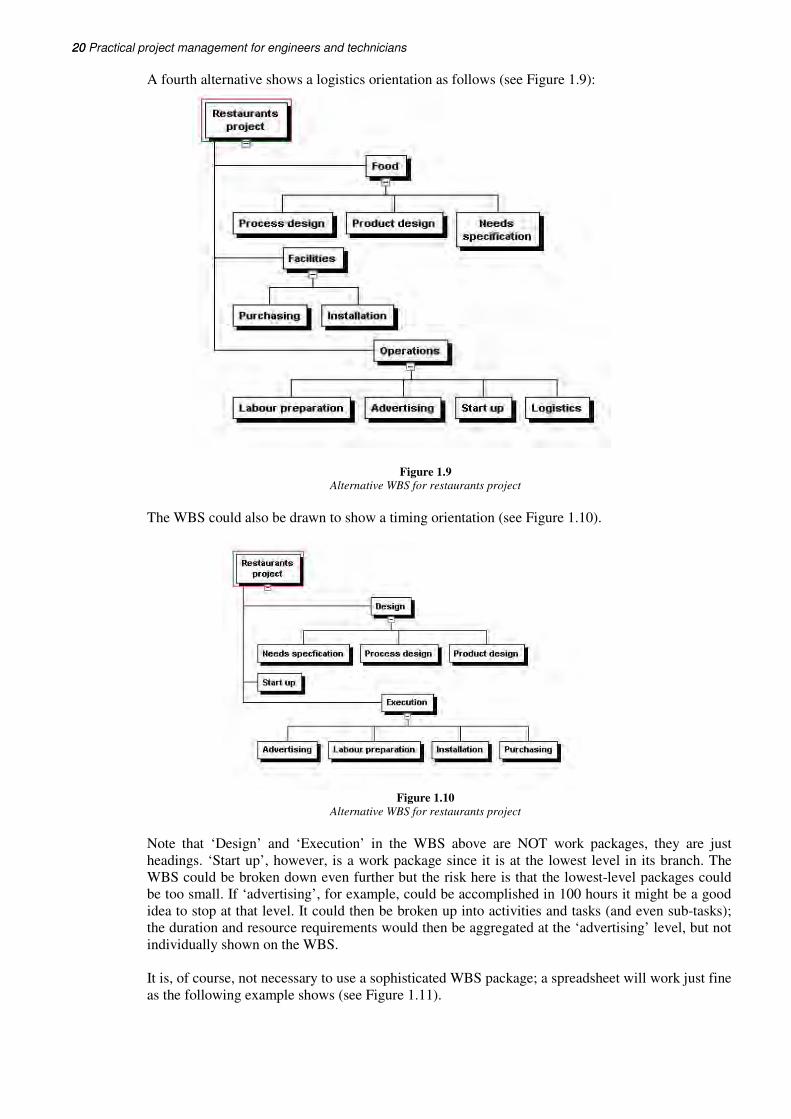
A fourth alternative shows a logistics orientation as follows (see Figure 1.9):
Figure 1.9 Alternative WBS for restaurants project
The WBS could also be drawn to show a timing orientation (see Figure 1.10).
Figure 1.10
Alternative WBS for restaurants project
Note that ‘Design’ and ‘Execution’ in the WBS above are NOT work packages, they are just
headings. ‘Start up’, however, is a work package since it is at the lowest level in its branch. The
WBS could be broken down even further but the risk here is that the lowest-level packages could
be too small. If ‘advertising’, for example, could be accomplished in 100 hours it might be a good
idea to stop at that level. It could then be broken up into activities and tasks (and even sub-tasks);
the duration and resource requirements would then be aggregated at the ‘advertising’ level, but not
individually shown on the WBS.
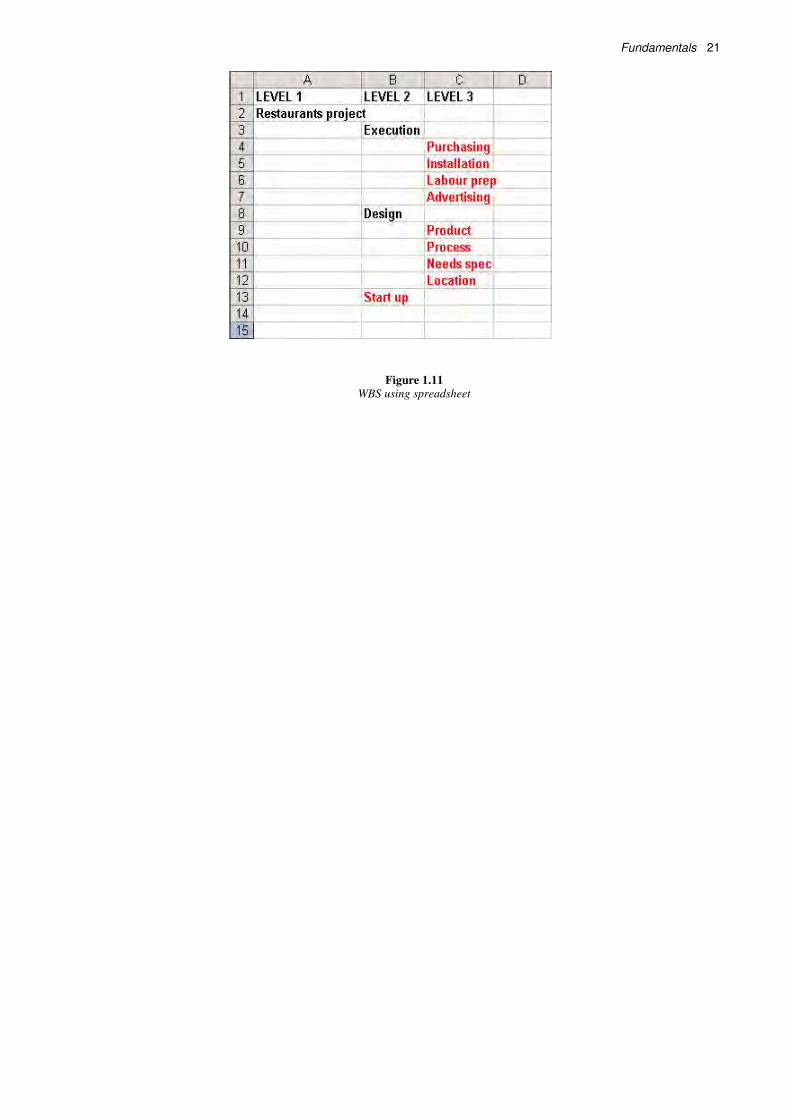
It is, of course, not necessary to use a sophisticated WBS package; a spreadsheet will work just fine
as the following example shows (see Figure 1.11).
Fundamentals
21
Figure 1.11
WBS using spreadsheet

22 Practical project management for engineers and technicians
22
2
Time management
Learning objective
The objective of this chapter is to provide a comprehensive introduction to the key elements of
effective time management for projects. Time management of a project consists of:
• Planning the project activities to a time scale (i.e. the project schedule)
• Monitoring performance of the implementation phase
• Comparing achieved performance with the project schedule
• Taking corrective action to ensure planned objectives are most likely to be met
The level of project planning that we propose requires a significant input of time and energy at the
start of the project, but considerably reduces the content and cost of management effort during the
project implementation phase. The preparation of the project schedule is only the first, albeit very
important, step.
Time management requires the monitoring and control functions to be carried out effectively so
that the project schedule can be adhered to, or so that any variance from the plan does not prejudice
project objectives.
The planning, monitoring and controlling cycle should be in process continuously until the project
is completed. The project schedule should be prepared with some knowledge of the monitoring
system to be employed. The prerequisite for setting up the monitoring system is the identification
of the key factors to be controlled. It may be, for example, the achievement of specific milestones
or particular resource items. The project manager will have to establish the boundaries within
which these factors need to be constrained. Performance monitoring must focus on outputs, not
inputs; i.e. results not effort.
2.1 Project planning
The principal aim of project management is to effectively utilize the available resources in order to
achieve the planned objective(s).
It is most unlikely, if not impossible, that this aim can be achieved in the absence of rational
planning and scheduling of all component activities, together with the associated human, material
and financial resources. Particular techniques have been developed which allow this essential
planning to be undertaken.
24 Practical project management for engineers and technicians 24
The most commonly used in the field of project management are known collectively as Project
Network Techniques. These comprise:
• The ‘Critical Path’ method (also known as the Activity on Arrow or AoA method)
• The Precedence method (also known as the Activity on Node or AoN method)
The Critical Path method may be the only one many people are familiar with since it is intuitively
attractive. The Precedence method appears, at least from a superficial look at the comparable
diagrams, to be more complex.
However, the Precedence method is far more flexible. The Precedence method has the advantage of
requiring no dummy activities to establish the correct logic for a project. Once the superficial
complexity is overcome, you will find it to be the more powerful tool. Most computer-based
project scheduling software packages use precedence logic and a proper understanding of the
method enables the software to be used to best effect.
Precedence network analyses are normally presented graphically, either as the network diagram
itself, or as a time-scaled bar chart known as a Gantt chart. Critical path networks can be presented
as time-scaled arrow diagrams, or as Gantt charts. All computer-based project scheduling software
packages use Gantt presentations in addition to the network diagrams.
Project analysis by either method involves the same four steps:
• Defining the activities. For the initial project plan this may involve the breakdown of
work packages used as the basic elements for the other components of the PQP
• Preparation of the logic sequence to determine the relationships between the activities
• Applying activity (time and resource) data for each activity
• Analysis of the network
The following is a brief introduction to these techniques. It will, however, be sufficient to allow
you to fully apply both methods to analyze any situation. There is a vast amount of literature
available on the subject that could be consulted for additional guidance.
2.2 The critical path method
2.2.1 Defining the activities
The first step in project planning is to break the defined work packages into component activities,
and sometimes tasks. It is crucial that this breakdown be carefully considered if the subsequent
output is to be an effective project control tool.
In establishing the activity list, the following principles may assist:
• For an initial analysis the number of activities should be kept to the minimum required to
be useful. This allows for the framework to be developed and checked for consistency
before too much effort has been spent. If found necessary, the activities can be broken
down further at a later stage if that is appropriate
• For a definitive plan it is useful to include more detail so that the schedule in the PQP can
be adopted as the baseline for schedule monitoring
• Who else will be using the schedule, and for what purpose?
• Is it an appropriate master plan, allowing elements to be defined in more detail as
implementation continues?
It is important to note that the word ‘operation’ or ‘activity’ is used in its widest sense. It will not
only include actual physical events, derived form the work packages, but anything that may
exercise a restraint on the completion of the project should be included as an activity. This will
include actions such as obtain finance, obtain approval, place order, and represent passages of
time with no actual activity, e.g. delivery period.
Time management 25
2.2.2 Preparing the logic network
The arrow diagram
In CPM, each activity is represented by an arrow. The tail of an arrow marks the start of the
activity it represents, and the head marks its finish. The start and finish of activities are called
events or nodes. Circles are drawn at the tails and heads of arrows to denote the nodes. The arrow
diagram, or network, is drawn by joining the nodes together to show the logically correct sequence
of activities. The arrows are not drawn to scale; their lengths are unimportant at this stage. Their
directions show the flow of work. Here are a few simple illustrations.
Figure 2.1 shows two sequential activities indicating that Activity B cannot be started until Activity
A is completed.
A B
Figure 2.1
Network example
Figure 2.2 shows that Activity E must await the completion of both Activities C and D before it can
commence.
D
C
E
Figure 2.2 Network example
Figure 2.3 shows Activities G and H as concurrent activities that can start simultaneously once
Activity F has been completed.
F H
G
Figure 2.3 Network example
When developing the arrow diagram, three questions are asked of each activity in order to ensure
its logical sequence:
• What must precede it?
• What has to follow it?
• What can take place concurrently with it?
26 Practical project management for engineers and technicians 26
The importance of these three questions cannot be overemphasized. Be aware of the ease of
inadvertently introducing constraints by implication.
Numbering of events
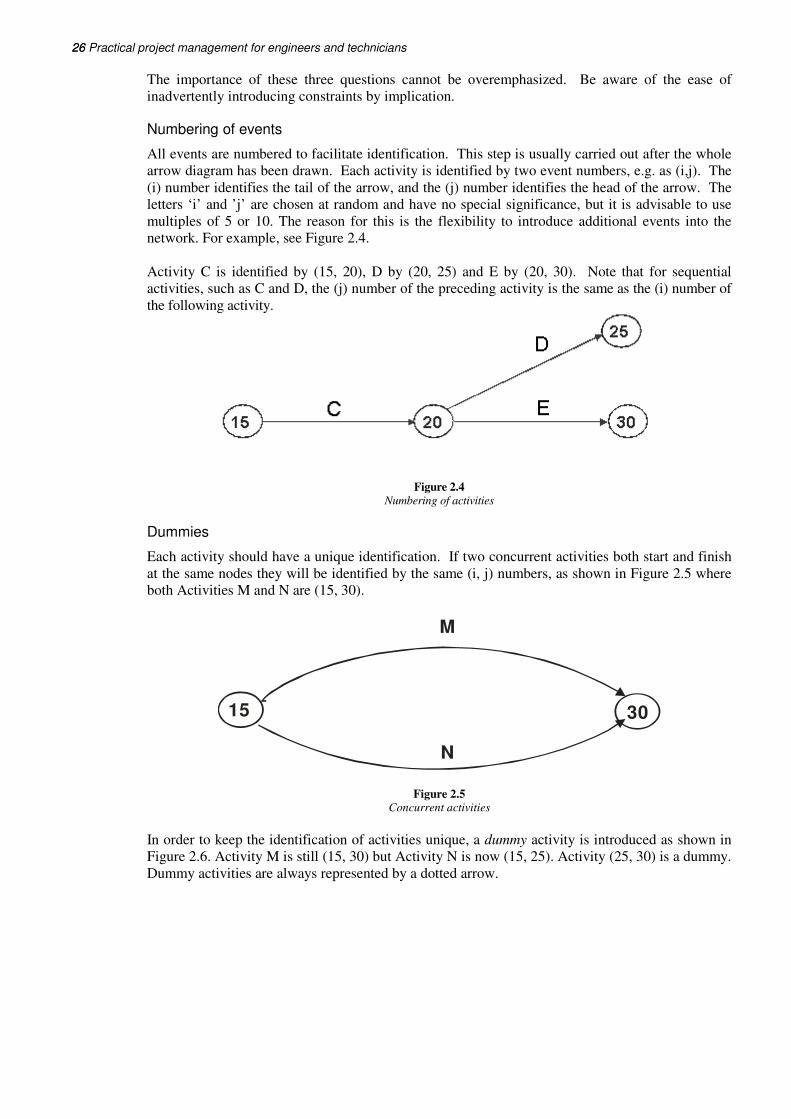
All events are numbered to facilitate identification. This step is usually carried out after the whole
arrow diagram has been drawn. Each activity is identified by two event numbers, e.g. as (i,j). The
(i) number identifies the tail of the arrow, and the (j) number identifies the head of the arrow. The
letters ‘i’ and ’j’ are chosen at random and have no special significance, but it is advisable to use
multiples of 5 or 10. The reason for this is the flexibility to introduce additional events into the
network. For example, see Figure 2.4.
Activity C is identified by (15, 20), D by (20, 25) and E by (20, 30). Note that for sequential
activities, such as C and D, the (j) number of the preceding activity is the same as the (i) number of
the following activity.
Figure 2.4
Numbering of activities
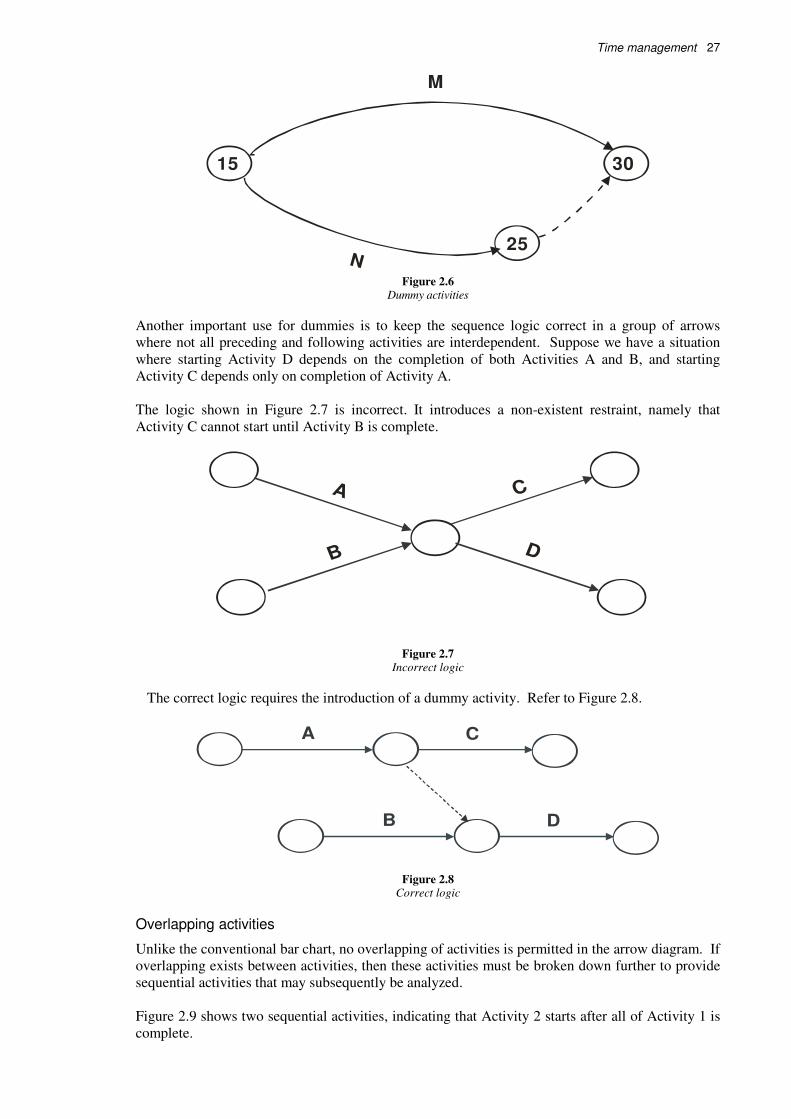
Dummies
Each activity should have a unique identification. If two concurrent activities both start and finish
at the same nodes they will be identified by the same (i, j) numbers, as shown in Figure 2.5 where
both Activities M and N are (15, 30).
M
15 30
N
Figure 2.5
Concurrent activities
In order to keep the identification of activities unique, a dummy activity is introduced as shown in
Figure 2.6. Activity M is still (15, 30) but Activity N is now (15, 25). Activity (25, 30) is a dummy.
Dummy activities are always represented by a dotted arrow.
Time management 27
M
N
15 30
25
Figure 2.6
Dummy activities
Another important use for dummies is to keep the sequence logic correct in a group of arrows
where not all preceding and following activities are interdependent. Suppose we have a situation
where starting Activity D depends on the completion of both Activities A and B, and starting
Activity C depends only on completion of Activity A.
The logic shown in Figure 2.7 is incorrect. It introduces a non-existent restraint, namely that
Activity C cannot start until Activity B is complete.
A
B
C
D
Figure 2.7 Incorrect logic
The correct logic requires the introduction of a dummy activity. Refer to Figure 2.8.
A C
B D
Figure 2.8 Correct logic
Overlapping activities
Unlike the conventional bar chart, no overlapping of activities is permitted in the arrow diagram. If
overlapping exists between activities, then these activities must be broken down further to provide
sequential activities that may subsequently be analyzed.
Figure 2.9 shows two sequential activities, indicating that Activity 2 starts after all of Activity 1 is
complete.
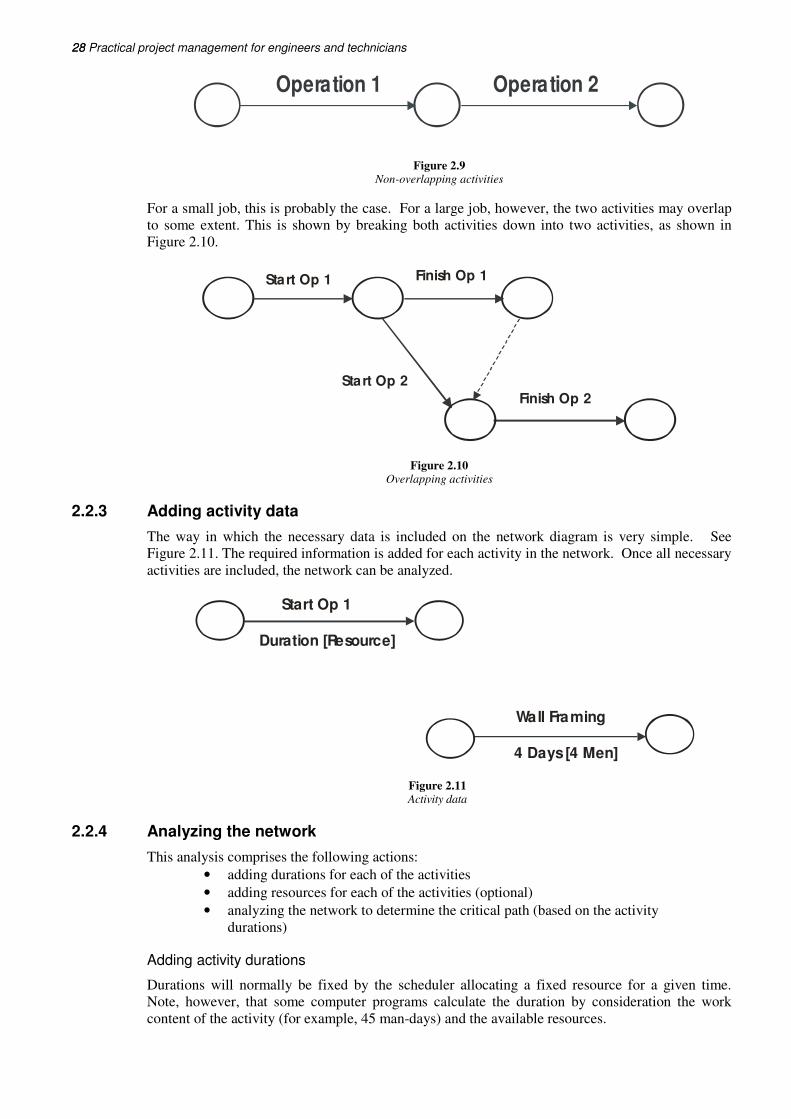
28 Practical project management for engineers and technicians 28
Operation 1 Operation 2
Figure 2.9 Non-overlapping activities
For a small job, this is probably the case. For a large job, however, the two activities may overlap
to some extent. This is shown by breaking both activities down into two activities, as shown in
Figure 2.10.
Start Op 1 Finish Op 1
Finish Op 2
Start Op 2
Figure 2.10 Overlapping activities
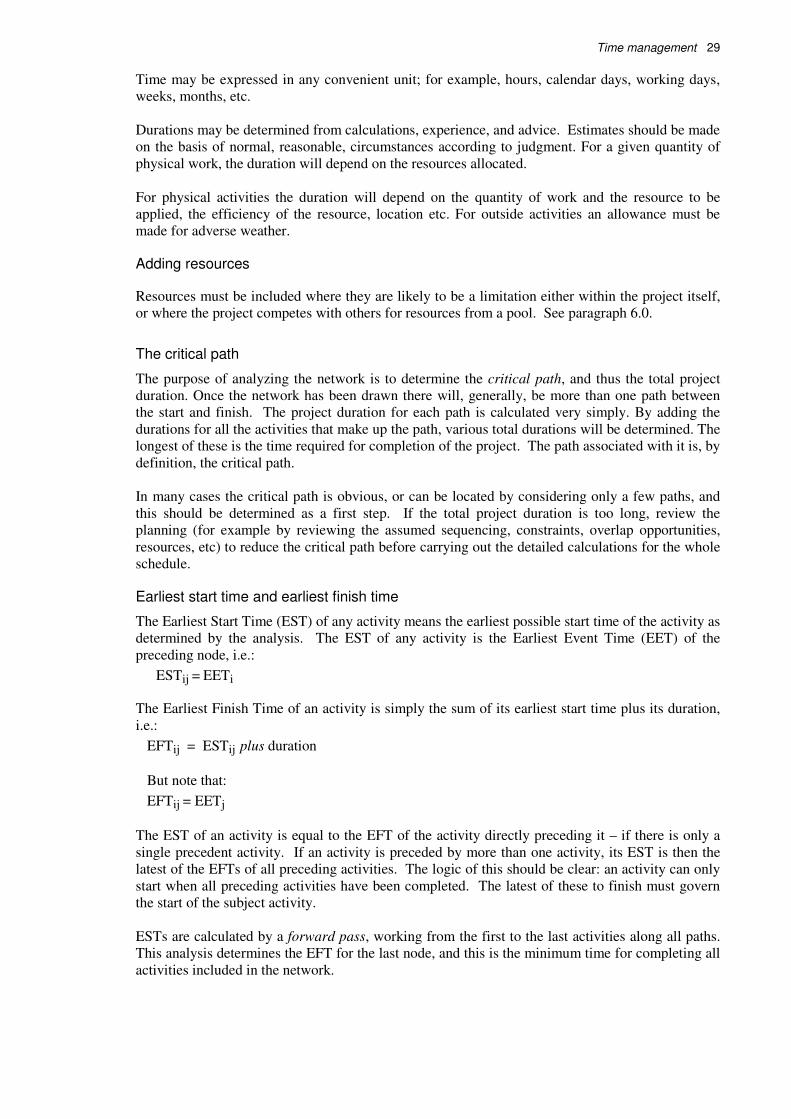
2.2.3 Adding activity data
The way in which the necessary data is included on the network diagram is very simple. See
Figure 2.11. The required information is added for each activity in the network. Once all necessary
activities are included, the network can be analyzed.
Start Op 1
Duration [Resource]
Wall Framing
4 Days [4 Men]
Figure 2.11 Activity data
2.2.4 Analyzing the network
This analysis comprises the following actions:
• adding durations for each of the activities
• adding resources for each of the activities (optional)
• analyzing the network to determine the critical path (based on the activity
durations)
Adding activity durations
Durations will normally be fixed by the scheduler allocating a fixed resource for a given time.
Note, however, that some computer programs calculate the duration by consideration the work
content of the activity (for example, 45 man-days) and the available resources.
Time management 29
Time may be expressed in any convenient unit; for example, hours, calendar days, working days,
weeks, months, etc.
Durations may be determined from calculations, experience, and advice. Estimates should be made
on the basis of normal, reasonable, circumstances according to judgment. For a given quantity of
physical work, the duration will depend on the resources allocated.
For physical activities the duration will depend on the quantity of work and the resource to be
applied, the efficiency of the resource, location etc. For outside activities an allowance must be
made for adverse weather.
Adding resources
Resources must be included where they are likely to be a limitation either within the project itself,
or where the project competes with others for resources from a pool. See paragraph 6.0.
The critical path
The purpose of analyzing the network is to determine the critical path, and thus the total project
duration. Once the network has been drawn there will, generally, be more than one path between
the start and finish. The project duration for each path is calculated very simply. By adding the
durations for all the activities that make up the path, various total durations will be determined. The
longest of these is the time required for completion of the project. The path associated with it is, by
definition, the critical path.
In many cases the critical path is obvious, or can be located by considering only a few paths, and
this should be determined as a first step. If the total project duration is too long, review the
planning (for example by reviewing the assumed sequencing, constraints, overlap opportunities,
resources, etc) to reduce the critical path before carrying out the detailed calculations for the whole
schedule.
Earliest start time and earliest finish time
The Earliest Start Time (EST) of any activity means the earliest possible start time of the activity as
determined by the analysis. The EST of any activity is the Earliest Event Time (EET) of the
preceding node, i.e.:
ESTij = EETi
The Earliest Finish Time of an activity is simply the sum of its earliest start time plus its duration,
i.e.:
EFTij = ESTij plus duration
But note that:
EFTij = EETj
The EST of an activity is equal to the EFT of the activity directly preceding it – if there is only a
single precedent activity. If an activity is preceded by more than one activity, its EST is then the
latest of the EFTs of all preceding activities. The logic of this should be clear: an activity can only
start when all preceding activities have been completed. The latest of these to finish must govern
the start of the subject activity.
ESTs are calculated by a forward pass, working from the first to the last activities along all paths.
This analysis determines the EFT for the last node, and this is the minimum time for completing all
activities included in the network.
30 Practical project management for engineers and technicians 30
Latest finish time and latest start time
The Latest Finish Time (LFT) of any activity means the latest possible time it must be finished if
the completion time of the whole project is not to be delayed. The LFT for an activity is the Latest
Event Time (LET) of the succeeding node, i.e.:
LFTij = LETj
The Latest Start Time of an activity is simply the sum of its latest finish time less its duration, i.e.:
LSTij = LFTij minus duration
But also note that:
LSTij = equals LETi
The LFT for the final activity is taken to be the same as its EFT. The latest times for all other
activities are computed by making a backwards pass from the final activity. The Latest Start Time
(LST) for any activity is obtained by subtracting its duration from its LFT. For each activity, the
LFT must be equal to the LET of the succeeding node. When an activity is, however, followed by
more than one activity, its LFT is equal to the earliest of the LSTs of all following activities.
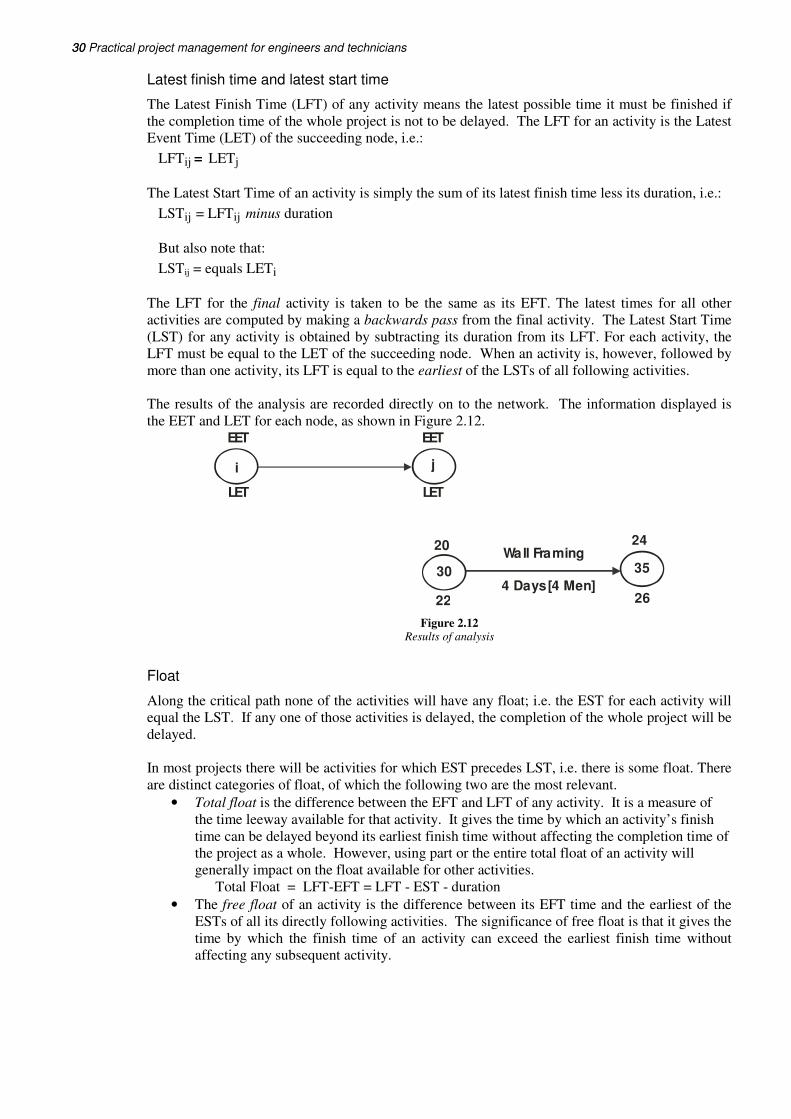
The results of the analysis are recorded directly on to the network. The information displayed is
the EET and LET for each node, as shown in Figure 2.12.
EET
Wall Framing
4 Days [4 Men]
LET
EET
LET
i j
20
30
22
24
35
26
Figure 2.12 Results of analysis
Float
Along the critical path none of the activities will have any float; i.e. the EST for each activity will
equal the LST. If any one of those activities is delayed, the completion of the whole project will be
delayed.
In most projects there will be activities for which EST precedes LST, i.e. there is some float. There
are distinct categories of float, of which the following two are the most relevant.
• Total float is the difference between the EFT and LFT of any activity. It is a measure of
the time leeway available for that activity. It gives the time by which an activity’s finish
time can be delayed beyond its earliest finish time without affecting the completion time of
the project as a whole. However, using part or the entire total float of an activity will
generally impact on the float available for other activities.
Total Float = LFT-EFT = LFT - EST - duration
• The free float of an activity is the difference between its EFT time and the earliest of the
ESTs of all its directly following activities. The significance of free float is that it gives the
time by which the finish time of an activity can exceed the earliest finish time without
affecting any subsequent activity.
Time management 31
2.3 The precedence method
2.3.1 General
The Precedence method (also known as the Activity on Node or AoN method) includes the same
four steps as the Critical Path method. There are two fundamental differences between the
Precedence and Critical Path methods of network analysis.
• For precedence analysis the data relating to each activity is contained on the node
• The arrows connecting the activities can show a variety of logical relationships between
activities
The ability to overlap activities more easily using the Precedence method is a considerable
advantage. This method gives the same results as the Critical Path method with respect to
determining the critical path for the project, and the amount of float available for non-critical
activities (those activities not on the critical path). It is often easier to use for people with no
previous programming experience. The work breakdown is performed as per the Critical Path
method.
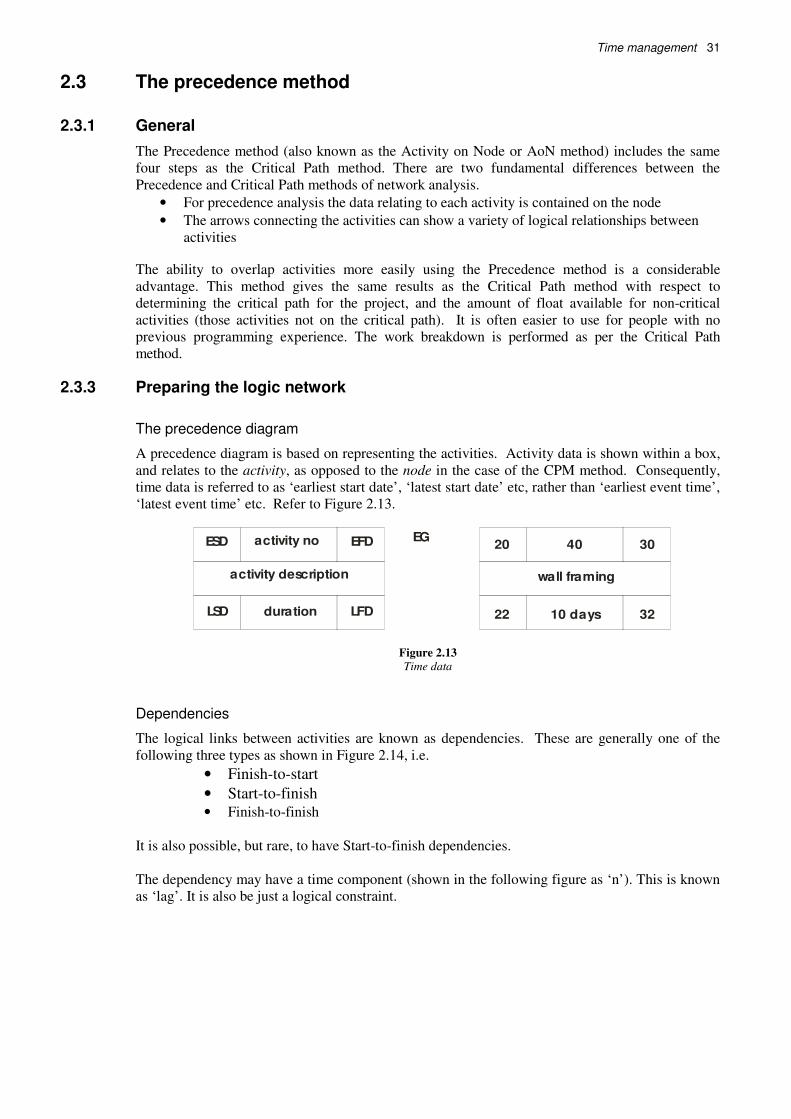
2.3.3 Preparing the logic network
The precedence diagram
A precedence diagram is based on representing the activities. Activity data is shown within a box,
and relates to the activity, as opposed to the node in the case of the CPM method. Consequently,
time data is referred to as ‘earliest start date’, ‘latest start date’ etc, rather than ‘earliest event time’,
‘latest event time’ etc. Refer to Figure 2.13.
40EGactivity no
activity description
20 30
3222 10 days
wall framing
ESD EFD
LFDLSD duration
Figure 2.13
Time data
Dependencies
The logical links between activities are known as dependencies. These are generally one of the
following three types as shown in Figure 2.14, i.e.
• Finish-to-start
• Start-to-finish • Finish-to-finish
It is also possible, but rare, to have Start-to-finish dependencies.
The dependency may have a time component (shown in the following figure as ‘n’). This is known
as ‘lag’. It is also be just a logical constraint.
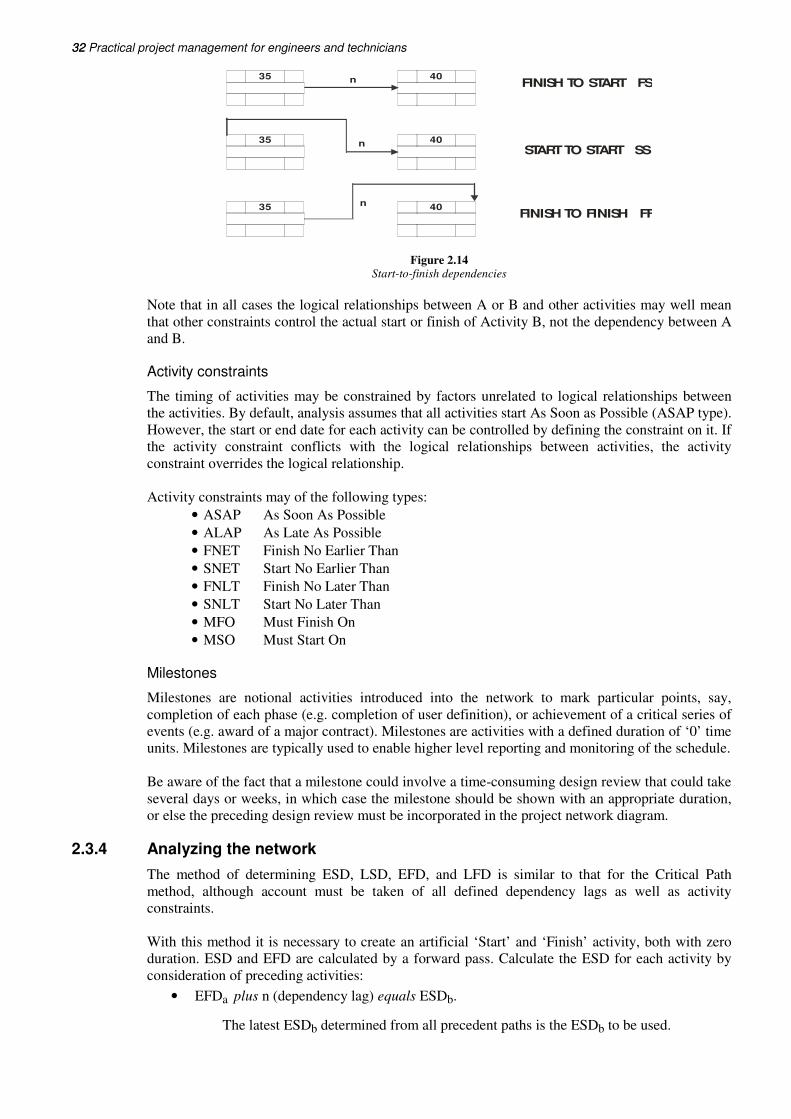
32 Practical project management for engineers and technicians 32
35
35
35
40
40
40
n
n
n
FINISH TO START FS
START TO START SS
FINISH TO FINISH FF
Figure 2.14 Start-to-finish dependencies
Note that in all cases the logical relationships between A or B and other activities may well mean
that other constraints control the actual start or finish of Activity B, not the dependency between A
and B.
Activity constraints
The timing of activities may be constrained by factors unrelated to logical relationships between
the activities. By default, analysis assumes that all activities start As Soon as Possible (ASAP type).
However, the start or end date for each activity can be controlled by defining the constraint on it. If
the activity constraint conflicts with the logical relationships between activities, the activity
constraint overrides the logical relationship.
Activity constraints may of the following types:
• ASAP As Soon As Possible
• ALAP As Late As Possible
• FNET Finish No Earlier Than
• SNET Start No Earlier Than
• FNLT Finish No Later Than
• SNLT Start No Later Than
• MFO Must Finish On
• MSO Must Start On
Milestones
Milestones are notional activities introduced into the network to mark particular points, say,
completion of each phase (e.g. completion of user definition), or achievement of a critical series of
events (e.g. award of a major contract). Milestones are activities with a defined duration of ‘0’ time
units. Milestones are typically used to enable higher level reporting and monitoring of the schedule.
Be aware of the fact that a milestone could involve a time-consuming design review that could take
several days or weeks, in which case the milestone should be shown with an appropriate duration,
or else the preceding design review must be incorporated in the project network diagram.
2.3.4 Analyzing the network
The method of determining ESD, LSD, EFD, and LFD is similar to that for the Critical Path
method, although account must be taken of all defined dependency lags as well as activity
constraints.
With this method it is necessary to create an artificial ‘Start’ and ‘Finish’ activity, both with zero
duration. ESD and EFD are calculated by a forward pass. Calculate the ESD for each activity by
consideration of preceding activities:
• EFDa plus n (dependency lag) equals ESDb.
The latest ESDb determined from all precedent paths is the ESDb to be used.
Time management 33
• EFDb equals ESDb plus duration.
Once the Finish task is reached, the LSDs and LFDs are calculated by a backward
pass. Calculate the LSD for each activity by consideration of succeeding activities plus
dependencies and durations.
• LFDa equals LSDb minus n (dependency lag)
The earliest LFDa determined is the LFDa to be used.
• LSDa equals LFDa minus duration
This is not as difficult as it sounds, but some practice is required to master the subtle
aspects of more complex networks.
Example
Activity A has no predecessors, and a duration of 4 time periods (e.g. months). Activity B has no
predecessors either, and a duration of 3 time periods. Activity C has a duration of 2 time periods
and can only start when A is finished. Activity D is expected to take 4 time periods, and can only
start when A and B is finished. The following figure shows the completed network. Note the
following:
• Each activity is labeled in the middle, and the duration is shown at the top, in the centre
field.
• The dummy activities ‘start’ and ‘finish’ have zero duration
Now the forward pass:
• The ‘start’ activity begins and ends at time zero (EST = EFT =0)
• Activity A can begin straight away (EST =0) and ends at time 4 (EFT =4)
• Activity B can also begin straight away (EST = 0) and ends at time 3 (EFT =0)
• C must wait for A. The earliest it can therefore start is at time 4, ending at 6 (EST = 4, EST
= 6)
• D must wait for both A and B to finish and can therefore not start before 4, ending at 8
(EST = 4, EFT = 8)
• The project is only finished when D is completed, at time 8
• The ‘finish’ dummy task has zero duration, and therefore starts and finishes at 8 (EST =
EFT =8)
Next follows the backward pass:
• The ‘finish’ task has zero duration, therefore its LST = LFT = 8
• Completion of C can now be delayed until time 8 (LFT = 8), so with a duration of 2 its
LST is now 6
• There is no slack in C, so its latest times are the same as its earliest times
• Since the earliest D can start is 4, B need not finish before then
• A must finish by 4, otherwise it will delay D
The floats are now calculated as LST minus EFT, or LFT minus EFT, i.e. the bottom number
minus the top number on either the left or the right side of each block. The critical path
interconnects all those blocks with zero slack. Remember that it is possible to have more than one
critical path, and that the critical path may change once the project is under way (see Figure 2.15).
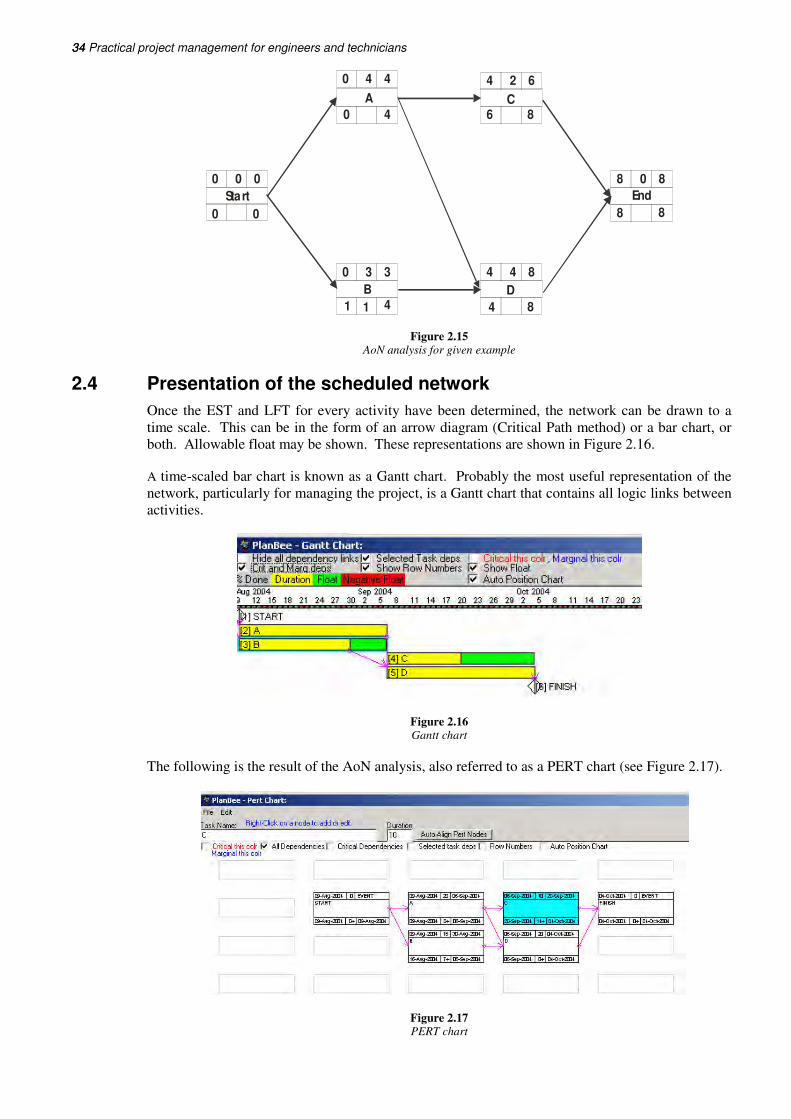
34 Practical project management for engineers and technicians 34
Start
0 0 0
00
0
0
0
0
8
4 4
4
4
4
4 4
41 1
3 3
2 6
6 8
8
8
8 8
8
D
A
B
C
End
Figure 2.15 AoN analysis for given example
2.4 Presentation of the scheduled network
Once the EST and LFT for every activity have been determined, the network can be drawn to a
time scale. This can be in the form of an arrow diagram (Critical Path method) or a bar chart, or
both. Allowable float may be shown. These representations are shown in Figure 2.16.
A time-scaled bar chart is known as a Gantt chart. Probably the most useful representation of the
network, particularly for managing the project, is a Gantt chart that contains all logic links between
activities.
Figure 2.16 Gantt chart
The following is the result of the AoN analysis, also referred to as a PERT chart (see Figure 2.17).
Figure 2.17 PERT chart
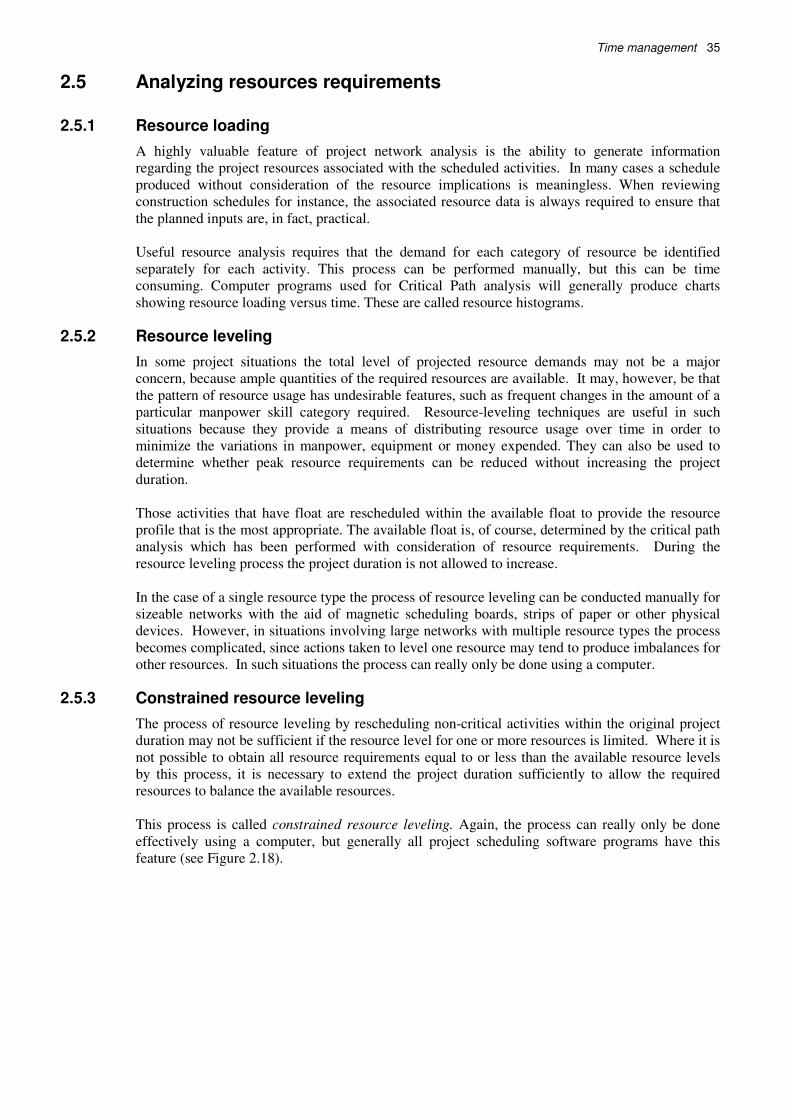
Time management 35
2.5 Analyzing resources requirements
2.5.1 Resource loading
A highly valuable feature of project network analysis is the ability to generate information
regarding the project resources associated with the scheduled activities. In many cases a schedule
produced without consideration of the resource implications is meaningless. When reviewing
construction schedules for instance, the associated resource data is always required to ensure that
the planned inputs are, in fact, practical.
Useful resource analysis requires that the demand for each category of resource be identified
separately for each activity. This process can be performed manually, but this can be time
consuming. Computer programs used for Critical Path analysis will generally produce charts
showing resource loading versus time. These are called resource histograms.
2.5.2 Resource leveling
In some project situations the total level of projected resource demands may not be a major
concern, because ample quantities of the required resources are available. It may, however, be that
the pattern of resource usage has undesirable features, such as frequent changes in the amount of a
particular manpower skill category required. Resource-leveling techniques are useful in such
situations because they provide a means of distributing resource usage over time in order to
minimize the variations in manpower, equipment or money expended. They can also be used to
determine whether peak resource requirements can be reduced without increasing the project
duration.
Those activities that have float are rescheduled within the available float to provide the resource
profile that is the most appropriate. The available float is, of course, determined by the critical path
analysis which has been performed with consideration of resource requirements. During the
resource leveling process the project duration is not allowed to increase.
In the case of a single resource type the process of resource leveling can be conducted manually for
sizeable networks with the aid of magnetic scheduling boards, strips of paper or other physical
devices. However, in situations involving large networks with multiple resource types the process
becomes complicated, since actions taken to level one resource may tend to produce imbalances for
other resources. In such situations the process can really only be done using a computer.
2.5.3 Constrained resource leveling
The process of resource leveling by rescheduling non-critical activities within the original project
duration may not be sufficient if the resource level for one or more resources is limited. Where it is
not possible to obtain all resource requirements equal to or less than the available resource levels
by this process, it is necessary to extend the project duration sufficiently to allow the required
resources to balance the available resources.
This process is called constrained resource leveling. Again, the process can really only be done
effectively using a computer, but generally all project scheduling software programs have this
feature (see Figure 2.18).
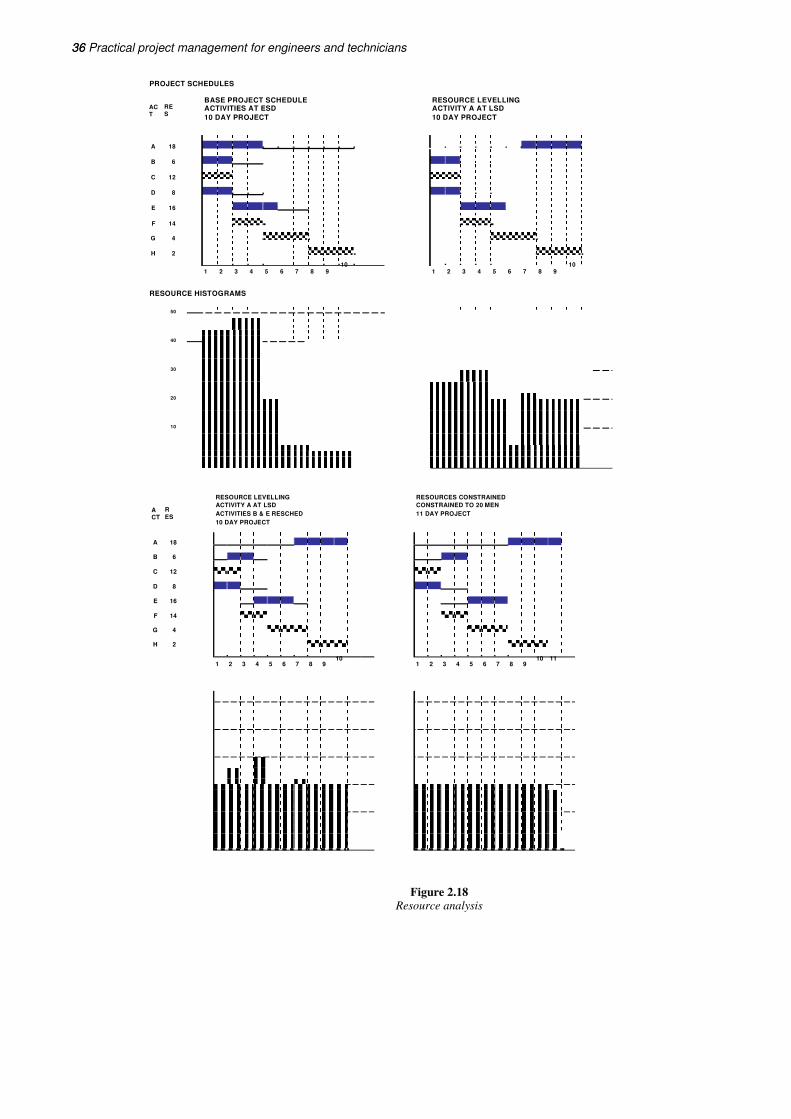
36 Practical project management for engineers and technicians 36
Figure 2.18 Resource analysis
PROJECT SCHEDULES
BASE PROJECT SCHEDULE RESOURCE LEVELLINGACTIVITIES AT ESD ACTIVITY A AT LSD
10 DAY PROJECT 10 DAY PROJECT
ACT
RES
A 18
B 6
C 12
D 8
E 16
F 14
G 4
H 2
1 2 3 4 5 6 7 8 910
1 2 3 4 5 6 7 8 910
RESOURCE HISTOGRAMS
50
40
30
20
10
RESOURCE LEVELLING RESOURCES CONSTRAINED
ACTIVITY A AT LSD CONSTRAINED TO 20 MEN
ACTIVITIES B & E RESCHED 11 DAY PROJECTACT
RES
10 DAY PROJECT
A 18
B 6
C 12
D 8
E 16
F 14
G 4
H 2
1 2 3 4 5 6 7 8 910
1 2 3 4 5 6 7 8 910 11
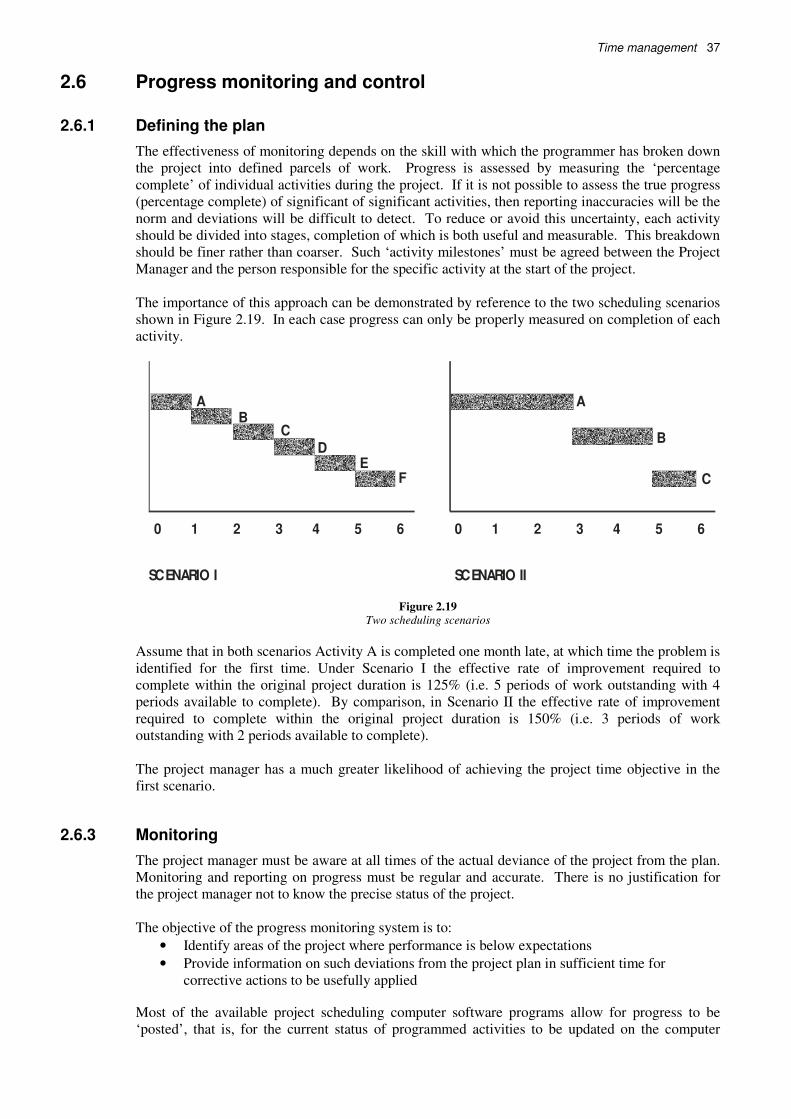
Time management 37
2.6 Progress monitoring and control
2.6.1 Defining the plan
The effectiveness of monitoring depends on the skill with which the programmer has broken down
the project into defined parcels of work. Progress is assessed by measuring the ‘percentage
complete’ of individual activities during the project. If it is not possible to assess the true progress
(percentage complete) of significant of significant activities, then reporting inaccuracies will be the
norm and deviations will be difficult to detect. To reduce or avoid this uncertainty, each activity
should be divided into stages, completion of which is both useful and measurable. This breakdown
should be finer rather than coarser. Such ‘activity milestones’ must be agreed between the Project
Manager and the person responsible for the specific activity at the start of the project.
The importance of this approach can be demonstrated by reference to the two scheduling scenarios
shown in Figure 2.19. In each case progress can only be properly measured on completion of each
activity.
AB
CD
EF
SCENARIO I
0 1 2 3 4 5 6 0 1 2 3 4 5 6
C
A
B
SCENARIO II
Figure 2.19 Two scheduling scenarios
Assume that in both scenarios Activity A is completed one month late, at which time the problem is
identified for the first time. Under Scenario I the effective rate of improvement required to
complete within the original project duration is 125% (i.e. 5 periods of work outstanding with 4
periods available to complete). By comparison, in Scenario II the effective rate of improvement
required to complete within the original project duration is 150% (i.e. 3 periods of work
outstanding with 2 periods available to complete).
The project manager has a much greater likelihood of achieving the project time objective in the
first scenario.
2.6.3 Monitoring
The project manager must be aware at all times of the actual deviance of the project from the plan.
Monitoring and reporting on progress must be regular and accurate. There is no justification for
the project manager not to know the precise status of the project.
The objective of the progress monitoring system is to:
• Identify areas of the project where performance is below expectations
• Provide information on such deviations from the project plan in sufficient time for
corrective actions to be usefully applied
Most of the available project scheduling computer software programs allow for progress to be
‘posted’, that is, for the current status of programmed activities to be updated on the computer
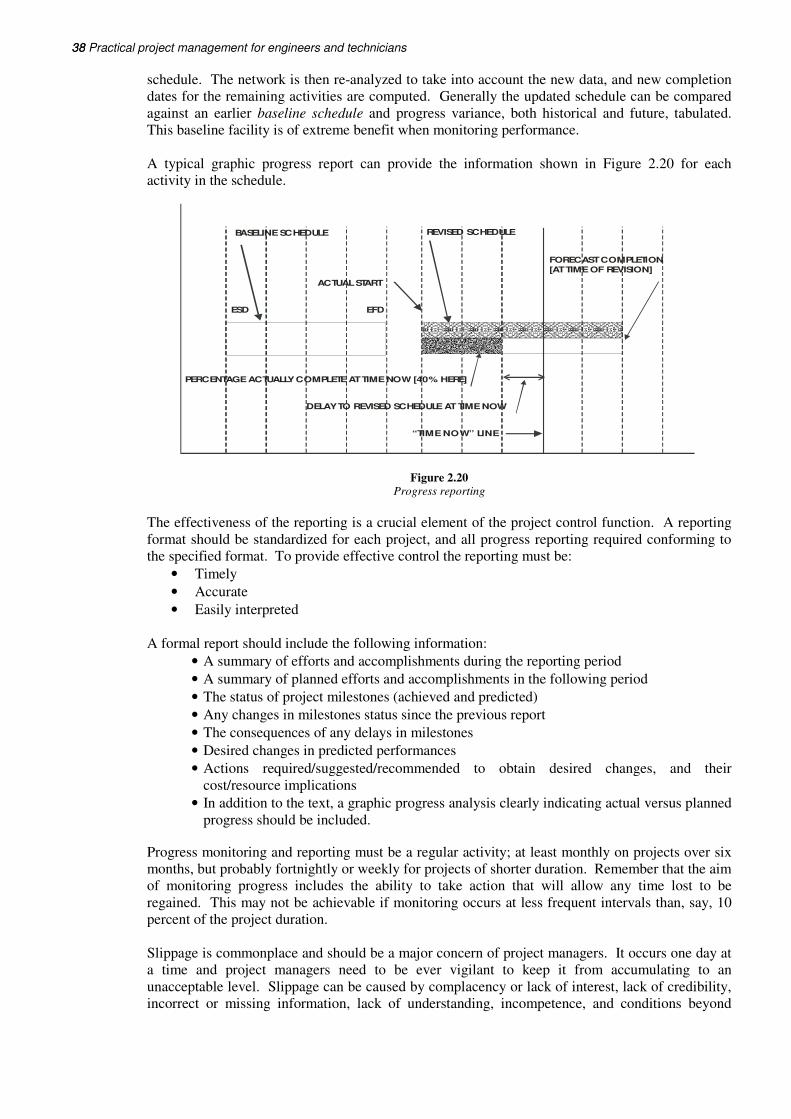
38 Practical project management for engineers and technicians 38
schedule. The network is then re-analyzed to take into account the new data, and new completion
dates for the remaining activities are computed. Generally the updated schedule can be compared
against an earlier baseline schedule and progress variance, both historical and future, tabulated.
This baseline facility is of extreme benefit when monitoring performance.
A typical graphic progress report can provide the information shown in Figure 2.20 for each
activity in the schedule.
ESD EFD
PERCENTAGE ACTUALLY COMPLETE AT TIME NOW [40% HERE]
DELAY TO REVISED SCHEDULE AT TIME NOW
“TIME NOW” LINE
ACTUAL START
BASELINE SCHEDULE REVISED SCHEDULE
FORECAST COMPLETION
[AT TIME OF REVISION]
Figure 2.20 Progress reporting
The effectiveness of the reporting is a crucial element of the project control function. A reporting
format should be standardized for each project, and all progress reporting required conforming to
the specified format. To provide effective control the reporting must be:
• Timely
• Accurate
• Easily interpreted
A formal report should include the following information:
• A summary of efforts and accomplishments during the reporting period
• A summary of planned efforts and accomplishments in the following period
• The status of project milestones (achieved and predicted)
• Any changes in milestones status since the previous report
• The consequences of any delays in milestones
• Desired changes in predicted performances
• Actions required/suggested/recommended to obtain desired changes, and their
cost/resource implications
• In addition to the text, a graphic progress analysis clearly indicating actual versus planned
progress should be included.
Progress monitoring and reporting must be a regular activity; at least monthly on projects over six
months, but probably fortnightly or weekly for projects of shorter duration. Remember that the aim
of monitoring progress includes the ability to take action that will allow any time lost to be
regained. This may not be achievable if monitoring occurs at less frequent intervals than, say, 10
percent of the project duration.
Slippage is commonplace and should be a major concern of project managers. It occurs one day at
a time and project managers need to be ever vigilant to keep it from accumulating to an
unacceptable level. Slippage can be caused by complacency or lack of interest, lack of credibility,
incorrect or missing information, lack of understanding, incompetence, and conditions beyond
Time management 39
one's control, such as too much work to do. Project managers need to be on the alert to detect the
existence of any of these factors in order to take appropriate action before they result in slippage.
Project slippage is not inevitable. In fact, there is much project managers can do to limit it. The
tools of progress control are the bar charts or critical path networks described above. The project
manager should take the following steps:
• Establish targets or ‘milestones’ - times by which identifiable complete sections of work
must be completed
• As each target event occurs, compare actual against targeted performance
• Assess the effect of performance to date on future progress
• If necessary, re-plan so as to achieve original targets or to come as near as possible to
achieving them
• Request appropriate action from those directly responsible for the various activities
2.6.4 Change control
The project manager must implement a project change control procedure to provide for effective
control of discretionary changes during the project, and to track non-discretionary changes. Thus,
if a proposed change in scope is requested, the commitment of the change must require specific
approval, given only when the cost and time impacts have been defined. In the case of unavoidable
changes their impact on the project must be systematically incorporated into the project
information system, especially with regard to time and cost changes.
2.7 Software selection
There is a large selection of so-called Project Management software available on the market. The
label is a misnomer - the software provides a tool for ‘scheduling’ projects and, in many cases,
integrated cost/time management.
This does not constitute a tool with the capabilities to turn the user into an instant project manager.
However, effective project management does require the use of appropriate software. The issue
here is on what basis the selection of the software is made.
This is relatively simple if the program is going to be used by a number of people within the
organization for low-level planning, presentation, and control of relatively simple projects. In that
case ease of learning and use becomes the primary criteria. That means, for most people, a
Windows-based tool with sufficient single project or multi-project capability.
In the cases where the scheduling program is required for more complex project management
functions and where the cost of learning to use the software is not an issue, the basis for the
selection will relate to the capabilities of the program required to suit the demands of the particular
situation.
The following elements will be relevant to an informed evaluation of the best tool for a particular
application.
Essential requirements
These must match the specific requirements for the required application in order to be considered
for selection:
• Multi-project capability
• Number of activities per project
• Number of resources per activity
• Resource input capabilities
• Resource calendar options
• Capability to input resource and overhead costs in the form required
• Baseline capabilities for presenting update comparisons
• Presentation graphics capability and flexibility
• Flexibility to tailor cross-tab reports, particularly financial reports

40 Practical project management for engineers and technicians 40
Other considerations
Other issues that will be relevant to the selection include:
• Ease of learning
• Training available
• Hardware requirements
• Product support

Practical Project Management for Engineers and Technicians
YOU MAY ALSO BE INTERESTED IN THE FOLLOWING TITLE:
This book is available for purchase in
printed form or as an ebook
For more details about this title
please visit the link below:
http://www.idc-online.com/content/project-management-engineers-and-technicians-4
If you would like a quote or any further information please do not hesitate to contact us: