Embed Size (px)
Citation preview

Date: July 23, 2015
To: Katie Wu, Energy Division, CPUC
Aaron Lu, Energy Division, CPUC
Pete Skala, Energy Division, CPUC
From: Mike Ting, Itron
This memorandum presents several examples of the methodology that would need to be applied
to integrate the results of the Ex Ante Measure Cost Study (MCS) into the DEER database and
the associated Remote Ex Ante Database Interface (READI).1
Overview of MCS Cost Models
The primary analytic framework used in the MCS was hedonic price modeling – a regression-
based analysis of retail unit prices that allows the price effect of individual features to be
estimated in isolation from all other product features. In the context of estimating incremental
measure costs, hedonic models were used to isolate the price effect of energy efficiency features
and performance. In total, the MCS study team estimated 75 hedonic price models which
covered 38 measure groups. The draft MCS results and report were released for stakeholder
review on March 11, 2014 and the final MCS results and report were published on June 10,
2014. Comprehensive documentation of the data collection methods, data cleaning methods, and
data analysis methods, as well as findings and recommendations are provided in the final report.2
In this memorandum, we provide an overview of the methodology that would need to be applied
to integrate the results of the MCS into the DEER database and READI. At a high level, this
methodology would simply involve entering the “parameter values” from the DEER measure
definitions into the respective MCS cost models in order to generate ex ante measure cost values
1 This work is also referred to as Work Order 017 in the portfolio of 2010-2012 EM&V studies.
2 http://www.energydataweb.com/cpucFiles/pdaDocs/1100/2010-
2012%20WO017%20Ex%20Ante%20Measure%20Cost%20Study%20-%20Final%20Report.pdf

that align directly with the ex ante energy savings values in DEER. More specifically, this would
involve the following steps:
Mapping the variables in the MCS cost models to those in the current DEER measure
definitions
Interacting the parameter values from the DEER measure definitions with the coefficients
estimated from the MCS to estimate average unit prices
Using the MCS results to estimate labor and non-labor installation costs where necessary
for incremental cost accounting (e.g. dual baseline measures, add-on measures)
Using appropriate incremental cost accounting to calculate specific ex ante incremental
costs for as many DEER measures as possible, given the data available from the MCS
An example of the “variable mapping” and “parameter-coefficient interaction” steps is shown in
the graphic below. For refrigerators, the MCS developed a generalized cost model where unit
price (P) is described as function of Energy Star compliance, capacity, type, quarter of sale,
exterior color, through-the-door water/ice dispenser, and rated annual kWh energy consumption.
The regression produces coefficients (β) for each term on the right-hand side of the equation, as
well as an intercept (α). Once the model is specified, estimating the average price for a specific
unit is a simple matter of interacting the parameter inputs (e.g. Energy Star-compliant, side-
mount freezer, 27 ft3 capacity, 620 kWh/yr, etc.) with the estimated coefficients as shown below.

It should be noted that when developing the cost models, the MCS study team prioritized
inclusion of variables that were present in DEER definitions available during time of study
(DEER 2011, READI v1.0.4) in order to allow cost estimates align directly with the ex ante
energy savings values in DEER. In cases where DEER variables were not included in final MCS
cost models, the reason was either that those variables did not contribute to statistically
significant price effects for the technology in question or that those variables were collinear with
other key DEER variables in the cost model.3
As noted above, the incremental costs for some types of measures must also include labor and
non-labor installation costs. Specifically, these cases include: 1) replace-on-burnout (ROB)
measures with “cross-technology baselines”, 2) early replacement measures where dual baseline
accounting must be used, and 3) add-on measures.
To further illustrate how the results of the MCS would be used to produce ex ante incremental
costs that align with current DEER measure definitions, the remainder of this memorandum
provides detailed examples of five cases that we believe are representative of the spectrum of
measure types currently in DEER:
ROB measures with no incremental labor costs;
ROB measures with incremental labor costs due to “cross-technology baselines”;
Early replacement measures with incremental labor costs;
Early replacement measures with incremental labor and other non-labor installation costs;
and
Add-on measures with incremental labor costs.
Example #1: Refrigerators
Energy Star-qualified residential refrigerators are an example of a replace-on-burnout (ROB)
measure where the incremental measure cost is simply the difference in unit price between a new
program-eligible product and a new, standards-compliant baseline product with the identical set
of features (except efficiency performance). In these cases, the baseline is determined by code,
and installation labor costs are identical between the measure case and the code case, i.e.
installation labor costs cancel in the incremental cost calculation.
Below we illustrate how the MCS cost models would be used to calculate the incremental cost
for specific refrigerator measures (and all analogous ROB measures) in DEER.
3 For an extended overview of the model development process including a discussion of collinearity, see section
2.5.2 in the MCS final report.

Measure Definition from READI v.2.2.0
For each refrigerator measure in DEER, a specific measure and baseline definition is provided in
READI. Below is a screenshot of one specific refrigerator measure: an Energy Star refrigerator
with side-mount freezer, through-the-door ice, 15-23 ft3 total volume, and 543 kWh/yr rated
energy consumption installed instead of a code-compliant refrigerator with the same features
except 639 kWh/yr rated energy consumption.
MCS Cost Model for Refrigerators
The table below (extracted from Table 3-3 in the MCS final report) shows the variables included
in the MCS cost model for refrigerators. As the table shows, the MCS cost model includes all of
the variables included in the DEER measure definition, as well as two other variables (calendar
quarter of sale and exterior color) that help explain differences in retail unit prices. For the latter
two variables in the MCS cost model that are not included in the DEER measure definition, the
estimated coefficients are “rolled up” to their market-average values using the sales weights
included in the price data set and treated as constants.
For the variables that are included in the DEER measure definitions (Energy Star, capacity, door
configuration, dispenser, rated annual kWh consumption), calculating average unit price is
simply a matter of multiplying the estimated coefficients (as shown in the table below) by their
parameter values and summing all terms.4 For the measure case, the parameter values would be:
Energy Star=1, capacity=19 ft3, door config=side-by-side, dispenser=1, and rated kWh=543
kWh/yr.5 For the baseline case, the parameter values would be the same with the exception of
rated kWh set to 639 kWh/yr instead of 543 kWh/yr.
4 Note that one must include the intercept estimated in each model in the summation. In the case of refrigerators,
the value of the intercept is $727.
5 Note that 19 ft3 is the mid-point in the 15-23 ft3 capacity range specified in DEER. We chose to use 19 ft3 here
for illustrative purposes, but any value within the stated capacity range can be used.

Technology Variable Type Values Model
Coefficients t-stat s.e.
Weights for Roll-
up to DEER/WP
DEER/WP-
equivalent Coefficients
Refrigerators
(full size residential)
ENERGY STAR Binary Yes -11.64 -1.03 11.34 N/A -11.640
No 0.00 -- -- N/A 0.000
Capacity (Total volume ft3) Continuous 7.8 - 31 23.79 17.60 1.35 N/A 23.790
Type Categorical
Freezer on Bottom 0.00 -- -- N/A 0.000
Freezer on Top -391.09 -24.90 15.74 N/A -391.091
French Doors 308.33 18.40 16.78 N/A 308.330
Side-by-Side -548.29 -29.20 18.75 N/A -548.290
Quarter Categorical
1 0.00 -- -- 0.129
-43.578 2 -34.90 -3.90 8.86 0.271
3 -42.00 -4.90 8.53 0.361
4 -79.30 -8.70 9.08 0.239
Color Categorical
White 0.00 -- -- 0.395
86.623
Bisque 71.51 2.51 28.51 0.009
Black 14.77 1.92 7.71 0.185
Other 169.17 6.17 27.42 0.010
Stainless 250.38 32.31 7.75 0.312
Stainless Look 40.00 3.96 10.10 0.090
Dispenser Binary Yes 521.50 42.90 12.15 N/A 521.500
No 0.00 -- -- N/A 0.000
kWh/yr Continuous 253 - 728 -0.47 -5.20 0.09 N/A -0.471
Incremental Cost Calculation
Because the installation labor in the measure and code cases is identical in this type of ROB
situation, the incremental cost is simply the difference in unit price strictly due to efficiency
performance, as summarized in the table below.
Equipment Spec, Installation Scenario
Unit Price Installation Labor Cost
Total Installed Cost
MCS baseline installed cost
Non-EStar, side-by-side, TTD ice, 19 ft3 TV, 639 kWh/yr
$894.00 N/A $894.00
MCS full measure installed cost
EStar, side-by-side, TTD ice, 19 ft3 TV, 543 kWh/yr
$927.57 N/A $927.57
MCS incremental measure cost
$33.58 N/A $33.58
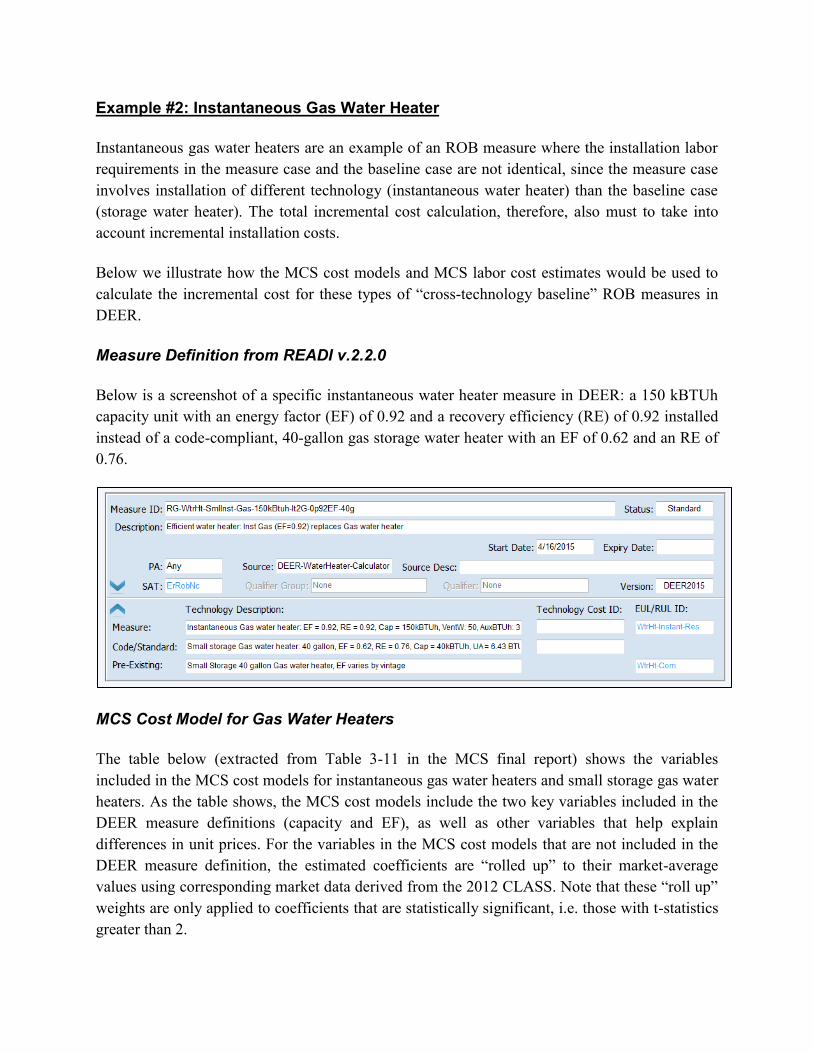
Example #2: Instantaneous Gas Water Heater
Instantaneous gas water heaters are an example of an ROB measure where the installation labor
requirements in the measure case and the baseline case are not identical, since the measure case
involves installation of different technology (instantaneous water heater) than the baseline case
(storage water heater). The total incremental cost calculation, therefore, also must to take into
account incremental installation costs.
Below we illustrate how the MCS cost models and MCS labor cost estimates would be used to
calculate the incremental cost for these types of “cross-technology baseline” ROB measures in
DEER.
Measure Definition from READI v.2.2.0
Below is a screenshot of a specific instantaneous water heater measure in DEER: a 150 kBTUh
capacity unit with an energy factor (EF) of 0.92 and a recovery efficiency (RE) of 0.92 installed
instead of a code-compliant, 40-gallon gas storage water heater with an EF of 0.62 and an RE of
0.76.
MCS Cost Model for Gas Water Heaters
The table below (extracted from Table 3-11 in the MCS final report) shows the variables
included in the MCS cost models for instantaneous gas water heaters and small storage gas water
heaters. As the table shows, the MCS cost models include the two key variables included in the
DEER measure definitions (capacity and EF), as well as other variables that help explain
differences in unit prices. For the variables in the MCS cost models that are not included in the
DEER measure definition, the estimated coefficients are “rolled up” to their market-average
values using corresponding market data derived from the 2012 CLASS. Note that these “roll up”
weights are only applied to coefficients that are statistically significant, i.e. those with t-statistics
greater than 2.

As before, calculating average unit price is simply a matter of multiplying the estimated
coefficients (as shown in the table below) by their parameter values and summing all terms.6 For
the measure case, the parameter values would be: capacity=150 kBTUh and EF=0.92. For the
baseline case, the parameter values would be: capacity=40 gallons, EF=0.62, and forced draft=0.
Note that although RE is specified in the DEER definitions of both the measure and baseline
units, variations in RE do not have a statistically significant impact on price.
Technology Variable Type Values Model Coefficients
t-stat s.e. Weights for Roll-up to DEER/WP
DEER/WP-equivalent Coefficients
Tankless WH
Energy Factor Continuous 82 - 92 (.82-.92) 13.98 2.97 4.71 N/A 13.980
Capacity (kbtuh)
Continuous 120-250 5.55 8.47 0.66 N/A 5.550
Rheem Binary Yes -119.99 -2.60 46.15 0.313
-37.497 No 0.00 -- -- 0.688
Small Storage Gas WH (<= 75,000 BtuH and EF rated)
Energy Factor Continuous 0.58-0.7 2332.51 2.32 1005.12 N/A 2332.506
Rated Volume (gallons)
Continuous 30-65 9.07 2.08 4.36 N/A 9.068
Forced Draft Binary Yes 473.20 5.17 91.47 0.315
148.972 No 0.00 -- -- 0.685
Manufacturer Categorical
AO Smith -163.91 -0.95 173.27 0.000
0.000
Bradford-White Co.
0.00 -- -- 0.000
Rheem 4.63 0.05 100.95 0.000
State Industries -33.31 -0.35 94.80 0.000
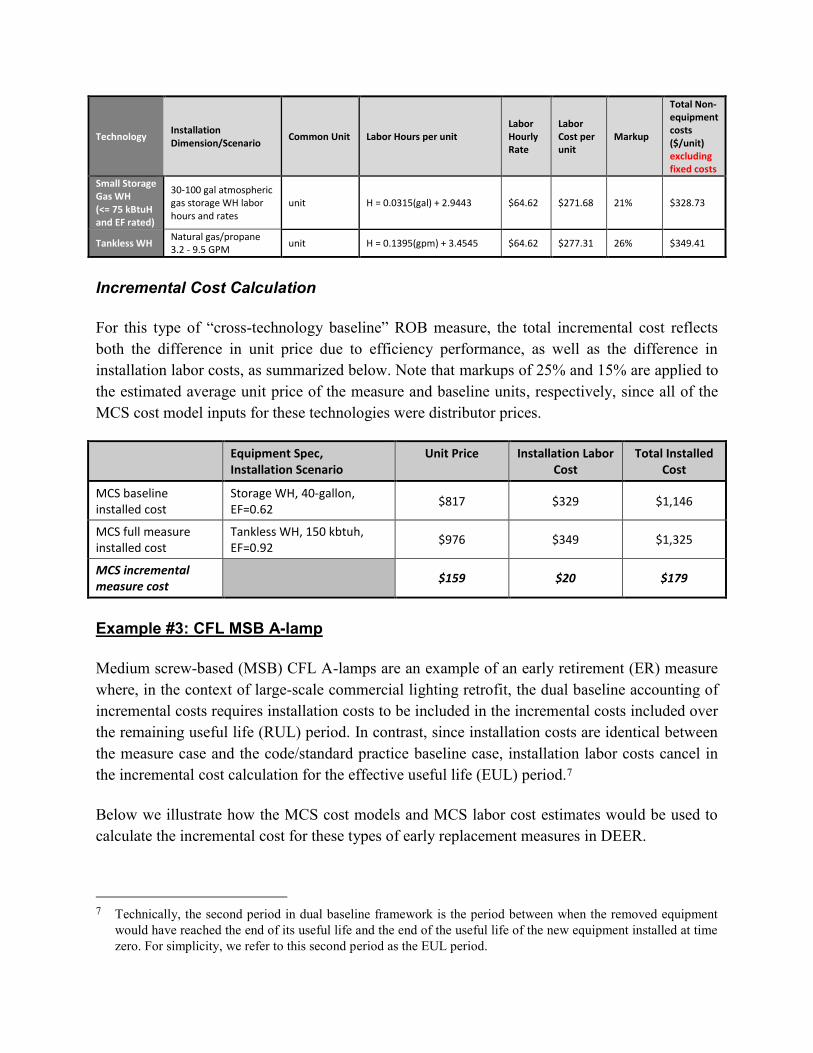
MCS Labor Costs for Gas Water Heaters
As noted above, since the measure case involves installation of different technology
(instantaneous water heater) than the baseline case (storage water heater), the total incremental
cost calculation must also to take into account incremental installation costs. The table below
(extracted from Table 4-13 in the MCS final report) shows the per-unit installation labor costs
for these respective technologies. Note that installation labor hours for instantaneous water
heaters is expressed as a function of the gallons per minute (GPM) rating of the unit rather than
the kBTUh capacity rating, since GPM is a closer proxy for the physical size (and weight) of the
unit. For the example below, we used assumed a 150 kBTUh unit has an average GPM rating of
6.0. Note also that the average mark up for installation labor associated with instantaneous water
heaters (as estimated in RSMeans) is slightly higher than that for storage water heaters.
6 Note that one must include the intercept estimated in each model in the summation. For tankless water heaters,
the value of the intercept is -$1,300. For small gas storage water heaters, the value of the intercept is -$1,248.
Technology Installation Dimension/Scenario
Common Unit Labor Hours per unit Labor Hourly Rate
Labor Cost per unit
Markup
Total Non-equipment costs ($/unit) excluding fixed costs
Small Storage Gas WH (<= 75 kBtuH and EF rated)
30-100 gal atmospheric gas storage WH labor hours and rates
unit H = 0.0315(gal) + 2.9443 $64.62 $271.68 21% $328.73
Tankless WH Natural gas/propane 3.2 - 9.5 GPM
unit H = 0.1395(gpm) + 3.4545 $64.62 $277.31 26% $349.41
Incremental Cost Calculation
For this type of “cross-technology baseline” ROB measure, the total incremental cost reflects
both the difference in unit price due to efficiency performance, as well as the difference in
installation labor costs, as summarized below. Note that markups of 25% and 15% are applied to
the estimated average unit price of the measure and baseline units, respectively, since all of the
MCS cost model inputs for these technologies were distributor prices.
Equipment Spec, Installation Scenario
Unit Price Installation Labor Cost
Total Installed Cost
MCS baseline installed cost
Storage WH, 40-gallon, EF=0.62
$817 $329 $1,146
MCS full measure installed cost
Tankless WH, 150 kbtuh, EF=0.92
$976 $349 $1,325
MCS incremental measure cost
$159 $20 $179
Example #3: CFL MSB A-lamp
Medium screw-based (MSB) CFL A-lamps are an example of an early retirement (ER) measure
where, in the context of large-scale commercial lighting retrofit, the dual baseline accounting of
incremental costs requires installation costs to be included in the incremental costs included over
the remaining useful life (RUL) period. In contrast, since installation costs are identical between
the measure case and the code/standard practice baseline case, installation labor costs cancel in
the incremental cost calculation for the effective useful life (EUL) period.7
Below we illustrate how the MCS cost models and MCS labor cost estimates would be used to
calculate the incremental cost for these types of early replacement measures in DEER.
7 Technically, the second period in dual baseline framework is the period between when the removed equipment
would have reached the end of its useful life and the end of the useful life of the new equipment installed at time
zero. For simplicity, we refer to this second period as the EUL period.

Measure Definition from READI v.2.2.0
Below is a screenshot of a specific CFL twister measure in DEER: a 13 watt, 660 lumen integral-
ballast CFL twister lamp replacing a functioning existing 45 watt incandescent A-lamp.8
MCS Cost Models for MSB Lighting
The table below (extracted from Table 3-8 in the MCS final report) shows the variables included
in the MCS cost models for MSB lighting. As the table shows, the MCS cost models include the
key variable included in the DEER measure definitions (wattage), as well as other variables that
help explain differences in unit prices.9 For the variables in the MCS cost models that are not
included in the DEER measure definition, the estimated coefficients are “rolled up” to their
market-average values using corresponding market data derived from the 2013 Retail Lighting
Shelf Survey (RLSS). Note that these “roll up” weights are only applied to coefficients that are
statistically significant, i.e. those with t-statistics greater than 2.
As before, calculating average unit price is simply a matter of multiplying the estimated
coefficients (as shown in the table below) by their parameter values and summing all terms.10 For
the measure case, the parameter values would be: A-lamp=0 (i.e. CFL twister), three-way=0,
dimmable=0, utility discount=0, rated life=10,000 hours, and watts=13. For the baseline case,
the parameter values would be: EISA=1, three-way=0, rated life=1,500 hours, and watts over
30=15.
8 45 watts is equal to the DEER “delta watts” shown in the screenshot above (3.47) multiplied by the specified
CFL wattage (3.47 x 13 watts = 45 watts).
9 Note that in both the incandescent and CFL cost models, lumen output was highly collinear with lamp wattage
and therefore was removed as an explanatory variable from the respective model specifications.
10 Note that one must include the intercept estimated in each model in the summation. For incandescent A-lamps,
the value of the intercept is $2.13. For CFL A-lamps and twisters, the value of the intercept is $3.04.

Technology Variable Type Values Model Coefficients
t-stat s.e. Weights for Roll-up to DEER/WP
DEER/WP-equivalent Coefficients
Incandescent A-Lamp
Channel Categorical
Home Improvement 0.00 . . 0.036
0.237
Drug Store 0.99 14.91 0.07 0.096
Grocery 0.25 3.09 0.08 0.151
Hardware 0.42 7.15 0.06 0.140
Mass Merchandise 0.13 2.03 0.06 0.356
Membership Club 0.42 0.89 0.47 0.000
EISA Binary Yes 0.33 4.02 0.08 N/A 0.334
No 0.00 . . N/A 0.000
Package size: 2 or more
Binary Yes -1.69
-21.56
0.08 0.919 -1.551
No 0.00 . . 0.081
Package size: 3 or more
Binary Yes -1.16
-20.36
0.06 0.789 -0.912
No 0.00 . . 0.211
Three-way Binary Yes 0.46 4.90 0.09 N/A 0.462
No 0.00 . . N/A 0.000
National brand Binary Yes 0.83 11.17 0.07 0.718
0.599 No 0.00 . . 0.282
Expected Life (1000s of hours)
Continuous .6-15 0.20 6.63 0.03 N/A 0.199
Watts over 30 Continuous 0 - 120 0.01 5.16 0.00 N/A 0.009
Watts over 75 Continuous 0 - 75 -0.01 -3.21 0.00 N/A -0.009
CFL A-Lamps and Twisters
Channel Categorical
Home Improvement 0.00 . . 0.105
-0.150
Drug Store 1.22 11.58 0.11 0.063
Grocery -0.37 -2.60 0.14 0.325
Hardware 1.13 11.46 0.10 0.087
Mass Merchandise -0.30 -3.18 0.09 0.179
Membership Club -1.02 -4.79 0.21 0.146
A-lamp Indicator Binary Yes 1.84 18.16 0.10 N/A 1.841
No 0.00 . . N/A 0.000
Package size: 2 or more
Binary Yes -1.81
-21.60
0.08 0.756 -1.365
No 0.00 . . 0.244
Package size: 4 or more
Binary Yes -1.13
-11.08
0.10 0.425 -0.480
No 0.00 . . 0.575
Three-way Binary Yes 6.75 35.65 0.19 N/A 6.751
No 0.00 . . N/A 0.000
Dimmable Binary Yes 5.81 42.95 0.14 N/A 5.805
No 0.00 . . N/A 0.000
National brand, no Binary Yes 1.11 14.52 0.08 0.473 0.527

Technology Variable Type Values Model Coefficients
t-stat s.e. Weights for Roll-up to DEER/WP
DEER/WP-equivalent Coefficients
utility discount No 0.00 . . 0.527
Utility discount, A-Lamp
Binary Yes -3.52 -5.40 0.65 N/A -3.515
No 0.00 . . N/A 0.000
Utility discount, Twister
Binary Yes -1.80 -7.34 0.25 N/A -1.804
No 0.00 . . N/A 0.000
Expected Life (1000s of hours)
Continuous 1-15 0.06 3.54 0.02 N/A 0.062
Watts Continuous 4-55 0.07 10.05 0.01 N/A 0.067
Watts over 25 Continuous 0-30 0.09 4.69 0.02 N/A 0.094
MCS Labor Costs for MSB Lighting
As noted above, since the measure case involves replacing existing, still-functioning equipment
higher-efficiency versions of the same equipment, so the total incremental cost calculation must
also take into account installation costs over the RUL period. The table below (extracted from
Table 4-13 in the MCS final report) shows the per-unit installation labor costs for these
respective technologies. Note that installation labor hours, labor rates, and markups for
installation of incandescent A-lamps and CFL twisters are identical.
Technology Installation Dimension/Scenario Common Unit
Labor Hours per unit
Labor Hourly Rate
Labor Cost per unit
Markup
Total Non-equipment costs ($/unit) excluding fixed costs
Incandescent A-Lamps
Labor hours and rates lamp 0.08 $58.27 $4.64 24% $5.75
CFL A-Lamps and Twisters
Labor hours and rates lamp 0.08 $58.27 $4.64 24% $5.75
Incremental Cost Calculation
For this type of early replacement measure, the total incremental cost calculation differs for the
RUL and EUL periods. For the RUL period, total incremental costs reflect both the difference in
unit price, as well as the installation labor costs of the measure, as summarized below. For the
EUL period, total incremental costs reflect only the difference in the unit price between the
measure and the baseline.

Equipment Spec, Installation Scenario
Unit Price Installation Labor Cost
Total Installed Cost
MCS baseline installed cost
Incandescent A-lamp, EISA-compliant, 1,500 hr rated life, 45 watts
$1.27 $5.75 $7.02
MCS full measure installed cost
CFL twister, 10,000 hr rated life, 13 watts
$3.06 $5.75 $8.81
MCS incremental measure cost (RUL)
$3.06 $5.75 $8.81
MCS incremental
measure cost (EUL) 11 $1.79 $0 $1.79
Example #4: Water-Cooled Chiller
Water-cooled chillers are an example of an early retirement (ER) measure where the dual
baseline accounting of incremental costs requires both labor-related and other non-labor related
installation costs to be included in the incremental costs included over the remaining useful life
(RUL) period. In contrast, since installation costs are identical between the measure case and the
code/standard practice baseline case, installation labor costs cancel in the incremental cost
calculation for the effective useful life (EUL) period.
Below we illustrate how the MCS cost models and MCS labor cost estimates would be used to
calculate the incremental cost for these types of early replacement measures in DEER.
Measure Definition from READI v.2.2.0
Below is a screenshot of a specific water-cooled chiller measure in DEER: a 150-299 ton,
0.574kW/ton, water-cooled screw chiller replacing a less efficient, functional water-cooled screw
chiller of the same capacity.
11 Note that in the case of CFLs, since the rated life of CFLs is so much longer than the incandescent lamps they
replace, the baseline installed cost for the EUL period would technically need to reflect the cost of replacing
incandescent lamps at multiple points in time to cover the EUL of the CFL lamp. In the dual baseline framework,
those future baseline costs would then need to be properly discounted to account for the time value of money. In
this sense, what is shown in the table above are the time zero incremental costs for the RUL and EUL period.

MCS Cost Model for Water-Cooled Chillers
The table below (extracted from Table 3-17 in the MCS final report) shows the variables
included in the MCS cost models for water-cooled chillers. As the table shows, the MCS cost
models include the three key variables included in the DEER measure definitions. As before,
calculating average unit price is simply a matter of multiplying the estimated coefficients (as
shown in the table below) by their parameter values and summing all terms.12 For the measure
case, the parameter values would be: capacity=200 tons, kW/ton=0.574, and compressor
type=screw. For the baseline code case, the parameter values would be: capacity=200 tons,
kW/ton=0.680, and compressor type=screw.
Technology Variable Type Values Model Coefficients
t-stat s.e. Weights for Roll-up to DEER/WP
DEER/WP-equivalent Coefficients
Water-Cooled Chillers (excluding centrifugal VSD)
Capacity (tons) Continuous 59.9-550 251.29 8.45 29.74 N/A 251.293
kW/ton Continuous 0.478-0.769 -200329.95 -3.52 56925.61 N/A -200329.951
Compressor type Categorical
Centrifugal -18496.30 -2.93 6309.64 N/A -18496.303
Screw 0.00 -- -- N/A 0.000
Scroll -4315.70 -0.58 7472.94 N/A -4315.696
MCS Labor Costs for Water-Cooled Chillers
As noted above, since the measure case involves replacing existing, still-functioning equipment
higher-efficiency versions of the same equipment, so the total incremental cost calculation must
take into account installation costs over the RUL period. For ER measures involving large capital
equipment such as chillers, these installation labor costs can vary widely depending on the
location and conditions of the installation site (e.g. roof mount vs. ground mount). Additionally,
there are also significant other non-labor installation costs that must be taken into account as
12 Note that one must include the intercept estimated in each model in the summation. For water-cooled chillers,
the value of the intercept is $163,883.

well. In the case of water-cooled chillers, these non-labor installation costs include crane rental,
engineering/survey, project management, permits, insurance, bond, contingency, and warranty.
The table below (extracted from Table 4-10 in the MCS final report) shows the per-unit
installation labor costs, per-unit miscellaneous costs, and miscellaneous fixed costs for water-
cooled chiller installations.
Technology Installation Dimension/Scenario
Common Unit
Labor Hrs per unit
Labor Hourly Rate
Labor Cost per unit
Misc Costs per unit
Misc Fixed Costs (per project)
Mar
kup
Total Non-equipment costs ($/unit) excluding fixed costs
Water-Cooled Chillers (excluding centrifugal VSD)
100 ton ground mount Labor and non-equipment costs
tons 1.145
$71.49
$81.86 $203.9031 $1,400.00
25%
$357.20
200 ton ground mount Labor and non-equipment costs
tons 0.788 $56.30 $179.9490 $2,150.00 $295.31
300 ton ground mount Labor and non-equipment costs
tons 0.605 $43.25 $155.0163 $2,750.00 $247.84
100 ton basement Labor and non-equipment costs
tons 1.585 $113.31 $215.6396 $5,000.00 $411.19
200 ton basement Labor and non-equipment costs
tons 1.058 $75.60 $185.5025 $5,500.00 $326.38
300 ton basement Labor and non-equipment costs
tons 0.740 $52.90 $159.1166 $6,250.00 $265.03
100 ton roof mount Labor and non-equipment costs
tons 1.330 $95.08 $214.7769 $3,250.00 $387.33
200 ton roof mount Labor and non-equipment costs
tons 0.855 $61.13 $183.0231 $4,000.00 $305.19
300 ton roof mount Labor and non-equipment costs
tons 0.673 $48.14 $157.4424 $4,750.00 $256.98
Incremental Cost Calculation
For this type of early replacement measure, the total incremental cost calculation differs for the
RUL and EUL periods. For the RUL period, total incremental costs reflect both the difference in
unit price, as well as the total installation costs (labor and non-labor) of the measure, as
summarized below. For the EUL period, total incremental costs reflect only the difference in the
unit price between the measure and the baseline. Note that a 20% markup is applied to the
estimated average unit price of both the measure and baseline units since all of the MCS cost
model inputs for these technologies were distributor prices.

Equipment Spec, Installation Scenario
Unit Price Installation Labor Cost
Non-Labor Installation Cost
Total Installed Cost
MCS baseline installed cost
Water-cooled screw chiller, 200 tons, 0.680 kW/ton, roof mount
$93,500 $15,28113 $50,75614 $159,538
MCS full measure installed cost
Water-cooled screw chiller, 200 tons, 0.574 kW/ton, roof mount
$118,982 $15,281 $50,756 $185,020
MCS incremental measure cost (RUL)
$118,982 $15,281 $50,756 $185,019
MCS incremental measure cost (EUL)
$25,482 $0 $0 $25,482
Example #5: Occupancy Sensor
Occupancy sensors are an example of an add-on measure where the incremental measure cost is
equal to the full installed cost of the measure. In these cases, the baseline condition is the
absence of the measure, so no baseline costs need to be accounted for.
Below we illustrate how the MCS cost models would be used to calculate the incremental cost
for a specific occupancy sensor measure (and all analogous add-on measures) in DEER.
Measure Definition from READI v.2.2.0
Below is a screenshot of one specific occupancy sensor measure: an occupancy sensor pack that
provides 200 ft2 of sensing coverage.
13 200 tons * 0.855 hrs/ton * $71.49/hr * 1.25 = $15,281.
14 (200 tons * $183.0231/ton + $4,000) * 1.25 = $50,756.
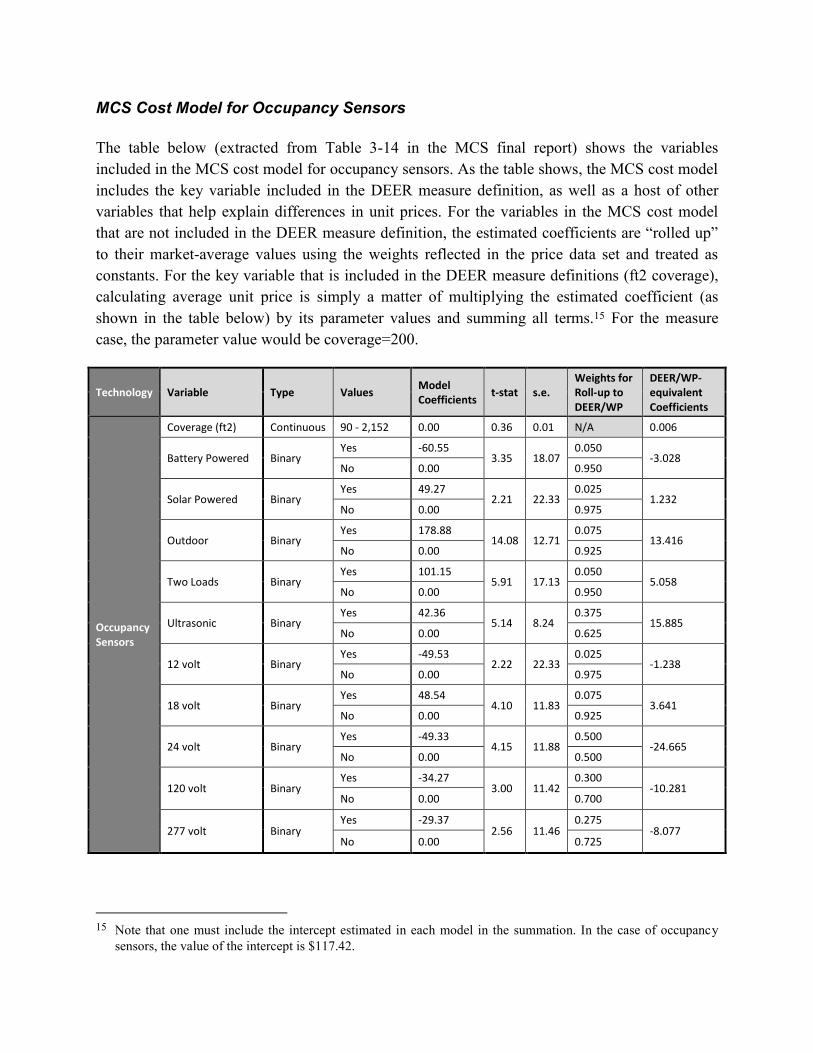
MCS Cost Model for Occupancy Sensors
The table below (extracted from Table 3-14 in the MCS final report) shows the variables
included in the MCS cost model for occupancy sensors. As the table shows, the MCS cost model
includes the key variable included in the DEER measure definition, as well as a host of other
variables that help explain differences in unit prices. For the variables in the MCS cost model
that are not included in the DEER measure definition, the estimated coefficients are “rolled up”
to their market-average values using the weights reflected in the price data set and treated as
constants. For the key variable that is included in the DEER measure definitions (ft2 coverage),
calculating average unit price is simply a matter of multiplying the estimated coefficient (as
shown in the table below) by its parameter values and summing all terms.15 For the measure
case, the parameter value would be coverage=200.
Technology Variable Type Values Model Coefficients
t-stat s.e. Weights for Roll-up to DEER/WP
DEER/WP-equivalent Coefficients
Occupancy Sensors
Coverage (ft2) Continuous 90 - 2,152 0.00 0.36 0.01 N/A 0.006
Battery Powered Binary Yes -60.55
3.35 18.07 0.050
-3.028 No 0.00 0.950
Solar Powered Binary Yes 49.27
2.21 22.33 0.025
1.232 No 0.00 0.975
Outdoor Binary Yes 178.88
14.08 12.71 0.075
13.416 No 0.00 0.925
Two Loads Binary Yes 101.15
5.91 17.13 0.050
5.058 No 0.00 0.950
Ultrasonic Binary Yes 42.36
5.14 8.24 0.375
15.885 No 0.00 0.625
12 volt Binary Yes -49.53
2.22 22.33 0.025
-1.238 No 0.00 0.975
18 volt Binary Yes 48.54
4.10 11.83 0.075
3.641 No 0.00 0.925
24 volt Binary Yes -49.33
4.15 11.88 0.500
-24.665 No 0.00 0.500
120 volt Binary Yes -34.27
3.00 11.42 0.300
-10.281 No 0.00 0.700
277 volt Binary Yes -29.37
2.56 11.46 0.275
-8.077 No 0.00 0.725
15 Note that one must include the intercept estimated in each model in the summation. In the case of occupancy
sensors, the value of the intercept is $117.42.

MCS Labor Costs for Occupancy Sensors
As noted above, since the measure case involves installing a technology to work with existing
systems, the total incremental cost is the full installed cost and therefore must take into account
installation labor costs and non-labor installation costs. The table below (extracted from Table 4-
6 in the MCS final report) shows the per-unit installation labor costs for these respective
technologies. For add-on measures like occupancy sensors, installation labor costs can vary
widely depending on the location and conditions of the installation (e.g. wall-mounted vs.
ceiling-mounted sensors). In the specific case of occupancy sensors, there are also other non-
labor installation costs that must be taken into account as well, such as removal and disposal of
the manual switches.
Technology Installation Dimension/Scenario Common Unit
Labor Hours per unit
Labor Hourly Rate
Labor Cost per unit
Miscellaneous Costs per unit
Markup
Total Non-equipment costs ($/unit) excluding fixed costs
Occupancy Sensors
Wall mounted labor sensor 1.1946 $67.55
26%
$91.85 Wall mounted disposal and taxes sensor $5.34
Ceiling mounted labor sensor 1.5098 $85.38 $124.11
Ceiling mounted disposal and taxes sensor $13.12
Fixture integrated labor sensor 1.1355 $64.21 $90.46
Fixture integrated disposal and taxes sensor $7.58
Labor rate sensor $56.55
Incremental Cost Calculation
For this type of add-on measure, the total incremental cost reflects the total installed cost of the
measure, including unit price, installation labor costs, and non-labor installation costs, as
summarized below. Note that a 26% markup is applied to the estimated average unit price of the
measure units since all of the MCS cost model inputs for these technologies were distributor
prices.
Equipment Spec, Installation Scenario
Unit Price Installation Labor Cost
Non-Labor Installation Cost
Total Installed Cost
MCS baseline installed cost
Manual switches N/A N/A N/A N/A
MCS full measure installed cost
Occupancy sensor, 200 ft2 coverage, wall mount
$138.20 $85.12 $6.73 $230.05
MCS incremental measure cost
$138.20 $85.12 $6.73 $230.05