Embed Size (px)
Citation preview

Overview of Corporate Financial Statements
Or . . . What are all those numbers anyway?


Required Financial Statements
Financial Position at the end of the period;
Earnings for the period;
Cash flows during the period; and
Investments by and distributions to owners during the period.

The Accounting EquationThe Accounting Equation
AssetsAssets =
Resources owned by the firmowned by the firm with the potential to provide future economic future economic benefitsbenefits, as a result of past transactions or events.

The Accounting EquationThe Accounting Equation
AssetsAssets = LiabilitiesLiabilities
Creditors’ fixed claims on the assetsresulting from pastpast transactions and representing probable future probable future sacrifices sacrifices of economic benefits (resources).

The Accounting EquationThe Accounting Equation
AssetsAssets LiabilitiesLiabilities Owners’Equity
Owners’Equity= +
Owners’ residualresidual interest after all liabilities have been settled.

The Accounting EquationThe Accounting Equation
AssetsAssets LiabilitiesLiabilities Owners’Equity
Owners’Equity
CapitalStock
CapitalStock
RetainedEarnings
RetainedEarnings
= +
Earned Capital
Invested Capital
The Accounting EquationThe Accounting Equation
AssetsAssets LiabilitiesLiabilities Owners’Equity
Owners’Equity
CapitalStock
CapitalStock
RetainedEarnings
RetainedEarnings
RevenueRevenue
= +
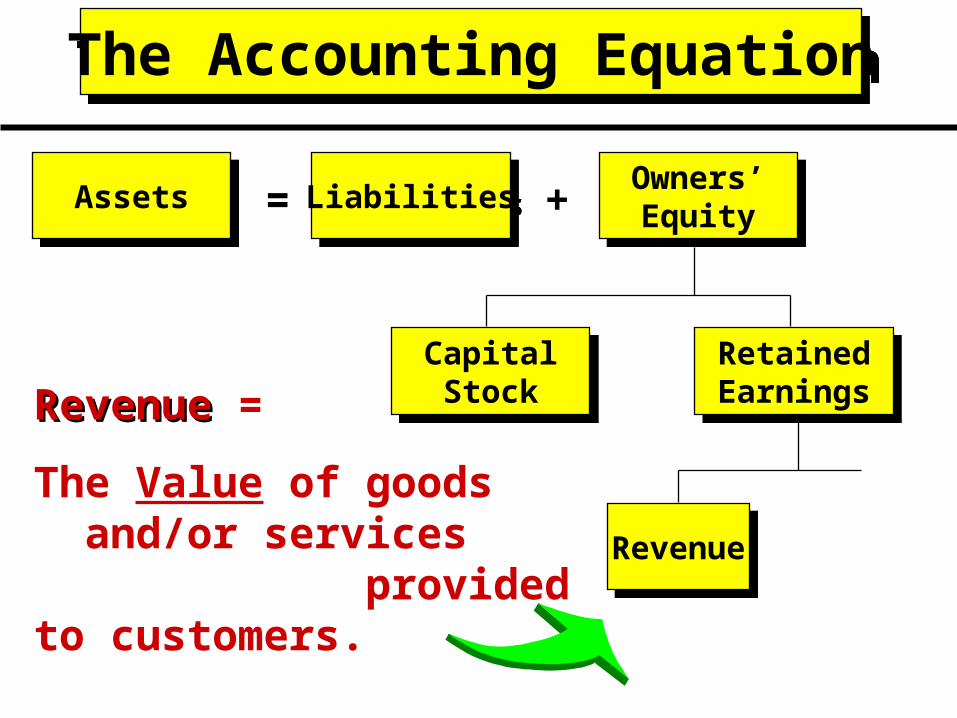
RevenueRevenue =
The Value of goods and/or services provided to customers.
The Accounting EquationThe Accounting Equation
AssetsAssets LiabilitiesLiabilities Owners’Equity
Owners’Equity
CapitalStock
CapitalStock
RetainedEarningsRetainedEarnings
ExpensesExpensesRevenueRevenue
= +
-
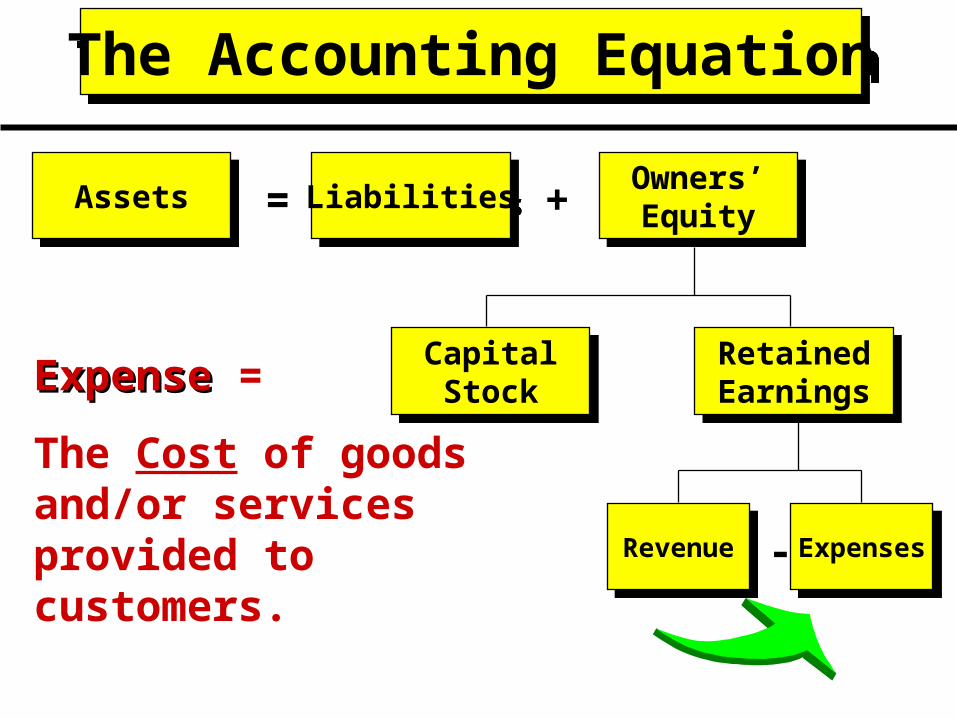
ExpenseExpense =
The Cost of goods and/or services provided to customers.

The Accounting EquationThe Accounting Equation
AssetsAssets LiabilitiesLiabilities Owners’Equity
Owners’Equity
CapitalStock
CapitalStock
RetainedEarnings
RetainedEarnings
ExpensesExpensesRevenueRevenue
= +
NetIncome
NetIncome
-
=
Net IncomeNet Income =
Net Value added to the firm

The Financial Statements
Financial Statements
We will illustrate the “set” of financial statements by examining Sourdough Alaska, Inc. 2001 and 2002 financial statements.Sourdough Alaska is a fictitious company
but it will provide us with an opportunity to examine the individual statements.

The Balance Sheet
AKA: Statement of Financial Position . . .
The Balance Sheet . . .
A Balance sheet lists a firm’s
assets,
liabilities, and
owners’ equity
at a given point in time. That is, it is a snapshot of the financial position of a firm at a specific point in time.

2002 2001 AmountPercentIncrease/Decrease
$1,2007,0008,000
450$16,650
6,5006,0003,000
15,500$32,150
$2,600($1,400)(53.8%)4,0009,750
150$16,500
6,5006,0001,500
14,000$30,500
3,000($1,750)
300$150
000
1,5001,500
$1,650
75.0%(17.9%)200.0%
0.9%
0.0%0.0%
100.0%10.7%5.4%
Current Assets Cash Accounts Rec. Net Inventory Prepaid Expenses Total Current Assets
Property and Equipment Land Buildings, Net Equipment, Net Total Prop. & Equip.TOTAL ASSETS
ASSETS
Sourdough Alaska, Inc.Balance Sheet
Sourdough Alaska, Inc.Balance Sheet
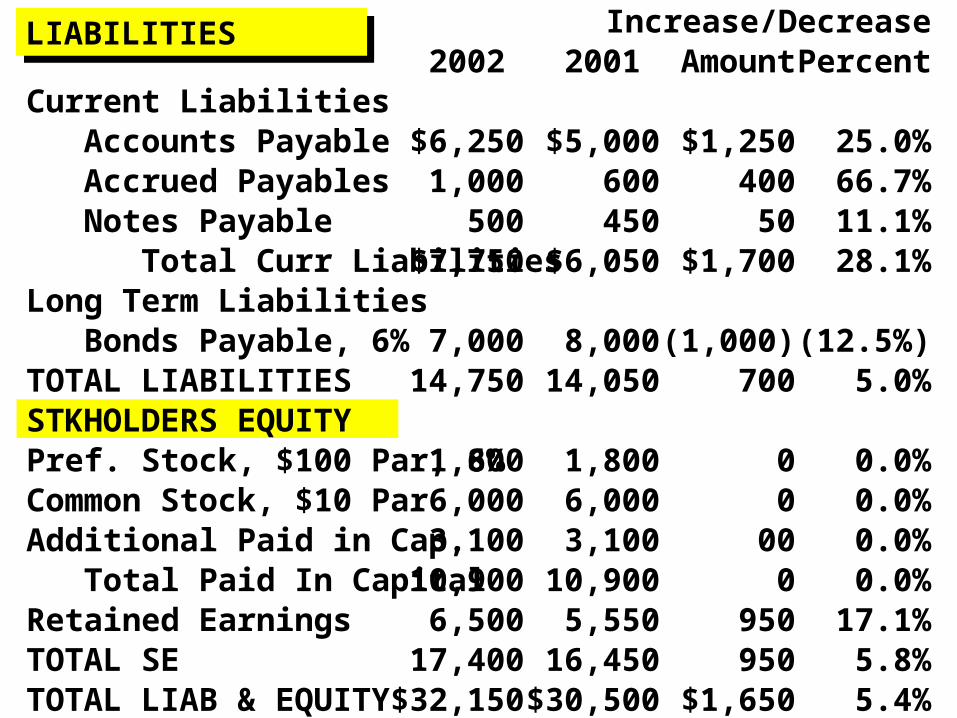
1,000 600 400 66.7%
2002 2001 AmountPercentIncrease/Decrease
500$7,750
7,00014,750
1,8006,0003,100
10,9006,500
17,400$32,150
450 50 11.1%$6,050 $1,700 28.1%
8,00014,050
1,8006,0003,100
10,9005,550
16,450$30,500
(1,000)700
00
000
950950
$1,650
(12.5%)5.0%
0.0%0.0%0.0%0.0%
17.1%5.8%5.4%
Notes Payable Total Curr LiabilitiesLong Term Liabilities Bonds Payable, 6%TOTAL LIABILITIESSTKHOLDERS EQUITYPref. Stock, $100 Par, 6%Common Stock, $10 ParAdditional Paid in Cap. Total Paid In CapitalRetained EarningsTOTAL SETOTAL LIAB & EQUITY
$6,250 $5,000 $1,250 25.0% Accrued Payables Accounts Payable
LIABILITIESLIABILITIES
Current Liabilities

Current Assets . . .
Consist of cash and other assets the firm expects to convert into cash within one year or the operating cycle, whichever is longer.
A firm’s operating cycle is the average time from when materials are purchased to when sales of finished goods or services yield cash.

Current Assets . . .
Are listed in order of liquidity; that is, how easily they can be converted into cash.
A typical order would be:
Cash and cash equivalents
Marketable securities
Receivables
Inventory

2002 2001 AmountPercentIncrease/Decrease
$1,2007,0008,000
450$16,650
6,5006,0003,000
15,500$32,150
$2,600($1,400)(53.8%)4,0009,750
150$16,500
6,5006,0001,500
14,000$30,500
3,000($1,750)
300$150
000
1,5001,500
$1,650
75.0%(17.9%)200.0%
0.9%
0.0%0.0%
100.0%10.7%5.4%
Current Assets Cash Accounts Rec. Net Inventory Prepaid Expenses Total Current Assets
Property and Equipment Land Buildings, Net Equipment, Net Total Prop. & Equip.TOTAL ASSETS
ASSETS
Sourdough Alaska, Inc.Balance Sheet
Sourdough Alaska, Inc.Balance Sheet

Noncurrent Assets . . .
Consist of those assets that do not meet the definition of a current asset.
Noncurrent assets include . . .
Long-term receivables;
Investments;
Property, plant and equipment; and
Purchased intangible assets

2002 2001 AmountPercentIncrease/Decrease
$1,2007,0008,000
450$16,650
6,5006,0003,000
15,500$32,150
$2,600($1,400)(53.8%)4,0009,750
150$16,500
6,5006,0001,500
14,000$30,500
3,000($1,750)
300$150
000
1,5001,500
$1,650
75.0%(17.9%)200.0%
0.9%
0.0%0.0%
100.0%10.7%5.4%
Current Assets Cash Accounts Rec. Net Inventory Prepaid Expenses Total Current Assets
Property and Equipment Land Buildings, Net Equipment, Net Total Prop. & Equip.TOTAL ASSETS
ASSETS
Sourdough Alaska, Inc.Balance Sheet
Sourdough Alaska, Inc.Balance Sheet
Current Liabilities . . .
. . . are obligations the firm expects to discharge over the next year, either through using current assets or by creating new current liabilities.
Typical current liabilities . ..Accounts PayableShort-term debtAccrued expenses of various kinds

1,000 600 400 66.7%
2002 2001 AmountPercentIncrease/Decrease
500$7,750
7,00014,750
1,8006,0003,100
10,9006,500
17,400$32,150
450 50 11.1%$6,050 $1,700 28.1%
8,00014,050
1,8006,0003,100
10,9005,550
16,450$30,500
(1,000)700
00
000
950950
$1,650
(12.5%)5.0%
0.0%0.0%0.0%0.0%
17.1%5.8%5.4%
Notes Payable Total Curr LiabilitiesLong Term Liabilities Bonds Payable, 6%TOTAL LIABILITIESSTKHOLDERS EQUITYPref. Stock, $100 Par, 6%Common Stock, $10 ParAdditional Paid in Cap. Total Paid In CapitalRetained EarningsTOTAL SETOTAL LIAB & EQUITY
$6,250 $5,000 $1,250 25.0% Accrued Payables Accounts Payable
LIABILITIES
Current Liabilities
Noncurrent Liabilities . . .
. . . are long-term liabilities that do not meet the definition of current liabilities.
Noncurrent Liabilities include . . .
Long-term debt;
Capital Leases;
Deferred Tax Liabilities

1,000 600 400 66.7%
2002 2001 AmountPercentIncrease/Decrease
500$7,750
7,00014,750
1,8006,0003,100
10,9006,500
17,400$32,150
450 50 11.1%$6,050 $1,700 28.1%
8,00014,050
1,8006,0003,100
10,9005,550
16,450$30,500
(1,000)700
00
000
950950
$1,650
(12.5%)5.0%
0.0%0.0%0.0%0.0%
17.1%5.8%5.4%
Notes Payable Total Curr LiabilitiesLong Term Liabilities Bonds Payable, 6%TOTAL LIABILITIESSTKHOLDERS EQUITYPref. Stock, $100 Par, 6%Common Stock, $10 ParAdditional Paid in Cap. Total Paid In CapitalRetained EarningsTOTAL SETOTAL LIAB & EQUITY
$6,250 $5,000 $1,250 25.0% Accrued Payables Accounts Payable
LIABILITIES
Current Liabilities

Owners’ Equity . . .
Typically has three major components:
Contributed Capital
Common and preferred stock at par value
Additional paid-in capital
Retained Earnings
Treasury Common or Preferred Stock

1,000 600 400 66.7%
2002 2001 AmountPercentIncrease/Decrease
500$7,750
7,00014,750
1,8006,0003,100
10,9006,500
17,400$32,150
450 50 11.1%$6,050 $1,700 28.1%
8,00014,050
1,8006,0003,100
10,9005,550
16,450$30,500
(1,000)700
00
000
950950
$1,650
(12.5%)5.0%
0.0%0.0%0.0%0.0%
17.1%5.8%5.4%
Notes Payable Total Curr LiabilitiesLong Term Liabilities Bonds Payable, 6%TOTAL LIABILITIESSTKHOLDERS EQUITYPref. Stock, $100 Par, 6%Common Stock, $10 ParAdditional Paid in Cap. Total Paid In CapitalRetained EarningsTOTAL SETOTAL LIAB & EQUITY
$6,250 $5,000 $1,250 25.0% Accrued Payables Accounts Payable
LIABILITIES
Current Liabilities

The Income Statement
AKA: Statement of Operations . . .

Income Statement . . .
Summarizes the firm’s operating activities over a given period of time.
An income statement always begins by reporting revenue
Key expenses are then subtracted from revenues to yield operating income

$55,000$52,000 $3,000 5.8%38,000
$17,000
$7,5006,300
$13,800
$3,200436
$2,7641,106
$1,658
36,000$16,000
$7,0006,000
$13,000
$3,000435
$2,5651,026
$1,539
2,000$1,000
$500300
$800
$2001
$19980
$119
5.6%6.3%
7.1%5.0%6.2%
6.7%0.2%7.8%7.8%
7.8%
SalesCost of Goods SoldGross Margin
Operating Expenses: Selling Expenses Administrative Exp.Total Operating Expense
Net Operating IncomeInterest ExpenseNet Income Before Taxes Income Taxes
Net Income
2002 2001 AmountPercentIncrease/DecreaseSourdough Alaska, Inc.
Income StatementSourdough Alaska, Inc.
Income Statement

Income Statement . . .
Immediately following operating income:
Nonoperating income,
Income tax expense,
Effects of discontinued operations,
Extraordinary items,

Income Statement . . .
Immediately following operating income:
Cumulative effects of changes in accounting principles
Net Income

For Example
Let’s briefly examine the Bridgeport Let’s briefly examine the Bridgeport Corporation Income Statement for the Corporation Income Statement for the year ended December 31, 2002.year ended December 31, 2002.

Bridgeport CorporationIncome Statement
For the Year Ended December 31, 2002
Bridgeport CorporationIncome Statement
For the Year Ended December 31, 2002
Sales $2,000,000
Gross Profit $800,000
Income from operations $350,000
Operating Expenses
Selling
Administrative 450,000170,000
$280,000
Cost of Goods Sold 1,200,000

Bridgeport CorporationIncome Statement
For the Year Ended December 31, 2002
Bridgeport CorporationIncome Statement
For the Year Ended December 31, 2002
Income From Operations $350,000
Other Revenue (Expense)
Loss on sale of machinery (50,000)1
Inc. From Continuing Opns. BT
Income Tax on Continuing Operations
Income From Continuing Operations
$300,000
120,000
$180,000
2

Bridgeport CorporationIncome Statement
For the Year Ended December 31, 2002
Bridgeport CorporationIncome Statement
For the Year Ended December 31, 2002
Income From Continuing Operations $180,000
Earnings From Sunrise Division operations, less applicable taxes ($110,000 - $44,000)
Loss on disposal of Sunrise facilities, less tax savings ($250,000 - $100,000)
Income Before Extraordinary Item
66,000
(150,000)
$96,000
3

Bridgeport CorporationIncome Statement
For the Year Ended December 31, 2002
Bridgeport CorporationIncome Statement
For the Year Ended December 31, 2002
Income Before Extraordinary Item $96,000
Extraordinary Item Flood loss, less tax savings ($60,000 - $24,000) (36,000)
4
Cumulative effect on prior years of a change in accounting principle, less applicable taxes ($25,000 - $10,000)
Net Income
15,000
$75,000
5

The Statement of Cash Flows
Where the cash came from . . . and Where the cash went . . .

Statement of Cash Flows
A statement of cash flows subdivides the change in a firm’s cash balance over the period into three categories . . .
operating activities
investing activities, or
financing activities

Statement of Cash Flows
Is used extensively by creditors who are interested in . .
The extent to which the firm will be able to meet interest payments on its current and potential future debt; and
The firm’s liquidity, solvency, and financial flexibility.

Statement of Cash Flows
Is used extensively by investors, who are interested in . . .
The firm’s ability to pay future dividends from future operating cash flows; and
The firm’s liquidity, solvency, and financial flexibility.

W. T. Grant Co.W. T. Grant Co.“Retailing With A Difference”
A Classic Example . . .

The W. T. Grant Co.
The W. T. Grant Company was the nation’s largest retailer when it filed for protection under Chapter XI of the bankruptcy act on October 2, 1975.
Four months later the company was liquidated.

What Happened?

Chain of Events . . .
1906: First store opened
1928: Public stock offering
1950: Had 500 stores
1963: W. T. Grant retired
1969: Opened 410 new stores
1973: Stock sold at 20 times earnings

Chain of Events . . .
1974: Borrowed $600 million
1974: Stock price was at $2 from a high of $71
1974: Hired new president
1975: Opened 6 new stores
1975: Closed 107 stores and laid off 7,000 employees

Chain of Events . . .
Oct. 1975: Chairman, Senior VP and all outside directors resigned - FILED FOR CHPT 11 BANKRUPTCY.
Feb. 1976: Judge ordered liquidation in 60 days
Apr. 1976: Company adjudicated as a bankrupt.

40
20
-20
0
-40
-100
Millions of Dollars
19681966 1970 1972 1974
Net Income
Working Capital Provided By Operations
Cash Flow Provided by Operations
W. T. Grant CompanyW. T. Grant Company

The Statement of Cash Flows

Where Does It Fit In?

The Income Statement
Focuses on the results of operations and reveals a firm’s revenues and expenses for a given accounting period.

The Balance Sheet . . .
Discloses information on the economic resources, financial obligations, and stock-holders’ equity of a business enterprise at a specific point in time.

Inherent Limitations
Neither the Balance Sheet nor the Income Statement disclose specific events or transactions that occurred during the period.

What caused the change?
1. Purchase $25,000 of Equipment?
The Balance Sheet doesn’t say!
Examine Two Balance SheetsExamine Two Balance Sheets
Property Plantand Equipment
2001$50,000
Property Plantand Equipment
2001$50,000
Property Plantand Equipment
2002$75,000
Property Plantand Equipment
2002$75,000
Difference$25,000
Difference$25,000
2. Sell/Buy with net change of $25,000?
P.S.: The Income Statement doesn’t either!

The Statement of Shareholder’s Equity

Statement of Shareholders’ Equity
. . . details the changes in shareholders’ equity accounts from one period to the next.
Financial Statement Articulation
Or . . . How do the financial statements fit together?

Income Statement Notes
Statement of Cash
Flows
Balance Sheet
Statement of Owners
Equity
Financial Statement ArticulationFinancial Statement Articulation

Statement of Cash
Flows
Statement of Owners
Equity
Balance Sheet
Income Statement
Notes
Financial Statement ArticulationFinancial Statement Articulation

Financial Statement ArticulationOr, How the Financial Statements Fit Together
Financial Statement ArticulationOr, How the Financial Statements Fit Together
Balance Sheetas of
12/31/01
Balance Sheetas of
12/31/01
Income StatementFor Period Ending
12/31/02
Income StatementFor Period Ending
12/31/02
Balance Sheetas of
12/31/02
Balance Sheetas of
12/31/02
Statement of Cash FlowsFor Period Ending
12/31/02
Statement of Cash FlowsFor Period Ending
12/31/02

Notes to the Financial Statements
Or . . . Helping us to read between the lines . . .

Notes to the Financial Statements
Notes are valuable to many different user groups because of the wealth of information they provide about the firm’s:
Operating activities,
Investing activities, and
Financing activities

Notes to the Financial Statements
Some is information that is not formally recognized in the financial statements, but is either . . .
Mandated by the FASB to be disclosed in notes, or
Is voluntarily disclosed by the firm.

Notes to the Financial Statements
Note #1
It is crucial that the reader carefully scrutinize note 1 with a view to under-standing management’s objectives as revealed through its choices in accounting methods.
Management objectives may not always agree with investor objectives.

Notes to the Financial Statements
The sophisticated reader can use the notes to adjust the stated information in the firm’s financial statements . . .
to make adjustments based on his or her own analysis of such off-financial statement items.


![[2] Reports AntWhere AnyWay](https://img.dokumen.tips/doc/110x75/577dae321a28ab223f901ee6/2-reports-antwhere-anyway.jpg)