Embed Size (px)
Citation preview

Overview

Chart 1 European sovereign spreads(a)
Sources: Thomson Reuters Datastream and Bank calculations.
(a)Spread of ten-year government bond yields over German bunds for selected countries. Data to close of business on 10 June.(b) December 2009 Report.

Chart 2 Market uncertainty(a)
Sources: Bloomberg, British Bankers’ Association, Chicago Mercantile Exchange, Euronext.liffe, JPMorgan Chase & Co. and Bank calculations.
(a) Three-month option-implied volatilities. For further details, see Chart 3.3.

Chart 3 Indicators of risk appetite(a)(b)
Sources: Bloomberg, Credit Suisse and Bank calculations.
(a) Indices are adjusted so that positive numbers in both series indicate increased risk-taking and negative numbers indicate reduced risk-taking. (b)Data to close of business on 14 June 2010.(c)Mean and standard deviation calculated from 28 July 2004.
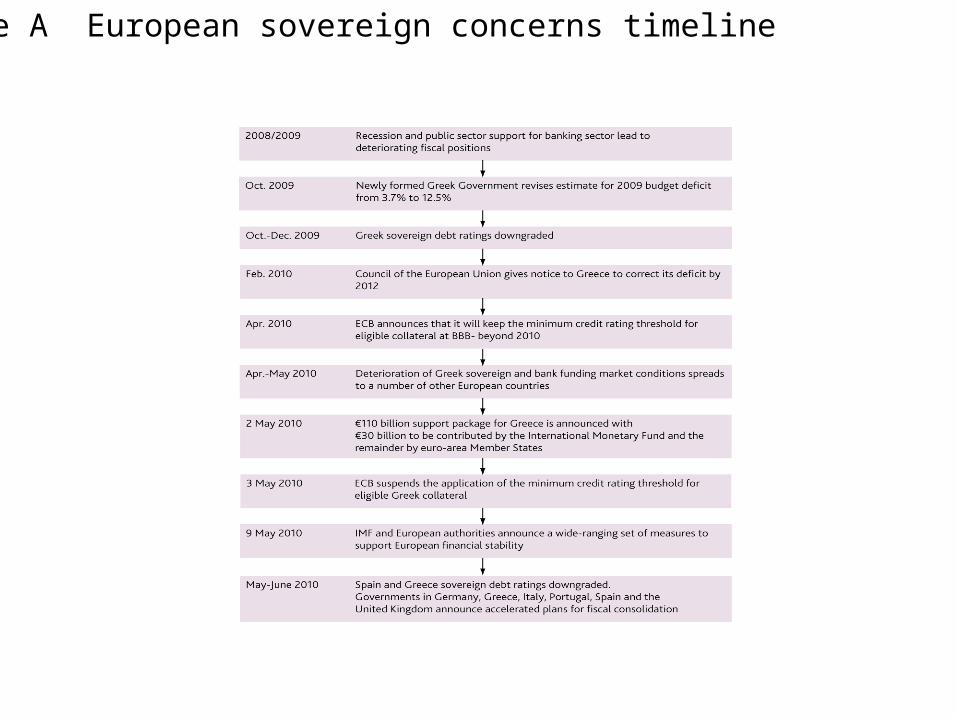
Table A European sovereign concerns timeline

Key risksRisks most
challenging to manage
May 2010 Nov. 2009 May 2010 Nov. 2009
Sovereign risk and/or concerns about public debt 69 24 43 3
Economic downturn 67 68 43 41
Regulation, taxes on banks 41 49 33 35
Funding and liquidity problems 33 35 20 30
Financial market disruption/dislocation
28 30 20 19
Property price falls 28 27 6 5
Tight credit conditions 20 24 7 11
Household and corporate defaults 17 49 11 22
Election uncertainty 17 0 0 0
Financial institution failure/distress 15 11 11 14
Table B Systemic Risk Survey results: key risks to the UK financial system(a)
Sources: Bank of England Systemic Risk Surveys and Bank calculations.
(a)Per cent of respondents citing each risk. Market participants were asked to list (in free format) the five risks they believed would have the greatest impact on the UK financial system if they were to materialise, as well as the three risks they would find most challenging to manage as a firm. Risks cited in the previous survey have been regrouped into categories used to describe the latest data.
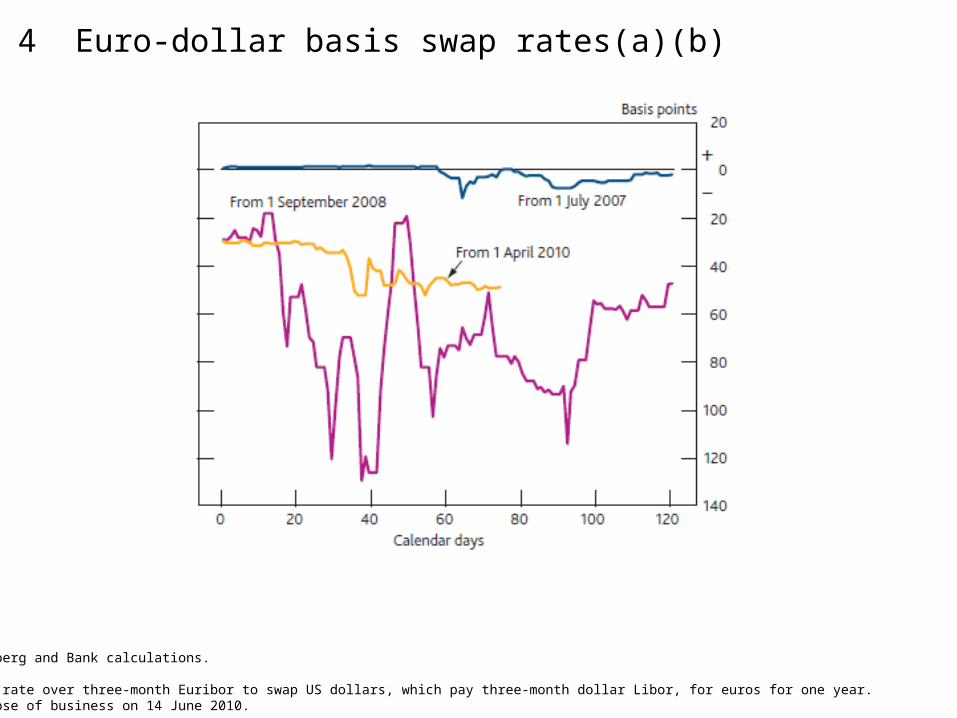
Chart 4 Euro-dollar basis swap rates(a)(b)
Sources: Bloomberg and Bank calculations.
(a) Additional rate over three-month Euribor to swap US dollars, which pay three-month dollar Libor, for euros for one year.(b) Data to close of business on 14 June 2010.

Chart 5 Tier 1 capital ratios for selected Europeanbanking systems(a)(b)
Sources: Capital IQ, Moody’s Investors Service, published accounts and Bank calculations.
(a) Includes banks with total assets of more than US$100 billion.(b) Aggregated from individual banks, weighted by total assets.

Chart 6 Changes in major UK banks’ gross leverage ratio(a)(b)
Sources: Bank of England, published accounts and Bank calculations.
(a)Bank of England estimates used to correct for a change in the reporting basis of loans to UK households — see Bank of England: Monetary and Financial Statistics (May 2009), Table A4.1 and footnotes. (b)Gross leverage is calculated as total assets divided by total equity. By accounting for derivatives positions on a gross basis, this measure best captures the risks around the associated counterparty exposures.(c) Other financial corporations.(d) Private non-financial corporations.

Chart 7 Selected BIS banks’ claims on public sectors(a)(b)
Sources: Bank for International Settlements (BIS), European Central Bank and Bank calculations.
(a)Chart shows exposures of each country to the public sectors of other selected countries and to its own public sector. All claims are as a fraction of 2008 aggregate shareholder equity.(b)All claims exclude guarantees and derivatives. Claims of German banks are not adjusted for risk transfers. (c)Exposures to own public sector.

Chart 8 Market-implied probability distributions of S&P 500(a)
Sources: Chicago Mercantile Exchange and Bank calculations.
(a) One year ahead. For further details, see footnote (a) in Chart 3.15.(b)Taken as 10 March 2009.(c)Taken as 23 April 2010.
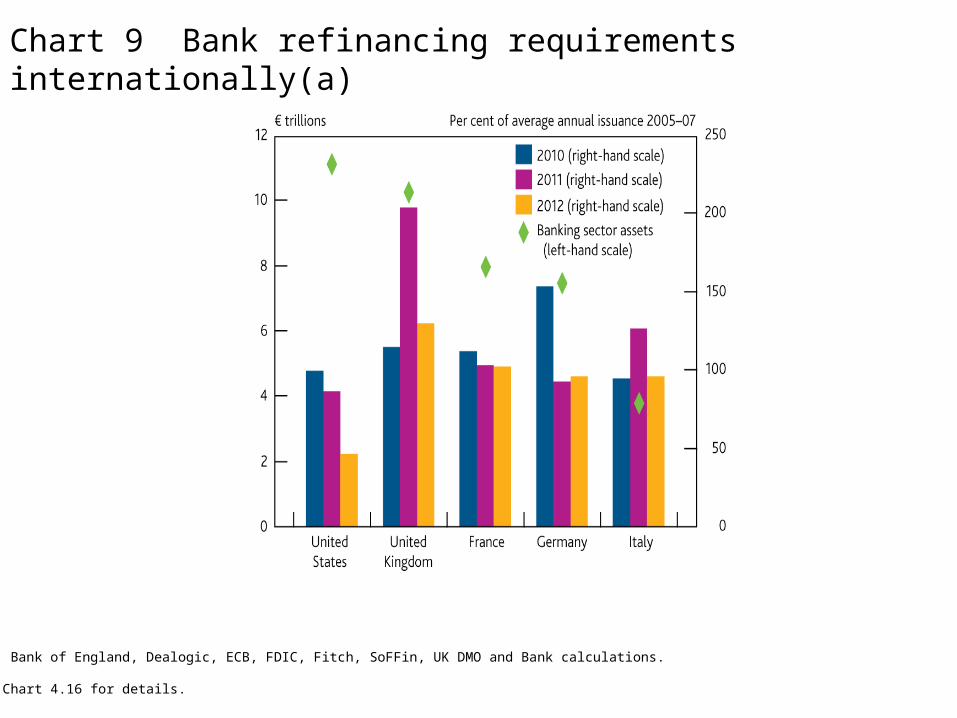
Chart 9 Bank refinancing requirements internationally(a)
Sources: Bank of England, Dealogic, ECB, FDIC, Fitch, SoFFin, UK DMO and Bank calculations.
(a) See Chart 4.16 for details.

Chart 10 Capital accumulation achievable through lowerdiscretionary distributions by UK banks(a)(b)
Sources: Published accounts and Bank calculations.
(a)Lines indicate staff compensation and dividend ratios that would generate various levels of retained capital, and are based on major UK banks’ 2009 results. Diamonds indicate compensation to revenue and dividend to revenue ratios for the major UK banks in various years. Diamonds for 2005–08 are not indicative of capital retained in 2005–08, as results in these years differ from the 2009 results used to calibrate the lines.
(b)Compensation to revenue and dividend to revenue ratios were high in 2008, partly due to lower revenue in that year. Though the 2008 ratios are outside the limits of this chart, they are presented in Chart 4.20.
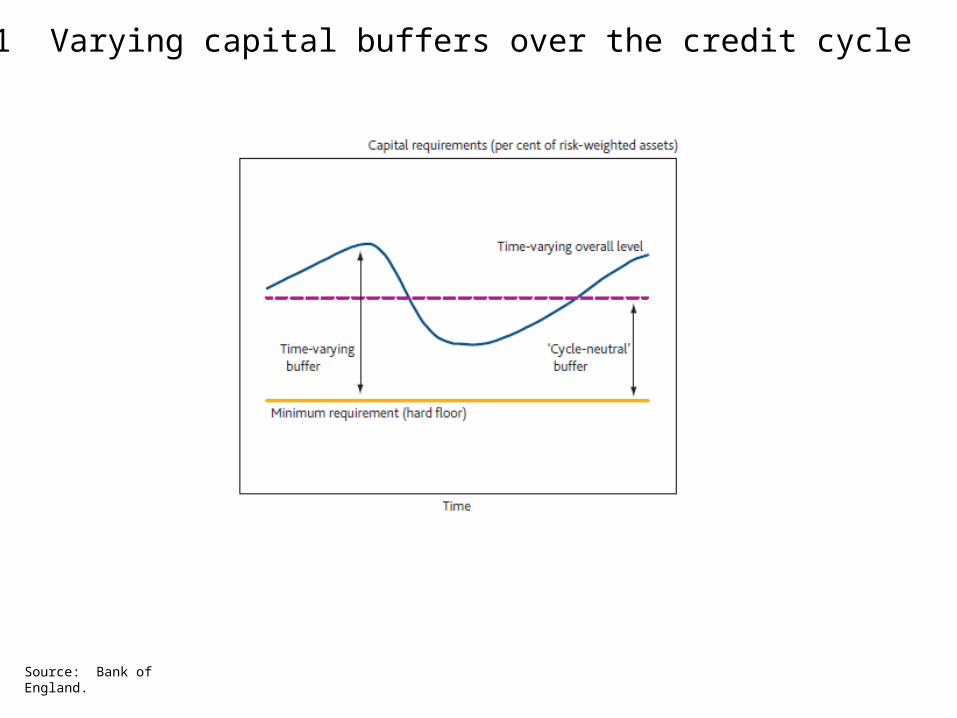
Chart 11 Varying capital buffers over the credit cycle
Source: Bank of England.

Sources: Building Societies Association, published accounts and Bank calculations.
(a) ‘Big’ includes Barclays, HBOS, HSBC, Lloyds TSB and RBS; ‘medium’ includes Alliance & Leicester, Bradford & Bingley, Nationwide and Northern Rock; ‘small’ includes all current building societies except Nationwide. Based on subsample of institutions for 1998–2000.
Chart 12 Liabilities of banks and building societies by size(a)