Embed Size (px)
Citation preview
Individual Equity Return Data From Thomson Datastream: Handle with Care!
December 2003
PRELIMINARY (Please do not quote without permission)
* PO Box 117168, 321 Stuzin Hall, Gainesville, FL 32611-7168. Email: [email protected] and [email protected]. Phone: (352) 392-8928. We would like to thank Ralf Elsas.... for their many helpful comments. Any remaining errors remain ours alone.

1
Abstract
We compare individual equity return data from Thomson Datastream (TDS) for one large national equity market, the United States, to the source most often used by academics, the Center for Research in Security Prices (CRSP) for the period 1975-2002 in order to evaluate the suitability of TDS for use in studies involving large numbers of individual equities in markets outside the U.S. We discover important issues of coverage, classification, and data integrity and find that naive use of TDS data can have a large impact on economic inferences, particularly early in the sample period and among smaller stocks. We show that after careful screening of the TDS data that although differences remain, inferences drawn from TDS data are similar to those drawn from CRSP.
2
I. Introduction
International asset pricing occupies a prominent position in the finance literature.
From a U.S. perspective, non-U.S. equity markets provide an opportunity to verify results
from tests using U.S. data. The study of all markets is also interesting in its own right.
Studies of market integration, market comovement, the benefits from international
diversification etc., add to our understanding of finance in an important way. A
necessary condition for conducting such research is the availability of high quality equity
return data. There exist many sources for non US equity return data including that
maintained by the Pacific-Basin Research Center (PACAP) for eight Asian markets
beginning in 1975 as well as the individual markets themselves. Alternatively, many
researchers have used Thomson Datastream (TDS) for its broad and deep coverage. We
know of no current alternative to TDS in terms of number of markets covered and stocks
covered in each market.
We evaluate the use of Thomson Datastream data for academic research by
comparing TDS data for U.S. equities to the "standard" academic source, The Center for
Research in Securities Prices (CRSP). The CRSP data is maintained specifically for
research of US equity markets so is an appropriate standard. We are not evaluating TDS
vs. CRSP per se; rather we use the comparison between the two databases to identify
issues that may be relevant in the use of TDS data for non-U.S. equities. In all of what
follows we never use CRSP to make corrections to TDS, rather we screen the TDS data
independently then compare the results to CRSP to see how well our proposed screens
perform. Since users of international TDS equity data rarely have an independent source
available, the procedures we develop must not require an independent data source in
order to be of practical use.
To our knowledge, this is the first formal examination of the TDS equity return data
as a research database even though several papers make use of worldwide equity return
data from this source. Examples include Griffin, Ji, and Martin (2003) and Naranjo and
Porter (2003) who examine the interaction between country neutral momentum strategies,
Griffin (2002) who examines whether country-specific or global versions of Fama and
3
French's three factor model better explain time-series variation in international stock
returns, and Porter (2003) who investigates the interaction between market-wide liquidity
shocks in national equity markets. Many authors use Thomson Datastream to compile
samples of all stocks traded within a national market. Examples include Clare and
Priestley (1998) for Malaysian stocks, Brooks, Faff, and Fry (2001) for Australia,
Pinfold, Wilson and Li for New Zealand, Hiller and Marshal (2002) in the U.K., Lau,
Lee, and McInish (2002) for Singapore and Malaysia, and Elsas (2003) for Germany.
We focus on issues of coverage, classification, and data integrity. We begin by
downloading price, shares outstanding, and total return data for all equities traded in the
U.S. and included by TDS in their research lists and lists of equities that are no longer
traded (dead) for the period 1975-2002. We compare this data to the CRSP universe
during the same time period.
Our investigation reveals several problems with using TDS data for research
involving broad market coverage. Most troubling is the inability to easily distinguish
between the various types of securities traded on equity exchanges. We also find that
classification variables often reflect only the most current values. For example, a security
that begins trading on the Nasdaq NMS and later delists and begins trading on the non-
Nasdaq OTC market would be classified as a non-Nasdaq OTC security by TDS
throughout the sample period. We also identify several issues with calculating total
returns using return variables provided by TDS.
Most of the problems identified in this paper are concentrated among the smaller size
deciles calculated using NYSE breakpoints. We illustrate the effects of these problems
on inferences by reporting sample statistics on size decile portfolios and by reporting the
profits from simple momentum strategies. It is well known that portfolios short recent
losers and long recent winners will be concentrated in smaller stocks since small stocks
tend to have higher variance; therefore data problems with calculating returns of small
stocks will likely show up in momentum portfolio returns. We find that the well
documented momentum effect in returns is not detectable in the raw TDS data.
4
We screen the TDS data in two steps. First we attempt to identify the non-common
equity securities included in our TDS sample. Second we run a series of screens to
identify 'unusual' return patterns and either replace the returns in question using
information contained in other TDS variables or drop the observations from our sample.
Although we develop our rules for screening observations using only information from
TDS, we verify using CRSP that our screens do not drop valid observations.
We give an overview of the Thomson Datastream data in Section II, and document
our extraction methods. Section III compares the coverage of TDS and CRSP in the U.S.
Section IV identifies idiosyncratic problems with using TDS return data, Section V
compares dividend data from CRSP and TDS and Section VI summarizes our findings
and concludes.
II. Datastream Overview
Thomson Datastream (TDS) has price, volume, market capitalization and dividend
data for approximately 50,000 equities covering 64 developed and emerging markets with
up to 25 years of data. There is also considerable accounting, fixed income, index,
commodity, macroeconomic time series, interest rate, and exchange rate data available,
although none of this is discussed in this paper.
To download security data we make use of constituent lists. TDS constituent lists are
maintained by TDS and contain all firms in an industry, sector or market. Each list
contains the TDS identification numbers of all firms that are part of the list. We use lists
FAMERA – FAMERZ (one list for each letter of the alphabet) for equities currently
trading in the U.S. and DEADUS1 – DEADUS6 for equities that are no longer traded.
We download daily data for all days between 1/1/1975 and 12/31/2002 and create
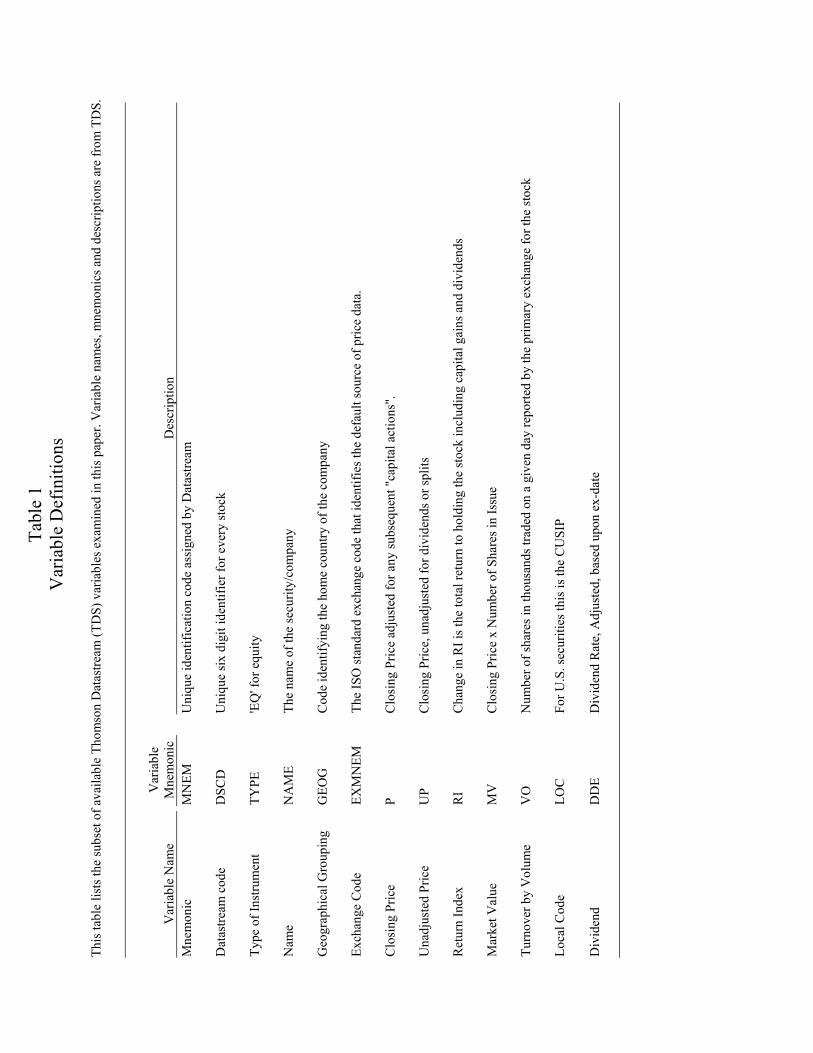
monthly returns from end-of-month daily data1. Table 1 lists the TDS variables we use
and their definitions. For comparison we use the entire CRSP universe for the same time
period including delisting returns and partial period data.
1 This yields exactly the same return series as requesting monthly frequency data. We request the more detailed data to help us in developing rules to screen the data.
5
Extracting a large volume of data from TDS can take many days due to limitations on
how much data can be extracted in a day. The length of time required along with the
constant updating nature of the data can cause some difficulties. For example, we
download the current data first followed by the dead equities, otherwise a firm that ceases
trading while the data is being extracted will be lost.
The approach used by TDS and CRSP when a user requests data after a firm ceases
trading is different. CRSP will report no data whereas TDS reports the last valid data
point. TDS pads the time period after the firm ceases trading with constant values equal
to the last month (or day) that the firm traded. To identify and eliminate these dummy
records we delete all monthly observations from TDS from the end of the sample to the
first non-zero return. We realize that a small number of valid zero return observations
may be lost at the end of the sample2.
Table 2 provides summary statistics on the data from the two sources with non-
missing return data. We have 22,832 unique permnos (CRSP Permanent Issue Number)
and 2,256,605 monthly observations from CRSP and 21,245 unique TDS identifiers and
2,048,255 observations from Thomson Datastream. Of the CRSP observations,
1,941,744 or 86% are share code 10 and 11 defined as common equity of U.S. based
companies. Most market studies using CRSP data restrict themselves to these share
codes. Of the TDS observations, 2,002,459 or 98% have TYPE equal to EQ (Equity).
Within common stock, CRSP has 503,107 monthly NYSE observations compared to
TDS with 946,940, or almost twice as many as CRSP. As we will show, most of this
discrepancy is due to the inclusion of non-common equity securities by TDS that are
traded on the NYSE. Somewhat surprisingly, there are fewer TDS observations
associated with AMEX (124,521) and Nasdaq (472,398) than CRSP observations on the
same exchanges (230,497 and 1,208,137 respectively).
2 TDS lists a variable "TIME" defined as "date of last equity price data", however a random check of several securities shows this variable to be uninformative for U.S. equities. In many cases the variable value is #N/A (for example: Integrated Silicon Systems) or the value does not coincide with actual return data available on both TDS and CRSP (see EMS Systems whose value for the TDS variable TIME is 12/29/1989 but has valid CRSP and TDS data through May (CRSP) and April (TDS) of 1990.)
6
We show the potential impact on inferences by calculating equal-weighted market
returns, equal-weighted returns by exchange, size decile returns, and the returns to two
momentum trading strategies. Our CRSP dataset for this exercise contains all equities
with share code equal to 10 or 11 (common equity) and that are traded on the NYSE,
AMEX, or Nasdaq exchanges. The TDS dataset contains all securities of type 'EQ'
(equity) and have an exchange identifier of NYSE, AMEX, Nasdaq-NMS, or Nasdaq-
nonNMS. No other data screens or checks have been used. Table 3 presents the results.
The TDS equal-weighted average market return of 2.40% per month is 72% higher
than the comparable CRSP average return of 1.41% per month. The time series
correlation of the equal-weighted market return series is 0.66. The value-weighted
market returns are more similar with nearly identical mean returns and a time series
correlation of 0.998, implying the differences between the two datasets is concentrated
among smaller issues.
Comparing equal-weighted returns by market we see that the biggest difference is
among AMEX firms, although as we will see later this is due in large part to errors in the
return data. Mean returns calculated from TDS are also much higher than those
calculated from CRSP for both NYSE and Nasdaq firms. The NYSE return series have a
correlation of 0.84 and the Nasdaq series have a correlation of 0.93. Comparing size
decile returns we see the largest differences in the smaller deciles.
The momentum trading strategy results are consistent with the large disparity in the
smaller decile returns between the two data sources. Using CRSP data, a strategy long
the top 10% of firms ranked on average return over months t-2 through t-12 and short the
bottom 10% and held for one month before rebalancing, referred to in the table as a 1090
strategy, earns an average monthly return of 1.13% with an associated t-statistic of 2.86.
A comparable strategy using TDS data results in an average of 0.26% per month and we
cannot reject the null that the average return is zero. The results from a 3070 strategy are
even more different with the return calculated from CRSP data equal to and average of
0.95% per month with an associated t-statistic of 3.65 while the average return calculated
from TDS is negative.
7
It is clear that there are important differences between the two data sources and that
these differences are concentrated in the smaller size deciles. In the next section we
explore differences in coverage between the two data sources and discuss a method of
screening the TDS database for securities that researchers may wish to exclude.
III. Coverage
To isolate the differences in coverage between the two data sources we match the
databases security by security using the last firm observation in each year between 1975
and 2002. We link securities using combinations of CUSIP, ticker symbol, and name.
We manually verify a sample of matching firms and nonmatching firms to confirm the
quality of our matching process.
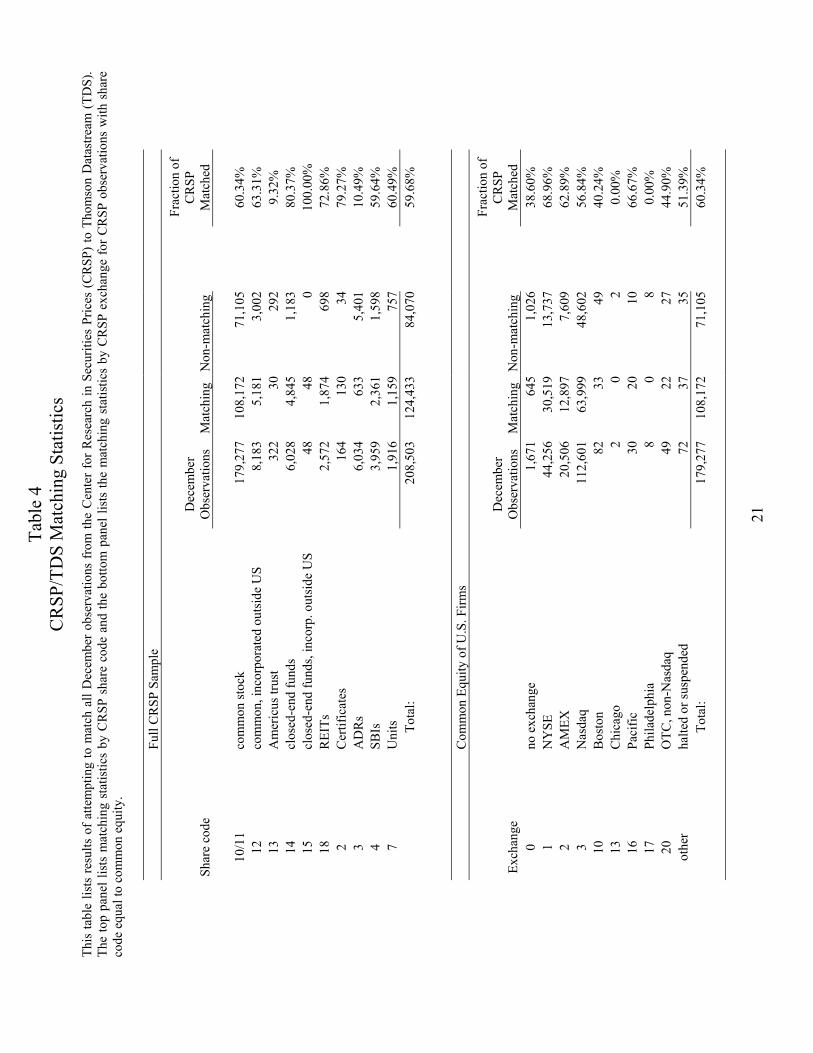
Table 4 summarizes the results of our matching exercise. We are able to match 60%
of December CRSP observations with share code 10 and 11 to December TDS
observations. The rate at which we match CRSP NYSE common equity (69%) is slightly
higher than for either AMEX (63%) or Nasdaq (57%). The matching is much better later
in the sample period than in earlier years.
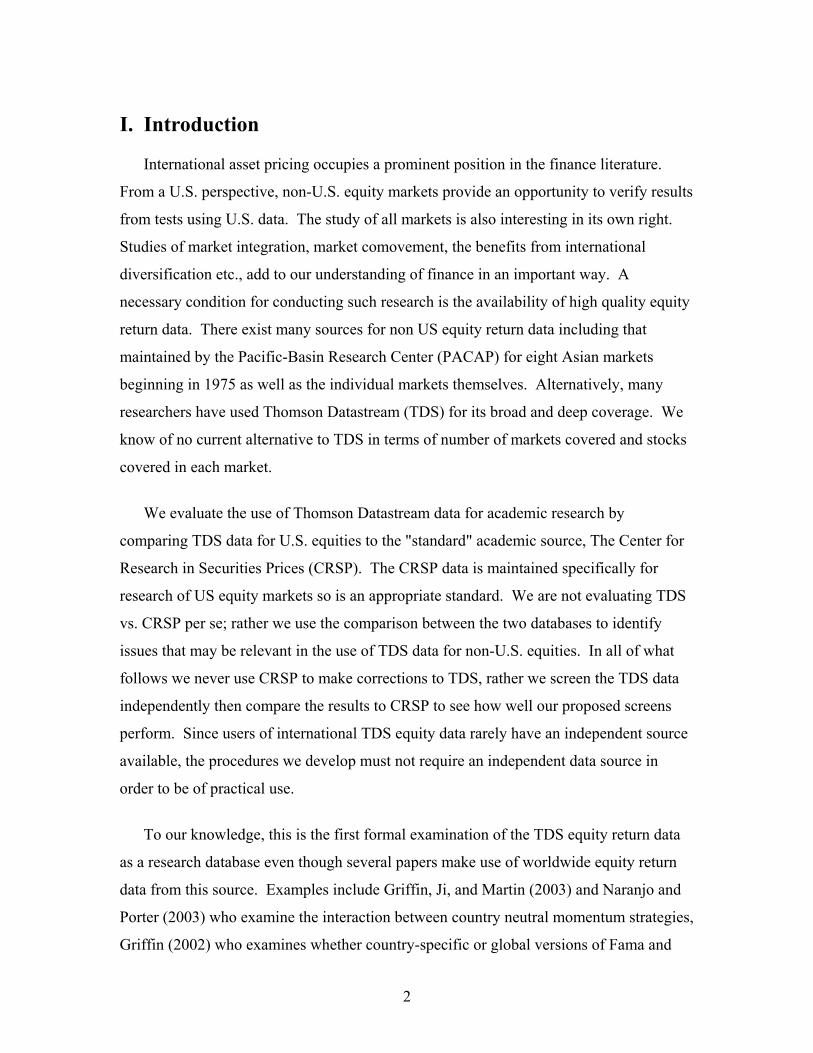
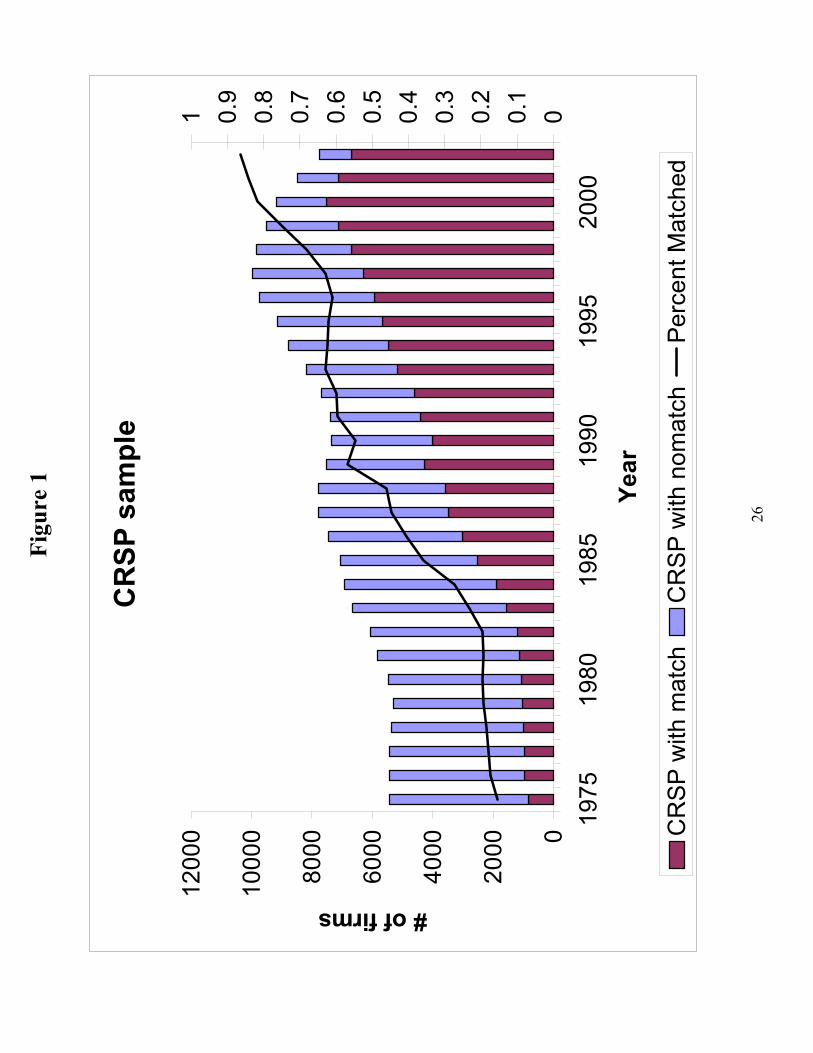
Figure 1 summarizes the fraction of CRSP permnos that are also found in TDS in
December of each year. Approximately 20% of the CRSP sample is also in TDS in
December of 1975 and this fraction rises steadily throughout the sample reaching almost
90% by December of 2002. Of the December 2002 CRSP observations that we are
unable to match to TDS, approximately half are ADRs (share codes 30 through 39 for
which TDS maintains separate constituent lists) and the remainder are firms that are
either absent from the TDS constituent lists or exist on TDS with different CUSIP
numbers than on CRSP.
We are surprised that not all firms that cease trading are included on the TDS
constituent lists of inactive firms, DEADUS1 through DEADUS6, and therefore do not
appear in our sample. Using the TDS interactive utility, Advance Version 4.0, we are
able to locate several large firms that have ceased trading and are not included on the

8
dead constituent lists. Examples include such well known names such as Atlantic
Richfield Co., GTE Corp, and Honeywell.
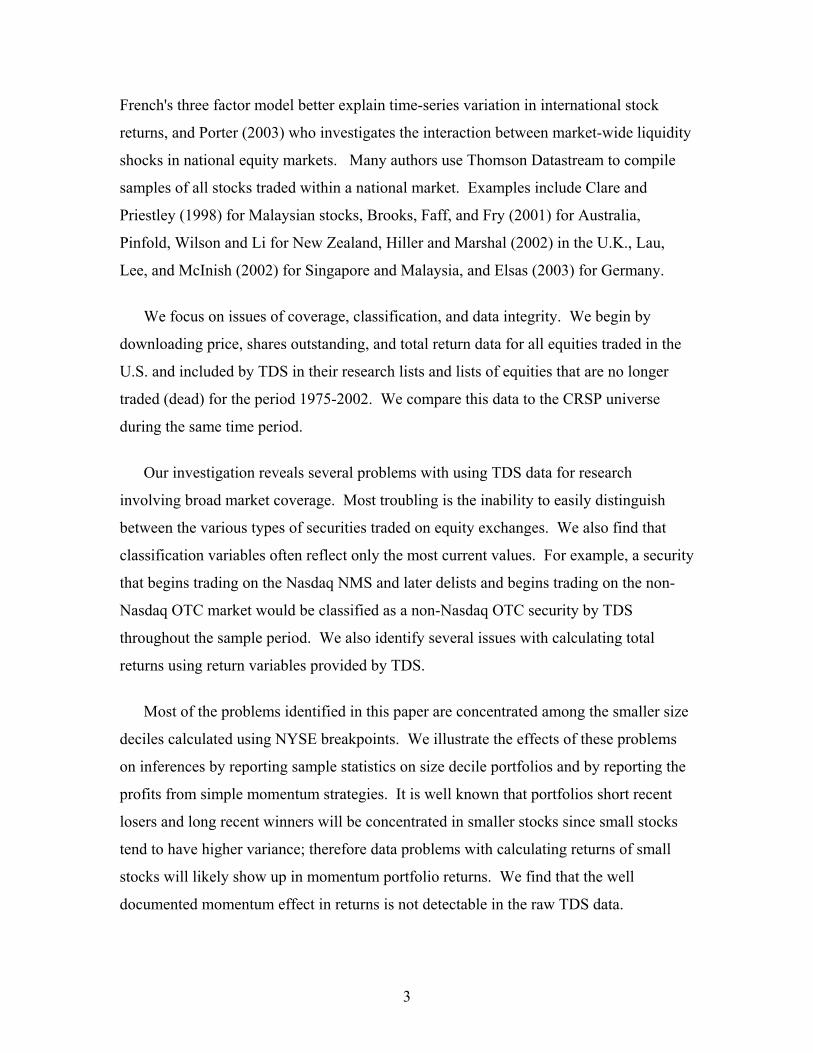
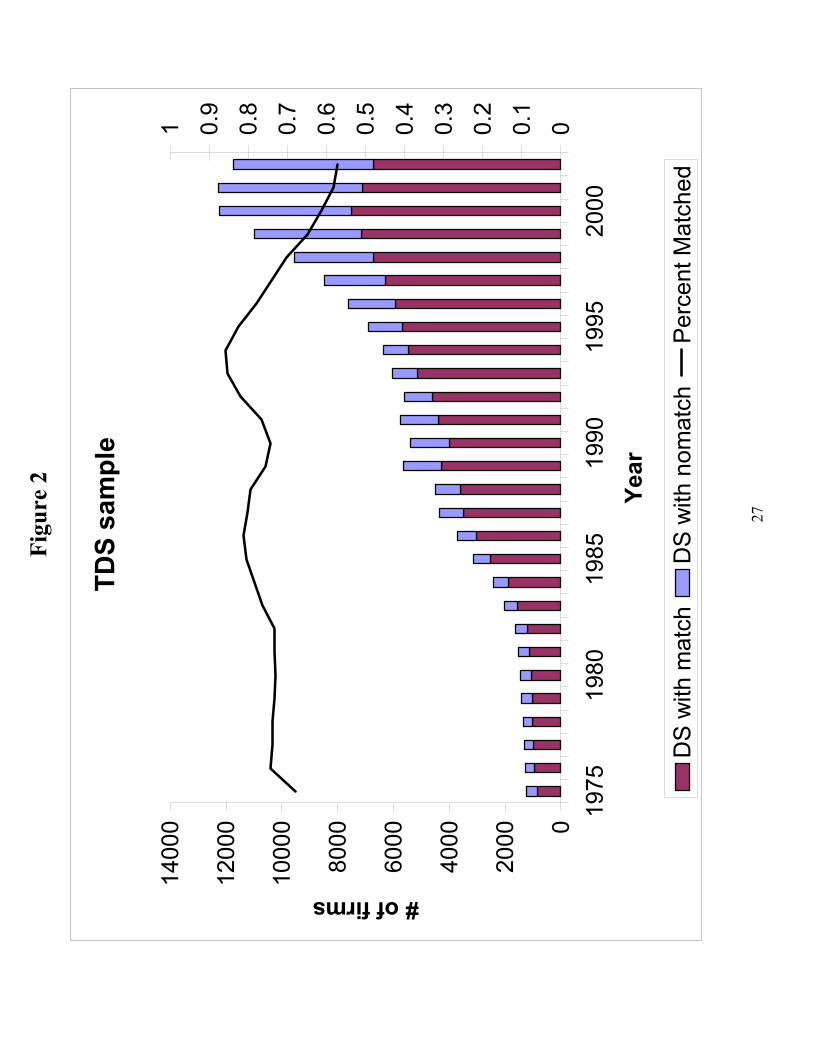
Figure 2 summarizes the fraction of TDS identifiers with TYPE equal to 'EQ' that are
also found in CRSP in December of each year. Approximately 70-80% of the TDS
sample is also on CRSP until the mid 1990s when the fraction steadily falls until only
55% of the TDS sample is also on CRSP in December of 2002.
The large number of TDS identifiers with no corresponding CRSP permnos,
especially late in the sample period, is due in large part to the fact that TDS includes
many securities with a type indicator of "equity" that are not common stock of U.S. firms.
Such securities include stock of firms incorporated outside the U.S., closed end funds,
REITs, ADRs (although there are very few ADRs on the TDS equity lists since there are
specific TDS constituent lists for ADRs), Shares of Beneficial Interest, and traded
partnership units. Researchers using CRSP data commonly restrict the sample to share
codes 10 and 11, however there is no simple method for performing the same screen with
TDS.
Since the only other source of information about the security is the variable NAME,
we search the NAME variable for key words or phrases that may indicate the security is
not common equity. Our procedure is to search the name field for key phrases, create a
candidate list of firms for removal by extracting all observations containing those
phrases, and then review the list of observations for any firms which should not be
removed from the sample. For example, we search for the letter combinations 'pf' and
'pref' to identify preferred stock, but explicitly prevent removing 'Pfizer'. We use the
TDS variable GEOG to remove any firm incorporated outside the U.S and the EXMNEM
variable to exclude any firm not traded on the NYSE, AMEX, or Nasdaq. Our screening
process reduces the number of TDS observations from 2,002,459 to 1,267,218, a
reduction in sample size of 37%. We repeat our calculation of market portfolio returns
and momentum portfolio returns using the TDS screened sample and compare the results
to our CRSP sample. The third set of columns of Table 3 reports our results. The results
are similar to the unscreened sample implying that the large differences in market returns,

9
size decile returns, and momentum returns are not due solely to the inclusion of securities
other than common equity by TDS.
IV. TDS Data Issues
Our goal is to develop methods for identifying data errors in TDS than can be used in
markets outside the U.S. for which an alternative data source is not readily available to
the researcher. In developing these rules we make extensive comparisons of CRSP and
TDS matched data but we take great care that no screen or correction we develop would
require the use of such an outside source.
Several TDS data errors we identify would be difficult, if not impossible to identify
without an alternative data source. For example, in June of 1992 Big O Tires, Inc
(permno=92508) conducted a 1:5 reverse stock split that is reflected in the shares
outstanding and closing price from CRSP. The unadjusted price series in TDS matches
that in CRSP, including the large rise in price level in 6/1992, however the change in
shares outstanding and adjusted price is in 6/1990 resulting in an incorrect return index
and return in June of 1990 and 1992 and an incorrect shares and market value for the full
two year period.
To be fair, TDS often does a better job than CRSP in reflecting capital structure
changes. For example, TDS will often reflect a seasoned equity offering on or very near
the day of the offering, however CRSP will not reflect the additional shares or the change
in market capitalization until the end of the quarter or fiscal year3. For example,
Nashville Country Club, Inc (now known as TBA Entertainment, CRSP permno=80256)
offered shares in a seasoned offering in April of 1996 but the additional shares are not
reflected in CRSP until 12/27/1996. The TDS data reflects the additional shares in May
of 1996. Since market value is derived from shares outstanding, the CRSP market
capitalization for this firm is incorrect for the eight month interval.
There are other differences in which it is not clear which data source is 'correct'. The
closing prices used by each source often do not agree. For example, according to CRSP, 3 Thank-you to Jay Ritter for providing an alternative source of SEO offer dates and share quantities.
10
Apogee Technology Inc, closed in May of 1990 at $4.625 and in June at $9.75 for a
return of 110.81%. The same firm is listed in TDS closing in May at $4.00 and in June at
$9.50, for a return of 137.50%, a difference of 26.69%. Note also that CRSP maintains
prices in increments as small as 1/64 while TDS rounds all prices to the nearest penny
resulting in differences in return, particularly for low priced stocks. Both CRSP and TDS
report closing price as a bid/ask average on days in which the stock does not trade.
To check for errors in return calculated from changes in the total return index, we
calculate returns using price and dividend data and compare it to the percentage change in
the return index. We only compare the two returns in months in which the ratio of
adjusted price to unadjusted price is the same as the previous month in order to prevent
differences in the two return calculations from being due to a capital structure change.
The TDS practice of rounding prices to the nearest penny can cause non trivial
differences in the calculated return when prices are small, so we drop all observations in
both TDS and CRSP when the end of previous month price is less than $1.00.
A related problem is the discreetness of the TDS total return index. The return index
is reported to the nearest tenth so when the return index is very small, discreetness
becomes important. To see why this is true, consider Firepond Inc. in October and
November of 2001. According to TDS, Firepond closed at $4.70 in September, $7.89 in
October and $8.00 in November. The corresponding values of the total return index are
0.5, 0.8, and 0.8. No dividends or capital changes occurred in this period. The returns
calculated from price changes are 67.87% and 1.39% whereas the returns calculated from
the return index changes are 60.00% and 0.00%. In these cases we substitute return
calculated directly from prices for returns calculated from the return index.
Suspension of trading is handled differently by the two sources. CRSP reports
missing values for prices and daily returns, however while monthly returns are reported
as missing if trading is suspended at the end of the month, the return for the first month
after trading resumes is calculated using the last available end of month price, even if the
intervening time interval is long, and without accounting for the multiperiod nature of the
return. For example, Ormand Industries (permno=34905) stopped trading on 5/31/1990
11
and resumed trading on 9/19/1990. The September return is calculated from the end of
month price, 0.68750 and the last valid end of month price, 4/30/1990, of 0.43750,
resulting in a simple 1-month reported return for September of 57.14%. TDS reports
sporadic trades during this period with changing prices. The way in which CRSP
calculates returns after the resumption of trading and the difficulty of identifying trading
halts on TDS can cause large difference in monthly returns between the two sources.
Since we are unable to identify trading suspensions using only TDS data, we make no
corrections for this problem.
We identify many instances of data errors. According to TDS, in the first eight
months of 1995, Magellan Petroleum Corp never has a daily closing price above $2.38
but the closing prices for 7/31, 8/1, and 8/2 are all above $13.60. On 8/3 the price reverts
to $1.88. The closing prices on the three days in question on CRSP are 1.9375, 1.8750,
and 1.9375. The resulting monthly TDS return for July is 626.69% vs. a CRSP reported
return of 0.00%. We screen for such occurrences by setting any return above 300% that
is reversed within one month to missing.
After screening the TDS equity data for non common equity securities and searching
for data errors as described above we recalculate the portfolio returns for the same
portfolios reported in Table 3. The results are reported in Table 5. We report revised
CRSP results as well because we have dropped CRSP observations with previous month
price less than $1.00. In calculating momentum returns we only enforce the price
restriction during the portfolio formation period and not during the holding period.
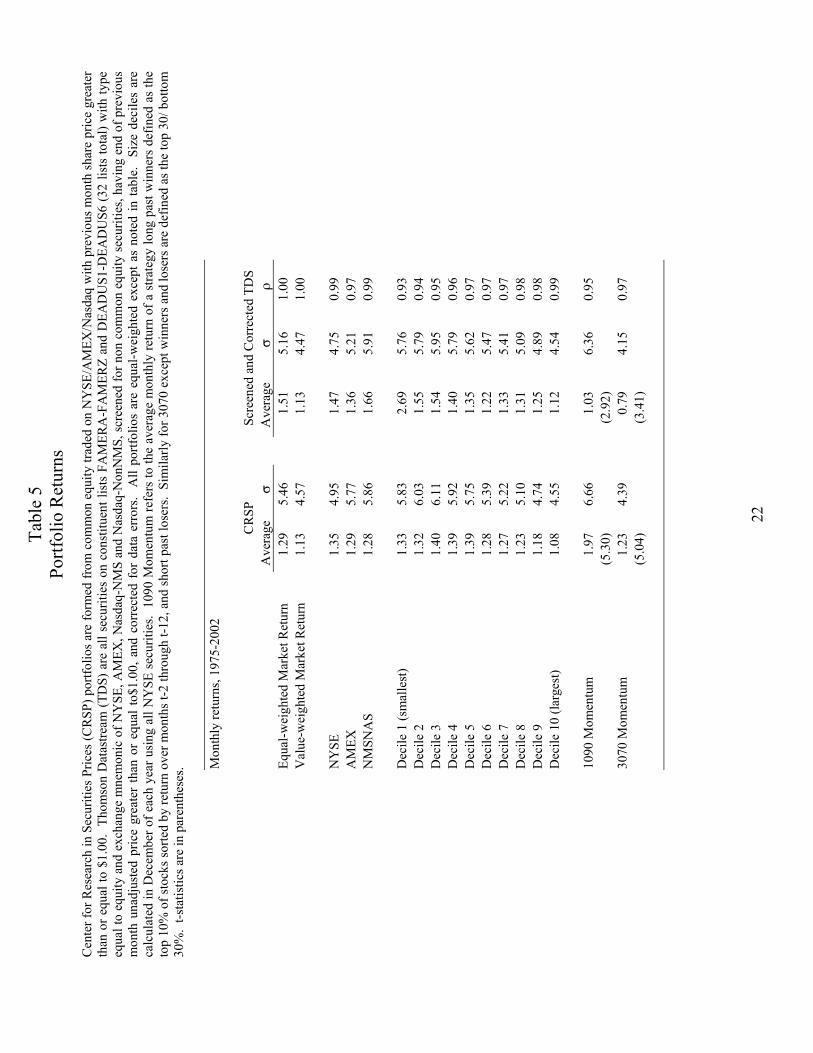
The TDS portfolio returns are now much closer to those calculated from CRSP. The
average CRSP equal-weighted market return is 1.29% per month compared to the TDS
equal-weighted market return of 1.51%. The correlation between the two equal-weighted
market indexes is 0.995 and the correlation between value-weighted indices is 0.998.
The individual market return means and standard deviations are also similar and the
correlations are high. The momentum returns that for TDS were insignificant and
sometimes negative are now positive, significant, and highly correlated with the
12
momentum returns calculated from CRSP4. In unreported results, we delete all
observations not common to both datasets and calculate all of the portfolio returns.
Although differences remain, they are generally quite small.
There are several reasons why we should not expect the CRSP and TDS results
reported in Table 5 to be identical. First is the issue of coverage. Not only will this
affect the average market returns but also the NYSE size breakpoints. In addition, the
issue of classification errors will induce a survivorship bias in a TDS sample of
NYSE/AMEX/Nasdaq firms. Since firms with poor returns are more likely to be delisted
and TDS captures only the most recently available exchange information, firms that delist
from the major exchanges and trade over-the-counter will be excluded from the TDS
sample raising the average return of the firms that remain.
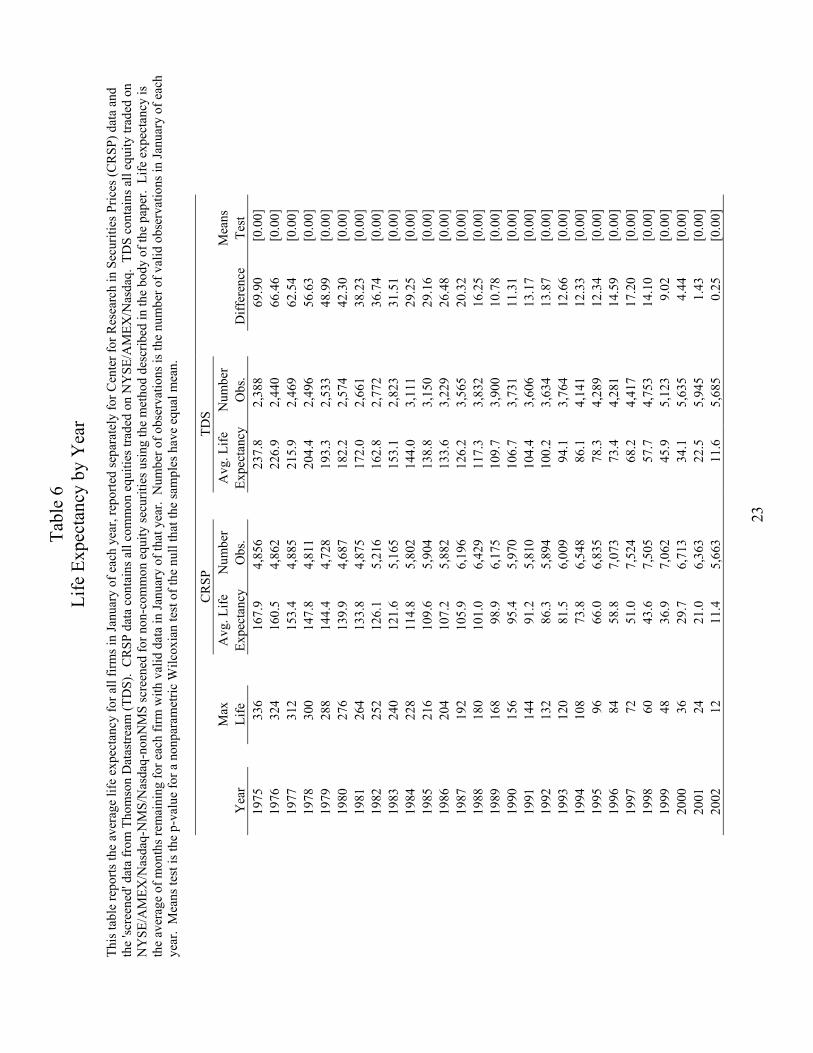
We illustrate the survivorship issue by calculating life expectancy for every year in
each sample. In January of each year, for all firms with valid observations in that month,
we estimate the life expectancy of a firm by averaging the number of months that each
firm remains in the sample. The 'life' of a firm has a maximum value equal to the number
of months remaining before December of 2002. Panel A of Table 6 reports the results.
In every year the average number of months remaining is larger for TDS than for CRSP
implying that firms that delist are less likely to be included in the TDS sample. A
nonparametric Wilcoxian rank-sum test for difference in mean easily rejects in every
year.
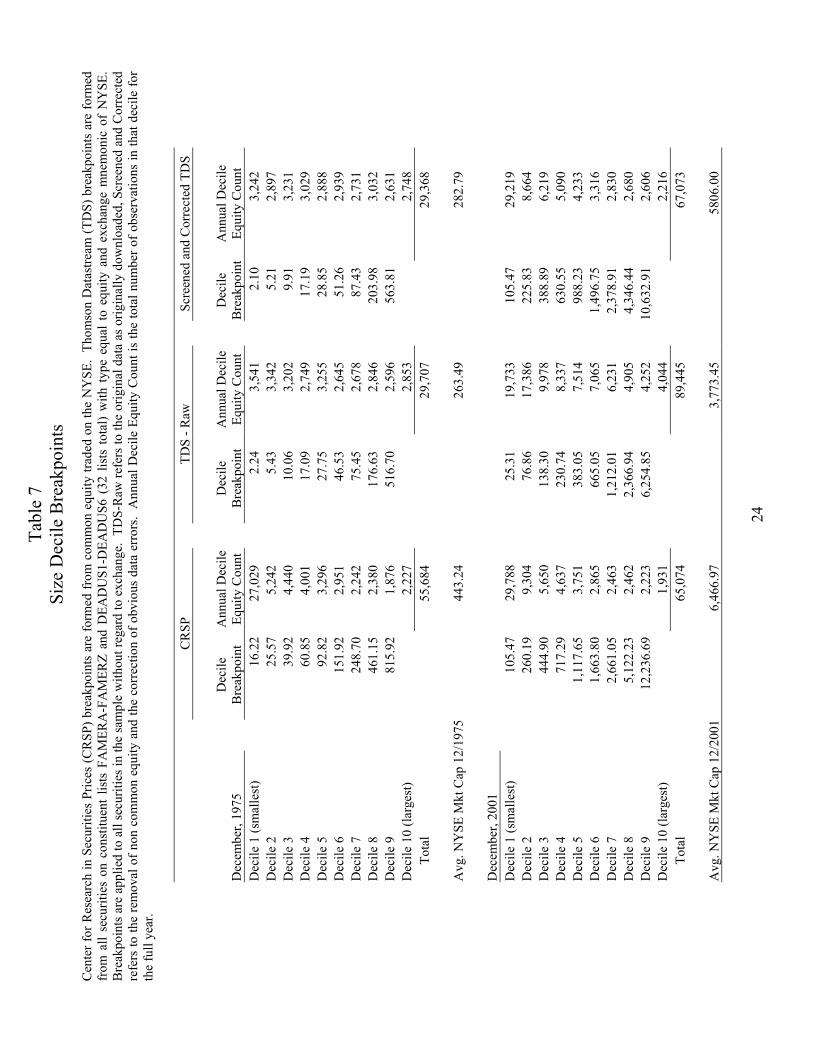
In addition, the issue of classification makes it difficult to identify NYSE firms from
which the breakpoints are calculated, particularly early in the sample period. Table 7 lists
the breakpoints calculated at the end of 1975 and 2001 calculated for stocks classified as
trading on NYSE for each of TDS and CRSP. The first set of columns list breakpoints
and the number of firms/month observations falling in each decile using CRSP, the
second set of columns list breakpoints and observations calculated from the 'raw' TDS
4 The CRSP 1090 momentum return of 1.97% per month is very high by the standards of the literature, however this value is not due only to dropping firm with prices less than $1.00 during the portfolio formation period. Restricting the sample to observations that exist on both CRSP and TDS lowers the CRSP 1090 momentum return to 1.38% per month.
13
data and the third set of columns refer to the TDS data after screening for non U.S. and
non common equity securities.
In December of 2001, the CRSP and screened TDS size decile breakpoints and equity
counts are very similar. The difference in breakpoints between the raw and screened
TDS samples show that most of the screened securities have very small market
capitalization. This is also reflected in the average market capitalization figures. The size
breakpoints are very different between the samples in December of 1975. Interestingly,
the number of firms from which the breakpoints are calculated is higher for the screened
and corrected TDS sample (2044) than for the CRSP sample (1429). The smaller average
NYSE market capitalization figure combined with the larger number of observations and
the smaller breakpoints implies that the additional firms are quite small. We believe this
is due to stale exchange information. For CRSP, the ratio of the number of observations
in decile 1 to the number of observations in decile 2 for 1976 is over 5:1 because the
average Nasdaq/AMEX firm is much smaller than the average NYSE firm. The
comparable ratio for TDS for 1976 is only 1.1:1. Taken together, these facts suggest that
the TDS size breakpoints have not been calculated only from stocks that traded on the
NYSE at the end of 1975. By the last year of the sample period the breakpoints and
distribution of firms by decile are much more similar.
V. Dividends
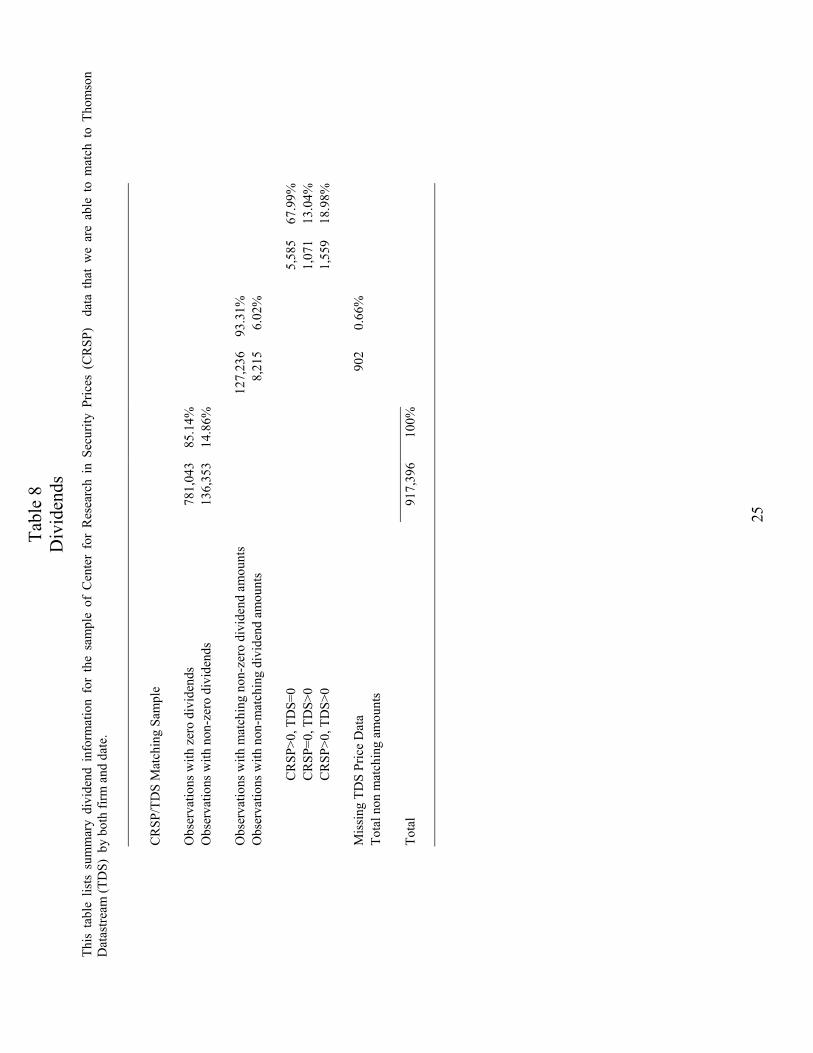
We also compare the dividend information provided by CRSP and TDS. We
compare CRSP dividends coded as ordinary or liquidating cash dividends to all TDS
dividends. We use the TDS dividend adjusted for capital changes and recover the
original dividend amount by multiplying the adjusted dividend by the ratio of unadjusted
price to adjusted price.
First we examine the common set of observations and find that of 136,353 firm
months in which either CRSP or TDS show a dividend payment, 127,236 or 93.31% of
the firm months show identical dividend amounts from each source. 8,215 dividend
observations or 6.03% disagree by the dividend payment amount and 902 observations or
0.66% have non zero values for TDS dividends but unadjusted prices are missing so

14
dividends before any capital changes cannot be calculated. Of the 8,215 observations
that disagree as to the dividend amount, 68% have positive dividends payments according
to CRSP and zero according to TDS. 13% have zero dividends according to CRSP and
positive according to TDS with the remainder showing positive dividends on each source
but disagreeing on the dividend amount.
Many of the observations that show positive dividends on CRSP and zero dividends
on TDS are for firms paying regular dividends. For example, the NYSE listed firm
American Can Co., later renamed Primerica Corporation (CRSP permno=10241) paid a
quarterly dividend every quarter from 1Q75 through 3Q88 in per share amounts from
$0.40 to $0.725 per share, however the first dividend reflected in TDS is in January of
1987.
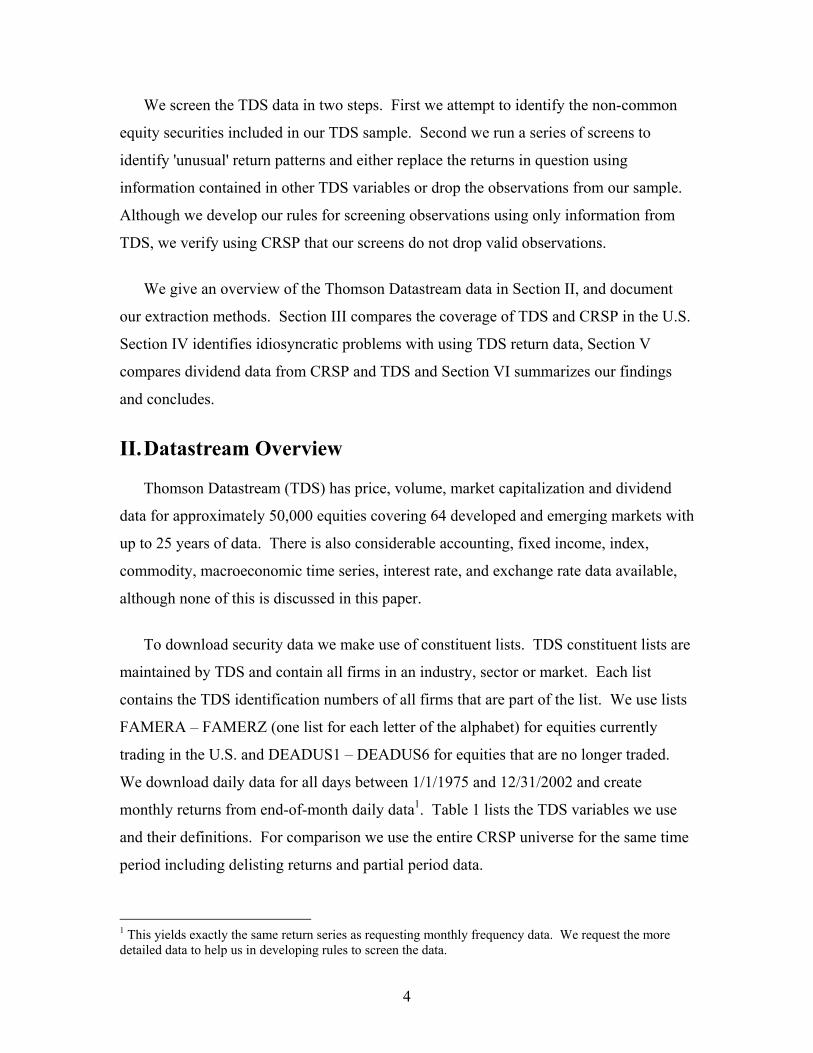
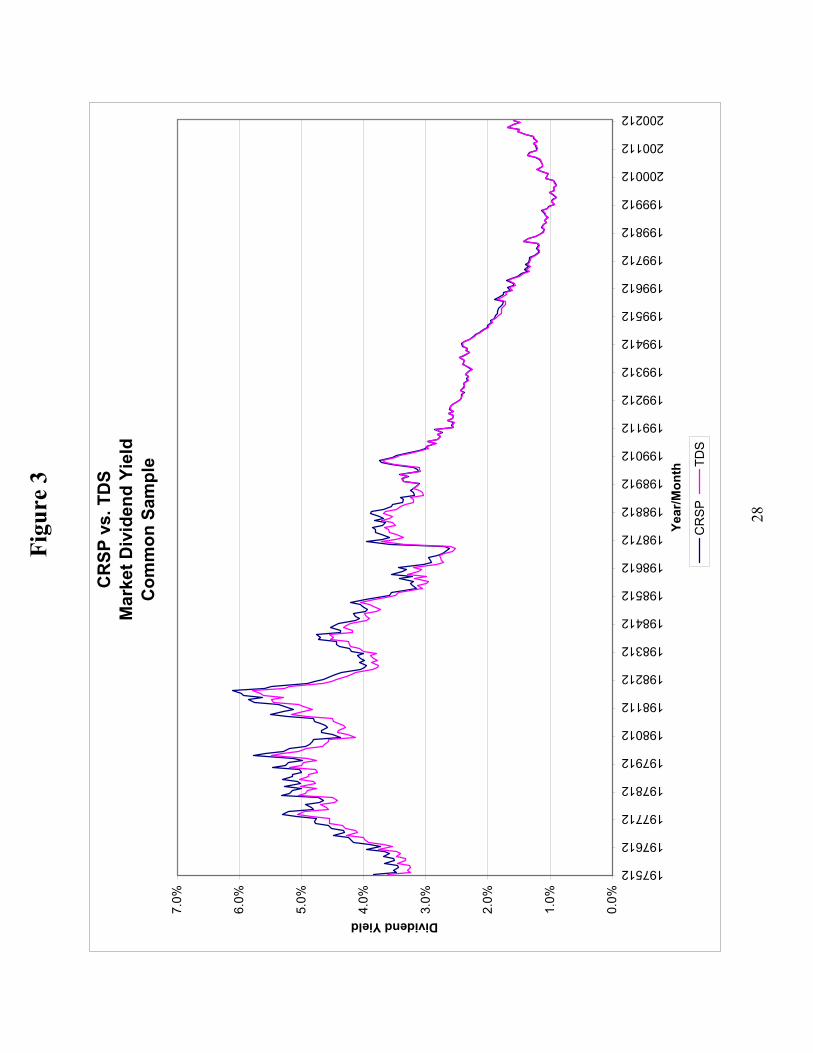
We calculate market dividend yields as the sum of all dividends paid during the
previous year calculated as per share dividend times shares outstanding computed from
market value and price, divided by the sum of all firm's market values. Figure 3 plots the
monthly dividend yields for the combined NYSE/AMEX/Nasdaq sample. Although the
time series of the two dividends yields is similar throughout the sample period, the fit is
better in the latter half. The common sample dividends yields have a correlation of 0.996.
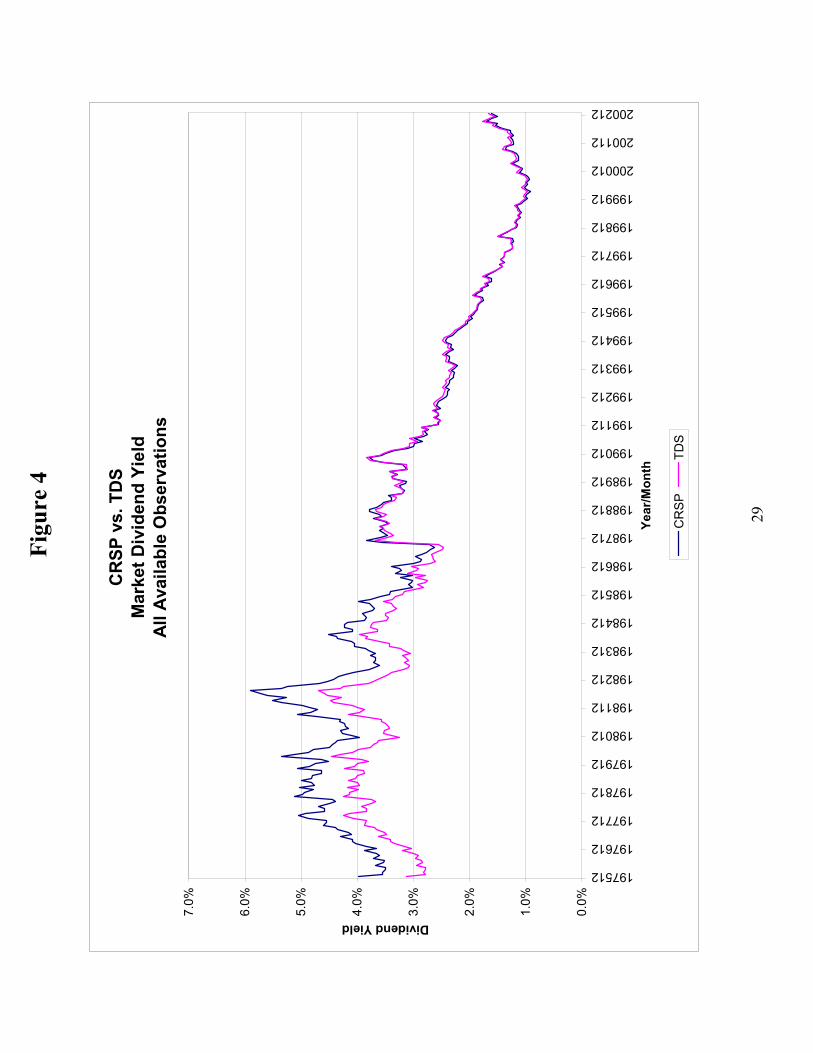
We recalculate market dividend yields without restricting the sample to matched
observations. Figure 4 plots the results. The CRSP dividend yield is higher than the TDS
dividend yield in the first half of the sample although they do move together. In the
second half there appears to be little difference in the two measures. The correlation of
the two measures of the market dividend yield is 0.982.
VI. Conclusion
Thomson Datastream is a rich data source containing equity return data for
approximately 50,000 equities in 64 developed and emerging markets with up to 25 years
of data; however, issues of classification, coverage, and data integrity require that care be
used. We compare Thomson Datastream (TDS) data for U.S. equities to data from the

15
Center for Research in Securities Prices (CRSP) in order to identify features of the TDS
data that might cause errors in inference for the unwary researcher.
We find that TDS includes data for many securities with type equal to 'EQ' (equity)
that the researcher may wish to exclude from her sample. Examples of such securities
include preferred stock, traded warrants, REITs, closed-end funds, exchange traded
funds, and shares of beneficial interest, however to the best of our knowledge there is no
simple method for classifying these securities. By scanning the security name field for
clues as to the security type, we are able to identify over 35% of the monthly
observations as not being common equity.
We also find several errors related to the country constituent lists maintained by TDS.
We identify several examples of large firms for which TDS maintains data but that are
not included on the appropriate constituent list and hence will not be downloaded by the
researcher. Since we can only check for missing firms manually, by identifying firms
that exist on CRSP and are not in the data we download from TDS, we are not sure how
common this problem is, however we do not have trouble finding several large firms that
are not on the TDS lists of non-traded (dead) firms. We also have no way of knowing
how common this problem is in other markets.
We also find that the exchange information provided by TDS usually applies only to
the exchange on which the security is trading when data is downloaded, or for securities
that are no longer traded, the last available exchange. This causes several problems.
First, if the researcher wished to include only securities traded on the major exchange(s)
of a particular country then the sample may include a survivorship bias. Since poorly
performing firms are those most likely to delist and trade over-the-counter, the remaining
firms are likely to have higher average returns. Second, for countries such as the U.S.
with multiple major exchanges, methods such as the using of NYSE determined size
breakpoints can be problematic, particularly the further back in time you go.
We identify many instances of errors in the return data. We compare returns
calculated from changes in the TDS total return index to returns calculated from price and
16
dividend data and either drop observations in which there is a large discrepancy or
substitute the return we calculate for the return calculated from the change in the return
index.
After screening the data for non-common equity and obvious errors in the data, we
find that market-wide, exchange, and decile portfolio returns are quite similar between
TDS and CRSP. We also find positive profits to momentum trading strategies using both
the CRSP data and the screened and corrected TDS data that are statistically significant
and highly correlated. However, the means are quite different but this is not surprising
considering the large discrepancies in coverage, particularly early in the sample period.
In our final judgment, TDS provides an excellent source of equity return data,
however the researcher must take great care to screen and correct the data. We argue that
failure to do so can result in very misleading inferences being drawn from tests using
these data.

17
References
Brooks, Robert D., Robert W. Faff, and Tim R.L. Fry (2001), GARCH Modeling of
Individual Stock Data: the Impact of Censoring, Firm Size and Trading Volume, Journal
of International financial Markets, Institutions and Money 11, pp. 215-222.
Clare, Andrew D., and Richard Priestley (1998), Risk Factors in the Malaysian Stock
Market, Pacific-Basin Finance Journal 6, pp. 103-114.
Elsas, Ralf (2003), Bank debt vs. public debt of German companies, University of Florida
Working Paper.
Griffin, John M. (2002), Are the Fama and French Factors Global or Country Specific?,
The Review of Financial Studies 15, pp 783-803.
Griffin, John M., Susan Ji, and Spencer Martin (2003), Momentum Investing and
Business Cycle Risks: Evidence from Pole to Pole, The Journal of Finance, December
2003.
Hiller, David and Andrew Marshall (2002), Insider Trading, Tax-Loss Selling, and the
Turn-of-the-year Effect, International Review of Financial Analysis 11, pp. 73-84.
Lau, Sie Ting, Chee Tong Lee, and Thomas H. McInish (2002), Stock Returns and Beta,
Firms' Size, E/P, CF/P, Book-to-market, and Sales Growth: Evidence from Singapore and
Malaysia, Journal of Multinational Financial Management 12, pp. 207-222.
Naranjo, Andy and R. Burt Porter (2003), International Momentum Strategies:
Profitability and Cross-Country Relationships, University of Florida working paper.
Pinfold, John F., William R. Wilson, and Qiuli Li (2001), Book-to-Market and Size as
Determinants of Returns in Small Illiquid Markets: the New Zealand Case, Financial
Services Review 10, pp. 291-302.
Porter, R. Burt (2003), Market-wide Liquidity Shocks in International Markets,
University of Florida working paper.
Tabl
e 1
Var
iabl
e D
efin
ition
s
This
tabl
e lis
ts th
e su
bset
of a
vaila
ble
Thom
son
Dat
astre
am (T
DS)
var
iabl
es e
xam
ined
in th
is p
aper
. Var
iabl
e na
mes
, mne
mon
ics a
nd d
escr
iptio
ns a
re fr
om T
DS.
Var
iabl
e N
ame
V
aria
ble
Mne
mon
ic
D
escr
iptio
n M
nem
onic
M
NEM
Uni
que
iden
tific
atio
n co
de a
ssig
ned
by D
atas
tream
D
atas
tream
cod
e D
SCD
Uni
que
six
digi
t ide
ntifi
er fo
r eve
ry st
ock
Type
of I
nstru
men
t T
YPE
'EQ
' for
equ
ity
Nam
e N
AM
E
The
nam
e of
the
secu
rity/
com
pany
G
eogr
aphi
cal G
roup
ing
GEO
G
C
ode
iden
tifyi
ng th
e ho
me
coun
try o
f the
com
pany
Ex
chan
ge C
ode
EX
MN
EM
Th
e IS
O st
anda
rd e
xcha
nge
code
that
iden
tifie
s the
def
ault
sour
ce o
f pric
e da
ta.
Clo
sing
Pric
e P
Clo
sing
Pric
e ad
just
ed fo
r any
subs
eque
nt "
capi
tal a
ctio
ns".
Una
djus
ted
Pric
e U
P
Clo
sing
Pric
e, u
nadj
uste
d fo
r div
iden
ds o
r spl
its
Ret
urn
Inde
x R
I
Cha
nge
in R
I is t
he to
tal r
etur
n to
hol
ding
the
stoc
k in
clud
ing
capi
tal g
ains
and
div
iden
ds
Mar
ket V
alue
M
V
C
losi
ng P
rice
x N
umbe
r of S
hare
s in
Issu
e
Tu
rnov
er b
y V
olum
e V
O
N
umbe
r of s
hare
s in
thou
sand
s tra
ded
on a
giv
en d
ay re
porte
d by
the
prim
ary
exch
ange
for t
he st
ock
Loca
l Cod
e L
OC
For U
.S. s
ecur
ities
this
is th
e C
USI
P
D
ivid
end
DD
E
Div
iden
d R
ate,
Adj
uste
d, b
ased
upo
n ex
-dat
e

19
Tabl
e 2
Com
para
tive
Stat
istic
s
This
tabl
e lis
ts th
e nu
mbe
r of m
onth
ly o
bser
vatio
ns a
nd u
niqu
e se
curit
y id
entif
iers
ava
ilabl
e in
the
1975
-200
2 da
ta fr
om th
e C
ente
r for
Res
earc
h in
Sec
uriti
es P
rices
(C
RSP
) and
Tho
mso
n D
atas
tream
(TD
S).
The
CR
SP id
entif
ier i
s th
e Pe
rman
ent I
ssue
Num
ber (
perm
no) a
nd th
e D
atas
tream
cod
e (D
SCD
) for
TD
S. W
e do
wnl
oad
all a
vaila
ble
CR
SP d
ata
for t
he ti
me
perio
d an
d lis
t cou
nts
by s
hare
cod
e an
d ob
serv
atio
ns b
y ex
chan
ge fo
r sha
re c
odes
10&
11 (c
omm
on e
quity
). W
e do
wnl
oad
all
avai
labl
e TD
S da
ta u
sing
TD
S co
nstit
uent
list
s FA
MER
A –
FA
MER
Z fo
r cur
rent
ly tr
aded
U.S
. equ
ities
and
DEA
DU
S1-D
EAD
US6
for s
ecur
ities
that
are
no
long
er
trade
d. W
e lis
t cou
nts
by ty
pe a
nd fo
r typ
e eq
ual t
o eq
uity
, by
exch
ange
. Su
bcat
egor
ies
of u
niqu
e id
entif
iers
do
not s
um to
ove
rall
coun
ts b
ecau
se o
f cha
nges
in th
e va
lue
of c
lass
ifica
tion
varia
bles
in th
e tim
e se
ries o
f uni
que
iden
tifie
r.
CR
SP
TD
S
Mon
thly
Obs
. U
niqu
e Id
entif
iers
M
onth
ly
Obs
. U
niqu
e Id
entif
iers
To
tal n
umbe
r of o
bser
vatio
n in
sam
ple
1975
-200
2 2,
256,
605
22,8
32
2,04
8,25
521
,245
Sh
are
Cod
e Sh
are
Cod
e D
escr
iptio
n
TYPE
TY
PE D
escr
iptio
n
10
-11
Com
mon
stoc
k 1,
941,
744
19,3
31
mis
sing
1,43
027
12
Com
mon
, inc
orpo
rate
d ou
tsid
e U
.S.
85,2
331,
141
EQ
Equi
ty
2,00
2,45
920
,394
13
Com
mon
, am
eric
us tr
ust c
ompo
nent
s 3,
196
54
AD
R
Am
eric
an D
epos
itory
Rec
eipt
21,7
6738
214
C
lose
d en
d fu
nds
66,9
2766
4 U
T U
nit T
rust
22
,599
466
15
Clo
sed
end
fund
s, in
corp
. out
side
US
567
3
T
otal
2,
048,
255
21,2
6918
R
EITs
28
,277
293
20-2
4 C
ertif
icat
es
1,84
918
30
A
DR
s 65
,326
764
40-4
8 SB
Is (a
ll)
42,8
4550
0
70
-78
Uni
ts (a
ll)
20,6
4126
3
T
otal
2,
256,
605
23,0
31
Ex
chan
ge
Cod
e Ex
chan
ge C
ode
Des
crip
tion
Mon
thly
Obs
. U
niqu
e Id
entif
iers
Ex
chan
ge
Cod
e Ex
chan
ge C
ode
Des
crip
tion
Mon
thly
O
bs.
Uni
que
Iden
tifie
rs
1NY
SE
503,
107
3,96
6 N
YS
NY
SE
946,
940
7,87
12A
MEX
23
0,49
72,
637
ASE
A
MEX
12
4,52
11,
084
3Nas
daq
1,20
8,13
715
,242
N
MS
Nas
daq/
NM
S 38
3,28
33,
665
0No
exch
ange
list
ed
33
NA
S N
asda
q/no
n N
MS
89,1
1591
7
To
tal
1,94
1,74
421
,848
O
TC
Non
-Nas
daq
OTC
21
1,07
43,
262
X
BQ
O
TC B
ulle
tin B
oard
23
5,72
03,
477
Oth
er U
.S.
1,70
518
Mis
sing
or U
nkno
wn
5,75
712
9
N
on-U
S 4,
344
97
Tot
al
2,00
2,45
920
,520

20
Tabl
e 3
Portf
olio
Ret
urns
Cen
ter
for
Res
earc
h in
Sec
uriti
es P
rices
(C
RSP
) po
rtfol
io a
re c
omm
on e
quity
trad
ed o
n N
YSE
/AM
EX/N
asda
q.
Thom
son
Dat
astre
am (
TDS)
are
all
secu
ritie
s on
co
nstit
uent
list
s FA
MER
A-F
AM
ERZ
and
DEA
DU
S1-D
EAD
US6
(32
lists
tota
l) w
ith ty
pe e
qual
to e
quity
and
exc
hang
e m
nem
onic
of N
YSE
, AM
EX, N
asda
q-N
MS
and
Nas
daq-
Non
NM
S. S
cree
ned
TDS
is T
DS
scre
ened
for n
on-c
omm
on e
quity
sec
uriti
es u
sing
the
proc
edur
e de
scrib
ed in
the
body
of t
he p
aper
. A
ll po
rtfol
ios
are
equa
l-wei
ghte
d ex
cept
as
note
d in
tabl
e.
Size
dec
iles
are
calc
ulat
ed in
Dec
embe
r of
eac
h ye
ar u
sing
all
NY
SE s
ecur
ities
. 10
90 M
omen
tum
ref
ers
to th
e av
erag
e m
onth
ly re
turn
of a
stra
tegy
long
pas
t win
ners
def
ined
as
the
top
10%
of s
tock
s so
rted
by re
turn
ove
r mon
ths
t-2 th
roug
h t-1
2, a
nd s
hort
past
lose
rs.
Sim
ilarly
for
30
70 e
xcep
t win
ners
and
lose
rs a
re d
efin
ed a
s the
top
30/ b
otto
m 3
0%.
t-sta
tistic
s are
in p
aren
thes
es.
M
onth
ly re
turn
s, 19
75-2
002
CR
SP
TD
S
Scre
ened
TD
S
Ave
rage
σ
A
vera
ge
σ ρ
A
vera
ge
σ ρ
Equa
l-wei
ghte
d M
arke
t Ret
urn
1.41
5.
69
2.
40
7.53
0.
66
2.
67
9.10
0.
61
Val
ue-w
eigh
ted
Mar
ket R
etur
n 1.
13
4.57
1.14
4.
40
1.00
1.16
4.
49
1.00
N
YSE
1.
35
5.00
2.00
5.
35
0.80
2.24
6.
54
0.74
A
MEX
1.
42
6.16
6.95
88
.90
0.11
8.19
10
6.15
0.
10
NM
SNA
S 1.
45
6.17
2.54
6.
24
0.94
2.55
6.
34
0.94
Dec
ile 1
(sm
alle
st)
1.60
6.
44
7.
15
14.6
9 0.
34
11
.27
76.6
2 0.
12
Dec
ile 2
1.
32
6.06
4.53
50
.30
0.12
1.83
5.
98
0.93
D
ecile
3
1.40
6.
11
1.
53
5.17
0.
91
1.
63
6.05
0.
95
Dec
ile 4
1.
39
5.92
1.39
4.
97
0.94
1.50
5.
84
0.96
D
ecile
5
1.39
5.
75
1.
38
4.98
0.
95
1.
41
5.65
0.
97
Dec
ile 6
1.
28
5.39
1.29
5.
18
0.96
1.28
5.
49
0.97
D
ecile
7
1.27
5.
22
1.
29
5.18
0.
96
1.
38
5.45
0.
97
Dec
ile 8
1.
23
5.10
1.28
5.
06
0.96
1.33
5.
10
0.98
D
ecile
9
1.18
4.
74
1.
27
4.88
0.
97
1.
28
4.91
0.
98
Dec
ile 1
0 (la
rges
t) 1.
08
4.55
1.15
4.
49
0.99
1.14
4.
55
0.99
1090
Mom
entu
m
1.13
7.
13
0.
26
7.99
0.
67
0.
20
8.79
0.
64
(2
.86)
(0.6
0)
(0
.42)
30
70 M
omen
tum
0.
95
4.70
-1.0
2 20
.32
0.21
-1.2
4 25
.40
0.18
(3.6
5)
(-
0.90
)
(-0.
88)
21
Tabl
e 4
CR
SP/T
DS
Mat
chin
g St
atis
tics
Th
is ta
ble
lists
resu
lts o
f atte
mpt
ing
to m
atch
all
Dec
embe
r obs
erva
tions
from
the
Cen
ter f
or R
esea
rch
in S
ecur
ities
Pric
es (C
RSP
) to
Thom
son
Dat
astre
am (T
DS)
. Th
e to
p pa
nel l
ists
mat
chin
g st
atis
tics
by C
RSP
sha
re c
ode
and
the
botto
m p
anel
list
s th
e m
atch
ing
stat
istic
s by
CR
SP e
xcha
nge
for C
RSP
obs
erva
tions
with
sha
re
code
equ
al to
com
mon
equ
ity.
Fu
ll C
RSP
Sam
ple
Shar
e co
de
Dec
embe
r O
bser
vatio
ns
Mat
chin
gN
on-m
atch
ing
Frac
tion
ofC
RSP
M
atch
ed
10
/11
co
mm
on st
ock
179,
277
108,
172
71,1
05
60.3
4%
12
co
mm
on, i
ncor
pora
ted
outs
ide
US
8,18
3 5,
181
3,00
2 63
.31%
13
Am
eric
us tr
ust
322
3029
2 9.
32%
14
clos
ed-e
nd fu
nds
6,02
8 4,
845
1,18
3 80
.37%
15
clos
ed-e
nd fu
nds,
inco
rp. o
utsi
de U
S 48
48
0 10
0.00
%
18
R
EITs
2,57
2 1,
874
698
72.8
6%
2
Cer
tific
ates
16
4 13
034
79
.27%
3
A
DR
s
6,03
4 63
35,
401
10.4
9%
4
SBIs
3,95
9 2,
361
1,59
8 59
.64%
7
U
nits
1,91
6 1,
159
757
60.4
9%
T
otal
:
208,
503
124,
433
84,0
70
59.6
8%
Com
mon
Equ
ity o
f U.S
. Firm
s
Exch
ange
D
ecem
ber
Obs
erva
tions
M
atch
ing
Non
-mat
chin
g
Frac
tion
ofC
RSP
M
atch
ed
0
no e
xcha
nge
1,67
1 64
51,
026
38.6
0%
1
NY
SE
44
,256
30
,519
13,7
37
68.9
6%
2
AM
EX
20
,506
12
,897
7,60
9 62
.89%
3
N
asda
q
112,
601
63,9
9948
,602
56
.84%
10
Bos
ton
82
33
49
40.2
4%
13
C
hica
go
2
02
0.00
%
16
Pa
cific
30
2010
66
.67%
17
Phila
delp
hia
8 0
8 0.
00%
20
OTC
, non
-Nas
daq
49
2227
44
.90%
ot
her
ha
lted
or su
spen
ded
72
3735
51
.39%
Tot
al:
17
9,27
7 10
8,17
271
,105
60
.34%
22
Tabl
e 5
Portf
olio
Ret
urns
Cen
ter f
or R
esea
rch
in S
ecur
ities
Pric
es (C
RSP
) por
tfolio
s are
form
ed fr
om c
omm
on e
quity
trad
ed o
n N
YSE
/AM
EX/N
asda
q w
ith p
revi
ous m
onth
shar
e pr
ice
grea
ter
than
or e
qual
to $
1.00
. Th
omso
n D
atas
tream
(TD
S) a
re a
ll se
curit
ies
on c
onst
ituen
t lis
ts F
AM
ERA
-FA
MER
Z an
d D
EAD
US1
-DEA
DU
S6 (3
2 lis
ts to
tal)
with
type
eq
ual t
o eq
uity
and
exc
hang
e m
nem
onic
of N
YSE
, AM
EX, N
asda
q-N
MS
and
Nas
daq-
Non
NM
S, s
cree
ned
for n
on c
omm
on e
quity
sec
uriti
es, h
avin
g en
d of
pre
viou
s m
onth
una
djus
ted
pric
e gr
eate
r th
an o
r eq
ual t
o$1.
00, a
nd c
orre
cted
for
dat
a er
rors
. A
ll po
rtfol
ios
are
equa
l-wei
ghte
d ex
cept
as
note
d in
tabl
e.
Size
dec
iles
are
calc
ulat
ed in
Dec
embe
r of e
ach
year
usi
ng a
ll N
YSE
sec
uriti
es.
1090
Mom
entu
m re
fers
to th
e av
erag
e m
onth
ly re
turn
of a
stra
tegy
long
pas
t win
ners
def
ined
as
the
top
10%
of s
tock
s sor
ted
by re
turn
ove
r mon
ths t
-2 th
roug
h t-1
2, a
nd sh
ort p
ast l
oser
s. S
imila
rly fo
r 307
0 ex
cept
win
ners
and
lose
rs a
re d
efin
ed a
s the
top
30/ b
otto
m
30%
. t-s
tatis
tics a
re in
par
enth
eses
.
Mon
thly
retu
rns,
1975
-200
2
C
RSP
Scre
ened
and
Cor
rect
ed T
DS
A
vera
geσ
A
vera
ge
σ ρ
Equa
l-wei
ghte
d M
arke
t Ret
urn
1.29
5.
46
1.51
5.
16
1.00
V
alue
-wei
ghte
d M
arke
t Ret
urn
1.13
4.
57
1.13
4.
47
1.00
N
YSE
1.
35
4.95
1.
47
4.75
0.
99
AM
EX
1.29
5.
77
1.36
5.
21
0.97
N
MSN
AS
1.28
5.
86
1.66
5.
91
0.99
D
ecile
1 (s
mal
lest
) 1.
33
5.83
2.
69
5.76
0.
93
Dec
ile 2
1.
32
6.03
1.
55
5.79
0.
94
Dec
ile 3
1.
40
6.11
1.
54
5.95
0.
95
Dec
ile 4
1.
39
5.92
1.
40
5.79
0.
96
Dec
ile 5
1.
39
5.75
1.
35
5.62
0.
97
Dec
ile 6
1.
28
5.39
1.
22
5.47
0.
97
Dec
ile 7
1.
27
5.22
1.
33
5.41
0.
97
Dec
ile 8
1.
23
5.10
1.
31
5.09
0.
98
Dec
ile 9
1.
18
4.74
1.
25
4.89
0.
98
Dec
ile 1
0 (la
rges
t) 1.
08
4.55
1.
12
4.54
0.
99
1090
Mom
entu
m
1.97
6.
66
1.03
6.
36
0.95
(5.3
0)
(2.9
2)
3070
Mom
entu
m
1.23
4.
39
0.79
4.
15
0.97
(5.0
4)
(3.4
1)
23
Tabl
e 6
Life
Exp
ecta
ncy
by Y
ear
This
tabl
e re
ports
the
aver
age
life
expe
ctan
cy fo
r all
firm
s in
Janu
ary
of e
ach
year
, rep
orte
d se
para
tely
for C
ente
r for
Res
earc
h in
Sec
uriti
es P
rices
(CR
SP) d
ata
and
the
'scre
ened
' dat
a fr
om T
hom
son
Dat
astre
am (T
DS)
. C
RSP
dat
a co
ntai
ns a
ll co
mm
on e
quiti
es tr
aded
on
NY
SE/A
MEX
/Nas
daq.
TD
S co
ntai
ns a
ll eq
uity
trad
ed o
n N
YSE
/AM
EX/N
asda
q-N
MS/
Nas
daq-
nonN
MS
scre
ened
for n
on-c
omm
on e
quity
secu
ritie
s usi
ng th
e m
etho
d de
scrib
ed in
the
body
of t
he p
aper
. Li
fe e
xpec
tanc
y is
th
e av
erag
e of
mon
ths r
emai
ning
for e
ach
firm
with
val
id d
ata
in Ja
nuar
y of
that
yea
r. N
umbe
r of o
bser
vatio
ns is
the
num
ber o
f val
id o
bser
vatio
ns in
Janu
ary
of e
ach
year
. M
eans
test
is th
e p-
valu
e fo
r a n
onpa
ram
etric
Wilc
oxia
n te
st o
f the
nul
l tha
t the
sam
ples
hav
e eq
ual m
ean.
CR
SP
TD
S
Max
Avg
. Life
N
umbe
r
Avg
. Life
N
umbe
r
M
eans
Y
ear
Li
fe
Ex
pect
ancy
Obs
.
Expe
ctan
cy
Obs
.
Diff
eren
ceTe
st
1975
336
16
7.9
4,85
6
237.
8 2,
388
69
.90
[0.0
0]
1976
324
16
0.5
4,86
2
226.
9 2,
440
66
.46
[0.0
0]
1977
312
15
3.4
4,88
5
215.
9 2,
469
62
.54
[0.0
0]
1978
300
14
7.8
4,81
1
204.
4 2,
496
56
.63
[0.0
0]
1979
288
14
4.4
4,72
8
193.
3 2,
533
48
.99
[0.0
0]
1980
276
13
9.9
4,68
7
182.
2 2,
574
42
.30
[0.0
0]
1981
264
13
3.8
4,87
5
172.
0 2,
661
38
.23
[0.0
0]
1982
252
12
6.1
5,21
6
162.
8 2,
772
36
.74
[0.0
0]
1983
240
12
1.6
5,16
5
153.
1 2,
823
31
.51
[0.0
0]
1984
228
11
4.8
5,80
2
144.
0 3,
111
29
.25
[0.0
0]
1985
216
10
9.6
5,90
4
138.
8 3,
150
29
.16
[0.0
0]
1986
204
10
7.2
5,88
2
133.
6 3,
229
26
.48
[0.0
0]
1987
192
10
5.9
6,19
6
126.
2 3,
565
20
.32
[0.0
0]
1988
180
10
1.0
6,42
9
117.
3 3,
832
16
.25
[0.0
0]
1989
168
98
.9
6,17
5
109.
7 3,
900
10
.78
[0.0
0]
1990
156
95
.4
5,97
0
106.
7 3,
731
11
.31
[0.0
0]
1991
144
91
.2
5,81
0
104.
4 3,
606
13
.17
[0.0
0]
1992
132
86
.3
5,89
4
100.
2 3,
634
13
.87
[0.0
0]
1993
120
81
.5
6,00
9
94.1
3,
764
12
.66
[0.0
0]
1994
108
73
.8
6,54
8
86.1
4,
141
12
.33
[0.0
0]
1995
96
66
.0
6,83
5
78.3
4,
289
12
.34
[0.0
0]
1996
84
58
.8
7,07
3
73.4
4,
281
14
.59
[0.0
0]
1997
72
51
.0
7,52
4
68.2
4,
417
17
.20
[0.0
0]
1998
60
43
.6
7,50
5
57.7
4,
753
14
.10
[0.0
0]
1999
48
36
.9
7,06
2
45.9
5,
123
9.
02
[0.0
0]
2000
36
29
.7
6,71
3
34.1
5,
635
4.
44
[0.0
0]
2001
24
21
.0
6,36
3
22.5
5,
945
1.
43
[0.0
0]
2002
12
11
.4
5,66
3
11.6
5,
685
0.
25
[0.0
0]
24
Tabl
e 7
Size
Dec
ile B
reak
poin
ts
C
ente
r for
Res
earc
h in
Sec
uriti
es P
rices
(CR
SP) b
reak
poin
ts a
re fo
rmed
from
com
mon
equ
ity tr
aded
on
the
NY
SE.
Thom
son
Dat
astre
am (T
DS)
bre
akpo
ints
are
form
ed
from
all
secu
ritie
s on
con
stitu
ent
lists
FA
MER
A-F
AM
ERZ
and
DEA
DU
S1-D
EAD
US6
(32
lis
ts t
otal
) w
ith t
ype
equa
l to
equ
ity a
nd e
xcha
nge
mne
mon
ic o
f N
YSE
. B
reak
poin
ts a
re a
pplie
d to
all
secu
ritie
s in
the
sam
ple
with
out r
egar
d to
exc
hang
e. T
DS-
Raw
refe
rs to
the
orig
inal
dat
a as
orig
inal
ly d
ownl
oade
d, S
cree
ned
and
Cor
rect
ed
refe
rs to
the
rem
oval
of n
on c
omm
on e
quity
and
the
corr
ectio
n of
obv
ious
dat
a er
rors
. A
nnua
l Dec
ile E
quity
Cou
nt is
the
tota
l num
ber o
f obs
erva
tions
in th
at d
ecile
for
the
full
year
.
CR
SP
TD
S - R
aw
Sc
reen
ed a
nd C
orre
cted
TD
S
Dec
embe
r, 19
75
D
ecile
B
reak
poin
t A
nnua
l Dec
ileEq
uity
Cou
nt
Dec
ile
Bre
akpo
int
Ann
ual D
ecile
Equi
ty C
ount
Dec
ile
Bre
akpo
int
Ann
ual D
ecile
Eq
uity
Cou
nt
Dec
ile 1
(sm
alle
st)
16
.22
27,0
29
2.
24
3,54
1
2.10
3,24
2 D
ecile
2
25
.57
5,24
2
5.43
3,
342
5.
212,
897
Dec
ile 3
39.9
24,
440
10
.06
3,20
2
9.91
3,23
1 D
ecile
4
60
.85
4,00
1
17.0
9 2,
749
17
.19
3,02
9 D
ecile
5
92
.82
3,29
6
27.7
5 3,
255
28
.85
2,88
8 D
ecile
6
15
1.92
2,95
1
46.5
3 2,
645
51
.26
2,93
9 D
ecile
7
24
8.70
2,24
2
75.4
5 2,
678
87
.43
2,73
1 D
ecile
8
46
1.15
2,38
0
176.
63
2,84
6
203.
983,
032
Dec
ile 9
815.
921,
876
51
6.70
2,
596
56
3.81
2,63
1 D
ecile
10
(larg
est)
2,
227
2,85
3
2,74
8
Tot
al
55
,684
29
,707
29,3
68
A
vg. N
YSE
Mkt
Cap
12/
1975
443.
24
263.
49
28
2.79
Dec
embe
r, 20
01
Dec
ile 1
(sm
alle
st)
10
5.47
29,7
88
25
.31
19,7
33
10
5.47
29,2
19
Dec
ile 2
260.
199,
304
76
.86
17,3
86
22
5.83
8,66
4 D
ecile
3
44
4.90
5,65
0
138.
30
9,97
8
388.
896,
219
Dec
ile 4
717.
294,
637
23
0.74
8,
337
63
0.55
5,09
0 D
ecile
5
1,
117.
653,
751
38
3.05
7,
514
98
8.23
4,23
3 D
ecile
6
1,
663.
802,
865
66
5.05
7,
065
1,
496.
753,
316
Dec
ile 7
2,66
1.05
2,46
3
1,21
2.01
6,
231
2,
378.
912,
830
Dec
ile 8
5,12
2.23
2,46
2
2,36
6.94
4,
905
4,
346.
442,
680
Dec
ile 9
12,2
36.6
92,
223
6,
254.
85
4,25
2
10,6
32.9
12,
606
Dec
ile 1
0 (la
rges
t)
1,
931
4,04
4
2,
216
T
otal
65
,074
89
,445
67
,073
Avg
. NY
SE M
kt C
ap 1
2/20
01
6,46
6.97
3,
773.
45
5806
.00
25
Tabl
e 8
Div
iden
ds
Th
is t
able
lis
ts s
umm
ary
divi
dend
inf
orm
atio
n fo
r th
e sa
mpl
e of
Cen
ter
for
Res
earc
h in
Sec
urity
Pric
es (
CR
SP)
dat
a th
at w
e ar
e ab
le t
o m
atch
to
Thom
son
Dat
astre
am (T
DS)
by
both
firm
and
dat
e.
CR
SP/T
DS
Mat
chin
g Sa
mpl
e
Obs
erva
tions
with
zer
o di
vide
nds
781,
043
85.1
4%
O
bser
vatio
ns w
ith n
on-z
ero
divi
dend
s
136,
353
14.8
6%
Obs
erva
tions
with
mat
chin
g no
n-ze
ro d
ivid
end
amou
nts
127,
236
93.3
1%
O
bser
vatio
ns w
ith n
on-m
atch
ing
divi
dend
am
ount
s
8,
215
6.02
%
C
RSP
>0, T
DS=
0
5,
585
67.9
9%
CR
SP=0
, TD
S>0
1,07
113
.04%
C
RSP
>0, T
DS>
0
1,
559
18.9
8%
Mis
sing
TD
S Pr
ice
Dat
a
90
20.
66%
Tota
l non
mat
chin
g am
ount
s
Tota
l
91
7,39
610
0%
26
Figu
re 1
CR
SP s
ampl
e
0
2000
4000
6000
8000
1000
0
1200
0
1975
1980
1985
1990
1995
2000
Year
# of firms
00.1
0.2
0.3
0.4
0.5
0.6
0.7
0.8
0.9
1
CR
SP
with
mat
chC
RSP
with
nom
atch
Perc
ent M
atch
ed
27
Figu
re 2
TDS
sam
ple
0
2000
4000
6000
8000
1000
0
1200
0
1400
0
1975
1980
1985
1990
1995
2000
Year
# of firms
00.1
0.2
0.3
0.4
0.5
0.6
0.7
0.8
0.9
1
DS
with
mat
chD
S w
ith n
omat
chP
erce
nt M
atch
ed
28
Figu
re 3
CR
SP v
s. T
DS
Mar
ket D
ivid
end
Yiel
dC
omm
on S
ampl
e
0.0%
1.0%
2.0%
3.0%
4.0%
5.0%
6.0%
7.0%197512
197612
197712
197812
197912
198012
198112
198212
198312
198412
198512
198612
198712
198812
198912
199012
199112
199212
199312
199412
199512
199612
199712
199812
199912
200012
200112
200212
Year
/Mon
th
Dividend Yield
CR
SP
TDS
29
Figu
re 4
CR
SP v
s. T
DS
Mar
ket D
ivid
end
Yiel
dA
ll A
vaila
ble
Obs
erva
tions
0.0%
1.0%
2.0%
3.0%
4.0%
5.0%
6.0%
7.0%
197512
197612
197712
197812
197912
198012
198112
198212
198312
198412
198512
198612
198712
198812
198912
199012
199112
199212
199312
199412
199512
199612
199712
199812
199912
200012
200112
200212
Year
/Mon
th
Dividend Yield
CR
SP
TDS