Embed Size (px)
Citation preview
Aceh Int. J. Sci. Technol., 10(2) 117-128 August, 2021
doi: 10.13170/aijst. 10.2.21193
117
Overpressure-generating Mechanisms in the Blok F3, North Sea, Netherland
Khusmia Karin1*, Sudarmaji1 1Geophysical Studies Program, Department of Physics, Faculty of Mathematics and Natural Sciences
Universitas Gadjah Mada, North Sekip Bulaksumur, Yogyakarta 55281, Indonesia; *Corresponding author: [email protected]
Received : January 26, 2021 Accepted : September 14., 2021 Online :September 18, 2021 Abstract – Block F3 North Sea is a block with pore pressure values that vary over time due to complex geological conditions such as burial and various sedimentation zones. Pore pressure is one of the important aspects that need to be analyzed as a basis for the identification of zones and overpressure mechanisms. Overpressure is a greater pore pressure condition than normal pressure and may cause drilling problems, such as kicks, blowouts, etc. This study calculated pore pressure values using the eaton method approach with well data and seismic data. Both data are integrated for generating pore pressure values in 1D and 3D. 1D Modelling uses Interactive Petrophysics 3.5, while 3D modeling uses Petrel software. In 3D modeling, the variables used are interval velocity and inversion velocity obtained by acoustic impedance inversion. The sub-variables used are the inversion density and the regression density obtained from well density acoustic impedance inversion. The existence of a 1D overpressure zone at a depth of 1,100 – 1,800 m with an overpressure value of 3,836 – 18,975 kPa. In addition, the overpressure value based on the 3D model is 8,000 – 18,000 kPa. The overpressure zone is validated using an acoustic impedance inversion model with a high value of 5,200 – 5,380 (m/s)*(gr/cc). Overpressure in Block F3 is predicted to occur from disequilibrium compaction. Keywords: Pore pressure prediction, overpressure, velocity, density, Block F3, North Sea, Netherlands. Introduction
Exploration and exploitation of oil and gas will continue to be performed to meet energy needs. The exploration process is performed by geological surveys and geophysical surveys. The exploitation process is then carried out by wells drilled. Drilling of these wells is carried out with different risks at each production well. In Indonesia, there was a drilling problem such as Lumpur Lapindo Sidoarjo on May 27, 2006. Lapindo has dipped factories, housing, schools, and infrastructure in just a matter of months (Sabdaningsih, 2018). In addition, the oil spill incident of BP's deepwater horizon disaster occurred in America in April 2010. The incident polluted the Gulf of Mexico with a crude oil spill of 200 billion gallons for approximately 87 days (Hoch, 2010). The incident also 11 workers dead and 17 injured (Welch, 2010). The cause of both cases is still contentious. It is believed that oil spill is caused by hydro-fracturing, geothermal process, or overpressure. Overpressure is one of the causes of drilling problems that affect the stability of wells, such as kicks and blowsts. Overpressure occurs when pore fluid pressure in the rock is greater than the normal pore pressure (hydrostatic pressure). According to Dutta (2002), overpressure usually occurs in impermeable rocks, the porosity increases to depth, and the density decreases to depth.
The research was carried out in Block F3, North Sea, Netherlands. Jager (2007) stated that the pore pressure in the field varies considerably, ranging from normal to high pressure (overpressure). Complex burial activities cause overpressure on this block. Overpressure events that occur throughout the period, such as the Neosen, Triassic, and JURA periods, can be found in this block. Therefore, the pore pressure
Aceh Int. J. Sci. Technol., 10(2) 117-128 August, 2021
doi: 10.13170/aijst. 10.2.21193
118
calculation was conducted in this study to find information on the subsurface pressure on Blok F3. In this study, the eaton method was used in Sonic Log to calculate the pore pressure. The Eaton method is used to determine pore pressure in research areas formed by loading mechanisms. In addition, the Eaton method is used because there is no direct data pressure on the measurement. The Eaton method results are shown in a 1D and 3D model pore pressure. The model will be used to predict pore pressure distribution to be used to the next well design. Materials and Methods Time and site
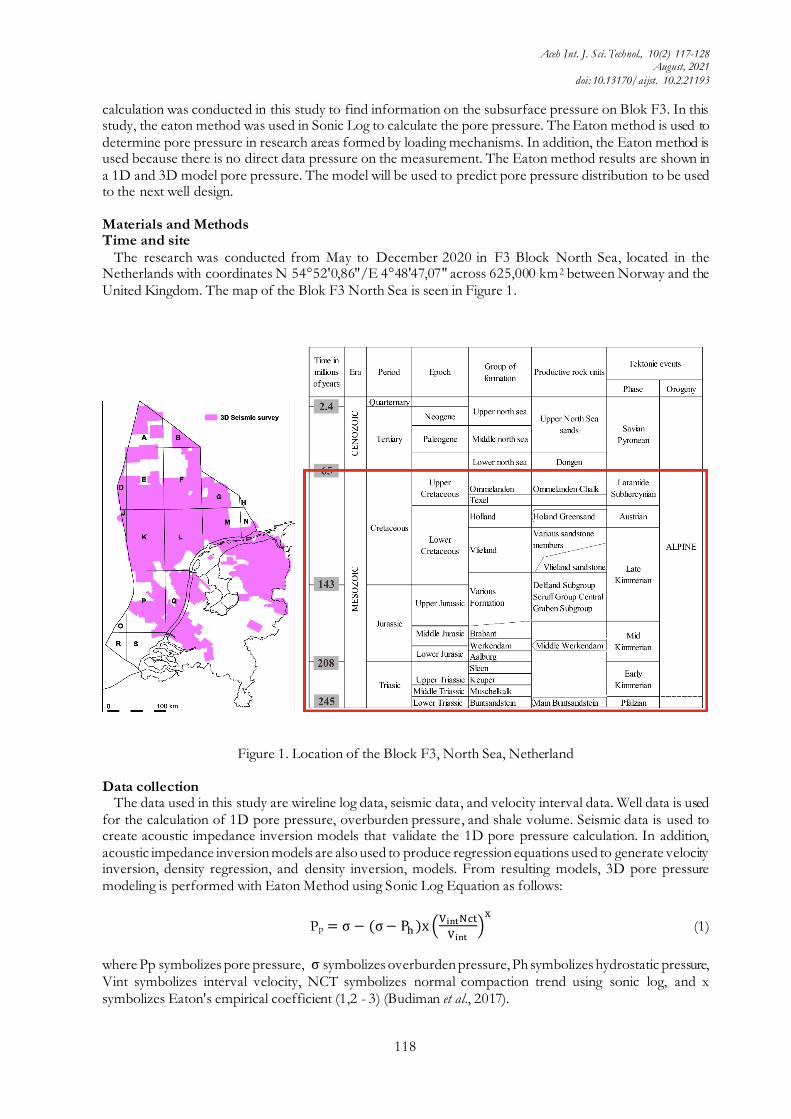
The research was conducted from May to December 2020 in F3 Block North Sea, located in the Netherlands with coordinates N 54°52'0,86"/E 4°48'47,07" across 625,000 km2 between Norway and the United Kingdom. The map of the Blok F3 North Sea is seen in Figure 1.
Figure 1. Location of the Block F3, North Sea, Netherland
Data collection
The data used in this study are wireline log data, seismic data, and velocity interval data. Well data is used for the calculation of 1D pore pressure, overburden pressure, and shale volume. Seismic data is used to create acoustic impedance inversion models that validate the 1D pore pressure calculation. In addition, acoustic impedance inversion models are also used to produce regression equations used to generate velocity inversion, density regression, and density inversion, models. From resulting models, 3D pore pressure modeling is performed with Eaton Method using Sonic Log Equation as follows:
Pp = σ − (σ − Ph )x (VintNct
Vint)
x
(1)
where Pp symbolizes pore pressure, σ symbolizes overburden pressure, Ph symbolizes hydrostatic pressure, Vint symbolizes interval velocity, NCT symbolizes normal compaction trend using sonic log, and x symbolizes Eaton's empirical coefficient (1,2 - 3) (Budiman et al., 2017).
Aceh Int. J. Sci. Technol., 10(2) 117-128 August, 2021
doi: 10.13170/aijst. 10.2.21193
119
Analysis of pore pressure using eaton methods
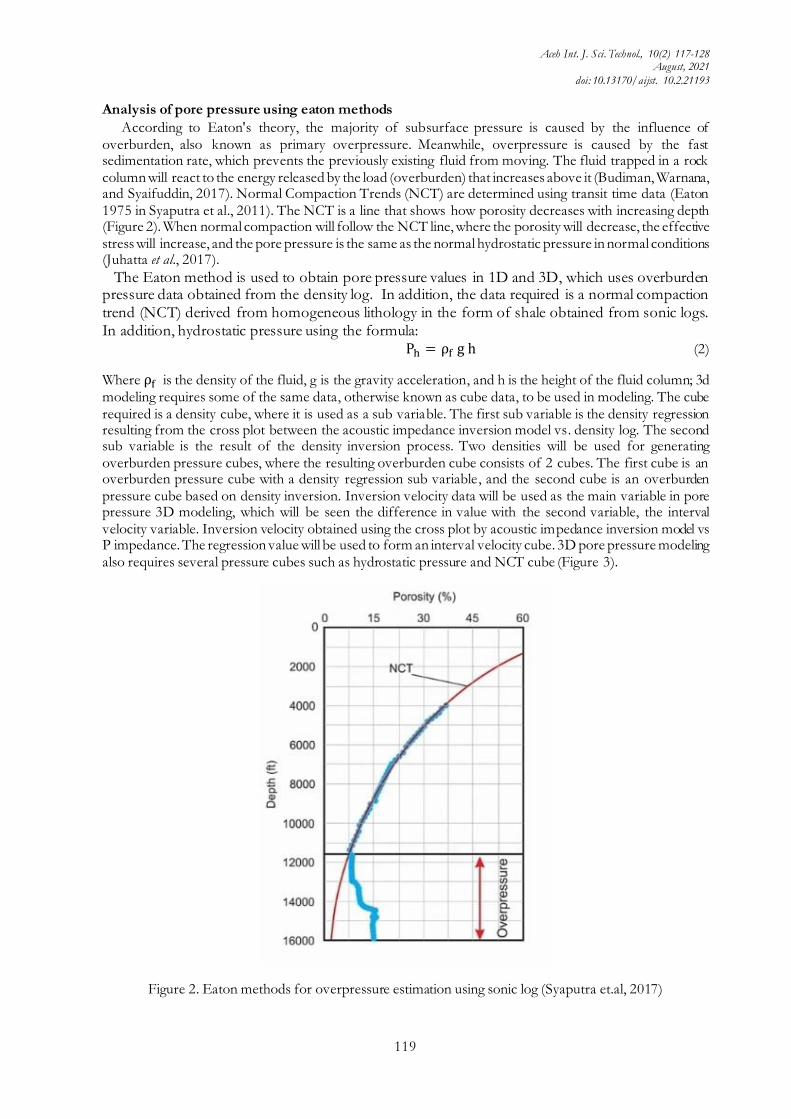
According to Eaton's theory, the majority of subsurface pressure is caused by the influence of overburden, also known as primary overpressure. Meanwhile, overpressure is caused by the fast sedimentation rate, which prevents the previously existing fluid from moving. The fluid trapped in a rock column will react to the energy released by the load (overburden) that increases above it (Budiman, Warnana, and Syaifuddin, 2017). Normal Compaction Trends (NCT) are determined using transit time data (Eaton 1975 in Syaputra et al., 2011). The NCT is a line that shows how porosity decreases with increasing depth (Figure 2). When normal compaction will follow the NCT line, where the porosity will decrease, the effective stress will increase, and the pore pressure is the same as the normal hydrostatic pressure in normal conditions (Juhatta et al., 2017).
The Eaton method is used to obtain pore pressure values in 1D and 3D, which uses overburden pressure data obtained from the density log. In addition, the data required is a normal compaction trend (NCT) derived from homogeneous lithology in the form of shale obtained from sonic logs. In addition, hydrostatic pressure using the formula:
Ph = ρf g h (2)
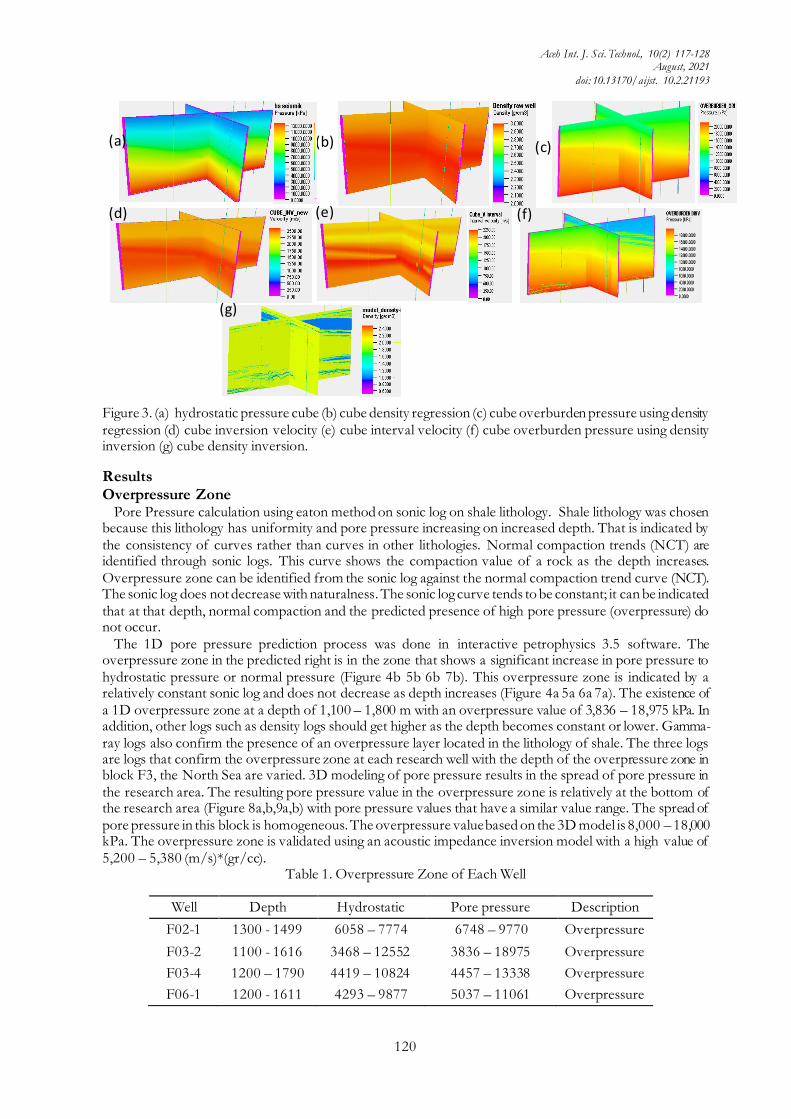
Where ρf is the density of the fluid, g is the gravity acceleration, and h is the height of the fluid column; 3d modeling requires some of the same data, otherwise known as cube data, to be used in modeling. The cube required is a density cube, where it is used as a sub variable. The first sub variable is the density regression resulting from the cross plot between the acoustic impedance inversion model vs. density log. The second sub variable is the result of the density inversion process. Two densities will be used for generating overburden pressure cubes, where the resulting overburden cube consists of 2 cubes. The first cube is an overburden pressure cube with a density regression sub variable, and the second cube is an overburden pressure cube based on density inversion. Inversion velocity data will be used as the main variable in pore pressure 3D modeling, which will be seen the difference in value with the second variable, the interval velocity variable. Inversion velocity obtained using the cross plot by acoustic impedance inversion model vs P impedance. The regression value will be used to form an interval velocity cube. 3D pore pressure modeling also requires several pressure cubes such as hydrostatic pressure and NCT cube (Figure 3).
Figure 2. Eaton methods for overpressure estimation using sonic log (Syaputra et.al, 2017)
Aceh Int. J. Sci. Technol., 10(2) 117-128 August, 2021
doi: 10.13170/aijst. 10.2.21193
120
Figure 3. (a) hydrostatic pressure cube (b) cube density regression (c) cube overburden pressure using density regression (d) cube inversion velocity (e) cube interval velocity (f) cube overburden pressure using density inversion (g) cube density inversion.
Results Overpressure Zone
Pore Pressure calculation using eaton method on sonic log on shale lithology. Shale lithology was chosen because this lithology has uniformity and pore pressure increasing on increased depth. That is indicated by the consistency of curves rather than curves in other lithologies. Normal compaction trends (NCT) are identified through sonic logs. This curve shows the compaction value of a rock as the depth increases. Overpressure zone can be identified from the sonic log against the normal compaction trend curve (NCT). The sonic log does not decrease with naturalness. The sonic log curve tends to be constant; it can be indicated that at that depth, normal compaction and the predicted presence of high pore pressure (overpressure) do not occur.
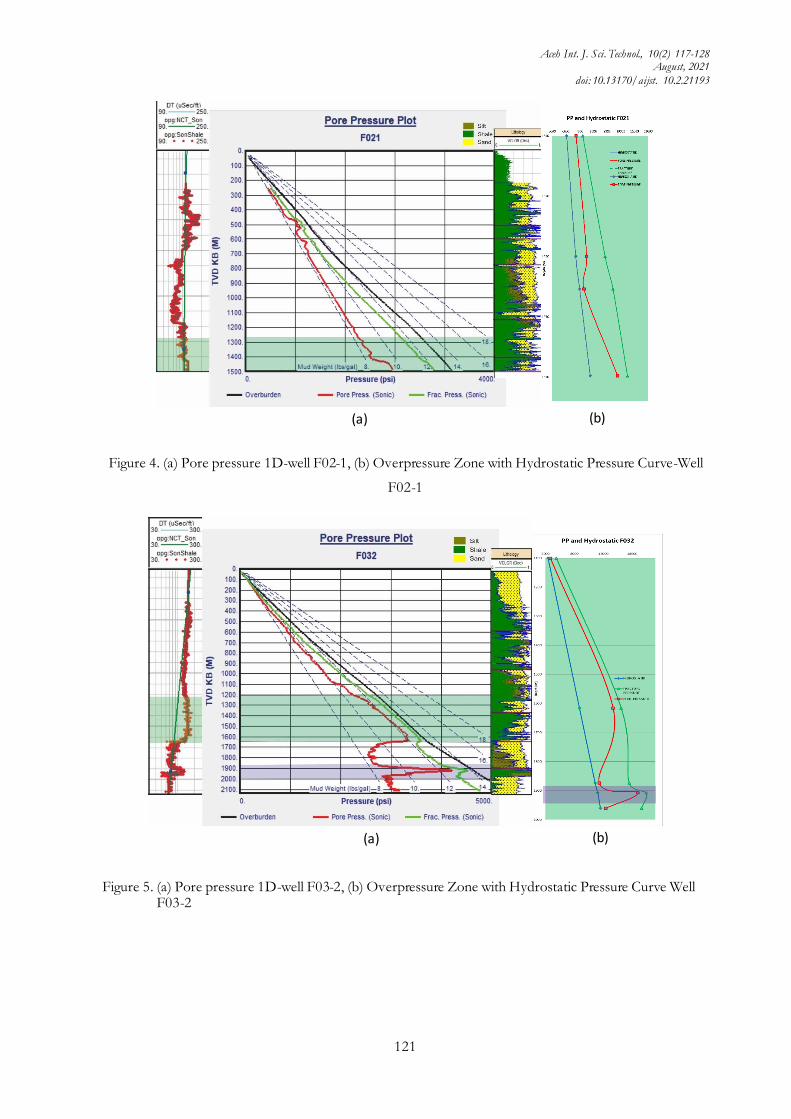
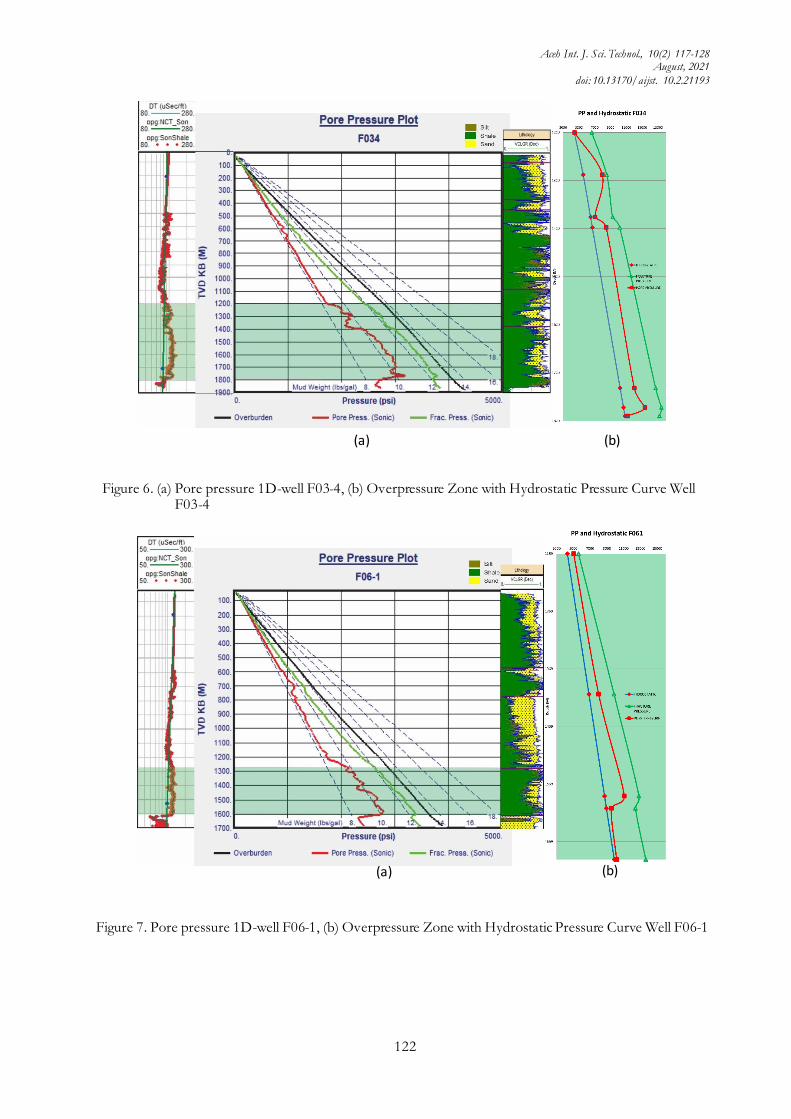
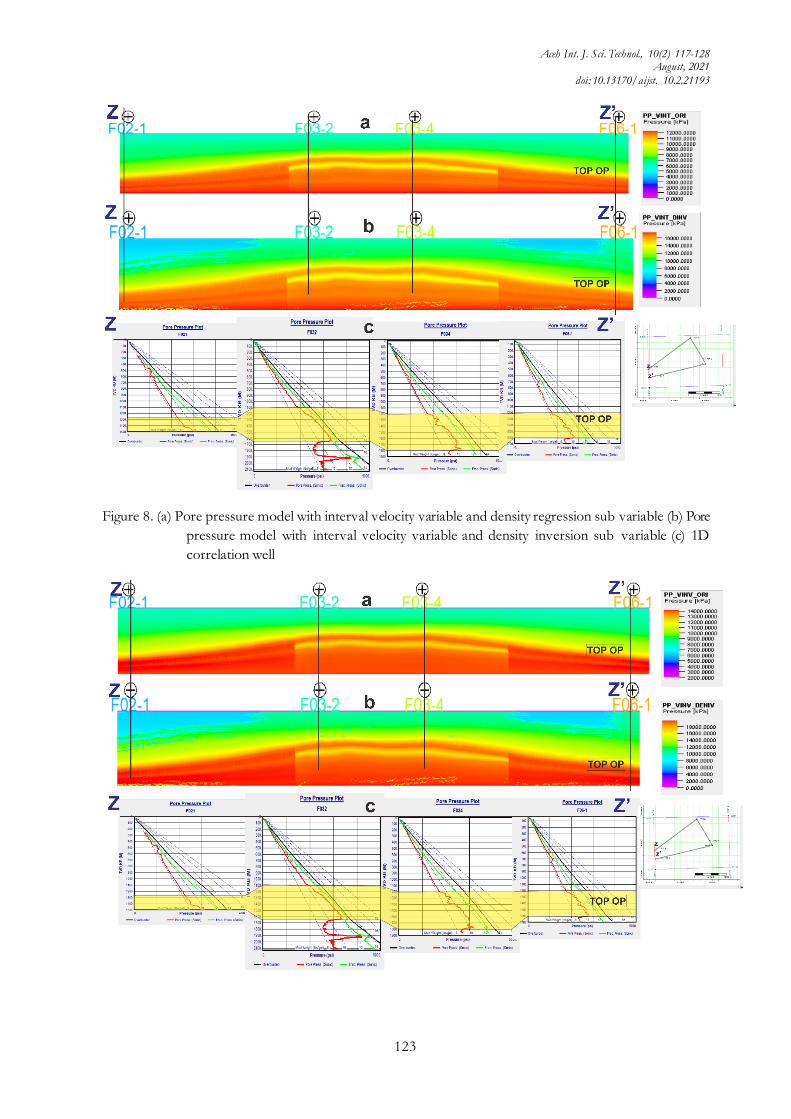
The 1D pore pressure prediction process was done in interactive petrophysics 3.5 software. The overpressure zone in the predicted right is in the zone that shows a significant increase in pore pressure to hydrostatic pressure or normal pressure (Figure 4b 5b 6b 7b). This overpressure zone is indicated by a relatively constant sonic log and does not decrease as depth increases (Figure 4a 5a 6a 7a). The existence of a 1D overpressure zone at a depth of 1,100 – 1,800 m with an overpressure value of 3,836 – 18,975 kPa. In addition, other logs such as density logs should get higher as the depth becomes constant or lower. Gamma-ray logs also confirm the presence of an overpressure layer located in the lithology of shale. The three logs are logs that confirm the overpressure zone at each research well with the depth of the overpressure zone in block F3, the North Sea are varied. 3D modeling of pore pressure results in the spread of pore pressure in the research area. The resulting pore pressure value in the overpressure zone is relatively at the bottom of the research area (Figure 8a,b,9a,b) with pore pressure values that have a similar value range. The spread of pore pressure in this block is homogeneous. The overpressure value based on the 3D model is 8,000 – 18,000 kPa. The overpressure zone is validated using an acoustic impedance inversion model with a high value of 5,200 – 5,380 (m/s)*(gr/cc).
Table 1. Overpressure Zone of Each Well
Well Depth Hydrostatic Pore pressure Description
F02-1 1300 - 1499 6058 – 7774 6748 – 9770 Overpressure
F03-2 1100 - 1616 3468 – 12552 3836 – 18975 Overpressure
F03-4 1200 – 1790 4419 – 10824 4457 – 13338 Overpressure
F06-1 1200 - 1611 4293 – 9877 5037 – 11061 Overpressure
(a) (b) (c)
(d) (e) (f)
(g)
Aceh Int. J. Sci. Technol., 10(2) 117-128 August, 2021
doi: 10.13170/aijst. 10.2.21193
121
Figure 4. (a) Pore pressure 1D-well F02-1, (b) Overpressure Zone with Hydrostatic Pressure Curve-Well
F02-1
Figure 5. (a) Pore pressure 1D-well F03-2, (b) Overpressure Zone with Hydrostatic Pressure Curve Well F03-2
(a) (b)
(a) (b)
Aceh Int. J. Sci. Technol., 10(2) 117-128 August, 2021
doi: 10.13170/aijst. 10.2.21193
122
Figure 6. (a) Pore pressure 1D-well F03-4, (b) Overpressure Zone with Hydrostatic Pressure Curve Well F03-4
Figure 7. Pore pressure 1D-well F06-1, (b) Overpressure Zone with Hydrostatic Pressure Curve Well F06-1
(a) (b)
(a) (b)
Aceh Int. J. Sci. Technol., 10(2) 117-128 August, 2021
doi: 10.13170/aijst. 10.2.21193
123
Figure 8. (a) Pore pressure model with interval velocity variable and density regression sub variable (b) Pore
pressure model with interval velocity variable and density inversion sub variable (c) 1D
correlation well
Aceh Int. J. Sci. Technol., 10(2) 117-128 August, 2021
doi: 10.13170/aijst. 10.2.21193
124
Figure 9. (a) Pore pressure model with inversion velocity variable and density regression sub variable, (b)
Pore pressure model with inversion velocity variable and density inversion sub variable, (c) 1D correlation
well
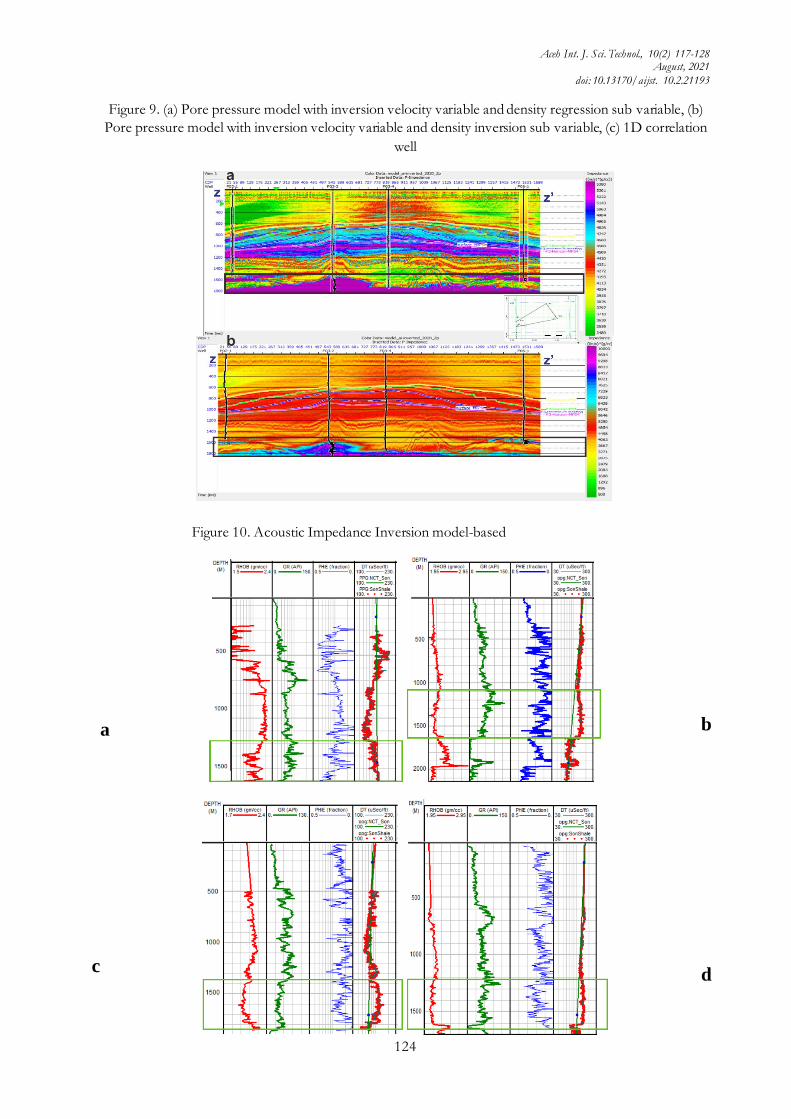
Figure 10. Acoustic Impedance Inversion model-based
a b
c d
Aceh Int. J. Sci. Technol., 10(2) 117-128 August, 2021
doi: 10.13170/aijst. 10.2.21193
125
Figure 11 (a) Shale overpressure validation using wireline log on F02-1 (b) Shale overpressure validation
using wireline log on F03-2 (c) Shale overpressure validation using wireline log on F03-4 (d)
Shale overpressure validation using wireline log on F06-1
Overpressure Mechanism After calculating pore pressure, mechanisms analysis that occurs in the overpressure zone of each well is
carried out. The dominating mechanism in the block is the loading mechanism formed through the process of disequilibrium compaction. This compaction disequilibrium is reviewed through effective stress in each overpressure zone in each available well. The effective stress value is relatively constant to the addition of overburden pressure and pore pressure curve (Figure 4a 5a 6a 7a). Disequilibrium compaction on this block has been conducted. Research confirmed in block F3 that the North Sea makes disequilibrium compaction by 80% the main cause of overpressure (Peter, 1998). Disequilibrium compaction occurs because the deposition rate is faster than the rate of fluid coming out of the pore space. Because there is still fluid in the pore space, so the opportunity for the grain to connect or contact between the grains becomes low or ineffective and resulting in a failure of compaction. This compaction failure is the pressure of rock pores to produce high pore pressure(overpressure). Overpressure Transference
Block F3, North Sea, is very interesting for further assessment. In this block, precisely the well F03-2 (Figure 5) obtained the results of unique analysis, where the process of overpressure transference related to fluid flow from place one to another. Lateral reservoir drainage occurs when an isolated reservoir (sand) is locked between thick shale that undergoes overpressure. This sand relates to a seabed/surface, which indicates that the high overpressure curve will decrease drastically. This is because the overpressure shale is dewatering the sand. This will produce a shoulder effect that shows the pressure continuity between shale and sand. The shoulder effect can be observed using wireline log, where the log value of porosity deflection towards high porosity. This analysis was confirmed by research conducted by Dennis (2000), which explains lateral reservoir drainage in block F3, North Sea. In addition, the shoulder effect is confirmed using the inverse of acoustic impedance, which indicates a high relative acoustic impedance value (Fig. 10) and suddenly decreases the value of acoustic impedance in the lithology and is predicted as lateral reservoir drainage. Validation
The inversion process has shown a match between the seismic impedance and the well log impedance. It can be reviewed qualitatively based on color suitability. With acoustic impedance values ranging from 3480 to 5380 m / s * g / cc. A pore pressure curve was used to validate the sonic log, which is constant with respect to depth. The overpressure zone in well F02-1 is located at a depth of 1300-1499 m, in well F03-2 at 1100-1616 m, in well F03-4 at 1200-1800 m, and in well F06-1 at 1200-1616 m, which is marked with a green box (Figure 11). The overpressure zone is located in a black box with an acoustic impedance value of 5200 - 5380 m / s * g / cc (Figure 10a). The acoustic impedance inversion model is presented in a higher range of values for clarity of resolution (Figure 10b). The results of the overpressure zone marked with a black box are quite clear and are still in the very high range of acoustic impedance values.
Furthermore, the researchers confirmed again based on the 1D analysis that the zone is shale-dominated. The existence of the overpressure shale is validated using the available logs. The density possessed by shale in the overpressure zone is low (Dutta, 2002). On the other hand, the zone is also confirmed by gamma-ray logs and sonic logs, where sonic logs tend to be constant, and high-value gamma rays indicate that the zone is a shale lithology that is overpressure.
Discussion The relationship between sonic and normal compaction trends on effective stress is often used to
differentiate the mechanism of overpressure. This mechanism is in the form of loading and unloading mechanisms related to the compaction process. In this field, the mechanism formed is a loading mechanism that occurs due to disequilibrium compaction. The disequilibrium compaction is dominated by sediment at depths that coincide with high overpressure pressures. The overpressure that occurs in this research is the overpressure of the sediment in the form of shale. In normal compaction, the log sonic curve will follow the normal compaction trend line, the effective stress will increase, and the pore pressure will be the same as the hydrostatic pressure. In this research, shale was identified through gamma-ray logs as an indicator of
Aceh Int. J. Sci. Technol., 10(2) 117-128 August, 2021
doi: 10.13170/aijst. 10.2.21193
126
lithology. The lithology of the shale of each well is spread out in various depths. The results obtained are the shale zone that has overpressure in the well F02-1 located at a depth of 1300 - 1499 m. different from the first well, the second well, F03-2, has shale overpressure at two depths, namely at 1100 - 1616 m and 1874 - 1961 m. The two zones are confined by sand lithology, which experiences dewatering, or the lateral reservoir drainage phenomenon, which will be discussed in the next discussion. Shale overpressure in the third well, F03-4, is located at a depth of 1200 - 1790 m, and the last well, F06-1, is located at a depth of 1200 - 1611 m. at this depth range, especially the shale overpressure shows a very high acoustic impedance value from the surroundings.
Disequilibrium compaction is therefore likely to be found in shale successions during continuous rapid burial. In slow burial conditions, sediment compaction occurs typically because there is a balance. The balance occurs between overburden pressure and reduced pore fluid. When the fluid cannot get out quickly from the pore space with low permeability and fast compaction, it will result in overpressure. The loading mechanism caused by disequilibrium compaction is one of the most common in the mechanism of abnormal pressure formation in sedimentary basins. This is due to favorable conditions such as rapid burial, high clay content, and low permeability, often found in clay, shale, mud, and shale. Rapid burials that produce this disequilibrium compaction mechanism are found in all wells F02-1, F03-2, F03-4, and F06-1.
Interestingly, there was a lateral reservoir drainage event in this field because there is sand supported on the Paleocene fan between the thick shales. The shale is in an overpressure condition, so the shale tends to dewater towards the sand. Sand on the Paleocene fan undergoes overpressure transport laterally to the seabed. This is a lateral overpressure causes the transfer overpressure condition Conclusion
Based on the analysis results, the 1D F3 block overpressure zone is at a depth of 1200 - 1800 m—range of overpressure values 3836.4 - 18975 kPa (Table 1). Confirmed by the 3D model variable Vinv and Vint overpressure values have a range of 8000 – 18. 000 kPa. The mechanism that causes overpressure in this block is the loading mechanism. This mechanism is also indicated by an increased pore pressure curve and effective stress that tends to be constant.
Acknowledgment The authors thank the Geophysical study program of Universitas Gadjah Mada and Dr. Sudarmaji, S.Si., M.Si
for arranging overpressure and general mechanism research in F3 Block. Thanks are also due to reviewers who have sharpened this paper. References Arief, J. H. 2019. Pemodelan 3D Tekanan Pori Berdasarkan Interval Velocity Cube Dan Accoustic Impedance Cube Pada
Lapangan j Cekungan Jawa Timur. Malang: Universitas Brawijaya. Arohman, Z. 2016. Karakterisasi Reservoir Migas Menggunakan Seismik Inversi Impedansi akustik dan Analisis
Seismik Multiatribut pada Lapangan “ZA”, Formasi Baturaja, Cekungan Sumatera Selatan. Lampung: Universitas Lampung.
Arumi, S. N. 2014. Aplikasi metode inversi impedansi akustik dan perbandingan metode multiatribut menggunakan regresi linier dengan neural networks pada lapangan F3, Northsea, Netherlands. Yogyakarta: Universitas Gadjah Mada.
Berry, A., & Utama, W. 2009. Estimasi Tekanan Formasi Menggunakan Metode Tekanan Efektif dan Tekanan Minimum dengan Kalibrasi Data Log (DST, RFT, FIT dan LOT): Studi Kasus Lapangan NN#. Jurnal Fisika dan Aplikasinya, 5, 090106-1 - 090106-9.
Bobby, I. 2011. Analisa metode inversi impedansi akustik dan seismik multiatribut untuk karakterisasi reservoar pada lapangan F3 Netherland. Jakarta: Universitas Indonesia.
Bowers, G.L. 1995. Pore pressure estimation from velocity data: Accounting for pore pressure mechanisms besides undercompaction. OnePetro, 10(02). doi:https://doi.org/10.2118/27488-PA
Budiman, M.A., Warnana, D.D. & Syaifuddin, F. 2017. Kajian dan Komparasi Teoritis Metode Prediksi Tekanan Pori: Metode Eaton dan Metode Bowers. Jurnal Teknik ITS, 6(2), 2337-3520. doi:10.12962/j23373539.v6i2.23332
Carstens, H. 1978. Origin of abnormal formation pressures in central North Sea Lower. The Log Analyst, 19: 24-28.
Aceh Int. J. Sci. Technol., 10(2) 117-128 August, 2021
doi: 10.13170/aijst. 10.2.21193
127
Cayley, G. T. 1987. Hydrocarbon migration in the central North Sea. In B. J. London, Graham, Trotman: Petroleum geology of northwest Europe.
Dennis, H., Baillie, J. & Wessel-berg, D. 2000. Hydrodynamic activity and tilted oil-water contacts in the North Sea. Elsevier, 9: 171-185. doi:10.1016/S0928-8937(00)80016-8
Dutta, N. C. 2002. Geopressure prediction using seismic data: Current status and the road ahead. Geophysics, 67(6): 2012-2041.
Fertl, W.H., & Chilingarian, G.V. 1987. Abnormal formation pressures and their detection by pulsed neutron capture logs. Elsevier, 1(1): 23-38. doi:10.1016/0920-4105(87)90012-X
Hoch, M. 2010. New Estimate Puts Gulf Oil Leak at 205 Million Gallons. Retrieved from http://www.pbs.org/newshour/rundown/new-estimate-puts-oil-leak-at-49-million-barrels
Jackson, C. A., Grunhagen, H. Howell, J. Larsen, A.L. Andresson, A. Boen, F. & Groth, A. 2010. 3D seismic imaging of lower delta-plain beach ridges: Lower Brent Group, northern North Sea. Journal of the Geological Society, 1225 - 1236.
Jager, J.D., & Geluk, M.C. 2007. Petroleum Geology, Geology of The Neherlands. Royal Netherlands Academy of Arts and Sciences, 241-264.
Japsen, P. 1998. Regional Velocity-depth Anomalies,North Sea Chalk: A Record of Overpressure and Neogene Uplift and Erosion. AAPG Bulletin, 82: 2031-2074.
Juhatta , T., Ramdhan, A.M. & Fatkhan, F. 2017. Prediksi Tekanan Pori dengan Data Seismik 3D dan Data Log Sumur Menggunakan Metode Eaton (Studi Kasus di Cekungan Bonaparte Utara). Bulletin of Geology, 1(2): 107 -122. doi:10.5614/bull.geol.2017.1.2.4
Kumar, B., Niwas, S. & Mangaraj, B.K. 2012. Pore Pressure Prediction from Well Logs and Seismic Data. Hyderabad, 005
Mackey, & Maureen. 2010. Oil Spill: 90 Days Out, A Bold Look at the Big Numbers | The Fiscal Times. Retrieved Desember 18, 2020, from http://www.thefiscaltimes.com/Articles/2010/07/20/Oil-Spill-Bold-Look-Bare-Economic-Numbers
Mouchet, J.P. & Mitchell, A. 1989. Abnormal Pressure While Drilling: Origins-Prediction-Detection-Evaluation,. Paris: Technip.
Muflich, L. 2016. Prediksi tekanan pori dan identifikasi zona geopressured menggunakan markov chain monte carlo. Surabaya: Institut Teknologi Sepuluh Nopember.
Ramdhan, A.M. 2010. Overpressure and compaction in the lower Kutai Basin, Indonesia. Durham: Durham e-Theses. Ramdhan, A.M., Hutasoit, L.M. & Slameto, E. 2018. Lateral Reservoir Drainage in Some Indonesia's
Sedimentary Basins and Its Implication to Hydrodinamic Trapping. Indonesian Journal on Geoscience, 5(1): 65-80. doi:10.17014/ijog.5.1.65-80
Richardson , R. M., & Zandt, G. 2003. Inverse Problem in Geophysics Geos 567. Arizona: University of Arizona. Rider, M. 2000. The Geological Interpretation of Well Logs 2nd Edition. Rider French Consulting Ltd. Rondeel, H.E., Batjes, D.A. & Nieuwenhujs, W.H. 1996. Geology of gas and oil under the Netherlands.
Kluwer Academic Publishers, 74: S1-S20. Russel, B.H. 1998. Introduction to Seismic Inversion Methods. United States of America: Society of Petroleum
Geophysicist. Russell, B. 1998. Introduction to Seismic Inversion Methods. Texas: Society of Exploration Geophysicists. Sabdaningsih, A. 2018. Mitologi dan Sains: Bledug Kuwu di Kabupaten Grobogan. Jurnal Kajian
Kebudayaan, 13(1): 7-17. doi:10.14710/sabda.13.1.7-17 Sismanto. 2016. Dasar-Dasar Akuisisi dan Pemrosesan Seismik. Yogyakarta: Universitas Gadjah Mada. Sukmono, S. 1999. Interpretasi Seismik Refleksi. Bandung: Institut Teknologi Bandung. Sukmono, S. 2016. Seismik Inversi untuk Karakterisasi Reservoar. Bandung: Institut Teknologi Bandung. Syaputra, M.R., Mulyatno, B.S. Karyanto & Herdiana, Y. 2017. Pemodelan Prediksi Tekanan Pori
Menggunakan Metode Eaton’ S Berdasarkan Data Interval Velocity Pada Lapangan Hidrokarbon “Ertiga”, Cekungan Sumatera Selatan. Jurnal Geofisika Eksplorasi, 3(1) doi:10.23960/jge.v3i1.1028
Terzaghi. 1994. Theoritical Soil Mechanics. New York: John Wiley & Sons. Welch, W.M., & Chris, J. 2010. Memorial service honors 11 dead oil rig workers. Retrieved Desember 25, 2020,
from USA Today: http://usatoday30.usatoday.com/news/nation/2010-05-25-oil-spill-victims-memorial_N.htm
White, R. 2003. Tying Well-Log Synthetic Seismograms to Seismic Data: the Key Factors. Journal of Society of Exploration Geophysicists, 2449-2452.
Yanto, H. 2011. Prediksi Tekanan Pori dengan Menggunakan Data Kecepatan Seismik: Studi Kasus, Lapangan X Laut Dalam Selat Makassar. Jakarta: Universitas Indonesia.

Aceh Int. J. Sci. Technol., 10(2) 117-128 August, 2021
doi: 10.13170/aijst. 10.2.21193
128
Zakrevsky, K.E. 2011. Geological 3D Modelling. EAGE Publications. Houten.


![$YGD GH &iGL] - movilidadgranada.com · f3 f3 f3 f3 f3 f3 f3 f3 f3 f3 f3 f3f3 f3 f3 f3 f3 f3 f3 f3 f3 f3 f3 f3 f3 f3 f3 f3 f3f3 f3 f3 f3 f3 f3 f3 f3 f2 f2 f2 f2 f2 f2 f2 f2 f2 f2](https://img.dokumen.tips/doc/110x75/5bb5162f09d3f2b63a8c0773/ygd-gh-igl-f3-f3-f3-f3-f3-f3-f3-f3-f3-f3-f3-f3f3-f3-f3-f3-f3-f3-f3-f3-f3.jpg)