Embed Size (px)
Citation preview
Optimisation of rheological parameters induced bleedingpermeability and mechanical properties of supersulfated cementgroutsSonebi M Abdalqader A Fayyad T Perrot A amp Bai Y (2020) Optimisation of rheological parametersinduced bleeding permeability and mechanical properties of supersulfated cement grouts Construction andBuilding Materials 262 1-16 httpsdoiorg101016jconbuildmat2020120078
Published inConstruction and Building Materials
Document VersionPublishers PDF also known as Version of record
Queens University Belfast - Research PortalLink to publication record in Queens University Belfast Research Portal
Publisher rightsCopyright 2020 ElsevierThis manuscript is distributed under a Creative Commons Attribution-NonCommercial-NoDerivs License(httpscreativecommonsorglicensesby-nc-nd40) which permits distribution and reproduction for non-commercial purposes provided theauthor and source are cited
General rightsCopyright for the publications made accessible via the Queens University Belfast Research Portal is retained by the author(s) and or othercopyright owners and it is a condition of accessing these publications that users recognise and abide by the legal requirements associatedwith these rights
Take down policyThe Research Portal is Queens institutional repository that provides access to Queens research output Every effort has been made toensure that content in the Research Portal does not infringe any persons rights or applicable UK laws If you discover content in theResearch Portal that you believe breaches copyright or violates any law please contact openaccessqubacuk
Download date29 Jan 2022
1
Optimisation of rheological parameters induced bleeding permeability 1
and mechanical properties of supersulfated cement grouts 2
M Sonebi1 A Abdalqader12 T Fayyad2 A Perrot3 Y Bai4 3
4
1School of Natural and Built Environment Queenrsquos University Belfast Belfast Northern Ireland UK 5
2Tracey Concrete Ltd Northern Ireland UK 6
3University Bretagne Sud Lorient France 7
4Departement of Civil Engineering Environmental and Geomatic University College London UK 8
9
Abstract 10
Presenting a promising option that could be used to encapsulate nuclear waste material 11
for disposal supersulfated cement (SSC) is again receiving wide attention among research 12
community as a cementitious system that has noteworthy properties It is also an 13
environmentally friendly cement since it is mainly composed of ground granulated blast 14
furnace slag (GGBS) that is activated by a sulphate source such as gypsum hemihydrate or 15
anhydrite Although there is some research on SSC little research work has focused on 16
modelling the effects of the various parameters using a statistical approach which is the aim of 17
this paper The effect of dosages of GGBS anhydrite (ANH) and water-to-binder ratio (WB) 18
on the fresh and rheological parameters induced bleeding permeability compressibility and 19
compressive strength of supersulfated grouts was investigated Then statistical models and 20
isoresponse curves were developed to capture the significant trends of the tested parameters 21
using factorial design approach The models suggested that that WB had significantly higher 22
influence on most of the parameters tested while the influence of GGBS and ANH and their 23
interactions varied depending on the parameter in question The findings of this study show 24
the importance of understanding the role of and optimising the relevant key factors in 25
producing SSC fit-for-purpose The statistical models developed in this paper can facilitate 26
optimizing the mixture proportions of grouts for target performance by reducing the number of 27
trial batches needed 28
29
Keywords compressive strength heat of hydration permeability induced bleeding 30
rheology slump flow supersulfated cement yield stress viscosity 31
2
Highlights 32
bull SSC presents a promising option to encapsulate nuclear waste material 33
bullThe constituents effect on SSC groutsrsquo properties was studied and modelled 34
bullFactorial design is a powerful tool for optimizing the mixture proportions of SCC 35
bullWB had the highest influence on most of the parameters tested 36
1 Introduction 37
Ancient concrete as well as more recent concrete materials reinvented in the nineteenth century 38
have performed well in the past However over recent decades a great challenge had emerged 39
regarding ensuring efficient consumption of natural resources and hence there was a pressure 40
to make construction industry more sustainable Concrete is widely used within the 41
construction industry and contributes to a large extent to the global energy consumption and 42
carbon emission due to the energy intensity and CO2 emissions associated with cement 43
production So the industry was looking for ways to become more sustainable [1] This has 44
resulted in a high demand for new types of cement possessing improved qualities including 45
strength toughness and durability as well as being environmentally friendly 46
Cements made of industrial waste materials and by-products emerged as one of the sustainable 47
options to traditional Portland cement (PC) because it is mainly manufactured using waste and 48
by-products that require little processing making the embodied energy and emissions 49
associated with the production process low Besides its environmental benefits such materials 50
has a great versatility depending on their components and they can be tailored to make them 51
suitable for a wide range of applications in the structures industry [2] 52
One of these environmentally friendly cements that was used during the last decades is the 53
supersulfated cement (SSC) which is a cementitious system composed of ground granulated 54
blast furnace slag (GGBS) that is activated by a sulphate source such as gypsum hemihydrate 55
or anhydrite [3] Wastes of semi-dry and dry flue gas desulpherisation (FGD) can be used as 56
source of sulphate [4 5] SSC has great advantages that make it attractive for use firstly it is 57
mainly manufactured using by-products and industrial wastes Secondly it has lower CO2 58
emissions compared to PC because clinker burning is reduced The estimated embodied CO2 59
of GGBS is 796 kgCO2tonne which is 10 times lower than that of Portland cement (CEM 1) 60
at 860 kgCO2tonne [6] Besides that SSC produces much lower heat than PC and also SSC 61
3
has superior resistance to chemically aggressive environments such as sulfates Due to the 62
glassy nature of GGBS composed mainly of monosilicates GGBS easily dissolves in low to 63
mild alkaline solutions However it is required that the alumina content (Al2O3) of slag to be 64
no less than 13 to be used effectively in SSC [7] The most commonly used sources of 65
sulphate is anhydrite because it has lower solubility rate than other sources [8 9] To promote 66
the dissolution of slag PC is added because its hydration yields the formation of calcium 67
hydroxide (CH) which provides the required alkaline environment for slag dissolution Once 68
the slag is dissolved the released aluminium silicon and calcium ions from slag glass react 69
with the calcium sulfate present in the mixture to form two main hydration products ettringite 70
(C6A3H32) and calcium silicate hydrate (C-S-H) [10] Ettringite provides the early strength to 71
SSC mixtures contributing to the strength development while C-S-H is responsible for later 72
strength and the continual increase of strength over time [11 12] C-S-H formed in SSC has a 73
CaSi ratio between 10 and 12 which is much lower than that formed in PC mixtures [13] 74
This means that the chemical composition of slag plays a significant role on the strength 75
development dissolution of the slags and the amount of hydration products formed 76
After being used for long time in construction for special structures currently SSC is very 77
rarely used and no longer produced in some areas According to Baux et al [14] this happened 78
because of its lack of reactivity Grounds et al [10] believed that this is because there is 79
uncertainty over some of its properties which include its long-term stability and durability One 80
of their main concern surrounding SSC is due to the hydration product ettringite or tri-81
sulphoaluminate which is known to be unstable in Portland cement and has been found to be 82
expansive in certain environments Phelipot-Mardeleacute et al [15] state that this could be because 83
generally cement made with blast furnace slag tends to harden more slowly than mortar and 84
concrete made from PC 85
The nuclear power is a promising option for the future in the UK and the world in general 86
however the nuclear waste is still an obstacle in its way to be a vital option for the future and 87
to gain public acceptance [16] This can be achieved by making the contaminants to be less 88
mobile or less toxic by lsquowaste stabilizationrsquo that results in converting the contaminants from 89
the dissolved phase to a solid phase by reactions such as precipitation sorption or substitution 90
This prevents the waste from diffusion to the external environment [16 17] Most applications 91
of stabilization are cement-based where the cement forms a low permeability matrix and where 92
the contaminant is incorporated into hydrated phases and then precipitated due to the prevailing 93
pH in the pore solution [18] This means that the efficiency of the process depends on the 94
4
prevailing pH The pH resulting from cement hydration results in many metal contaminants 95
forming hydroxide or mixed hydroxide solids [17] Portland cement will tend to result in a 96
higher pH while combining it with lime as well as fly ash blast furnace slag and other 97
pozzolanic binders will result in lower pH The interactions of these binders with waste 98
components determine the extent of treatment [18] 99
There is a lack of data detailing the assessment criteria and performance of nuclear 100
encapsulation groutconcrete However general requirements of a cementitious system for 101
encapsulation can be summarised as follows an ability to incorporate waste and harden 102
fluidity of initial cemented mix and potential for remote mixing low permeability resistance 103
to water low temperature rise on setting workable setting time low free or unbound water 104
when setting reaction is complete low internal pH to avoid ongoing reactions such as 105
corrosion long term durability [16] 106
The solubility of many heavy metals is low at low pH and therefore low pH cements such as 107
SSC are likely to be particularly desirable cements for nuclear waste management [16ndash19] 108
This would help to make the nuclear energy as a clean and a safe source of energy a promising 109
alternative for future generations This again has highlighted some of the noteworthy 110
properties of the SSC where not only the pH value that makes SSC a promising option that 111
could be used to encapsulate nuclear waste material for disposal Also the heat of hydration in 112
supersulfated cement is much lower than that of OPC and therefore the heat gradient created 113
during hydration between the internal and external surfaces would not be as great and thus less 114
stress caused and less chance of cracking which would be unacceptable with nuclear waste 115
disposal It has high non-evaporable water content that is itrsquos chemically bonded to the silica 116
Besides that it has a good durability in aggressive environments such as structures exposed to 117
seawater or sulfate-bearing groundwater [9 14 15 20ndash22] 118
These technical and environmental benefits have re-simulated recent research on this type of 119
cement and brought the attention for re-investigating overcoming its drawbacks to offer a green 120
cement for very essential applications 121
Currently different researches are being carried out on SSC in order to optimize the usage of 122
SSC Many researchers have examined its various mixture compositions to determine the best 123
compositions for some desirable properties such as strength low permeability faster setting 124
time etc A research on slags activated with 15ndash20 calcium sulfate showed a higher 125
compressive strength in comparison with other mixtures when they examined slags classified 126
5
as low-lime high-alumina and when various SSC mixture compositions were examined with 127
70ndash85 slag 10-25 anhydrite and 5 Portland cement for alkali activation [15] 128
Gruskovnjak et al [8] investigated the effect of alumina content in the slag by examining two 129
types of slag with a high Al2O3 percentage content (12) and low Al2O3 percentage content 130
(77) The findings of their study showed that slag with high alumina contents produced more 131
ettringite and higher strength This was attributed to the higher dissolution rate of high alumina 132
slag SSC hydration characteristics with different fineness has also been investigated [20] It 133
showed that when sample particles become finer the compressive strength is significantly 134
higher Also there is some work which has been done on modifying the mechanical properties 135
of SSC with addition phosphogypsum [19 23] Recently the influence of curing temperature 136
was studied for supersulfated cements made with two slags having different chemical 137
compositions [20] It was found that SSC made with high-alumina slag resulted in higher 138
strengths and presented a more complex mechanism of hydration that was strongly influenced 139
by the solubility of anhydrite This is also being shown in [21] where the SSC made using high-140
alumina slag exhibited higher compressive strength and the use of higher activator contents 141
decreased the compressive strength 142
Based on recent researches and the fact that there are many factors and parameters involved in 143
the composition of SSC there is a demanding need for optimizing the cement grout in order to 144
effectively utilise it to fit for purpose The current paper aligns with this demand The effect of 145
GGBS water-to-binder ratio WB and anhydrite dosages on the grout fluidity rheological 146
properties induced bleeding fresh state permeability and compressibility maximum heat of 147
hydration and compressive strength will be investigated using factorial design approach and 148
analysis Although there is some research on SSC little research work has focused on 149
modelling the effects of the various parameters using a statistical approach Factorial design is 150
a powerful tool and widely used in experiments involving many factors It can be utilised to 151
study the joint effect of factors on responses or dependent variables and to develop models 152
applicable to design and development of experiments Simulation of models obtained with 153
factorial design can facilitate the test protocol needed to optimize cement grout within a given 154
set of performance criteria 155
6
2 Experimental Programme 156
21 Materials and Test Methods 157
The grout mixes investigated in this study were prepared with Standard CEM I 425N Portland 158
cement (PC) specified by BS EN 197-1 The ground granulated blast furnace slag (GGBS) in 159
accordance to BS EN 15167-2 was used The chemical composition of CEM I and GGBS are 160
provided in Table 1 Anhydrite (ANH) was used as the source of sulphate in the present study 161
and it was partially or completely replaced the PC The proportions of the grout mixes are 162
shown in Table 2 163
164
Table 1 Chemical and physical properties of cement and GGBS 165
Chemical analysis Material
CEM I GGBS
SiO2 () 2101 3518
Al2O3 () 492 1396
Fe2O3 () 284 025
MgO() 220 818
CaO () 6452 4121
Na2O () 020 019
K2O () 071 042
SO3 () 253 --
P2O5 () 011 --
LOI () 126 064
Physical analysis
Specific gravity 308 291
Specific surface area [m2kg] 360 600
166
Table 2 Mix proportions for the grouts used in the factorial design 167
Mix
No
Code WB
Percentage ()
WB GGBS ANH GGBS ANH
M1 -1 -1 -1 034 60 0
M2 1 -1 -1 044 60 0
M3 -1 1 -1 034 60 20
M4 1 1 -1 044 60 20
M5 -1 -1 1 034 80 0
M6 1 -1 1 044 80 0
M7 -1 1 1 034 80 20
M8 1 1 1 044 80 20
M9 0 0 0 039 70 10
M10 0 0 0 039 70 10
M11 0 0 0 039 70 10
M12 0 0 0 039 70 10
168
7
All grout mixes were prepared in 2 L batches using a high-shear mixer with a 45 L capacity 169
The mixing water was kept at 98 plusmn 02 ordmC to compensate for heat generated during mixing 170
The cement and GGBS were mixed with ANH in a sequence that started with adding all of the 171
water into the mixer After one minute the binder was gradually introduced The grout was 172
mixed for one minute followed by 30 seconds of rest Subsequently the grout was mixed again 173
for 2 min at a high speed (285 rpm) and for 1 min at the low speed (140 rpm) 174
For all tests the timing is given from zero time ie the time when the cement particles first 175
touch the mixing water The mini-slump flow test started at 7 min (immediately after the end 176
of mixing) The transparent cone-shaped mould described elsewhere [24] was placed in the 177
centre of a smooth Plexiglas plate After filling with grout the cone was gently lifted 178
(approximately 30 s after placement of the grout) When the flow stopped the spread of the 179
grout was measured with a ruler in two perpendicular directions 180
Marsh cone test was carried out using a metal cone with an orifice diameter of 10 mm and 181
started at 8 plusmn 1 min One litre of grout was poured into the cone The conersquos orifice was opened 182
15 s after pouring the cement grout into the cone The time taken for each 100 ml of grout to 183
flow through the orifice was recorded and the measurements were completed upon collecting 184
700 ml of grout 185
The viscosity of cement grout was determined using a coaxial rotating cylinder viscometer 186
Fann (smooth cylinders no serration) that determined apparent viscosity at different shear 187
rates The test was contained in the annular space between an outer cylinder (rotor) with a 188
radius of 18415 mm and a bob with a radius of 17245 mm and a height of 380 cm The rotor 189
and bob were plunged into a cup containing 350 ml of sample grout Viscosity measurements 190
were made when the outer cylinder rotating at a known speed caused a viscous drag to be 191
exerted by the fluid This drag created a torque on the bob which was transmitted to a precision 192
spring where its deflection was measured and compared with test conditions and the 193
instrumentrsquos constants The measurement was made for 12 rotor speeds from 09 rpm to 600 194
rpm where the viscometer reading values () were recorded The value of shear stress (Pa) 195
was calculated by including k1 torsion constant of spring per unit deflection (N-cmdegree) 196
k2 shear stress constant for the effective bob surface (cm-3) and k3 shear rate constant [s-1rpm] 197
[25 26] 198
Rotor speed was increased step by step and the viscometer readings were recorded with 199
increasing rotation speeds The reading was taken when the needle in the viscometer was 200
8
stabilised or 30 seconds after the change of speed in cases when the needle had not stabilised 201
due to the thixotropy of the cement grout The time of reading was generally between 5 and 202
10 seconds 203
In this study the down-curve was chosen for final evaluation because it offered a better 204
description of the rheological behaviour of the grouts including a structural breakdown 205
phenomenon of inner forces among particles [27] The values of shear yield stress (the 206
minimum shearing stress required for the fluid to start flowing) and plastic viscosity used the 207
modified Bingham model [28] and are expressed as follows 208
2
0 cp (1) 209
Where τ0 is yield stress (Pa) μp is plastic viscosity (Pas) is shear rate (s-1) and c is a 210
constant 211
The cohesion of grout was determined at 30 plusmn 1 min with a Lombardi plate cohesion meter 212
[29] A thin galvanized steel plate (100times100times1 mm) was immersed in the grout and hung on a 213
stand placed on an electronic balance The weight of the grout still present on the plate was 214
recorded when the dripping of the grout had stopped This test was followed by the fresh 215
density measurement of the grout with a mud balancer Knowing the fresh density of the grout 216
it was possible to calculate the thickness on each side of the plate 217
The resistance of the fresh grout to induced bleeding was evaluated using a pressure filter The 218
equipment consists of a pressure vessel filter paper which is placed on a sieve and a graduated 219
cylinder A 200 ml grout sample is placed in the pressure vessel After closing the cell the 220
graduated cylinder is placed under the outlet of the cell The cell is pressured by compressed 221
air to 055 MPa The volume of water going out through the outlet on the bottom of the cell is 222
recorded at 15 and 30 s then at every minute up to 10 min and then at every 5 min up to 30 min 223
[25] 224
Considering homogeneous bleeding the results of the induced bleeding tests allow to derive 225
the evolution of the permeability of the sample during its compaction under the applied 226
pressure The permeability of the material is directly linked to the bleeding rate during the 227
material consolidation until the tested material is able to sustain the applied pressure [30 31] 228
It refers to the material ability to slow down the water filtration process 229
The measurement of the flow water allows to compute instantaneous WB ratio and makes it 230
possible to link it with the computed instantaneous permeability at a given time of the test [32ndash231
9
34] I The water flow is computed by dividing the variation of the measured water mass flowing 232
out the samples by the elapsed time between two successive data sampling In this study value 233
of permeability at 1 and 30 minutes are taken and compared It corresponds to the initial and 234
final permeability of the mixes 235
The material compressibility is considered in a soils mechanics way [30 35] It corresponds to 236
the ratio of the variation of void ratio (liquidsolid volume ratio) to the variation of logarithm 237
of applied pressure between the initial and the final state of the induced bleeding test It 238
provides the equilibrium state of the sample under a given applied pressure and is valid for 239
both homogeneous and heterogeneous bleeding [36] 240
It is worth noting that the computed permeability describes homogeneous bleeding kinetics 241
while compressibility describes the amplitude of the bleeding phenomenon 242
Heat of hydration was evaluated by isothermal calorimetry with an eight-channel heat 243
conduction calorimeter maintained at 22degC This equipment measures heat evolved by 244
comparing the temperatures of a grout sample and an inert reference which are both held under 245
isothermal conditions The heat flow results are recorded as a function of time CEM I GGBS 246
and ANH were blended manually for 30 s After the addition of water the grout was blended 247
10 s by hand and then an additional 50 s mechanically Polyethylene ampoules were filled with 248
approximately 6 g of each grout and the experiments were conducted for at least 72 h 249
The compressive strength of the grout was determined by crushing three cubes of 50 mm size 250
After casting the samples were covered with a polymer sheet (a cling film) to limit evaporation 251
of water and stored in a conditioning room at 20 plusmn 2 degC for 24 plusmn 05 hours Afterwards cubes 252
were demoulded and placed in water at 20 plusmn 1 degC until tested at 1 3 7 and 28days 253
In order to perform the pH test a powder sample of the hardened mixes was required The test 254
was performed on 1 7 and 28 day samples As mixes 9-12 are of identical composition the 255
reason is explained later in 41 derived statistical model tests were only performed on sample 256
10 To get the powder with a fineness of 65μm the samples were firstly drained of the acetone 257
To remove any remaining acetone they were placed in a vacuum desiccator The pieces were 258
then ground using a mortar and pestle passed through a 65 μm sieve placed in sample bags 259
and returned to the desiccator The samples had then to be mixed with distilled water to enable 260
the pH test to be performed A 110 ratio of cement to water was used and mixed for 24 hours 261
using a rotating machine To get the pH reading the samples were put into a centrifuge machine 262
to separate the solid and liquid At this stage the solution should have a pH equivalent to cement 263
10
it was mixed with To get a pH reading for the samples a pH device was used where a probe 264
is placed in the solution The machine was calibrated with three buffer solutions of 7 10 and 265
13 pH levels before measuring the pH of the samples 266
SEM (scanning electron microscopy) was carried out using a JEOL JSM6400 on flat fractured 267
surface specimens obtained from compression testing at 7-day samples Prior to SEM testing 268
the samples were mounted onto metal stubs using carbon paste and coated with gold film to 269
ensure good conductivity The accelerated voltage was set at 20 kV 270
22 Statistical Design and Modelling of Experiments 271
The technique of analysis used in this study was a 2k factorial experimental design [37] to 272
evaluate the influence of two different levels (maximum and minimum) for each variable on 273
the relevant grout properties Three key parameters (WB ANH GGBS) that should have 274
significant influence on mix characteristics of supersulfated cements were selected to formulate 275
the mathematical models for evaluating relevant properties (ie k = 3 in this study thus the 276
total mixes for the factorial design was 23 = 8) Additionally a mix at the central point was 277
replicated four times to estimate the experimental error and improve the reliability of the 278
models The coding and levels of the variables (WB and dosages of GGBS and ANH) are 279
given Table 2 280
The statistical models are valid for supersulfated grout (SSC) mixes made with WB GGBS 281
and ANH in the ranges of 034 to 044 60 to 80 and 0 to 20 respectively The modelled 282
experimental region consisted of mixtures ranging from coded variables of ndash1 to +1 The coded 283
factors for variables were calculated by 284
Coded Factor = (Actual value-Factor means)[Range of factor value2] (2) 285
Hence 286
Coded WB = (Actual WB ndash 039)005 287
Coded GGBS = (Actual GGBS ndash 07)01 288
Coded Anhydrite = (Actual ANH ndash 01)01 289
The responses modelled were mini-slump plate cohesion Marsh cone yield stress plastic 290
viscosity induced bleeding at 1 min 5 and 30 mins permeability at 1 min and 30 mins 291
compressibility and compressive strength at 1 3 7 and 28 days The general model associated 292
11
with the two-level factorial design incorporating three independent variables (WB GGBS 293
ANH) is expressed by 294
Y1 = a0 + a1WB + a2GGBS + a3ANH+ a4WBGGBS + a5WBANH + a6GGBSANH 295
+ a7WBGGBSANH + ε (3) 296
where 297
Y1 Response (mini slump marsh cone plate cohesion etc) 298
a0 Overall mean factor effect 299
a1-a7 Regression coefficients representing model constants (contribution of independent 300
variables and their interaction to each response) 301
a1WB a2GGBS a3ANH Linear effect of factors WB GGBS and ANH 302
a4WBGGBS a5WBANH a6GGBSANH a7WBGGBSANH Interaction effects of 303
factors WB GGBS and ANH 304
ε Random error term representing the effects of uncontrolled variables 305
Analysis of variance (ANOVA) was used to test the significance of regression models and t-306
tests were performed to identify the non-significant (NS) variables and second order 307
interactions which were subsequently eliminated from the derived models Model coefficients 308
were determined using multi-linear regression analysis based on a normal distribution 309
assumption The error was assumed to be random and normally distributed so the residual 310
terms which represent the difference between the actual and predicted values should exhibit 311
similar properties [37] The probability value (Prob) obtained from ANOVA determines the 312
statistical significance of each factor and their interactions For most of the parameters the 313
probability that the derived coefficients associated with the various variables influencing each 314
response were limited to 10 This signifies that there is less than 10 chance or 90 315
confidence limit that the contribution of a given parameter to the tested response exceeds the 316
value of the specified coefficient A negative estimate indicates that an increase of the given 317
parameter results in a reduction of the measured response 318
12
3 Results and discussion 319
The results of the experimental work characterize the behaviour of the mortars with different 320
WB ANH and GGBS levels Table 3 summarises all results of the experimental work 321
performed The results were used to construct the regression models 322
Table 3 Average results from experimental work 323 324
Viscometer Induced bleeding
Mix Mini-
slump
Flow
time
Cohesion
meter
Yield
value
Plastic
viscosity
1min 5min 30min
(mm) (s) (mm) (Pa) (Pas) (mL) (mL) (mL)
1 61 230 105 191 0923 220 470 480
2 89 25 55 97 0323 290 780 810
3 67 200 118 172 0802 280 580 605
4 111 12 20 80 0199 490 860 860
5 52 360 143 251 1203 280 520 540
6 83 69 86 99 0403 360 700 700
7 60 250 125 211 0980 310 580 590
8 110 13 40 77 0224 350 910 950
9 71 150 87 101 0617 370 720 730
10 73 102 122 106 0681 290 620 620
11
12
77
74
192
83
89
110
124
101
0660
0641
290
350
640
715
645
720
325
Table 3 Average results from experimental work (continued) 326
Mix Permeability Permeability Compre-
ssibility
Compressive strength
1 min 30 min fc 1d fc 3d fc 7d fc 28d
(ms) (ms) (MPa) (MPa) (MPa) (MPa)
1 216E-09 317E-09 0155 299 506 581 704
2 512E-08 418E-09 0298 168 383 547 558
3 448E-08 366E-09 0194 213 334 406 527
4 374E-08 425E-09 0312 140 223 256 408
5 448E-08 342E-09 0173 233 434 507 535
6 512E-08 395E-09 0255 136 371 371 448
7 440E-08 361E-09 0187 108 232 343 532
8 451E-08 433E-09 0342 68 200 263 473
9 446E-08 402E-09 0250 196 328 398 592
10 468E-08 371E-09 0212 171 232 361 556
11
12
423E-08
516E-08
379E-09
400E-09
0221
0246
207
183
313
301
451
435
565
520
327
The derived quadratic statistical models of grout for mini-slump flow time cohesion plate 328
yield stress plastic viscosity induced bleeding at 1 min 5 min and 30 min permeability at 1 329
13
min and 30 min compressibility and compressive strength at 1 3 7 and 28 days are given in 330
Equations (4) to (18) where WB GGBS and ANH are given in codes values 331
Mini-Slump (mm) = 7881 + 1919 WB + 781 ANH + 444 WBANH - 294 GGBS (4) 332
333
Marsh flow time (s) = 1404 - 1153 WB ndash 261 ANH + 281 GGBS (5) 334
335
Plate Cohesion meter (microm) = 86 - 366 WB + 122 GGBS - 107 ANH - 091 WBANH (6) 336
337
Yield Value (Pa) = 1466 ndash 584 WB - 126 WBGGBS - 125 ANH + 124 GGBS (7) 338
339
Plastic Viscosity (Pas) = 063 - 034 WB - 0078 ANH + 0073 GGBS 340
- 0047 WBGGBS - 0022 ANHGGBS (8) 341
342
Induced Bleeding at 1 min (ml) = 3225 + 50 WB + 35 ANH ndash 225 WBANHGGBS (9) 343
344
Induced Bleeding at 5 mins (ml) = 675 + 1375 WB + 575 ANH (10) 345
346
Induced Bleeding at 30 mins (ml) = 6919 + 1381 WB + 594 ANH (11) 347
348
Permeability at 1 min (ms) x 10-8 = 4 + 0615 WB + 0621 AHN ndash 0773 WBGGBS 349
- 0426WBAHN - 0446 AHNGGBS (12) 350
351
Permeability at 30 min (ms) x 10-8 = 0382 + 0035 WB + 0014 ANH 352
+ 0008 WBANHGGBS (13) 353
354
Compressibility = 02396 + 00623 WB + 00194 ANH + 00012 WBANHGGBS (14) 355
356
ƒc 1 d (MPa) = 1705 - 426 WB - 384 ANH - 343 GGBS + 145 WBANH (15) 357
358
ƒc 3 d (MPa) = 3215 - 879 ANH - 412 WB ndash 261 GGBS (16) 359
360
ƒc 7 d (MPa) = 4092ndash 924 ANH - 5 WB - 383 GGBS (17) 361
362
14
ƒc 28 d (MPa) = 5348 - 515 WB - 382 ANH ndash 262 GGBS + 436 ANHGGBS (18) 363
364
The correlation coefficient of most of the proposed models were higher than 090 except for 365
plastic viscosity compressive strength after 3days and compressive strength after 28days 366
which have coefficients of 070 086 and 087 respectively 367
Table 4 shows the average measured responses of the four replicate grouts the coefficients of 368
variation (COV) as well as the estimated errors with a 90 confidence limit for each of the 369
measured properties The estimated error levels for mini-slump plate cohesion meter Marsh 370
cone yield stress plastic viscosity induced bleeding at 1 min 5 min and 30 mins permeability 371
at 1 min and 30 min compressibility and compressive strengths at 1 3 7 28 days were plusmn 22 372
mm plusmn 0001mm plusmn 40 s plusmn 09 Pa plusmn 002 Pa s plusmn 28 ml plusmn 42 ml plusmn 45 ml plusmn 32x10-9 (ms) 373
plusmn 13x10-10 (ms) plusmn 00153 plusmn 13 MPa plusmn 35 MPa plusmn 33 MPa and plusmn 25 MPa respectively 374
The relative experimental errors for mini-slump plate cohesion meter Marsh cone yiled stress 375
plastic viscosity induced bleeding permeability compressibility compressive strengths were 376
limited to 3-11 On the other hand relative error for march cone was up to 30 377
Table 4 Repeatability of test parameters at the central point 378
379
Tests Mini-
slump
Plate
cohesion
Marsh
cone
Yield
stress
Plastic
viscosit
y
Induced
bleeding
at 1 min
Induced
bleedin
g at 5
min
Induced
bleeding
at 30
min
Mean (n=4) 736
mm
001
mm
1318
s
108
Pa
065
Pa s
325
ml
674
ml
679
ml
Coefficient
of variation
()
37 115 372 105 42 127 76 80
Estimate
error (90
confidence
limit)
22
mm
0001
mm
402
s
09
Pa
002
Pa s
28
ml
42
ml
45
ml
380
381 Table 4 Repeatability of test parameters at the central point (continued) 382
383
Tests
Permeability
1 min
x10-8
Permeability
30 min
x10-8
Compressibility frsquoc 1d frsquoc 3d frsquoc 7d frsquoc 28d
Mean (n=4) 463
ms
0388
ms 02323
189
MPa
293
MPa
411
MPa
558
MPa
Coefficient
of variation
()
85 39 8 84 144 98 53
15
Estimate
error (90
confidence
limit)
032
(ms)
0013
(ms)
00153
13
MPa
35
MPa
33
MPa
24
MPa
384
385
31 Accuracy of the established models 386
387
The ratio of predicted-to-measured properties for grout ranged between 087 and 115 388
indicating good accuracy for prediction of mini-slump plate cohesion induced bleeding at 1 389
min 5 mins and 30 mins yield stress plastic viscosity and compressive strength at 1-d 3-d 7-390
d and 28-d In general the proposed models for mini-slump plate cohesion Marsh cone and 391
compressive strength appeared to be accurate in predicting fluidity cohesivity induced 392
bleeding permeability at 30 min compressibility and compressive strength with low scatter 393
between measured and predicted values However the average values of predictedmeasured 394
ratio of yield values were slightly higher (074) 395
396
32 Isoresponses of the proposed models 397
398
The isoresponse surfaces and contour plots for mini-slump plate cohesion Marsh cone yield 399
stress plastic viscosity induced bleeding at 1 min 5 mins and 30 mins permeability at 1 min 400
and 30 mins compressibility and compressive strength at 1-d 3-d 7-d and 28-d were obtained 401
by using response surface methodology (RSM) The isoresponse surfaces and contour plots 402
were obtained from the regression models and because the models contained interaction and 403
second-order variables the contour lines were curved 404
The proposed statistical models can therefore be used to evaluate the effect of a group of 405
variables on the properties affecting the quality of supersulfated grout This allowed for the 406
calculation of isoresponse surfaces from the parameters under study outside the experimental 407
domain and the optimisation of their effects The next sections will discuss the results of each 408
experiment separately 409
331 Mini-slump 410
As shown in Eq 4 the mini-slump is influenced in order of significance by WB ratio 411
anhydrite proportion interaction of WB and ANH and the percentage of GGBS content The 412
WB ratio had the greatest effect on fluidity due to better lubrication of the particles in the paste 413
16
[29] The mini-slump test was accompanied by very low shear The value of mini-slump is to 414
characterise yield stress [38] therefore higher mini-slump value indicated a lower yield stress 415
The effect of WB on the increase of mini-slump was two and half-time than that of ANH (192 416
vs 781 in Eq 4) However increased ANH resulted in a 27 times greater increase in mini-417
slump than reduced GGBS (781 vs -294 in Eq 4) Figure 1(a) shows the effect of increased 418
WB on mini-slump vs ANH (when GGBS was kept constant at 70) and Figure 1(b) shows 419
GGBS vs ANH (when WB was fixed at 039) Based on these figures it is evident that mini-420
slump increased significantly when the dosage of WB and ANH increased 421
422
(a) (b) 423
Fig 1 Isoresponse curves of mini-slump (mm) (a) WB vs ANH and (b) GGBS vs ANH 424
425
332 Marsh cone 426
The time needed for a grout sample to flow through the Marsh cone is proportional to the 427
viscosity of the cement grout the flow time becomes an index of fluidity so the longer the 428
flow time the lower the fluidity Similar to the previous trends Eq 5 shows that the values of 429
Marsh cone are influenced in order of significance by WB GGBS and ANH This is 430
graphically illustrated in Figure 2 431
GGBS = 70
034 039 042 044
0
5
10
15
20
WB
AN
H (
)
65
74
83
92
101
037
AN
H(
)
WB = 039
60 65 70 75 80
0
5
10
15
20
GGBS()
70
75
80
85
17
432
(a) (b) 433
Fig 2 Isoresponse curves for flow time (s) (a) WB vs ANH and (b) GGBS vs ANH 434
435
It can be noted that an increase in WB and ANH or a reduction in GGBS led to decreasing 436
the Marsh cone flow time For example at fixed WB at 039 and GGBS of 70 respectively 437
the increase in ANH dosage from 5 to 20 led to a marked reduction of the Marsh cone flow 438
time from 170 to 140 s (Figure 2(a)) This behaviour is attributed to the change in plastic 439
viscosity of the grout as will be discussed later 440
333 Cohesion plate 441
As shown in Eq 6 the cohesion plate was influenced in order of magnitude by the WB and 442
the percentage of GGBS and ANH The increasing WB had a 34 times the influence on the 443
reduction of the cohesion plate test results as the increased ANH (for a GGBS constant) By 444
comparing the effects of WB and GGBS on plate cohesion the increased WB can be 445
interpreted as having approximately a 3 times greater influence on the reduction of plate 446
cohesion values than the increase in GGBS (-366 vs 122 in Eq 6) given that ANH is held 447
constant The effect of an increase in WB from 034 to 044 and ANH from 0 to 20 with a 448
fixed GGBS dosage of 70 is presented in Figure 3(a) Increased WB led to a decreased 449
cohesion plate value Conversely an increase in GGBS increased the cohesion plate value and 450
an increased ANH caused a reduction in cohesion plate (Figure 3(b)) 451
GGBS = 70
034 036 039 042 0440
5
10
15
20
WB
AN
H (
)
40
6080
100120
140160
180200
220
WB = 039
60 65 70 75 80
0
5
10
15
20
GGBS ()
AN
H (
)
100
120
140
160
180
18
452
(a) (b) 453
Fig 3 Isoresponse curves for plate cohesion meter (a) WB vs ANH and (b) GGBS vs 454 ANH 455
334 Yield stress 456
As shown in Eq 7 yield value was influenced in order of magnitude by WB and dosages of 457
ANH and GGBS Based on Figure 4 (a) when WB was fixed at 039 GGBS maintained at 458
70 and ANH increased to 5 the isoresponse curve showed a yield value of 15 Pa On the 459
other hand if the proportion of ANH was further increased to 20 while GBBS was 460
maintained at 70 the yield value decreased to 135 Pa This corresponds with Eq (7) in 461
which the proportion of WB and ANH were increased while GGBS was kept constant 462
resulting in a reduction in yield stress An increase in GGBS content resulted in an increase of 463
the yield stress 464
Figure 4 (b) shows the isoresponse curve of the yield value with a fixed proportion of GGBS 465
at 70 When WB was 039 and ANH was 5 the isoresponse of the predicted yield value 466
was 155 Pa If ANH was increased to 20 while maintaining WB at 039 the isoresponse of 467
the yield value was 135 Pa 468
It can be interesting to note that the observed results for the yield stress are closed to the one 469
observed with the cohesion plate and mini-slump tests This is expected as yield stress values 470
can be derived from those two simple tests 471
GGBS = 70
034 037 039 042 0440
5
10
15
20
WB
AN
H(
)
45
55
65
7585
95
105
115
WB = 039
60 65 70 75 800
5
10
15
20
GGBS ()
AN
H(
)
75
85
95
105
19
472
(a) (b) 473
Fig 4 Isoresponse curves for yield stress (Pa) (a) WB vs ANH and (b) GGBS vs ANH 474
335 Plastic viscosity 475
Plastic viscosity was influenced in order of magnitude by WB and the dosages of ANH and 476
GGBS ANH and GGBS had almost opposite effects on plastic viscosity (-0078 vs 0073 in 477
Eq 8) As shown in Eq (8) increased WB had the greatest primary effect on plastic viscosity 478
(034 vs 0078 and 0073) The increased WB had approximately a 44 times greater influence 479
on reducing plastic viscosity than increased ANH or decreased GGBS 480
In the isoresponse curve of plastic viscosity shown in Figure 5 (a) when GGBS was fixed at 481
70 WB set at 039 and ANH maintained at 5 the predicted plastic viscosity value was 482
068 Pas On the other hand if the dosage of ANHB was increased to 20 while maintaining 483
a similar WB the plastic viscosity was reduced to 055 Pas 484
In Figure 5 (b) WB was fixed at 039 when GGBS was held at 70 and ANH at 5 the 485
predicted plastic viscosity was 067 Pas However when ANH was increased to 20 and 486
GGBS was maintained at 70 the predicted plastic viscosity dropped to 055 Pas 487
AN
H(
)
GGBS = 70
034 037 039 042 044
0
5
10
15
20
WB
1012
1416
18
20
WB = 039
60 65 70 75 800
5
10
15
20
GGBS ()
AN
H(
)
13
14
15
20
488
(a) (b) 489
Fig 5 Isoresponse curve for plastic viscosity (Pas) (a) WB vs ANH and (b) GGBS vs 490
ANH 491
336 Induced bleeding 492
The induced bleeding equations for 1 and 5 minutes (Eqs 9 10) and 30 minutes (Eq 11) are 493
very similar The two influencing factors of induced bleeding are WB ratio and anhydrite 494
WB ratio has the greatest effect over two times the effect of anhydrite content Figure 6 shows 495
the isoresponse for bleeding versus the WB ratio for a fixed value of GGBS at 70 It can be 496
seen that when an anhydrite value is selected and the WB ratio is increased the bleeding will 497
also increase Similarly if a WB ratio is selected and the anhydrite content is increased the 498
bleeding will again increase 499
500
GGBS = 70
034 037 039 042 0440
5
10
15
20
WB
AN
H(
)
035
045
055
065
075
085
095
WB = 039
60 65 70 75 800
5
10
15
20
GGBS ()
AN
H(
)
055
060
065
075
034 036 039 042 044
0
5
10
15
20
WB
AN
H (
)
26
28
30
3234
36
38
40
GGBS=70
21
(a) 501
502
(b) (c) 503
Fig 6 Isoresponse curves for induced bleeding at 1 5 and 30 min WB vs ANH 504
337 Permeability 505
Figure 7 (a) and (b) showed firstly that the permeability decreased significantly from 1 min to 506
30 min Permeability at 1 min was influenced in order of magnitude by WB and the dosage 507
of ANH All interactions between 3 parameters had almost opposite effects on permeability 508
(Eq 12) As shown in Eq (12) increased WB and AHN had the greatest primary effect on 509
permeability at 1 min It seems there is an optimum reached at WB = 40 and AHN at 17 510
Similarly the permeability at 30 min is affected in order of significance by WB followed by 511
ANH (Eq 13) In Figure 7 (b) WB was fixed at 039 when GGBS was held at 70 and ANH 512
at 10 the predicted permeability was 038 x 10-8 (ms) However when ANH was increased 513
to 20 and GGBS was maintained at 70 the predicted permeability increased to 040x10-8 514
(ms) 515
516
GGBS = 70
034 036 039 042 0440
5
10
15
20
WB
AN
H (
)
545
61
675
74
805
GGBS = 70
034 036 039 042 0440
5
10
15
20
WB
AN
H (
)
56
60
64
68
72
7680
84
22
517
(a) (b) 518
Fig 7 Isoresponse curves for permeability at 1 and 30 min WB vs ANH 519
338 Compressibility 520
As shown in Eq (14) the compressibility was influenced in order of magnitude by the WB 521
and the percentage of ANH The interaction between 3 parameters affected also the 522
compressibility The increasing WB had a 32 times the influence on the increase of the 523
compressibility results as the increased ANH (for a GGBS constant) The effect of an increase 524
in WB from 034 to 044 and ANH from 0 to 20 with a fixed GGBS dosage of 70 is 525
presented in Figure 8 Increased WB led to an increase of compressibility Similarly an 526
increase in AHN increased the compressibility 527
528
Fig 8 Isoresponse curves for compressibility WB vs ANH 529
034 036 039 042 044
0
5
10
15
20
GGBS = 70 WB
AN
H (
)
3
35
4
4
45
5
034 036 039 042 044
0
5
10
15
20
WB
AN
H (
)
034
035
036 037 038 039 04
041
042
4
GGBS=70
034 036 039 042 044
0
5
10
15
20
WB
AN
H (
)
017
019
021 023 025 027
029
031
GGBS=70
23
530
339 Compressive strength 531
After one day from Eq 15 the influencing factors in order of significance are WB ratio 532
anhydrite content GGBS content and the interaction of WB and ANH The effect of the first 533
three was similar but WB had 11 times greater effect than anhydrite and 125 times greater 534
effect than GGBS While the interaction of WB and anhydrite had around a third of the 535
influence of WB Figures 9 (a) and (b) show the isoresponses for 1-day compressive strength 536
From Figure 9 (a) it can be seen when the GGBS content is fixed at 70 for a given anhydrite 537
content increasing the WB ratio will decrease the strength Also if a WB ratio is selected and 538
the anhydrite is increased similarly the strength will decrease From Figure 9 (b) with the WB 539
ratio fixed at 039 once again an increase in GGBS led to a reduction of compressive strength 540
at 1 day 541
542
(a) (b) 543
Fig9 Isoresponse curves for compressive strength at 1d (a) (WB vs ANH) and (b) (GGBS 544 vs ANH) 545
Eqs 16 17 and 18 show the effect of GGBS and ANH percentages on compressive strength at 546
3-d 7-d and 28-d Figures 10 11 and 12 show the isoresponse of the compressive strength at 547
3-d 7-d and 28-d respectively with WB vs ANH Increased ANH led to a decrease of 3-d 548
and 7-d compressive strength As expected an Increase in WB led to a decrease in compressive 549
strength The percentage of ANH had a negative effect on compressive strength and showed a 550
greater influence particularly at 3-d and 7-d (879 (3 d) amp 924 (7d) vs 382 (28 d)) GGBS has 551
a negative impact on early strength development The negative effect of GGBS on compressive 552
GGBS = 70
034 037 039 042 0440
5
10
15
20
WB
AN
H(
)
12
14
16
18
20
22
2426
WB = 039
60 65 70 75 800
5
10
15
20
GGBS ()
AN
H(
)
10
12
14
16
18
20
22
24
strength at early ages is clearly attributable to the fact that up to 80 of cement has been 553
replaced by GGBS and it takes some time for GGBS to start developing its pozzolanic action 554
at a noticeable level The results indicate that ANH content influences strength to a greater 555
extent than GGBS at all ages The SO3 content was reported to have great influence on the 556
strength [39 40] 557
558
(a) (b) 559
Fig10 Isoresponse curves for compressive strength at 3d (a) (WB vs ANH) and (b) 560 (GGBS vs ANH) 561
562
563
(a) (b) 564
Fig11 Isoresponse curves for compressive strength at 7d (a) (WB vs ANH) and (b) (WB 565 vs ANH) 566
567
GGBS = 70
034 036 039 042 0440
5
10
15
20
WB
AN
H (
)
24
2628
30
3234
3638
4042
WB = 039
60 65 70 75 80
0
5
10
15
20
GGBS ()
AN
H (
)
2426
2830
32
34
36
3840
42
GGBS = 70
034 037 039 042 044
0
5
10
15
20
WB
AN
H(
)
3032
34
3638
40
42
44
46
48
WB = 039
60 65 70 75 80
0
5
10
15
20
GGBS ()
AN
H(
)
32
34
36
38
40
42
44
46
48
25
568
(a) (b) 569
Fig12 Isoresponse curves for compressive strength at 28d (a) (WB vs ANH) and (b) 570
(ANH vs GGBS) 571
3310 Discussion of the effect of WB GGBS and ANH 572
As expected the increase of WB led to an increase in mini-slump induced bleeding and a 573
reduction in flow time plate cohesion yield stress plastic viscosity and compressive strengths 574
This can be attributed to more water in the system 575
An increase in GGBS content resulted in a reduction of the flow time plate cohesion yield 576
stress and plastic viscosity while the fluidity is improved This was due to the fact the specific 577
gravity of slag is lower than that of PC leading to an increase in the paste volume and thus 578
improving the fluidity of paste 579
In case of an increase of ANH proportion while WB and GGBS were kept constant it led to 580
an increased mini-slump and induced bleeding while the flow time plate cohesion yield stress 581
and plastic viscosity were reduced This was due to the lower reactivity of ANH resulting in an 582
increase of water needed for lubrication of paste 583
As expected an increase in WB lead to an increase in induced bleeding permeability and a 584
decrease in compressibility [33 35] This is due to the increase in liquid volume between the 585
particles and to the reduction in the amount of interparticle forces Globally the compressibility 586
decreases and the permeability increases with ANH It can be explained by the reduced specific 587
area and lower reactivity that can lead to more available water in the samples 588
3311 Heat of Hydration 589
Heat of hydration is considered an important factor in the cement design as low heat of 590
hydration reduces the effect of thermal cracking The heat flow results of the calorimeter test 591
performed over a three days period can be seen in Figure 13 592
GGBS = 70
034 036 039 042 0440
5
10
15
20
WB
AN
H (
)
46
48
50
52
54
56
58
60
WB = 039
0 5 10 15 2060
65
70
75
80
ANH ()
GG
BS
(
)
50
52
54
56
5860
62
26
593
Fig 13 Heat flow graphs for first 3 days of reaction 594
Figure 13 presents that the largest peaks were in mixes 1 2 5 and 6 This shows that these 595
reactions generated the most heat and that they were quick Mixes 1 and 2 have the highest 596
OPC content at 40 and this suggests that to lower the heat of the reaction minimal OPC 597
should be used This is confirmed by the fact that mixes 5 and 6 have the next highest OPC 598
contents the same percentage as mixes 3 4 and 9 (one of the repeated mixes) which have 599
anhydrite present This implies that the presence of anhydrite will lengthen the reaction process 600
and reduce the heat produced during setting significantly The graph shows this by the absence 601
of a sharp peak instead a gentle curved hump is shown over a 2-day period whereas the mixes 602
showing a sharp peak occur after about 12 hrs Mix 7 which has the same solids content as 603
mix 8 but a lower WB ratio and no cement present showed the lowest heat flow during the 604
hydration process 605
Figure 14 shows the cumulative heat generation during the first 3 days of setting It is clear that 606
the two mixes (1 and 2) with highest cement content and absence of anhydrite had the highest 607
cumulative heat development over the 3-day period 643J and 594J respectively Mixes 3456 608
and 9 which all have 20 OPC content generated similar heat value over the 3 days Results 609
of mixes containing ANH implies that over the period that the anhydrite did not reduce the 610
cumulative heat generated but slowed the reaction and reduce the peak heat generated The 611
0
0002
0004
0006
0008
001
0012
0 50000 100000 150000 200000 250000 300000
He
at F
low
(mW
)
Time s()
M1
M2
M3
M4
M5
M6
M7
M9
1Day
2Day
3day
1d 2d 3d
27
graphs also suggest that a higher WB ratio produced a lower cumulative and peak heat 612
generation613
614
Fig 14 Cumulative heat generation curves for first 3 days 615
3312 pH measurements 616
Fig 15 summarises the results of pH and the nine mixes with different compositions of WB 617
the percentages of cement GGBS and ANH It is shown that Supersulfated cements (SSCs) 618
have lower pH values (lt 125 at all ages) than PC which has a pH of 139 [41] making SSC 619
more preferable in essential applications such as nuclear waste encapsulation 620
The figure shows that the pH value decreased with time for all samples between 1 and 7 days 621
Similar trend was observed in the majority of mixes between 7 and 28 days except for sample 622
2 5 and 9 which showed slight increase in the pH values This decrease refers to the 623
consumption of ions in the pore structure due to the hydration process 624
0
100
200
300
400
500
600
700
800
0 50000 100000 150000 200000 250000 300000
(J)
Time (s)
M1
M2
M3
M4
M5
M6
M7
M9
1 Day
3 Day
2 day
1d 2d 3d
1
2
3
9
45
6
7
28
625
626 Fig 15 Summary of pore solution pH 627
628
The incorporation of ANH replacing the Portland cement (C) results in remarkable decrease in 629
pH at all ages as introducing the ANH reduced the lower initial pH Likewise the increase in 630
the content of GGBS led to a decrease in the pH value of the pore structure as GGBS has lower 631
initial pH than Portland cement The increase of WB ratio decreased the pH value This is in 632
agreement with Collier [41] who found that increasing the wb ratio from 05 to 06 increased 633
the pH by I unit This was attributed to the increased availability of water in the case of WB 634
of 06 allowing hydration of more cement powder thereby releasing more hydroxide anions 635
into solution However in this study the WB ratio did not show a significant effect on 636
lowering the pH These results are in agreement with [42] which also found that decreasing the 637
pH improved the bulk resistivity of SSC mixtures 638
3313 SEM 639
Figure 16 shows the SEM images of some mixes at various magnifications The images clearly 640
show the dense and compact structure of the cement after seven days The dense structure was 641
another requirement from the cement chosen to enclose the waste to prevent leaching The 642
microstructure consists mainly of C-S-H the main hydration product and unhydrated slag 643
grains C-S-H is formed after the dissolution of slag grains when contacting the water and 644
alkalis and then the ionic species saturate the solution and then precipitate as hydrated phases 645
[8] There were abundant grains of hydrated and partially hydrated slag grains some small 646
1080
1100
1120
1140
1160
1180
1200
1220
1240
1260
1280
1 2 3 4 5 6 7 8 9
pH
val
ue
Mix Number
1 Day
7 Days
28 Days
29
GGBS particles presented rims of reaction products (eg Mix 6-Figure 16 (f) and Mix 9-Figure 647
16 (h)) It was found by [11] that the composition of the reaction rims around slag was similar 648
to that of the C-S-H from PC However [12] found that in the CndashSndashH of SSC is apparently 649
more foil like which is different than the fibrillar morphology of C-S-H in OPC Mix 3 and 650
Mix 4 (Figure 16 (c) and (d) respectively) exhibits more micro voids in the micrsostructure 651
which could explain the low strength of these mixes compared to mix 1 and 2 Ettringite was 652
not detected Ettringite is not the most abundant phase and it is not easy to detect in dried 653
polished samples because it is easily decomposed under the drying conditions of the vacuum 654
of the microscope column [11] 655
(a) Mix 1 image at 1100 magnification (b) Mix 2 image at 900 magnification
(c) Particle of unreacted slag mix3 7 days (d) An overall image of mix 4 at 7days
showing CSH and BFS particles
30
(e) Mix 5 image at 1100 magnification (f) Mix 6 image at 2300 magnification
(g) Mix 7 image at 2000 magnification (h) Mix 9 image at 2700 magnification
Fig 16 SEM results 656
4 Conclusions 657
The paper focused on optimizing the SSC cement grout in order to get the best of it The effect 658
of GGBS WB and ANH dosages on the grout fluidity rheological properties induced 659
bleeding maximum heat of hydration and compressive strength was investigated using 660
factorial design approach and analysis The models derived in this study are valid for the 661
experimental area corresponding to grout mixes made with variable levels of WB ANH and 662
GGBS in the ranges of 034 to 044 0 to 20 by mass of binder 60 to 80 by mass of 663
binder respectively Based on the results from this study the following conclusions are drawn 664
- In comparison to GGBS and ANH WB ratio had more pronounced effects on the 665
results of mini-slump plate cohesion meter Marsh cone time yield stress plastic viscosity 666
induced bleeding permeability compressibility and compressive strength 667
31
- The increase in the dosage of GGBS led to an increase in the values of plate cohesion 668
meter Marsh cone time yield stress and plastic viscosity while reducing the mini-slump 669
values maximum hydration and compressive strength This is ascribed to the fine nature 670
of GGBS particles and pozzolanic effect 671
- While the ANH particles caused a decrease in the maximum of heat of hydration it 672
increased the induced bleeding permeability and compressibility due to its dominant effect 673
on increasing the dormant period and increasing the rates of solid sedimentation and 674
induced bleeding water 675
- Increasing the dosage of ANH in grout reduced the hydrations kinetic at early-age and 676
thus reduced the compressive strength at 1d 3d and 7d However this effect diminished 677
at later ages at 28 d in a manner similar to increasing WB 678
- The increase in the dosage of ANH led to an increase in the mini-slump values 679
(fluidity) but a decrease in the values of yield stress plastic viscosity plate cohesion and 680
Marsh cone time This is attributed to better deflocculation of particles at the fresh state 681
- The increase of GGBS percentage delayed the reaction process and decreased the total 682
heat after 3 days while WB slightly reduced the total heat it didnrsquot significantly affect the 683
reaction process 684
- pH measurements in the present study confirmed the suitability of these mixture to low-685
pH applications as the increase in both the GGBS and ANH markedly decreased the initial 686
pH thereby lowering the pH at different ages 687
- The modelling and prediction of the response of other points in the experimental domain 688
were therefore possible Although the models are based on a given set of materials they 689
can be easily used to generate future results using other materials 690
- Dense microstructure was observed for mixes examined in this study C-S-H is the main 691
reaction product with presence of unreacted slag grains embedded well in the structure 692
However some micro voids were observed in mixes containing ANH which led to lower 693
compressive strength of mixes with ANH 694
CRediT authorship contribution statement 695
MSonebi and YBai did the conceptualization and the design of investigation as well as 696 performing the experiments MSonebi carried out the software analysis of the results and the 697
32
visualization MSonebi AAbdalqader T Fayyad and APerrot analysed the results and 698 wrote the original draft and reviewed and edited the final version 699
Declaration of Competing Interest 700
The authors declare that they have no known competing financial interests or personal 701 relationships that could have appeared to influence the work reported in this paper 702
Acknowledgments 703
The authors would like to express their gratitude to P McCann from QUB and N Collier 704 from Eden Nuclear and Environment Ltd for their helps for some experiments 705
706
References 707
1 Schneider M Romer M Tschudin M Bolio H (2011) Sustainable cement production-708 present and future Cement and Concrete Research 41642ndash650 709
httpsdoiorg101016jcemconres201103019 710
2 Madlool NA Saidur R Hossain MS Rahim NA (2011) A critical review on energy use 711 and savings in the cement industries Renewable and Sustainable Energy Reviews 712
152042ndash2060 httpsdoiorg101016jrser201101005 713
3 EN15743 (2015) BS EN 157432010+A12015 Supersulfated cement - Composition 714
specifications and conformity criteria BSI 715
4 Khatib JM Wright L Mangat PS (2016) Mechanical and physical properties of concrete 716
containing FGD waste Magazine of Concrete Research 68550ndash560 717 httpsdoiorg101680macr1500092 718
5 Khatib JM Mangat PS Wright L (2008) Sulfate resistance of mortar containing 719
simulated FGD waste Proceedings of Institution of Civil Engineers Construction 720 Materials 161119ndash128 httpsdoiorg101680coma20081613119 721
6 (2020) Specifying Sustainable Concrete 722
7 Hewlett PC (2004) Learsquos Chemistry of Cement and Concrete fourth edi Elsevier 723 Science amp Technology Books Oxford 724
8 Gruskovnjak A Lothenbach B Winnefeld F et al (2008) Hydration mechanisms of 725 super sulphated slag cement Cement and Concrete Research 38983ndash992 726
httpsdoiorg101016jcemconres200803004 727
9 Grounds T Nowell D V Wilburn FW (2003) Resistance of supersulfated cement to 728 strong sulfate solutions Journal of Thermal Analysis and Calorimetry 72181ndash190 729
httpsdoiorg101023A1023928021602 730
10 Grounds T Nowell D V Wilburn FW (1995) The influence of temperature and 731
different storage conditions on the stability of supersulphated cement Journal of 732 Thermal Analysis 45385ndash394 httpsdoiorg101007BF02548772 733
33
11 Bazalduacutea-Medelliacuten ME Fuentes AF Gorokhovsky A Escalante-Garciacutea JI (2015) Early 734 and late hydration of supersulphated cements of blast furnace slag with fluorgypsum 735 Materiales de Construccion 65e043 httpsdoiorg103989mc201506013 736
12 Matschei T Bellmann F Stark J (2005) Hydration behaviour of sulphate-activated slag 737 cements Advances in Cement Research 17167ndash178 738
httpsdoiorg101680adcr2005174167 739
13 Richardson IG (2000) Nature of the hydration products in hardened cement pastes 740 Cement and Concrete Composites 2297ndash113 httpsdoiorg101016S0958-741 9465(99)00036-0 742
14 Baux C Phelipot-Mardeleacute A Lanos C et al (2013) PERFORMANCES OF SUPER 743 SULFATED CEMENTS In International Conference on Concrete Under Severe 744 Conditions pp 1857ndash1870 745
15 Annabelle Phelipot-Mardeleacute Gabriel Samson Christophe Lanos (2015) Super sulfated 746 cement formulation and uses In Construction Materials ConMat Whistler Canada 747
16 Milestone NB (2006) Reactions in cement encapsulated nuclear wastes need for 748 toolbox of different cement types Advances in Applied Ceramics 10513ndash20 749
httpsdoiorg101179174367606X81678 750
17 Batchelor B (2006) Overview of waste stabilization with cement Waste Management 751
26689ndash698 httpsdoiorg101016JWASMAN200601020 752
18 Zhang T Cheeseman CR Vandeperre LJ (2011) Development of low pH cement 753
systems forming magnesium silicate hydrate (MSH) Cement and Concrete Research 754 41439ndash442 httpsdoiorg101016jcemconres201101016 755
19 Mobasher N Bernal SA Provis JL (2016) Structural evolution of an alkali sulfate 756
activated slag cement Journal of Nuclear Materials 46897ndash104 757 httpsdoiorg101016JJNUCMAT201511016 758
20 Wang J Yu B Gao Y (2014) Hydration Characteristics of Super Sulphated Cement 759 with Different Fineness In Proceedings of the International Conference on Material 760 and Environmental Engineering (ICMAEE 2014) Atlantis Press Paris France 761
21 Naumlgele E (1986) The Zeta-potential of cement Part II Effect of pH-value Cement and 762 Concrete Research 16853ndash863 httpsdoiorg1010160008-8846(86)90008-6 763
22 Jain N Civil MG-IJ of M and 2015 U (2015) Formulation of Sulphate Resistant Super 764 Sulphated Cement Using Fluorogypsum and Granulated Blast Furnace Slag IOSR 765
Journal of Mechanical and Civil Engineering (IOSR-JMCE) 12153ndash159 766
23 Gao YX Yu BY Xu FL (2012) Effect of Modified Phosphogypsum on the Mechanical 767 Properties of Super Sulphate Cement Applied Mechanics and Materials 161264ndash268 768 httpsdoiorg104028wwwscientificnetAMM161264 769
24 Kantro D (1980) Influence of Water-Reducing Admixtures on Properties of Cement 770 PasteampmdashA Miniature Slump Test Cement Concrete and Aggregates 295ndash102 771
httpsdoiorg101520CCA10190J 772
34
25 Svermova L Sonebi M Bartos PJM (2003) Influence of mix proportions on rheology of 773 cement grouts containing limestone powder Cement and Concrete Composites 25737ndash774 749 httpsdoiorg101016S0958-9465(02)00115-4 775
26 Sonebi M (2006) Rheological properties of grouts with viscosity modifying agents as 776 diutan gum and welan gum incorporating pulverised fly ash Cement and Concrete 777
Research 361609ndash1618 httpsdoiorg101016JCEMCONRES200605016 778
27 Nehdi M Rahman M (2004) Effect of Geometry and Surface Friction of Test Accessory 779 on Oscillatory Rheological Properties of Cement Pastes ACI Materials Journal 780 101416ndash424 httpsdoiorg101435913428 781
28 Khayat KH Yahia A (1997) Effect of Welan Gum-High-Range Water Reducer 782 Combinations on Rheology of Cement Grout ACI Materials Journal 94365ndash372 783 httpsdoiorg1014359321 784
29 Lombardi G (1985) THE ROLE OF COHESION IN CEMENT GROUTING OF 785 ROCK In Proceedings of Fifteenth Congress on Large Dams International 786 Commission on Large Dams pp 235ndash261 787
30 Perrot A Rangeard D Picandet V Meacutelinge Y (2013) Hydro-mechanical properties of 788
fresh cement pastes containing polycarboxylate superplasticizer Cement and Concrete 789 Research 53221ndash228 httpsdoiorg101016JCEMCONRES201306015 790
31 Perrot A Lecompte T Khelifi H et al (2012) Yield stress and bleeding of fresh cement 791 pastes Cement and Concrete Research 42937ndash944 792
httpdxdoiorg101016jcemconres201203015 793
32 Sonebi M Perrot A (2019) Effect of mix proportions on rheology and permeability of 794 cement grouts containing viscosity modifying admixture Construction and Building 795
Materials 212687ndash697 httpsdoiorg101016jconbuildmat201904022 796
33 Picandet V Rangeard D Perrot A Lecompte T (2011) Permeability measurement of 797
fresh cement paste Cement and Concrete Research 41330ndash338 798 httpsdoiorg101016JCEMCONRES201011019 799
34 Perrot A Rangeard D (2017) Effects of mix design parameters on consolidation 800
behaviour of fresh cement-based materials Materials and Structures 50117 801 httpsdoiorg101617s11527-016-0988-0 802
35 Rangeard D Perrot A Picandet V et al (2015) Determination of the consolidation 803 coefficient of low compressibility materials application to fresh cement-based 804
materials Materials and Structures 481475ndash1483 httpsdoiorg101617s11527-014-805 0247-1 806
36 Massoussi N Keita E Roussel N (2017) The heterogeneous nature of bleeding in 807 cement pastes Cement and Concrete Research 95108ndash116 808 httpsdoiorg101016JCEMCONRES201702012 809
37 Montgomery D (2007) Design and Analysis of Experiments Second Edition John 810
Wiley amp Sons 811
35
38 Roussel N Stefani C Leroy R (2005) From mini-cone test to Abrams cone test 812 Measurement of cement-based materials yield stress using slump tests Cement and 813 Concrete Research 35817ndash822 httpsdoiorg101016jcemconres200407032 814
39 Mangat PS Khatib JM Wright L (2006) Optimum utilisation of FGD waste in blended 815 binders Proceedings of Institution of Civil Engineers Construction Materials 159119ndash816
127 httpsdoiorg101680coma20061593119 817
40 Khatib JM Mangat PS Wright L (2013) Early age porosity and pore size distribution of 818 cement paste with flue gas desulphurisation (FGD) waste Journal of Civil Engineering 819 and Management 19622ndash627 httpsdoiorg103846139237302013793609 820
41 Collier NC Milestone NB Gordon LE Ko SC (2014) The suitability of a supersulfated 821 cement for nuclear waste immobilisation Journal of Nuclear Materials 452457ndash464 822 httpsdoiorg101016jjnucmat201405078 823
42 Masoudi R (2018) Examining compositions hydration mechanisms and properties of 824 supersulfated cement for use in concrete by Examining compositions hydration 825 mechanisms and properties of supersulfated cement for use in concrete University of 826 Toronto 827
828
1
Optimisation of rheological parameters induced bleeding permeability 1
and mechanical properties of supersulfated cement grouts 2
M Sonebi1 A Abdalqader12 T Fayyad2 A Perrot3 Y Bai4 3
4
1School of Natural and Built Environment Queenrsquos University Belfast Belfast Northern Ireland UK 5
2Tracey Concrete Ltd Northern Ireland UK 6
3University Bretagne Sud Lorient France 7
4Departement of Civil Engineering Environmental and Geomatic University College London UK 8
9
Abstract 10
Presenting a promising option that could be used to encapsulate nuclear waste material 11
for disposal supersulfated cement (SSC) is again receiving wide attention among research 12
community as a cementitious system that has noteworthy properties It is also an 13
environmentally friendly cement since it is mainly composed of ground granulated blast 14
furnace slag (GGBS) that is activated by a sulphate source such as gypsum hemihydrate or 15
anhydrite Although there is some research on SSC little research work has focused on 16
modelling the effects of the various parameters using a statistical approach which is the aim of 17
this paper The effect of dosages of GGBS anhydrite (ANH) and water-to-binder ratio (WB) 18
on the fresh and rheological parameters induced bleeding permeability compressibility and 19
compressive strength of supersulfated grouts was investigated Then statistical models and 20
isoresponse curves were developed to capture the significant trends of the tested parameters 21
using factorial design approach The models suggested that that WB had significantly higher 22
influence on most of the parameters tested while the influence of GGBS and ANH and their 23
interactions varied depending on the parameter in question The findings of this study show 24
the importance of understanding the role of and optimising the relevant key factors in 25
producing SSC fit-for-purpose The statistical models developed in this paper can facilitate 26
optimizing the mixture proportions of grouts for target performance by reducing the number of 27
trial batches needed 28
29
Keywords compressive strength heat of hydration permeability induced bleeding 30
rheology slump flow supersulfated cement yield stress viscosity 31
2
Highlights 32
bull SSC presents a promising option to encapsulate nuclear waste material 33
bullThe constituents effect on SSC groutsrsquo properties was studied and modelled 34
bullFactorial design is a powerful tool for optimizing the mixture proportions of SCC 35
bullWB had the highest influence on most of the parameters tested 36
1 Introduction 37
Ancient concrete as well as more recent concrete materials reinvented in the nineteenth century 38
have performed well in the past However over recent decades a great challenge had emerged 39
regarding ensuring efficient consumption of natural resources and hence there was a pressure 40
to make construction industry more sustainable Concrete is widely used within the 41
construction industry and contributes to a large extent to the global energy consumption and 42
carbon emission due to the energy intensity and CO2 emissions associated with cement 43
production So the industry was looking for ways to become more sustainable [1] This has 44
resulted in a high demand for new types of cement possessing improved qualities including 45
strength toughness and durability as well as being environmentally friendly 46
Cements made of industrial waste materials and by-products emerged as one of the sustainable 47
options to traditional Portland cement (PC) because it is mainly manufactured using waste and 48
by-products that require little processing making the embodied energy and emissions 49
associated with the production process low Besides its environmental benefits such materials 50
has a great versatility depending on their components and they can be tailored to make them 51
suitable for a wide range of applications in the structures industry [2] 52
One of these environmentally friendly cements that was used during the last decades is the 53
supersulfated cement (SSC) which is a cementitious system composed of ground granulated 54
blast furnace slag (GGBS) that is activated by a sulphate source such as gypsum hemihydrate 55
or anhydrite [3] Wastes of semi-dry and dry flue gas desulpherisation (FGD) can be used as 56
source of sulphate [4 5] SSC has great advantages that make it attractive for use firstly it is 57
mainly manufactured using by-products and industrial wastes Secondly it has lower CO2 58
emissions compared to PC because clinker burning is reduced The estimated embodied CO2 59
of GGBS is 796 kgCO2tonne which is 10 times lower than that of Portland cement (CEM 1) 60
at 860 kgCO2tonne [6] Besides that SSC produces much lower heat than PC and also SSC 61
3
has superior resistance to chemically aggressive environments such as sulfates Due to the 62
glassy nature of GGBS composed mainly of monosilicates GGBS easily dissolves in low to 63
mild alkaline solutions However it is required that the alumina content (Al2O3) of slag to be 64
no less than 13 to be used effectively in SSC [7] The most commonly used sources of 65
sulphate is anhydrite because it has lower solubility rate than other sources [8 9] To promote 66
the dissolution of slag PC is added because its hydration yields the formation of calcium 67
hydroxide (CH) which provides the required alkaline environment for slag dissolution Once 68
the slag is dissolved the released aluminium silicon and calcium ions from slag glass react 69
with the calcium sulfate present in the mixture to form two main hydration products ettringite 70
(C6A3H32) and calcium silicate hydrate (C-S-H) [10] Ettringite provides the early strength to 71
SSC mixtures contributing to the strength development while C-S-H is responsible for later 72
strength and the continual increase of strength over time [11 12] C-S-H formed in SSC has a 73
CaSi ratio between 10 and 12 which is much lower than that formed in PC mixtures [13] 74
This means that the chemical composition of slag plays a significant role on the strength 75
development dissolution of the slags and the amount of hydration products formed 76
After being used for long time in construction for special structures currently SSC is very 77
rarely used and no longer produced in some areas According to Baux et al [14] this happened 78
because of its lack of reactivity Grounds et al [10] believed that this is because there is 79
uncertainty over some of its properties which include its long-term stability and durability One 80
of their main concern surrounding SSC is due to the hydration product ettringite or tri-81
sulphoaluminate which is known to be unstable in Portland cement and has been found to be 82
expansive in certain environments Phelipot-Mardeleacute et al [15] state that this could be because 83
generally cement made with blast furnace slag tends to harden more slowly than mortar and 84
concrete made from PC 85
The nuclear power is a promising option for the future in the UK and the world in general 86
however the nuclear waste is still an obstacle in its way to be a vital option for the future and 87
to gain public acceptance [16] This can be achieved by making the contaminants to be less 88
mobile or less toxic by lsquowaste stabilizationrsquo that results in converting the contaminants from 89
the dissolved phase to a solid phase by reactions such as precipitation sorption or substitution 90
This prevents the waste from diffusion to the external environment [16 17] Most applications 91
of stabilization are cement-based where the cement forms a low permeability matrix and where 92
the contaminant is incorporated into hydrated phases and then precipitated due to the prevailing 93
pH in the pore solution [18] This means that the efficiency of the process depends on the 94
4
prevailing pH The pH resulting from cement hydration results in many metal contaminants 95
forming hydroxide or mixed hydroxide solids [17] Portland cement will tend to result in a 96
higher pH while combining it with lime as well as fly ash blast furnace slag and other 97
pozzolanic binders will result in lower pH The interactions of these binders with waste 98
components determine the extent of treatment [18] 99
There is a lack of data detailing the assessment criteria and performance of nuclear 100
encapsulation groutconcrete However general requirements of a cementitious system for 101
encapsulation can be summarised as follows an ability to incorporate waste and harden 102
fluidity of initial cemented mix and potential for remote mixing low permeability resistance 103
to water low temperature rise on setting workable setting time low free or unbound water 104
when setting reaction is complete low internal pH to avoid ongoing reactions such as 105
corrosion long term durability [16] 106
The solubility of many heavy metals is low at low pH and therefore low pH cements such as 107
SSC are likely to be particularly desirable cements for nuclear waste management [16ndash19] 108
This would help to make the nuclear energy as a clean and a safe source of energy a promising 109
alternative for future generations This again has highlighted some of the noteworthy 110
properties of the SSC where not only the pH value that makes SSC a promising option that 111
could be used to encapsulate nuclear waste material for disposal Also the heat of hydration in 112
supersulfated cement is much lower than that of OPC and therefore the heat gradient created 113
during hydration between the internal and external surfaces would not be as great and thus less 114
stress caused and less chance of cracking which would be unacceptable with nuclear waste 115
disposal It has high non-evaporable water content that is itrsquos chemically bonded to the silica 116
Besides that it has a good durability in aggressive environments such as structures exposed to 117
seawater or sulfate-bearing groundwater [9 14 15 20ndash22] 118
These technical and environmental benefits have re-simulated recent research on this type of 119
cement and brought the attention for re-investigating overcoming its drawbacks to offer a green 120
cement for very essential applications 121
Currently different researches are being carried out on SSC in order to optimize the usage of 122
SSC Many researchers have examined its various mixture compositions to determine the best 123
compositions for some desirable properties such as strength low permeability faster setting 124
time etc A research on slags activated with 15ndash20 calcium sulfate showed a higher 125
compressive strength in comparison with other mixtures when they examined slags classified 126
5
as low-lime high-alumina and when various SSC mixture compositions were examined with 127
70ndash85 slag 10-25 anhydrite and 5 Portland cement for alkali activation [15] 128
Gruskovnjak et al [8] investigated the effect of alumina content in the slag by examining two 129
types of slag with a high Al2O3 percentage content (12) and low Al2O3 percentage content 130
(77) The findings of their study showed that slag with high alumina contents produced more 131
ettringite and higher strength This was attributed to the higher dissolution rate of high alumina 132
slag SSC hydration characteristics with different fineness has also been investigated [20] It 133
showed that when sample particles become finer the compressive strength is significantly 134
higher Also there is some work which has been done on modifying the mechanical properties 135
of SSC with addition phosphogypsum [19 23] Recently the influence of curing temperature 136
was studied for supersulfated cements made with two slags having different chemical 137
compositions [20] It was found that SSC made with high-alumina slag resulted in higher 138
strengths and presented a more complex mechanism of hydration that was strongly influenced 139
by the solubility of anhydrite This is also being shown in [21] where the SSC made using high-140
alumina slag exhibited higher compressive strength and the use of higher activator contents 141
decreased the compressive strength 142
Based on recent researches and the fact that there are many factors and parameters involved in 143
the composition of SSC there is a demanding need for optimizing the cement grout in order to 144
effectively utilise it to fit for purpose The current paper aligns with this demand The effect of 145
GGBS water-to-binder ratio WB and anhydrite dosages on the grout fluidity rheological 146
properties induced bleeding fresh state permeability and compressibility maximum heat of 147
hydration and compressive strength will be investigated using factorial design approach and 148
analysis Although there is some research on SSC little research work has focused on 149
modelling the effects of the various parameters using a statistical approach Factorial design is 150
a powerful tool and widely used in experiments involving many factors It can be utilised to 151
study the joint effect of factors on responses or dependent variables and to develop models 152
applicable to design and development of experiments Simulation of models obtained with 153
factorial design can facilitate the test protocol needed to optimize cement grout within a given 154
set of performance criteria 155
6
2 Experimental Programme 156
21 Materials and Test Methods 157
The grout mixes investigated in this study were prepared with Standard CEM I 425N Portland 158
cement (PC) specified by BS EN 197-1 The ground granulated blast furnace slag (GGBS) in 159
accordance to BS EN 15167-2 was used The chemical composition of CEM I and GGBS are 160
provided in Table 1 Anhydrite (ANH) was used as the source of sulphate in the present study 161
and it was partially or completely replaced the PC The proportions of the grout mixes are 162
shown in Table 2 163
164
Table 1 Chemical and physical properties of cement and GGBS 165
Chemical analysis Material
CEM I GGBS
SiO2 () 2101 3518
Al2O3 () 492 1396
Fe2O3 () 284 025
MgO() 220 818
CaO () 6452 4121
Na2O () 020 019
K2O () 071 042
SO3 () 253 --
P2O5 () 011 --
LOI () 126 064
Physical analysis
Specific gravity 308 291
Specific surface area [m2kg] 360 600
166
Table 2 Mix proportions for the grouts used in the factorial design 167
Mix
No
Code WB
Percentage ()
WB GGBS ANH GGBS ANH
M1 -1 -1 -1 034 60 0
M2 1 -1 -1 044 60 0
M3 -1 1 -1 034 60 20
M4 1 1 -1 044 60 20
M5 -1 -1 1 034 80 0
M6 1 -1 1 044 80 0
M7 -1 1 1 034 80 20
M8 1 1 1 044 80 20
M9 0 0 0 039 70 10
M10 0 0 0 039 70 10
M11 0 0 0 039 70 10
M12 0 0 0 039 70 10
168
7
All grout mixes were prepared in 2 L batches using a high-shear mixer with a 45 L capacity 169
The mixing water was kept at 98 plusmn 02 ordmC to compensate for heat generated during mixing 170
The cement and GGBS were mixed with ANH in a sequence that started with adding all of the 171
water into the mixer After one minute the binder was gradually introduced The grout was 172
mixed for one minute followed by 30 seconds of rest Subsequently the grout was mixed again 173
for 2 min at a high speed (285 rpm) and for 1 min at the low speed (140 rpm) 174
For all tests the timing is given from zero time ie the time when the cement particles first 175
touch the mixing water The mini-slump flow test started at 7 min (immediately after the end 176
of mixing) The transparent cone-shaped mould described elsewhere [24] was placed in the 177
centre of a smooth Plexiglas plate After filling with grout the cone was gently lifted 178
(approximately 30 s after placement of the grout) When the flow stopped the spread of the 179
grout was measured with a ruler in two perpendicular directions 180
Marsh cone test was carried out using a metal cone with an orifice diameter of 10 mm and 181
started at 8 plusmn 1 min One litre of grout was poured into the cone The conersquos orifice was opened 182
15 s after pouring the cement grout into the cone The time taken for each 100 ml of grout to 183
flow through the orifice was recorded and the measurements were completed upon collecting 184
700 ml of grout 185
The viscosity of cement grout was determined using a coaxial rotating cylinder viscometer 186
Fann (smooth cylinders no serration) that determined apparent viscosity at different shear 187
rates The test was contained in the annular space between an outer cylinder (rotor) with a 188
radius of 18415 mm and a bob with a radius of 17245 mm and a height of 380 cm The rotor 189
and bob were plunged into a cup containing 350 ml of sample grout Viscosity measurements 190
were made when the outer cylinder rotating at a known speed caused a viscous drag to be 191
exerted by the fluid This drag created a torque on the bob which was transmitted to a precision 192
spring where its deflection was measured and compared with test conditions and the 193
instrumentrsquos constants The measurement was made for 12 rotor speeds from 09 rpm to 600 194
rpm where the viscometer reading values () were recorded The value of shear stress (Pa) 195
was calculated by including k1 torsion constant of spring per unit deflection (N-cmdegree) 196
k2 shear stress constant for the effective bob surface (cm-3) and k3 shear rate constant [s-1rpm] 197
[25 26] 198
Rotor speed was increased step by step and the viscometer readings were recorded with 199
increasing rotation speeds The reading was taken when the needle in the viscometer was 200
8
stabilised or 30 seconds after the change of speed in cases when the needle had not stabilised 201
due to the thixotropy of the cement grout The time of reading was generally between 5 and 202
10 seconds 203
In this study the down-curve was chosen for final evaluation because it offered a better 204
description of the rheological behaviour of the grouts including a structural breakdown 205
phenomenon of inner forces among particles [27] The values of shear yield stress (the 206
minimum shearing stress required for the fluid to start flowing) and plastic viscosity used the 207
modified Bingham model [28] and are expressed as follows 208
2
0 cp (1) 209
Where τ0 is yield stress (Pa) μp is plastic viscosity (Pas) is shear rate (s-1) and c is a 210
constant 211
The cohesion of grout was determined at 30 plusmn 1 min with a Lombardi plate cohesion meter 212
[29] A thin galvanized steel plate (100times100times1 mm) was immersed in the grout and hung on a 213
stand placed on an electronic balance The weight of the grout still present on the plate was 214
recorded when the dripping of the grout had stopped This test was followed by the fresh 215
density measurement of the grout with a mud balancer Knowing the fresh density of the grout 216
it was possible to calculate the thickness on each side of the plate 217
The resistance of the fresh grout to induced bleeding was evaluated using a pressure filter The 218
equipment consists of a pressure vessel filter paper which is placed on a sieve and a graduated 219
cylinder A 200 ml grout sample is placed in the pressure vessel After closing the cell the 220
graduated cylinder is placed under the outlet of the cell The cell is pressured by compressed 221
air to 055 MPa The volume of water going out through the outlet on the bottom of the cell is 222
recorded at 15 and 30 s then at every minute up to 10 min and then at every 5 min up to 30 min 223
[25] 224
Considering homogeneous bleeding the results of the induced bleeding tests allow to derive 225
the evolution of the permeability of the sample during its compaction under the applied 226
pressure The permeability of the material is directly linked to the bleeding rate during the 227
material consolidation until the tested material is able to sustain the applied pressure [30 31] 228
It refers to the material ability to slow down the water filtration process 229
The measurement of the flow water allows to compute instantaneous WB ratio and makes it 230
possible to link it with the computed instantaneous permeability at a given time of the test [32ndash231
9
34] I The water flow is computed by dividing the variation of the measured water mass flowing 232
out the samples by the elapsed time between two successive data sampling In this study value 233
of permeability at 1 and 30 minutes are taken and compared It corresponds to the initial and 234
final permeability of the mixes 235
The material compressibility is considered in a soils mechanics way [30 35] It corresponds to 236
the ratio of the variation of void ratio (liquidsolid volume ratio) to the variation of logarithm 237
of applied pressure between the initial and the final state of the induced bleeding test It 238
provides the equilibrium state of the sample under a given applied pressure and is valid for 239
both homogeneous and heterogeneous bleeding [36] 240
It is worth noting that the computed permeability describes homogeneous bleeding kinetics 241
while compressibility describes the amplitude of the bleeding phenomenon 242
Heat of hydration was evaluated by isothermal calorimetry with an eight-channel heat 243
conduction calorimeter maintained at 22degC This equipment measures heat evolved by 244
comparing the temperatures of a grout sample and an inert reference which are both held under 245
isothermal conditions The heat flow results are recorded as a function of time CEM I GGBS 246
and ANH were blended manually for 30 s After the addition of water the grout was blended 247
10 s by hand and then an additional 50 s mechanically Polyethylene ampoules were filled with 248
approximately 6 g of each grout and the experiments were conducted for at least 72 h 249
The compressive strength of the grout was determined by crushing three cubes of 50 mm size 250
After casting the samples were covered with a polymer sheet (a cling film) to limit evaporation 251
of water and stored in a conditioning room at 20 plusmn 2 degC for 24 plusmn 05 hours Afterwards cubes 252
were demoulded and placed in water at 20 plusmn 1 degC until tested at 1 3 7 and 28days 253
In order to perform the pH test a powder sample of the hardened mixes was required The test 254
was performed on 1 7 and 28 day samples As mixes 9-12 are of identical composition the 255
reason is explained later in 41 derived statistical model tests were only performed on sample 256
10 To get the powder with a fineness of 65μm the samples were firstly drained of the acetone 257
To remove any remaining acetone they were placed in a vacuum desiccator The pieces were 258
then ground using a mortar and pestle passed through a 65 μm sieve placed in sample bags 259
and returned to the desiccator The samples had then to be mixed with distilled water to enable 260
the pH test to be performed A 110 ratio of cement to water was used and mixed for 24 hours 261
using a rotating machine To get the pH reading the samples were put into a centrifuge machine 262
to separate the solid and liquid At this stage the solution should have a pH equivalent to cement 263
10
it was mixed with To get a pH reading for the samples a pH device was used where a probe 264
is placed in the solution The machine was calibrated with three buffer solutions of 7 10 and 265
13 pH levels before measuring the pH of the samples 266
SEM (scanning electron microscopy) was carried out using a JEOL JSM6400 on flat fractured 267
surface specimens obtained from compression testing at 7-day samples Prior to SEM testing 268
the samples were mounted onto metal stubs using carbon paste and coated with gold film to 269
ensure good conductivity The accelerated voltage was set at 20 kV 270
22 Statistical Design and Modelling of Experiments 271
The technique of analysis used in this study was a 2k factorial experimental design [37] to 272
evaluate the influence of two different levels (maximum and minimum) for each variable on 273
the relevant grout properties Three key parameters (WB ANH GGBS) that should have 274
significant influence on mix characteristics of supersulfated cements were selected to formulate 275
the mathematical models for evaluating relevant properties (ie k = 3 in this study thus the 276
total mixes for the factorial design was 23 = 8) Additionally a mix at the central point was 277
replicated four times to estimate the experimental error and improve the reliability of the 278
models The coding and levels of the variables (WB and dosages of GGBS and ANH) are 279
given Table 2 280
The statistical models are valid for supersulfated grout (SSC) mixes made with WB GGBS 281
and ANH in the ranges of 034 to 044 60 to 80 and 0 to 20 respectively The modelled 282
experimental region consisted of mixtures ranging from coded variables of ndash1 to +1 The coded 283
factors for variables were calculated by 284
Coded Factor = (Actual value-Factor means)[Range of factor value2] (2) 285
Hence 286
Coded WB = (Actual WB ndash 039)005 287
Coded GGBS = (Actual GGBS ndash 07)01 288
Coded Anhydrite = (Actual ANH ndash 01)01 289
The responses modelled were mini-slump plate cohesion Marsh cone yield stress plastic 290
viscosity induced bleeding at 1 min 5 and 30 mins permeability at 1 min and 30 mins 291
compressibility and compressive strength at 1 3 7 and 28 days The general model associated 292
11
with the two-level factorial design incorporating three independent variables (WB GGBS 293
ANH) is expressed by 294
Y1 = a0 + a1WB + a2GGBS + a3ANH+ a4WBGGBS + a5WBANH + a6GGBSANH 295
+ a7WBGGBSANH + ε (3) 296
where 297
Y1 Response (mini slump marsh cone plate cohesion etc) 298
a0 Overall mean factor effect 299
a1-a7 Regression coefficients representing model constants (contribution of independent 300
variables and their interaction to each response) 301
a1WB a2GGBS a3ANH Linear effect of factors WB GGBS and ANH 302
a4WBGGBS a5WBANH a6GGBSANH a7WBGGBSANH Interaction effects of 303
factors WB GGBS and ANH 304
ε Random error term representing the effects of uncontrolled variables 305
Analysis of variance (ANOVA) was used to test the significance of regression models and t-306
tests were performed to identify the non-significant (NS) variables and second order 307
interactions which were subsequently eliminated from the derived models Model coefficients 308
were determined using multi-linear regression analysis based on a normal distribution 309
assumption The error was assumed to be random and normally distributed so the residual 310
terms which represent the difference between the actual and predicted values should exhibit 311
similar properties [37] The probability value (Prob) obtained from ANOVA determines the 312
statistical significance of each factor and their interactions For most of the parameters the 313
probability that the derived coefficients associated with the various variables influencing each 314
response were limited to 10 This signifies that there is less than 10 chance or 90 315
confidence limit that the contribution of a given parameter to the tested response exceeds the 316
value of the specified coefficient A negative estimate indicates that an increase of the given 317
parameter results in a reduction of the measured response 318
12
3 Results and discussion 319
The results of the experimental work characterize the behaviour of the mortars with different 320
WB ANH and GGBS levels Table 3 summarises all results of the experimental work 321
performed The results were used to construct the regression models 322
Table 3 Average results from experimental work 323 324
Viscometer Induced bleeding
Mix Mini-
slump
Flow
time
Cohesion
meter
Yield
value
Plastic
viscosity
1min 5min 30min
(mm) (s) (mm) (Pa) (Pas) (mL) (mL) (mL)
1 61 230 105 191 0923 220 470 480
2 89 25 55 97 0323 290 780 810
3 67 200 118 172 0802 280 580 605
4 111 12 20 80 0199 490 860 860
5 52 360 143 251 1203 280 520 540
6 83 69 86 99 0403 360 700 700
7 60 250 125 211 0980 310 580 590
8 110 13 40 77 0224 350 910 950
9 71 150 87 101 0617 370 720 730
10 73 102 122 106 0681 290 620 620
11
12
77
74
192
83
89
110
124
101
0660
0641
290
350
640
715
645
720
325
Table 3 Average results from experimental work (continued) 326
Mix Permeability Permeability Compre-
ssibility
Compressive strength
1 min 30 min fc 1d fc 3d fc 7d fc 28d
(ms) (ms) (MPa) (MPa) (MPa) (MPa)
1 216E-09 317E-09 0155 299 506 581 704
2 512E-08 418E-09 0298 168 383 547 558
3 448E-08 366E-09 0194 213 334 406 527
4 374E-08 425E-09 0312 140 223 256 408
5 448E-08 342E-09 0173 233 434 507 535
6 512E-08 395E-09 0255 136 371 371 448
7 440E-08 361E-09 0187 108 232 343 532
8 451E-08 433E-09 0342 68 200 263 473
9 446E-08 402E-09 0250 196 328 398 592
10 468E-08 371E-09 0212 171 232 361 556
11
12
423E-08
516E-08
379E-09
400E-09
0221
0246
207
183
313
301
451
435
565
520
327
The derived quadratic statistical models of grout for mini-slump flow time cohesion plate 328
yield stress plastic viscosity induced bleeding at 1 min 5 min and 30 min permeability at 1 329
13
min and 30 min compressibility and compressive strength at 1 3 7 and 28 days are given in 330
Equations (4) to (18) where WB GGBS and ANH are given in codes values 331
Mini-Slump (mm) = 7881 + 1919 WB + 781 ANH + 444 WBANH - 294 GGBS (4) 332
333
Marsh flow time (s) = 1404 - 1153 WB ndash 261 ANH + 281 GGBS (5) 334
335
Plate Cohesion meter (microm) = 86 - 366 WB + 122 GGBS - 107 ANH - 091 WBANH (6) 336
337
Yield Value (Pa) = 1466 ndash 584 WB - 126 WBGGBS - 125 ANH + 124 GGBS (7) 338
339
Plastic Viscosity (Pas) = 063 - 034 WB - 0078 ANH + 0073 GGBS 340
- 0047 WBGGBS - 0022 ANHGGBS (8) 341
342
Induced Bleeding at 1 min (ml) = 3225 + 50 WB + 35 ANH ndash 225 WBANHGGBS (9) 343
344
Induced Bleeding at 5 mins (ml) = 675 + 1375 WB + 575 ANH (10) 345
346
Induced Bleeding at 30 mins (ml) = 6919 + 1381 WB + 594 ANH (11) 347
348
Permeability at 1 min (ms) x 10-8 = 4 + 0615 WB + 0621 AHN ndash 0773 WBGGBS 349
- 0426WBAHN - 0446 AHNGGBS (12) 350
351
Permeability at 30 min (ms) x 10-8 = 0382 + 0035 WB + 0014 ANH 352
+ 0008 WBANHGGBS (13) 353
354
Compressibility = 02396 + 00623 WB + 00194 ANH + 00012 WBANHGGBS (14) 355
356
ƒc 1 d (MPa) = 1705 - 426 WB - 384 ANH - 343 GGBS + 145 WBANH (15) 357
358
ƒc 3 d (MPa) = 3215 - 879 ANH - 412 WB ndash 261 GGBS (16) 359
360
ƒc 7 d (MPa) = 4092ndash 924 ANH - 5 WB - 383 GGBS (17) 361
362
14
ƒc 28 d (MPa) = 5348 - 515 WB - 382 ANH ndash 262 GGBS + 436 ANHGGBS (18) 363
364
The correlation coefficient of most of the proposed models were higher than 090 except for 365
plastic viscosity compressive strength after 3days and compressive strength after 28days 366
which have coefficients of 070 086 and 087 respectively 367
Table 4 shows the average measured responses of the four replicate grouts the coefficients of 368
variation (COV) as well as the estimated errors with a 90 confidence limit for each of the 369
measured properties The estimated error levels for mini-slump plate cohesion meter Marsh 370
cone yield stress plastic viscosity induced bleeding at 1 min 5 min and 30 mins permeability 371
at 1 min and 30 min compressibility and compressive strengths at 1 3 7 28 days were plusmn 22 372
mm plusmn 0001mm plusmn 40 s plusmn 09 Pa plusmn 002 Pa s plusmn 28 ml plusmn 42 ml plusmn 45 ml plusmn 32x10-9 (ms) 373
plusmn 13x10-10 (ms) plusmn 00153 plusmn 13 MPa plusmn 35 MPa plusmn 33 MPa and plusmn 25 MPa respectively 374
The relative experimental errors for mini-slump plate cohesion meter Marsh cone yiled stress 375
plastic viscosity induced bleeding permeability compressibility compressive strengths were 376
limited to 3-11 On the other hand relative error for march cone was up to 30 377
Table 4 Repeatability of test parameters at the central point 378
379
Tests Mini-
slump
Plate
cohesion
Marsh
cone
Yield
stress
Plastic
viscosit
y
Induced
bleeding
at 1 min
Induced
bleedin
g at 5
min
Induced
bleeding
at 30
min
Mean (n=4) 736
mm
001
mm
1318
s
108
Pa
065
Pa s
325
ml
674
ml
679
ml
Coefficient
of variation
()
37 115 372 105 42 127 76 80
Estimate
error (90
confidence
limit)
22
mm
0001
mm
402
s
09
Pa
002
Pa s
28
ml
42
ml
45
ml
380
381 Table 4 Repeatability of test parameters at the central point (continued) 382
383
Tests
Permeability
1 min
x10-8
Permeability
30 min
x10-8
Compressibility frsquoc 1d frsquoc 3d frsquoc 7d frsquoc 28d
Mean (n=4) 463
ms
0388
ms 02323
189
MPa
293
MPa
411
MPa
558
MPa
Coefficient
of variation
()
85 39 8 84 144 98 53
15
Estimate
error (90
confidence
limit)
032
(ms)
0013
(ms)
00153
13
MPa
35
MPa
33
MPa
24
MPa
384
385
31 Accuracy of the established models 386
387
The ratio of predicted-to-measured properties for grout ranged between 087 and 115 388
indicating good accuracy for prediction of mini-slump plate cohesion induced bleeding at 1 389
min 5 mins and 30 mins yield stress plastic viscosity and compressive strength at 1-d 3-d 7-390
d and 28-d In general the proposed models for mini-slump plate cohesion Marsh cone and 391
compressive strength appeared to be accurate in predicting fluidity cohesivity induced 392
bleeding permeability at 30 min compressibility and compressive strength with low scatter 393
between measured and predicted values However the average values of predictedmeasured 394
ratio of yield values were slightly higher (074) 395
396
32 Isoresponses of the proposed models 397
398
The isoresponse surfaces and contour plots for mini-slump plate cohesion Marsh cone yield 399
stress plastic viscosity induced bleeding at 1 min 5 mins and 30 mins permeability at 1 min 400
and 30 mins compressibility and compressive strength at 1-d 3-d 7-d and 28-d were obtained 401
by using response surface methodology (RSM) The isoresponse surfaces and contour plots 402
were obtained from the regression models and because the models contained interaction and 403
second-order variables the contour lines were curved 404
The proposed statistical models can therefore be used to evaluate the effect of a group of 405
variables on the properties affecting the quality of supersulfated grout This allowed for the 406
calculation of isoresponse surfaces from the parameters under study outside the experimental 407
domain and the optimisation of their effects The next sections will discuss the results of each 408
experiment separately 409
331 Mini-slump 410
As shown in Eq 4 the mini-slump is influenced in order of significance by WB ratio 411
anhydrite proportion interaction of WB and ANH and the percentage of GGBS content The 412
WB ratio had the greatest effect on fluidity due to better lubrication of the particles in the paste 413
16
[29] The mini-slump test was accompanied by very low shear The value of mini-slump is to 414
characterise yield stress [38] therefore higher mini-slump value indicated a lower yield stress 415
The effect of WB on the increase of mini-slump was two and half-time than that of ANH (192 416
vs 781 in Eq 4) However increased ANH resulted in a 27 times greater increase in mini-417
slump than reduced GGBS (781 vs -294 in Eq 4) Figure 1(a) shows the effect of increased 418
WB on mini-slump vs ANH (when GGBS was kept constant at 70) and Figure 1(b) shows 419
GGBS vs ANH (when WB was fixed at 039) Based on these figures it is evident that mini-420
slump increased significantly when the dosage of WB and ANH increased 421
422
(a) (b) 423
Fig 1 Isoresponse curves of mini-slump (mm) (a) WB vs ANH and (b) GGBS vs ANH 424
425
332 Marsh cone 426
The time needed for a grout sample to flow through the Marsh cone is proportional to the 427
viscosity of the cement grout the flow time becomes an index of fluidity so the longer the 428
flow time the lower the fluidity Similar to the previous trends Eq 5 shows that the values of 429
Marsh cone are influenced in order of significance by WB GGBS and ANH This is 430
graphically illustrated in Figure 2 431
GGBS = 70
034 039 042 044
0
5
10
15
20
WB
AN
H (
)
65
74
83
92
101
037
AN
H(
)
WB = 039
60 65 70 75 80
0
5
10
15
20
GGBS()
70
75
80
85
17
432
(a) (b) 433
Fig 2 Isoresponse curves for flow time (s) (a) WB vs ANH and (b) GGBS vs ANH 434
435
It can be noted that an increase in WB and ANH or a reduction in GGBS led to decreasing 436
the Marsh cone flow time For example at fixed WB at 039 and GGBS of 70 respectively 437
the increase in ANH dosage from 5 to 20 led to a marked reduction of the Marsh cone flow 438
time from 170 to 140 s (Figure 2(a)) This behaviour is attributed to the change in plastic 439
viscosity of the grout as will be discussed later 440
333 Cohesion plate 441
As shown in Eq 6 the cohesion plate was influenced in order of magnitude by the WB and 442
the percentage of GGBS and ANH The increasing WB had a 34 times the influence on the 443
reduction of the cohesion plate test results as the increased ANH (for a GGBS constant) By 444
comparing the effects of WB and GGBS on plate cohesion the increased WB can be 445
interpreted as having approximately a 3 times greater influence on the reduction of plate 446
cohesion values than the increase in GGBS (-366 vs 122 in Eq 6) given that ANH is held 447
constant The effect of an increase in WB from 034 to 044 and ANH from 0 to 20 with a 448
fixed GGBS dosage of 70 is presented in Figure 3(a) Increased WB led to a decreased 449
cohesion plate value Conversely an increase in GGBS increased the cohesion plate value and 450
an increased ANH caused a reduction in cohesion plate (Figure 3(b)) 451
GGBS = 70
034 036 039 042 0440
5
10
15
20
WB
AN
H (
)
40
6080
100120
140160
180200
220
WB = 039
60 65 70 75 80
0
5
10
15
20
GGBS ()
AN
H (
)
100
120
140
160
180
18
452
(a) (b) 453
Fig 3 Isoresponse curves for plate cohesion meter (a) WB vs ANH and (b) GGBS vs 454 ANH 455
334 Yield stress 456
As shown in Eq 7 yield value was influenced in order of magnitude by WB and dosages of 457
ANH and GGBS Based on Figure 4 (a) when WB was fixed at 039 GGBS maintained at 458
70 and ANH increased to 5 the isoresponse curve showed a yield value of 15 Pa On the 459
other hand if the proportion of ANH was further increased to 20 while GBBS was 460
maintained at 70 the yield value decreased to 135 Pa This corresponds with Eq (7) in 461
which the proportion of WB and ANH were increased while GGBS was kept constant 462
resulting in a reduction in yield stress An increase in GGBS content resulted in an increase of 463
the yield stress 464
Figure 4 (b) shows the isoresponse curve of the yield value with a fixed proportion of GGBS 465
at 70 When WB was 039 and ANH was 5 the isoresponse of the predicted yield value 466
was 155 Pa If ANH was increased to 20 while maintaining WB at 039 the isoresponse of 467
the yield value was 135 Pa 468
It can be interesting to note that the observed results for the yield stress are closed to the one 469
observed with the cohesion plate and mini-slump tests This is expected as yield stress values 470
can be derived from those two simple tests 471
GGBS = 70
034 037 039 042 0440
5
10
15
20
WB
AN
H(
)
45
55
65
7585
95
105
115
WB = 039
60 65 70 75 800
5
10
15
20
GGBS ()
AN
H(
)
75
85
95
105
19
472
(a) (b) 473
Fig 4 Isoresponse curves for yield stress (Pa) (a) WB vs ANH and (b) GGBS vs ANH 474
335 Plastic viscosity 475
Plastic viscosity was influenced in order of magnitude by WB and the dosages of ANH and 476
GGBS ANH and GGBS had almost opposite effects on plastic viscosity (-0078 vs 0073 in 477
Eq 8) As shown in Eq (8) increased WB had the greatest primary effect on plastic viscosity 478
(034 vs 0078 and 0073) The increased WB had approximately a 44 times greater influence 479
on reducing plastic viscosity than increased ANH or decreased GGBS 480
In the isoresponse curve of plastic viscosity shown in Figure 5 (a) when GGBS was fixed at 481
70 WB set at 039 and ANH maintained at 5 the predicted plastic viscosity value was 482
068 Pas On the other hand if the dosage of ANHB was increased to 20 while maintaining 483
a similar WB the plastic viscosity was reduced to 055 Pas 484
In Figure 5 (b) WB was fixed at 039 when GGBS was held at 70 and ANH at 5 the 485
predicted plastic viscosity was 067 Pas However when ANH was increased to 20 and 486
GGBS was maintained at 70 the predicted plastic viscosity dropped to 055 Pas 487
AN
H(
)
GGBS = 70
034 037 039 042 044
0
5
10
15
20
WB
1012
1416
18
20
WB = 039
60 65 70 75 800
5
10
15
20
GGBS ()
AN
H(
)
13
14
15
20
488
(a) (b) 489
Fig 5 Isoresponse curve for plastic viscosity (Pas) (a) WB vs ANH and (b) GGBS vs 490
ANH 491
336 Induced bleeding 492
The induced bleeding equations for 1 and 5 minutes (Eqs 9 10) and 30 minutes (Eq 11) are 493
very similar The two influencing factors of induced bleeding are WB ratio and anhydrite 494
WB ratio has the greatest effect over two times the effect of anhydrite content Figure 6 shows 495
the isoresponse for bleeding versus the WB ratio for a fixed value of GGBS at 70 It can be 496
seen that when an anhydrite value is selected and the WB ratio is increased the bleeding will 497
also increase Similarly if a WB ratio is selected and the anhydrite content is increased the 498
bleeding will again increase 499
500
GGBS = 70
034 037 039 042 0440
5
10
15
20
WB
AN
H(
)
035
045
055
065
075
085
095
WB = 039
60 65 70 75 800
5
10
15
20
GGBS ()
AN
H(
)
055
060
065
075
034 036 039 042 044
0
5
10
15
20
WB
AN
H (
)
26
28
30
3234
36
38
40
GGBS=70
21
(a) 501
502
(b) (c) 503
Fig 6 Isoresponse curves for induced bleeding at 1 5 and 30 min WB vs ANH 504
337 Permeability 505
Figure 7 (a) and (b) showed firstly that the permeability decreased significantly from 1 min to 506
30 min Permeability at 1 min was influenced in order of magnitude by WB and the dosage 507
of ANH All interactions between 3 parameters had almost opposite effects on permeability 508
(Eq 12) As shown in Eq (12) increased WB and AHN had the greatest primary effect on 509
permeability at 1 min It seems there is an optimum reached at WB = 40 and AHN at 17 510
Similarly the permeability at 30 min is affected in order of significance by WB followed by 511
ANH (Eq 13) In Figure 7 (b) WB was fixed at 039 when GGBS was held at 70 and ANH 512
at 10 the predicted permeability was 038 x 10-8 (ms) However when ANH was increased 513
to 20 and GGBS was maintained at 70 the predicted permeability increased to 040x10-8 514
(ms) 515
516
GGBS = 70
034 036 039 042 0440
5
10
15
20
WB
AN
H (
)
545
61
675
74
805
GGBS = 70
034 036 039 042 0440
5
10
15
20
WB
AN
H (
)
56
60
64
68
72
7680
84
22
517
(a) (b) 518
Fig 7 Isoresponse curves for permeability at 1 and 30 min WB vs ANH 519
338 Compressibility 520
As shown in Eq (14) the compressibility was influenced in order of magnitude by the WB 521
and the percentage of ANH The interaction between 3 parameters affected also the 522
compressibility The increasing WB had a 32 times the influence on the increase of the 523
compressibility results as the increased ANH (for a GGBS constant) The effect of an increase 524
in WB from 034 to 044 and ANH from 0 to 20 with a fixed GGBS dosage of 70 is 525
presented in Figure 8 Increased WB led to an increase of compressibility Similarly an 526
increase in AHN increased the compressibility 527
528
Fig 8 Isoresponse curves for compressibility WB vs ANH 529
034 036 039 042 044
0
5
10
15
20
GGBS = 70 WB
AN
H (
)
3
35
4
4
45
5
034 036 039 042 044
0
5
10
15
20
WB
AN
H (
)
034
035
036 037 038 039 04
041
042
4
GGBS=70
034 036 039 042 044
0
5
10
15
20
WB
AN
H (
)
017
019
021 023 025 027
029
031
GGBS=70
23
530
339 Compressive strength 531
After one day from Eq 15 the influencing factors in order of significance are WB ratio 532
anhydrite content GGBS content and the interaction of WB and ANH The effect of the first 533
three was similar but WB had 11 times greater effect than anhydrite and 125 times greater 534
effect than GGBS While the interaction of WB and anhydrite had around a third of the 535
influence of WB Figures 9 (a) and (b) show the isoresponses for 1-day compressive strength 536
From Figure 9 (a) it can be seen when the GGBS content is fixed at 70 for a given anhydrite 537
content increasing the WB ratio will decrease the strength Also if a WB ratio is selected and 538
the anhydrite is increased similarly the strength will decrease From Figure 9 (b) with the WB 539
ratio fixed at 039 once again an increase in GGBS led to a reduction of compressive strength 540
at 1 day 541
542
(a) (b) 543
Fig9 Isoresponse curves for compressive strength at 1d (a) (WB vs ANH) and (b) (GGBS 544 vs ANH) 545
Eqs 16 17 and 18 show the effect of GGBS and ANH percentages on compressive strength at 546
3-d 7-d and 28-d Figures 10 11 and 12 show the isoresponse of the compressive strength at 547
3-d 7-d and 28-d respectively with WB vs ANH Increased ANH led to a decrease of 3-d 548
and 7-d compressive strength As expected an Increase in WB led to a decrease in compressive 549
strength The percentage of ANH had a negative effect on compressive strength and showed a 550
greater influence particularly at 3-d and 7-d (879 (3 d) amp 924 (7d) vs 382 (28 d)) GGBS has 551
a negative impact on early strength development The negative effect of GGBS on compressive 552
GGBS = 70
034 037 039 042 0440
5
10
15
20
WB
AN
H(
)
12
14
16
18
20
22
2426
WB = 039
60 65 70 75 800
5
10
15
20
GGBS ()
AN
H(
)
10
12
14
16
18
20
22
24
strength at early ages is clearly attributable to the fact that up to 80 of cement has been 553
replaced by GGBS and it takes some time for GGBS to start developing its pozzolanic action 554
at a noticeable level The results indicate that ANH content influences strength to a greater 555
extent than GGBS at all ages The SO3 content was reported to have great influence on the 556
strength [39 40] 557
558
(a) (b) 559
Fig10 Isoresponse curves for compressive strength at 3d (a) (WB vs ANH) and (b) 560 (GGBS vs ANH) 561
562
563
(a) (b) 564
Fig11 Isoresponse curves for compressive strength at 7d (a) (WB vs ANH) and (b) (WB 565 vs ANH) 566
567
GGBS = 70
034 036 039 042 0440
5
10
15
20
WB
AN
H (
)
24
2628
30
3234
3638
4042
WB = 039
60 65 70 75 80
0
5
10
15
20
GGBS ()
AN
H (
)
2426
2830
32
34
36
3840
42
GGBS = 70
034 037 039 042 044
0
5
10
15
20
WB
AN
H(
)
3032
34
3638
40
42
44
46
48
WB = 039
60 65 70 75 80
0
5
10
15
20
GGBS ()
AN
H(
)
32
34
36
38
40
42
44
46
48
25
568
(a) (b) 569
Fig12 Isoresponse curves for compressive strength at 28d (a) (WB vs ANH) and (b) 570
(ANH vs GGBS) 571
3310 Discussion of the effect of WB GGBS and ANH 572
As expected the increase of WB led to an increase in mini-slump induced bleeding and a 573
reduction in flow time plate cohesion yield stress plastic viscosity and compressive strengths 574
This can be attributed to more water in the system 575
An increase in GGBS content resulted in a reduction of the flow time plate cohesion yield 576
stress and plastic viscosity while the fluidity is improved This was due to the fact the specific 577
gravity of slag is lower than that of PC leading to an increase in the paste volume and thus 578
improving the fluidity of paste 579
In case of an increase of ANH proportion while WB and GGBS were kept constant it led to 580
an increased mini-slump and induced bleeding while the flow time plate cohesion yield stress 581
and plastic viscosity were reduced This was due to the lower reactivity of ANH resulting in an 582
increase of water needed for lubrication of paste 583
As expected an increase in WB lead to an increase in induced bleeding permeability and a 584
decrease in compressibility [33 35] This is due to the increase in liquid volume between the 585
particles and to the reduction in the amount of interparticle forces Globally the compressibility 586
decreases and the permeability increases with ANH It can be explained by the reduced specific 587
area and lower reactivity that can lead to more available water in the samples 588
3311 Heat of Hydration 589
Heat of hydration is considered an important factor in the cement design as low heat of 590
hydration reduces the effect of thermal cracking The heat flow results of the calorimeter test 591
performed over a three days period can be seen in Figure 13 592
GGBS = 70
034 036 039 042 0440
5
10
15
20
WB
AN
H (
)
46
48
50
52
54
56
58
60
WB = 039
0 5 10 15 2060
65
70
75
80
ANH ()
GG
BS
(
)
50
52
54
56
5860
62
26
593
Fig 13 Heat flow graphs for first 3 days of reaction 594
Figure 13 presents that the largest peaks were in mixes 1 2 5 and 6 This shows that these 595
reactions generated the most heat and that they were quick Mixes 1 and 2 have the highest 596
OPC content at 40 and this suggests that to lower the heat of the reaction minimal OPC 597
should be used This is confirmed by the fact that mixes 5 and 6 have the next highest OPC 598
contents the same percentage as mixes 3 4 and 9 (one of the repeated mixes) which have 599
anhydrite present This implies that the presence of anhydrite will lengthen the reaction process 600
and reduce the heat produced during setting significantly The graph shows this by the absence 601
of a sharp peak instead a gentle curved hump is shown over a 2-day period whereas the mixes 602
showing a sharp peak occur after about 12 hrs Mix 7 which has the same solids content as 603
mix 8 but a lower WB ratio and no cement present showed the lowest heat flow during the 604
hydration process 605
Figure 14 shows the cumulative heat generation during the first 3 days of setting It is clear that 606
the two mixes (1 and 2) with highest cement content and absence of anhydrite had the highest 607
cumulative heat development over the 3-day period 643J and 594J respectively Mixes 3456 608
and 9 which all have 20 OPC content generated similar heat value over the 3 days Results 609
of mixes containing ANH implies that over the period that the anhydrite did not reduce the 610
cumulative heat generated but slowed the reaction and reduce the peak heat generated The 611
0
0002
0004
0006
0008
001
0012
0 50000 100000 150000 200000 250000 300000
He
at F
low
(mW
)
Time s()
M1
M2
M3
M4
M5
M6
M7
M9
1Day
2Day
3day
1d 2d 3d
27
graphs also suggest that a higher WB ratio produced a lower cumulative and peak heat 612
generation613
614
Fig 14 Cumulative heat generation curves for first 3 days 615
3312 pH measurements 616
Fig 15 summarises the results of pH and the nine mixes with different compositions of WB 617
the percentages of cement GGBS and ANH It is shown that Supersulfated cements (SSCs) 618
have lower pH values (lt 125 at all ages) than PC which has a pH of 139 [41] making SSC 619
more preferable in essential applications such as nuclear waste encapsulation 620
The figure shows that the pH value decreased with time for all samples between 1 and 7 days 621
Similar trend was observed in the majority of mixes between 7 and 28 days except for sample 622
2 5 and 9 which showed slight increase in the pH values This decrease refers to the 623
consumption of ions in the pore structure due to the hydration process 624
0
100
200
300
400
500
600
700
800
0 50000 100000 150000 200000 250000 300000
(J)
Time (s)
M1
M2
M3
M4
M5
M6
M7
M9
1 Day
3 Day
2 day
1d 2d 3d
1
2
3
9
45
6
7
28
625
626 Fig 15 Summary of pore solution pH 627
628
The incorporation of ANH replacing the Portland cement (C) results in remarkable decrease in 629
pH at all ages as introducing the ANH reduced the lower initial pH Likewise the increase in 630
the content of GGBS led to a decrease in the pH value of the pore structure as GGBS has lower 631
initial pH than Portland cement The increase of WB ratio decreased the pH value This is in 632
agreement with Collier [41] who found that increasing the wb ratio from 05 to 06 increased 633
the pH by I unit This was attributed to the increased availability of water in the case of WB 634
of 06 allowing hydration of more cement powder thereby releasing more hydroxide anions 635
into solution However in this study the WB ratio did not show a significant effect on 636
lowering the pH These results are in agreement with [42] which also found that decreasing the 637
pH improved the bulk resistivity of SSC mixtures 638
3313 SEM 639
Figure 16 shows the SEM images of some mixes at various magnifications The images clearly 640
show the dense and compact structure of the cement after seven days The dense structure was 641
another requirement from the cement chosen to enclose the waste to prevent leaching The 642
microstructure consists mainly of C-S-H the main hydration product and unhydrated slag 643
grains C-S-H is formed after the dissolution of slag grains when contacting the water and 644
alkalis and then the ionic species saturate the solution and then precipitate as hydrated phases 645
[8] There were abundant grains of hydrated and partially hydrated slag grains some small 646
1080
1100
1120
1140
1160
1180
1200
1220
1240
1260
1280
1 2 3 4 5 6 7 8 9
pH
val
ue
Mix Number
1 Day
7 Days
28 Days
29
GGBS particles presented rims of reaction products (eg Mix 6-Figure 16 (f) and Mix 9-Figure 647
16 (h)) It was found by [11] that the composition of the reaction rims around slag was similar 648
to that of the C-S-H from PC However [12] found that in the CndashSndashH of SSC is apparently 649
more foil like which is different than the fibrillar morphology of C-S-H in OPC Mix 3 and 650
Mix 4 (Figure 16 (c) and (d) respectively) exhibits more micro voids in the micrsostructure 651
which could explain the low strength of these mixes compared to mix 1 and 2 Ettringite was 652
not detected Ettringite is not the most abundant phase and it is not easy to detect in dried 653
polished samples because it is easily decomposed under the drying conditions of the vacuum 654
of the microscope column [11] 655
(a) Mix 1 image at 1100 magnification (b) Mix 2 image at 900 magnification
(c) Particle of unreacted slag mix3 7 days (d) An overall image of mix 4 at 7days
showing CSH and BFS particles
30
(e) Mix 5 image at 1100 magnification (f) Mix 6 image at 2300 magnification
(g) Mix 7 image at 2000 magnification (h) Mix 9 image at 2700 magnification
Fig 16 SEM results 656
4 Conclusions 657
The paper focused on optimizing the SSC cement grout in order to get the best of it The effect 658
of GGBS WB and ANH dosages on the grout fluidity rheological properties induced 659
bleeding maximum heat of hydration and compressive strength was investigated using 660
factorial design approach and analysis The models derived in this study are valid for the 661
experimental area corresponding to grout mixes made with variable levels of WB ANH and 662
GGBS in the ranges of 034 to 044 0 to 20 by mass of binder 60 to 80 by mass of 663
binder respectively Based on the results from this study the following conclusions are drawn 664
- In comparison to GGBS and ANH WB ratio had more pronounced effects on the 665
results of mini-slump plate cohesion meter Marsh cone time yield stress plastic viscosity 666
induced bleeding permeability compressibility and compressive strength 667
31
- The increase in the dosage of GGBS led to an increase in the values of plate cohesion 668
meter Marsh cone time yield stress and plastic viscosity while reducing the mini-slump 669
values maximum hydration and compressive strength This is ascribed to the fine nature 670
of GGBS particles and pozzolanic effect 671
- While the ANH particles caused a decrease in the maximum of heat of hydration it 672
increased the induced bleeding permeability and compressibility due to its dominant effect 673
on increasing the dormant period and increasing the rates of solid sedimentation and 674
induced bleeding water 675
- Increasing the dosage of ANH in grout reduced the hydrations kinetic at early-age and 676
thus reduced the compressive strength at 1d 3d and 7d However this effect diminished 677
at later ages at 28 d in a manner similar to increasing WB 678
- The increase in the dosage of ANH led to an increase in the mini-slump values 679
(fluidity) but a decrease in the values of yield stress plastic viscosity plate cohesion and 680
Marsh cone time This is attributed to better deflocculation of particles at the fresh state 681
- The increase of GGBS percentage delayed the reaction process and decreased the total 682
heat after 3 days while WB slightly reduced the total heat it didnrsquot significantly affect the 683
reaction process 684
- pH measurements in the present study confirmed the suitability of these mixture to low-685
pH applications as the increase in both the GGBS and ANH markedly decreased the initial 686
pH thereby lowering the pH at different ages 687
- The modelling and prediction of the response of other points in the experimental domain 688
were therefore possible Although the models are based on a given set of materials they 689
can be easily used to generate future results using other materials 690
- Dense microstructure was observed for mixes examined in this study C-S-H is the main 691
reaction product with presence of unreacted slag grains embedded well in the structure 692
However some micro voids were observed in mixes containing ANH which led to lower 693
compressive strength of mixes with ANH 694
CRediT authorship contribution statement 695
MSonebi and YBai did the conceptualization and the design of investigation as well as 696 performing the experiments MSonebi carried out the software analysis of the results and the 697
32
visualization MSonebi AAbdalqader T Fayyad and APerrot analysed the results and 698 wrote the original draft and reviewed and edited the final version 699
Declaration of Competing Interest 700
The authors declare that they have no known competing financial interests or personal 701 relationships that could have appeared to influence the work reported in this paper 702
Acknowledgments 703
The authors would like to express their gratitude to P McCann from QUB and N Collier 704 from Eden Nuclear and Environment Ltd for their helps for some experiments 705
706
References 707
1 Schneider M Romer M Tschudin M Bolio H (2011) Sustainable cement production-708 present and future Cement and Concrete Research 41642ndash650 709
httpsdoiorg101016jcemconres201103019 710
2 Madlool NA Saidur R Hossain MS Rahim NA (2011) A critical review on energy use 711 and savings in the cement industries Renewable and Sustainable Energy Reviews 712
152042ndash2060 httpsdoiorg101016jrser201101005 713
3 EN15743 (2015) BS EN 157432010+A12015 Supersulfated cement - Composition 714
specifications and conformity criteria BSI 715
4 Khatib JM Wright L Mangat PS (2016) Mechanical and physical properties of concrete 716
containing FGD waste Magazine of Concrete Research 68550ndash560 717 httpsdoiorg101680macr1500092 718
5 Khatib JM Mangat PS Wright L (2008) Sulfate resistance of mortar containing 719
simulated FGD waste Proceedings of Institution of Civil Engineers Construction 720 Materials 161119ndash128 httpsdoiorg101680coma20081613119 721
6 (2020) Specifying Sustainable Concrete 722
7 Hewlett PC (2004) Learsquos Chemistry of Cement and Concrete fourth edi Elsevier 723 Science amp Technology Books Oxford 724
8 Gruskovnjak A Lothenbach B Winnefeld F et al (2008) Hydration mechanisms of 725 super sulphated slag cement Cement and Concrete Research 38983ndash992 726
httpsdoiorg101016jcemconres200803004 727
9 Grounds T Nowell D V Wilburn FW (2003) Resistance of supersulfated cement to 728 strong sulfate solutions Journal of Thermal Analysis and Calorimetry 72181ndash190 729
httpsdoiorg101023A1023928021602 730
10 Grounds T Nowell D V Wilburn FW (1995) The influence of temperature and 731
different storage conditions on the stability of supersulphated cement Journal of 732 Thermal Analysis 45385ndash394 httpsdoiorg101007BF02548772 733
33
11 Bazalduacutea-Medelliacuten ME Fuentes AF Gorokhovsky A Escalante-Garciacutea JI (2015) Early 734 and late hydration of supersulphated cements of blast furnace slag with fluorgypsum 735 Materiales de Construccion 65e043 httpsdoiorg103989mc201506013 736
12 Matschei T Bellmann F Stark J (2005) Hydration behaviour of sulphate-activated slag 737 cements Advances in Cement Research 17167ndash178 738
httpsdoiorg101680adcr2005174167 739
13 Richardson IG (2000) Nature of the hydration products in hardened cement pastes 740 Cement and Concrete Composites 2297ndash113 httpsdoiorg101016S0958-741 9465(99)00036-0 742
14 Baux C Phelipot-Mardeleacute A Lanos C et al (2013) PERFORMANCES OF SUPER 743 SULFATED CEMENTS In International Conference on Concrete Under Severe 744 Conditions pp 1857ndash1870 745
15 Annabelle Phelipot-Mardeleacute Gabriel Samson Christophe Lanos (2015) Super sulfated 746 cement formulation and uses In Construction Materials ConMat Whistler Canada 747
16 Milestone NB (2006) Reactions in cement encapsulated nuclear wastes need for 748 toolbox of different cement types Advances in Applied Ceramics 10513ndash20 749
httpsdoiorg101179174367606X81678 750
17 Batchelor B (2006) Overview of waste stabilization with cement Waste Management 751
26689ndash698 httpsdoiorg101016JWASMAN200601020 752
18 Zhang T Cheeseman CR Vandeperre LJ (2011) Development of low pH cement 753
systems forming magnesium silicate hydrate (MSH) Cement and Concrete Research 754 41439ndash442 httpsdoiorg101016jcemconres201101016 755
19 Mobasher N Bernal SA Provis JL (2016) Structural evolution of an alkali sulfate 756
activated slag cement Journal of Nuclear Materials 46897ndash104 757 httpsdoiorg101016JJNUCMAT201511016 758
20 Wang J Yu B Gao Y (2014) Hydration Characteristics of Super Sulphated Cement 759 with Different Fineness In Proceedings of the International Conference on Material 760 and Environmental Engineering (ICMAEE 2014) Atlantis Press Paris France 761
21 Naumlgele E (1986) The Zeta-potential of cement Part II Effect of pH-value Cement and 762 Concrete Research 16853ndash863 httpsdoiorg1010160008-8846(86)90008-6 763
22 Jain N Civil MG-IJ of M and 2015 U (2015) Formulation of Sulphate Resistant Super 764 Sulphated Cement Using Fluorogypsum and Granulated Blast Furnace Slag IOSR 765
Journal of Mechanical and Civil Engineering (IOSR-JMCE) 12153ndash159 766
23 Gao YX Yu BY Xu FL (2012) Effect of Modified Phosphogypsum on the Mechanical 767 Properties of Super Sulphate Cement Applied Mechanics and Materials 161264ndash268 768 httpsdoiorg104028wwwscientificnetAMM161264 769
24 Kantro D (1980) Influence of Water-Reducing Admixtures on Properties of Cement 770 PasteampmdashA Miniature Slump Test Cement Concrete and Aggregates 295ndash102 771
httpsdoiorg101520CCA10190J 772
34
25 Svermova L Sonebi M Bartos PJM (2003) Influence of mix proportions on rheology of 773 cement grouts containing limestone powder Cement and Concrete Composites 25737ndash774 749 httpsdoiorg101016S0958-9465(02)00115-4 775
26 Sonebi M (2006) Rheological properties of grouts with viscosity modifying agents as 776 diutan gum and welan gum incorporating pulverised fly ash Cement and Concrete 777
Research 361609ndash1618 httpsdoiorg101016JCEMCONRES200605016 778
27 Nehdi M Rahman M (2004) Effect of Geometry and Surface Friction of Test Accessory 779 on Oscillatory Rheological Properties of Cement Pastes ACI Materials Journal 780 101416ndash424 httpsdoiorg101435913428 781
28 Khayat KH Yahia A (1997) Effect of Welan Gum-High-Range Water Reducer 782 Combinations on Rheology of Cement Grout ACI Materials Journal 94365ndash372 783 httpsdoiorg1014359321 784
29 Lombardi G (1985) THE ROLE OF COHESION IN CEMENT GROUTING OF 785 ROCK In Proceedings of Fifteenth Congress on Large Dams International 786 Commission on Large Dams pp 235ndash261 787
30 Perrot A Rangeard D Picandet V Meacutelinge Y (2013) Hydro-mechanical properties of 788
fresh cement pastes containing polycarboxylate superplasticizer Cement and Concrete 789 Research 53221ndash228 httpsdoiorg101016JCEMCONRES201306015 790
31 Perrot A Lecompte T Khelifi H et al (2012) Yield stress and bleeding of fresh cement 791 pastes Cement and Concrete Research 42937ndash944 792
httpdxdoiorg101016jcemconres201203015 793
32 Sonebi M Perrot A (2019) Effect of mix proportions on rheology and permeability of 794 cement grouts containing viscosity modifying admixture Construction and Building 795
Materials 212687ndash697 httpsdoiorg101016jconbuildmat201904022 796
33 Picandet V Rangeard D Perrot A Lecompte T (2011) Permeability measurement of 797
fresh cement paste Cement and Concrete Research 41330ndash338 798 httpsdoiorg101016JCEMCONRES201011019 799
34 Perrot A Rangeard D (2017) Effects of mix design parameters on consolidation 800
behaviour of fresh cement-based materials Materials and Structures 50117 801 httpsdoiorg101617s11527-016-0988-0 802
35 Rangeard D Perrot A Picandet V et al (2015) Determination of the consolidation 803 coefficient of low compressibility materials application to fresh cement-based 804
materials Materials and Structures 481475ndash1483 httpsdoiorg101617s11527-014-805 0247-1 806
36 Massoussi N Keita E Roussel N (2017) The heterogeneous nature of bleeding in 807 cement pastes Cement and Concrete Research 95108ndash116 808 httpsdoiorg101016JCEMCONRES201702012 809
37 Montgomery D (2007) Design and Analysis of Experiments Second Edition John 810
Wiley amp Sons 811
35
38 Roussel N Stefani C Leroy R (2005) From mini-cone test to Abrams cone test 812 Measurement of cement-based materials yield stress using slump tests Cement and 813 Concrete Research 35817ndash822 httpsdoiorg101016jcemconres200407032 814
39 Mangat PS Khatib JM Wright L (2006) Optimum utilisation of FGD waste in blended 815 binders Proceedings of Institution of Civil Engineers Construction Materials 159119ndash816
127 httpsdoiorg101680coma20061593119 817
40 Khatib JM Mangat PS Wright L (2013) Early age porosity and pore size distribution of 818 cement paste with flue gas desulphurisation (FGD) waste Journal of Civil Engineering 819 and Management 19622ndash627 httpsdoiorg103846139237302013793609 820
41 Collier NC Milestone NB Gordon LE Ko SC (2014) The suitability of a supersulfated 821 cement for nuclear waste immobilisation Journal of Nuclear Materials 452457ndash464 822 httpsdoiorg101016jjnucmat201405078 823
42 Masoudi R (2018) Examining compositions hydration mechanisms and properties of 824 supersulfated cement for use in concrete by Examining compositions hydration 825 mechanisms and properties of supersulfated cement for use in concrete University of 826 Toronto 827
828
2
Highlights 32
bull SSC presents a promising option to encapsulate nuclear waste material 33
bullThe constituents effect on SSC groutsrsquo properties was studied and modelled 34
bullFactorial design is a powerful tool for optimizing the mixture proportions of SCC 35
bullWB had the highest influence on most of the parameters tested 36
1 Introduction 37
Ancient concrete as well as more recent concrete materials reinvented in the nineteenth century 38
have performed well in the past However over recent decades a great challenge had emerged 39
regarding ensuring efficient consumption of natural resources and hence there was a pressure 40
to make construction industry more sustainable Concrete is widely used within the 41
construction industry and contributes to a large extent to the global energy consumption and 42
carbon emission due to the energy intensity and CO2 emissions associated with cement 43
production So the industry was looking for ways to become more sustainable [1] This has 44
resulted in a high demand for new types of cement possessing improved qualities including 45
strength toughness and durability as well as being environmentally friendly 46
Cements made of industrial waste materials and by-products emerged as one of the sustainable 47
options to traditional Portland cement (PC) because it is mainly manufactured using waste and 48
by-products that require little processing making the embodied energy and emissions 49
associated with the production process low Besides its environmental benefits such materials 50
has a great versatility depending on their components and they can be tailored to make them 51
suitable for a wide range of applications in the structures industry [2] 52
One of these environmentally friendly cements that was used during the last decades is the 53
supersulfated cement (SSC) which is a cementitious system composed of ground granulated 54
blast furnace slag (GGBS) that is activated by a sulphate source such as gypsum hemihydrate 55
or anhydrite [3] Wastes of semi-dry and dry flue gas desulpherisation (FGD) can be used as 56
source of sulphate [4 5] SSC has great advantages that make it attractive for use firstly it is 57
mainly manufactured using by-products and industrial wastes Secondly it has lower CO2 58
emissions compared to PC because clinker burning is reduced The estimated embodied CO2 59
of GGBS is 796 kgCO2tonne which is 10 times lower than that of Portland cement (CEM 1) 60
at 860 kgCO2tonne [6] Besides that SSC produces much lower heat than PC and also SSC 61
3
has superior resistance to chemically aggressive environments such as sulfates Due to the 62
glassy nature of GGBS composed mainly of monosilicates GGBS easily dissolves in low to 63
mild alkaline solutions However it is required that the alumina content (Al2O3) of slag to be 64
no less than 13 to be used effectively in SSC [7] The most commonly used sources of 65
sulphate is anhydrite because it has lower solubility rate than other sources [8 9] To promote 66
the dissolution of slag PC is added because its hydration yields the formation of calcium 67
hydroxide (CH) which provides the required alkaline environment for slag dissolution Once 68
the slag is dissolved the released aluminium silicon and calcium ions from slag glass react 69
with the calcium sulfate present in the mixture to form two main hydration products ettringite 70
(C6A3H32) and calcium silicate hydrate (C-S-H) [10] Ettringite provides the early strength to 71
SSC mixtures contributing to the strength development while C-S-H is responsible for later 72
strength and the continual increase of strength over time [11 12] C-S-H formed in SSC has a 73
CaSi ratio between 10 and 12 which is much lower than that formed in PC mixtures [13] 74
This means that the chemical composition of slag plays a significant role on the strength 75
development dissolution of the slags and the amount of hydration products formed 76
After being used for long time in construction for special structures currently SSC is very 77
rarely used and no longer produced in some areas According to Baux et al [14] this happened 78
because of its lack of reactivity Grounds et al [10] believed that this is because there is 79
uncertainty over some of its properties which include its long-term stability and durability One 80
of their main concern surrounding SSC is due to the hydration product ettringite or tri-81
sulphoaluminate which is known to be unstable in Portland cement and has been found to be 82
expansive in certain environments Phelipot-Mardeleacute et al [15] state that this could be because 83
generally cement made with blast furnace slag tends to harden more slowly than mortar and 84
concrete made from PC 85
The nuclear power is a promising option for the future in the UK and the world in general 86
however the nuclear waste is still an obstacle in its way to be a vital option for the future and 87
to gain public acceptance [16] This can be achieved by making the contaminants to be less 88
mobile or less toxic by lsquowaste stabilizationrsquo that results in converting the contaminants from 89
the dissolved phase to a solid phase by reactions such as precipitation sorption or substitution 90
This prevents the waste from diffusion to the external environment [16 17] Most applications 91
of stabilization are cement-based where the cement forms a low permeability matrix and where 92
the contaminant is incorporated into hydrated phases and then precipitated due to the prevailing 93
pH in the pore solution [18] This means that the efficiency of the process depends on the 94
4
prevailing pH The pH resulting from cement hydration results in many metal contaminants 95
forming hydroxide or mixed hydroxide solids [17] Portland cement will tend to result in a 96
higher pH while combining it with lime as well as fly ash blast furnace slag and other 97
pozzolanic binders will result in lower pH The interactions of these binders with waste 98
components determine the extent of treatment [18] 99
There is a lack of data detailing the assessment criteria and performance of nuclear 100
encapsulation groutconcrete However general requirements of a cementitious system for 101
encapsulation can be summarised as follows an ability to incorporate waste and harden 102
fluidity of initial cemented mix and potential for remote mixing low permeability resistance 103
to water low temperature rise on setting workable setting time low free or unbound water 104
when setting reaction is complete low internal pH to avoid ongoing reactions such as 105
corrosion long term durability [16] 106
The solubility of many heavy metals is low at low pH and therefore low pH cements such as 107
SSC are likely to be particularly desirable cements for nuclear waste management [16ndash19] 108
This would help to make the nuclear energy as a clean and a safe source of energy a promising 109
alternative for future generations This again has highlighted some of the noteworthy 110
properties of the SSC where not only the pH value that makes SSC a promising option that 111
could be used to encapsulate nuclear waste material for disposal Also the heat of hydration in 112
supersulfated cement is much lower than that of OPC and therefore the heat gradient created 113
during hydration between the internal and external surfaces would not be as great and thus less 114
stress caused and less chance of cracking which would be unacceptable with nuclear waste 115
disposal It has high non-evaporable water content that is itrsquos chemically bonded to the silica 116
Besides that it has a good durability in aggressive environments such as structures exposed to 117
seawater or sulfate-bearing groundwater [9 14 15 20ndash22] 118
These technical and environmental benefits have re-simulated recent research on this type of 119
cement and brought the attention for re-investigating overcoming its drawbacks to offer a green 120
cement for very essential applications 121
Currently different researches are being carried out on SSC in order to optimize the usage of 122
SSC Many researchers have examined its various mixture compositions to determine the best 123
compositions for some desirable properties such as strength low permeability faster setting 124
time etc A research on slags activated with 15ndash20 calcium sulfate showed a higher 125
compressive strength in comparison with other mixtures when they examined slags classified 126
5
as low-lime high-alumina and when various SSC mixture compositions were examined with 127
70ndash85 slag 10-25 anhydrite and 5 Portland cement for alkali activation [15] 128
Gruskovnjak et al [8] investigated the effect of alumina content in the slag by examining two 129
types of slag with a high Al2O3 percentage content (12) and low Al2O3 percentage content 130
(77) The findings of their study showed that slag with high alumina contents produced more 131
ettringite and higher strength This was attributed to the higher dissolution rate of high alumina 132
slag SSC hydration characteristics with different fineness has also been investigated [20] It 133
showed that when sample particles become finer the compressive strength is significantly 134
higher Also there is some work which has been done on modifying the mechanical properties 135
of SSC with addition phosphogypsum [19 23] Recently the influence of curing temperature 136
was studied for supersulfated cements made with two slags having different chemical 137
compositions [20] It was found that SSC made with high-alumina slag resulted in higher 138
strengths and presented a more complex mechanism of hydration that was strongly influenced 139
by the solubility of anhydrite This is also being shown in [21] where the SSC made using high-140
alumina slag exhibited higher compressive strength and the use of higher activator contents 141
decreased the compressive strength 142
Based on recent researches and the fact that there are many factors and parameters involved in 143
the composition of SSC there is a demanding need for optimizing the cement grout in order to 144
effectively utilise it to fit for purpose The current paper aligns with this demand The effect of 145
GGBS water-to-binder ratio WB and anhydrite dosages on the grout fluidity rheological 146
properties induced bleeding fresh state permeability and compressibility maximum heat of 147
hydration and compressive strength will be investigated using factorial design approach and 148
analysis Although there is some research on SSC little research work has focused on 149
modelling the effects of the various parameters using a statistical approach Factorial design is 150
a powerful tool and widely used in experiments involving many factors It can be utilised to 151
study the joint effect of factors on responses or dependent variables and to develop models 152
applicable to design and development of experiments Simulation of models obtained with 153
factorial design can facilitate the test protocol needed to optimize cement grout within a given 154
set of performance criteria 155
6
2 Experimental Programme 156
21 Materials and Test Methods 157
The grout mixes investigated in this study were prepared with Standard CEM I 425N Portland 158
cement (PC) specified by BS EN 197-1 The ground granulated blast furnace slag (GGBS) in 159
accordance to BS EN 15167-2 was used The chemical composition of CEM I and GGBS are 160
provided in Table 1 Anhydrite (ANH) was used as the source of sulphate in the present study 161
and it was partially or completely replaced the PC The proportions of the grout mixes are 162
shown in Table 2 163
164
Table 1 Chemical and physical properties of cement and GGBS 165
Chemical analysis Material
CEM I GGBS
SiO2 () 2101 3518
Al2O3 () 492 1396
Fe2O3 () 284 025
MgO() 220 818
CaO () 6452 4121
Na2O () 020 019
K2O () 071 042
SO3 () 253 --
P2O5 () 011 --
LOI () 126 064
Physical analysis
Specific gravity 308 291
Specific surface area [m2kg] 360 600
166
Table 2 Mix proportions for the grouts used in the factorial design 167
Mix
No
Code WB
Percentage ()
WB GGBS ANH GGBS ANH
M1 -1 -1 -1 034 60 0
M2 1 -1 -1 044 60 0
M3 -1 1 -1 034 60 20
M4 1 1 -1 044 60 20
M5 -1 -1 1 034 80 0
M6 1 -1 1 044 80 0
M7 -1 1 1 034 80 20
M8 1 1 1 044 80 20
M9 0 0 0 039 70 10
M10 0 0 0 039 70 10
M11 0 0 0 039 70 10
M12 0 0 0 039 70 10
168
7
All grout mixes were prepared in 2 L batches using a high-shear mixer with a 45 L capacity 169
The mixing water was kept at 98 plusmn 02 ordmC to compensate for heat generated during mixing 170
The cement and GGBS were mixed with ANH in a sequence that started with adding all of the 171
water into the mixer After one minute the binder was gradually introduced The grout was 172
mixed for one minute followed by 30 seconds of rest Subsequently the grout was mixed again 173
for 2 min at a high speed (285 rpm) and for 1 min at the low speed (140 rpm) 174
For all tests the timing is given from zero time ie the time when the cement particles first 175
touch the mixing water The mini-slump flow test started at 7 min (immediately after the end 176
of mixing) The transparent cone-shaped mould described elsewhere [24] was placed in the 177
centre of a smooth Plexiglas plate After filling with grout the cone was gently lifted 178
(approximately 30 s after placement of the grout) When the flow stopped the spread of the 179
grout was measured with a ruler in two perpendicular directions 180
Marsh cone test was carried out using a metal cone with an orifice diameter of 10 mm and 181
started at 8 plusmn 1 min One litre of grout was poured into the cone The conersquos orifice was opened 182
15 s after pouring the cement grout into the cone The time taken for each 100 ml of grout to 183
flow through the orifice was recorded and the measurements were completed upon collecting 184
700 ml of grout 185
The viscosity of cement grout was determined using a coaxial rotating cylinder viscometer 186
Fann (smooth cylinders no serration) that determined apparent viscosity at different shear 187
rates The test was contained in the annular space between an outer cylinder (rotor) with a 188
radius of 18415 mm and a bob with a radius of 17245 mm and a height of 380 cm The rotor 189
and bob were plunged into a cup containing 350 ml of sample grout Viscosity measurements 190
were made when the outer cylinder rotating at a known speed caused a viscous drag to be 191
exerted by the fluid This drag created a torque on the bob which was transmitted to a precision 192
spring where its deflection was measured and compared with test conditions and the 193
instrumentrsquos constants The measurement was made for 12 rotor speeds from 09 rpm to 600 194
rpm where the viscometer reading values () were recorded The value of shear stress (Pa) 195
was calculated by including k1 torsion constant of spring per unit deflection (N-cmdegree) 196
k2 shear stress constant for the effective bob surface (cm-3) and k3 shear rate constant [s-1rpm] 197
[25 26] 198
Rotor speed was increased step by step and the viscometer readings were recorded with 199
increasing rotation speeds The reading was taken when the needle in the viscometer was 200
8
stabilised or 30 seconds after the change of speed in cases when the needle had not stabilised 201
due to the thixotropy of the cement grout The time of reading was generally between 5 and 202
10 seconds 203
In this study the down-curve was chosen for final evaluation because it offered a better 204
description of the rheological behaviour of the grouts including a structural breakdown 205
phenomenon of inner forces among particles [27] The values of shear yield stress (the 206
minimum shearing stress required for the fluid to start flowing) and plastic viscosity used the 207
modified Bingham model [28] and are expressed as follows 208
2
0 cp (1) 209
Where τ0 is yield stress (Pa) μp is plastic viscosity (Pas) is shear rate (s-1) and c is a 210
constant 211
The cohesion of grout was determined at 30 plusmn 1 min with a Lombardi plate cohesion meter 212
[29] A thin galvanized steel plate (100times100times1 mm) was immersed in the grout and hung on a 213
stand placed on an electronic balance The weight of the grout still present on the plate was 214
recorded when the dripping of the grout had stopped This test was followed by the fresh 215
density measurement of the grout with a mud balancer Knowing the fresh density of the grout 216
it was possible to calculate the thickness on each side of the plate 217
The resistance of the fresh grout to induced bleeding was evaluated using a pressure filter The 218
equipment consists of a pressure vessel filter paper which is placed on a sieve and a graduated 219
cylinder A 200 ml grout sample is placed in the pressure vessel After closing the cell the 220
graduated cylinder is placed under the outlet of the cell The cell is pressured by compressed 221
air to 055 MPa The volume of water going out through the outlet on the bottom of the cell is 222
recorded at 15 and 30 s then at every minute up to 10 min and then at every 5 min up to 30 min 223
[25] 224
Considering homogeneous bleeding the results of the induced bleeding tests allow to derive 225
the evolution of the permeability of the sample during its compaction under the applied 226
pressure The permeability of the material is directly linked to the bleeding rate during the 227
material consolidation until the tested material is able to sustain the applied pressure [30 31] 228
It refers to the material ability to slow down the water filtration process 229
The measurement of the flow water allows to compute instantaneous WB ratio and makes it 230
possible to link it with the computed instantaneous permeability at a given time of the test [32ndash231
9
34] I The water flow is computed by dividing the variation of the measured water mass flowing 232
out the samples by the elapsed time between two successive data sampling In this study value 233
of permeability at 1 and 30 minutes are taken and compared It corresponds to the initial and 234
final permeability of the mixes 235
The material compressibility is considered in a soils mechanics way [30 35] It corresponds to 236
the ratio of the variation of void ratio (liquidsolid volume ratio) to the variation of logarithm 237
of applied pressure between the initial and the final state of the induced bleeding test It 238
provides the equilibrium state of the sample under a given applied pressure and is valid for 239
both homogeneous and heterogeneous bleeding [36] 240
It is worth noting that the computed permeability describes homogeneous bleeding kinetics 241
while compressibility describes the amplitude of the bleeding phenomenon 242
Heat of hydration was evaluated by isothermal calorimetry with an eight-channel heat 243
conduction calorimeter maintained at 22degC This equipment measures heat evolved by 244
comparing the temperatures of a grout sample and an inert reference which are both held under 245
isothermal conditions The heat flow results are recorded as a function of time CEM I GGBS 246
and ANH were blended manually for 30 s After the addition of water the grout was blended 247
10 s by hand and then an additional 50 s mechanically Polyethylene ampoules were filled with 248
approximately 6 g of each grout and the experiments were conducted for at least 72 h 249
The compressive strength of the grout was determined by crushing three cubes of 50 mm size 250
After casting the samples were covered with a polymer sheet (a cling film) to limit evaporation 251
of water and stored in a conditioning room at 20 plusmn 2 degC for 24 plusmn 05 hours Afterwards cubes 252
were demoulded and placed in water at 20 plusmn 1 degC until tested at 1 3 7 and 28days 253
In order to perform the pH test a powder sample of the hardened mixes was required The test 254
was performed on 1 7 and 28 day samples As mixes 9-12 are of identical composition the 255
reason is explained later in 41 derived statistical model tests were only performed on sample 256
10 To get the powder with a fineness of 65μm the samples were firstly drained of the acetone 257
To remove any remaining acetone they were placed in a vacuum desiccator The pieces were 258
then ground using a mortar and pestle passed through a 65 μm sieve placed in sample bags 259
and returned to the desiccator The samples had then to be mixed with distilled water to enable 260
the pH test to be performed A 110 ratio of cement to water was used and mixed for 24 hours 261
using a rotating machine To get the pH reading the samples were put into a centrifuge machine 262
to separate the solid and liquid At this stage the solution should have a pH equivalent to cement 263
10
it was mixed with To get a pH reading for the samples a pH device was used where a probe 264
is placed in the solution The machine was calibrated with three buffer solutions of 7 10 and 265
13 pH levels before measuring the pH of the samples 266
SEM (scanning electron microscopy) was carried out using a JEOL JSM6400 on flat fractured 267
surface specimens obtained from compression testing at 7-day samples Prior to SEM testing 268
the samples were mounted onto metal stubs using carbon paste and coated with gold film to 269
ensure good conductivity The accelerated voltage was set at 20 kV 270
22 Statistical Design and Modelling of Experiments 271
The technique of analysis used in this study was a 2k factorial experimental design [37] to 272
evaluate the influence of two different levels (maximum and minimum) for each variable on 273
the relevant grout properties Three key parameters (WB ANH GGBS) that should have 274
significant influence on mix characteristics of supersulfated cements were selected to formulate 275
the mathematical models for evaluating relevant properties (ie k = 3 in this study thus the 276
total mixes for the factorial design was 23 = 8) Additionally a mix at the central point was 277
replicated four times to estimate the experimental error and improve the reliability of the 278
models The coding and levels of the variables (WB and dosages of GGBS and ANH) are 279
given Table 2 280
The statistical models are valid for supersulfated grout (SSC) mixes made with WB GGBS 281
and ANH in the ranges of 034 to 044 60 to 80 and 0 to 20 respectively The modelled 282
experimental region consisted of mixtures ranging from coded variables of ndash1 to +1 The coded 283
factors for variables were calculated by 284
Coded Factor = (Actual value-Factor means)[Range of factor value2] (2) 285
Hence 286
Coded WB = (Actual WB ndash 039)005 287
Coded GGBS = (Actual GGBS ndash 07)01 288
Coded Anhydrite = (Actual ANH ndash 01)01 289
The responses modelled were mini-slump plate cohesion Marsh cone yield stress plastic 290
viscosity induced bleeding at 1 min 5 and 30 mins permeability at 1 min and 30 mins 291
compressibility and compressive strength at 1 3 7 and 28 days The general model associated 292
11
with the two-level factorial design incorporating three independent variables (WB GGBS 293
ANH) is expressed by 294
Y1 = a0 + a1WB + a2GGBS + a3ANH+ a4WBGGBS + a5WBANH + a6GGBSANH 295
+ a7WBGGBSANH + ε (3) 296
where 297
Y1 Response (mini slump marsh cone plate cohesion etc) 298
a0 Overall mean factor effect 299
a1-a7 Regression coefficients representing model constants (contribution of independent 300
variables and their interaction to each response) 301
a1WB a2GGBS a3ANH Linear effect of factors WB GGBS and ANH 302
a4WBGGBS a5WBANH a6GGBSANH a7WBGGBSANH Interaction effects of 303
factors WB GGBS and ANH 304
ε Random error term representing the effects of uncontrolled variables 305
Analysis of variance (ANOVA) was used to test the significance of regression models and t-306
tests were performed to identify the non-significant (NS) variables and second order 307
interactions which were subsequently eliminated from the derived models Model coefficients 308
were determined using multi-linear regression analysis based on a normal distribution 309
assumption The error was assumed to be random and normally distributed so the residual 310
terms which represent the difference between the actual and predicted values should exhibit 311
similar properties [37] The probability value (Prob) obtained from ANOVA determines the 312
statistical significance of each factor and their interactions For most of the parameters the 313
probability that the derived coefficients associated with the various variables influencing each 314
response were limited to 10 This signifies that there is less than 10 chance or 90 315
confidence limit that the contribution of a given parameter to the tested response exceeds the 316
value of the specified coefficient A negative estimate indicates that an increase of the given 317
parameter results in a reduction of the measured response 318
12
3 Results and discussion 319
The results of the experimental work characterize the behaviour of the mortars with different 320
WB ANH and GGBS levels Table 3 summarises all results of the experimental work 321
performed The results were used to construct the regression models 322
Table 3 Average results from experimental work 323 324
Viscometer Induced bleeding
Mix Mini-
slump
Flow
time
Cohesion
meter
Yield
value
Plastic
viscosity
1min 5min 30min
(mm) (s) (mm) (Pa) (Pas) (mL) (mL) (mL)
1 61 230 105 191 0923 220 470 480
2 89 25 55 97 0323 290 780 810
3 67 200 118 172 0802 280 580 605
4 111 12 20 80 0199 490 860 860
5 52 360 143 251 1203 280 520 540
6 83 69 86 99 0403 360 700 700
7 60 250 125 211 0980 310 580 590
8 110 13 40 77 0224 350 910 950
9 71 150 87 101 0617 370 720 730
10 73 102 122 106 0681 290 620 620
11
12
77
74
192
83
89
110
124
101
0660
0641
290
350
640
715
645
720
325
Table 3 Average results from experimental work (continued) 326
Mix Permeability Permeability Compre-
ssibility
Compressive strength
1 min 30 min fc 1d fc 3d fc 7d fc 28d
(ms) (ms) (MPa) (MPa) (MPa) (MPa)
1 216E-09 317E-09 0155 299 506 581 704
2 512E-08 418E-09 0298 168 383 547 558
3 448E-08 366E-09 0194 213 334 406 527
4 374E-08 425E-09 0312 140 223 256 408
5 448E-08 342E-09 0173 233 434 507 535
6 512E-08 395E-09 0255 136 371 371 448
7 440E-08 361E-09 0187 108 232 343 532
8 451E-08 433E-09 0342 68 200 263 473
9 446E-08 402E-09 0250 196 328 398 592
10 468E-08 371E-09 0212 171 232 361 556
11
12
423E-08
516E-08
379E-09
400E-09
0221
0246
207
183
313
301
451
435
565
520
327
The derived quadratic statistical models of grout for mini-slump flow time cohesion plate 328
yield stress plastic viscosity induced bleeding at 1 min 5 min and 30 min permeability at 1 329
13
min and 30 min compressibility and compressive strength at 1 3 7 and 28 days are given in 330
Equations (4) to (18) where WB GGBS and ANH are given in codes values 331
Mini-Slump (mm) = 7881 + 1919 WB + 781 ANH + 444 WBANH - 294 GGBS (4) 332
333
Marsh flow time (s) = 1404 - 1153 WB ndash 261 ANH + 281 GGBS (5) 334
335
Plate Cohesion meter (microm) = 86 - 366 WB + 122 GGBS - 107 ANH - 091 WBANH (6) 336
337
Yield Value (Pa) = 1466 ndash 584 WB - 126 WBGGBS - 125 ANH + 124 GGBS (7) 338
339
Plastic Viscosity (Pas) = 063 - 034 WB - 0078 ANH + 0073 GGBS 340
- 0047 WBGGBS - 0022 ANHGGBS (8) 341
342
Induced Bleeding at 1 min (ml) = 3225 + 50 WB + 35 ANH ndash 225 WBANHGGBS (9) 343
344
Induced Bleeding at 5 mins (ml) = 675 + 1375 WB + 575 ANH (10) 345
346
Induced Bleeding at 30 mins (ml) = 6919 + 1381 WB + 594 ANH (11) 347
348
Permeability at 1 min (ms) x 10-8 = 4 + 0615 WB + 0621 AHN ndash 0773 WBGGBS 349
- 0426WBAHN - 0446 AHNGGBS (12) 350
351
Permeability at 30 min (ms) x 10-8 = 0382 + 0035 WB + 0014 ANH 352
+ 0008 WBANHGGBS (13) 353
354
Compressibility = 02396 + 00623 WB + 00194 ANH + 00012 WBANHGGBS (14) 355
356
ƒc 1 d (MPa) = 1705 - 426 WB - 384 ANH - 343 GGBS + 145 WBANH (15) 357
358
ƒc 3 d (MPa) = 3215 - 879 ANH - 412 WB ndash 261 GGBS (16) 359
360
ƒc 7 d (MPa) = 4092ndash 924 ANH - 5 WB - 383 GGBS (17) 361
362
14
ƒc 28 d (MPa) = 5348 - 515 WB - 382 ANH ndash 262 GGBS + 436 ANHGGBS (18) 363
364
The correlation coefficient of most of the proposed models were higher than 090 except for 365
plastic viscosity compressive strength after 3days and compressive strength after 28days 366
which have coefficients of 070 086 and 087 respectively 367
Table 4 shows the average measured responses of the four replicate grouts the coefficients of 368
variation (COV) as well as the estimated errors with a 90 confidence limit for each of the 369
measured properties The estimated error levels for mini-slump plate cohesion meter Marsh 370
cone yield stress plastic viscosity induced bleeding at 1 min 5 min and 30 mins permeability 371
at 1 min and 30 min compressibility and compressive strengths at 1 3 7 28 days were plusmn 22 372
mm plusmn 0001mm plusmn 40 s plusmn 09 Pa plusmn 002 Pa s plusmn 28 ml plusmn 42 ml plusmn 45 ml plusmn 32x10-9 (ms) 373
plusmn 13x10-10 (ms) plusmn 00153 plusmn 13 MPa plusmn 35 MPa plusmn 33 MPa and plusmn 25 MPa respectively 374
The relative experimental errors for mini-slump plate cohesion meter Marsh cone yiled stress 375
plastic viscosity induced bleeding permeability compressibility compressive strengths were 376
limited to 3-11 On the other hand relative error for march cone was up to 30 377
Table 4 Repeatability of test parameters at the central point 378
379
Tests Mini-
slump
Plate
cohesion
Marsh
cone
Yield
stress
Plastic
viscosit
y
Induced
bleeding
at 1 min
Induced
bleedin
g at 5
min
Induced
bleeding
at 30
min
Mean (n=4) 736
mm
001
mm
1318
s
108
Pa
065
Pa s
325
ml
674
ml
679
ml
Coefficient
of variation
()
37 115 372 105 42 127 76 80
Estimate
error (90
confidence
limit)
22
mm
0001
mm
402
s
09
Pa
002
Pa s
28
ml
42
ml
45
ml
380
381 Table 4 Repeatability of test parameters at the central point (continued) 382
383
Tests
Permeability
1 min
x10-8
Permeability
30 min
x10-8
Compressibility frsquoc 1d frsquoc 3d frsquoc 7d frsquoc 28d
Mean (n=4) 463
ms
0388
ms 02323
189
MPa
293
MPa
411
MPa
558
MPa
Coefficient
of variation
()
85 39 8 84 144 98 53
15
Estimate
error (90
confidence
limit)
032
(ms)
0013
(ms)
00153
13
MPa
35
MPa
33
MPa
24
MPa
384
385
31 Accuracy of the established models 386
387
The ratio of predicted-to-measured properties for grout ranged between 087 and 115 388
indicating good accuracy for prediction of mini-slump plate cohesion induced bleeding at 1 389
min 5 mins and 30 mins yield stress plastic viscosity and compressive strength at 1-d 3-d 7-390
d and 28-d In general the proposed models for mini-slump plate cohesion Marsh cone and 391
compressive strength appeared to be accurate in predicting fluidity cohesivity induced 392
bleeding permeability at 30 min compressibility and compressive strength with low scatter 393
between measured and predicted values However the average values of predictedmeasured 394
ratio of yield values were slightly higher (074) 395
396
32 Isoresponses of the proposed models 397
398
The isoresponse surfaces and contour plots for mini-slump plate cohesion Marsh cone yield 399
stress plastic viscosity induced bleeding at 1 min 5 mins and 30 mins permeability at 1 min 400
and 30 mins compressibility and compressive strength at 1-d 3-d 7-d and 28-d were obtained 401
by using response surface methodology (RSM) The isoresponse surfaces and contour plots 402
were obtained from the regression models and because the models contained interaction and 403
second-order variables the contour lines were curved 404
The proposed statistical models can therefore be used to evaluate the effect of a group of 405
variables on the properties affecting the quality of supersulfated grout This allowed for the 406
calculation of isoresponse surfaces from the parameters under study outside the experimental 407
domain and the optimisation of their effects The next sections will discuss the results of each 408
experiment separately 409
331 Mini-slump 410
As shown in Eq 4 the mini-slump is influenced in order of significance by WB ratio 411
anhydrite proportion interaction of WB and ANH and the percentage of GGBS content The 412
WB ratio had the greatest effect on fluidity due to better lubrication of the particles in the paste 413
16
[29] The mini-slump test was accompanied by very low shear The value of mini-slump is to 414
characterise yield stress [38] therefore higher mini-slump value indicated a lower yield stress 415
The effect of WB on the increase of mini-slump was two and half-time than that of ANH (192 416
vs 781 in Eq 4) However increased ANH resulted in a 27 times greater increase in mini-417
slump than reduced GGBS (781 vs -294 in Eq 4) Figure 1(a) shows the effect of increased 418
WB on mini-slump vs ANH (when GGBS was kept constant at 70) and Figure 1(b) shows 419
GGBS vs ANH (when WB was fixed at 039) Based on these figures it is evident that mini-420
slump increased significantly when the dosage of WB and ANH increased 421
422
(a) (b) 423
Fig 1 Isoresponse curves of mini-slump (mm) (a) WB vs ANH and (b) GGBS vs ANH 424
425
332 Marsh cone 426
The time needed for a grout sample to flow through the Marsh cone is proportional to the 427
viscosity of the cement grout the flow time becomes an index of fluidity so the longer the 428
flow time the lower the fluidity Similar to the previous trends Eq 5 shows that the values of 429
Marsh cone are influenced in order of significance by WB GGBS and ANH This is 430
graphically illustrated in Figure 2 431
GGBS = 70
034 039 042 044
0
5
10
15
20
WB
AN
H (
)
65
74
83
92
101
037
AN
H(
)
WB = 039
60 65 70 75 80
0
5
10
15
20
GGBS()
70
75
80
85
17
432
(a) (b) 433
Fig 2 Isoresponse curves for flow time (s) (a) WB vs ANH and (b) GGBS vs ANH 434
435
It can be noted that an increase in WB and ANH or a reduction in GGBS led to decreasing 436
the Marsh cone flow time For example at fixed WB at 039 and GGBS of 70 respectively 437
the increase in ANH dosage from 5 to 20 led to a marked reduction of the Marsh cone flow 438
time from 170 to 140 s (Figure 2(a)) This behaviour is attributed to the change in plastic 439
viscosity of the grout as will be discussed later 440
333 Cohesion plate 441
As shown in Eq 6 the cohesion plate was influenced in order of magnitude by the WB and 442
the percentage of GGBS and ANH The increasing WB had a 34 times the influence on the 443
reduction of the cohesion plate test results as the increased ANH (for a GGBS constant) By 444
comparing the effects of WB and GGBS on plate cohesion the increased WB can be 445
interpreted as having approximately a 3 times greater influence on the reduction of plate 446
cohesion values than the increase in GGBS (-366 vs 122 in Eq 6) given that ANH is held 447
constant The effect of an increase in WB from 034 to 044 and ANH from 0 to 20 with a 448
fixed GGBS dosage of 70 is presented in Figure 3(a) Increased WB led to a decreased 449
cohesion plate value Conversely an increase in GGBS increased the cohesion plate value and 450
an increased ANH caused a reduction in cohesion plate (Figure 3(b)) 451
GGBS = 70
034 036 039 042 0440
5
10
15
20
WB
AN
H (
)
40
6080
100120
140160
180200
220
WB = 039
60 65 70 75 80
0
5
10
15
20
GGBS ()
AN
H (
)
100
120
140
160
180
18
452
(a) (b) 453
Fig 3 Isoresponse curves for plate cohesion meter (a) WB vs ANH and (b) GGBS vs 454 ANH 455
334 Yield stress 456
As shown in Eq 7 yield value was influenced in order of magnitude by WB and dosages of 457
ANH and GGBS Based on Figure 4 (a) when WB was fixed at 039 GGBS maintained at 458
70 and ANH increased to 5 the isoresponse curve showed a yield value of 15 Pa On the 459
other hand if the proportion of ANH was further increased to 20 while GBBS was 460
maintained at 70 the yield value decreased to 135 Pa This corresponds with Eq (7) in 461
which the proportion of WB and ANH were increased while GGBS was kept constant 462
resulting in a reduction in yield stress An increase in GGBS content resulted in an increase of 463
the yield stress 464
Figure 4 (b) shows the isoresponse curve of the yield value with a fixed proportion of GGBS 465
at 70 When WB was 039 and ANH was 5 the isoresponse of the predicted yield value 466
was 155 Pa If ANH was increased to 20 while maintaining WB at 039 the isoresponse of 467
the yield value was 135 Pa 468
It can be interesting to note that the observed results for the yield stress are closed to the one 469
observed with the cohesion plate and mini-slump tests This is expected as yield stress values 470
can be derived from those two simple tests 471
GGBS = 70
034 037 039 042 0440
5
10
15
20
WB
AN
H(
)
45
55
65
7585
95
105
115
WB = 039
60 65 70 75 800
5
10
15
20
GGBS ()
AN
H(
)
75
85
95
105
19
472
(a) (b) 473
Fig 4 Isoresponse curves for yield stress (Pa) (a) WB vs ANH and (b) GGBS vs ANH 474
335 Plastic viscosity 475
Plastic viscosity was influenced in order of magnitude by WB and the dosages of ANH and 476
GGBS ANH and GGBS had almost opposite effects on plastic viscosity (-0078 vs 0073 in 477
Eq 8) As shown in Eq (8) increased WB had the greatest primary effect on plastic viscosity 478
(034 vs 0078 and 0073) The increased WB had approximately a 44 times greater influence 479
on reducing plastic viscosity than increased ANH or decreased GGBS 480
In the isoresponse curve of plastic viscosity shown in Figure 5 (a) when GGBS was fixed at 481
70 WB set at 039 and ANH maintained at 5 the predicted plastic viscosity value was 482
068 Pas On the other hand if the dosage of ANHB was increased to 20 while maintaining 483
a similar WB the plastic viscosity was reduced to 055 Pas 484
In Figure 5 (b) WB was fixed at 039 when GGBS was held at 70 and ANH at 5 the 485
predicted plastic viscosity was 067 Pas However when ANH was increased to 20 and 486
GGBS was maintained at 70 the predicted plastic viscosity dropped to 055 Pas 487
AN
H(
)
GGBS = 70
034 037 039 042 044
0
5
10
15
20
WB
1012
1416
18
20
WB = 039
60 65 70 75 800
5
10
15
20
GGBS ()
AN
H(
)
13
14
15
20
488
(a) (b) 489
Fig 5 Isoresponse curve for plastic viscosity (Pas) (a) WB vs ANH and (b) GGBS vs 490
ANH 491
336 Induced bleeding 492
The induced bleeding equations for 1 and 5 minutes (Eqs 9 10) and 30 minutes (Eq 11) are 493
very similar The two influencing factors of induced bleeding are WB ratio and anhydrite 494
WB ratio has the greatest effect over two times the effect of anhydrite content Figure 6 shows 495
the isoresponse for bleeding versus the WB ratio for a fixed value of GGBS at 70 It can be 496
seen that when an anhydrite value is selected and the WB ratio is increased the bleeding will 497
also increase Similarly if a WB ratio is selected and the anhydrite content is increased the 498
bleeding will again increase 499
500
GGBS = 70
034 037 039 042 0440
5
10
15
20
WB
AN
H(
)
035
045
055
065
075
085
095
WB = 039
60 65 70 75 800
5
10
15
20
GGBS ()
AN
H(
)
055
060
065
075
034 036 039 042 044
0
5
10
15
20
WB
AN
H (
)
26
28
30
3234
36
38
40
GGBS=70
21
(a) 501
502
(b) (c) 503
Fig 6 Isoresponse curves for induced bleeding at 1 5 and 30 min WB vs ANH 504
337 Permeability 505
Figure 7 (a) and (b) showed firstly that the permeability decreased significantly from 1 min to 506
30 min Permeability at 1 min was influenced in order of magnitude by WB and the dosage 507
of ANH All interactions between 3 parameters had almost opposite effects on permeability 508
(Eq 12) As shown in Eq (12) increased WB and AHN had the greatest primary effect on 509
permeability at 1 min It seems there is an optimum reached at WB = 40 and AHN at 17 510
Similarly the permeability at 30 min is affected in order of significance by WB followed by 511
ANH (Eq 13) In Figure 7 (b) WB was fixed at 039 when GGBS was held at 70 and ANH 512
at 10 the predicted permeability was 038 x 10-8 (ms) However when ANH was increased 513
to 20 and GGBS was maintained at 70 the predicted permeability increased to 040x10-8 514
(ms) 515
516
GGBS = 70
034 036 039 042 0440
5
10
15
20
WB
AN
H (
)
545
61
675
74
805
GGBS = 70
034 036 039 042 0440
5
10
15
20
WB
AN
H (
)
56
60
64
68
72
7680
84
22
517
(a) (b) 518
Fig 7 Isoresponse curves for permeability at 1 and 30 min WB vs ANH 519
338 Compressibility 520
As shown in Eq (14) the compressibility was influenced in order of magnitude by the WB 521
and the percentage of ANH The interaction between 3 parameters affected also the 522
compressibility The increasing WB had a 32 times the influence on the increase of the 523
compressibility results as the increased ANH (for a GGBS constant) The effect of an increase 524
in WB from 034 to 044 and ANH from 0 to 20 with a fixed GGBS dosage of 70 is 525
presented in Figure 8 Increased WB led to an increase of compressibility Similarly an 526
increase in AHN increased the compressibility 527
528
Fig 8 Isoresponse curves for compressibility WB vs ANH 529
034 036 039 042 044
0
5
10
15
20
GGBS = 70 WB
AN
H (
)
3
35
4
4
45
5
034 036 039 042 044
0
5
10
15
20
WB
AN
H (
)
034
035
036 037 038 039 04
041
042
4
GGBS=70
034 036 039 042 044
0
5
10
15
20
WB
AN
H (
)
017
019
021 023 025 027
029
031
GGBS=70
23
530
339 Compressive strength 531
After one day from Eq 15 the influencing factors in order of significance are WB ratio 532
anhydrite content GGBS content and the interaction of WB and ANH The effect of the first 533
three was similar but WB had 11 times greater effect than anhydrite and 125 times greater 534
effect than GGBS While the interaction of WB and anhydrite had around a third of the 535
influence of WB Figures 9 (a) and (b) show the isoresponses for 1-day compressive strength 536
From Figure 9 (a) it can be seen when the GGBS content is fixed at 70 for a given anhydrite 537
content increasing the WB ratio will decrease the strength Also if a WB ratio is selected and 538
the anhydrite is increased similarly the strength will decrease From Figure 9 (b) with the WB 539
ratio fixed at 039 once again an increase in GGBS led to a reduction of compressive strength 540
at 1 day 541
542
(a) (b) 543
Fig9 Isoresponse curves for compressive strength at 1d (a) (WB vs ANH) and (b) (GGBS 544 vs ANH) 545
Eqs 16 17 and 18 show the effect of GGBS and ANH percentages on compressive strength at 546
3-d 7-d and 28-d Figures 10 11 and 12 show the isoresponse of the compressive strength at 547
3-d 7-d and 28-d respectively with WB vs ANH Increased ANH led to a decrease of 3-d 548
and 7-d compressive strength As expected an Increase in WB led to a decrease in compressive 549
strength The percentage of ANH had a negative effect on compressive strength and showed a 550
greater influence particularly at 3-d and 7-d (879 (3 d) amp 924 (7d) vs 382 (28 d)) GGBS has 551
a negative impact on early strength development The negative effect of GGBS on compressive 552
GGBS = 70
034 037 039 042 0440
5
10
15
20
WB
AN
H(
)
12
14
16
18
20
22
2426
WB = 039
60 65 70 75 800
5
10
15
20
GGBS ()
AN
H(
)
10
12
14
16
18
20
22
24
strength at early ages is clearly attributable to the fact that up to 80 of cement has been 553
replaced by GGBS and it takes some time for GGBS to start developing its pozzolanic action 554
at a noticeable level The results indicate that ANH content influences strength to a greater 555
extent than GGBS at all ages The SO3 content was reported to have great influence on the 556
strength [39 40] 557
558
(a) (b) 559
Fig10 Isoresponse curves for compressive strength at 3d (a) (WB vs ANH) and (b) 560 (GGBS vs ANH) 561
562
563
(a) (b) 564
Fig11 Isoresponse curves for compressive strength at 7d (a) (WB vs ANH) and (b) (WB 565 vs ANH) 566
567
GGBS = 70
034 036 039 042 0440
5
10
15
20
WB
AN
H (
)
24
2628
30
3234
3638
4042
WB = 039
60 65 70 75 80
0
5
10
15
20
GGBS ()
AN
H (
)
2426
2830
32
34
36
3840
42
GGBS = 70
034 037 039 042 044
0
5
10
15
20
WB
AN
H(
)
3032
34
3638
40
42
44
46
48
WB = 039
60 65 70 75 80
0
5
10
15
20
GGBS ()
AN
H(
)
32
34
36
38
40
42
44
46
48
25
568
(a) (b) 569
Fig12 Isoresponse curves for compressive strength at 28d (a) (WB vs ANH) and (b) 570
(ANH vs GGBS) 571
3310 Discussion of the effect of WB GGBS and ANH 572
As expected the increase of WB led to an increase in mini-slump induced bleeding and a 573
reduction in flow time plate cohesion yield stress plastic viscosity and compressive strengths 574
This can be attributed to more water in the system 575
An increase in GGBS content resulted in a reduction of the flow time plate cohesion yield 576
stress and plastic viscosity while the fluidity is improved This was due to the fact the specific 577
gravity of slag is lower than that of PC leading to an increase in the paste volume and thus 578
improving the fluidity of paste 579
In case of an increase of ANH proportion while WB and GGBS were kept constant it led to 580
an increased mini-slump and induced bleeding while the flow time plate cohesion yield stress 581
and plastic viscosity were reduced This was due to the lower reactivity of ANH resulting in an 582
increase of water needed for lubrication of paste 583
As expected an increase in WB lead to an increase in induced bleeding permeability and a 584
decrease in compressibility [33 35] This is due to the increase in liquid volume between the 585
particles and to the reduction in the amount of interparticle forces Globally the compressibility 586
decreases and the permeability increases with ANH It can be explained by the reduced specific 587
area and lower reactivity that can lead to more available water in the samples 588
3311 Heat of Hydration 589
Heat of hydration is considered an important factor in the cement design as low heat of 590
hydration reduces the effect of thermal cracking The heat flow results of the calorimeter test 591
performed over a three days period can be seen in Figure 13 592
GGBS = 70
034 036 039 042 0440
5
10
15
20
WB
AN
H (
)
46
48
50
52
54
56
58
60
WB = 039
0 5 10 15 2060
65
70
75
80
ANH ()
GG
BS
(
)
50
52
54
56
5860
62
26
593
Fig 13 Heat flow graphs for first 3 days of reaction 594
Figure 13 presents that the largest peaks were in mixes 1 2 5 and 6 This shows that these 595
reactions generated the most heat and that they were quick Mixes 1 and 2 have the highest 596
OPC content at 40 and this suggests that to lower the heat of the reaction minimal OPC 597
should be used This is confirmed by the fact that mixes 5 and 6 have the next highest OPC 598
contents the same percentage as mixes 3 4 and 9 (one of the repeated mixes) which have 599
anhydrite present This implies that the presence of anhydrite will lengthen the reaction process 600
and reduce the heat produced during setting significantly The graph shows this by the absence 601
of a sharp peak instead a gentle curved hump is shown over a 2-day period whereas the mixes 602
showing a sharp peak occur after about 12 hrs Mix 7 which has the same solids content as 603
mix 8 but a lower WB ratio and no cement present showed the lowest heat flow during the 604
hydration process 605
Figure 14 shows the cumulative heat generation during the first 3 days of setting It is clear that 606
the two mixes (1 and 2) with highest cement content and absence of anhydrite had the highest 607
cumulative heat development over the 3-day period 643J and 594J respectively Mixes 3456 608
and 9 which all have 20 OPC content generated similar heat value over the 3 days Results 609
of mixes containing ANH implies that over the period that the anhydrite did not reduce the 610
cumulative heat generated but slowed the reaction and reduce the peak heat generated The 611
0
0002
0004
0006
0008
001
0012
0 50000 100000 150000 200000 250000 300000
He
at F
low
(mW
)
Time s()
M1
M2
M3
M4
M5
M6
M7
M9
1Day
2Day
3day
1d 2d 3d
27
graphs also suggest that a higher WB ratio produced a lower cumulative and peak heat 612
generation613
614
Fig 14 Cumulative heat generation curves for first 3 days 615
3312 pH measurements 616
Fig 15 summarises the results of pH and the nine mixes with different compositions of WB 617
the percentages of cement GGBS and ANH It is shown that Supersulfated cements (SSCs) 618
have lower pH values (lt 125 at all ages) than PC which has a pH of 139 [41] making SSC 619
more preferable in essential applications such as nuclear waste encapsulation 620
The figure shows that the pH value decreased with time for all samples between 1 and 7 days 621
Similar trend was observed in the majority of mixes between 7 and 28 days except for sample 622
2 5 and 9 which showed slight increase in the pH values This decrease refers to the 623
consumption of ions in the pore structure due to the hydration process 624
0
100
200
300
400
500
600
700
800
0 50000 100000 150000 200000 250000 300000
(J)
Time (s)
M1
M2
M3
M4
M5
M6
M7
M9
1 Day
3 Day
2 day
1d 2d 3d
1
2
3
9
45
6
7
28
625
626 Fig 15 Summary of pore solution pH 627
628
The incorporation of ANH replacing the Portland cement (C) results in remarkable decrease in 629
pH at all ages as introducing the ANH reduced the lower initial pH Likewise the increase in 630
the content of GGBS led to a decrease in the pH value of the pore structure as GGBS has lower 631
initial pH than Portland cement The increase of WB ratio decreased the pH value This is in 632
agreement with Collier [41] who found that increasing the wb ratio from 05 to 06 increased 633
the pH by I unit This was attributed to the increased availability of water in the case of WB 634
of 06 allowing hydration of more cement powder thereby releasing more hydroxide anions 635
into solution However in this study the WB ratio did not show a significant effect on 636
lowering the pH These results are in agreement with [42] which also found that decreasing the 637
pH improved the bulk resistivity of SSC mixtures 638
3313 SEM 639
Figure 16 shows the SEM images of some mixes at various magnifications The images clearly 640
show the dense and compact structure of the cement after seven days The dense structure was 641
another requirement from the cement chosen to enclose the waste to prevent leaching The 642
microstructure consists mainly of C-S-H the main hydration product and unhydrated slag 643
grains C-S-H is formed after the dissolution of slag grains when contacting the water and 644
alkalis and then the ionic species saturate the solution and then precipitate as hydrated phases 645
[8] There were abundant grains of hydrated and partially hydrated slag grains some small 646
1080
1100
1120
1140
1160
1180
1200
1220
1240
1260
1280
1 2 3 4 5 6 7 8 9
pH
val
ue
Mix Number
1 Day
7 Days
28 Days
29
GGBS particles presented rims of reaction products (eg Mix 6-Figure 16 (f) and Mix 9-Figure 647
16 (h)) It was found by [11] that the composition of the reaction rims around slag was similar 648
to that of the C-S-H from PC However [12] found that in the CndashSndashH of SSC is apparently 649
more foil like which is different than the fibrillar morphology of C-S-H in OPC Mix 3 and 650
Mix 4 (Figure 16 (c) and (d) respectively) exhibits more micro voids in the micrsostructure 651
which could explain the low strength of these mixes compared to mix 1 and 2 Ettringite was 652
not detected Ettringite is not the most abundant phase and it is not easy to detect in dried 653
polished samples because it is easily decomposed under the drying conditions of the vacuum 654
of the microscope column [11] 655
(a) Mix 1 image at 1100 magnification (b) Mix 2 image at 900 magnification
(c) Particle of unreacted slag mix3 7 days (d) An overall image of mix 4 at 7days
showing CSH and BFS particles
30
(e) Mix 5 image at 1100 magnification (f) Mix 6 image at 2300 magnification
(g) Mix 7 image at 2000 magnification (h) Mix 9 image at 2700 magnification
Fig 16 SEM results 656
4 Conclusions 657
The paper focused on optimizing the SSC cement grout in order to get the best of it The effect 658
of GGBS WB and ANH dosages on the grout fluidity rheological properties induced 659
bleeding maximum heat of hydration and compressive strength was investigated using 660
factorial design approach and analysis The models derived in this study are valid for the 661
experimental area corresponding to grout mixes made with variable levels of WB ANH and 662
GGBS in the ranges of 034 to 044 0 to 20 by mass of binder 60 to 80 by mass of 663
binder respectively Based on the results from this study the following conclusions are drawn 664
- In comparison to GGBS and ANH WB ratio had more pronounced effects on the 665
results of mini-slump plate cohesion meter Marsh cone time yield stress plastic viscosity 666
induced bleeding permeability compressibility and compressive strength 667
31
- The increase in the dosage of GGBS led to an increase in the values of plate cohesion 668
meter Marsh cone time yield stress and plastic viscosity while reducing the mini-slump 669
values maximum hydration and compressive strength This is ascribed to the fine nature 670
of GGBS particles and pozzolanic effect 671
- While the ANH particles caused a decrease in the maximum of heat of hydration it 672
increased the induced bleeding permeability and compressibility due to its dominant effect 673
on increasing the dormant period and increasing the rates of solid sedimentation and 674
induced bleeding water 675
- Increasing the dosage of ANH in grout reduced the hydrations kinetic at early-age and 676
thus reduced the compressive strength at 1d 3d and 7d However this effect diminished 677
at later ages at 28 d in a manner similar to increasing WB 678
- The increase in the dosage of ANH led to an increase in the mini-slump values 679
(fluidity) but a decrease in the values of yield stress plastic viscosity plate cohesion and 680
Marsh cone time This is attributed to better deflocculation of particles at the fresh state 681
- The increase of GGBS percentage delayed the reaction process and decreased the total 682
heat after 3 days while WB slightly reduced the total heat it didnrsquot significantly affect the 683
reaction process 684
- pH measurements in the present study confirmed the suitability of these mixture to low-685
pH applications as the increase in both the GGBS and ANH markedly decreased the initial 686
pH thereby lowering the pH at different ages 687
- The modelling and prediction of the response of other points in the experimental domain 688
were therefore possible Although the models are based on a given set of materials they 689
can be easily used to generate future results using other materials 690
- Dense microstructure was observed for mixes examined in this study C-S-H is the main 691
reaction product with presence of unreacted slag grains embedded well in the structure 692
However some micro voids were observed in mixes containing ANH which led to lower 693
compressive strength of mixes with ANH 694
CRediT authorship contribution statement 695
MSonebi and YBai did the conceptualization and the design of investigation as well as 696 performing the experiments MSonebi carried out the software analysis of the results and the 697
32
visualization MSonebi AAbdalqader T Fayyad and APerrot analysed the results and 698 wrote the original draft and reviewed and edited the final version 699
Declaration of Competing Interest 700
The authors declare that they have no known competing financial interests or personal 701 relationships that could have appeared to influence the work reported in this paper 702
Acknowledgments 703
The authors would like to express their gratitude to P McCann from QUB and N Collier 704 from Eden Nuclear and Environment Ltd for their helps for some experiments 705
706
References 707
1 Schneider M Romer M Tschudin M Bolio H (2011) Sustainable cement production-708 present and future Cement and Concrete Research 41642ndash650 709
httpsdoiorg101016jcemconres201103019 710
2 Madlool NA Saidur R Hossain MS Rahim NA (2011) A critical review on energy use 711 and savings in the cement industries Renewable and Sustainable Energy Reviews 712
152042ndash2060 httpsdoiorg101016jrser201101005 713
3 EN15743 (2015) BS EN 157432010+A12015 Supersulfated cement - Composition 714
specifications and conformity criteria BSI 715
4 Khatib JM Wright L Mangat PS (2016) Mechanical and physical properties of concrete 716
containing FGD waste Magazine of Concrete Research 68550ndash560 717 httpsdoiorg101680macr1500092 718
5 Khatib JM Mangat PS Wright L (2008) Sulfate resistance of mortar containing 719
simulated FGD waste Proceedings of Institution of Civil Engineers Construction 720 Materials 161119ndash128 httpsdoiorg101680coma20081613119 721
6 (2020) Specifying Sustainable Concrete 722
7 Hewlett PC (2004) Learsquos Chemistry of Cement and Concrete fourth edi Elsevier 723 Science amp Technology Books Oxford 724
8 Gruskovnjak A Lothenbach B Winnefeld F et al (2008) Hydration mechanisms of 725 super sulphated slag cement Cement and Concrete Research 38983ndash992 726
httpsdoiorg101016jcemconres200803004 727
9 Grounds T Nowell D V Wilburn FW (2003) Resistance of supersulfated cement to 728 strong sulfate solutions Journal of Thermal Analysis and Calorimetry 72181ndash190 729
httpsdoiorg101023A1023928021602 730
10 Grounds T Nowell D V Wilburn FW (1995) The influence of temperature and 731
different storage conditions on the stability of supersulphated cement Journal of 732 Thermal Analysis 45385ndash394 httpsdoiorg101007BF02548772 733
33
11 Bazalduacutea-Medelliacuten ME Fuentes AF Gorokhovsky A Escalante-Garciacutea JI (2015) Early 734 and late hydration of supersulphated cements of blast furnace slag with fluorgypsum 735 Materiales de Construccion 65e043 httpsdoiorg103989mc201506013 736
12 Matschei T Bellmann F Stark J (2005) Hydration behaviour of sulphate-activated slag 737 cements Advances in Cement Research 17167ndash178 738
httpsdoiorg101680adcr2005174167 739
13 Richardson IG (2000) Nature of the hydration products in hardened cement pastes 740 Cement and Concrete Composites 2297ndash113 httpsdoiorg101016S0958-741 9465(99)00036-0 742
14 Baux C Phelipot-Mardeleacute A Lanos C et al (2013) PERFORMANCES OF SUPER 743 SULFATED CEMENTS In International Conference on Concrete Under Severe 744 Conditions pp 1857ndash1870 745
15 Annabelle Phelipot-Mardeleacute Gabriel Samson Christophe Lanos (2015) Super sulfated 746 cement formulation and uses In Construction Materials ConMat Whistler Canada 747
16 Milestone NB (2006) Reactions in cement encapsulated nuclear wastes need for 748 toolbox of different cement types Advances in Applied Ceramics 10513ndash20 749
httpsdoiorg101179174367606X81678 750
17 Batchelor B (2006) Overview of waste stabilization with cement Waste Management 751
26689ndash698 httpsdoiorg101016JWASMAN200601020 752
18 Zhang T Cheeseman CR Vandeperre LJ (2011) Development of low pH cement 753
systems forming magnesium silicate hydrate (MSH) Cement and Concrete Research 754 41439ndash442 httpsdoiorg101016jcemconres201101016 755
19 Mobasher N Bernal SA Provis JL (2016) Structural evolution of an alkali sulfate 756
activated slag cement Journal of Nuclear Materials 46897ndash104 757 httpsdoiorg101016JJNUCMAT201511016 758
20 Wang J Yu B Gao Y (2014) Hydration Characteristics of Super Sulphated Cement 759 with Different Fineness In Proceedings of the International Conference on Material 760 and Environmental Engineering (ICMAEE 2014) Atlantis Press Paris France 761
21 Naumlgele E (1986) The Zeta-potential of cement Part II Effect of pH-value Cement and 762 Concrete Research 16853ndash863 httpsdoiorg1010160008-8846(86)90008-6 763
22 Jain N Civil MG-IJ of M and 2015 U (2015) Formulation of Sulphate Resistant Super 764 Sulphated Cement Using Fluorogypsum and Granulated Blast Furnace Slag IOSR 765
Journal of Mechanical and Civil Engineering (IOSR-JMCE) 12153ndash159 766
23 Gao YX Yu BY Xu FL (2012) Effect of Modified Phosphogypsum on the Mechanical 767 Properties of Super Sulphate Cement Applied Mechanics and Materials 161264ndash268 768 httpsdoiorg104028wwwscientificnetAMM161264 769
24 Kantro D (1980) Influence of Water-Reducing Admixtures on Properties of Cement 770 PasteampmdashA Miniature Slump Test Cement Concrete and Aggregates 295ndash102 771
httpsdoiorg101520CCA10190J 772
34
25 Svermova L Sonebi M Bartos PJM (2003) Influence of mix proportions on rheology of 773 cement grouts containing limestone powder Cement and Concrete Composites 25737ndash774 749 httpsdoiorg101016S0958-9465(02)00115-4 775
26 Sonebi M (2006) Rheological properties of grouts with viscosity modifying agents as 776 diutan gum and welan gum incorporating pulverised fly ash Cement and Concrete 777
Research 361609ndash1618 httpsdoiorg101016JCEMCONRES200605016 778
27 Nehdi M Rahman M (2004) Effect of Geometry and Surface Friction of Test Accessory 779 on Oscillatory Rheological Properties of Cement Pastes ACI Materials Journal 780 101416ndash424 httpsdoiorg101435913428 781
28 Khayat KH Yahia A (1997) Effect of Welan Gum-High-Range Water Reducer 782 Combinations on Rheology of Cement Grout ACI Materials Journal 94365ndash372 783 httpsdoiorg1014359321 784
29 Lombardi G (1985) THE ROLE OF COHESION IN CEMENT GROUTING OF 785 ROCK In Proceedings of Fifteenth Congress on Large Dams International 786 Commission on Large Dams pp 235ndash261 787
30 Perrot A Rangeard D Picandet V Meacutelinge Y (2013) Hydro-mechanical properties of 788
fresh cement pastes containing polycarboxylate superplasticizer Cement and Concrete 789 Research 53221ndash228 httpsdoiorg101016JCEMCONRES201306015 790
31 Perrot A Lecompte T Khelifi H et al (2012) Yield stress and bleeding of fresh cement 791 pastes Cement and Concrete Research 42937ndash944 792
httpdxdoiorg101016jcemconres201203015 793
32 Sonebi M Perrot A (2019) Effect of mix proportions on rheology and permeability of 794 cement grouts containing viscosity modifying admixture Construction and Building 795
Materials 212687ndash697 httpsdoiorg101016jconbuildmat201904022 796
33 Picandet V Rangeard D Perrot A Lecompte T (2011) Permeability measurement of 797
fresh cement paste Cement and Concrete Research 41330ndash338 798 httpsdoiorg101016JCEMCONRES201011019 799
34 Perrot A Rangeard D (2017) Effects of mix design parameters on consolidation 800
behaviour of fresh cement-based materials Materials and Structures 50117 801 httpsdoiorg101617s11527-016-0988-0 802
35 Rangeard D Perrot A Picandet V et al (2015) Determination of the consolidation 803 coefficient of low compressibility materials application to fresh cement-based 804
materials Materials and Structures 481475ndash1483 httpsdoiorg101617s11527-014-805 0247-1 806
36 Massoussi N Keita E Roussel N (2017) The heterogeneous nature of bleeding in 807 cement pastes Cement and Concrete Research 95108ndash116 808 httpsdoiorg101016JCEMCONRES201702012 809
37 Montgomery D (2007) Design and Analysis of Experiments Second Edition John 810
Wiley amp Sons 811
35
38 Roussel N Stefani C Leroy R (2005) From mini-cone test to Abrams cone test 812 Measurement of cement-based materials yield stress using slump tests Cement and 813 Concrete Research 35817ndash822 httpsdoiorg101016jcemconres200407032 814
39 Mangat PS Khatib JM Wright L (2006) Optimum utilisation of FGD waste in blended 815 binders Proceedings of Institution of Civil Engineers Construction Materials 159119ndash816
127 httpsdoiorg101680coma20061593119 817
40 Khatib JM Mangat PS Wright L (2013) Early age porosity and pore size distribution of 818 cement paste with flue gas desulphurisation (FGD) waste Journal of Civil Engineering 819 and Management 19622ndash627 httpsdoiorg103846139237302013793609 820
41 Collier NC Milestone NB Gordon LE Ko SC (2014) The suitability of a supersulfated 821 cement for nuclear waste immobilisation Journal of Nuclear Materials 452457ndash464 822 httpsdoiorg101016jjnucmat201405078 823
42 Masoudi R (2018) Examining compositions hydration mechanisms and properties of 824 supersulfated cement for use in concrete by Examining compositions hydration 825 mechanisms and properties of supersulfated cement for use in concrete University of 826 Toronto 827
828
3
has superior resistance to chemically aggressive environments such as sulfates Due to the 62
glassy nature of GGBS composed mainly of monosilicates GGBS easily dissolves in low to 63
mild alkaline solutions However it is required that the alumina content (Al2O3) of slag to be 64
no less than 13 to be used effectively in SSC [7] The most commonly used sources of 65
sulphate is anhydrite because it has lower solubility rate than other sources [8 9] To promote 66
the dissolution of slag PC is added because its hydration yields the formation of calcium 67
hydroxide (CH) which provides the required alkaline environment for slag dissolution Once 68
the slag is dissolved the released aluminium silicon and calcium ions from slag glass react 69
with the calcium sulfate present in the mixture to form two main hydration products ettringite 70
(C6A3H32) and calcium silicate hydrate (C-S-H) [10] Ettringite provides the early strength to 71
SSC mixtures contributing to the strength development while C-S-H is responsible for later 72
strength and the continual increase of strength over time [11 12] C-S-H formed in SSC has a 73
CaSi ratio between 10 and 12 which is much lower than that formed in PC mixtures [13] 74
This means that the chemical composition of slag plays a significant role on the strength 75
development dissolution of the slags and the amount of hydration products formed 76
After being used for long time in construction for special structures currently SSC is very 77
rarely used and no longer produced in some areas According to Baux et al [14] this happened 78
because of its lack of reactivity Grounds et al [10] believed that this is because there is 79
uncertainty over some of its properties which include its long-term stability and durability One 80
of their main concern surrounding SSC is due to the hydration product ettringite or tri-81
sulphoaluminate which is known to be unstable in Portland cement and has been found to be 82
expansive in certain environments Phelipot-Mardeleacute et al [15] state that this could be because 83
generally cement made with blast furnace slag tends to harden more slowly than mortar and 84
concrete made from PC 85
The nuclear power is a promising option for the future in the UK and the world in general 86
however the nuclear waste is still an obstacle in its way to be a vital option for the future and 87
to gain public acceptance [16] This can be achieved by making the contaminants to be less 88
mobile or less toxic by lsquowaste stabilizationrsquo that results in converting the contaminants from 89
the dissolved phase to a solid phase by reactions such as precipitation sorption or substitution 90
This prevents the waste from diffusion to the external environment [16 17] Most applications 91
of stabilization are cement-based where the cement forms a low permeability matrix and where 92
the contaminant is incorporated into hydrated phases and then precipitated due to the prevailing 93
pH in the pore solution [18] This means that the efficiency of the process depends on the 94
4
prevailing pH The pH resulting from cement hydration results in many metal contaminants 95
forming hydroxide or mixed hydroxide solids [17] Portland cement will tend to result in a 96
higher pH while combining it with lime as well as fly ash blast furnace slag and other 97
pozzolanic binders will result in lower pH The interactions of these binders with waste 98
components determine the extent of treatment [18] 99
There is a lack of data detailing the assessment criteria and performance of nuclear 100
encapsulation groutconcrete However general requirements of a cementitious system for 101
encapsulation can be summarised as follows an ability to incorporate waste and harden 102
fluidity of initial cemented mix and potential for remote mixing low permeability resistance 103
to water low temperature rise on setting workable setting time low free or unbound water 104
when setting reaction is complete low internal pH to avoid ongoing reactions such as 105
corrosion long term durability [16] 106
The solubility of many heavy metals is low at low pH and therefore low pH cements such as 107
SSC are likely to be particularly desirable cements for nuclear waste management [16ndash19] 108
This would help to make the nuclear energy as a clean and a safe source of energy a promising 109
alternative for future generations This again has highlighted some of the noteworthy 110
properties of the SSC where not only the pH value that makes SSC a promising option that 111
could be used to encapsulate nuclear waste material for disposal Also the heat of hydration in 112
supersulfated cement is much lower than that of OPC and therefore the heat gradient created 113
during hydration between the internal and external surfaces would not be as great and thus less 114
stress caused and less chance of cracking which would be unacceptable with nuclear waste 115
disposal It has high non-evaporable water content that is itrsquos chemically bonded to the silica 116
Besides that it has a good durability in aggressive environments such as structures exposed to 117
seawater or sulfate-bearing groundwater [9 14 15 20ndash22] 118
These technical and environmental benefits have re-simulated recent research on this type of 119
cement and brought the attention for re-investigating overcoming its drawbacks to offer a green 120
cement for very essential applications 121
Currently different researches are being carried out on SSC in order to optimize the usage of 122
SSC Many researchers have examined its various mixture compositions to determine the best 123
compositions for some desirable properties such as strength low permeability faster setting 124
time etc A research on slags activated with 15ndash20 calcium sulfate showed a higher 125
compressive strength in comparison with other mixtures when they examined slags classified 126
5
as low-lime high-alumina and when various SSC mixture compositions were examined with 127
70ndash85 slag 10-25 anhydrite and 5 Portland cement for alkali activation [15] 128
Gruskovnjak et al [8] investigated the effect of alumina content in the slag by examining two 129
types of slag with a high Al2O3 percentage content (12) and low Al2O3 percentage content 130
(77) The findings of their study showed that slag with high alumina contents produced more 131
ettringite and higher strength This was attributed to the higher dissolution rate of high alumina 132
slag SSC hydration characteristics with different fineness has also been investigated [20] It 133
showed that when sample particles become finer the compressive strength is significantly 134
higher Also there is some work which has been done on modifying the mechanical properties 135
of SSC with addition phosphogypsum [19 23] Recently the influence of curing temperature 136
was studied for supersulfated cements made with two slags having different chemical 137
compositions [20] It was found that SSC made with high-alumina slag resulted in higher 138
strengths and presented a more complex mechanism of hydration that was strongly influenced 139
by the solubility of anhydrite This is also being shown in [21] where the SSC made using high-140
alumina slag exhibited higher compressive strength and the use of higher activator contents 141
decreased the compressive strength 142
Based on recent researches and the fact that there are many factors and parameters involved in 143
the composition of SSC there is a demanding need for optimizing the cement grout in order to 144
effectively utilise it to fit for purpose The current paper aligns with this demand The effect of 145
GGBS water-to-binder ratio WB and anhydrite dosages on the grout fluidity rheological 146
properties induced bleeding fresh state permeability and compressibility maximum heat of 147
hydration and compressive strength will be investigated using factorial design approach and 148
analysis Although there is some research on SSC little research work has focused on 149
modelling the effects of the various parameters using a statistical approach Factorial design is 150
a powerful tool and widely used in experiments involving many factors It can be utilised to 151
study the joint effect of factors on responses or dependent variables and to develop models 152
applicable to design and development of experiments Simulation of models obtained with 153
factorial design can facilitate the test protocol needed to optimize cement grout within a given 154
set of performance criteria 155
6
2 Experimental Programme 156
21 Materials and Test Methods 157
The grout mixes investigated in this study were prepared with Standard CEM I 425N Portland 158
cement (PC) specified by BS EN 197-1 The ground granulated blast furnace slag (GGBS) in 159
accordance to BS EN 15167-2 was used The chemical composition of CEM I and GGBS are 160
provided in Table 1 Anhydrite (ANH) was used as the source of sulphate in the present study 161
and it was partially or completely replaced the PC The proportions of the grout mixes are 162
shown in Table 2 163
164
Table 1 Chemical and physical properties of cement and GGBS 165
Chemical analysis Material
CEM I GGBS
SiO2 () 2101 3518
Al2O3 () 492 1396
Fe2O3 () 284 025
MgO() 220 818
CaO () 6452 4121
Na2O () 020 019
K2O () 071 042
SO3 () 253 --
P2O5 () 011 --
LOI () 126 064
Physical analysis
Specific gravity 308 291
Specific surface area [m2kg] 360 600
166
Table 2 Mix proportions for the grouts used in the factorial design 167
Mix
No
Code WB
Percentage ()
WB GGBS ANH GGBS ANH
M1 -1 -1 -1 034 60 0
M2 1 -1 -1 044 60 0
M3 -1 1 -1 034 60 20
M4 1 1 -1 044 60 20
M5 -1 -1 1 034 80 0
M6 1 -1 1 044 80 0
M7 -1 1 1 034 80 20
M8 1 1 1 044 80 20
M9 0 0 0 039 70 10
M10 0 0 0 039 70 10
M11 0 0 0 039 70 10
M12 0 0 0 039 70 10
168
7
All grout mixes were prepared in 2 L batches using a high-shear mixer with a 45 L capacity 169
The mixing water was kept at 98 plusmn 02 ordmC to compensate for heat generated during mixing 170
The cement and GGBS were mixed with ANH in a sequence that started with adding all of the 171
water into the mixer After one minute the binder was gradually introduced The grout was 172
mixed for one minute followed by 30 seconds of rest Subsequently the grout was mixed again 173
for 2 min at a high speed (285 rpm) and for 1 min at the low speed (140 rpm) 174
For all tests the timing is given from zero time ie the time when the cement particles first 175
touch the mixing water The mini-slump flow test started at 7 min (immediately after the end 176
of mixing) The transparent cone-shaped mould described elsewhere [24] was placed in the 177
centre of a smooth Plexiglas plate After filling with grout the cone was gently lifted 178
(approximately 30 s after placement of the grout) When the flow stopped the spread of the 179
grout was measured with a ruler in two perpendicular directions 180
Marsh cone test was carried out using a metal cone with an orifice diameter of 10 mm and 181
started at 8 plusmn 1 min One litre of grout was poured into the cone The conersquos orifice was opened 182
15 s after pouring the cement grout into the cone The time taken for each 100 ml of grout to 183
flow through the orifice was recorded and the measurements were completed upon collecting 184
700 ml of grout 185
The viscosity of cement grout was determined using a coaxial rotating cylinder viscometer 186
Fann (smooth cylinders no serration) that determined apparent viscosity at different shear 187
rates The test was contained in the annular space between an outer cylinder (rotor) with a 188
radius of 18415 mm and a bob with a radius of 17245 mm and a height of 380 cm The rotor 189
and bob were plunged into a cup containing 350 ml of sample grout Viscosity measurements 190
were made when the outer cylinder rotating at a known speed caused a viscous drag to be 191
exerted by the fluid This drag created a torque on the bob which was transmitted to a precision 192
spring where its deflection was measured and compared with test conditions and the 193
instrumentrsquos constants The measurement was made for 12 rotor speeds from 09 rpm to 600 194
rpm where the viscometer reading values () were recorded The value of shear stress (Pa) 195
was calculated by including k1 torsion constant of spring per unit deflection (N-cmdegree) 196
k2 shear stress constant for the effective bob surface (cm-3) and k3 shear rate constant [s-1rpm] 197
[25 26] 198
Rotor speed was increased step by step and the viscometer readings were recorded with 199
increasing rotation speeds The reading was taken when the needle in the viscometer was 200
8
stabilised or 30 seconds after the change of speed in cases when the needle had not stabilised 201
due to the thixotropy of the cement grout The time of reading was generally between 5 and 202
10 seconds 203
In this study the down-curve was chosen for final evaluation because it offered a better 204
description of the rheological behaviour of the grouts including a structural breakdown 205
phenomenon of inner forces among particles [27] The values of shear yield stress (the 206
minimum shearing stress required for the fluid to start flowing) and plastic viscosity used the 207
modified Bingham model [28] and are expressed as follows 208
2
0 cp (1) 209
Where τ0 is yield stress (Pa) μp is plastic viscosity (Pas) is shear rate (s-1) and c is a 210
constant 211
The cohesion of grout was determined at 30 plusmn 1 min with a Lombardi plate cohesion meter 212
[29] A thin galvanized steel plate (100times100times1 mm) was immersed in the grout and hung on a 213
stand placed on an electronic balance The weight of the grout still present on the plate was 214
recorded when the dripping of the grout had stopped This test was followed by the fresh 215
density measurement of the grout with a mud balancer Knowing the fresh density of the grout 216
it was possible to calculate the thickness on each side of the plate 217
The resistance of the fresh grout to induced bleeding was evaluated using a pressure filter The 218
equipment consists of a pressure vessel filter paper which is placed on a sieve and a graduated 219
cylinder A 200 ml grout sample is placed in the pressure vessel After closing the cell the 220
graduated cylinder is placed under the outlet of the cell The cell is pressured by compressed 221
air to 055 MPa The volume of water going out through the outlet on the bottom of the cell is 222
recorded at 15 and 30 s then at every minute up to 10 min and then at every 5 min up to 30 min 223
[25] 224
Considering homogeneous bleeding the results of the induced bleeding tests allow to derive 225
the evolution of the permeability of the sample during its compaction under the applied 226
pressure The permeability of the material is directly linked to the bleeding rate during the 227
material consolidation until the tested material is able to sustain the applied pressure [30 31] 228
It refers to the material ability to slow down the water filtration process 229
The measurement of the flow water allows to compute instantaneous WB ratio and makes it 230
possible to link it with the computed instantaneous permeability at a given time of the test [32ndash231
9
34] I The water flow is computed by dividing the variation of the measured water mass flowing 232
out the samples by the elapsed time between two successive data sampling In this study value 233
of permeability at 1 and 30 minutes are taken and compared It corresponds to the initial and 234
final permeability of the mixes 235
The material compressibility is considered in a soils mechanics way [30 35] It corresponds to 236
the ratio of the variation of void ratio (liquidsolid volume ratio) to the variation of logarithm 237
of applied pressure between the initial and the final state of the induced bleeding test It 238
provides the equilibrium state of the sample under a given applied pressure and is valid for 239
both homogeneous and heterogeneous bleeding [36] 240
It is worth noting that the computed permeability describes homogeneous bleeding kinetics 241
while compressibility describes the amplitude of the bleeding phenomenon 242
Heat of hydration was evaluated by isothermal calorimetry with an eight-channel heat 243
conduction calorimeter maintained at 22degC This equipment measures heat evolved by 244
comparing the temperatures of a grout sample and an inert reference which are both held under 245
isothermal conditions The heat flow results are recorded as a function of time CEM I GGBS 246
and ANH were blended manually for 30 s After the addition of water the grout was blended 247
10 s by hand and then an additional 50 s mechanically Polyethylene ampoules were filled with 248
approximately 6 g of each grout and the experiments were conducted for at least 72 h 249
The compressive strength of the grout was determined by crushing three cubes of 50 mm size 250
After casting the samples were covered with a polymer sheet (a cling film) to limit evaporation 251
of water and stored in a conditioning room at 20 plusmn 2 degC for 24 plusmn 05 hours Afterwards cubes 252
were demoulded and placed in water at 20 plusmn 1 degC until tested at 1 3 7 and 28days 253
In order to perform the pH test a powder sample of the hardened mixes was required The test 254
was performed on 1 7 and 28 day samples As mixes 9-12 are of identical composition the 255
reason is explained later in 41 derived statistical model tests were only performed on sample 256
10 To get the powder with a fineness of 65μm the samples were firstly drained of the acetone 257
To remove any remaining acetone they were placed in a vacuum desiccator The pieces were 258
then ground using a mortar and pestle passed through a 65 μm sieve placed in sample bags 259
and returned to the desiccator The samples had then to be mixed with distilled water to enable 260
the pH test to be performed A 110 ratio of cement to water was used and mixed for 24 hours 261
using a rotating machine To get the pH reading the samples were put into a centrifuge machine 262
to separate the solid and liquid At this stage the solution should have a pH equivalent to cement 263
10
it was mixed with To get a pH reading for the samples a pH device was used where a probe 264
is placed in the solution The machine was calibrated with three buffer solutions of 7 10 and 265
13 pH levels before measuring the pH of the samples 266
SEM (scanning electron microscopy) was carried out using a JEOL JSM6400 on flat fractured 267
surface specimens obtained from compression testing at 7-day samples Prior to SEM testing 268
the samples were mounted onto metal stubs using carbon paste and coated with gold film to 269
ensure good conductivity The accelerated voltage was set at 20 kV 270
22 Statistical Design and Modelling of Experiments 271
The technique of analysis used in this study was a 2k factorial experimental design [37] to 272
evaluate the influence of two different levels (maximum and minimum) for each variable on 273
the relevant grout properties Three key parameters (WB ANH GGBS) that should have 274
significant influence on mix characteristics of supersulfated cements were selected to formulate 275
the mathematical models for evaluating relevant properties (ie k = 3 in this study thus the 276
total mixes for the factorial design was 23 = 8) Additionally a mix at the central point was 277
replicated four times to estimate the experimental error and improve the reliability of the 278
models The coding and levels of the variables (WB and dosages of GGBS and ANH) are 279
given Table 2 280
The statistical models are valid for supersulfated grout (SSC) mixes made with WB GGBS 281
and ANH in the ranges of 034 to 044 60 to 80 and 0 to 20 respectively The modelled 282
experimental region consisted of mixtures ranging from coded variables of ndash1 to +1 The coded 283
factors for variables were calculated by 284
Coded Factor = (Actual value-Factor means)[Range of factor value2] (2) 285
Hence 286
Coded WB = (Actual WB ndash 039)005 287
Coded GGBS = (Actual GGBS ndash 07)01 288
Coded Anhydrite = (Actual ANH ndash 01)01 289
The responses modelled were mini-slump plate cohesion Marsh cone yield stress plastic 290
viscosity induced bleeding at 1 min 5 and 30 mins permeability at 1 min and 30 mins 291
compressibility and compressive strength at 1 3 7 and 28 days The general model associated 292
11
with the two-level factorial design incorporating three independent variables (WB GGBS 293
ANH) is expressed by 294
Y1 = a0 + a1WB + a2GGBS + a3ANH+ a4WBGGBS + a5WBANH + a6GGBSANH 295
+ a7WBGGBSANH + ε (3) 296
where 297
Y1 Response (mini slump marsh cone plate cohesion etc) 298
a0 Overall mean factor effect 299
a1-a7 Regression coefficients representing model constants (contribution of independent 300
variables and their interaction to each response) 301
a1WB a2GGBS a3ANH Linear effect of factors WB GGBS and ANH 302
a4WBGGBS a5WBANH a6GGBSANH a7WBGGBSANH Interaction effects of 303
factors WB GGBS and ANH 304
ε Random error term representing the effects of uncontrolled variables 305
Analysis of variance (ANOVA) was used to test the significance of regression models and t-306
tests were performed to identify the non-significant (NS) variables and second order 307
interactions which were subsequently eliminated from the derived models Model coefficients 308
were determined using multi-linear regression analysis based on a normal distribution 309
assumption The error was assumed to be random and normally distributed so the residual 310
terms which represent the difference between the actual and predicted values should exhibit 311
similar properties [37] The probability value (Prob) obtained from ANOVA determines the 312
statistical significance of each factor and their interactions For most of the parameters the 313
probability that the derived coefficients associated with the various variables influencing each 314
response were limited to 10 This signifies that there is less than 10 chance or 90 315
confidence limit that the contribution of a given parameter to the tested response exceeds the 316
value of the specified coefficient A negative estimate indicates that an increase of the given 317
parameter results in a reduction of the measured response 318
12
3 Results and discussion 319
The results of the experimental work characterize the behaviour of the mortars with different 320
WB ANH and GGBS levels Table 3 summarises all results of the experimental work 321
performed The results were used to construct the regression models 322
Table 3 Average results from experimental work 323 324
Viscometer Induced bleeding
Mix Mini-
slump
Flow
time
Cohesion
meter
Yield
value
Plastic
viscosity
1min 5min 30min
(mm) (s) (mm) (Pa) (Pas) (mL) (mL) (mL)
1 61 230 105 191 0923 220 470 480
2 89 25 55 97 0323 290 780 810
3 67 200 118 172 0802 280 580 605
4 111 12 20 80 0199 490 860 860
5 52 360 143 251 1203 280 520 540
6 83 69 86 99 0403 360 700 700
7 60 250 125 211 0980 310 580 590
8 110 13 40 77 0224 350 910 950
9 71 150 87 101 0617 370 720 730
10 73 102 122 106 0681 290 620 620
11
12
77
74
192
83
89
110
124
101
0660
0641
290
350
640
715
645
720
325
Table 3 Average results from experimental work (continued) 326
Mix Permeability Permeability Compre-
ssibility
Compressive strength
1 min 30 min fc 1d fc 3d fc 7d fc 28d
(ms) (ms) (MPa) (MPa) (MPa) (MPa)
1 216E-09 317E-09 0155 299 506 581 704
2 512E-08 418E-09 0298 168 383 547 558
3 448E-08 366E-09 0194 213 334 406 527
4 374E-08 425E-09 0312 140 223 256 408
5 448E-08 342E-09 0173 233 434 507 535
6 512E-08 395E-09 0255 136 371 371 448
7 440E-08 361E-09 0187 108 232 343 532
8 451E-08 433E-09 0342 68 200 263 473
9 446E-08 402E-09 0250 196 328 398 592
10 468E-08 371E-09 0212 171 232 361 556
11
12
423E-08
516E-08
379E-09
400E-09
0221
0246
207
183
313
301
451
435
565
520
327
The derived quadratic statistical models of grout for mini-slump flow time cohesion plate 328
yield stress plastic viscosity induced bleeding at 1 min 5 min and 30 min permeability at 1 329
13
min and 30 min compressibility and compressive strength at 1 3 7 and 28 days are given in 330
Equations (4) to (18) where WB GGBS and ANH are given in codes values 331
Mini-Slump (mm) = 7881 + 1919 WB + 781 ANH + 444 WBANH - 294 GGBS (4) 332
333
Marsh flow time (s) = 1404 - 1153 WB ndash 261 ANH + 281 GGBS (5) 334
335
Plate Cohesion meter (microm) = 86 - 366 WB + 122 GGBS - 107 ANH - 091 WBANH (6) 336
337
Yield Value (Pa) = 1466 ndash 584 WB - 126 WBGGBS - 125 ANH + 124 GGBS (7) 338
339
Plastic Viscosity (Pas) = 063 - 034 WB - 0078 ANH + 0073 GGBS 340
- 0047 WBGGBS - 0022 ANHGGBS (8) 341
342
Induced Bleeding at 1 min (ml) = 3225 + 50 WB + 35 ANH ndash 225 WBANHGGBS (9) 343
344
Induced Bleeding at 5 mins (ml) = 675 + 1375 WB + 575 ANH (10) 345
346
Induced Bleeding at 30 mins (ml) = 6919 + 1381 WB + 594 ANH (11) 347
348
Permeability at 1 min (ms) x 10-8 = 4 + 0615 WB + 0621 AHN ndash 0773 WBGGBS 349
- 0426WBAHN - 0446 AHNGGBS (12) 350
351
Permeability at 30 min (ms) x 10-8 = 0382 + 0035 WB + 0014 ANH 352
+ 0008 WBANHGGBS (13) 353
354
Compressibility = 02396 + 00623 WB + 00194 ANH + 00012 WBANHGGBS (14) 355
356
ƒc 1 d (MPa) = 1705 - 426 WB - 384 ANH - 343 GGBS + 145 WBANH (15) 357
358
ƒc 3 d (MPa) = 3215 - 879 ANH - 412 WB ndash 261 GGBS (16) 359
360
ƒc 7 d (MPa) = 4092ndash 924 ANH - 5 WB - 383 GGBS (17) 361
362
14
ƒc 28 d (MPa) = 5348 - 515 WB - 382 ANH ndash 262 GGBS + 436 ANHGGBS (18) 363
364
The correlation coefficient of most of the proposed models were higher than 090 except for 365
plastic viscosity compressive strength after 3days and compressive strength after 28days 366
which have coefficients of 070 086 and 087 respectively 367
Table 4 shows the average measured responses of the four replicate grouts the coefficients of 368
variation (COV) as well as the estimated errors with a 90 confidence limit for each of the 369
measured properties The estimated error levels for mini-slump plate cohesion meter Marsh 370
cone yield stress plastic viscosity induced bleeding at 1 min 5 min and 30 mins permeability 371
at 1 min and 30 min compressibility and compressive strengths at 1 3 7 28 days were plusmn 22 372
mm plusmn 0001mm plusmn 40 s plusmn 09 Pa plusmn 002 Pa s plusmn 28 ml plusmn 42 ml plusmn 45 ml plusmn 32x10-9 (ms) 373
plusmn 13x10-10 (ms) plusmn 00153 plusmn 13 MPa plusmn 35 MPa plusmn 33 MPa and plusmn 25 MPa respectively 374
The relative experimental errors for mini-slump plate cohesion meter Marsh cone yiled stress 375
plastic viscosity induced bleeding permeability compressibility compressive strengths were 376
limited to 3-11 On the other hand relative error for march cone was up to 30 377
Table 4 Repeatability of test parameters at the central point 378
379
Tests Mini-
slump
Plate
cohesion
Marsh
cone
Yield
stress
Plastic
viscosit
y
Induced
bleeding
at 1 min
Induced
bleedin
g at 5
min
Induced
bleeding
at 30
min
Mean (n=4) 736
mm
001
mm
1318
s
108
Pa
065
Pa s
325
ml
674
ml
679
ml
Coefficient
of variation
()
37 115 372 105 42 127 76 80
Estimate
error (90
confidence
limit)
22
mm
0001
mm
402
s
09
Pa
002
Pa s
28
ml
42
ml
45
ml
380
381 Table 4 Repeatability of test parameters at the central point (continued) 382
383
Tests
Permeability
1 min
x10-8
Permeability
30 min
x10-8
Compressibility frsquoc 1d frsquoc 3d frsquoc 7d frsquoc 28d
Mean (n=4) 463
ms
0388
ms 02323
189
MPa
293
MPa
411
MPa
558
MPa
Coefficient
of variation
()
85 39 8 84 144 98 53
15
Estimate
error (90
confidence
limit)
032
(ms)
0013
(ms)
00153
13
MPa
35
MPa
33
MPa
24
MPa
384
385
31 Accuracy of the established models 386
387
The ratio of predicted-to-measured properties for grout ranged between 087 and 115 388
indicating good accuracy for prediction of mini-slump plate cohesion induced bleeding at 1 389
min 5 mins and 30 mins yield stress plastic viscosity and compressive strength at 1-d 3-d 7-390
d and 28-d In general the proposed models for mini-slump plate cohesion Marsh cone and 391
compressive strength appeared to be accurate in predicting fluidity cohesivity induced 392
bleeding permeability at 30 min compressibility and compressive strength with low scatter 393
between measured and predicted values However the average values of predictedmeasured 394
ratio of yield values were slightly higher (074) 395
396
32 Isoresponses of the proposed models 397
398
The isoresponse surfaces and contour plots for mini-slump plate cohesion Marsh cone yield 399
stress plastic viscosity induced bleeding at 1 min 5 mins and 30 mins permeability at 1 min 400
and 30 mins compressibility and compressive strength at 1-d 3-d 7-d and 28-d were obtained 401
by using response surface methodology (RSM) The isoresponse surfaces and contour plots 402
were obtained from the regression models and because the models contained interaction and 403
second-order variables the contour lines were curved 404
The proposed statistical models can therefore be used to evaluate the effect of a group of 405
variables on the properties affecting the quality of supersulfated grout This allowed for the 406
calculation of isoresponse surfaces from the parameters under study outside the experimental 407
domain and the optimisation of their effects The next sections will discuss the results of each 408
experiment separately 409
331 Mini-slump 410
As shown in Eq 4 the mini-slump is influenced in order of significance by WB ratio 411
anhydrite proportion interaction of WB and ANH and the percentage of GGBS content The 412
WB ratio had the greatest effect on fluidity due to better lubrication of the particles in the paste 413
16
[29] The mini-slump test was accompanied by very low shear The value of mini-slump is to 414
characterise yield stress [38] therefore higher mini-slump value indicated a lower yield stress 415
The effect of WB on the increase of mini-slump was two and half-time than that of ANH (192 416
vs 781 in Eq 4) However increased ANH resulted in a 27 times greater increase in mini-417
slump than reduced GGBS (781 vs -294 in Eq 4) Figure 1(a) shows the effect of increased 418
WB on mini-slump vs ANH (when GGBS was kept constant at 70) and Figure 1(b) shows 419
GGBS vs ANH (when WB was fixed at 039) Based on these figures it is evident that mini-420
slump increased significantly when the dosage of WB and ANH increased 421
422
(a) (b) 423
Fig 1 Isoresponse curves of mini-slump (mm) (a) WB vs ANH and (b) GGBS vs ANH 424
425
332 Marsh cone 426
The time needed for a grout sample to flow through the Marsh cone is proportional to the 427
viscosity of the cement grout the flow time becomes an index of fluidity so the longer the 428
flow time the lower the fluidity Similar to the previous trends Eq 5 shows that the values of 429
Marsh cone are influenced in order of significance by WB GGBS and ANH This is 430
graphically illustrated in Figure 2 431
GGBS = 70
034 039 042 044
0
5
10
15
20
WB
AN
H (
)
65
74
83
92
101
037
AN
H(
)
WB = 039
60 65 70 75 80
0
5
10
15
20
GGBS()
70
75
80
85
17
432
(a) (b) 433
Fig 2 Isoresponse curves for flow time (s) (a) WB vs ANH and (b) GGBS vs ANH 434
435
It can be noted that an increase in WB and ANH or a reduction in GGBS led to decreasing 436
the Marsh cone flow time For example at fixed WB at 039 and GGBS of 70 respectively 437
the increase in ANH dosage from 5 to 20 led to a marked reduction of the Marsh cone flow 438
time from 170 to 140 s (Figure 2(a)) This behaviour is attributed to the change in plastic 439
viscosity of the grout as will be discussed later 440
333 Cohesion plate 441
As shown in Eq 6 the cohesion plate was influenced in order of magnitude by the WB and 442
the percentage of GGBS and ANH The increasing WB had a 34 times the influence on the 443
reduction of the cohesion plate test results as the increased ANH (for a GGBS constant) By 444
comparing the effects of WB and GGBS on plate cohesion the increased WB can be 445
interpreted as having approximately a 3 times greater influence on the reduction of plate 446
cohesion values than the increase in GGBS (-366 vs 122 in Eq 6) given that ANH is held 447
constant The effect of an increase in WB from 034 to 044 and ANH from 0 to 20 with a 448
fixed GGBS dosage of 70 is presented in Figure 3(a) Increased WB led to a decreased 449
cohesion plate value Conversely an increase in GGBS increased the cohesion plate value and 450
an increased ANH caused a reduction in cohesion plate (Figure 3(b)) 451
GGBS = 70
034 036 039 042 0440
5
10
15
20
WB
AN
H (
)
40
6080
100120
140160
180200
220
WB = 039
60 65 70 75 80
0
5
10
15
20
GGBS ()
AN
H (
)
100
120
140
160
180
18
452
(a) (b) 453
Fig 3 Isoresponse curves for plate cohesion meter (a) WB vs ANH and (b) GGBS vs 454 ANH 455
334 Yield stress 456
As shown in Eq 7 yield value was influenced in order of magnitude by WB and dosages of 457
ANH and GGBS Based on Figure 4 (a) when WB was fixed at 039 GGBS maintained at 458
70 and ANH increased to 5 the isoresponse curve showed a yield value of 15 Pa On the 459
other hand if the proportion of ANH was further increased to 20 while GBBS was 460
maintained at 70 the yield value decreased to 135 Pa This corresponds with Eq (7) in 461
which the proportion of WB and ANH were increased while GGBS was kept constant 462
resulting in a reduction in yield stress An increase in GGBS content resulted in an increase of 463
the yield stress 464
Figure 4 (b) shows the isoresponse curve of the yield value with a fixed proportion of GGBS 465
at 70 When WB was 039 and ANH was 5 the isoresponse of the predicted yield value 466
was 155 Pa If ANH was increased to 20 while maintaining WB at 039 the isoresponse of 467
the yield value was 135 Pa 468
It can be interesting to note that the observed results for the yield stress are closed to the one 469
observed with the cohesion plate and mini-slump tests This is expected as yield stress values 470
can be derived from those two simple tests 471
GGBS = 70
034 037 039 042 0440
5
10
15
20
WB
AN
H(
)
45
55
65
7585
95
105
115
WB = 039
60 65 70 75 800
5
10
15
20
GGBS ()
AN
H(
)
75
85
95
105
19
472
(a) (b) 473
Fig 4 Isoresponse curves for yield stress (Pa) (a) WB vs ANH and (b) GGBS vs ANH 474
335 Plastic viscosity 475
Plastic viscosity was influenced in order of magnitude by WB and the dosages of ANH and 476
GGBS ANH and GGBS had almost opposite effects on plastic viscosity (-0078 vs 0073 in 477
Eq 8) As shown in Eq (8) increased WB had the greatest primary effect on plastic viscosity 478
(034 vs 0078 and 0073) The increased WB had approximately a 44 times greater influence 479
on reducing plastic viscosity than increased ANH or decreased GGBS 480
In the isoresponse curve of plastic viscosity shown in Figure 5 (a) when GGBS was fixed at 481
70 WB set at 039 and ANH maintained at 5 the predicted plastic viscosity value was 482
068 Pas On the other hand if the dosage of ANHB was increased to 20 while maintaining 483
a similar WB the plastic viscosity was reduced to 055 Pas 484
In Figure 5 (b) WB was fixed at 039 when GGBS was held at 70 and ANH at 5 the 485
predicted plastic viscosity was 067 Pas However when ANH was increased to 20 and 486
GGBS was maintained at 70 the predicted plastic viscosity dropped to 055 Pas 487
AN
H(
)
GGBS = 70
034 037 039 042 044
0
5
10
15
20
WB
1012
1416
18
20
WB = 039
60 65 70 75 800
5
10
15
20
GGBS ()
AN
H(
)
13
14
15
20
488
(a) (b) 489
Fig 5 Isoresponse curve for plastic viscosity (Pas) (a) WB vs ANH and (b) GGBS vs 490
ANH 491
336 Induced bleeding 492
The induced bleeding equations for 1 and 5 minutes (Eqs 9 10) and 30 minutes (Eq 11) are 493
very similar The two influencing factors of induced bleeding are WB ratio and anhydrite 494
WB ratio has the greatest effect over two times the effect of anhydrite content Figure 6 shows 495
the isoresponse for bleeding versus the WB ratio for a fixed value of GGBS at 70 It can be 496
seen that when an anhydrite value is selected and the WB ratio is increased the bleeding will 497
also increase Similarly if a WB ratio is selected and the anhydrite content is increased the 498
bleeding will again increase 499
500
GGBS = 70
034 037 039 042 0440
5
10
15
20
WB
AN
H(
)
035
045
055
065
075
085
095
WB = 039
60 65 70 75 800
5
10
15
20
GGBS ()
AN
H(
)
055
060
065
075
034 036 039 042 044
0
5
10
15
20
WB
AN
H (
)
26
28
30
3234
36
38
40
GGBS=70
21
(a) 501
502
(b) (c) 503
Fig 6 Isoresponse curves for induced bleeding at 1 5 and 30 min WB vs ANH 504
337 Permeability 505
Figure 7 (a) and (b) showed firstly that the permeability decreased significantly from 1 min to 506
30 min Permeability at 1 min was influenced in order of magnitude by WB and the dosage 507
of ANH All interactions between 3 parameters had almost opposite effects on permeability 508
(Eq 12) As shown in Eq (12) increased WB and AHN had the greatest primary effect on 509
permeability at 1 min It seems there is an optimum reached at WB = 40 and AHN at 17 510
Similarly the permeability at 30 min is affected in order of significance by WB followed by 511
ANH (Eq 13) In Figure 7 (b) WB was fixed at 039 when GGBS was held at 70 and ANH 512
at 10 the predicted permeability was 038 x 10-8 (ms) However when ANH was increased 513
to 20 and GGBS was maintained at 70 the predicted permeability increased to 040x10-8 514
(ms) 515
516
GGBS = 70
034 036 039 042 0440
5
10
15
20
WB
AN
H (
)
545
61
675
74
805
GGBS = 70
034 036 039 042 0440
5
10
15
20
WB
AN
H (
)
56
60
64
68
72
7680
84
22
517
(a) (b) 518
Fig 7 Isoresponse curves for permeability at 1 and 30 min WB vs ANH 519
338 Compressibility 520
As shown in Eq (14) the compressibility was influenced in order of magnitude by the WB 521
and the percentage of ANH The interaction between 3 parameters affected also the 522
compressibility The increasing WB had a 32 times the influence on the increase of the 523
compressibility results as the increased ANH (for a GGBS constant) The effect of an increase 524
in WB from 034 to 044 and ANH from 0 to 20 with a fixed GGBS dosage of 70 is 525
presented in Figure 8 Increased WB led to an increase of compressibility Similarly an 526
increase in AHN increased the compressibility 527
528
Fig 8 Isoresponse curves for compressibility WB vs ANH 529
034 036 039 042 044
0
5
10
15
20
GGBS = 70 WB
AN
H (
)
3
35
4
4
45
5
034 036 039 042 044
0
5
10
15
20
WB
AN
H (
)
034
035
036 037 038 039 04
041
042
4
GGBS=70
034 036 039 042 044
0
5
10
15
20
WB
AN
H (
)
017
019
021 023 025 027
029
031
GGBS=70
23
530
339 Compressive strength 531
After one day from Eq 15 the influencing factors in order of significance are WB ratio 532
anhydrite content GGBS content and the interaction of WB and ANH The effect of the first 533
three was similar but WB had 11 times greater effect than anhydrite and 125 times greater 534
effect than GGBS While the interaction of WB and anhydrite had around a third of the 535
influence of WB Figures 9 (a) and (b) show the isoresponses for 1-day compressive strength 536
From Figure 9 (a) it can be seen when the GGBS content is fixed at 70 for a given anhydrite 537
content increasing the WB ratio will decrease the strength Also if a WB ratio is selected and 538
the anhydrite is increased similarly the strength will decrease From Figure 9 (b) with the WB 539
ratio fixed at 039 once again an increase in GGBS led to a reduction of compressive strength 540
at 1 day 541
542
(a) (b) 543
Fig9 Isoresponse curves for compressive strength at 1d (a) (WB vs ANH) and (b) (GGBS 544 vs ANH) 545
Eqs 16 17 and 18 show the effect of GGBS and ANH percentages on compressive strength at 546
3-d 7-d and 28-d Figures 10 11 and 12 show the isoresponse of the compressive strength at 547
3-d 7-d and 28-d respectively with WB vs ANH Increased ANH led to a decrease of 3-d 548
and 7-d compressive strength As expected an Increase in WB led to a decrease in compressive 549
strength The percentage of ANH had a negative effect on compressive strength and showed a 550
greater influence particularly at 3-d and 7-d (879 (3 d) amp 924 (7d) vs 382 (28 d)) GGBS has 551
a negative impact on early strength development The negative effect of GGBS on compressive 552
GGBS = 70
034 037 039 042 0440
5
10
15
20
WB
AN
H(
)
12
14
16
18
20
22
2426
WB = 039
60 65 70 75 800
5
10
15
20
GGBS ()
AN
H(
)
10
12
14
16
18
20
22
24
strength at early ages is clearly attributable to the fact that up to 80 of cement has been 553
replaced by GGBS and it takes some time for GGBS to start developing its pozzolanic action 554
at a noticeable level The results indicate that ANH content influences strength to a greater 555
extent than GGBS at all ages The SO3 content was reported to have great influence on the 556
strength [39 40] 557
558
(a) (b) 559
Fig10 Isoresponse curves for compressive strength at 3d (a) (WB vs ANH) and (b) 560 (GGBS vs ANH) 561
562
563
(a) (b) 564
Fig11 Isoresponse curves for compressive strength at 7d (a) (WB vs ANH) and (b) (WB 565 vs ANH) 566
567
GGBS = 70
034 036 039 042 0440
5
10
15
20
WB
AN
H (
)
24
2628
30
3234
3638
4042
WB = 039
60 65 70 75 80
0
5
10
15
20
GGBS ()
AN
H (
)
2426
2830
32
34
36
3840
42
GGBS = 70
034 037 039 042 044
0
5
10
15
20
WB
AN
H(
)
3032
34
3638
40
42
44
46
48
WB = 039
60 65 70 75 80
0
5
10
15
20
GGBS ()
AN
H(
)
32
34
36
38
40
42
44
46
48
25
568
(a) (b) 569
Fig12 Isoresponse curves for compressive strength at 28d (a) (WB vs ANH) and (b) 570
(ANH vs GGBS) 571
3310 Discussion of the effect of WB GGBS and ANH 572
As expected the increase of WB led to an increase in mini-slump induced bleeding and a 573
reduction in flow time plate cohesion yield stress plastic viscosity and compressive strengths 574
This can be attributed to more water in the system 575
An increase in GGBS content resulted in a reduction of the flow time plate cohesion yield 576
stress and plastic viscosity while the fluidity is improved This was due to the fact the specific 577
gravity of slag is lower than that of PC leading to an increase in the paste volume and thus 578
improving the fluidity of paste 579
In case of an increase of ANH proportion while WB and GGBS were kept constant it led to 580
an increased mini-slump and induced bleeding while the flow time plate cohesion yield stress 581
and plastic viscosity were reduced This was due to the lower reactivity of ANH resulting in an 582
increase of water needed for lubrication of paste 583
As expected an increase in WB lead to an increase in induced bleeding permeability and a 584
decrease in compressibility [33 35] This is due to the increase in liquid volume between the 585
particles and to the reduction in the amount of interparticle forces Globally the compressibility 586
decreases and the permeability increases with ANH It can be explained by the reduced specific 587
area and lower reactivity that can lead to more available water in the samples 588
3311 Heat of Hydration 589
Heat of hydration is considered an important factor in the cement design as low heat of 590
hydration reduces the effect of thermal cracking The heat flow results of the calorimeter test 591
performed over a three days period can be seen in Figure 13 592
GGBS = 70
034 036 039 042 0440
5
10
15
20
WB
AN
H (
)
46
48
50
52
54
56
58
60
WB = 039
0 5 10 15 2060
65
70
75
80
ANH ()
GG
BS
(
)
50
52
54
56
5860
62
26
593
Fig 13 Heat flow graphs for first 3 days of reaction 594
Figure 13 presents that the largest peaks were in mixes 1 2 5 and 6 This shows that these 595
reactions generated the most heat and that they were quick Mixes 1 and 2 have the highest 596
OPC content at 40 and this suggests that to lower the heat of the reaction minimal OPC 597
should be used This is confirmed by the fact that mixes 5 and 6 have the next highest OPC 598
contents the same percentage as mixes 3 4 and 9 (one of the repeated mixes) which have 599
anhydrite present This implies that the presence of anhydrite will lengthen the reaction process 600
and reduce the heat produced during setting significantly The graph shows this by the absence 601
of a sharp peak instead a gentle curved hump is shown over a 2-day period whereas the mixes 602
showing a sharp peak occur after about 12 hrs Mix 7 which has the same solids content as 603
mix 8 but a lower WB ratio and no cement present showed the lowest heat flow during the 604
hydration process 605
Figure 14 shows the cumulative heat generation during the first 3 days of setting It is clear that 606
the two mixes (1 and 2) with highest cement content and absence of anhydrite had the highest 607
cumulative heat development over the 3-day period 643J and 594J respectively Mixes 3456 608
and 9 which all have 20 OPC content generated similar heat value over the 3 days Results 609
of mixes containing ANH implies that over the period that the anhydrite did not reduce the 610
cumulative heat generated but slowed the reaction and reduce the peak heat generated The 611
0
0002
0004
0006
0008
001
0012
0 50000 100000 150000 200000 250000 300000
He
at F
low
(mW
)
Time s()
M1
M2
M3
M4
M5
M6
M7
M9
1Day
2Day
3day
1d 2d 3d
27
graphs also suggest that a higher WB ratio produced a lower cumulative and peak heat 612
generation613
614
Fig 14 Cumulative heat generation curves for first 3 days 615
3312 pH measurements 616
Fig 15 summarises the results of pH and the nine mixes with different compositions of WB 617
the percentages of cement GGBS and ANH It is shown that Supersulfated cements (SSCs) 618
have lower pH values (lt 125 at all ages) than PC which has a pH of 139 [41] making SSC 619
more preferable in essential applications such as nuclear waste encapsulation 620
The figure shows that the pH value decreased with time for all samples between 1 and 7 days 621
Similar trend was observed in the majority of mixes between 7 and 28 days except for sample 622
2 5 and 9 which showed slight increase in the pH values This decrease refers to the 623
consumption of ions in the pore structure due to the hydration process 624
0
100
200
300
400
500
600
700
800
0 50000 100000 150000 200000 250000 300000
(J)
Time (s)
M1
M2
M3
M4
M5
M6
M7
M9
1 Day
3 Day
2 day
1d 2d 3d
1
2
3
9
45
6
7
28
625
626 Fig 15 Summary of pore solution pH 627
628
The incorporation of ANH replacing the Portland cement (C) results in remarkable decrease in 629
pH at all ages as introducing the ANH reduced the lower initial pH Likewise the increase in 630
the content of GGBS led to a decrease in the pH value of the pore structure as GGBS has lower 631
initial pH than Portland cement The increase of WB ratio decreased the pH value This is in 632
agreement with Collier [41] who found that increasing the wb ratio from 05 to 06 increased 633
the pH by I unit This was attributed to the increased availability of water in the case of WB 634
of 06 allowing hydration of more cement powder thereby releasing more hydroxide anions 635
into solution However in this study the WB ratio did not show a significant effect on 636
lowering the pH These results are in agreement with [42] which also found that decreasing the 637
pH improved the bulk resistivity of SSC mixtures 638
3313 SEM 639
Figure 16 shows the SEM images of some mixes at various magnifications The images clearly 640
show the dense and compact structure of the cement after seven days The dense structure was 641
another requirement from the cement chosen to enclose the waste to prevent leaching The 642
microstructure consists mainly of C-S-H the main hydration product and unhydrated slag 643
grains C-S-H is formed after the dissolution of slag grains when contacting the water and 644
alkalis and then the ionic species saturate the solution and then precipitate as hydrated phases 645
[8] There were abundant grains of hydrated and partially hydrated slag grains some small 646
1080
1100
1120
1140
1160
1180
1200
1220
1240
1260
1280
1 2 3 4 5 6 7 8 9
pH
val
ue
Mix Number
1 Day
7 Days
28 Days
29
GGBS particles presented rims of reaction products (eg Mix 6-Figure 16 (f) and Mix 9-Figure 647
16 (h)) It was found by [11] that the composition of the reaction rims around slag was similar 648
to that of the C-S-H from PC However [12] found that in the CndashSndashH of SSC is apparently 649
more foil like which is different than the fibrillar morphology of C-S-H in OPC Mix 3 and 650
Mix 4 (Figure 16 (c) and (d) respectively) exhibits more micro voids in the micrsostructure 651
which could explain the low strength of these mixes compared to mix 1 and 2 Ettringite was 652
not detected Ettringite is not the most abundant phase and it is not easy to detect in dried 653
polished samples because it is easily decomposed under the drying conditions of the vacuum 654
of the microscope column [11] 655
(a) Mix 1 image at 1100 magnification (b) Mix 2 image at 900 magnification
(c) Particle of unreacted slag mix3 7 days (d) An overall image of mix 4 at 7days
showing CSH and BFS particles
30
(e) Mix 5 image at 1100 magnification (f) Mix 6 image at 2300 magnification
(g) Mix 7 image at 2000 magnification (h) Mix 9 image at 2700 magnification
Fig 16 SEM results 656
4 Conclusions 657
The paper focused on optimizing the SSC cement grout in order to get the best of it The effect 658
of GGBS WB and ANH dosages on the grout fluidity rheological properties induced 659
bleeding maximum heat of hydration and compressive strength was investigated using 660
factorial design approach and analysis The models derived in this study are valid for the 661
experimental area corresponding to grout mixes made with variable levels of WB ANH and 662
GGBS in the ranges of 034 to 044 0 to 20 by mass of binder 60 to 80 by mass of 663
binder respectively Based on the results from this study the following conclusions are drawn 664
- In comparison to GGBS and ANH WB ratio had more pronounced effects on the 665
results of mini-slump plate cohesion meter Marsh cone time yield stress plastic viscosity 666
induced bleeding permeability compressibility and compressive strength 667
31
- The increase in the dosage of GGBS led to an increase in the values of plate cohesion 668
meter Marsh cone time yield stress and plastic viscosity while reducing the mini-slump 669
values maximum hydration and compressive strength This is ascribed to the fine nature 670
of GGBS particles and pozzolanic effect 671
- While the ANH particles caused a decrease in the maximum of heat of hydration it 672
increased the induced bleeding permeability and compressibility due to its dominant effect 673
on increasing the dormant period and increasing the rates of solid sedimentation and 674
induced bleeding water 675
- Increasing the dosage of ANH in grout reduced the hydrations kinetic at early-age and 676
thus reduced the compressive strength at 1d 3d and 7d However this effect diminished 677
at later ages at 28 d in a manner similar to increasing WB 678
- The increase in the dosage of ANH led to an increase in the mini-slump values 679
(fluidity) but a decrease in the values of yield stress plastic viscosity plate cohesion and 680
Marsh cone time This is attributed to better deflocculation of particles at the fresh state 681
- The increase of GGBS percentage delayed the reaction process and decreased the total 682
heat after 3 days while WB slightly reduced the total heat it didnrsquot significantly affect the 683
reaction process 684
- pH measurements in the present study confirmed the suitability of these mixture to low-685
pH applications as the increase in both the GGBS and ANH markedly decreased the initial 686
pH thereby lowering the pH at different ages 687
- The modelling and prediction of the response of other points in the experimental domain 688
were therefore possible Although the models are based on a given set of materials they 689
can be easily used to generate future results using other materials 690
- Dense microstructure was observed for mixes examined in this study C-S-H is the main 691
reaction product with presence of unreacted slag grains embedded well in the structure 692
However some micro voids were observed in mixes containing ANH which led to lower 693
compressive strength of mixes with ANH 694
CRediT authorship contribution statement 695
MSonebi and YBai did the conceptualization and the design of investigation as well as 696 performing the experiments MSonebi carried out the software analysis of the results and the 697
32
visualization MSonebi AAbdalqader T Fayyad and APerrot analysed the results and 698 wrote the original draft and reviewed and edited the final version 699
Declaration of Competing Interest 700
The authors declare that they have no known competing financial interests or personal 701 relationships that could have appeared to influence the work reported in this paper 702
Acknowledgments 703
The authors would like to express their gratitude to P McCann from QUB and N Collier 704 from Eden Nuclear and Environment Ltd for their helps for some experiments 705
706
References 707
1 Schneider M Romer M Tschudin M Bolio H (2011) Sustainable cement production-708 present and future Cement and Concrete Research 41642ndash650 709
httpsdoiorg101016jcemconres201103019 710
2 Madlool NA Saidur R Hossain MS Rahim NA (2011) A critical review on energy use 711 and savings in the cement industries Renewable and Sustainable Energy Reviews 712
152042ndash2060 httpsdoiorg101016jrser201101005 713
3 EN15743 (2015) BS EN 157432010+A12015 Supersulfated cement - Composition 714
specifications and conformity criteria BSI 715
4 Khatib JM Wright L Mangat PS (2016) Mechanical and physical properties of concrete 716
containing FGD waste Magazine of Concrete Research 68550ndash560 717 httpsdoiorg101680macr1500092 718
5 Khatib JM Mangat PS Wright L (2008) Sulfate resistance of mortar containing 719
simulated FGD waste Proceedings of Institution of Civil Engineers Construction 720 Materials 161119ndash128 httpsdoiorg101680coma20081613119 721
6 (2020) Specifying Sustainable Concrete 722
7 Hewlett PC (2004) Learsquos Chemistry of Cement and Concrete fourth edi Elsevier 723 Science amp Technology Books Oxford 724
8 Gruskovnjak A Lothenbach B Winnefeld F et al (2008) Hydration mechanisms of 725 super sulphated slag cement Cement and Concrete Research 38983ndash992 726
httpsdoiorg101016jcemconres200803004 727
9 Grounds T Nowell D V Wilburn FW (2003) Resistance of supersulfated cement to 728 strong sulfate solutions Journal of Thermal Analysis and Calorimetry 72181ndash190 729
httpsdoiorg101023A1023928021602 730
10 Grounds T Nowell D V Wilburn FW (1995) The influence of temperature and 731
different storage conditions on the stability of supersulphated cement Journal of 732 Thermal Analysis 45385ndash394 httpsdoiorg101007BF02548772 733
33
11 Bazalduacutea-Medelliacuten ME Fuentes AF Gorokhovsky A Escalante-Garciacutea JI (2015) Early 734 and late hydration of supersulphated cements of blast furnace slag with fluorgypsum 735 Materiales de Construccion 65e043 httpsdoiorg103989mc201506013 736
12 Matschei T Bellmann F Stark J (2005) Hydration behaviour of sulphate-activated slag 737 cements Advances in Cement Research 17167ndash178 738
httpsdoiorg101680adcr2005174167 739
13 Richardson IG (2000) Nature of the hydration products in hardened cement pastes 740 Cement and Concrete Composites 2297ndash113 httpsdoiorg101016S0958-741 9465(99)00036-0 742
14 Baux C Phelipot-Mardeleacute A Lanos C et al (2013) PERFORMANCES OF SUPER 743 SULFATED CEMENTS In International Conference on Concrete Under Severe 744 Conditions pp 1857ndash1870 745
15 Annabelle Phelipot-Mardeleacute Gabriel Samson Christophe Lanos (2015) Super sulfated 746 cement formulation and uses In Construction Materials ConMat Whistler Canada 747
16 Milestone NB (2006) Reactions in cement encapsulated nuclear wastes need for 748 toolbox of different cement types Advances in Applied Ceramics 10513ndash20 749
httpsdoiorg101179174367606X81678 750
17 Batchelor B (2006) Overview of waste stabilization with cement Waste Management 751
26689ndash698 httpsdoiorg101016JWASMAN200601020 752
18 Zhang T Cheeseman CR Vandeperre LJ (2011) Development of low pH cement 753
systems forming magnesium silicate hydrate (MSH) Cement and Concrete Research 754 41439ndash442 httpsdoiorg101016jcemconres201101016 755
19 Mobasher N Bernal SA Provis JL (2016) Structural evolution of an alkali sulfate 756
activated slag cement Journal of Nuclear Materials 46897ndash104 757 httpsdoiorg101016JJNUCMAT201511016 758
20 Wang J Yu B Gao Y (2014) Hydration Characteristics of Super Sulphated Cement 759 with Different Fineness In Proceedings of the International Conference on Material 760 and Environmental Engineering (ICMAEE 2014) Atlantis Press Paris France 761
21 Naumlgele E (1986) The Zeta-potential of cement Part II Effect of pH-value Cement and 762 Concrete Research 16853ndash863 httpsdoiorg1010160008-8846(86)90008-6 763
22 Jain N Civil MG-IJ of M and 2015 U (2015) Formulation of Sulphate Resistant Super 764 Sulphated Cement Using Fluorogypsum and Granulated Blast Furnace Slag IOSR 765
Journal of Mechanical and Civil Engineering (IOSR-JMCE) 12153ndash159 766
23 Gao YX Yu BY Xu FL (2012) Effect of Modified Phosphogypsum on the Mechanical 767 Properties of Super Sulphate Cement Applied Mechanics and Materials 161264ndash268 768 httpsdoiorg104028wwwscientificnetAMM161264 769
24 Kantro D (1980) Influence of Water-Reducing Admixtures on Properties of Cement 770 PasteampmdashA Miniature Slump Test Cement Concrete and Aggregates 295ndash102 771
httpsdoiorg101520CCA10190J 772
34
25 Svermova L Sonebi M Bartos PJM (2003) Influence of mix proportions on rheology of 773 cement grouts containing limestone powder Cement and Concrete Composites 25737ndash774 749 httpsdoiorg101016S0958-9465(02)00115-4 775
26 Sonebi M (2006) Rheological properties of grouts with viscosity modifying agents as 776 diutan gum and welan gum incorporating pulverised fly ash Cement and Concrete 777
Research 361609ndash1618 httpsdoiorg101016JCEMCONRES200605016 778
27 Nehdi M Rahman M (2004) Effect of Geometry and Surface Friction of Test Accessory 779 on Oscillatory Rheological Properties of Cement Pastes ACI Materials Journal 780 101416ndash424 httpsdoiorg101435913428 781
28 Khayat KH Yahia A (1997) Effect of Welan Gum-High-Range Water Reducer 782 Combinations on Rheology of Cement Grout ACI Materials Journal 94365ndash372 783 httpsdoiorg1014359321 784
29 Lombardi G (1985) THE ROLE OF COHESION IN CEMENT GROUTING OF 785 ROCK In Proceedings of Fifteenth Congress on Large Dams International 786 Commission on Large Dams pp 235ndash261 787
30 Perrot A Rangeard D Picandet V Meacutelinge Y (2013) Hydro-mechanical properties of 788
fresh cement pastes containing polycarboxylate superplasticizer Cement and Concrete 789 Research 53221ndash228 httpsdoiorg101016JCEMCONRES201306015 790
31 Perrot A Lecompte T Khelifi H et al (2012) Yield stress and bleeding of fresh cement 791 pastes Cement and Concrete Research 42937ndash944 792
httpdxdoiorg101016jcemconres201203015 793
32 Sonebi M Perrot A (2019) Effect of mix proportions on rheology and permeability of 794 cement grouts containing viscosity modifying admixture Construction and Building 795
Materials 212687ndash697 httpsdoiorg101016jconbuildmat201904022 796
33 Picandet V Rangeard D Perrot A Lecompte T (2011) Permeability measurement of 797
fresh cement paste Cement and Concrete Research 41330ndash338 798 httpsdoiorg101016JCEMCONRES201011019 799
34 Perrot A Rangeard D (2017) Effects of mix design parameters on consolidation 800
behaviour of fresh cement-based materials Materials and Structures 50117 801 httpsdoiorg101617s11527-016-0988-0 802
35 Rangeard D Perrot A Picandet V et al (2015) Determination of the consolidation 803 coefficient of low compressibility materials application to fresh cement-based 804
materials Materials and Structures 481475ndash1483 httpsdoiorg101617s11527-014-805 0247-1 806
36 Massoussi N Keita E Roussel N (2017) The heterogeneous nature of bleeding in 807 cement pastes Cement and Concrete Research 95108ndash116 808 httpsdoiorg101016JCEMCONRES201702012 809
37 Montgomery D (2007) Design and Analysis of Experiments Second Edition John 810
Wiley amp Sons 811
35
38 Roussel N Stefani C Leroy R (2005) From mini-cone test to Abrams cone test 812 Measurement of cement-based materials yield stress using slump tests Cement and 813 Concrete Research 35817ndash822 httpsdoiorg101016jcemconres200407032 814
39 Mangat PS Khatib JM Wright L (2006) Optimum utilisation of FGD waste in blended 815 binders Proceedings of Institution of Civil Engineers Construction Materials 159119ndash816
127 httpsdoiorg101680coma20061593119 817
40 Khatib JM Mangat PS Wright L (2013) Early age porosity and pore size distribution of 818 cement paste with flue gas desulphurisation (FGD) waste Journal of Civil Engineering 819 and Management 19622ndash627 httpsdoiorg103846139237302013793609 820
41 Collier NC Milestone NB Gordon LE Ko SC (2014) The suitability of a supersulfated 821 cement for nuclear waste immobilisation Journal of Nuclear Materials 452457ndash464 822 httpsdoiorg101016jjnucmat201405078 823
42 Masoudi R (2018) Examining compositions hydration mechanisms and properties of 824 supersulfated cement for use in concrete by Examining compositions hydration 825 mechanisms and properties of supersulfated cement for use in concrete University of 826 Toronto 827
828
4
prevailing pH The pH resulting from cement hydration results in many metal contaminants 95
forming hydroxide or mixed hydroxide solids [17] Portland cement will tend to result in a 96
higher pH while combining it with lime as well as fly ash blast furnace slag and other 97
pozzolanic binders will result in lower pH The interactions of these binders with waste 98
components determine the extent of treatment [18] 99
There is a lack of data detailing the assessment criteria and performance of nuclear 100
encapsulation groutconcrete However general requirements of a cementitious system for 101
encapsulation can be summarised as follows an ability to incorporate waste and harden 102
fluidity of initial cemented mix and potential for remote mixing low permeability resistance 103
to water low temperature rise on setting workable setting time low free or unbound water 104
when setting reaction is complete low internal pH to avoid ongoing reactions such as 105
corrosion long term durability [16] 106
The solubility of many heavy metals is low at low pH and therefore low pH cements such as 107
SSC are likely to be particularly desirable cements for nuclear waste management [16ndash19] 108
This would help to make the nuclear energy as a clean and a safe source of energy a promising 109
alternative for future generations This again has highlighted some of the noteworthy 110
properties of the SSC where not only the pH value that makes SSC a promising option that 111
could be used to encapsulate nuclear waste material for disposal Also the heat of hydration in 112
supersulfated cement is much lower than that of OPC and therefore the heat gradient created 113
during hydration between the internal and external surfaces would not be as great and thus less 114
stress caused and less chance of cracking which would be unacceptable with nuclear waste 115
disposal It has high non-evaporable water content that is itrsquos chemically bonded to the silica 116
Besides that it has a good durability in aggressive environments such as structures exposed to 117
seawater or sulfate-bearing groundwater [9 14 15 20ndash22] 118
These technical and environmental benefits have re-simulated recent research on this type of 119
cement and brought the attention for re-investigating overcoming its drawbacks to offer a green 120
cement for very essential applications 121
Currently different researches are being carried out on SSC in order to optimize the usage of 122
SSC Many researchers have examined its various mixture compositions to determine the best 123
compositions for some desirable properties such as strength low permeability faster setting 124
time etc A research on slags activated with 15ndash20 calcium sulfate showed a higher 125
compressive strength in comparison with other mixtures when they examined slags classified 126
5
as low-lime high-alumina and when various SSC mixture compositions were examined with 127
70ndash85 slag 10-25 anhydrite and 5 Portland cement for alkali activation [15] 128
Gruskovnjak et al [8] investigated the effect of alumina content in the slag by examining two 129
types of slag with a high Al2O3 percentage content (12) and low Al2O3 percentage content 130
(77) The findings of their study showed that slag with high alumina contents produced more 131
ettringite and higher strength This was attributed to the higher dissolution rate of high alumina 132
slag SSC hydration characteristics with different fineness has also been investigated [20] It 133
showed that when sample particles become finer the compressive strength is significantly 134
higher Also there is some work which has been done on modifying the mechanical properties 135
of SSC with addition phosphogypsum [19 23] Recently the influence of curing temperature 136
was studied for supersulfated cements made with two slags having different chemical 137
compositions [20] It was found that SSC made with high-alumina slag resulted in higher 138
strengths and presented a more complex mechanism of hydration that was strongly influenced 139
by the solubility of anhydrite This is also being shown in [21] where the SSC made using high-140
alumina slag exhibited higher compressive strength and the use of higher activator contents 141
decreased the compressive strength 142
Based on recent researches and the fact that there are many factors and parameters involved in 143
the composition of SSC there is a demanding need for optimizing the cement grout in order to 144
effectively utilise it to fit for purpose The current paper aligns with this demand The effect of 145
GGBS water-to-binder ratio WB and anhydrite dosages on the grout fluidity rheological 146
properties induced bleeding fresh state permeability and compressibility maximum heat of 147
hydration and compressive strength will be investigated using factorial design approach and 148
analysis Although there is some research on SSC little research work has focused on 149
modelling the effects of the various parameters using a statistical approach Factorial design is 150
a powerful tool and widely used in experiments involving many factors It can be utilised to 151
study the joint effect of factors on responses or dependent variables and to develop models 152
applicable to design and development of experiments Simulation of models obtained with 153
factorial design can facilitate the test protocol needed to optimize cement grout within a given 154
set of performance criteria 155
6
2 Experimental Programme 156
21 Materials and Test Methods 157
The grout mixes investigated in this study were prepared with Standard CEM I 425N Portland 158
cement (PC) specified by BS EN 197-1 The ground granulated blast furnace slag (GGBS) in 159
accordance to BS EN 15167-2 was used The chemical composition of CEM I and GGBS are 160
provided in Table 1 Anhydrite (ANH) was used as the source of sulphate in the present study 161
and it was partially or completely replaced the PC The proportions of the grout mixes are 162
shown in Table 2 163
164
Table 1 Chemical and physical properties of cement and GGBS 165
Chemical analysis Material
CEM I GGBS
SiO2 () 2101 3518
Al2O3 () 492 1396
Fe2O3 () 284 025
MgO() 220 818
CaO () 6452 4121
Na2O () 020 019
K2O () 071 042
SO3 () 253 --
P2O5 () 011 --
LOI () 126 064
Physical analysis
Specific gravity 308 291
Specific surface area [m2kg] 360 600
166
Table 2 Mix proportions for the grouts used in the factorial design 167
Mix
No
Code WB
Percentage ()
WB GGBS ANH GGBS ANH
M1 -1 -1 -1 034 60 0
M2 1 -1 -1 044 60 0
M3 -1 1 -1 034 60 20
M4 1 1 -1 044 60 20
M5 -1 -1 1 034 80 0
M6 1 -1 1 044 80 0
M7 -1 1 1 034 80 20
M8 1 1 1 044 80 20
M9 0 0 0 039 70 10
M10 0 0 0 039 70 10
M11 0 0 0 039 70 10
M12 0 0 0 039 70 10
168
7
All grout mixes were prepared in 2 L batches using a high-shear mixer with a 45 L capacity 169
The mixing water was kept at 98 plusmn 02 ordmC to compensate for heat generated during mixing 170
The cement and GGBS were mixed with ANH in a sequence that started with adding all of the 171
water into the mixer After one minute the binder was gradually introduced The grout was 172
mixed for one minute followed by 30 seconds of rest Subsequently the grout was mixed again 173
for 2 min at a high speed (285 rpm) and for 1 min at the low speed (140 rpm) 174
For all tests the timing is given from zero time ie the time when the cement particles first 175
touch the mixing water The mini-slump flow test started at 7 min (immediately after the end 176
of mixing) The transparent cone-shaped mould described elsewhere [24] was placed in the 177
centre of a smooth Plexiglas plate After filling with grout the cone was gently lifted 178
(approximately 30 s after placement of the grout) When the flow stopped the spread of the 179
grout was measured with a ruler in two perpendicular directions 180
Marsh cone test was carried out using a metal cone with an orifice diameter of 10 mm and 181
started at 8 plusmn 1 min One litre of grout was poured into the cone The conersquos orifice was opened 182
15 s after pouring the cement grout into the cone The time taken for each 100 ml of grout to 183
flow through the orifice was recorded and the measurements were completed upon collecting 184
700 ml of grout 185
The viscosity of cement grout was determined using a coaxial rotating cylinder viscometer 186
Fann (smooth cylinders no serration) that determined apparent viscosity at different shear 187
rates The test was contained in the annular space between an outer cylinder (rotor) with a 188
radius of 18415 mm and a bob with a radius of 17245 mm and a height of 380 cm The rotor 189
and bob were plunged into a cup containing 350 ml of sample grout Viscosity measurements 190
were made when the outer cylinder rotating at a known speed caused a viscous drag to be 191
exerted by the fluid This drag created a torque on the bob which was transmitted to a precision 192
spring where its deflection was measured and compared with test conditions and the 193
instrumentrsquos constants The measurement was made for 12 rotor speeds from 09 rpm to 600 194
rpm where the viscometer reading values () were recorded The value of shear stress (Pa) 195
was calculated by including k1 torsion constant of spring per unit deflection (N-cmdegree) 196
k2 shear stress constant for the effective bob surface (cm-3) and k3 shear rate constant [s-1rpm] 197
[25 26] 198
Rotor speed was increased step by step and the viscometer readings were recorded with 199
increasing rotation speeds The reading was taken when the needle in the viscometer was 200
8
stabilised or 30 seconds after the change of speed in cases when the needle had not stabilised 201
due to the thixotropy of the cement grout The time of reading was generally between 5 and 202
10 seconds 203
In this study the down-curve was chosen for final evaluation because it offered a better 204
description of the rheological behaviour of the grouts including a structural breakdown 205
phenomenon of inner forces among particles [27] The values of shear yield stress (the 206
minimum shearing stress required for the fluid to start flowing) and plastic viscosity used the 207
modified Bingham model [28] and are expressed as follows 208
2
0 cp (1) 209
Where τ0 is yield stress (Pa) μp is plastic viscosity (Pas) is shear rate (s-1) and c is a 210
constant 211
The cohesion of grout was determined at 30 plusmn 1 min with a Lombardi plate cohesion meter 212
[29] A thin galvanized steel plate (100times100times1 mm) was immersed in the grout and hung on a 213
stand placed on an electronic balance The weight of the grout still present on the plate was 214
recorded when the dripping of the grout had stopped This test was followed by the fresh 215
density measurement of the grout with a mud balancer Knowing the fresh density of the grout 216
it was possible to calculate the thickness on each side of the plate 217
The resistance of the fresh grout to induced bleeding was evaluated using a pressure filter The 218
equipment consists of a pressure vessel filter paper which is placed on a sieve and a graduated 219
cylinder A 200 ml grout sample is placed in the pressure vessel After closing the cell the 220
graduated cylinder is placed under the outlet of the cell The cell is pressured by compressed 221
air to 055 MPa The volume of water going out through the outlet on the bottom of the cell is 222
recorded at 15 and 30 s then at every minute up to 10 min and then at every 5 min up to 30 min 223
[25] 224
Considering homogeneous bleeding the results of the induced bleeding tests allow to derive 225
the evolution of the permeability of the sample during its compaction under the applied 226
pressure The permeability of the material is directly linked to the bleeding rate during the 227
material consolidation until the tested material is able to sustain the applied pressure [30 31] 228
It refers to the material ability to slow down the water filtration process 229
The measurement of the flow water allows to compute instantaneous WB ratio and makes it 230
possible to link it with the computed instantaneous permeability at a given time of the test [32ndash231
9
34] I The water flow is computed by dividing the variation of the measured water mass flowing 232
out the samples by the elapsed time between two successive data sampling In this study value 233
of permeability at 1 and 30 minutes are taken and compared It corresponds to the initial and 234
final permeability of the mixes 235
The material compressibility is considered in a soils mechanics way [30 35] It corresponds to 236
the ratio of the variation of void ratio (liquidsolid volume ratio) to the variation of logarithm 237
of applied pressure between the initial and the final state of the induced bleeding test It 238
provides the equilibrium state of the sample under a given applied pressure and is valid for 239
both homogeneous and heterogeneous bleeding [36] 240
It is worth noting that the computed permeability describes homogeneous bleeding kinetics 241
while compressibility describes the amplitude of the bleeding phenomenon 242
Heat of hydration was evaluated by isothermal calorimetry with an eight-channel heat 243
conduction calorimeter maintained at 22degC This equipment measures heat evolved by 244
comparing the temperatures of a grout sample and an inert reference which are both held under 245
isothermal conditions The heat flow results are recorded as a function of time CEM I GGBS 246
and ANH were blended manually for 30 s After the addition of water the grout was blended 247
10 s by hand and then an additional 50 s mechanically Polyethylene ampoules were filled with 248
approximately 6 g of each grout and the experiments were conducted for at least 72 h 249
The compressive strength of the grout was determined by crushing three cubes of 50 mm size 250
After casting the samples were covered with a polymer sheet (a cling film) to limit evaporation 251
of water and stored in a conditioning room at 20 plusmn 2 degC for 24 plusmn 05 hours Afterwards cubes 252
were demoulded and placed in water at 20 plusmn 1 degC until tested at 1 3 7 and 28days 253
In order to perform the pH test a powder sample of the hardened mixes was required The test 254
was performed on 1 7 and 28 day samples As mixes 9-12 are of identical composition the 255
reason is explained later in 41 derived statistical model tests were only performed on sample 256
10 To get the powder with a fineness of 65μm the samples were firstly drained of the acetone 257
To remove any remaining acetone they were placed in a vacuum desiccator The pieces were 258
then ground using a mortar and pestle passed through a 65 μm sieve placed in sample bags 259
and returned to the desiccator The samples had then to be mixed with distilled water to enable 260
the pH test to be performed A 110 ratio of cement to water was used and mixed for 24 hours 261
using a rotating machine To get the pH reading the samples were put into a centrifuge machine 262
to separate the solid and liquid At this stage the solution should have a pH equivalent to cement 263
10
it was mixed with To get a pH reading for the samples a pH device was used where a probe 264
is placed in the solution The machine was calibrated with three buffer solutions of 7 10 and 265
13 pH levels before measuring the pH of the samples 266
SEM (scanning electron microscopy) was carried out using a JEOL JSM6400 on flat fractured 267
surface specimens obtained from compression testing at 7-day samples Prior to SEM testing 268
the samples were mounted onto metal stubs using carbon paste and coated with gold film to 269
ensure good conductivity The accelerated voltage was set at 20 kV 270
22 Statistical Design and Modelling of Experiments 271
The technique of analysis used in this study was a 2k factorial experimental design [37] to 272
evaluate the influence of two different levels (maximum and minimum) for each variable on 273
the relevant grout properties Three key parameters (WB ANH GGBS) that should have 274
significant influence on mix characteristics of supersulfated cements were selected to formulate 275
the mathematical models for evaluating relevant properties (ie k = 3 in this study thus the 276
total mixes for the factorial design was 23 = 8) Additionally a mix at the central point was 277
replicated four times to estimate the experimental error and improve the reliability of the 278
models The coding and levels of the variables (WB and dosages of GGBS and ANH) are 279
given Table 2 280
The statistical models are valid for supersulfated grout (SSC) mixes made with WB GGBS 281
and ANH in the ranges of 034 to 044 60 to 80 and 0 to 20 respectively The modelled 282
experimental region consisted of mixtures ranging from coded variables of ndash1 to +1 The coded 283
factors for variables were calculated by 284
Coded Factor = (Actual value-Factor means)[Range of factor value2] (2) 285
Hence 286
Coded WB = (Actual WB ndash 039)005 287
Coded GGBS = (Actual GGBS ndash 07)01 288
Coded Anhydrite = (Actual ANH ndash 01)01 289
The responses modelled were mini-slump plate cohesion Marsh cone yield stress plastic 290
viscosity induced bleeding at 1 min 5 and 30 mins permeability at 1 min and 30 mins 291
compressibility and compressive strength at 1 3 7 and 28 days The general model associated 292
11
with the two-level factorial design incorporating three independent variables (WB GGBS 293
ANH) is expressed by 294
Y1 = a0 + a1WB + a2GGBS + a3ANH+ a4WBGGBS + a5WBANH + a6GGBSANH 295
+ a7WBGGBSANH + ε (3) 296
where 297
Y1 Response (mini slump marsh cone plate cohesion etc) 298
a0 Overall mean factor effect 299
a1-a7 Regression coefficients representing model constants (contribution of independent 300
variables and their interaction to each response) 301
a1WB a2GGBS a3ANH Linear effect of factors WB GGBS and ANH 302
a4WBGGBS a5WBANH a6GGBSANH a7WBGGBSANH Interaction effects of 303
factors WB GGBS and ANH 304
ε Random error term representing the effects of uncontrolled variables 305
Analysis of variance (ANOVA) was used to test the significance of regression models and t-306
tests were performed to identify the non-significant (NS) variables and second order 307
interactions which were subsequently eliminated from the derived models Model coefficients 308
were determined using multi-linear regression analysis based on a normal distribution 309
assumption The error was assumed to be random and normally distributed so the residual 310
terms which represent the difference between the actual and predicted values should exhibit 311
similar properties [37] The probability value (Prob) obtained from ANOVA determines the 312
statistical significance of each factor and their interactions For most of the parameters the 313
probability that the derived coefficients associated with the various variables influencing each 314
response were limited to 10 This signifies that there is less than 10 chance or 90 315
confidence limit that the contribution of a given parameter to the tested response exceeds the 316
value of the specified coefficient A negative estimate indicates that an increase of the given 317
parameter results in a reduction of the measured response 318
12
3 Results and discussion 319
The results of the experimental work characterize the behaviour of the mortars with different 320
WB ANH and GGBS levels Table 3 summarises all results of the experimental work 321
performed The results were used to construct the regression models 322
Table 3 Average results from experimental work 323 324
Viscometer Induced bleeding
Mix Mini-
slump
Flow
time
Cohesion
meter
Yield
value
Plastic
viscosity
1min 5min 30min
(mm) (s) (mm) (Pa) (Pas) (mL) (mL) (mL)
1 61 230 105 191 0923 220 470 480
2 89 25 55 97 0323 290 780 810
3 67 200 118 172 0802 280 580 605
4 111 12 20 80 0199 490 860 860
5 52 360 143 251 1203 280 520 540
6 83 69 86 99 0403 360 700 700
7 60 250 125 211 0980 310 580 590
8 110 13 40 77 0224 350 910 950
9 71 150 87 101 0617 370 720 730
10 73 102 122 106 0681 290 620 620
11
12
77
74
192
83
89
110
124
101
0660
0641
290
350
640
715
645
720
325
Table 3 Average results from experimental work (continued) 326
Mix Permeability Permeability Compre-
ssibility
Compressive strength
1 min 30 min fc 1d fc 3d fc 7d fc 28d
(ms) (ms) (MPa) (MPa) (MPa) (MPa)
1 216E-09 317E-09 0155 299 506 581 704
2 512E-08 418E-09 0298 168 383 547 558
3 448E-08 366E-09 0194 213 334 406 527
4 374E-08 425E-09 0312 140 223 256 408
5 448E-08 342E-09 0173 233 434 507 535
6 512E-08 395E-09 0255 136 371 371 448
7 440E-08 361E-09 0187 108 232 343 532
8 451E-08 433E-09 0342 68 200 263 473
9 446E-08 402E-09 0250 196 328 398 592
10 468E-08 371E-09 0212 171 232 361 556
11
12
423E-08
516E-08
379E-09
400E-09
0221
0246
207
183
313
301
451
435
565
520
327
The derived quadratic statistical models of grout for mini-slump flow time cohesion plate 328
yield stress plastic viscosity induced bleeding at 1 min 5 min and 30 min permeability at 1 329
13
min and 30 min compressibility and compressive strength at 1 3 7 and 28 days are given in 330
Equations (4) to (18) where WB GGBS and ANH are given in codes values 331
Mini-Slump (mm) = 7881 + 1919 WB + 781 ANH + 444 WBANH - 294 GGBS (4) 332
333
Marsh flow time (s) = 1404 - 1153 WB ndash 261 ANH + 281 GGBS (5) 334
335
Plate Cohesion meter (microm) = 86 - 366 WB + 122 GGBS - 107 ANH - 091 WBANH (6) 336
337
Yield Value (Pa) = 1466 ndash 584 WB - 126 WBGGBS - 125 ANH + 124 GGBS (7) 338
339
Plastic Viscosity (Pas) = 063 - 034 WB - 0078 ANH + 0073 GGBS 340
- 0047 WBGGBS - 0022 ANHGGBS (8) 341
342
Induced Bleeding at 1 min (ml) = 3225 + 50 WB + 35 ANH ndash 225 WBANHGGBS (9) 343
344
Induced Bleeding at 5 mins (ml) = 675 + 1375 WB + 575 ANH (10) 345
346
Induced Bleeding at 30 mins (ml) = 6919 + 1381 WB + 594 ANH (11) 347
348
Permeability at 1 min (ms) x 10-8 = 4 + 0615 WB + 0621 AHN ndash 0773 WBGGBS 349
- 0426WBAHN - 0446 AHNGGBS (12) 350
351
Permeability at 30 min (ms) x 10-8 = 0382 + 0035 WB + 0014 ANH 352
+ 0008 WBANHGGBS (13) 353
354
Compressibility = 02396 + 00623 WB + 00194 ANH + 00012 WBANHGGBS (14) 355
356
ƒc 1 d (MPa) = 1705 - 426 WB - 384 ANH - 343 GGBS + 145 WBANH (15) 357
358
ƒc 3 d (MPa) = 3215 - 879 ANH - 412 WB ndash 261 GGBS (16) 359
360
ƒc 7 d (MPa) = 4092ndash 924 ANH - 5 WB - 383 GGBS (17) 361
362
14
ƒc 28 d (MPa) = 5348 - 515 WB - 382 ANH ndash 262 GGBS + 436 ANHGGBS (18) 363
364
The correlation coefficient of most of the proposed models were higher than 090 except for 365
plastic viscosity compressive strength after 3days and compressive strength after 28days 366
which have coefficients of 070 086 and 087 respectively 367
Table 4 shows the average measured responses of the four replicate grouts the coefficients of 368
variation (COV) as well as the estimated errors with a 90 confidence limit for each of the 369
measured properties The estimated error levels for mini-slump plate cohesion meter Marsh 370
cone yield stress plastic viscosity induced bleeding at 1 min 5 min and 30 mins permeability 371
at 1 min and 30 min compressibility and compressive strengths at 1 3 7 28 days were plusmn 22 372
mm plusmn 0001mm plusmn 40 s plusmn 09 Pa plusmn 002 Pa s plusmn 28 ml plusmn 42 ml plusmn 45 ml plusmn 32x10-9 (ms) 373
plusmn 13x10-10 (ms) plusmn 00153 plusmn 13 MPa plusmn 35 MPa plusmn 33 MPa and plusmn 25 MPa respectively 374
The relative experimental errors for mini-slump plate cohesion meter Marsh cone yiled stress 375
plastic viscosity induced bleeding permeability compressibility compressive strengths were 376
limited to 3-11 On the other hand relative error for march cone was up to 30 377
Table 4 Repeatability of test parameters at the central point 378
379
Tests Mini-
slump
Plate
cohesion
Marsh
cone
Yield
stress
Plastic
viscosit
y
Induced
bleeding
at 1 min
Induced
bleedin
g at 5
min
Induced
bleeding
at 30
min
Mean (n=4) 736
mm
001
mm
1318
s
108
Pa
065
Pa s
325
ml
674
ml
679
ml
Coefficient
of variation
()
37 115 372 105 42 127 76 80
Estimate
error (90
confidence
limit)
22
mm
0001
mm
402
s
09
Pa
002
Pa s
28
ml
42
ml
45
ml
380
381 Table 4 Repeatability of test parameters at the central point (continued) 382
383
Tests
Permeability
1 min
x10-8
Permeability
30 min
x10-8
Compressibility frsquoc 1d frsquoc 3d frsquoc 7d frsquoc 28d
Mean (n=4) 463
ms
0388
ms 02323
189
MPa
293
MPa
411
MPa
558
MPa
Coefficient
of variation
()
85 39 8 84 144 98 53
15
Estimate
error (90
confidence
limit)
032
(ms)
0013
(ms)
00153
13
MPa
35
MPa
33
MPa
24
MPa
384
385
31 Accuracy of the established models 386
387
The ratio of predicted-to-measured properties for grout ranged between 087 and 115 388
indicating good accuracy for prediction of mini-slump plate cohesion induced bleeding at 1 389
min 5 mins and 30 mins yield stress plastic viscosity and compressive strength at 1-d 3-d 7-390
d and 28-d In general the proposed models for mini-slump plate cohesion Marsh cone and 391
compressive strength appeared to be accurate in predicting fluidity cohesivity induced 392
bleeding permeability at 30 min compressibility and compressive strength with low scatter 393
between measured and predicted values However the average values of predictedmeasured 394
ratio of yield values were slightly higher (074) 395
396
32 Isoresponses of the proposed models 397
398
The isoresponse surfaces and contour plots for mini-slump plate cohesion Marsh cone yield 399
stress plastic viscosity induced bleeding at 1 min 5 mins and 30 mins permeability at 1 min 400
and 30 mins compressibility and compressive strength at 1-d 3-d 7-d and 28-d were obtained 401
by using response surface methodology (RSM) The isoresponse surfaces and contour plots 402
were obtained from the regression models and because the models contained interaction and 403
second-order variables the contour lines were curved 404
The proposed statistical models can therefore be used to evaluate the effect of a group of 405
variables on the properties affecting the quality of supersulfated grout This allowed for the 406
calculation of isoresponse surfaces from the parameters under study outside the experimental 407
domain and the optimisation of their effects The next sections will discuss the results of each 408
experiment separately 409
331 Mini-slump 410
As shown in Eq 4 the mini-slump is influenced in order of significance by WB ratio 411
anhydrite proportion interaction of WB and ANH and the percentage of GGBS content The 412
WB ratio had the greatest effect on fluidity due to better lubrication of the particles in the paste 413
16
[29] The mini-slump test was accompanied by very low shear The value of mini-slump is to 414
characterise yield stress [38] therefore higher mini-slump value indicated a lower yield stress 415
The effect of WB on the increase of mini-slump was two and half-time than that of ANH (192 416
vs 781 in Eq 4) However increased ANH resulted in a 27 times greater increase in mini-417
slump than reduced GGBS (781 vs -294 in Eq 4) Figure 1(a) shows the effect of increased 418
WB on mini-slump vs ANH (when GGBS was kept constant at 70) and Figure 1(b) shows 419
GGBS vs ANH (when WB was fixed at 039) Based on these figures it is evident that mini-420
slump increased significantly when the dosage of WB and ANH increased 421
422
(a) (b) 423
Fig 1 Isoresponse curves of mini-slump (mm) (a) WB vs ANH and (b) GGBS vs ANH 424
425
332 Marsh cone 426
The time needed for a grout sample to flow through the Marsh cone is proportional to the 427
viscosity of the cement grout the flow time becomes an index of fluidity so the longer the 428
flow time the lower the fluidity Similar to the previous trends Eq 5 shows that the values of 429
Marsh cone are influenced in order of significance by WB GGBS and ANH This is 430
graphically illustrated in Figure 2 431
GGBS = 70
034 039 042 044
0
5
10
15
20
WB
AN
H (
)
65
74
83
92
101
037
AN
H(
)
WB = 039
60 65 70 75 80
0
5
10
15
20
GGBS()
70
75
80
85
17
432
(a) (b) 433
Fig 2 Isoresponse curves for flow time (s) (a) WB vs ANH and (b) GGBS vs ANH 434
435
It can be noted that an increase in WB and ANH or a reduction in GGBS led to decreasing 436
the Marsh cone flow time For example at fixed WB at 039 and GGBS of 70 respectively 437
the increase in ANH dosage from 5 to 20 led to a marked reduction of the Marsh cone flow 438
time from 170 to 140 s (Figure 2(a)) This behaviour is attributed to the change in plastic 439
viscosity of the grout as will be discussed later 440
333 Cohesion plate 441
As shown in Eq 6 the cohesion plate was influenced in order of magnitude by the WB and 442
the percentage of GGBS and ANH The increasing WB had a 34 times the influence on the 443
reduction of the cohesion plate test results as the increased ANH (for a GGBS constant) By 444
comparing the effects of WB and GGBS on plate cohesion the increased WB can be 445
interpreted as having approximately a 3 times greater influence on the reduction of plate 446
cohesion values than the increase in GGBS (-366 vs 122 in Eq 6) given that ANH is held 447
constant The effect of an increase in WB from 034 to 044 and ANH from 0 to 20 with a 448
fixed GGBS dosage of 70 is presented in Figure 3(a) Increased WB led to a decreased 449
cohesion plate value Conversely an increase in GGBS increased the cohesion plate value and 450
an increased ANH caused a reduction in cohesion plate (Figure 3(b)) 451
GGBS = 70
034 036 039 042 0440
5
10
15
20
WB
AN
H (
)
40
6080
100120
140160
180200
220
WB = 039
60 65 70 75 80
0
5
10
15
20
GGBS ()
AN
H (
)
100
120
140
160
180
18
452
(a) (b) 453
Fig 3 Isoresponse curves for plate cohesion meter (a) WB vs ANH and (b) GGBS vs 454 ANH 455
334 Yield stress 456
As shown in Eq 7 yield value was influenced in order of magnitude by WB and dosages of 457
ANH and GGBS Based on Figure 4 (a) when WB was fixed at 039 GGBS maintained at 458
70 and ANH increased to 5 the isoresponse curve showed a yield value of 15 Pa On the 459
other hand if the proportion of ANH was further increased to 20 while GBBS was 460
maintained at 70 the yield value decreased to 135 Pa This corresponds with Eq (7) in 461
which the proportion of WB and ANH were increased while GGBS was kept constant 462
resulting in a reduction in yield stress An increase in GGBS content resulted in an increase of 463
the yield stress 464
Figure 4 (b) shows the isoresponse curve of the yield value with a fixed proportion of GGBS 465
at 70 When WB was 039 and ANH was 5 the isoresponse of the predicted yield value 466
was 155 Pa If ANH was increased to 20 while maintaining WB at 039 the isoresponse of 467
the yield value was 135 Pa 468
It can be interesting to note that the observed results for the yield stress are closed to the one 469
observed with the cohesion plate and mini-slump tests This is expected as yield stress values 470
can be derived from those two simple tests 471
GGBS = 70
034 037 039 042 0440
5
10
15
20
WB
AN
H(
)
45
55
65
7585
95
105
115
WB = 039
60 65 70 75 800
5
10
15
20
GGBS ()
AN
H(
)
75
85
95
105
19
472
(a) (b) 473
Fig 4 Isoresponse curves for yield stress (Pa) (a) WB vs ANH and (b) GGBS vs ANH 474
335 Plastic viscosity 475
Plastic viscosity was influenced in order of magnitude by WB and the dosages of ANH and 476
GGBS ANH and GGBS had almost opposite effects on plastic viscosity (-0078 vs 0073 in 477
Eq 8) As shown in Eq (8) increased WB had the greatest primary effect on plastic viscosity 478
(034 vs 0078 and 0073) The increased WB had approximately a 44 times greater influence 479
on reducing plastic viscosity than increased ANH or decreased GGBS 480
In the isoresponse curve of plastic viscosity shown in Figure 5 (a) when GGBS was fixed at 481
70 WB set at 039 and ANH maintained at 5 the predicted plastic viscosity value was 482
068 Pas On the other hand if the dosage of ANHB was increased to 20 while maintaining 483
a similar WB the plastic viscosity was reduced to 055 Pas 484
In Figure 5 (b) WB was fixed at 039 when GGBS was held at 70 and ANH at 5 the 485
predicted plastic viscosity was 067 Pas However when ANH was increased to 20 and 486
GGBS was maintained at 70 the predicted plastic viscosity dropped to 055 Pas 487
AN
H(
)
GGBS = 70
034 037 039 042 044
0
5
10
15
20
WB
1012
1416
18
20
WB = 039
60 65 70 75 800
5
10
15
20
GGBS ()
AN
H(
)
13
14
15
20
488
(a) (b) 489
Fig 5 Isoresponse curve for plastic viscosity (Pas) (a) WB vs ANH and (b) GGBS vs 490
ANH 491
336 Induced bleeding 492
The induced bleeding equations for 1 and 5 minutes (Eqs 9 10) and 30 minutes (Eq 11) are 493
very similar The two influencing factors of induced bleeding are WB ratio and anhydrite 494
WB ratio has the greatest effect over two times the effect of anhydrite content Figure 6 shows 495
the isoresponse for bleeding versus the WB ratio for a fixed value of GGBS at 70 It can be 496
seen that when an anhydrite value is selected and the WB ratio is increased the bleeding will 497
also increase Similarly if a WB ratio is selected and the anhydrite content is increased the 498
bleeding will again increase 499
500
GGBS = 70
034 037 039 042 0440
5
10
15
20
WB
AN
H(
)
035
045
055
065
075
085
095
WB = 039
60 65 70 75 800
5
10
15
20
GGBS ()
AN
H(
)
055
060
065
075
034 036 039 042 044
0
5
10
15
20
WB
AN
H (
)
26
28
30
3234
36
38
40
GGBS=70
21
(a) 501
502
(b) (c) 503
Fig 6 Isoresponse curves for induced bleeding at 1 5 and 30 min WB vs ANH 504
337 Permeability 505
Figure 7 (a) and (b) showed firstly that the permeability decreased significantly from 1 min to 506
30 min Permeability at 1 min was influenced in order of magnitude by WB and the dosage 507
of ANH All interactions between 3 parameters had almost opposite effects on permeability 508
(Eq 12) As shown in Eq (12) increased WB and AHN had the greatest primary effect on 509
permeability at 1 min It seems there is an optimum reached at WB = 40 and AHN at 17 510
Similarly the permeability at 30 min is affected in order of significance by WB followed by 511
ANH (Eq 13) In Figure 7 (b) WB was fixed at 039 when GGBS was held at 70 and ANH 512
at 10 the predicted permeability was 038 x 10-8 (ms) However when ANH was increased 513
to 20 and GGBS was maintained at 70 the predicted permeability increased to 040x10-8 514
(ms) 515
516
GGBS = 70
034 036 039 042 0440
5
10
15
20
WB
AN
H (
)
545
61
675
74
805
GGBS = 70
034 036 039 042 0440
5
10
15
20
WB
AN
H (
)
56
60
64
68
72
7680
84
22
517
(a) (b) 518
Fig 7 Isoresponse curves for permeability at 1 and 30 min WB vs ANH 519
338 Compressibility 520
As shown in Eq (14) the compressibility was influenced in order of magnitude by the WB 521
and the percentage of ANH The interaction between 3 parameters affected also the 522
compressibility The increasing WB had a 32 times the influence on the increase of the 523
compressibility results as the increased ANH (for a GGBS constant) The effect of an increase 524
in WB from 034 to 044 and ANH from 0 to 20 with a fixed GGBS dosage of 70 is 525
presented in Figure 8 Increased WB led to an increase of compressibility Similarly an 526
increase in AHN increased the compressibility 527
528
Fig 8 Isoresponse curves for compressibility WB vs ANH 529
034 036 039 042 044
0
5
10
15
20
GGBS = 70 WB
AN
H (
)
3
35
4
4
45
5
034 036 039 042 044
0
5
10
15
20
WB
AN
H (
)
034
035
036 037 038 039 04
041
042
4
GGBS=70
034 036 039 042 044
0
5
10
15
20
WB
AN
H (
)
017
019
021 023 025 027
029
031
GGBS=70
23
530
339 Compressive strength 531
After one day from Eq 15 the influencing factors in order of significance are WB ratio 532
anhydrite content GGBS content and the interaction of WB and ANH The effect of the first 533
three was similar but WB had 11 times greater effect than anhydrite and 125 times greater 534
effect than GGBS While the interaction of WB and anhydrite had around a third of the 535
influence of WB Figures 9 (a) and (b) show the isoresponses for 1-day compressive strength 536
From Figure 9 (a) it can be seen when the GGBS content is fixed at 70 for a given anhydrite 537
content increasing the WB ratio will decrease the strength Also if a WB ratio is selected and 538
the anhydrite is increased similarly the strength will decrease From Figure 9 (b) with the WB 539
ratio fixed at 039 once again an increase in GGBS led to a reduction of compressive strength 540
at 1 day 541
542
(a) (b) 543
Fig9 Isoresponse curves for compressive strength at 1d (a) (WB vs ANH) and (b) (GGBS 544 vs ANH) 545
Eqs 16 17 and 18 show the effect of GGBS and ANH percentages on compressive strength at 546
3-d 7-d and 28-d Figures 10 11 and 12 show the isoresponse of the compressive strength at 547
3-d 7-d and 28-d respectively with WB vs ANH Increased ANH led to a decrease of 3-d 548
and 7-d compressive strength As expected an Increase in WB led to a decrease in compressive 549
strength The percentage of ANH had a negative effect on compressive strength and showed a 550
greater influence particularly at 3-d and 7-d (879 (3 d) amp 924 (7d) vs 382 (28 d)) GGBS has 551
a negative impact on early strength development The negative effect of GGBS on compressive 552
GGBS = 70
034 037 039 042 0440
5
10
15
20
WB
AN
H(
)
12
14
16
18
20
22
2426
WB = 039
60 65 70 75 800
5
10
15
20
GGBS ()
AN
H(
)
10
12
14
16
18
20
22
24
strength at early ages is clearly attributable to the fact that up to 80 of cement has been 553
replaced by GGBS and it takes some time for GGBS to start developing its pozzolanic action 554
at a noticeable level The results indicate that ANH content influences strength to a greater 555
extent than GGBS at all ages The SO3 content was reported to have great influence on the 556
strength [39 40] 557
558
(a) (b) 559
Fig10 Isoresponse curves for compressive strength at 3d (a) (WB vs ANH) and (b) 560 (GGBS vs ANH) 561
562
563
(a) (b) 564
Fig11 Isoresponse curves for compressive strength at 7d (a) (WB vs ANH) and (b) (WB 565 vs ANH) 566
567
GGBS = 70
034 036 039 042 0440
5
10
15
20
WB
AN
H (
)
24
2628
30
3234
3638
4042
WB = 039
60 65 70 75 80
0
5
10
15
20
GGBS ()
AN
H (
)
2426
2830
32
34
36
3840
42
GGBS = 70
034 037 039 042 044
0
5
10
15
20
WB
AN
H(
)
3032
34
3638
40
42
44
46
48
WB = 039
60 65 70 75 80
0
5
10
15
20
GGBS ()
AN
H(
)
32
34
36
38
40
42
44
46
48
25
568
(a) (b) 569
Fig12 Isoresponse curves for compressive strength at 28d (a) (WB vs ANH) and (b) 570
(ANH vs GGBS) 571
3310 Discussion of the effect of WB GGBS and ANH 572
As expected the increase of WB led to an increase in mini-slump induced bleeding and a 573
reduction in flow time plate cohesion yield stress plastic viscosity and compressive strengths 574
This can be attributed to more water in the system 575
An increase in GGBS content resulted in a reduction of the flow time plate cohesion yield 576
stress and plastic viscosity while the fluidity is improved This was due to the fact the specific 577
gravity of slag is lower than that of PC leading to an increase in the paste volume and thus 578
improving the fluidity of paste 579
In case of an increase of ANH proportion while WB and GGBS were kept constant it led to 580
an increased mini-slump and induced bleeding while the flow time plate cohesion yield stress 581
and plastic viscosity were reduced This was due to the lower reactivity of ANH resulting in an 582
increase of water needed for lubrication of paste 583
As expected an increase in WB lead to an increase in induced bleeding permeability and a 584
decrease in compressibility [33 35] This is due to the increase in liquid volume between the 585
particles and to the reduction in the amount of interparticle forces Globally the compressibility 586
decreases and the permeability increases with ANH It can be explained by the reduced specific 587
area and lower reactivity that can lead to more available water in the samples 588
3311 Heat of Hydration 589
Heat of hydration is considered an important factor in the cement design as low heat of 590
hydration reduces the effect of thermal cracking The heat flow results of the calorimeter test 591
performed over a three days period can be seen in Figure 13 592
GGBS = 70
034 036 039 042 0440
5
10
15
20
WB
AN
H (
)
46
48
50
52
54
56
58
60
WB = 039
0 5 10 15 2060
65
70
75
80
ANH ()
GG
BS
(
)
50
52
54
56
5860
62
26
593
Fig 13 Heat flow graphs for first 3 days of reaction 594
Figure 13 presents that the largest peaks were in mixes 1 2 5 and 6 This shows that these 595
reactions generated the most heat and that they were quick Mixes 1 and 2 have the highest 596
OPC content at 40 and this suggests that to lower the heat of the reaction minimal OPC 597
should be used This is confirmed by the fact that mixes 5 and 6 have the next highest OPC 598
contents the same percentage as mixes 3 4 and 9 (one of the repeated mixes) which have 599
anhydrite present This implies that the presence of anhydrite will lengthen the reaction process 600
and reduce the heat produced during setting significantly The graph shows this by the absence 601
of a sharp peak instead a gentle curved hump is shown over a 2-day period whereas the mixes 602
showing a sharp peak occur after about 12 hrs Mix 7 which has the same solids content as 603
mix 8 but a lower WB ratio and no cement present showed the lowest heat flow during the 604
hydration process 605
Figure 14 shows the cumulative heat generation during the first 3 days of setting It is clear that 606
the two mixes (1 and 2) with highest cement content and absence of anhydrite had the highest 607
cumulative heat development over the 3-day period 643J and 594J respectively Mixes 3456 608
and 9 which all have 20 OPC content generated similar heat value over the 3 days Results 609
of mixes containing ANH implies that over the period that the anhydrite did not reduce the 610
cumulative heat generated but slowed the reaction and reduce the peak heat generated The 611
0
0002
0004
0006
0008
001
0012
0 50000 100000 150000 200000 250000 300000
He
at F
low
(mW
)
Time s()
M1
M2
M3
M4
M5
M6
M7
M9
1Day
2Day
3day
1d 2d 3d
27
graphs also suggest that a higher WB ratio produced a lower cumulative and peak heat 612
generation613
614
Fig 14 Cumulative heat generation curves for first 3 days 615
3312 pH measurements 616
Fig 15 summarises the results of pH and the nine mixes with different compositions of WB 617
the percentages of cement GGBS and ANH It is shown that Supersulfated cements (SSCs) 618
have lower pH values (lt 125 at all ages) than PC which has a pH of 139 [41] making SSC 619
more preferable in essential applications such as nuclear waste encapsulation 620
The figure shows that the pH value decreased with time for all samples between 1 and 7 days 621
Similar trend was observed in the majority of mixes between 7 and 28 days except for sample 622
2 5 and 9 which showed slight increase in the pH values This decrease refers to the 623
consumption of ions in the pore structure due to the hydration process 624
0
100
200
300
400
500
600
700
800
0 50000 100000 150000 200000 250000 300000
(J)
Time (s)
M1
M2
M3
M4
M5
M6
M7
M9
1 Day
3 Day
2 day
1d 2d 3d
1
2
3
9
45
6
7
28
625
626 Fig 15 Summary of pore solution pH 627
628
The incorporation of ANH replacing the Portland cement (C) results in remarkable decrease in 629
pH at all ages as introducing the ANH reduced the lower initial pH Likewise the increase in 630
the content of GGBS led to a decrease in the pH value of the pore structure as GGBS has lower 631
initial pH than Portland cement The increase of WB ratio decreased the pH value This is in 632
agreement with Collier [41] who found that increasing the wb ratio from 05 to 06 increased 633
the pH by I unit This was attributed to the increased availability of water in the case of WB 634
of 06 allowing hydration of more cement powder thereby releasing more hydroxide anions 635
into solution However in this study the WB ratio did not show a significant effect on 636
lowering the pH These results are in agreement with [42] which also found that decreasing the 637
pH improved the bulk resistivity of SSC mixtures 638
3313 SEM 639
Figure 16 shows the SEM images of some mixes at various magnifications The images clearly 640
show the dense and compact structure of the cement after seven days The dense structure was 641
another requirement from the cement chosen to enclose the waste to prevent leaching The 642
microstructure consists mainly of C-S-H the main hydration product and unhydrated slag 643
grains C-S-H is formed after the dissolution of slag grains when contacting the water and 644
alkalis and then the ionic species saturate the solution and then precipitate as hydrated phases 645
[8] There were abundant grains of hydrated and partially hydrated slag grains some small 646
1080
1100
1120
1140
1160
1180
1200
1220
1240
1260
1280
1 2 3 4 5 6 7 8 9
pH
val
ue
Mix Number
1 Day
7 Days
28 Days
29
GGBS particles presented rims of reaction products (eg Mix 6-Figure 16 (f) and Mix 9-Figure 647
16 (h)) It was found by [11] that the composition of the reaction rims around slag was similar 648
to that of the C-S-H from PC However [12] found that in the CndashSndashH of SSC is apparently 649
more foil like which is different than the fibrillar morphology of C-S-H in OPC Mix 3 and 650
Mix 4 (Figure 16 (c) and (d) respectively) exhibits more micro voids in the micrsostructure 651
which could explain the low strength of these mixes compared to mix 1 and 2 Ettringite was 652
not detected Ettringite is not the most abundant phase and it is not easy to detect in dried 653
polished samples because it is easily decomposed under the drying conditions of the vacuum 654
of the microscope column [11] 655
(a) Mix 1 image at 1100 magnification (b) Mix 2 image at 900 magnification
(c) Particle of unreacted slag mix3 7 days (d) An overall image of mix 4 at 7days
showing CSH and BFS particles
30
(e) Mix 5 image at 1100 magnification (f) Mix 6 image at 2300 magnification
(g) Mix 7 image at 2000 magnification (h) Mix 9 image at 2700 magnification
Fig 16 SEM results 656
4 Conclusions 657
The paper focused on optimizing the SSC cement grout in order to get the best of it The effect 658
of GGBS WB and ANH dosages on the grout fluidity rheological properties induced 659
bleeding maximum heat of hydration and compressive strength was investigated using 660
factorial design approach and analysis The models derived in this study are valid for the 661
experimental area corresponding to grout mixes made with variable levels of WB ANH and 662
GGBS in the ranges of 034 to 044 0 to 20 by mass of binder 60 to 80 by mass of 663
binder respectively Based on the results from this study the following conclusions are drawn 664
- In comparison to GGBS and ANH WB ratio had more pronounced effects on the 665
results of mini-slump plate cohesion meter Marsh cone time yield stress plastic viscosity 666
induced bleeding permeability compressibility and compressive strength 667
31
- The increase in the dosage of GGBS led to an increase in the values of plate cohesion 668
meter Marsh cone time yield stress and plastic viscosity while reducing the mini-slump 669
values maximum hydration and compressive strength This is ascribed to the fine nature 670
of GGBS particles and pozzolanic effect 671
- While the ANH particles caused a decrease in the maximum of heat of hydration it 672
increased the induced bleeding permeability and compressibility due to its dominant effect 673
on increasing the dormant period and increasing the rates of solid sedimentation and 674
induced bleeding water 675
- Increasing the dosage of ANH in grout reduced the hydrations kinetic at early-age and 676
thus reduced the compressive strength at 1d 3d and 7d However this effect diminished 677
at later ages at 28 d in a manner similar to increasing WB 678
- The increase in the dosage of ANH led to an increase in the mini-slump values 679
(fluidity) but a decrease in the values of yield stress plastic viscosity plate cohesion and 680
Marsh cone time This is attributed to better deflocculation of particles at the fresh state 681
- The increase of GGBS percentage delayed the reaction process and decreased the total 682
heat after 3 days while WB slightly reduced the total heat it didnrsquot significantly affect the 683
reaction process 684
- pH measurements in the present study confirmed the suitability of these mixture to low-685
pH applications as the increase in both the GGBS and ANH markedly decreased the initial 686
pH thereby lowering the pH at different ages 687
- The modelling and prediction of the response of other points in the experimental domain 688
were therefore possible Although the models are based on a given set of materials they 689
can be easily used to generate future results using other materials 690
- Dense microstructure was observed for mixes examined in this study C-S-H is the main 691
reaction product with presence of unreacted slag grains embedded well in the structure 692
However some micro voids were observed in mixes containing ANH which led to lower 693
compressive strength of mixes with ANH 694
CRediT authorship contribution statement 695
MSonebi and YBai did the conceptualization and the design of investigation as well as 696 performing the experiments MSonebi carried out the software analysis of the results and the 697
32
visualization MSonebi AAbdalqader T Fayyad and APerrot analysed the results and 698 wrote the original draft and reviewed and edited the final version 699
Declaration of Competing Interest 700
The authors declare that they have no known competing financial interests or personal 701 relationships that could have appeared to influence the work reported in this paper 702
Acknowledgments 703
The authors would like to express their gratitude to P McCann from QUB and N Collier 704 from Eden Nuclear and Environment Ltd for their helps for some experiments 705
706
References 707
1 Schneider M Romer M Tschudin M Bolio H (2011) Sustainable cement production-708 present and future Cement and Concrete Research 41642ndash650 709
httpsdoiorg101016jcemconres201103019 710
2 Madlool NA Saidur R Hossain MS Rahim NA (2011) A critical review on energy use 711 and savings in the cement industries Renewable and Sustainable Energy Reviews 712
152042ndash2060 httpsdoiorg101016jrser201101005 713
3 EN15743 (2015) BS EN 157432010+A12015 Supersulfated cement - Composition 714
specifications and conformity criteria BSI 715
4 Khatib JM Wright L Mangat PS (2016) Mechanical and physical properties of concrete 716
containing FGD waste Magazine of Concrete Research 68550ndash560 717 httpsdoiorg101680macr1500092 718
5 Khatib JM Mangat PS Wright L (2008) Sulfate resistance of mortar containing 719
simulated FGD waste Proceedings of Institution of Civil Engineers Construction 720 Materials 161119ndash128 httpsdoiorg101680coma20081613119 721
6 (2020) Specifying Sustainable Concrete 722
7 Hewlett PC (2004) Learsquos Chemistry of Cement and Concrete fourth edi Elsevier 723 Science amp Technology Books Oxford 724
8 Gruskovnjak A Lothenbach B Winnefeld F et al (2008) Hydration mechanisms of 725 super sulphated slag cement Cement and Concrete Research 38983ndash992 726
httpsdoiorg101016jcemconres200803004 727
9 Grounds T Nowell D V Wilburn FW (2003) Resistance of supersulfated cement to 728 strong sulfate solutions Journal of Thermal Analysis and Calorimetry 72181ndash190 729
httpsdoiorg101023A1023928021602 730
10 Grounds T Nowell D V Wilburn FW (1995) The influence of temperature and 731
different storage conditions on the stability of supersulphated cement Journal of 732 Thermal Analysis 45385ndash394 httpsdoiorg101007BF02548772 733
33
11 Bazalduacutea-Medelliacuten ME Fuentes AF Gorokhovsky A Escalante-Garciacutea JI (2015) Early 734 and late hydration of supersulphated cements of blast furnace slag with fluorgypsum 735 Materiales de Construccion 65e043 httpsdoiorg103989mc201506013 736
12 Matschei T Bellmann F Stark J (2005) Hydration behaviour of sulphate-activated slag 737 cements Advances in Cement Research 17167ndash178 738
httpsdoiorg101680adcr2005174167 739
13 Richardson IG (2000) Nature of the hydration products in hardened cement pastes 740 Cement and Concrete Composites 2297ndash113 httpsdoiorg101016S0958-741 9465(99)00036-0 742
14 Baux C Phelipot-Mardeleacute A Lanos C et al (2013) PERFORMANCES OF SUPER 743 SULFATED CEMENTS In International Conference on Concrete Under Severe 744 Conditions pp 1857ndash1870 745
15 Annabelle Phelipot-Mardeleacute Gabriel Samson Christophe Lanos (2015) Super sulfated 746 cement formulation and uses In Construction Materials ConMat Whistler Canada 747
16 Milestone NB (2006) Reactions in cement encapsulated nuclear wastes need for 748 toolbox of different cement types Advances in Applied Ceramics 10513ndash20 749
httpsdoiorg101179174367606X81678 750
17 Batchelor B (2006) Overview of waste stabilization with cement Waste Management 751
26689ndash698 httpsdoiorg101016JWASMAN200601020 752
18 Zhang T Cheeseman CR Vandeperre LJ (2011) Development of low pH cement 753
systems forming magnesium silicate hydrate (MSH) Cement and Concrete Research 754 41439ndash442 httpsdoiorg101016jcemconres201101016 755
19 Mobasher N Bernal SA Provis JL (2016) Structural evolution of an alkali sulfate 756
activated slag cement Journal of Nuclear Materials 46897ndash104 757 httpsdoiorg101016JJNUCMAT201511016 758
20 Wang J Yu B Gao Y (2014) Hydration Characteristics of Super Sulphated Cement 759 with Different Fineness In Proceedings of the International Conference on Material 760 and Environmental Engineering (ICMAEE 2014) Atlantis Press Paris France 761
21 Naumlgele E (1986) The Zeta-potential of cement Part II Effect of pH-value Cement and 762 Concrete Research 16853ndash863 httpsdoiorg1010160008-8846(86)90008-6 763
22 Jain N Civil MG-IJ of M and 2015 U (2015) Formulation of Sulphate Resistant Super 764 Sulphated Cement Using Fluorogypsum and Granulated Blast Furnace Slag IOSR 765
Journal of Mechanical and Civil Engineering (IOSR-JMCE) 12153ndash159 766
23 Gao YX Yu BY Xu FL (2012) Effect of Modified Phosphogypsum on the Mechanical 767 Properties of Super Sulphate Cement Applied Mechanics and Materials 161264ndash268 768 httpsdoiorg104028wwwscientificnetAMM161264 769
24 Kantro D (1980) Influence of Water-Reducing Admixtures on Properties of Cement 770 PasteampmdashA Miniature Slump Test Cement Concrete and Aggregates 295ndash102 771
httpsdoiorg101520CCA10190J 772
34
25 Svermova L Sonebi M Bartos PJM (2003) Influence of mix proportions on rheology of 773 cement grouts containing limestone powder Cement and Concrete Composites 25737ndash774 749 httpsdoiorg101016S0958-9465(02)00115-4 775
26 Sonebi M (2006) Rheological properties of grouts with viscosity modifying agents as 776 diutan gum and welan gum incorporating pulverised fly ash Cement and Concrete 777
Research 361609ndash1618 httpsdoiorg101016JCEMCONRES200605016 778
27 Nehdi M Rahman M (2004) Effect of Geometry and Surface Friction of Test Accessory 779 on Oscillatory Rheological Properties of Cement Pastes ACI Materials Journal 780 101416ndash424 httpsdoiorg101435913428 781
28 Khayat KH Yahia A (1997) Effect of Welan Gum-High-Range Water Reducer 782 Combinations on Rheology of Cement Grout ACI Materials Journal 94365ndash372 783 httpsdoiorg1014359321 784
29 Lombardi G (1985) THE ROLE OF COHESION IN CEMENT GROUTING OF 785 ROCK In Proceedings of Fifteenth Congress on Large Dams International 786 Commission on Large Dams pp 235ndash261 787
30 Perrot A Rangeard D Picandet V Meacutelinge Y (2013) Hydro-mechanical properties of 788
fresh cement pastes containing polycarboxylate superplasticizer Cement and Concrete 789 Research 53221ndash228 httpsdoiorg101016JCEMCONRES201306015 790
31 Perrot A Lecompte T Khelifi H et al (2012) Yield stress and bleeding of fresh cement 791 pastes Cement and Concrete Research 42937ndash944 792
httpdxdoiorg101016jcemconres201203015 793
32 Sonebi M Perrot A (2019) Effect of mix proportions on rheology and permeability of 794 cement grouts containing viscosity modifying admixture Construction and Building 795
Materials 212687ndash697 httpsdoiorg101016jconbuildmat201904022 796
33 Picandet V Rangeard D Perrot A Lecompte T (2011) Permeability measurement of 797
fresh cement paste Cement and Concrete Research 41330ndash338 798 httpsdoiorg101016JCEMCONRES201011019 799
34 Perrot A Rangeard D (2017) Effects of mix design parameters on consolidation 800
behaviour of fresh cement-based materials Materials and Structures 50117 801 httpsdoiorg101617s11527-016-0988-0 802
35 Rangeard D Perrot A Picandet V et al (2015) Determination of the consolidation 803 coefficient of low compressibility materials application to fresh cement-based 804
materials Materials and Structures 481475ndash1483 httpsdoiorg101617s11527-014-805 0247-1 806
36 Massoussi N Keita E Roussel N (2017) The heterogeneous nature of bleeding in 807 cement pastes Cement and Concrete Research 95108ndash116 808 httpsdoiorg101016JCEMCONRES201702012 809
37 Montgomery D (2007) Design and Analysis of Experiments Second Edition John 810
Wiley amp Sons 811
35
38 Roussel N Stefani C Leroy R (2005) From mini-cone test to Abrams cone test 812 Measurement of cement-based materials yield stress using slump tests Cement and 813 Concrete Research 35817ndash822 httpsdoiorg101016jcemconres200407032 814
39 Mangat PS Khatib JM Wright L (2006) Optimum utilisation of FGD waste in blended 815 binders Proceedings of Institution of Civil Engineers Construction Materials 159119ndash816
127 httpsdoiorg101680coma20061593119 817
40 Khatib JM Mangat PS Wright L (2013) Early age porosity and pore size distribution of 818 cement paste with flue gas desulphurisation (FGD) waste Journal of Civil Engineering 819 and Management 19622ndash627 httpsdoiorg103846139237302013793609 820
41 Collier NC Milestone NB Gordon LE Ko SC (2014) The suitability of a supersulfated 821 cement for nuclear waste immobilisation Journal of Nuclear Materials 452457ndash464 822 httpsdoiorg101016jjnucmat201405078 823
42 Masoudi R (2018) Examining compositions hydration mechanisms and properties of 824 supersulfated cement for use in concrete by Examining compositions hydration 825 mechanisms and properties of supersulfated cement for use in concrete University of 826 Toronto 827
828
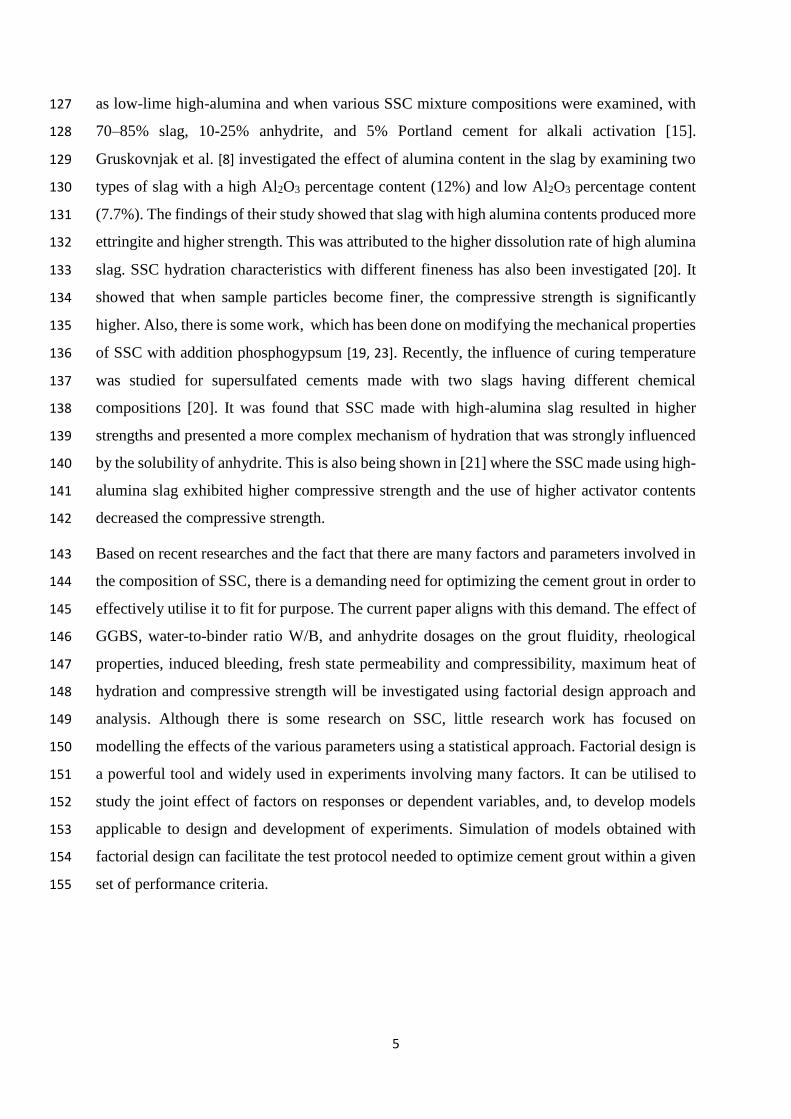
5
as low-lime high-alumina and when various SSC mixture compositions were examined with 127
70ndash85 slag 10-25 anhydrite and 5 Portland cement for alkali activation [15] 128
Gruskovnjak et al [8] investigated the effect of alumina content in the slag by examining two 129
types of slag with a high Al2O3 percentage content (12) and low Al2O3 percentage content 130
(77) The findings of their study showed that slag with high alumina contents produced more 131
ettringite and higher strength This was attributed to the higher dissolution rate of high alumina 132
slag SSC hydration characteristics with different fineness has also been investigated [20] It 133
showed that when sample particles become finer the compressive strength is significantly 134
higher Also there is some work which has been done on modifying the mechanical properties 135
of SSC with addition phosphogypsum [19 23] Recently the influence of curing temperature 136
was studied for supersulfated cements made with two slags having different chemical 137
compositions [20] It was found that SSC made with high-alumina slag resulted in higher 138
strengths and presented a more complex mechanism of hydration that was strongly influenced 139
by the solubility of anhydrite This is also being shown in [21] where the SSC made using high-140
alumina slag exhibited higher compressive strength and the use of higher activator contents 141
decreased the compressive strength 142
Based on recent researches and the fact that there are many factors and parameters involved in 143
the composition of SSC there is a demanding need for optimizing the cement grout in order to 144
effectively utilise it to fit for purpose The current paper aligns with this demand The effect of 145
GGBS water-to-binder ratio WB and anhydrite dosages on the grout fluidity rheological 146
properties induced bleeding fresh state permeability and compressibility maximum heat of 147
hydration and compressive strength will be investigated using factorial design approach and 148
analysis Although there is some research on SSC little research work has focused on 149
modelling the effects of the various parameters using a statistical approach Factorial design is 150
a powerful tool and widely used in experiments involving many factors It can be utilised to 151
study the joint effect of factors on responses or dependent variables and to develop models 152
applicable to design and development of experiments Simulation of models obtained with 153
factorial design can facilitate the test protocol needed to optimize cement grout within a given 154
set of performance criteria 155
6
2 Experimental Programme 156
21 Materials and Test Methods 157
The grout mixes investigated in this study were prepared with Standard CEM I 425N Portland 158
cement (PC) specified by BS EN 197-1 The ground granulated blast furnace slag (GGBS) in 159
accordance to BS EN 15167-2 was used The chemical composition of CEM I and GGBS are 160
provided in Table 1 Anhydrite (ANH) was used as the source of sulphate in the present study 161
and it was partially or completely replaced the PC The proportions of the grout mixes are 162
shown in Table 2 163
164
Table 1 Chemical and physical properties of cement and GGBS 165
Chemical analysis Material
CEM I GGBS
SiO2 () 2101 3518
Al2O3 () 492 1396
Fe2O3 () 284 025
MgO() 220 818
CaO () 6452 4121
Na2O () 020 019
K2O () 071 042
SO3 () 253 --
P2O5 () 011 --
LOI () 126 064
Physical analysis
Specific gravity 308 291
Specific surface area [m2kg] 360 600
166
Table 2 Mix proportions for the grouts used in the factorial design 167
Mix
No
Code WB
Percentage ()
WB GGBS ANH GGBS ANH
M1 -1 -1 -1 034 60 0
M2 1 -1 -1 044 60 0
M3 -1 1 -1 034 60 20
M4 1 1 -1 044 60 20
M5 -1 -1 1 034 80 0
M6 1 -1 1 044 80 0
M7 -1 1 1 034 80 20
M8 1 1 1 044 80 20
M9 0 0 0 039 70 10
M10 0 0 0 039 70 10
M11 0 0 0 039 70 10
M12 0 0 0 039 70 10
168
7
All grout mixes were prepared in 2 L batches using a high-shear mixer with a 45 L capacity 169
The mixing water was kept at 98 plusmn 02 ordmC to compensate for heat generated during mixing 170
The cement and GGBS were mixed with ANH in a sequence that started with adding all of the 171
water into the mixer After one minute the binder was gradually introduced The grout was 172
mixed for one minute followed by 30 seconds of rest Subsequently the grout was mixed again 173
for 2 min at a high speed (285 rpm) and for 1 min at the low speed (140 rpm) 174
For all tests the timing is given from zero time ie the time when the cement particles first 175
touch the mixing water The mini-slump flow test started at 7 min (immediately after the end 176
of mixing) The transparent cone-shaped mould described elsewhere [24] was placed in the 177
centre of a smooth Plexiglas plate After filling with grout the cone was gently lifted 178
(approximately 30 s after placement of the grout) When the flow stopped the spread of the 179
grout was measured with a ruler in two perpendicular directions 180
Marsh cone test was carried out using a metal cone with an orifice diameter of 10 mm and 181
started at 8 plusmn 1 min One litre of grout was poured into the cone The conersquos orifice was opened 182
15 s after pouring the cement grout into the cone The time taken for each 100 ml of grout to 183
flow through the orifice was recorded and the measurements were completed upon collecting 184
700 ml of grout 185
The viscosity of cement grout was determined using a coaxial rotating cylinder viscometer 186
Fann (smooth cylinders no serration) that determined apparent viscosity at different shear 187
rates The test was contained in the annular space between an outer cylinder (rotor) with a 188
radius of 18415 mm and a bob with a radius of 17245 mm and a height of 380 cm The rotor 189
and bob were plunged into a cup containing 350 ml of sample grout Viscosity measurements 190
were made when the outer cylinder rotating at a known speed caused a viscous drag to be 191
exerted by the fluid This drag created a torque on the bob which was transmitted to a precision 192
spring where its deflection was measured and compared with test conditions and the 193
instrumentrsquos constants The measurement was made for 12 rotor speeds from 09 rpm to 600 194
rpm where the viscometer reading values () were recorded The value of shear stress (Pa) 195
was calculated by including k1 torsion constant of spring per unit deflection (N-cmdegree) 196
k2 shear stress constant for the effective bob surface (cm-3) and k3 shear rate constant [s-1rpm] 197
[25 26] 198
Rotor speed was increased step by step and the viscometer readings were recorded with 199
increasing rotation speeds The reading was taken when the needle in the viscometer was 200
8
stabilised or 30 seconds after the change of speed in cases when the needle had not stabilised 201
due to the thixotropy of the cement grout The time of reading was generally between 5 and 202
10 seconds 203
In this study the down-curve was chosen for final evaluation because it offered a better 204
description of the rheological behaviour of the grouts including a structural breakdown 205
phenomenon of inner forces among particles [27] The values of shear yield stress (the 206
minimum shearing stress required for the fluid to start flowing) and plastic viscosity used the 207
modified Bingham model [28] and are expressed as follows 208
2
0 cp (1) 209
Where τ0 is yield stress (Pa) μp is plastic viscosity (Pas) is shear rate (s-1) and c is a 210
constant 211
The cohesion of grout was determined at 30 plusmn 1 min with a Lombardi plate cohesion meter 212
[29] A thin galvanized steel plate (100times100times1 mm) was immersed in the grout and hung on a 213
stand placed on an electronic balance The weight of the grout still present on the plate was 214
recorded when the dripping of the grout had stopped This test was followed by the fresh 215
density measurement of the grout with a mud balancer Knowing the fresh density of the grout 216
it was possible to calculate the thickness on each side of the plate 217
The resistance of the fresh grout to induced bleeding was evaluated using a pressure filter The 218
equipment consists of a pressure vessel filter paper which is placed on a sieve and a graduated 219
cylinder A 200 ml grout sample is placed in the pressure vessel After closing the cell the 220
graduated cylinder is placed under the outlet of the cell The cell is pressured by compressed 221
air to 055 MPa The volume of water going out through the outlet on the bottom of the cell is 222
recorded at 15 and 30 s then at every minute up to 10 min and then at every 5 min up to 30 min 223
[25] 224
Considering homogeneous bleeding the results of the induced bleeding tests allow to derive 225
the evolution of the permeability of the sample during its compaction under the applied 226
pressure The permeability of the material is directly linked to the bleeding rate during the 227
material consolidation until the tested material is able to sustain the applied pressure [30 31] 228
It refers to the material ability to slow down the water filtration process 229
The measurement of the flow water allows to compute instantaneous WB ratio and makes it 230
possible to link it with the computed instantaneous permeability at a given time of the test [32ndash231
9
34] I The water flow is computed by dividing the variation of the measured water mass flowing 232
out the samples by the elapsed time between two successive data sampling In this study value 233
of permeability at 1 and 30 minutes are taken and compared It corresponds to the initial and 234
final permeability of the mixes 235
The material compressibility is considered in a soils mechanics way [30 35] It corresponds to 236
the ratio of the variation of void ratio (liquidsolid volume ratio) to the variation of logarithm 237
of applied pressure between the initial and the final state of the induced bleeding test It 238
provides the equilibrium state of the sample under a given applied pressure and is valid for 239
both homogeneous and heterogeneous bleeding [36] 240
It is worth noting that the computed permeability describes homogeneous bleeding kinetics 241
while compressibility describes the amplitude of the bleeding phenomenon 242
Heat of hydration was evaluated by isothermal calorimetry with an eight-channel heat 243
conduction calorimeter maintained at 22degC This equipment measures heat evolved by 244
comparing the temperatures of a grout sample and an inert reference which are both held under 245
isothermal conditions The heat flow results are recorded as a function of time CEM I GGBS 246
and ANH were blended manually for 30 s After the addition of water the grout was blended 247
10 s by hand and then an additional 50 s mechanically Polyethylene ampoules were filled with 248
approximately 6 g of each grout and the experiments were conducted for at least 72 h 249
The compressive strength of the grout was determined by crushing three cubes of 50 mm size 250
After casting the samples were covered with a polymer sheet (a cling film) to limit evaporation 251
of water and stored in a conditioning room at 20 plusmn 2 degC for 24 plusmn 05 hours Afterwards cubes 252
were demoulded and placed in water at 20 plusmn 1 degC until tested at 1 3 7 and 28days 253
In order to perform the pH test a powder sample of the hardened mixes was required The test 254
was performed on 1 7 and 28 day samples As mixes 9-12 are of identical composition the 255
reason is explained later in 41 derived statistical model tests were only performed on sample 256
10 To get the powder with a fineness of 65μm the samples were firstly drained of the acetone 257
To remove any remaining acetone they were placed in a vacuum desiccator The pieces were 258
then ground using a mortar and pestle passed through a 65 μm sieve placed in sample bags 259
and returned to the desiccator The samples had then to be mixed with distilled water to enable 260
the pH test to be performed A 110 ratio of cement to water was used and mixed for 24 hours 261
using a rotating machine To get the pH reading the samples were put into a centrifuge machine 262
to separate the solid and liquid At this stage the solution should have a pH equivalent to cement 263
10
it was mixed with To get a pH reading for the samples a pH device was used where a probe 264
is placed in the solution The machine was calibrated with three buffer solutions of 7 10 and 265
13 pH levels before measuring the pH of the samples 266
SEM (scanning electron microscopy) was carried out using a JEOL JSM6400 on flat fractured 267
surface specimens obtained from compression testing at 7-day samples Prior to SEM testing 268
the samples were mounted onto metal stubs using carbon paste and coated with gold film to 269
ensure good conductivity The accelerated voltage was set at 20 kV 270
22 Statistical Design and Modelling of Experiments 271
The technique of analysis used in this study was a 2k factorial experimental design [37] to 272
evaluate the influence of two different levels (maximum and minimum) for each variable on 273
the relevant grout properties Three key parameters (WB ANH GGBS) that should have 274
significant influence on mix characteristics of supersulfated cements were selected to formulate 275
the mathematical models for evaluating relevant properties (ie k = 3 in this study thus the 276
total mixes for the factorial design was 23 = 8) Additionally a mix at the central point was 277
replicated four times to estimate the experimental error and improve the reliability of the 278
models The coding and levels of the variables (WB and dosages of GGBS and ANH) are 279
given Table 2 280
The statistical models are valid for supersulfated grout (SSC) mixes made with WB GGBS 281
and ANH in the ranges of 034 to 044 60 to 80 and 0 to 20 respectively The modelled 282
experimental region consisted of mixtures ranging from coded variables of ndash1 to +1 The coded 283
factors for variables were calculated by 284
Coded Factor = (Actual value-Factor means)[Range of factor value2] (2) 285
Hence 286
Coded WB = (Actual WB ndash 039)005 287
Coded GGBS = (Actual GGBS ndash 07)01 288
Coded Anhydrite = (Actual ANH ndash 01)01 289
The responses modelled were mini-slump plate cohesion Marsh cone yield stress plastic 290
viscosity induced bleeding at 1 min 5 and 30 mins permeability at 1 min and 30 mins 291
compressibility and compressive strength at 1 3 7 and 28 days The general model associated 292
11
with the two-level factorial design incorporating three independent variables (WB GGBS 293
ANH) is expressed by 294
Y1 = a0 + a1WB + a2GGBS + a3ANH+ a4WBGGBS + a5WBANH + a6GGBSANH 295
+ a7WBGGBSANH + ε (3) 296
where 297
Y1 Response (mini slump marsh cone plate cohesion etc) 298
a0 Overall mean factor effect 299
a1-a7 Regression coefficients representing model constants (contribution of independent 300
variables and their interaction to each response) 301
a1WB a2GGBS a3ANH Linear effect of factors WB GGBS and ANH 302
a4WBGGBS a5WBANH a6GGBSANH a7WBGGBSANH Interaction effects of 303
factors WB GGBS and ANH 304
ε Random error term representing the effects of uncontrolled variables 305
Analysis of variance (ANOVA) was used to test the significance of regression models and t-306
tests were performed to identify the non-significant (NS) variables and second order 307
interactions which were subsequently eliminated from the derived models Model coefficients 308
were determined using multi-linear regression analysis based on a normal distribution 309
assumption The error was assumed to be random and normally distributed so the residual 310
terms which represent the difference between the actual and predicted values should exhibit 311
similar properties [37] The probability value (Prob) obtained from ANOVA determines the 312
statistical significance of each factor and their interactions For most of the parameters the 313
probability that the derived coefficients associated with the various variables influencing each 314
response were limited to 10 This signifies that there is less than 10 chance or 90 315
confidence limit that the contribution of a given parameter to the tested response exceeds the 316
value of the specified coefficient A negative estimate indicates that an increase of the given 317
parameter results in a reduction of the measured response 318
12
3 Results and discussion 319
The results of the experimental work characterize the behaviour of the mortars with different 320
WB ANH and GGBS levels Table 3 summarises all results of the experimental work 321
performed The results were used to construct the regression models 322
Table 3 Average results from experimental work 323 324
Viscometer Induced bleeding
Mix Mini-
slump
Flow
time
Cohesion
meter
Yield
value
Plastic
viscosity
1min 5min 30min
(mm) (s) (mm) (Pa) (Pas) (mL) (mL) (mL)
1 61 230 105 191 0923 220 470 480
2 89 25 55 97 0323 290 780 810
3 67 200 118 172 0802 280 580 605
4 111 12 20 80 0199 490 860 860
5 52 360 143 251 1203 280 520 540
6 83 69 86 99 0403 360 700 700
7 60 250 125 211 0980 310 580 590
8 110 13 40 77 0224 350 910 950
9 71 150 87 101 0617 370 720 730
10 73 102 122 106 0681 290 620 620
11
12
77
74
192
83
89
110
124
101
0660
0641
290
350
640
715
645
720
325
Table 3 Average results from experimental work (continued) 326
Mix Permeability Permeability Compre-
ssibility
Compressive strength
1 min 30 min fc 1d fc 3d fc 7d fc 28d
(ms) (ms) (MPa) (MPa) (MPa) (MPa)
1 216E-09 317E-09 0155 299 506 581 704
2 512E-08 418E-09 0298 168 383 547 558
3 448E-08 366E-09 0194 213 334 406 527
4 374E-08 425E-09 0312 140 223 256 408
5 448E-08 342E-09 0173 233 434 507 535
6 512E-08 395E-09 0255 136 371 371 448
7 440E-08 361E-09 0187 108 232 343 532
8 451E-08 433E-09 0342 68 200 263 473
9 446E-08 402E-09 0250 196 328 398 592
10 468E-08 371E-09 0212 171 232 361 556
11
12
423E-08
516E-08
379E-09
400E-09
0221
0246
207
183
313
301
451
435
565
520
327
The derived quadratic statistical models of grout for mini-slump flow time cohesion plate 328
yield stress plastic viscosity induced bleeding at 1 min 5 min and 30 min permeability at 1 329
13
min and 30 min compressibility and compressive strength at 1 3 7 and 28 days are given in 330
Equations (4) to (18) where WB GGBS and ANH are given in codes values 331
Mini-Slump (mm) = 7881 + 1919 WB + 781 ANH + 444 WBANH - 294 GGBS (4) 332
333
Marsh flow time (s) = 1404 - 1153 WB ndash 261 ANH + 281 GGBS (5) 334
335
Plate Cohesion meter (microm) = 86 - 366 WB + 122 GGBS - 107 ANH - 091 WBANH (6) 336
337
Yield Value (Pa) = 1466 ndash 584 WB - 126 WBGGBS - 125 ANH + 124 GGBS (7) 338
339
Plastic Viscosity (Pas) = 063 - 034 WB - 0078 ANH + 0073 GGBS 340
- 0047 WBGGBS - 0022 ANHGGBS (8) 341
342
Induced Bleeding at 1 min (ml) = 3225 + 50 WB + 35 ANH ndash 225 WBANHGGBS (9) 343
344
Induced Bleeding at 5 mins (ml) = 675 + 1375 WB + 575 ANH (10) 345
346
Induced Bleeding at 30 mins (ml) = 6919 + 1381 WB + 594 ANH (11) 347
348
Permeability at 1 min (ms) x 10-8 = 4 + 0615 WB + 0621 AHN ndash 0773 WBGGBS 349
- 0426WBAHN - 0446 AHNGGBS (12) 350
351
Permeability at 30 min (ms) x 10-8 = 0382 + 0035 WB + 0014 ANH 352
+ 0008 WBANHGGBS (13) 353
354
Compressibility = 02396 + 00623 WB + 00194 ANH + 00012 WBANHGGBS (14) 355
356
ƒc 1 d (MPa) = 1705 - 426 WB - 384 ANH - 343 GGBS + 145 WBANH (15) 357
358
ƒc 3 d (MPa) = 3215 - 879 ANH - 412 WB ndash 261 GGBS (16) 359
360
ƒc 7 d (MPa) = 4092ndash 924 ANH - 5 WB - 383 GGBS (17) 361
362
14
ƒc 28 d (MPa) = 5348 - 515 WB - 382 ANH ndash 262 GGBS + 436 ANHGGBS (18) 363
364
The correlation coefficient of most of the proposed models were higher than 090 except for 365
plastic viscosity compressive strength after 3days and compressive strength after 28days 366
which have coefficients of 070 086 and 087 respectively 367
Table 4 shows the average measured responses of the four replicate grouts the coefficients of 368
variation (COV) as well as the estimated errors with a 90 confidence limit for each of the 369
measured properties The estimated error levels for mini-slump plate cohesion meter Marsh 370
cone yield stress plastic viscosity induced bleeding at 1 min 5 min and 30 mins permeability 371
at 1 min and 30 min compressibility and compressive strengths at 1 3 7 28 days were plusmn 22 372
mm plusmn 0001mm plusmn 40 s plusmn 09 Pa plusmn 002 Pa s plusmn 28 ml plusmn 42 ml plusmn 45 ml plusmn 32x10-9 (ms) 373
plusmn 13x10-10 (ms) plusmn 00153 plusmn 13 MPa plusmn 35 MPa plusmn 33 MPa and plusmn 25 MPa respectively 374
The relative experimental errors for mini-slump plate cohesion meter Marsh cone yiled stress 375
plastic viscosity induced bleeding permeability compressibility compressive strengths were 376
limited to 3-11 On the other hand relative error for march cone was up to 30 377
Table 4 Repeatability of test parameters at the central point 378
379
Tests Mini-
slump
Plate
cohesion
Marsh
cone
Yield
stress
Plastic
viscosit
y
Induced
bleeding
at 1 min
Induced
bleedin
g at 5
min
Induced
bleeding
at 30
min
Mean (n=4) 736
mm
001
mm
1318
s
108
Pa
065
Pa s
325
ml
674
ml
679
ml
Coefficient
of variation
()
37 115 372 105 42 127 76 80
Estimate
error (90
confidence
limit)
22
mm
0001
mm
402
s
09
Pa
002
Pa s
28
ml
42
ml
45
ml
380
381 Table 4 Repeatability of test parameters at the central point (continued) 382
383
Tests
Permeability
1 min
x10-8
Permeability
30 min
x10-8
Compressibility frsquoc 1d frsquoc 3d frsquoc 7d frsquoc 28d
Mean (n=4) 463
ms
0388
ms 02323
189
MPa
293
MPa
411
MPa
558
MPa
Coefficient
of variation
()
85 39 8 84 144 98 53
15
Estimate
error (90
confidence
limit)
032
(ms)
0013
(ms)
00153
13
MPa
35
MPa
33
MPa
24
MPa
384
385
31 Accuracy of the established models 386
387
The ratio of predicted-to-measured properties for grout ranged between 087 and 115 388
indicating good accuracy for prediction of mini-slump plate cohesion induced bleeding at 1 389
min 5 mins and 30 mins yield stress plastic viscosity and compressive strength at 1-d 3-d 7-390
d and 28-d In general the proposed models for mini-slump plate cohesion Marsh cone and 391
compressive strength appeared to be accurate in predicting fluidity cohesivity induced 392
bleeding permeability at 30 min compressibility and compressive strength with low scatter 393
between measured and predicted values However the average values of predictedmeasured 394
ratio of yield values were slightly higher (074) 395
396
32 Isoresponses of the proposed models 397
398
The isoresponse surfaces and contour plots for mini-slump plate cohesion Marsh cone yield 399
stress plastic viscosity induced bleeding at 1 min 5 mins and 30 mins permeability at 1 min 400
and 30 mins compressibility and compressive strength at 1-d 3-d 7-d and 28-d were obtained 401
by using response surface methodology (RSM) The isoresponse surfaces and contour plots 402
were obtained from the regression models and because the models contained interaction and 403
second-order variables the contour lines were curved 404
The proposed statistical models can therefore be used to evaluate the effect of a group of 405
variables on the properties affecting the quality of supersulfated grout This allowed for the 406
calculation of isoresponse surfaces from the parameters under study outside the experimental 407
domain and the optimisation of their effects The next sections will discuss the results of each 408
experiment separately 409
331 Mini-slump 410
As shown in Eq 4 the mini-slump is influenced in order of significance by WB ratio 411
anhydrite proportion interaction of WB and ANH and the percentage of GGBS content The 412
WB ratio had the greatest effect on fluidity due to better lubrication of the particles in the paste 413
16
[29] The mini-slump test was accompanied by very low shear The value of mini-slump is to 414
characterise yield stress [38] therefore higher mini-slump value indicated a lower yield stress 415
The effect of WB on the increase of mini-slump was two and half-time than that of ANH (192 416
vs 781 in Eq 4) However increased ANH resulted in a 27 times greater increase in mini-417
slump than reduced GGBS (781 vs -294 in Eq 4) Figure 1(a) shows the effect of increased 418
WB on mini-slump vs ANH (when GGBS was kept constant at 70) and Figure 1(b) shows 419
GGBS vs ANH (when WB was fixed at 039) Based on these figures it is evident that mini-420
slump increased significantly when the dosage of WB and ANH increased 421
422
(a) (b) 423
Fig 1 Isoresponse curves of mini-slump (mm) (a) WB vs ANH and (b) GGBS vs ANH 424
425
332 Marsh cone 426
The time needed for a grout sample to flow through the Marsh cone is proportional to the 427
viscosity of the cement grout the flow time becomes an index of fluidity so the longer the 428
flow time the lower the fluidity Similar to the previous trends Eq 5 shows that the values of 429
Marsh cone are influenced in order of significance by WB GGBS and ANH This is 430
graphically illustrated in Figure 2 431
GGBS = 70
034 039 042 044
0
5
10
15
20
WB
AN
H (
)
65
74
83
92
101
037
AN
H(
)
WB = 039
60 65 70 75 80
0
5
10
15
20
GGBS()
70
75
80
85
17
432
(a) (b) 433
Fig 2 Isoresponse curves for flow time (s) (a) WB vs ANH and (b) GGBS vs ANH 434
435
It can be noted that an increase in WB and ANH or a reduction in GGBS led to decreasing 436
the Marsh cone flow time For example at fixed WB at 039 and GGBS of 70 respectively 437
the increase in ANH dosage from 5 to 20 led to a marked reduction of the Marsh cone flow 438
time from 170 to 140 s (Figure 2(a)) This behaviour is attributed to the change in plastic 439
viscosity of the grout as will be discussed later 440
333 Cohesion plate 441
As shown in Eq 6 the cohesion plate was influenced in order of magnitude by the WB and 442
the percentage of GGBS and ANH The increasing WB had a 34 times the influence on the 443
reduction of the cohesion plate test results as the increased ANH (for a GGBS constant) By 444
comparing the effects of WB and GGBS on plate cohesion the increased WB can be 445
interpreted as having approximately a 3 times greater influence on the reduction of plate 446
cohesion values than the increase in GGBS (-366 vs 122 in Eq 6) given that ANH is held 447
constant The effect of an increase in WB from 034 to 044 and ANH from 0 to 20 with a 448
fixed GGBS dosage of 70 is presented in Figure 3(a) Increased WB led to a decreased 449
cohesion plate value Conversely an increase in GGBS increased the cohesion plate value and 450
an increased ANH caused a reduction in cohesion plate (Figure 3(b)) 451
GGBS = 70
034 036 039 042 0440
5
10
15
20
WB
AN
H (
)
40
6080
100120
140160
180200
220
WB = 039
60 65 70 75 80
0
5
10
15
20
GGBS ()
AN
H (
)
100
120
140
160
180
18
452
(a) (b) 453
Fig 3 Isoresponse curves for plate cohesion meter (a) WB vs ANH and (b) GGBS vs 454 ANH 455
334 Yield stress 456
As shown in Eq 7 yield value was influenced in order of magnitude by WB and dosages of 457
ANH and GGBS Based on Figure 4 (a) when WB was fixed at 039 GGBS maintained at 458
70 and ANH increased to 5 the isoresponse curve showed a yield value of 15 Pa On the 459
other hand if the proportion of ANH was further increased to 20 while GBBS was 460
maintained at 70 the yield value decreased to 135 Pa This corresponds with Eq (7) in 461
which the proportion of WB and ANH were increased while GGBS was kept constant 462
resulting in a reduction in yield stress An increase in GGBS content resulted in an increase of 463
the yield stress 464
Figure 4 (b) shows the isoresponse curve of the yield value with a fixed proportion of GGBS 465
at 70 When WB was 039 and ANH was 5 the isoresponse of the predicted yield value 466
was 155 Pa If ANH was increased to 20 while maintaining WB at 039 the isoresponse of 467
the yield value was 135 Pa 468
It can be interesting to note that the observed results for the yield stress are closed to the one 469
observed with the cohesion plate and mini-slump tests This is expected as yield stress values 470
can be derived from those two simple tests 471
GGBS = 70
034 037 039 042 0440
5
10
15
20
WB
AN
H(
)
45
55
65
7585
95
105
115
WB = 039
60 65 70 75 800
5
10
15
20
GGBS ()
AN
H(
)
75
85
95
105
19
472
(a) (b) 473
Fig 4 Isoresponse curves for yield stress (Pa) (a) WB vs ANH and (b) GGBS vs ANH 474
335 Plastic viscosity 475
Plastic viscosity was influenced in order of magnitude by WB and the dosages of ANH and 476
GGBS ANH and GGBS had almost opposite effects on plastic viscosity (-0078 vs 0073 in 477
Eq 8) As shown in Eq (8) increased WB had the greatest primary effect on plastic viscosity 478
(034 vs 0078 and 0073) The increased WB had approximately a 44 times greater influence 479
on reducing plastic viscosity than increased ANH or decreased GGBS 480
In the isoresponse curve of plastic viscosity shown in Figure 5 (a) when GGBS was fixed at 481
70 WB set at 039 and ANH maintained at 5 the predicted plastic viscosity value was 482
068 Pas On the other hand if the dosage of ANHB was increased to 20 while maintaining 483
a similar WB the plastic viscosity was reduced to 055 Pas 484
In Figure 5 (b) WB was fixed at 039 when GGBS was held at 70 and ANH at 5 the 485
predicted plastic viscosity was 067 Pas However when ANH was increased to 20 and 486
GGBS was maintained at 70 the predicted plastic viscosity dropped to 055 Pas 487
AN
H(
)
GGBS = 70
034 037 039 042 044
0
5
10
15
20
WB
1012
1416
18
20
WB = 039
60 65 70 75 800
5
10
15
20
GGBS ()
AN
H(
)
13
14
15
20
488
(a) (b) 489
Fig 5 Isoresponse curve for plastic viscosity (Pas) (a) WB vs ANH and (b) GGBS vs 490
ANH 491
336 Induced bleeding 492
The induced bleeding equations for 1 and 5 minutes (Eqs 9 10) and 30 minutes (Eq 11) are 493
very similar The two influencing factors of induced bleeding are WB ratio and anhydrite 494
WB ratio has the greatest effect over two times the effect of anhydrite content Figure 6 shows 495
the isoresponse for bleeding versus the WB ratio for a fixed value of GGBS at 70 It can be 496
seen that when an anhydrite value is selected and the WB ratio is increased the bleeding will 497
also increase Similarly if a WB ratio is selected and the anhydrite content is increased the 498
bleeding will again increase 499
500
GGBS = 70
034 037 039 042 0440
5
10
15
20
WB
AN
H(
)
035
045
055
065
075
085
095
WB = 039
60 65 70 75 800
5
10
15
20
GGBS ()
AN
H(
)
055
060
065
075
034 036 039 042 044
0
5
10
15
20
WB
AN
H (
)
26
28
30
3234
36
38
40
GGBS=70
21
(a) 501
502
(b) (c) 503
Fig 6 Isoresponse curves for induced bleeding at 1 5 and 30 min WB vs ANH 504
337 Permeability 505
Figure 7 (a) and (b) showed firstly that the permeability decreased significantly from 1 min to 506
30 min Permeability at 1 min was influenced in order of magnitude by WB and the dosage 507
of ANH All interactions between 3 parameters had almost opposite effects on permeability 508
(Eq 12) As shown in Eq (12) increased WB and AHN had the greatest primary effect on 509
permeability at 1 min It seems there is an optimum reached at WB = 40 and AHN at 17 510
Similarly the permeability at 30 min is affected in order of significance by WB followed by 511
ANH (Eq 13) In Figure 7 (b) WB was fixed at 039 when GGBS was held at 70 and ANH 512
at 10 the predicted permeability was 038 x 10-8 (ms) However when ANH was increased 513
to 20 and GGBS was maintained at 70 the predicted permeability increased to 040x10-8 514
(ms) 515
516
GGBS = 70
034 036 039 042 0440
5
10
15
20
WB
AN
H (
)
545
61
675
74
805
GGBS = 70
034 036 039 042 0440
5
10
15
20
WB
AN
H (
)
56
60
64
68
72
7680
84
22
517
(a) (b) 518
Fig 7 Isoresponse curves for permeability at 1 and 30 min WB vs ANH 519
338 Compressibility 520
As shown in Eq (14) the compressibility was influenced in order of magnitude by the WB 521
and the percentage of ANH The interaction between 3 parameters affected also the 522
compressibility The increasing WB had a 32 times the influence on the increase of the 523
compressibility results as the increased ANH (for a GGBS constant) The effect of an increase 524
in WB from 034 to 044 and ANH from 0 to 20 with a fixed GGBS dosage of 70 is 525
presented in Figure 8 Increased WB led to an increase of compressibility Similarly an 526
increase in AHN increased the compressibility 527
528
Fig 8 Isoresponse curves for compressibility WB vs ANH 529
034 036 039 042 044
0
5
10
15
20
GGBS = 70 WB
AN
H (
)
3
35
4
4
45
5
034 036 039 042 044
0
5
10
15
20
WB
AN
H (
)
034
035
036 037 038 039 04
041
042
4
GGBS=70
034 036 039 042 044
0
5
10
15
20
WB
AN
H (
)
017
019
021 023 025 027
029
031
GGBS=70
23
530
339 Compressive strength 531
After one day from Eq 15 the influencing factors in order of significance are WB ratio 532
anhydrite content GGBS content and the interaction of WB and ANH The effect of the first 533
three was similar but WB had 11 times greater effect than anhydrite and 125 times greater 534
effect than GGBS While the interaction of WB and anhydrite had around a third of the 535
influence of WB Figures 9 (a) and (b) show the isoresponses for 1-day compressive strength 536
From Figure 9 (a) it can be seen when the GGBS content is fixed at 70 for a given anhydrite 537
content increasing the WB ratio will decrease the strength Also if a WB ratio is selected and 538
the anhydrite is increased similarly the strength will decrease From Figure 9 (b) with the WB 539
ratio fixed at 039 once again an increase in GGBS led to a reduction of compressive strength 540
at 1 day 541
542
(a) (b) 543
Fig9 Isoresponse curves for compressive strength at 1d (a) (WB vs ANH) and (b) (GGBS 544 vs ANH) 545
Eqs 16 17 and 18 show the effect of GGBS and ANH percentages on compressive strength at 546
3-d 7-d and 28-d Figures 10 11 and 12 show the isoresponse of the compressive strength at 547
3-d 7-d and 28-d respectively with WB vs ANH Increased ANH led to a decrease of 3-d 548
and 7-d compressive strength As expected an Increase in WB led to a decrease in compressive 549
strength The percentage of ANH had a negative effect on compressive strength and showed a 550
greater influence particularly at 3-d and 7-d (879 (3 d) amp 924 (7d) vs 382 (28 d)) GGBS has 551
a negative impact on early strength development The negative effect of GGBS on compressive 552
GGBS = 70
034 037 039 042 0440
5
10
15
20
WB
AN
H(
)
12
14
16
18
20
22
2426
WB = 039
60 65 70 75 800
5
10
15
20
GGBS ()
AN
H(
)
10
12
14
16
18
20
22
24
strength at early ages is clearly attributable to the fact that up to 80 of cement has been 553
replaced by GGBS and it takes some time for GGBS to start developing its pozzolanic action 554
at a noticeable level The results indicate that ANH content influences strength to a greater 555
extent than GGBS at all ages The SO3 content was reported to have great influence on the 556
strength [39 40] 557
558
(a) (b) 559
Fig10 Isoresponse curves for compressive strength at 3d (a) (WB vs ANH) and (b) 560 (GGBS vs ANH) 561
562
563
(a) (b) 564
Fig11 Isoresponse curves for compressive strength at 7d (a) (WB vs ANH) and (b) (WB 565 vs ANH) 566
567
GGBS = 70
034 036 039 042 0440
5
10
15
20
WB
AN
H (
)
24
2628
30
3234
3638
4042
WB = 039
60 65 70 75 80
0
5
10
15
20
GGBS ()
AN
H (
)
2426
2830
32
34
36
3840
42
GGBS = 70
034 037 039 042 044
0
5
10
15
20
WB
AN
H(
)
3032
34
3638
40
42
44
46
48
WB = 039
60 65 70 75 80
0
5
10
15
20
GGBS ()
AN
H(
)
32
34
36
38
40
42
44
46
48
25
568
(a) (b) 569
Fig12 Isoresponse curves for compressive strength at 28d (a) (WB vs ANH) and (b) 570
(ANH vs GGBS) 571
3310 Discussion of the effect of WB GGBS and ANH 572
As expected the increase of WB led to an increase in mini-slump induced bleeding and a 573
reduction in flow time plate cohesion yield stress plastic viscosity and compressive strengths 574
This can be attributed to more water in the system 575
An increase in GGBS content resulted in a reduction of the flow time plate cohesion yield 576
stress and plastic viscosity while the fluidity is improved This was due to the fact the specific 577
gravity of slag is lower than that of PC leading to an increase in the paste volume and thus 578
improving the fluidity of paste 579
In case of an increase of ANH proportion while WB and GGBS were kept constant it led to 580
an increased mini-slump and induced bleeding while the flow time plate cohesion yield stress 581
and plastic viscosity were reduced This was due to the lower reactivity of ANH resulting in an 582
increase of water needed for lubrication of paste 583
As expected an increase in WB lead to an increase in induced bleeding permeability and a 584
decrease in compressibility [33 35] This is due to the increase in liquid volume between the 585
particles and to the reduction in the amount of interparticle forces Globally the compressibility 586
decreases and the permeability increases with ANH It can be explained by the reduced specific 587
area and lower reactivity that can lead to more available water in the samples 588
3311 Heat of Hydration 589
Heat of hydration is considered an important factor in the cement design as low heat of 590
hydration reduces the effect of thermal cracking The heat flow results of the calorimeter test 591
performed over a three days period can be seen in Figure 13 592
GGBS = 70
034 036 039 042 0440
5
10
15
20
WB
AN
H (
)
46
48
50
52
54
56
58
60
WB = 039
0 5 10 15 2060
65
70
75
80
ANH ()
GG
BS
(
)
50
52
54
56
5860
62
26
593
Fig 13 Heat flow graphs for first 3 days of reaction 594
Figure 13 presents that the largest peaks were in mixes 1 2 5 and 6 This shows that these 595
reactions generated the most heat and that they were quick Mixes 1 and 2 have the highest 596
OPC content at 40 and this suggests that to lower the heat of the reaction minimal OPC 597
should be used This is confirmed by the fact that mixes 5 and 6 have the next highest OPC 598
contents the same percentage as mixes 3 4 and 9 (one of the repeated mixes) which have 599
anhydrite present This implies that the presence of anhydrite will lengthen the reaction process 600
and reduce the heat produced during setting significantly The graph shows this by the absence 601
of a sharp peak instead a gentle curved hump is shown over a 2-day period whereas the mixes 602
showing a sharp peak occur after about 12 hrs Mix 7 which has the same solids content as 603
mix 8 but a lower WB ratio and no cement present showed the lowest heat flow during the 604
hydration process 605
Figure 14 shows the cumulative heat generation during the first 3 days of setting It is clear that 606
the two mixes (1 and 2) with highest cement content and absence of anhydrite had the highest 607
cumulative heat development over the 3-day period 643J and 594J respectively Mixes 3456 608
and 9 which all have 20 OPC content generated similar heat value over the 3 days Results 609
of mixes containing ANH implies that over the period that the anhydrite did not reduce the 610
cumulative heat generated but slowed the reaction and reduce the peak heat generated The 611
0
0002
0004
0006
0008
001
0012
0 50000 100000 150000 200000 250000 300000
He
at F
low
(mW
)
Time s()
M1
M2
M3
M4
M5
M6
M7
M9
1Day
2Day
3day
1d 2d 3d
27
graphs also suggest that a higher WB ratio produced a lower cumulative and peak heat 612
generation613
614
Fig 14 Cumulative heat generation curves for first 3 days 615
3312 pH measurements 616
Fig 15 summarises the results of pH and the nine mixes with different compositions of WB 617
the percentages of cement GGBS and ANH It is shown that Supersulfated cements (SSCs) 618
have lower pH values (lt 125 at all ages) than PC which has a pH of 139 [41] making SSC 619
more preferable in essential applications such as nuclear waste encapsulation 620
The figure shows that the pH value decreased with time for all samples between 1 and 7 days 621
Similar trend was observed in the majority of mixes between 7 and 28 days except for sample 622
2 5 and 9 which showed slight increase in the pH values This decrease refers to the 623
consumption of ions in the pore structure due to the hydration process 624
0
100
200
300
400
500
600
700
800
0 50000 100000 150000 200000 250000 300000
(J)
Time (s)
M1
M2
M3
M4
M5
M6
M7
M9
1 Day
3 Day
2 day
1d 2d 3d
1
2
3
9
45
6
7
28
625
626 Fig 15 Summary of pore solution pH 627
628
The incorporation of ANH replacing the Portland cement (C) results in remarkable decrease in 629
pH at all ages as introducing the ANH reduced the lower initial pH Likewise the increase in 630
the content of GGBS led to a decrease in the pH value of the pore structure as GGBS has lower 631
initial pH than Portland cement The increase of WB ratio decreased the pH value This is in 632
agreement with Collier [41] who found that increasing the wb ratio from 05 to 06 increased 633
the pH by I unit This was attributed to the increased availability of water in the case of WB 634
of 06 allowing hydration of more cement powder thereby releasing more hydroxide anions 635
into solution However in this study the WB ratio did not show a significant effect on 636
lowering the pH These results are in agreement with [42] which also found that decreasing the 637
pH improved the bulk resistivity of SSC mixtures 638
3313 SEM 639
Figure 16 shows the SEM images of some mixes at various magnifications The images clearly 640
show the dense and compact structure of the cement after seven days The dense structure was 641
another requirement from the cement chosen to enclose the waste to prevent leaching The 642
microstructure consists mainly of C-S-H the main hydration product and unhydrated slag 643
grains C-S-H is formed after the dissolution of slag grains when contacting the water and 644
alkalis and then the ionic species saturate the solution and then precipitate as hydrated phases 645
[8] There were abundant grains of hydrated and partially hydrated slag grains some small 646
1080
1100
1120
1140
1160
1180
1200
1220
1240
1260
1280
1 2 3 4 5 6 7 8 9
pH
val
ue
Mix Number
1 Day
7 Days
28 Days
29
GGBS particles presented rims of reaction products (eg Mix 6-Figure 16 (f) and Mix 9-Figure 647
16 (h)) It was found by [11] that the composition of the reaction rims around slag was similar 648
to that of the C-S-H from PC However [12] found that in the CndashSndashH of SSC is apparently 649
more foil like which is different than the fibrillar morphology of C-S-H in OPC Mix 3 and 650
Mix 4 (Figure 16 (c) and (d) respectively) exhibits more micro voids in the micrsostructure 651
which could explain the low strength of these mixes compared to mix 1 and 2 Ettringite was 652
not detected Ettringite is not the most abundant phase and it is not easy to detect in dried 653
polished samples because it is easily decomposed under the drying conditions of the vacuum 654
of the microscope column [11] 655
(a) Mix 1 image at 1100 magnification (b) Mix 2 image at 900 magnification
(c) Particle of unreacted slag mix3 7 days (d) An overall image of mix 4 at 7days
showing CSH and BFS particles
30
(e) Mix 5 image at 1100 magnification (f) Mix 6 image at 2300 magnification
(g) Mix 7 image at 2000 magnification (h) Mix 9 image at 2700 magnification
Fig 16 SEM results 656
4 Conclusions 657
The paper focused on optimizing the SSC cement grout in order to get the best of it The effect 658
of GGBS WB and ANH dosages on the grout fluidity rheological properties induced 659
bleeding maximum heat of hydration and compressive strength was investigated using 660
factorial design approach and analysis The models derived in this study are valid for the 661
experimental area corresponding to grout mixes made with variable levels of WB ANH and 662
GGBS in the ranges of 034 to 044 0 to 20 by mass of binder 60 to 80 by mass of 663
binder respectively Based on the results from this study the following conclusions are drawn 664
- In comparison to GGBS and ANH WB ratio had more pronounced effects on the 665
results of mini-slump plate cohesion meter Marsh cone time yield stress plastic viscosity 666
induced bleeding permeability compressibility and compressive strength 667
31
- The increase in the dosage of GGBS led to an increase in the values of plate cohesion 668
meter Marsh cone time yield stress and plastic viscosity while reducing the mini-slump 669
values maximum hydration and compressive strength This is ascribed to the fine nature 670
of GGBS particles and pozzolanic effect 671
- While the ANH particles caused a decrease in the maximum of heat of hydration it 672
increased the induced bleeding permeability and compressibility due to its dominant effect 673
on increasing the dormant period and increasing the rates of solid sedimentation and 674
induced bleeding water 675
- Increasing the dosage of ANH in grout reduced the hydrations kinetic at early-age and 676
thus reduced the compressive strength at 1d 3d and 7d However this effect diminished 677
at later ages at 28 d in a manner similar to increasing WB 678
- The increase in the dosage of ANH led to an increase in the mini-slump values 679
(fluidity) but a decrease in the values of yield stress plastic viscosity plate cohesion and 680
Marsh cone time This is attributed to better deflocculation of particles at the fresh state 681
- The increase of GGBS percentage delayed the reaction process and decreased the total 682
heat after 3 days while WB slightly reduced the total heat it didnrsquot significantly affect the 683
reaction process 684
- pH measurements in the present study confirmed the suitability of these mixture to low-685
pH applications as the increase in both the GGBS and ANH markedly decreased the initial 686
pH thereby lowering the pH at different ages 687
- The modelling and prediction of the response of other points in the experimental domain 688
were therefore possible Although the models are based on a given set of materials they 689
can be easily used to generate future results using other materials 690
- Dense microstructure was observed for mixes examined in this study C-S-H is the main 691
reaction product with presence of unreacted slag grains embedded well in the structure 692
However some micro voids were observed in mixes containing ANH which led to lower 693
compressive strength of mixes with ANH 694
CRediT authorship contribution statement 695
MSonebi and YBai did the conceptualization and the design of investigation as well as 696 performing the experiments MSonebi carried out the software analysis of the results and the 697
32
visualization MSonebi AAbdalqader T Fayyad and APerrot analysed the results and 698 wrote the original draft and reviewed and edited the final version 699
Declaration of Competing Interest 700
The authors declare that they have no known competing financial interests or personal 701 relationships that could have appeared to influence the work reported in this paper 702
Acknowledgments 703
The authors would like to express their gratitude to P McCann from QUB and N Collier 704 from Eden Nuclear and Environment Ltd for their helps for some experiments 705
706
References 707
1 Schneider M Romer M Tschudin M Bolio H (2011) Sustainable cement production-708 present and future Cement and Concrete Research 41642ndash650 709
httpsdoiorg101016jcemconres201103019 710
2 Madlool NA Saidur R Hossain MS Rahim NA (2011) A critical review on energy use 711 and savings in the cement industries Renewable and Sustainable Energy Reviews 712
152042ndash2060 httpsdoiorg101016jrser201101005 713
3 EN15743 (2015) BS EN 157432010+A12015 Supersulfated cement - Composition 714
specifications and conformity criteria BSI 715
4 Khatib JM Wright L Mangat PS (2016) Mechanical and physical properties of concrete 716
containing FGD waste Magazine of Concrete Research 68550ndash560 717 httpsdoiorg101680macr1500092 718
5 Khatib JM Mangat PS Wright L (2008) Sulfate resistance of mortar containing 719
simulated FGD waste Proceedings of Institution of Civil Engineers Construction 720 Materials 161119ndash128 httpsdoiorg101680coma20081613119 721
6 (2020) Specifying Sustainable Concrete 722
7 Hewlett PC (2004) Learsquos Chemistry of Cement and Concrete fourth edi Elsevier 723 Science amp Technology Books Oxford 724
8 Gruskovnjak A Lothenbach B Winnefeld F et al (2008) Hydration mechanisms of 725 super sulphated slag cement Cement and Concrete Research 38983ndash992 726
httpsdoiorg101016jcemconres200803004 727
9 Grounds T Nowell D V Wilburn FW (2003) Resistance of supersulfated cement to 728 strong sulfate solutions Journal of Thermal Analysis and Calorimetry 72181ndash190 729
httpsdoiorg101023A1023928021602 730
10 Grounds T Nowell D V Wilburn FW (1995) The influence of temperature and 731
different storage conditions on the stability of supersulphated cement Journal of 732 Thermal Analysis 45385ndash394 httpsdoiorg101007BF02548772 733
33
11 Bazalduacutea-Medelliacuten ME Fuentes AF Gorokhovsky A Escalante-Garciacutea JI (2015) Early 734 and late hydration of supersulphated cements of blast furnace slag with fluorgypsum 735 Materiales de Construccion 65e043 httpsdoiorg103989mc201506013 736
12 Matschei T Bellmann F Stark J (2005) Hydration behaviour of sulphate-activated slag 737 cements Advances in Cement Research 17167ndash178 738
httpsdoiorg101680adcr2005174167 739
13 Richardson IG (2000) Nature of the hydration products in hardened cement pastes 740 Cement and Concrete Composites 2297ndash113 httpsdoiorg101016S0958-741 9465(99)00036-0 742
14 Baux C Phelipot-Mardeleacute A Lanos C et al (2013) PERFORMANCES OF SUPER 743 SULFATED CEMENTS In International Conference on Concrete Under Severe 744 Conditions pp 1857ndash1870 745
15 Annabelle Phelipot-Mardeleacute Gabriel Samson Christophe Lanos (2015) Super sulfated 746 cement formulation and uses In Construction Materials ConMat Whistler Canada 747
16 Milestone NB (2006) Reactions in cement encapsulated nuclear wastes need for 748 toolbox of different cement types Advances in Applied Ceramics 10513ndash20 749
httpsdoiorg101179174367606X81678 750
17 Batchelor B (2006) Overview of waste stabilization with cement Waste Management 751
26689ndash698 httpsdoiorg101016JWASMAN200601020 752
18 Zhang T Cheeseman CR Vandeperre LJ (2011) Development of low pH cement 753
systems forming magnesium silicate hydrate (MSH) Cement and Concrete Research 754 41439ndash442 httpsdoiorg101016jcemconres201101016 755
19 Mobasher N Bernal SA Provis JL (2016) Structural evolution of an alkali sulfate 756
activated slag cement Journal of Nuclear Materials 46897ndash104 757 httpsdoiorg101016JJNUCMAT201511016 758
20 Wang J Yu B Gao Y (2014) Hydration Characteristics of Super Sulphated Cement 759 with Different Fineness In Proceedings of the International Conference on Material 760 and Environmental Engineering (ICMAEE 2014) Atlantis Press Paris France 761
21 Naumlgele E (1986) The Zeta-potential of cement Part II Effect of pH-value Cement and 762 Concrete Research 16853ndash863 httpsdoiorg1010160008-8846(86)90008-6 763
22 Jain N Civil MG-IJ of M and 2015 U (2015) Formulation of Sulphate Resistant Super 764 Sulphated Cement Using Fluorogypsum and Granulated Blast Furnace Slag IOSR 765
Journal of Mechanical and Civil Engineering (IOSR-JMCE) 12153ndash159 766
23 Gao YX Yu BY Xu FL (2012) Effect of Modified Phosphogypsum on the Mechanical 767 Properties of Super Sulphate Cement Applied Mechanics and Materials 161264ndash268 768 httpsdoiorg104028wwwscientificnetAMM161264 769
24 Kantro D (1980) Influence of Water-Reducing Admixtures on Properties of Cement 770 PasteampmdashA Miniature Slump Test Cement Concrete and Aggregates 295ndash102 771
httpsdoiorg101520CCA10190J 772
34
25 Svermova L Sonebi M Bartos PJM (2003) Influence of mix proportions on rheology of 773 cement grouts containing limestone powder Cement and Concrete Composites 25737ndash774 749 httpsdoiorg101016S0958-9465(02)00115-4 775
26 Sonebi M (2006) Rheological properties of grouts with viscosity modifying agents as 776 diutan gum and welan gum incorporating pulverised fly ash Cement and Concrete 777
Research 361609ndash1618 httpsdoiorg101016JCEMCONRES200605016 778
27 Nehdi M Rahman M (2004) Effect of Geometry and Surface Friction of Test Accessory 779 on Oscillatory Rheological Properties of Cement Pastes ACI Materials Journal 780 101416ndash424 httpsdoiorg101435913428 781
28 Khayat KH Yahia A (1997) Effect of Welan Gum-High-Range Water Reducer 782 Combinations on Rheology of Cement Grout ACI Materials Journal 94365ndash372 783 httpsdoiorg1014359321 784
29 Lombardi G (1985) THE ROLE OF COHESION IN CEMENT GROUTING OF 785 ROCK In Proceedings of Fifteenth Congress on Large Dams International 786 Commission on Large Dams pp 235ndash261 787
30 Perrot A Rangeard D Picandet V Meacutelinge Y (2013) Hydro-mechanical properties of 788
fresh cement pastes containing polycarboxylate superplasticizer Cement and Concrete 789 Research 53221ndash228 httpsdoiorg101016JCEMCONRES201306015 790
31 Perrot A Lecompte T Khelifi H et al (2012) Yield stress and bleeding of fresh cement 791 pastes Cement and Concrete Research 42937ndash944 792
httpdxdoiorg101016jcemconres201203015 793
32 Sonebi M Perrot A (2019) Effect of mix proportions on rheology and permeability of 794 cement grouts containing viscosity modifying admixture Construction and Building 795
Materials 212687ndash697 httpsdoiorg101016jconbuildmat201904022 796
33 Picandet V Rangeard D Perrot A Lecompte T (2011) Permeability measurement of 797
fresh cement paste Cement and Concrete Research 41330ndash338 798 httpsdoiorg101016JCEMCONRES201011019 799
34 Perrot A Rangeard D (2017) Effects of mix design parameters on consolidation 800
behaviour of fresh cement-based materials Materials and Structures 50117 801 httpsdoiorg101617s11527-016-0988-0 802
35 Rangeard D Perrot A Picandet V et al (2015) Determination of the consolidation 803 coefficient of low compressibility materials application to fresh cement-based 804
materials Materials and Structures 481475ndash1483 httpsdoiorg101617s11527-014-805 0247-1 806
36 Massoussi N Keita E Roussel N (2017) The heterogeneous nature of bleeding in 807 cement pastes Cement and Concrete Research 95108ndash116 808 httpsdoiorg101016JCEMCONRES201702012 809
37 Montgomery D (2007) Design and Analysis of Experiments Second Edition John 810
Wiley amp Sons 811
35
38 Roussel N Stefani C Leroy R (2005) From mini-cone test to Abrams cone test 812 Measurement of cement-based materials yield stress using slump tests Cement and 813 Concrete Research 35817ndash822 httpsdoiorg101016jcemconres200407032 814
39 Mangat PS Khatib JM Wright L (2006) Optimum utilisation of FGD waste in blended 815 binders Proceedings of Institution of Civil Engineers Construction Materials 159119ndash816
127 httpsdoiorg101680coma20061593119 817
40 Khatib JM Mangat PS Wright L (2013) Early age porosity and pore size distribution of 818 cement paste with flue gas desulphurisation (FGD) waste Journal of Civil Engineering 819 and Management 19622ndash627 httpsdoiorg103846139237302013793609 820
41 Collier NC Milestone NB Gordon LE Ko SC (2014) The suitability of a supersulfated 821 cement for nuclear waste immobilisation Journal of Nuclear Materials 452457ndash464 822 httpsdoiorg101016jjnucmat201405078 823
42 Masoudi R (2018) Examining compositions hydration mechanisms and properties of 824 supersulfated cement for use in concrete by Examining compositions hydration 825 mechanisms and properties of supersulfated cement for use in concrete University of 826 Toronto 827
828
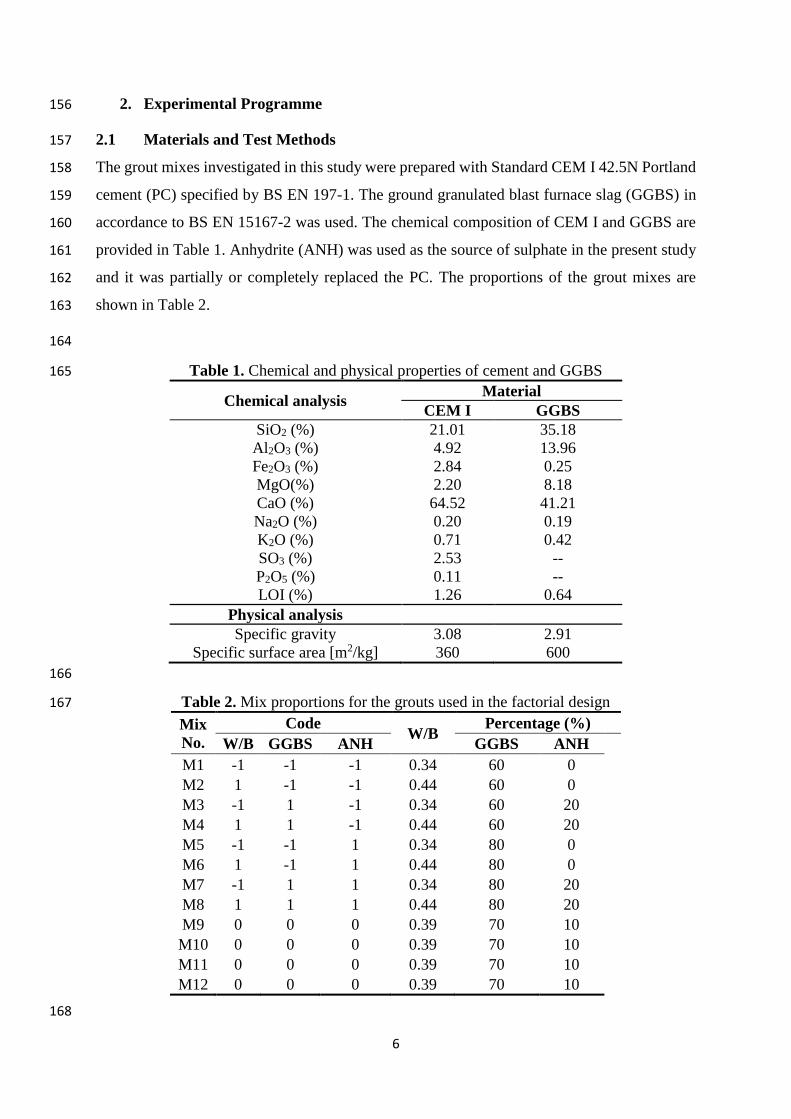
6
2 Experimental Programme 156
21 Materials and Test Methods 157
The grout mixes investigated in this study were prepared with Standard CEM I 425N Portland 158
cement (PC) specified by BS EN 197-1 The ground granulated blast furnace slag (GGBS) in 159
accordance to BS EN 15167-2 was used The chemical composition of CEM I and GGBS are 160
provided in Table 1 Anhydrite (ANH) was used as the source of sulphate in the present study 161
and it was partially or completely replaced the PC The proportions of the grout mixes are 162
shown in Table 2 163
164
Table 1 Chemical and physical properties of cement and GGBS 165
Chemical analysis Material
CEM I GGBS
SiO2 () 2101 3518
Al2O3 () 492 1396
Fe2O3 () 284 025
MgO() 220 818
CaO () 6452 4121
Na2O () 020 019
K2O () 071 042
SO3 () 253 --
P2O5 () 011 --
LOI () 126 064
Physical analysis
Specific gravity 308 291
Specific surface area [m2kg] 360 600
166
Table 2 Mix proportions for the grouts used in the factorial design 167
Mix
No
Code WB
Percentage ()
WB GGBS ANH GGBS ANH
M1 -1 -1 -1 034 60 0
M2 1 -1 -1 044 60 0
M3 -1 1 -1 034 60 20
M4 1 1 -1 044 60 20
M5 -1 -1 1 034 80 0
M6 1 -1 1 044 80 0
M7 -1 1 1 034 80 20
M8 1 1 1 044 80 20
M9 0 0 0 039 70 10
M10 0 0 0 039 70 10
M11 0 0 0 039 70 10
M12 0 0 0 039 70 10
168
7
All grout mixes were prepared in 2 L batches using a high-shear mixer with a 45 L capacity 169
The mixing water was kept at 98 plusmn 02 ordmC to compensate for heat generated during mixing 170
The cement and GGBS were mixed with ANH in a sequence that started with adding all of the 171
water into the mixer After one minute the binder was gradually introduced The grout was 172
mixed for one minute followed by 30 seconds of rest Subsequently the grout was mixed again 173
for 2 min at a high speed (285 rpm) and for 1 min at the low speed (140 rpm) 174
For all tests the timing is given from zero time ie the time when the cement particles first 175
touch the mixing water The mini-slump flow test started at 7 min (immediately after the end 176
of mixing) The transparent cone-shaped mould described elsewhere [24] was placed in the 177
centre of a smooth Plexiglas plate After filling with grout the cone was gently lifted 178
(approximately 30 s after placement of the grout) When the flow stopped the spread of the 179
grout was measured with a ruler in two perpendicular directions 180
Marsh cone test was carried out using a metal cone with an orifice diameter of 10 mm and 181
started at 8 plusmn 1 min One litre of grout was poured into the cone The conersquos orifice was opened 182
15 s after pouring the cement grout into the cone The time taken for each 100 ml of grout to 183
flow through the orifice was recorded and the measurements were completed upon collecting 184
700 ml of grout 185
The viscosity of cement grout was determined using a coaxial rotating cylinder viscometer 186
Fann (smooth cylinders no serration) that determined apparent viscosity at different shear 187
rates The test was contained in the annular space between an outer cylinder (rotor) with a 188
radius of 18415 mm and a bob with a radius of 17245 mm and a height of 380 cm The rotor 189
and bob were plunged into a cup containing 350 ml of sample grout Viscosity measurements 190
were made when the outer cylinder rotating at a known speed caused a viscous drag to be 191
exerted by the fluid This drag created a torque on the bob which was transmitted to a precision 192
spring where its deflection was measured and compared with test conditions and the 193
instrumentrsquos constants The measurement was made for 12 rotor speeds from 09 rpm to 600 194
rpm where the viscometer reading values () were recorded The value of shear stress (Pa) 195
was calculated by including k1 torsion constant of spring per unit deflection (N-cmdegree) 196
k2 shear stress constant for the effective bob surface (cm-3) and k3 shear rate constant [s-1rpm] 197
[25 26] 198
Rotor speed was increased step by step and the viscometer readings were recorded with 199
increasing rotation speeds The reading was taken when the needle in the viscometer was 200
8
stabilised or 30 seconds after the change of speed in cases when the needle had not stabilised 201
due to the thixotropy of the cement grout The time of reading was generally between 5 and 202
10 seconds 203
In this study the down-curve was chosen for final evaluation because it offered a better 204
description of the rheological behaviour of the grouts including a structural breakdown 205
phenomenon of inner forces among particles [27] The values of shear yield stress (the 206
minimum shearing stress required for the fluid to start flowing) and plastic viscosity used the 207
modified Bingham model [28] and are expressed as follows 208
2
0 cp (1) 209
Where τ0 is yield stress (Pa) μp is plastic viscosity (Pas) is shear rate (s-1) and c is a 210
constant 211
The cohesion of grout was determined at 30 plusmn 1 min with a Lombardi plate cohesion meter 212
[29] A thin galvanized steel plate (100times100times1 mm) was immersed in the grout and hung on a 213
stand placed on an electronic balance The weight of the grout still present on the plate was 214
recorded when the dripping of the grout had stopped This test was followed by the fresh 215
density measurement of the grout with a mud balancer Knowing the fresh density of the grout 216
it was possible to calculate the thickness on each side of the plate 217
The resistance of the fresh grout to induced bleeding was evaluated using a pressure filter The 218
equipment consists of a pressure vessel filter paper which is placed on a sieve and a graduated 219
cylinder A 200 ml grout sample is placed in the pressure vessel After closing the cell the 220
graduated cylinder is placed under the outlet of the cell The cell is pressured by compressed 221
air to 055 MPa The volume of water going out through the outlet on the bottom of the cell is 222
recorded at 15 and 30 s then at every minute up to 10 min and then at every 5 min up to 30 min 223
[25] 224
Considering homogeneous bleeding the results of the induced bleeding tests allow to derive 225
the evolution of the permeability of the sample during its compaction under the applied 226
pressure The permeability of the material is directly linked to the bleeding rate during the 227
material consolidation until the tested material is able to sustain the applied pressure [30 31] 228
It refers to the material ability to slow down the water filtration process 229
The measurement of the flow water allows to compute instantaneous WB ratio and makes it 230
possible to link it with the computed instantaneous permeability at a given time of the test [32ndash231
9
34] I The water flow is computed by dividing the variation of the measured water mass flowing 232
out the samples by the elapsed time between two successive data sampling In this study value 233
of permeability at 1 and 30 minutes are taken and compared It corresponds to the initial and 234
final permeability of the mixes 235
The material compressibility is considered in a soils mechanics way [30 35] It corresponds to 236
the ratio of the variation of void ratio (liquidsolid volume ratio) to the variation of logarithm 237
of applied pressure between the initial and the final state of the induced bleeding test It 238
provides the equilibrium state of the sample under a given applied pressure and is valid for 239
both homogeneous and heterogeneous bleeding [36] 240
It is worth noting that the computed permeability describes homogeneous bleeding kinetics 241
while compressibility describes the amplitude of the bleeding phenomenon 242
Heat of hydration was evaluated by isothermal calorimetry with an eight-channel heat 243
conduction calorimeter maintained at 22degC This equipment measures heat evolved by 244
comparing the temperatures of a grout sample and an inert reference which are both held under 245
isothermal conditions The heat flow results are recorded as a function of time CEM I GGBS 246
and ANH were blended manually for 30 s After the addition of water the grout was blended 247
10 s by hand and then an additional 50 s mechanically Polyethylene ampoules were filled with 248
approximately 6 g of each grout and the experiments were conducted for at least 72 h 249
The compressive strength of the grout was determined by crushing three cubes of 50 mm size 250
After casting the samples were covered with a polymer sheet (a cling film) to limit evaporation 251
of water and stored in a conditioning room at 20 plusmn 2 degC for 24 plusmn 05 hours Afterwards cubes 252
were demoulded and placed in water at 20 plusmn 1 degC until tested at 1 3 7 and 28days 253
In order to perform the pH test a powder sample of the hardened mixes was required The test 254
was performed on 1 7 and 28 day samples As mixes 9-12 are of identical composition the 255
reason is explained later in 41 derived statistical model tests were only performed on sample 256
10 To get the powder with a fineness of 65μm the samples were firstly drained of the acetone 257
To remove any remaining acetone they were placed in a vacuum desiccator The pieces were 258
then ground using a mortar and pestle passed through a 65 μm sieve placed in sample bags 259
and returned to the desiccator The samples had then to be mixed with distilled water to enable 260
the pH test to be performed A 110 ratio of cement to water was used and mixed for 24 hours 261
using a rotating machine To get the pH reading the samples were put into a centrifuge machine 262
to separate the solid and liquid At this stage the solution should have a pH equivalent to cement 263
10
it was mixed with To get a pH reading for the samples a pH device was used where a probe 264
is placed in the solution The machine was calibrated with three buffer solutions of 7 10 and 265
13 pH levels before measuring the pH of the samples 266
SEM (scanning electron microscopy) was carried out using a JEOL JSM6400 on flat fractured 267
surface specimens obtained from compression testing at 7-day samples Prior to SEM testing 268
the samples were mounted onto metal stubs using carbon paste and coated with gold film to 269
ensure good conductivity The accelerated voltage was set at 20 kV 270
22 Statistical Design and Modelling of Experiments 271
The technique of analysis used in this study was a 2k factorial experimental design [37] to 272
evaluate the influence of two different levels (maximum and minimum) for each variable on 273
the relevant grout properties Three key parameters (WB ANH GGBS) that should have 274
significant influence on mix characteristics of supersulfated cements were selected to formulate 275
the mathematical models for evaluating relevant properties (ie k = 3 in this study thus the 276
total mixes for the factorial design was 23 = 8) Additionally a mix at the central point was 277
replicated four times to estimate the experimental error and improve the reliability of the 278
models The coding and levels of the variables (WB and dosages of GGBS and ANH) are 279
given Table 2 280
The statistical models are valid for supersulfated grout (SSC) mixes made with WB GGBS 281
and ANH in the ranges of 034 to 044 60 to 80 and 0 to 20 respectively The modelled 282
experimental region consisted of mixtures ranging from coded variables of ndash1 to +1 The coded 283
factors for variables were calculated by 284
Coded Factor = (Actual value-Factor means)[Range of factor value2] (2) 285
Hence 286
Coded WB = (Actual WB ndash 039)005 287
Coded GGBS = (Actual GGBS ndash 07)01 288
Coded Anhydrite = (Actual ANH ndash 01)01 289
The responses modelled were mini-slump plate cohesion Marsh cone yield stress plastic 290
viscosity induced bleeding at 1 min 5 and 30 mins permeability at 1 min and 30 mins 291
compressibility and compressive strength at 1 3 7 and 28 days The general model associated 292
11
with the two-level factorial design incorporating three independent variables (WB GGBS 293
ANH) is expressed by 294
Y1 = a0 + a1WB + a2GGBS + a3ANH+ a4WBGGBS + a5WBANH + a6GGBSANH 295
+ a7WBGGBSANH + ε (3) 296
where 297
Y1 Response (mini slump marsh cone plate cohesion etc) 298
a0 Overall mean factor effect 299
a1-a7 Regression coefficients representing model constants (contribution of independent 300
variables and their interaction to each response) 301
a1WB a2GGBS a3ANH Linear effect of factors WB GGBS and ANH 302
a4WBGGBS a5WBANH a6GGBSANH a7WBGGBSANH Interaction effects of 303
factors WB GGBS and ANH 304
ε Random error term representing the effects of uncontrolled variables 305
Analysis of variance (ANOVA) was used to test the significance of regression models and t-306
tests were performed to identify the non-significant (NS) variables and second order 307
interactions which were subsequently eliminated from the derived models Model coefficients 308
were determined using multi-linear regression analysis based on a normal distribution 309
assumption The error was assumed to be random and normally distributed so the residual 310
terms which represent the difference between the actual and predicted values should exhibit 311
similar properties [37] The probability value (Prob) obtained from ANOVA determines the 312
statistical significance of each factor and their interactions For most of the parameters the 313
probability that the derived coefficients associated with the various variables influencing each 314
response were limited to 10 This signifies that there is less than 10 chance or 90 315
confidence limit that the contribution of a given parameter to the tested response exceeds the 316
value of the specified coefficient A negative estimate indicates that an increase of the given 317
parameter results in a reduction of the measured response 318
12
3 Results and discussion 319
The results of the experimental work characterize the behaviour of the mortars with different 320
WB ANH and GGBS levels Table 3 summarises all results of the experimental work 321
performed The results were used to construct the regression models 322
Table 3 Average results from experimental work 323 324
Viscometer Induced bleeding
Mix Mini-
slump
Flow
time
Cohesion
meter
Yield
value
Plastic
viscosity
1min 5min 30min
(mm) (s) (mm) (Pa) (Pas) (mL) (mL) (mL)
1 61 230 105 191 0923 220 470 480
2 89 25 55 97 0323 290 780 810
3 67 200 118 172 0802 280 580 605
4 111 12 20 80 0199 490 860 860
5 52 360 143 251 1203 280 520 540
6 83 69 86 99 0403 360 700 700
7 60 250 125 211 0980 310 580 590
8 110 13 40 77 0224 350 910 950
9 71 150 87 101 0617 370 720 730
10 73 102 122 106 0681 290 620 620
11
12
77
74
192
83
89
110
124
101
0660
0641
290
350
640
715
645
720
325
Table 3 Average results from experimental work (continued) 326
Mix Permeability Permeability Compre-
ssibility
Compressive strength
1 min 30 min fc 1d fc 3d fc 7d fc 28d
(ms) (ms) (MPa) (MPa) (MPa) (MPa)
1 216E-09 317E-09 0155 299 506 581 704
2 512E-08 418E-09 0298 168 383 547 558
3 448E-08 366E-09 0194 213 334 406 527
4 374E-08 425E-09 0312 140 223 256 408
5 448E-08 342E-09 0173 233 434 507 535
6 512E-08 395E-09 0255 136 371 371 448
7 440E-08 361E-09 0187 108 232 343 532
8 451E-08 433E-09 0342 68 200 263 473
9 446E-08 402E-09 0250 196 328 398 592
10 468E-08 371E-09 0212 171 232 361 556
11
12
423E-08
516E-08
379E-09
400E-09
0221
0246
207
183
313
301
451
435
565
520
327
The derived quadratic statistical models of grout for mini-slump flow time cohesion plate 328
yield stress plastic viscosity induced bleeding at 1 min 5 min and 30 min permeability at 1 329
13
min and 30 min compressibility and compressive strength at 1 3 7 and 28 days are given in 330
Equations (4) to (18) where WB GGBS and ANH are given in codes values 331
Mini-Slump (mm) = 7881 + 1919 WB + 781 ANH + 444 WBANH - 294 GGBS (4) 332
333
Marsh flow time (s) = 1404 - 1153 WB ndash 261 ANH + 281 GGBS (5) 334
335
Plate Cohesion meter (microm) = 86 - 366 WB + 122 GGBS - 107 ANH - 091 WBANH (6) 336
337
Yield Value (Pa) = 1466 ndash 584 WB - 126 WBGGBS - 125 ANH + 124 GGBS (7) 338
339
Plastic Viscosity (Pas) = 063 - 034 WB - 0078 ANH + 0073 GGBS 340
- 0047 WBGGBS - 0022 ANHGGBS (8) 341
342
Induced Bleeding at 1 min (ml) = 3225 + 50 WB + 35 ANH ndash 225 WBANHGGBS (9) 343
344
Induced Bleeding at 5 mins (ml) = 675 + 1375 WB + 575 ANH (10) 345
346
Induced Bleeding at 30 mins (ml) = 6919 + 1381 WB + 594 ANH (11) 347
348
Permeability at 1 min (ms) x 10-8 = 4 + 0615 WB + 0621 AHN ndash 0773 WBGGBS 349
- 0426WBAHN - 0446 AHNGGBS (12) 350
351
Permeability at 30 min (ms) x 10-8 = 0382 + 0035 WB + 0014 ANH 352
+ 0008 WBANHGGBS (13) 353
354
Compressibility = 02396 + 00623 WB + 00194 ANH + 00012 WBANHGGBS (14) 355
356
ƒc 1 d (MPa) = 1705 - 426 WB - 384 ANH - 343 GGBS + 145 WBANH (15) 357
358
ƒc 3 d (MPa) = 3215 - 879 ANH - 412 WB ndash 261 GGBS (16) 359
360
ƒc 7 d (MPa) = 4092ndash 924 ANH - 5 WB - 383 GGBS (17) 361
362
14
ƒc 28 d (MPa) = 5348 - 515 WB - 382 ANH ndash 262 GGBS + 436 ANHGGBS (18) 363
364
The correlation coefficient of most of the proposed models were higher than 090 except for 365
plastic viscosity compressive strength after 3days and compressive strength after 28days 366
which have coefficients of 070 086 and 087 respectively 367
Table 4 shows the average measured responses of the four replicate grouts the coefficients of 368
variation (COV) as well as the estimated errors with a 90 confidence limit for each of the 369
measured properties The estimated error levels for mini-slump plate cohesion meter Marsh 370
cone yield stress plastic viscosity induced bleeding at 1 min 5 min and 30 mins permeability 371
at 1 min and 30 min compressibility and compressive strengths at 1 3 7 28 days were plusmn 22 372
mm plusmn 0001mm plusmn 40 s plusmn 09 Pa plusmn 002 Pa s plusmn 28 ml plusmn 42 ml plusmn 45 ml plusmn 32x10-9 (ms) 373
plusmn 13x10-10 (ms) plusmn 00153 plusmn 13 MPa plusmn 35 MPa plusmn 33 MPa and plusmn 25 MPa respectively 374
The relative experimental errors for mini-slump plate cohesion meter Marsh cone yiled stress 375
plastic viscosity induced bleeding permeability compressibility compressive strengths were 376
limited to 3-11 On the other hand relative error for march cone was up to 30 377
Table 4 Repeatability of test parameters at the central point 378
379
Tests Mini-
slump
Plate
cohesion
Marsh
cone
Yield
stress
Plastic
viscosit
y
Induced
bleeding
at 1 min
Induced
bleedin
g at 5
min
Induced
bleeding
at 30
min
Mean (n=4) 736
mm
001
mm
1318
s
108
Pa
065
Pa s
325
ml
674
ml
679
ml
Coefficient
of variation
()
37 115 372 105 42 127 76 80
Estimate
error (90
confidence
limit)
22
mm
0001
mm
402
s
09
Pa
002
Pa s
28
ml
42
ml
45
ml
380
381 Table 4 Repeatability of test parameters at the central point (continued) 382
383
Tests
Permeability
1 min
x10-8
Permeability
30 min
x10-8
Compressibility frsquoc 1d frsquoc 3d frsquoc 7d frsquoc 28d
Mean (n=4) 463
ms
0388
ms 02323
189
MPa
293
MPa
411
MPa
558
MPa
Coefficient
of variation
()
85 39 8 84 144 98 53
15
Estimate
error (90
confidence
limit)
032
(ms)
0013
(ms)
00153
13
MPa
35
MPa
33
MPa
24
MPa
384
385
31 Accuracy of the established models 386
387
The ratio of predicted-to-measured properties for grout ranged between 087 and 115 388
indicating good accuracy for prediction of mini-slump plate cohesion induced bleeding at 1 389
min 5 mins and 30 mins yield stress plastic viscosity and compressive strength at 1-d 3-d 7-390
d and 28-d In general the proposed models for mini-slump plate cohesion Marsh cone and 391
compressive strength appeared to be accurate in predicting fluidity cohesivity induced 392
bleeding permeability at 30 min compressibility and compressive strength with low scatter 393
between measured and predicted values However the average values of predictedmeasured 394
ratio of yield values were slightly higher (074) 395
396
32 Isoresponses of the proposed models 397
398
The isoresponse surfaces and contour plots for mini-slump plate cohesion Marsh cone yield 399
stress plastic viscosity induced bleeding at 1 min 5 mins and 30 mins permeability at 1 min 400
and 30 mins compressibility and compressive strength at 1-d 3-d 7-d and 28-d were obtained 401
by using response surface methodology (RSM) The isoresponse surfaces and contour plots 402
were obtained from the regression models and because the models contained interaction and 403
second-order variables the contour lines were curved 404
The proposed statistical models can therefore be used to evaluate the effect of a group of 405
variables on the properties affecting the quality of supersulfated grout This allowed for the 406
calculation of isoresponse surfaces from the parameters under study outside the experimental 407
domain and the optimisation of their effects The next sections will discuss the results of each 408
experiment separately 409
331 Mini-slump 410
As shown in Eq 4 the mini-slump is influenced in order of significance by WB ratio 411
anhydrite proportion interaction of WB and ANH and the percentage of GGBS content The 412
WB ratio had the greatest effect on fluidity due to better lubrication of the particles in the paste 413
16
[29] The mini-slump test was accompanied by very low shear The value of mini-slump is to 414
characterise yield stress [38] therefore higher mini-slump value indicated a lower yield stress 415
The effect of WB on the increase of mini-slump was two and half-time than that of ANH (192 416
vs 781 in Eq 4) However increased ANH resulted in a 27 times greater increase in mini-417
slump than reduced GGBS (781 vs -294 in Eq 4) Figure 1(a) shows the effect of increased 418
WB on mini-slump vs ANH (when GGBS was kept constant at 70) and Figure 1(b) shows 419
GGBS vs ANH (when WB was fixed at 039) Based on these figures it is evident that mini-420
slump increased significantly when the dosage of WB and ANH increased 421
422
(a) (b) 423
Fig 1 Isoresponse curves of mini-slump (mm) (a) WB vs ANH and (b) GGBS vs ANH 424
425
332 Marsh cone 426
The time needed for a grout sample to flow through the Marsh cone is proportional to the 427
viscosity of the cement grout the flow time becomes an index of fluidity so the longer the 428
flow time the lower the fluidity Similar to the previous trends Eq 5 shows that the values of 429
Marsh cone are influenced in order of significance by WB GGBS and ANH This is 430
graphically illustrated in Figure 2 431
GGBS = 70
034 039 042 044
0
5
10
15
20
WB
AN
H (
)
65
74
83
92
101
037
AN
H(
)
WB = 039
60 65 70 75 80
0
5
10
15
20
GGBS()
70
75
80
85
17
432
(a) (b) 433
Fig 2 Isoresponse curves for flow time (s) (a) WB vs ANH and (b) GGBS vs ANH 434
435
It can be noted that an increase in WB and ANH or a reduction in GGBS led to decreasing 436
the Marsh cone flow time For example at fixed WB at 039 and GGBS of 70 respectively 437
the increase in ANH dosage from 5 to 20 led to a marked reduction of the Marsh cone flow 438
time from 170 to 140 s (Figure 2(a)) This behaviour is attributed to the change in plastic 439
viscosity of the grout as will be discussed later 440
333 Cohesion plate 441
As shown in Eq 6 the cohesion plate was influenced in order of magnitude by the WB and 442
the percentage of GGBS and ANH The increasing WB had a 34 times the influence on the 443
reduction of the cohesion plate test results as the increased ANH (for a GGBS constant) By 444
comparing the effects of WB and GGBS on plate cohesion the increased WB can be 445
interpreted as having approximately a 3 times greater influence on the reduction of plate 446
cohesion values than the increase in GGBS (-366 vs 122 in Eq 6) given that ANH is held 447
constant The effect of an increase in WB from 034 to 044 and ANH from 0 to 20 with a 448
fixed GGBS dosage of 70 is presented in Figure 3(a) Increased WB led to a decreased 449
cohesion plate value Conversely an increase in GGBS increased the cohesion plate value and 450
an increased ANH caused a reduction in cohesion plate (Figure 3(b)) 451
GGBS = 70
034 036 039 042 0440
5
10
15
20
WB
AN
H (
)
40
6080
100120
140160
180200
220
WB = 039
60 65 70 75 80
0
5
10
15
20
GGBS ()
AN
H (
)
100
120
140
160
180
18
452
(a) (b) 453
Fig 3 Isoresponse curves for plate cohesion meter (a) WB vs ANH and (b) GGBS vs 454 ANH 455
334 Yield stress 456
As shown in Eq 7 yield value was influenced in order of magnitude by WB and dosages of 457
ANH and GGBS Based on Figure 4 (a) when WB was fixed at 039 GGBS maintained at 458
70 and ANH increased to 5 the isoresponse curve showed a yield value of 15 Pa On the 459
other hand if the proportion of ANH was further increased to 20 while GBBS was 460
maintained at 70 the yield value decreased to 135 Pa This corresponds with Eq (7) in 461
which the proportion of WB and ANH were increased while GGBS was kept constant 462
resulting in a reduction in yield stress An increase in GGBS content resulted in an increase of 463
the yield stress 464
Figure 4 (b) shows the isoresponse curve of the yield value with a fixed proportion of GGBS 465
at 70 When WB was 039 and ANH was 5 the isoresponse of the predicted yield value 466
was 155 Pa If ANH was increased to 20 while maintaining WB at 039 the isoresponse of 467
the yield value was 135 Pa 468
It can be interesting to note that the observed results for the yield stress are closed to the one 469
observed with the cohesion plate and mini-slump tests This is expected as yield stress values 470
can be derived from those two simple tests 471
GGBS = 70
034 037 039 042 0440
5
10
15
20
WB
AN
H(
)
45
55
65
7585
95
105
115
WB = 039
60 65 70 75 800
5
10
15
20
GGBS ()
AN
H(
)
75
85
95
105
19
472
(a) (b) 473
Fig 4 Isoresponse curves for yield stress (Pa) (a) WB vs ANH and (b) GGBS vs ANH 474
335 Plastic viscosity 475
Plastic viscosity was influenced in order of magnitude by WB and the dosages of ANH and 476
GGBS ANH and GGBS had almost opposite effects on plastic viscosity (-0078 vs 0073 in 477
Eq 8) As shown in Eq (8) increased WB had the greatest primary effect on plastic viscosity 478
(034 vs 0078 and 0073) The increased WB had approximately a 44 times greater influence 479
on reducing plastic viscosity than increased ANH or decreased GGBS 480
In the isoresponse curve of plastic viscosity shown in Figure 5 (a) when GGBS was fixed at 481
70 WB set at 039 and ANH maintained at 5 the predicted plastic viscosity value was 482
068 Pas On the other hand if the dosage of ANHB was increased to 20 while maintaining 483
a similar WB the plastic viscosity was reduced to 055 Pas 484
In Figure 5 (b) WB was fixed at 039 when GGBS was held at 70 and ANH at 5 the 485
predicted plastic viscosity was 067 Pas However when ANH was increased to 20 and 486
GGBS was maintained at 70 the predicted plastic viscosity dropped to 055 Pas 487
AN
H(
)
GGBS = 70
034 037 039 042 044
0
5
10
15
20
WB
1012
1416
18
20
WB = 039
60 65 70 75 800
5
10
15
20
GGBS ()
AN
H(
)
13
14
15
20
488
(a) (b) 489
Fig 5 Isoresponse curve for plastic viscosity (Pas) (a) WB vs ANH and (b) GGBS vs 490
ANH 491
336 Induced bleeding 492
The induced bleeding equations for 1 and 5 minutes (Eqs 9 10) and 30 minutes (Eq 11) are 493
very similar The two influencing factors of induced bleeding are WB ratio and anhydrite 494
WB ratio has the greatest effect over two times the effect of anhydrite content Figure 6 shows 495
the isoresponse for bleeding versus the WB ratio for a fixed value of GGBS at 70 It can be 496
seen that when an anhydrite value is selected and the WB ratio is increased the bleeding will 497
also increase Similarly if a WB ratio is selected and the anhydrite content is increased the 498
bleeding will again increase 499
500
GGBS = 70
034 037 039 042 0440
5
10
15
20
WB
AN
H(
)
035
045
055
065
075
085
095
WB = 039
60 65 70 75 800
5
10
15
20
GGBS ()
AN
H(
)
055
060
065
075
034 036 039 042 044
0
5
10
15
20
WB
AN
H (
)
26
28
30
3234
36
38
40
GGBS=70
21
(a) 501
502
(b) (c) 503
Fig 6 Isoresponse curves for induced bleeding at 1 5 and 30 min WB vs ANH 504
337 Permeability 505
Figure 7 (a) and (b) showed firstly that the permeability decreased significantly from 1 min to 506
30 min Permeability at 1 min was influenced in order of magnitude by WB and the dosage 507
of ANH All interactions between 3 parameters had almost opposite effects on permeability 508
(Eq 12) As shown in Eq (12) increased WB and AHN had the greatest primary effect on 509
permeability at 1 min It seems there is an optimum reached at WB = 40 and AHN at 17 510
Similarly the permeability at 30 min is affected in order of significance by WB followed by 511
ANH (Eq 13) In Figure 7 (b) WB was fixed at 039 when GGBS was held at 70 and ANH 512
at 10 the predicted permeability was 038 x 10-8 (ms) However when ANH was increased 513
to 20 and GGBS was maintained at 70 the predicted permeability increased to 040x10-8 514
(ms) 515
516
GGBS = 70
034 036 039 042 0440
5
10
15
20
WB
AN
H (
)
545
61
675
74
805
GGBS = 70
034 036 039 042 0440
5
10
15
20
WB
AN
H (
)
56
60
64
68
72
7680
84
22
517
(a) (b) 518
Fig 7 Isoresponse curves for permeability at 1 and 30 min WB vs ANH 519
338 Compressibility 520
As shown in Eq (14) the compressibility was influenced in order of magnitude by the WB 521
and the percentage of ANH The interaction between 3 parameters affected also the 522
compressibility The increasing WB had a 32 times the influence on the increase of the 523
compressibility results as the increased ANH (for a GGBS constant) The effect of an increase 524
in WB from 034 to 044 and ANH from 0 to 20 with a fixed GGBS dosage of 70 is 525
presented in Figure 8 Increased WB led to an increase of compressibility Similarly an 526
increase in AHN increased the compressibility 527
528
Fig 8 Isoresponse curves for compressibility WB vs ANH 529
034 036 039 042 044
0
5
10
15
20
GGBS = 70 WB
AN
H (
)
3
35
4
4
45
5
034 036 039 042 044
0
5
10
15
20
WB
AN
H (
)
034
035
036 037 038 039 04
041
042
4
GGBS=70
034 036 039 042 044
0
5
10
15
20
WB
AN
H (
)
017
019
021 023 025 027
029
031
GGBS=70
23
530
339 Compressive strength 531
After one day from Eq 15 the influencing factors in order of significance are WB ratio 532
anhydrite content GGBS content and the interaction of WB and ANH The effect of the first 533
three was similar but WB had 11 times greater effect than anhydrite and 125 times greater 534
effect than GGBS While the interaction of WB and anhydrite had around a third of the 535
influence of WB Figures 9 (a) and (b) show the isoresponses for 1-day compressive strength 536
From Figure 9 (a) it can be seen when the GGBS content is fixed at 70 for a given anhydrite 537
content increasing the WB ratio will decrease the strength Also if a WB ratio is selected and 538
the anhydrite is increased similarly the strength will decrease From Figure 9 (b) with the WB 539
ratio fixed at 039 once again an increase in GGBS led to a reduction of compressive strength 540
at 1 day 541
542
(a) (b) 543
Fig9 Isoresponse curves for compressive strength at 1d (a) (WB vs ANH) and (b) (GGBS 544 vs ANH) 545
Eqs 16 17 and 18 show the effect of GGBS and ANH percentages on compressive strength at 546
3-d 7-d and 28-d Figures 10 11 and 12 show the isoresponse of the compressive strength at 547
3-d 7-d and 28-d respectively with WB vs ANH Increased ANH led to a decrease of 3-d 548
and 7-d compressive strength As expected an Increase in WB led to a decrease in compressive 549
strength The percentage of ANH had a negative effect on compressive strength and showed a 550
greater influence particularly at 3-d and 7-d (879 (3 d) amp 924 (7d) vs 382 (28 d)) GGBS has 551
a negative impact on early strength development The negative effect of GGBS on compressive 552
GGBS = 70
034 037 039 042 0440
5
10
15
20
WB
AN
H(
)
12
14
16
18
20
22
2426
WB = 039
60 65 70 75 800
5
10
15
20
GGBS ()
AN
H(
)
10
12
14
16
18
20
22
24
strength at early ages is clearly attributable to the fact that up to 80 of cement has been 553
replaced by GGBS and it takes some time for GGBS to start developing its pozzolanic action 554
at a noticeable level The results indicate that ANH content influences strength to a greater 555
extent than GGBS at all ages The SO3 content was reported to have great influence on the 556
strength [39 40] 557
558
(a) (b) 559
Fig10 Isoresponse curves for compressive strength at 3d (a) (WB vs ANH) and (b) 560 (GGBS vs ANH) 561
562
563
(a) (b) 564
Fig11 Isoresponse curves for compressive strength at 7d (a) (WB vs ANH) and (b) (WB 565 vs ANH) 566
567
GGBS = 70
034 036 039 042 0440
5
10
15
20
WB
AN
H (
)
24
2628
30
3234
3638
4042
WB = 039
60 65 70 75 80
0
5
10
15
20
GGBS ()
AN
H (
)
2426
2830
32
34
36
3840
42
GGBS = 70
034 037 039 042 044
0
5
10
15
20
WB
AN
H(
)
3032
34
3638
40
42
44
46
48
WB = 039
60 65 70 75 80
0
5
10
15
20
GGBS ()
AN
H(
)
32
34
36
38
40
42
44
46
48
25
568
(a) (b) 569
Fig12 Isoresponse curves for compressive strength at 28d (a) (WB vs ANH) and (b) 570
(ANH vs GGBS) 571
3310 Discussion of the effect of WB GGBS and ANH 572
As expected the increase of WB led to an increase in mini-slump induced bleeding and a 573
reduction in flow time plate cohesion yield stress plastic viscosity and compressive strengths 574
This can be attributed to more water in the system 575
An increase in GGBS content resulted in a reduction of the flow time plate cohesion yield 576
stress and plastic viscosity while the fluidity is improved This was due to the fact the specific 577
gravity of slag is lower than that of PC leading to an increase in the paste volume and thus 578
improving the fluidity of paste 579
In case of an increase of ANH proportion while WB and GGBS were kept constant it led to 580
an increased mini-slump and induced bleeding while the flow time plate cohesion yield stress 581
and plastic viscosity were reduced This was due to the lower reactivity of ANH resulting in an 582
increase of water needed for lubrication of paste 583
As expected an increase in WB lead to an increase in induced bleeding permeability and a 584
decrease in compressibility [33 35] This is due to the increase in liquid volume between the 585
particles and to the reduction in the amount of interparticle forces Globally the compressibility 586
decreases and the permeability increases with ANH It can be explained by the reduced specific 587
area and lower reactivity that can lead to more available water in the samples 588
3311 Heat of Hydration 589
Heat of hydration is considered an important factor in the cement design as low heat of 590
hydration reduces the effect of thermal cracking The heat flow results of the calorimeter test 591
performed over a three days period can be seen in Figure 13 592
GGBS = 70
034 036 039 042 0440
5
10
15
20
WB
AN
H (
)
46
48
50
52
54
56
58
60
WB = 039
0 5 10 15 2060
65
70
75
80
ANH ()
GG
BS
(
)
50
52
54
56
5860
62
26
593
Fig 13 Heat flow graphs for first 3 days of reaction 594
Figure 13 presents that the largest peaks were in mixes 1 2 5 and 6 This shows that these 595
reactions generated the most heat and that they were quick Mixes 1 and 2 have the highest 596
OPC content at 40 and this suggests that to lower the heat of the reaction minimal OPC 597
should be used This is confirmed by the fact that mixes 5 and 6 have the next highest OPC 598
contents the same percentage as mixes 3 4 and 9 (one of the repeated mixes) which have 599
anhydrite present This implies that the presence of anhydrite will lengthen the reaction process 600
and reduce the heat produced during setting significantly The graph shows this by the absence 601
of a sharp peak instead a gentle curved hump is shown over a 2-day period whereas the mixes 602
showing a sharp peak occur after about 12 hrs Mix 7 which has the same solids content as 603
mix 8 but a lower WB ratio and no cement present showed the lowest heat flow during the 604
hydration process 605
Figure 14 shows the cumulative heat generation during the first 3 days of setting It is clear that 606
the two mixes (1 and 2) with highest cement content and absence of anhydrite had the highest 607
cumulative heat development over the 3-day period 643J and 594J respectively Mixes 3456 608
and 9 which all have 20 OPC content generated similar heat value over the 3 days Results 609
of mixes containing ANH implies that over the period that the anhydrite did not reduce the 610
cumulative heat generated but slowed the reaction and reduce the peak heat generated The 611
0
0002
0004
0006
0008
001
0012
0 50000 100000 150000 200000 250000 300000
He
at F
low
(mW
)
Time s()
M1
M2
M3
M4
M5
M6
M7
M9
1Day
2Day
3day
1d 2d 3d
27
graphs also suggest that a higher WB ratio produced a lower cumulative and peak heat 612
generation613
614
Fig 14 Cumulative heat generation curves for first 3 days 615
3312 pH measurements 616
Fig 15 summarises the results of pH and the nine mixes with different compositions of WB 617
the percentages of cement GGBS and ANH It is shown that Supersulfated cements (SSCs) 618
have lower pH values (lt 125 at all ages) than PC which has a pH of 139 [41] making SSC 619
more preferable in essential applications such as nuclear waste encapsulation 620
The figure shows that the pH value decreased with time for all samples between 1 and 7 days 621
Similar trend was observed in the majority of mixes between 7 and 28 days except for sample 622
2 5 and 9 which showed slight increase in the pH values This decrease refers to the 623
consumption of ions in the pore structure due to the hydration process 624
0
100
200
300
400
500
600
700
800
0 50000 100000 150000 200000 250000 300000
(J)
Time (s)
M1
M2
M3
M4
M5
M6
M7
M9
1 Day
3 Day
2 day
1d 2d 3d
1
2
3
9
45
6
7
28
625
626 Fig 15 Summary of pore solution pH 627
628
The incorporation of ANH replacing the Portland cement (C) results in remarkable decrease in 629
pH at all ages as introducing the ANH reduced the lower initial pH Likewise the increase in 630
the content of GGBS led to a decrease in the pH value of the pore structure as GGBS has lower 631
initial pH than Portland cement The increase of WB ratio decreased the pH value This is in 632
agreement with Collier [41] who found that increasing the wb ratio from 05 to 06 increased 633
the pH by I unit This was attributed to the increased availability of water in the case of WB 634
of 06 allowing hydration of more cement powder thereby releasing more hydroxide anions 635
into solution However in this study the WB ratio did not show a significant effect on 636
lowering the pH These results are in agreement with [42] which also found that decreasing the 637
pH improved the bulk resistivity of SSC mixtures 638
3313 SEM 639
Figure 16 shows the SEM images of some mixes at various magnifications The images clearly 640
show the dense and compact structure of the cement after seven days The dense structure was 641
another requirement from the cement chosen to enclose the waste to prevent leaching The 642
microstructure consists mainly of C-S-H the main hydration product and unhydrated slag 643
grains C-S-H is formed after the dissolution of slag grains when contacting the water and 644
alkalis and then the ionic species saturate the solution and then precipitate as hydrated phases 645
[8] There were abundant grains of hydrated and partially hydrated slag grains some small 646
1080
1100
1120
1140
1160
1180
1200
1220
1240
1260
1280
1 2 3 4 5 6 7 8 9
pH
val
ue
Mix Number
1 Day
7 Days
28 Days
29
GGBS particles presented rims of reaction products (eg Mix 6-Figure 16 (f) and Mix 9-Figure 647
16 (h)) It was found by [11] that the composition of the reaction rims around slag was similar 648
to that of the C-S-H from PC However [12] found that in the CndashSndashH of SSC is apparently 649
more foil like which is different than the fibrillar morphology of C-S-H in OPC Mix 3 and 650
Mix 4 (Figure 16 (c) and (d) respectively) exhibits more micro voids in the micrsostructure 651
which could explain the low strength of these mixes compared to mix 1 and 2 Ettringite was 652
not detected Ettringite is not the most abundant phase and it is not easy to detect in dried 653
polished samples because it is easily decomposed under the drying conditions of the vacuum 654
of the microscope column [11] 655
(a) Mix 1 image at 1100 magnification (b) Mix 2 image at 900 magnification
(c) Particle of unreacted slag mix3 7 days (d) An overall image of mix 4 at 7days
showing CSH and BFS particles
30
(e) Mix 5 image at 1100 magnification (f) Mix 6 image at 2300 magnification
(g) Mix 7 image at 2000 magnification (h) Mix 9 image at 2700 magnification
Fig 16 SEM results 656
4 Conclusions 657
The paper focused on optimizing the SSC cement grout in order to get the best of it The effect 658
of GGBS WB and ANH dosages on the grout fluidity rheological properties induced 659
bleeding maximum heat of hydration and compressive strength was investigated using 660
factorial design approach and analysis The models derived in this study are valid for the 661
experimental area corresponding to grout mixes made with variable levels of WB ANH and 662
GGBS in the ranges of 034 to 044 0 to 20 by mass of binder 60 to 80 by mass of 663
binder respectively Based on the results from this study the following conclusions are drawn 664
- In comparison to GGBS and ANH WB ratio had more pronounced effects on the 665
results of mini-slump plate cohesion meter Marsh cone time yield stress plastic viscosity 666
induced bleeding permeability compressibility and compressive strength 667
31
- The increase in the dosage of GGBS led to an increase in the values of plate cohesion 668
meter Marsh cone time yield stress and plastic viscosity while reducing the mini-slump 669
values maximum hydration and compressive strength This is ascribed to the fine nature 670
of GGBS particles and pozzolanic effect 671
- While the ANH particles caused a decrease in the maximum of heat of hydration it 672
increased the induced bleeding permeability and compressibility due to its dominant effect 673
on increasing the dormant period and increasing the rates of solid sedimentation and 674
induced bleeding water 675
- Increasing the dosage of ANH in grout reduced the hydrations kinetic at early-age and 676
thus reduced the compressive strength at 1d 3d and 7d However this effect diminished 677
at later ages at 28 d in a manner similar to increasing WB 678
- The increase in the dosage of ANH led to an increase in the mini-slump values 679
(fluidity) but a decrease in the values of yield stress plastic viscosity plate cohesion and 680
Marsh cone time This is attributed to better deflocculation of particles at the fresh state 681
- The increase of GGBS percentage delayed the reaction process and decreased the total 682
heat after 3 days while WB slightly reduced the total heat it didnrsquot significantly affect the 683
reaction process 684
- pH measurements in the present study confirmed the suitability of these mixture to low-685
pH applications as the increase in both the GGBS and ANH markedly decreased the initial 686
pH thereby lowering the pH at different ages 687
- The modelling and prediction of the response of other points in the experimental domain 688
were therefore possible Although the models are based on a given set of materials they 689
can be easily used to generate future results using other materials 690
- Dense microstructure was observed for mixes examined in this study C-S-H is the main 691
reaction product with presence of unreacted slag grains embedded well in the structure 692
However some micro voids were observed in mixes containing ANH which led to lower 693
compressive strength of mixes with ANH 694
CRediT authorship contribution statement 695
MSonebi and YBai did the conceptualization and the design of investigation as well as 696 performing the experiments MSonebi carried out the software analysis of the results and the 697
32
visualization MSonebi AAbdalqader T Fayyad and APerrot analysed the results and 698 wrote the original draft and reviewed and edited the final version 699
Declaration of Competing Interest 700
The authors declare that they have no known competing financial interests or personal 701 relationships that could have appeared to influence the work reported in this paper 702
Acknowledgments 703
The authors would like to express their gratitude to P McCann from QUB and N Collier 704 from Eden Nuclear and Environment Ltd for their helps for some experiments 705
706
References 707
1 Schneider M Romer M Tschudin M Bolio H (2011) Sustainable cement production-708 present and future Cement and Concrete Research 41642ndash650 709
httpsdoiorg101016jcemconres201103019 710
2 Madlool NA Saidur R Hossain MS Rahim NA (2011) A critical review on energy use 711 and savings in the cement industries Renewable and Sustainable Energy Reviews 712
152042ndash2060 httpsdoiorg101016jrser201101005 713
3 EN15743 (2015) BS EN 157432010+A12015 Supersulfated cement - Composition 714
specifications and conformity criteria BSI 715
4 Khatib JM Wright L Mangat PS (2016) Mechanical and physical properties of concrete 716
containing FGD waste Magazine of Concrete Research 68550ndash560 717 httpsdoiorg101680macr1500092 718
5 Khatib JM Mangat PS Wright L (2008) Sulfate resistance of mortar containing 719
simulated FGD waste Proceedings of Institution of Civil Engineers Construction 720 Materials 161119ndash128 httpsdoiorg101680coma20081613119 721
6 (2020) Specifying Sustainable Concrete 722
7 Hewlett PC (2004) Learsquos Chemistry of Cement and Concrete fourth edi Elsevier 723 Science amp Technology Books Oxford 724
8 Gruskovnjak A Lothenbach B Winnefeld F et al (2008) Hydration mechanisms of 725 super sulphated slag cement Cement and Concrete Research 38983ndash992 726
httpsdoiorg101016jcemconres200803004 727
9 Grounds T Nowell D V Wilburn FW (2003) Resistance of supersulfated cement to 728 strong sulfate solutions Journal of Thermal Analysis and Calorimetry 72181ndash190 729
httpsdoiorg101023A1023928021602 730
10 Grounds T Nowell D V Wilburn FW (1995) The influence of temperature and 731
different storage conditions on the stability of supersulphated cement Journal of 732 Thermal Analysis 45385ndash394 httpsdoiorg101007BF02548772 733
33
11 Bazalduacutea-Medelliacuten ME Fuentes AF Gorokhovsky A Escalante-Garciacutea JI (2015) Early 734 and late hydration of supersulphated cements of blast furnace slag with fluorgypsum 735 Materiales de Construccion 65e043 httpsdoiorg103989mc201506013 736
12 Matschei T Bellmann F Stark J (2005) Hydration behaviour of sulphate-activated slag 737 cements Advances in Cement Research 17167ndash178 738
httpsdoiorg101680adcr2005174167 739
13 Richardson IG (2000) Nature of the hydration products in hardened cement pastes 740 Cement and Concrete Composites 2297ndash113 httpsdoiorg101016S0958-741 9465(99)00036-0 742
14 Baux C Phelipot-Mardeleacute A Lanos C et al (2013) PERFORMANCES OF SUPER 743 SULFATED CEMENTS In International Conference on Concrete Under Severe 744 Conditions pp 1857ndash1870 745
15 Annabelle Phelipot-Mardeleacute Gabriel Samson Christophe Lanos (2015) Super sulfated 746 cement formulation and uses In Construction Materials ConMat Whistler Canada 747
16 Milestone NB (2006) Reactions in cement encapsulated nuclear wastes need for 748 toolbox of different cement types Advances in Applied Ceramics 10513ndash20 749
httpsdoiorg101179174367606X81678 750
17 Batchelor B (2006) Overview of waste stabilization with cement Waste Management 751
26689ndash698 httpsdoiorg101016JWASMAN200601020 752
18 Zhang T Cheeseman CR Vandeperre LJ (2011) Development of low pH cement 753
systems forming magnesium silicate hydrate (MSH) Cement and Concrete Research 754 41439ndash442 httpsdoiorg101016jcemconres201101016 755
19 Mobasher N Bernal SA Provis JL (2016) Structural evolution of an alkali sulfate 756
activated slag cement Journal of Nuclear Materials 46897ndash104 757 httpsdoiorg101016JJNUCMAT201511016 758
20 Wang J Yu B Gao Y (2014) Hydration Characteristics of Super Sulphated Cement 759 with Different Fineness In Proceedings of the International Conference on Material 760 and Environmental Engineering (ICMAEE 2014) Atlantis Press Paris France 761
21 Naumlgele E (1986) The Zeta-potential of cement Part II Effect of pH-value Cement and 762 Concrete Research 16853ndash863 httpsdoiorg1010160008-8846(86)90008-6 763
22 Jain N Civil MG-IJ of M and 2015 U (2015) Formulation of Sulphate Resistant Super 764 Sulphated Cement Using Fluorogypsum and Granulated Blast Furnace Slag IOSR 765
Journal of Mechanical and Civil Engineering (IOSR-JMCE) 12153ndash159 766
23 Gao YX Yu BY Xu FL (2012) Effect of Modified Phosphogypsum on the Mechanical 767 Properties of Super Sulphate Cement Applied Mechanics and Materials 161264ndash268 768 httpsdoiorg104028wwwscientificnetAMM161264 769
24 Kantro D (1980) Influence of Water-Reducing Admixtures on Properties of Cement 770 PasteampmdashA Miniature Slump Test Cement Concrete and Aggregates 295ndash102 771
httpsdoiorg101520CCA10190J 772
34
25 Svermova L Sonebi M Bartos PJM (2003) Influence of mix proportions on rheology of 773 cement grouts containing limestone powder Cement and Concrete Composites 25737ndash774 749 httpsdoiorg101016S0958-9465(02)00115-4 775
26 Sonebi M (2006) Rheological properties of grouts with viscosity modifying agents as 776 diutan gum and welan gum incorporating pulverised fly ash Cement and Concrete 777
Research 361609ndash1618 httpsdoiorg101016JCEMCONRES200605016 778
27 Nehdi M Rahman M (2004) Effect of Geometry and Surface Friction of Test Accessory 779 on Oscillatory Rheological Properties of Cement Pastes ACI Materials Journal 780 101416ndash424 httpsdoiorg101435913428 781
28 Khayat KH Yahia A (1997) Effect of Welan Gum-High-Range Water Reducer 782 Combinations on Rheology of Cement Grout ACI Materials Journal 94365ndash372 783 httpsdoiorg1014359321 784
29 Lombardi G (1985) THE ROLE OF COHESION IN CEMENT GROUTING OF 785 ROCK In Proceedings of Fifteenth Congress on Large Dams International 786 Commission on Large Dams pp 235ndash261 787
30 Perrot A Rangeard D Picandet V Meacutelinge Y (2013) Hydro-mechanical properties of 788
fresh cement pastes containing polycarboxylate superplasticizer Cement and Concrete 789 Research 53221ndash228 httpsdoiorg101016JCEMCONRES201306015 790
31 Perrot A Lecompte T Khelifi H et al (2012) Yield stress and bleeding of fresh cement 791 pastes Cement and Concrete Research 42937ndash944 792
httpdxdoiorg101016jcemconres201203015 793
32 Sonebi M Perrot A (2019) Effect of mix proportions on rheology and permeability of 794 cement grouts containing viscosity modifying admixture Construction and Building 795
Materials 212687ndash697 httpsdoiorg101016jconbuildmat201904022 796
33 Picandet V Rangeard D Perrot A Lecompte T (2011) Permeability measurement of 797
fresh cement paste Cement and Concrete Research 41330ndash338 798 httpsdoiorg101016JCEMCONRES201011019 799
34 Perrot A Rangeard D (2017) Effects of mix design parameters on consolidation 800
behaviour of fresh cement-based materials Materials and Structures 50117 801 httpsdoiorg101617s11527-016-0988-0 802
35 Rangeard D Perrot A Picandet V et al (2015) Determination of the consolidation 803 coefficient of low compressibility materials application to fresh cement-based 804
materials Materials and Structures 481475ndash1483 httpsdoiorg101617s11527-014-805 0247-1 806
36 Massoussi N Keita E Roussel N (2017) The heterogeneous nature of bleeding in 807 cement pastes Cement and Concrete Research 95108ndash116 808 httpsdoiorg101016JCEMCONRES201702012 809
37 Montgomery D (2007) Design and Analysis of Experiments Second Edition John 810
Wiley amp Sons 811
35
38 Roussel N Stefani C Leroy R (2005) From mini-cone test to Abrams cone test 812 Measurement of cement-based materials yield stress using slump tests Cement and 813 Concrete Research 35817ndash822 httpsdoiorg101016jcemconres200407032 814
39 Mangat PS Khatib JM Wright L (2006) Optimum utilisation of FGD waste in blended 815 binders Proceedings of Institution of Civil Engineers Construction Materials 159119ndash816
127 httpsdoiorg101680coma20061593119 817
40 Khatib JM Mangat PS Wright L (2013) Early age porosity and pore size distribution of 818 cement paste with flue gas desulphurisation (FGD) waste Journal of Civil Engineering 819 and Management 19622ndash627 httpsdoiorg103846139237302013793609 820
41 Collier NC Milestone NB Gordon LE Ko SC (2014) The suitability of a supersulfated 821 cement for nuclear waste immobilisation Journal of Nuclear Materials 452457ndash464 822 httpsdoiorg101016jjnucmat201405078 823
42 Masoudi R (2018) Examining compositions hydration mechanisms and properties of 824 supersulfated cement for use in concrete by Examining compositions hydration 825 mechanisms and properties of supersulfated cement for use in concrete University of 826 Toronto 827
828
7
All grout mixes were prepared in 2 L batches using a high-shear mixer with a 45 L capacity 169
The mixing water was kept at 98 plusmn 02 ordmC to compensate for heat generated during mixing 170
The cement and GGBS were mixed with ANH in a sequence that started with adding all of the 171
water into the mixer After one minute the binder was gradually introduced The grout was 172
mixed for one minute followed by 30 seconds of rest Subsequently the grout was mixed again 173
for 2 min at a high speed (285 rpm) and for 1 min at the low speed (140 rpm) 174
For all tests the timing is given from zero time ie the time when the cement particles first 175
touch the mixing water The mini-slump flow test started at 7 min (immediately after the end 176
of mixing) The transparent cone-shaped mould described elsewhere [24] was placed in the 177
centre of a smooth Plexiglas plate After filling with grout the cone was gently lifted 178
(approximately 30 s after placement of the grout) When the flow stopped the spread of the 179
grout was measured with a ruler in two perpendicular directions 180
Marsh cone test was carried out using a metal cone with an orifice diameter of 10 mm and 181
started at 8 plusmn 1 min One litre of grout was poured into the cone The conersquos orifice was opened 182
15 s after pouring the cement grout into the cone The time taken for each 100 ml of grout to 183
flow through the orifice was recorded and the measurements were completed upon collecting 184
700 ml of grout 185
The viscosity of cement grout was determined using a coaxial rotating cylinder viscometer 186
Fann (smooth cylinders no serration) that determined apparent viscosity at different shear 187
rates The test was contained in the annular space between an outer cylinder (rotor) with a 188
radius of 18415 mm and a bob with a radius of 17245 mm and a height of 380 cm The rotor 189
and bob were plunged into a cup containing 350 ml of sample grout Viscosity measurements 190
were made when the outer cylinder rotating at a known speed caused a viscous drag to be 191
exerted by the fluid This drag created a torque on the bob which was transmitted to a precision 192
spring where its deflection was measured and compared with test conditions and the 193
instrumentrsquos constants The measurement was made for 12 rotor speeds from 09 rpm to 600 194
rpm where the viscometer reading values () were recorded The value of shear stress (Pa) 195
was calculated by including k1 torsion constant of spring per unit deflection (N-cmdegree) 196
k2 shear stress constant for the effective bob surface (cm-3) and k3 shear rate constant [s-1rpm] 197
[25 26] 198
Rotor speed was increased step by step and the viscometer readings were recorded with 199
increasing rotation speeds The reading was taken when the needle in the viscometer was 200
8
stabilised or 30 seconds after the change of speed in cases when the needle had not stabilised 201
due to the thixotropy of the cement grout The time of reading was generally between 5 and 202
10 seconds 203
In this study the down-curve was chosen for final evaluation because it offered a better 204
description of the rheological behaviour of the grouts including a structural breakdown 205
phenomenon of inner forces among particles [27] The values of shear yield stress (the 206
minimum shearing stress required for the fluid to start flowing) and plastic viscosity used the 207
modified Bingham model [28] and are expressed as follows 208
2
0 cp (1) 209
Where τ0 is yield stress (Pa) μp is plastic viscosity (Pas) is shear rate (s-1) and c is a 210
constant 211
The cohesion of grout was determined at 30 plusmn 1 min with a Lombardi plate cohesion meter 212
[29] A thin galvanized steel plate (100times100times1 mm) was immersed in the grout and hung on a 213
stand placed on an electronic balance The weight of the grout still present on the plate was 214
recorded when the dripping of the grout had stopped This test was followed by the fresh 215
density measurement of the grout with a mud balancer Knowing the fresh density of the grout 216
it was possible to calculate the thickness on each side of the plate 217
The resistance of the fresh grout to induced bleeding was evaluated using a pressure filter The 218
equipment consists of a pressure vessel filter paper which is placed on a sieve and a graduated 219
cylinder A 200 ml grout sample is placed in the pressure vessel After closing the cell the 220
graduated cylinder is placed under the outlet of the cell The cell is pressured by compressed 221
air to 055 MPa The volume of water going out through the outlet on the bottom of the cell is 222
recorded at 15 and 30 s then at every minute up to 10 min and then at every 5 min up to 30 min 223
[25] 224
Considering homogeneous bleeding the results of the induced bleeding tests allow to derive 225
the evolution of the permeability of the sample during its compaction under the applied 226
pressure The permeability of the material is directly linked to the bleeding rate during the 227
material consolidation until the tested material is able to sustain the applied pressure [30 31] 228
It refers to the material ability to slow down the water filtration process 229
The measurement of the flow water allows to compute instantaneous WB ratio and makes it 230
possible to link it with the computed instantaneous permeability at a given time of the test [32ndash231
9
34] I The water flow is computed by dividing the variation of the measured water mass flowing 232
out the samples by the elapsed time between two successive data sampling In this study value 233
of permeability at 1 and 30 minutes are taken and compared It corresponds to the initial and 234
final permeability of the mixes 235
The material compressibility is considered in a soils mechanics way [30 35] It corresponds to 236
the ratio of the variation of void ratio (liquidsolid volume ratio) to the variation of logarithm 237
of applied pressure between the initial and the final state of the induced bleeding test It 238
provides the equilibrium state of the sample under a given applied pressure and is valid for 239
both homogeneous and heterogeneous bleeding [36] 240
It is worth noting that the computed permeability describes homogeneous bleeding kinetics 241
while compressibility describes the amplitude of the bleeding phenomenon 242
Heat of hydration was evaluated by isothermal calorimetry with an eight-channel heat 243
conduction calorimeter maintained at 22degC This equipment measures heat evolved by 244
comparing the temperatures of a grout sample and an inert reference which are both held under 245
isothermal conditions The heat flow results are recorded as a function of time CEM I GGBS 246
and ANH were blended manually for 30 s After the addition of water the grout was blended 247
10 s by hand and then an additional 50 s mechanically Polyethylene ampoules were filled with 248
approximately 6 g of each grout and the experiments were conducted for at least 72 h 249
The compressive strength of the grout was determined by crushing three cubes of 50 mm size 250
After casting the samples were covered with a polymer sheet (a cling film) to limit evaporation 251
of water and stored in a conditioning room at 20 plusmn 2 degC for 24 plusmn 05 hours Afterwards cubes 252
were demoulded and placed in water at 20 plusmn 1 degC until tested at 1 3 7 and 28days 253
In order to perform the pH test a powder sample of the hardened mixes was required The test 254
was performed on 1 7 and 28 day samples As mixes 9-12 are of identical composition the 255
reason is explained later in 41 derived statistical model tests were only performed on sample 256
10 To get the powder with a fineness of 65μm the samples were firstly drained of the acetone 257
To remove any remaining acetone they were placed in a vacuum desiccator The pieces were 258
then ground using a mortar and pestle passed through a 65 μm sieve placed in sample bags 259
and returned to the desiccator The samples had then to be mixed with distilled water to enable 260
the pH test to be performed A 110 ratio of cement to water was used and mixed for 24 hours 261
using a rotating machine To get the pH reading the samples were put into a centrifuge machine 262
to separate the solid and liquid At this stage the solution should have a pH equivalent to cement 263
10
it was mixed with To get a pH reading for the samples a pH device was used where a probe 264
is placed in the solution The machine was calibrated with three buffer solutions of 7 10 and 265
13 pH levels before measuring the pH of the samples 266
SEM (scanning electron microscopy) was carried out using a JEOL JSM6400 on flat fractured 267
surface specimens obtained from compression testing at 7-day samples Prior to SEM testing 268
the samples were mounted onto metal stubs using carbon paste and coated with gold film to 269
ensure good conductivity The accelerated voltage was set at 20 kV 270
22 Statistical Design and Modelling of Experiments 271
The technique of analysis used in this study was a 2k factorial experimental design [37] to 272
evaluate the influence of two different levels (maximum and minimum) for each variable on 273
the relevant grout properties Three key parameters (WB ANH GGBS) that should have 274
significant influence on mix characteristics of supersulfated cements were selected to formulate 275
the mathematical models for evaluating relevant properties (ie k = 3 in this study thus the 276
total mixes for the factorial design was 23 = 8) Additionally a mix at the central point was 277
replicated four times to estimate the experimental error and improve the reliability of the 278
models The coding and levels of the variables (WB and dosages of GGBS and ANH) are 279
given Table 2 280
The statistical models are valid for supersulfated grout (SSC) mixes made with WB GGBS 281
and ANH in the ranges of 034 to 044 60 to 80 and 0 to 20 respectively The modelled 282
experimental region consisted of mixtures ranging from coded variables of ndash1 to +1 The coded 283
factors for variables were calculated by 284
Coded Factor = (Actual value-Factor means)[Range of factor value2] (2) 285
Hence 286
Coded WB = (Actual WB ndash 039)005 287
Coded GGBS = (Actual GGBS ndash 07)01 288
Coded Anhydrite = (Actual ANH ndash 01)01 289
The responses modelled were mini-slump plate cohesion Marsh cone yield stress plastic 290
viscosity induced bleeding at 1 min 5 and 30 mins permeability at 1 min and 30 mins 291
compressibility and compressive strength at 1 3 7 and 28 days The general model associated 292
11
with the two-level factorial design incorporating three independent variables (WB GGBS 293
ANH) is expressed by 294
Y1 = a0 + a1WB + a2GGBS + a3ANH+ a4WBGGBS + a5WBANH + a6GGBSANH 295
+ a7WBGGBSANH + ε (3) 296
where 297
Y1 Response (mini slump marsh cone plate cohesion etc) 298
a0 Overall mean factor effect 299
a1-a7 Regression coefficients representing model constants (contribution of independent 300
variables and their interaction to each response) 301
a1WB a2GGBS a3ANH Linear effect of factors WB GGBS and ANH 302
a4WBGGBS a5WBANH a6GGBSANH a7WBGGBSANH Interaction effects of 303
factors WB GGBS and ANH 304
ε Random error term representing the effects of uncontrolled variables 305
Analysis of variance (ANOVA) was used to test the significance of regression models and t-306
tests were performed to identify the non-significant (NS) variables and second order 307
interactions which were subsequently eliminated from the derived models Model coefficients 308
were determined using multi-linear regression analysis based on a normal distribution 309
assumption The error was assumed to be random and normally distributed so the residual 310
terms which represent the difference between the actual and predicted values should exhibit 311
similar properties [37] The probability value (Prob) obtained from ANOVA determines the 312
statistical significance of each factor and their interactions For most of the parameters the 313
probability that the derived coefficients associated with the various variables influencing each 314
response were limited to 10 This signifies that there is less than 10 chance or 90 315
confidence limit that the contribution of a given parameter to the tested response exceeds the 316
value of the specified coefficient A negative estimate indicates that an increase of the given 317
parameter results in a reduction of the measured response 318
12
3 Results and discussion 319
The results of the experimental work characterize the behaviour of the mortars with different 320
WB ANH and GGBS levels Table 3 summarises all results of the experimental work 321
performed The results were used to construct the regression models 322
Table 3 Average results from experimental work 323 324
Viscometer Induced bleeding
Mix Mini-
slump
Flow
time
Cohesion
meter
Yield
value
Plastic
viscosity
1min 5min 30min
(mm) (s) (mm) (Pa) (Pas) (mL) (mL) (mL)
1 61 230 105 191 0923 220 470 480
2 89 25 55 97 0323 290 780 810
3 67 200 118 172 0802 280 580 605
4 111 12 20 80 0199 490 860 860
5 52 360 143 251 1203 280 520 540
6 83 69 86 99 0403 360 700 700
7 60 250 125 211 0980 310 580 590
8 110 13 40 77 0224 350 910 950
9 71 150 87 101 0617 370 720 730
10 73 102 122 106 0681 290 620 620
11
12
77
74
192
83
89
110
124
101
0660
0641
290
350
640
715
645
720
325
Table 3 Average results from experimental work (continued) 326
Mix Permeability Permeability Compre-
ssibility
Compressive strength
1 min 30 min fc 1d fc 3d fc 7d fc 28d
(ms) (ms) (MPa) (MPa) (MPa) (MPa)
1 216E-09 317E-09 0155 299 506 581 704
2 512E-08 418E-09 0298 168 383 547 558
3 448E-08 366E-09 0194 213 334 406 527
4 374E-08 425E-09 0312 140 223 256 408
5 448E-08 342E-09 0173 233 434 507 535
6 512E-08 395E-09 0255 136 371 371 448
7 440E-08 361E-09 0187 108 232 343 532
8 451E-08 433E-09 0342 68 200 263 473
9 446E-08 402E-09 0250 196 328 398 592
10 468E-08 371E-09 0212 171 232 361 556
11
12
423E-08
516E-08
379E-09
400E-09
0221
0246
207
183
313
301
451
435
565
520
327
The derived quadratic statistical models of grout for mini-slump flow time cohesion plate 328
yield stress plastic viscosity induced bleeding at 1 min 5 min and 30 min permeability at 1 329
13
min and 30 min compressibility and compressive strength at 1 3 7 and 28 days are given in 330
Equations (4) to (18) where WB GGBS and ANH are given in codes values 331
Mini-Slump (mm) = 7881 + 1919 WB + 781 ANH + 444 WBANH - 294 GGBS (4) 332
333
Marsh flow time (s) = 1404 - 1153 WB ndash 261 ANH + 281 GGBS (5) 334
335
Plate Cohesion meter (microm) = 86 - 366 WB + 122 GGBS - 107 ANH - 091 WBANH (6) 336
337
Yield Value (Pa) = 1466 ndash 584 WB - 126 WBGGBS - 125 ANH + 124 GGBS (7) 338
339
Plastic Viscosity (Pas) = 063 - 034 WB - 0078 ANH + 0073 GGBS 340
- 0047 WBGGBS - 0022 ANHGGBS (8) 341
342
Induced Bleeding at 1 min (ml) = 3225 + 50 WB + 35 ANH ndash 225 WBANHGGBS (9) 343
344
Induced Bleeding at 5 mins (ml) = 675 + 1375 WB + 575 ANH (10) 345
346
Induced Bleeding at 30 mins (ml) = 6919 + 1381 WB + 594 ANH (11) 347
348
Permeability at 1 min (ms) x 10-8 = 4 + 0615 WB + 0621 AHN ndash 0773 WBGGBS 349
- 0426WBAHN - 0446 AHNGGBS (12) 350
351
Permeability at 30 min (ms) x 10-8 = 0382 + 0035 WB + 0014 ANH 352
+ 0008 WBANHGGBS (13) 353
354
Compressibility = 02396 + 00623 WB + 00194 ANH + 00012 WBANHGGBS (14) 355
356
ƒc 1 d (MPa) = 1705 - 426 WB - 384 ANH - 343 GGBS + 145 WBANH (15) 357
358
ƒc 3 d (MPa) = 3215 - 879 ANH - 412 WB ndash 261 GGBS (16) 359
360
ƒc 7 d (MPa) = 4092ndash 924 ANH - 5 WB - 383 GGBS (17) 361
362
14
ƒc 28 d (MPa) = 5348 - 515 WB - 382 ANH ndash 262 GGBS + 436 ANHGGBS (18) 363
364
The correlation coefficient of most of the proposed models were higher than 090 except for 365
plastic viscosity compressive strength after 3days and compressive strength after 28days 366
which have coefficients of 070 086 and 087 respectively 367
Table 4 shows the average measured responses of the four replicate grouts the coefficients of 368
variation (COV) as well as the estimated errors with a 90 confidence limit for each of the 369
measured properties The estimated error levels for mini-slump plate cohesion meter Marsh 370
cone yield stress plastic viscosity induced bleeding at 1 min 5 min and 30 mins permeability 371
at 1 min and 30 min compressibility and compressive strengths at 1 3 7 28 days were plusmn 22 372
mm plusmn 0001mm plusmn 40 s plusmn 09 Pa plusmn 002 Pa s plusmn 28 ml plusmn 42 ml plusmn 45 ml plusmn 32x10-9 (ms) 373
plusmn 13x10-10 (ms) plusmn 00153 plusmn 13 MPa plusmn 35 MPa plusmn 33 MPa and plusmn 25 MPa respectively 374
The relative experimental errors for mini-slump plate cohesion meter Marsh cone yiled stress 375
plastic viscosity induced bleeding permeability compressibility compressive strengths were 376
limited to 3-11 On the other hand relative error for march cone was up to 30 377
Table 4 Repeatability of test parameters at the central point 378
379
Tests Mini-
slump
Plate
cohesion
Marsh
cone
Yield
stress
Plastic
viscosit
y
Induced
bleeding
at 1 min
Induced
bleedin
g at 5
min
Induced
bleeding
at 30
min
Mean (n=4) 736
mm
001
mm
1318
s
108
Pa
065
Pa s
325
ml
674
ml
679
ml
Coefficient
of variation
()
37 115 372 105 42 127 76 80
Estimate
error (90
confidence
limit)
22
mm
0001
mm
402
s
09
Pa
002
Pa s
28
ml
42
ml
45
ml
380
381 Table 4 Repeatability of test parameters at the central point (continued) 382
383
Tests
Permeability
1 min
x10-8
Permeability
30 min
x10-8
Compressibility frsquoc 1d frsquoc 3d frsquoc 7d frsquoc 28d
Mean (n=4) 463
ms
0388
ms 02323
189
MPa
293
MPa
411
MPa
558
MPa
Coefficient
of variation
()
85 39 8 84 144 98 53
15
Estimate
error (90
confidence
limit)
032
(ms)
0013
(ms)
00153
13
MPa
35
MPa
33
MPa
24
MPa
384
385
31 Accuracy of the established models 386
387
The ratio of predicted-to-measured properties for grout ranged between 087 and 115 388
indicating good accuracy for prediction of mini-slump plate cohesion induced bleeding at 1 389
min 5 mins and 30 mins yield stress plastic viscosity and compressive strength at 1-d 3-d 7-390
d and 28-d In general the proposed models for mini-slump plate cohesion Marsh cone and 391
compressive strength appeared to be accurate in predicting fluidity cohesivity induced 392
bleeding permeability at 30 min compressibility and compressive strength with low scatter 393
between measured and predicted values However the average values of predictedmeasured 394
ratio of yield values were slightly higher (074) 395
396
32 Isoresponses of the proposed models 397
398
The isoresponse surfaces and contour plots for mini-slump plate cohesion Marsh cone yield 399
stress plastic viscosity induced bleeding at 1 min 5 mins and 30 mins permeability at 1 min 400
and 30 mins compressibility and compressive strength at 1-d 3-d 7-d and 28-d were obtained 401
by using response surface methodology (RSM) The isoresponse surfaces and contour plots 402
were obtained from the regression models and because the models contained interaction and 403
second-order variables the contour lines were curved 404
The proposed statistical models can therefore be used to evaluate the effect of a group of 405
variables on the properties affecting the quality of supersulfated grout This allowed for the 406
calculation of isoresponse surfaces from the parameters under study outside the experimental 407
domain and the optimisation of their effects The next sections will discuss the results of each 408
experiment separately 409
331 Mini-slump 410
As shown in Eq 4 the mini-slump is influenced in order of significance by WB ratio 411
anhydrite proportion interaction of WB and ANH and the percentage of GGBS content The 412
WB ratio had the greatest effect on fluidity due to better lubrication of the particles in the paste 413
16
[29] The mini-slump test was accompanied by very low shear The value of mini-slump is to 414
characterise yield stress [38] therefore higher mini-slump value indicated a lower yield stress 415
The effect of WB on the increase of mini-slump was two and half-time than that of ANH (192 416
vs 781 in Eq 4) However increased ANH resulted in a 27 times greater increase in mini-417
slump than reduced GGBS (781 vs -294 in Eq 4) Figure 1(a) shows the effect of increased 418
WB on mini-slump vs ANH (when GGBS was kept constant at 70) and Figure 1(b) shows 419
GGBS vs ANH (when WB was fixed at 039) Based on these figures it is evident that mini-420
slump increased significantly when the dosage of WB and ANH increased 421
422
(a) (b) 423
Fig 1 Isoresponse curves of mini-slump (mm) (a) WB vs ANH and (b) GGBS vs ANH 424
425
332 Marsh cone 426
The time needed for a grout sample to flow through the Marsh cone is proportional to the 427
viscosity of the cement grout the flow time becomes an index of fluidity so the longer the 428
flow time the lower the fluidity Similar to the previous trends Eq 5 shows that the values of 429
Marsh cone are influenced in order of significance by WB GGBS and ANH This is 430
graphically illustrated in Figure 2 431
GGBS = 70
034 039 042 044
0
5
10
15
20
WB
AN
H (
)
65
74
83
92
101
037
AN
H(
)
WB = 039
60 65 70 75 80
0
5
10
15
20
GGBS()
70
75
80
85
17
432
(a) (b) 433
Fig 2 Isoresponse curves for flow time (s) (a) WB vs ANH and (b) GGBS vs ANH 434
435
It can be noted that an increase in WB and ANH or a reduction in GGBS led to decreasing 436
the Marsh cone flow time For example at fixed WB at 039 and GGBS of 70 respectively 437
the increase in ANH dosage from 5 to 20 led to a marked reduction of the Marsh cone flow 438
time from 170 to 140 s (Figure 2(a)) This behaviour is attributed to the change in plastic 439
viscosity of the grout as will be discussed later 440
333 Cohesion plate 441
As shown in Eq 6 the cohesion plate was influenced in order of magnitude by the WB and 442
the percentage of GGBS and ANH The increasing WB had a 34 times the influence on the 443
reduction of the cohesion plate test results as the increased ANH (for a GGBS constant) By 444
comparing the effects of WB and GGBS on plate cohesion the increased WB can be 445
interpreted as having approximately a 3 times greater influence on the reduction of plate 446
cohesion values than the increase in GGBS (-366 vs 122 in Eq 6) given that ANH is held 447
constant The effect of an increase in WB from 034 to 044 and ANH from 0 to 20 with a 448
fixed GGBS dosage of 70 is presented in Figure 3(a) Increased WB led to a decreased 449
cohesion plate value Conversely an increase in GGBS increased the cohesion plate value and 450
an increased ANH caused a reduction in cohesion plate (Figure 3(b)) 451
GGBS = 70
034 036 039 042 0440
5
10
15
20
WB
AN
H (
)
40
6080
100120
140160
180200
220
WB = 039
60 65 70 75 80
0
5
10
15
20
GGBS ()
AN
H (
)
100
120
140
160
180
18
452
(a) (b) 453
Fig 3 Isoresponse curves for plate cohesion meter (a) WB vs ANH and (b) GGBS vs 454 ANH 455
334 Yield stress 456
As shown in Eq 7 yield value was influenced in order of magnitude by WB and dosages of 457
ANH and GGBS Based on Figure 4 (a) when WB was fixed at 039 GGBS maintained at 458
70 and ANH increased to 5 the isoresponse curve showed a yield value of 15 Pa On the 459
other hand if the proportion of ANH was further increased to 20 while GBBS was 460
maintained at 70 the yield value decreased to 135 Pa This corresponds with Eq (7) in 461
which the proportion of WB and ANH were increased while GGBS was kept constant 462
resulting in a reduction in yield stress An increase in GGBS content resulted in an increase of 463
the yield stress 464
Figure 4 (b) shows the isoresponse curve of the yield value with a fixed proportion of GGBS 465
at 70 When WB was 039 and ANH was 5 the isoresponse of the predicted yield value 466
was 155 Pa If ANH was increased to 20 while maintaining WB at 039 the isoresponse of 467
the yield value was 135 Pa 468
It can be interesting to note that the observed results for the yield stress are closed to the one 469
observed with the cohesion plate and mini-slump tests This is expected as yield stress values 470
can be derived from those two simple tests 471
GGBS = 70
034 037 039 042 0440
5
10
15
20
WB
AN
H(
)
45
55
65
7585
95
105
115
WB = 039
60 65 70 75 800
5
10
15
20
GGBS ()
AN
H(
)
75
85
95
105
19
472
(a) (b) 473
Fig 4 Isoresponse curves for yield stress (Pa) (a) WB vs ANH and (b) GGBS vs ANH 474
335 Plastic viscosity 475
Plastic viscosity was influenced in order of magnitude by WB and the dosages of ANH and 476
GGBS ANH and GGBS had almost opposite effects on plastic viscosity (-0078 vs 0073 in 477
Eq 8) As shown in Eq (8) increased WB had the greatest primary effect on plastic viscosity 478
(034 vs 0078 and 0073) The increased WB had approximately a 44 times greater influence 479
on reducing plastic viscosity than increased ANH or decreased GGBS 480
In the isoresponse curve of plastic viscosity shown in Figure 5 (a) when GGBS was fixed at 481
70 WB set at 039 and ANH maintained at 5 the predicted plastic viscosity value was 482
068 Pas On the other hand if the dosage of ANHB was increased to 20 while maintaining 483
a similar WB the plastic viscosity was reduced to 055 Pas 484
In Figure 5 (b) WB was fixed at 039 when GGBS was held at 70 and ANH at 5 the 485
predicted plastic viscosity was 067 Pas However when ANH was increased to 20 and 486
GGBS was maintained at 70 the predicted plastic viscosity dropped to 055 Pas 487
AN
H(
)
GGBS = 70
034 037 039 042 044
0
5
10
15
20
WB
1012
1416
18
20
WB = 039
60 65 70 75 800
5
10
15
20
GGBS ()
AN
H(
)
13
14
15
20
488
(a) (b) 489
Fig 5 Isoresponse curve for plastic viscosity (Pas) (a) WB vs ANH and (b) GGBS vs 490
ANH 491
336 Induced bleeding 492
The induced bleeding equations for 1 and 5 minutes (Eqs 9 10) and 30 minutes (Eq 11) are 493
very similar The two influencing factors of induced bleeding are WB ratio and anhydrite 494
WB ratio has the greatest effect over two times the effect of anhydrite content Figure 6 shows 495
the isoresponse for bleeding versus the WB ratio for a fixed value of GGBS at 70 It can be 496
seen that when an anhydrite value is selected and the WB ratio is increased the bleeding will 497
also increase Similarly if a WB ratio is selected and the anhydrite content is increased the 498
bleeding will again increase 499
500
GGBS = 70
034 037 039 042 0440
5
10
15
20
WB
AN
H(
)
035
045
055
065
075
085
095
WB = 039
60 65 70 75 800
5
10
15
20
GGBS ()
AN
H(
)
055
060
065
075
034 036 039 042 044
0
5
10
15
20
WB
AN
H (
)
26
28
30
3234
36
38
40
GGBS=70
21
(a) 501
502
(b) (c) 503
Fig 6 Isoresponse curves for induced bleeding at 1 5 and 30 min WB vs ANH 504
337 Permeability 505
Figure 7 (a) and (b) showed firstly that the permeability decreased significantly from 1 min to 506
30 min Permeability at 1 min was influenced in order of magnitude by WB and the dosage 507
of ANH All interactions between 3 parameters had almost opposite effects on permeability 508
(Eq 12) As shown in Eq (12) increased WB and AHN had the greatest primary effect on 509
permeability at 1 min It seems there is an optimum reached at WB = 40 and AHN at 17 510
Similarly the permeability at 30 min is affected in order of significance by WB followed by 511
ANH (Eq 13) In Figure 7 (b) WB was fixed at 039 when GGBS was held at 70 and ANH 512
at 10 the predicted permeability was 038 x 10-8 (ms) However when ANH was increased 513
to 20 and GGBS was maintained at 70 the predicted permeability increased to 040x10-8 514
(ms) 515
516
GGBS = 70
034 036 039 042 0440
5
10
15
20
WB
AN
H (
)
545
61
675
74
805
GGBS = 70
034 036 039 042 0440
5
10
15
20
WB
AN
H (
)
56
60
64
68
72
7680
84
22
517
(a) (b) 518
Fig 7 Isoresponse curves for permeability at 1 and 30 min WB vs ANH 519
338 Compressibility 520
As shown in Eq (14) the compressibility was influenced in order of magnitude by the WB 521
and the percentage of ANH The interaction between 3 parameters affected also the 522
compressibility The increasing WB had a 32 times the influence on the increase of the 523
compressibility results as the increased ANH (for a GGBS constant) The effect of an increase 524
in WB from 034 to 044 and ANH from 0 to 20 with a fixed GGBS dosage of 70 is 525
presented in Figure 8 Increased WB led to an increase of compressibility Similarly an 526
increase in AHN increased the compressibility 527
528
Fig 8 Isoresponse curves for compressibility WB vs ANH 529
034 036 039 042 044
0
5
10
15
20
GGBS = 70 WB
AN
H (
)
3
35
4
4
45
5
034 036 039 042 044
0
5
10
15
20
WB
AN
H (
)
034
035
036 037 038 039 04
041
042
4
GGBS=70
034 036 039 042 044
0
5
10
15
20
WB
AN
H (
)
017
019
021 023 025 027
029
031
GGBS=70
23
530
339 Compressive strength 531
After one day from Eq 15 the influencing factors in order of significance are WB ratio 532
anhydrite content GGBS content and the interaction of WB and ANH The effect of the first 533
three was similar but WB had 11 times greater effect than anhydrite and 125 times greater 534
effect than GGBS While the interaction of WB and anhydrite had around a third of the 535
influence of WB Figures 9 (a) and (b) show the isoresponses for 1-day compressive strength 536
From Figure 9 (a) it can be seen when the GGBS content is fixed at 70 for a given anhydrite 537
content increasing the WB ratio will decrease the strength Also if a WB ratio is selected and 538
the anhydrite is increased similarly the strength will decrease From Figure 9 (b) with the WB 539
ratio fixed at 039 once again an increase in GGBS led to a reduction of compressive strength 540
at 1 day 541
542
(a) (b) 543
Fig9 Isoresponse curves for compressive strength at 1d (a) (WB vs ANH) and (b) (GGBS 544 vs ANH) 545
Eqs 16 17 and 18 show the effect of GGBS and ANH percentages on compressive strength at 546
3-d 7-d and 28-d Figures 10 11 and 12 show the isoresponse of the compressive strength at 547
3-d 7-d and 28-d respectively with WB vs ANH Increased ANH led to a decrease of 3-d 548
and 7-d compressive strength As expected an Increase in WB led to a decrease in compressive 549
strength The percentage of ANH had a negative effect on compressive strength and showed a 550
greater influence particularly at 3-d and 7-d (879 (3 d) amp 924 (7d) vs 382 (28 d)) GGBS has 551
a negative impact on early strength development The negative effect of GGBS on compressive 552
GGBS = 70
034 037 039 042 0440
5
10
15
20
WB
AN
H(
)
12
14
16
18
20
22
2426
WB = 039
60 65 70 75 800
5
10
15
20
GGBS ()
AN
H(
)
10
12
14
16
18
20
22
24
strength at early ages is clearly attributable to the fact that up to 80 of cement has been 553
replaced by GGBS and it takes some time for GGBS to start developing its pozzolanic action 554
at a noticeable level The results indicate that ANH content influences strength to a greater 555
extent than GGBS at all ages The SO3 content was reported to have great influence on the 556
strength [39 40] 557
558
(a) (b) 559
Fig10 Isoresponse curves for compressive strength at 3d (a) (WB vs ANH) and (b) 560 (GGBS vs ANH) 561
562
563
(a) (b) 564
Fig11 Isoresponse curves for compressive strength at 7d (a) (WB vs ANH) and (b) (WB 565 vs ANH) 566
567
GGBS = 70
034 036 039 042 0440
5
10
15
20
WB
AN
H (
)
24
2628
30
3234
3638
4042
WB = 039
60 65 70 75 80
0
5
10
15
20
GGBS ()
AN
H (
)
2426
2830
32
34
36
3840
42
GGBS = 70
034 037 039 042 044
0
5
10
15
20
WB
AN
H(
)
3032
34
3638
40
42
44
46
48
WB = 039
60 65 70 75 80
0
5
10
15
20
GGBS ()
AN
H(
)
32
34
36
38
40
42
44
46
48
25
568
(a) (b) 569
Fig12 Isoresponse curves for compressive strength at 28d (a) (WB vs ANH) and (b) 570
(ANH vs GGBS) 571
3310 Discussion of the effect of WB GGBS and ANH 572
As expected the increase of WB led to an increase in mini-slump induced bleeding and a 573
reduction in flow time plate cohesion yield stress plastic viscosity and compressive strengths 574
This can be attributed to more water in the system 575
An increase in GGBS content resulted in a reduction of the flow time plate cohesion yield 576
stress and plastic viscosity while the fluidity is improved This was due to the fact the specific 577
gravity of slag is lower than that of PC leading to an increase in the paste volume and thus 578
improving the fluidity of paste 579
In case of an increase of ANH proportion while WB and GGBS were kept constant it led to 580
an increased mini-slump and induced bleeding while the flow time plate cohesion yield stress 581
and plastic viscosity were reduced This was due to the lower reactivity of ANH resulting in an 582
increase of water needed for lubrication of paste 583
As expected an increase in WB lead to an increase in induced bleeding permeability and a 584
decrease in compressibility [33 35] This is due to the increase in liquid volume between the 585
particles and to the reduction in the amount of interparticle forces Globally the compressibility 586
decreases and the permeability increases with ANH It can be explained by the reduced specific 587
area and lower reactivity that can lead to more available water in the samples 588
3311 Heat of Hydration 589
Heat of hydration is considered an important factor in the cement design as low heat of 590
hydration reduces the effect of thermal cracking The heat flow results of the calorimeter test 591
performed over a three days period can be seen in Figure 13 592
GGBS = 70
034 036 039 042 0440
5
10
15
20
WB
AN
H (
)
46
48
50
52
54
56
58
60
WB = 039
0 5 10 15 2060
65
70
75
80
ANH ()
GG
BS
(
)
50
52
54
56
5860
62
26
593
Fig 13 Heat flow graphs for first 3 days of reaction 594
Figure 13 presents that the largest peaks were in mixes 1 2 5 and 6 This shows that these 595
reactions generated the most heat and that they were quick Mixes 1 and 2 have the highest 596
OPC content at 40 and this suggests that to lower the heat of the reaction minimal OPC 597
should be used This is confirmed by the fact that mixes 5 and 6 have the next highest OPC 598
contents the same percentage as mixes 3 4 and 9 (one of the repeated mixes) which have 599
anhydrite present This implies that the presence of anhydrite will lengthen the reaction process 600
and reduce the heat produced during setting significantly The graph shows this by the absence 601
of a sharp peak instead a gentle curved hump is shown over a 2-day period whereas the mixes 602
showing a sharp peak occur after about 12 hrs Mix 7 which has the same solids content as 603
mix 8 but a lower WB ratio and no cement present showed the lowest heat flow during the 604
hydration process 605
Figure 14 shows the cumulative heat generation during the first 3 days of setting It is clear that 606
the two mixes (1 and 2) with highest cement content and absence of anhydrite had the highest 607
cumulative heat development over the 3-day period 643J and 594J respectively Mixes 3456 608
and 9 which all have 20 OPC content generated similar heat value over the 3 days Results 609
of mixes containing ANH implies that over the period that the anhydrite did not reduce the 610
cumulative heat generated but slowed the reaction and reduce the peak heat generated The 611
0
0002
0004
0006
0008
001
0012
0 50000 100000 150000 200000 250000 300000
He
at F
low
(mW
)
Time s()
M1
M2
M3
M4
M5
M6
M7
M9
1Day
2Day
3day
1d 2d 3d
27
graphs also suggest that a higher WB ratio produced a lower cumulative and peak heat 612
generation613
614
Fig 14 Cumulative heat generation curves for first 3 days 615
3312 pH measurements 616
Fig 15 summarises the results of pH and the nine mixes with different compositions of WB 617
the percentages of cement GGBS and ANH It is shown that Supersulfated cements (SSCs) 618
have lower pH values (lt 125 at all ages) than PC which has a pH of 139 [41] making SSC 619
more preferable in essential applications such as nuclear waste encapsulation 620
The figure shows that the pH value decreased with time for all samples between 1 and 7 days 621
Similar trend was observed in the majority of mixes between 7 and 28 days except for sample 622
2 5 and 9 which showed slight increase in the pH values This decrease refers to the 623
consumption of ions in the pore structure due to the hydration process 624
0
100
200
300
400
500
600
700
800
0 50000 100000 150000 200000 250000 300000
(J)
Time (s)
M1
M2
M3
M4
M5
M6
M7
M9
1 Day
3 Day
2 day
1d 2d 3d
1
2
3
9
45
6
7
28
625
626 Fig 15 Summary of pore solution pH 627
628
The incorporation of ANH replacing the Portland cement (C) results in remarkable decrease in 629
pH at all ages as introducing the ANH reduced the lower initial pH Likewise the increase in 630
the content of GGBS led to a decrease in the pH value of the pore structure as GGBS has lower 631
initial pH than Portland cement The increase of WB ratio decreased the pH value This is in 632
agreement with Collier [41] who found that increasing the wb ratio from 05 to 06 increased 633
the pH by I unit This was attributed to the increased availability of water in the case of WB 634
of 06 allowing hydration of more cement powder thereby releasing more hydroxide anions 635
into solution However in this study the WB ratio did not show a significant effect on 636
lowering the pH These results are in agreement with [42] which also found that decreasing the 637
pH improved the bulk resistivity of SSC mixtures 638
3313 SEM 639
Figure 16 shows the SEM images of some mixes at various magnifications The images clearly 640
show the dense and compact structure of the cement after seven days The dense structure was 641
another requirement from the cement chosen to enclose the waste to prevent leaching The 642
microstructure consists mainly of C-S-H the main hydration product and unhydrated slag 643
grains C-S-H is formed after the dissolution of slag grains when contacting the water and 644
alkalis and then the ionic species saturate the solution and then precipitate as hydrated phases 645
[8] There were abundant grains of hydrated and partially hydrated slag grains some small 646
1080
1100
1120
1140
1160
1180
1200
1220
1240
1260
1280
1 2 3 4 5 6 7 8 9
pH
val
ue
Mix Number
1 Day
7 Days
28 Days
29
GGBS particles presented rims of reaction products (eg Mix 6-Figure 16 (f) and Mix 9-Figure 647
16 (h)) It was found by [11] that the composition of the reaction rims around slag was similar 648
to that of the C-S-H from PC However [12] found that in the CndashSndashH of SSC is apparently 649
more foil like which is different than the fibrillar morphology of C-S-H in OPC Mix 3 and 650
Mix 4 (Figure 16 (c) and (d) respectively) exhibits more micro voids in the micrsostructure 651
which could explain the low strength of these mixes compared to mix 1 and 2 Ettringite was 652
not detected Ettringite is not the most abundant phase and it is not easy to detect in dried 653
polished samples because it is easily decomposed under the drying conditions of the vacuum 654
of the microscope column [11] 655
(a) Mix 1 image at 1100 magnification (b) Mix 2 image at 900 magnification
(c) Particle of unreacted slag mix3 7 days (d) An overall image of mix 4 at 7days
showing CSH and BFS particles
30
(e) Mix 5 image at 1100 magnification (f) Mix 6 image at 2300 magnification
(g) Mix 7 image at 2000 magnification (h) Mix 9 image at 2700 magnification
Fig 16 SEM results 656
4 Conclusions 657
The paper focused on optimizing the SSC cement grout in order to get the best of it The effect 658
of GGBS WB and ANH dosages on the grout fluidity rheological properties induced 659
bleeding maximum heat of hydration and compressive strength was investigated using 660
factorial design approach and analysis The models derived in this study are valid for the 661
experimental area corresponding to grout mixes made with variable levels of WB ANH and 662
GGBS in the ranges of 034 to 044 0 to 20 by mass of binder 60 to 80 by mass of 663
binder respectively Based on the results from this study the following conclusions are drawn 664
- In comparison to GGBS and ANH WB ratio had more pronounced effects on the 665
results of mini-slump plate cohesion meter Marsh cone time yield stress plastic viscosity 666
induced bleeding permeability compressibility and compressive strength 667
31
- The increase in the dosage of GGBS led to an increase in the values of plate cohesion 668
meter Marsh cone time yield stress and plastic viscosity while reducing the mini-slump 669
values maximum hydration and compressive strength This is ascribed to the fine nature 670
of GGBS particles and pozzolanic effect 671
- While the ANH particles caused a decrease in the maximum of heat of hydration it 672
increased the induced bleeding permeability and compressibility due to its dominant effect 673
on increasing the dormant period and increasing the rates of solid sedimentation and 674
induced bleeding water 675
- Increasing the dosage of ANH in grout reduced the hydrations kinetic at early-age and 676
thus reduced the compressive strength at 1d 3d and 7d However this effect diminished 677
at later ages at 28 d in a manner similar to increasing WB 678
- The increase in the dosage of ANH led to an increase in the mini-slump values 679
(fluidity) but a decrease in the values of yield stress plastic viscosity plate cohesion and 680
Marsh cone time This is attributed to better deflocculation of particles at the fresh state 681
- The increase of GGBS percentage delayed the reaction process and decreased the total 682
heat after 3 days while WB slightly reduced the total heat it didnrsquot significantly affect the 683
reaction process 684
- pH measurements in the present study confirmed the suitability of these mixture to low-685
pH applications as the increase in both the GGBS and ANH markedly decreased the initial 686
pH thereby lowering the pH at different ages 687
- The modelling and prediction of the response of other points in the experimental domain 688
were therefore possible Although the models are based on a given set of materials they 689
can be easily used to generate future results using other materials 690
- Dense microstructure was observed for mixes examined in this study C-S-H is the main 691
reaction product with presence of unreacted slag grains embedded well in the structure 692
However some micro voids were observed in mixes containing ANH which led to lower 693
compressive strength of mixes with ANH 694
CRediT authorship contribution statement 695
MSonebi and YBai did the conceptualization and the design of investigation as well as 696 performing the experiments MSonebi carried out the software analysis of the results and the 697
32
visualization MSonebi AAbdalqader T Fayyad and APerrot analysed the results and 698 wrote the original draft and reviewed and edited the final version 699
Declaration of Competing Interest 700
The authors declare that they have no known competing financial interests or personal 701 relationships that could have appeared to influence the work reported in this paper 702
Acknowledgments 703
The authors would like to express their gratitude to P McCann from QUB and N Collier 704 from Eden Nuclear and Environment Ltd for their helps for some experiments 705
706
References 707
1 Schneider M Romer M Tschudin M Bolio H (2011) Sustainable cement production-708 present and future Cement and Concrete Research 41642ndash650 709
httpsdoiorg101016jcemconres201103019 710
2 Madlool NA Saidur R Hossain MS Rahim NA (2011) A critical review on energy use 711 and savings in the cement industries Renewable and Sustainable Energy Reviews 712
152042ndash2060 httpsdoiorg101016jrser201101005 713
3 EN15743 (2015) BS EN 157432010+A12015 Supersulfated cement - Composition 714
specifications and conformity criteria BSI 715
4 Khatib JM Wright L Mangat PS (2016) Mechanical and physical properties of concrete 716
containing FGD waste Magazine of Concrete Research 68550ndash560 717 httpsdoiorg101680macr1500092 718
5 Khatib JM Mangat PS Wright L (2008) Sulfate resistance of mortar containing 719
simulated FGD waste Proceedings of Institution of Civil Engineers Construction 720 Materials 161119ndash128 httpsdoiorg101680coma20081613119 721
6 (2020) Specifying Sustainable Concrete 722
7 Hewlett PC (2004) Learsquos Chemistry of Cement and Concrete fourth edi Elsevier 723 Science amp Technology Books Oxford 724
8 Gruskovnjak A Lothenbach B Winnefeld F et al (2008) Hydration mechanisms of 725 super sulphated slag cement Cement and Concrete Research 38983ndash992 726
httpsdoiorg101016jcemconres200803004 727
9 Grounds T Nowell D V Wilburn FW (2003) Resistance of supersulfated cement to 728 strong sulfate solutions Journal of Thermal Analysis and Calorimetry 72181ndash190 729
httpsdoiorg101023A1023928021602 730
10 Grounds T Nowell D V Wilburn FW (1995) The influence of temperature and 731
different storage conditions on the stability of supersulphated cement Journal of 732 Thermal Analysis 45385ndash394 httpsdoiorg101007BF02548772 733
33
11 Bazalduacutea-Medelliacuten ME Fuentes AF Gorokhovsky A Escalante-Garciacutea JI (2015) Early 734 and late hydration of supersulphated cements of blast furnace slag with fluorgypsum 735 Materiales de Construccion 65e043 httpsdoiorg103989mc201506013 736
12 Matschei T Bellmann F Stark J (2005) Hydration behaviour of sulphate-activated slag 737 cements Advances in Cement Research 17167ndash178 738
httpsdoiorg101680adcr2005174167 739
13 Richardson IG (2000) Nature of the hydration products in hardened cement pastes 740 Cement and Concrete Composites 2297ndash113 httpsdoiorg101016S0958-741 9465(99)00036-0 742
14 Baux C Phelipot-Mardeleacute A Lanos C et al (2013) PERFORMANCES OF SUPER 743 SULFATED CEMENTS In International Conference on Concrete Under Severe 744 Conditions pp 1857ndash1870 745
15 Annabelle Phelipot-Mardeleacute Gabriel Samson Christophe Lanos (2015) Super sulfated 746 cement formulation and uses In Construction Materials ConMat Whistler Canada 747
16 Milestone NB (2006) Reactions in cement encapsulated nuclear wastes need for 748 toolbox of different cement types Advances in Applied Ceramics 10513ndash20 749
httpsdoiorg101179174367606X81678 750
17 Batchelor B (2006) Overview of waste stabilization with cement Waste Management 751
26689ndash698 httpsdoiorg101016JWASMAN200601020 752
18 Zhang T Cheeseman CR Vandeperre LJ (2011) Development of low pH cement 753
systems forming magnesium silicate hydrate (MSH) Cement and Concrete Research 754 41439ndash442 httpsdoiorg101016jcemconres201101016 755
19 Mobasher N Bernal SA Provis JL (2016) Structural evolution of an alkali sulfate 756
activated slag cement Journal of Nuclear Materials 46897ndash104 757 httpsdoiorg101016JJNUCMAT201511016 758
20 Wang J Yu B Gao Y (2014) Hydration Characteristics of Super Sulphated Cement 759 with Different Fineness In Proceedings of the International Conference on Material 760 and Environmental Engineering (ICMAEE 2014) Atlantis Press Paris France 761
21 Naumlgele E (1986) The Zeta-potential of cement Part II Effect of pH-value Cement and 762 Concrete Research 16853ndash863 httpsdoiorg1010160008-8846(86)90008-6 763
22 Jain N Civil MG-IJ of M and 2015 U (2015) Formulation of Sulphate Resistant Super 764 Sulphated Cement Using Fluorogypsum and Granulated Blast Furnace Slag IOSR 765
Journal of Mechanical and Civil Engineering (IOSR-JMCE) 12153ndash159 766
23 Gao YX Yu BY Xu FL (2012) Effect of Modified Phosphogypsum on the Mechanical 767 Properties of Super Sulphate Cement Applied Mechanics and Materials 161264ndash268 768 httpsdoiorg104028wwwscientificnetAMM161264 769
24 Kantro D (1980) Influence of Water-Reducing Admixtures on Properties of Cement 770 PasteampmdashA Miniature Slump Test Cement Concrete and Aggregates 295ndash102 771
httpsdoiorg101520CCA10190J 772
34
25 Svermova L Sonebi M Bartos PJM (2003) Influence of mix proportions on rheology of 773 cement grouts containing limestone powder Cement and Concrete Composites 25737ndash774 749 httpsdoiorg101016S0958-9465(02)00115-4 775
26 Sonebi M (2006) Rheological properties of grouts with viscosity modifying agents as 776 diutan gum and welan gum incorporating pulverised fly ash Cement and Concrete 777
Research 361609ndash1618 httpsdoiorg101016JCEMCONRES200605016 778
27 Nehdi M Rahman M (2004) Effect of Geometry and Surface Friction of Test Accessory 779 on Oscillatory Rheological Properties of Cement Pastes ACI Materials Journal 780 101416ndash424 httpsdoiorg101435913428 781
28 Khayat KH Yahia A (1997) Effect of Welan Gum-High-Range Water Reducer 782 Combinations on Rheology of Cement Grout ACI Materials Journal 94365ndash372 783 httpsdoiorg1014359321 784
29 Lombardi G (1985) THE ROLE OF COHESION IN CEMENT GROUTING OF 785 ROCK In Proceedings of Fifteenth Congress on Large Dams International 786 Commission on Large Dams pp 235ndash261 787
30 Perrot A Rangeard D Picandet V Meacutelinge Y (2013) Hydro-mechanical properties of 788
fresh cement pastes containing polycarboxylate superplasticizer Cement and Concrete 789 Research 53221ndash228 httpsdoiorg101016JCEMCONRES201306015 790
31 Perrot A Lecompte T Khelifi H et al (2012) Yield stress and bleeding of fresh cement 791 pastes Cement and Concrete Research 42937ndash944 792
httpdxdoiorg101016jcemconres201203015 793
32 Sonebi M Perrot A (2019) Effect of mix proportions on rheology and permeability of 794 cement grouts containing viscosity modifying admixture Construction and Building 795
Materials 212687ndash697 httpsdoiorg101016jconbuildmat201904022 796
33 Picandet V Rangeard D Perrot A Lecompte T (2011) Permeability measurement of 797
fresh cement paste Cement and Concrete Research 41330ndash338 798 httpsdoiorg101016JCEMCONRES201011019 799
34 Perrot A Rangeard D (2017) Effects of mix design parameters on consolidation 800
behaviour of fresh cement-based materials Materials and Structures 50117 801 httpsdoiorg101617s11527-016-0988-0 802
35 Rangeard D Perrot A Picandet V et al (2015) Determination of the consolidation 803 coefficient of low compressibility materials application to fresh cement-based 804
materials Materials and Structures 481475ndash1483 httpsdoiorg101617s11527-014-805 0247-1 806
36 Massoussi N Keita E Roussel N (2017) The heterogeneous nature of bleeding in 807 cement pastes Cement and Concrete Research 95108ndash116 808 httpsdoiorg101016JCEMCONRES201702012 809
37 Montgomery D (2007) Design and Analysis of Experiments Second Edition John 810
Wiley amp Sons 811
35
38 Roussel N Stefani C Leroy R (2005) From mini-cone test to Abrams cone test 812 Measurement of cement-based materials yield stress using slump tests Cement and 813 Concrete Research 35817ndash822 httpsdoiorg101016jcemconres200407032 814
39 Mangat PS Khatib JM Wright L (2006) Optimum utilisation of FGD waste in blended 815 binders Proceedings of Institution of Civil Engineers Construction Materials 159119ndash816
127 httpsdoiorg101680coma20061593119 817
40 Khatib JM Mangat PS Wright L (2013) Early age porosity and pore size distribution of 818 cement paste with flue gas desulphurisation (FGD) waste Journal of Civil Engineering 819 and Management 19622ndash627 httpsdoiorg103846139237302013793609 820
41 Collier NC Milestone NB Gordon LE Ko SC (2014) The suitability of a supersulfated 821 cement for nuclear waste immobilisation Journal of Nuclear Materials 452457ndash464 822 httpsdoiorg101016jjnucmat201405078 823
42 Masoudi R (2018) Examining compositions hydration mechanisms and properties of 824 supersulfated cement for use in concrete by Examining compositions hydration 825 mechanisms and properties of supersulfated cement for use in concrete University of 826 Toronto 827
828
9
34] I The water flow is computed by dividing the variation of the measured water mass flowing 232
out the samples by the elapsed time between two successive data sampling In this study value 233
of permeability at 1 and 30 minutes are taken and compared It corresponds to the initial and 234
final permeability of the mixes 235
The material compressibility is considered in a soils mechanics way [30 35] It corresponds to 236
the ratio of the variation of void ratio (liquidsolid volume ratio) to the variation of logarithm 237
of applied pressure between the initial and the final state of the induced bleeding test It 238
provides the equilibrium state of the sample under a given applied pressure and is valid for 239
both homogeneous and heterogeneous bleeding [36] 240
It is worth noting that the computed permeability describes homogeneous bleeding kinetics 241
while compressibility describes the amplitude of the bleeding phenomenon 242
Heat of hydration was evaluated by isothermal calorimetry with an eight-channel heat 243
conduction calorimeter maintained at 22degC This equipment measures heat evolved by 244
comparing the temperatures of a grout sample and an inert reference which are both held under 245
isothermal conditions The heat flow results are recorded as a function of time CEM I GGBS 246
and ANH were blended manually for 30 s After the addition of water the grout was blended 247
10 s by hand and then an additional 50 s mechanically Polyethylene ampoules were filled with 248
approximately 6 g of each grout and the experiments were conducted for at least 72 h 249
The compressive strength of the grout was determined by crushing three cubes of 50 mm size 250
After casting the samples were covered with a polymer sheet (a cling film) to limit evaporation 251
of water and stored in a conditioning room at 20 plusmn 2 degC for 24 plusmn 05 hours Afterwards cubes 252
were demoulded and placed in water at 20 plusmn 1 degC until tested at 1 3 7 and 28days 253
In order to perform the pH test a powder sample of the hardened mixes was required The test 254
was performed on 1 7 and 28 day samples As mixes 9-12 are of identical composition the 255
reason is explained later in 41 derived statistical model tests were only performed on sample 256
10 To get the powder with a fineness of 65μm the samples were firstly drained of the acetone 257
To remove any remaining acetone they were placed in a vacuum desiccator The pieces were 258
then ground using a mortar and pestle passed through a 65 μm sieve placed in sample bags 259
and returned to the desiccator The samples had then to be mixed with distilled water to enable 260
the pH test to be performed A 110 ratio of cement to water was used and mixed for 24 hours 261
using a rotating machine To get the pH reading the samples were put into a centrifuge machine 262
to separate the solid and liquid At this stage the solution should have a pH equivalent to cement 263
10
it was mixed with To get a pH reading for the samples a pH device was used where a probe 264
is placed in the solution The machine was calibrated with three buffer solutions of 7 10 and 265
13 pH levels before measuring the pH of the samples 266
SEM (scanning electron microscopy) was carried out using a JEOL JSM6400 on flat fractured 267
surface specimens obtained from compression testing at 7-day samples Prior to SEM testing 268
the samples were mounted onto metal stubs using carbon paste and coated with gold film to 269
ensure good conductivity The accelerated voltage was set at 20 kV 270
22 Statistical Design and Modelling of Experiments 271
The technique of analysis used in this study was a 2k factorial experimental design [37] to 272
evaluate the influence of two different levels (maximum and minimum) for each variable on 273
the relevant grout properties Three key parameters (WB ANH GGBS) that should have 274
significant influence on mix characteristics of supersulfated cements were selected to formulate 275
the mathematical models for evaluating relevant properties (ie k = 3 in this study thus the 276
total mixes for the factorial design was 23 = 8) Additionally a mix at the central point was 277
replicated four times to estimate the experimental error and improve the reliability of the 278
models The coding and levels of the variables (WB and dosages of GGBS and ANH) are 279
given Table 2 280
The statistical models are valid for supersulfated grout (SSC) mixes made with WB GGBS 281
and ANH in the ranges of 034 to 044 60 to 80 and 0 to 20 respectively The modelled 282
experimental region consisted of mixtures ranging from coded variables of ndash1 to +1 The coded 283
factors for variables were calculated by 284
Coded Factor = (Actual value-Factor means)[Range of factor value2] (2) 285
Hence 286
Coded WB = (Actual WB ndash 039)005 287
Coded GGBS = (Actual GGBS ndash 07)01 288
Coded Anhydrite = (Actual ANH ndash 01)01 289
The responses modelled were mini-slump plate cohesion Marsh cone yield stress plastic 290
viscosity induced bleeding at 1 min 5 and 30 mins permeability at 1 min and 30 mins 291
compressibility and compressive strength at 1 3 7 and 28 days The general model associated 292
11
with the two-level factorial design incorporating three independent variables (WB GGBS 293
ANH) is expressed by 294
Y1 = a0 + a1WB + a2GGBS + a3ANH+ a4WBGGBS + a5WBANH + a6GGBSANH 295
+ a7WBGGBSANH + ε (3) 296
where 297
Y1 Response (mini slump marsh cone plate cohesion etc) 298
a0 Overall mean factor effect 299
a1-a7 Regression coefficients representing model constants (contribution of independent 300
variables and their interaction to each response) 301
a1WB a2GGBS a3ANH Linear effect of factors WB GGBS and ANH 302
a4WBGGBS a5WBANH a6GGBSANH a7WBGGBSANH Interaction effects of 303
factors WB GGBS and ANH 304
ε Random error term representing the effects of uncontrolled variables 305
Analysis of variance (ANOVA) was used to test the significance of regression models and t-306
tests were performed to identify the non-significant (NS) variables and second order 307
interactions which were subsequently eliminated from the derived models Model coefficients 308
were determined using multi-linear regression analysis based on a normal distribution 309
assumption The error was assumed to be random and normally distributed so the residual 310
terms which represent the difference between the actual and predicted values should exhibit 311
similar properties [37] The probability value (Prob) obtained from ANOVA determines the 312
statistical significance of each factor and their interactions For most of the parameters the 313
probability that the derived coefficients associated with the various variables influencing each 314
response were limited to 10 This signifies that there is less than 10 chance or 90 315
confidence limit that the contribution of a given parameter to the tested response exceeds the 316
value of the specified coefficient A negative estimate indicates that an increase of the given 317
parameter results in a reduction of the measured response 318
12
3 Results and discussion 319
The results of the experimental work characterize the behaviour of the mortars with different 320
WB ANH and GGBS levels Table 3 summarises all results of the experimental work 321
performed The results were used to construct the regression models 322
Table 3 Average results from experimental work 323 324
Viscometer Induced bleeding
Mix Mini-
slump
Flow
time
Cohesion
meter
Yield
value
Plastic
viscosity
1min 5min 30min
(mm) (s) (mm) (Pa) (Pas) (mL) (mL) (mL)
1 61 230 105 191 0923 220 470 480
2 89 25 55 97 0323 290 780 810
3 67 200 118 172 0802 280 580 605
4 111 12 20 80 0199 490 860 860
5 52 360 143 251 1203 280 520 540
6 83 69 86 99 0403 360 700 700
7 60 250 125 211 0980 310 580 590
8 110 13 40 77 0224 350 910 950
9 71 150 87 101 0617 370 720 730
10 73 102 122 106 0681 290 620 620
11
12
77
74
192
83
89
110
124
101
0660
0641
290
350
640
715
645
720
325
Table 3 Average results from experimental work (continued) 326
Mix Permeability Permeability Compre-
ssibility
Compressive strength
1 min 30 min fc 1d fc 3d fc 7d fc 28d
(ms) (ms) (MPa) (MPa) (MPa) (MPa)
1 216E-09 317E-09 0155 299 506 581 704
2 512E-08 418E-09 0298 168 383 547 558
3 448E-08 366E-09 0194 213 334 406 527
4 374E-08 425E-09 0312 140 223 256 408
5 448E-08 342E-09 0173 233 434 507 535
6 512E-08 395E-09 0255 136 371 371 448
7 440E-08 361E-09 0187 108 232 343 532
8 451E-08 433E-09 0342 68 200 263 473
9 446E-08 402E-09 0250 196 328 398 592
10 468E-08 371E-09 0212 171 232 361 556
11
12
423E-08
516E-08
379E-09
400E-09
0221
0246
207
183
313
301
451
435
565
520
327
The derived quadratic statistical models of grout for mini-slump flow time cohesion plate 328
yield stress plastic viscosity induced bleeding at 1 min 5 min and 30 min permeability at 1 329
13
min and 30 min compressibility and compressive strength at 1 3 7 and 28 days are given in 330
Equations (4) to (18) where WB GGBS and ANH are given in codes values 331
Mini-Slump (mm) = 7881 + 1919 WB + 781 ANH + 444 WBANH - 294 GGBS (4) 332
333
Marsh flow time (s) = 1404 - 1153 WB ndash 261 ANH + 281 GGBS (5) 334
335
Plate Cohesion meter (microm) = 86 - 366 WB + 122 GGBS - 107 ANH - 091 WBANH (6) 336
337
Yield Value (Pa) = 1466 ndash 584 WB - 126 WBGGBS - 125 ANH + 124 GGBS (7) 338
339
Plastic Viscosity (Pas) = 063 - 034 WB - 0078 ANH + 0073 GGBS 340
- 0047 WBGGBS - 0022 ANHGGBS (8) 341
342
Induced Bleeding at 1 min (ml) = 3225 + 50 WB + 35 ANH ndash 225 WBANHGGBS (9) 343
344
Induced Bleeding at 5 mins (ml) = 675 + 1375 WB + 575 ANH (10) 345
346
Induced Bleeding at 30 mins (ml) = 6919 + 1381 WB + 594 ANH (11) 347
348
Permeability at 1 min (ms) x 10-8 = 4 + 0615 WB + 0621 AHN ndash 0773 WBGGBS 349
- 0426WBAHN - 0446 AHNGGBS (12) 350
351
Permeability at 30 min (ms) x 10-8 = 0382 + 0035 WB + 0014 ANH 352
+ 0008 WBANHGGBS (13) 353
354
Compressibility = 02396 + 00623 WB + 00194 ANH + 00012 WBANHGGBS (14) 355
356
ƒc 1 d (MPa) = 1705 - 426 WB - 384 ANH - 343 GGBS + 145 WBANH (15) 357
358
ƒc 3 d (MPa) = 3215 - 879 ANH - 412 WB ndash 261 GGBS (16) 359
360
ƒc 7 d (MPa) = 4092ndash 924 ANH - 5 WB - 383 GGBS (17) 361
362
14
ƒc 28 d (MPa) = 5348 - 515 WB - 382 ANH ndash 262 GGBS + 436 ANHGGBS (18) 363
364
The correlation coefficient of most of the proposed models were higher than 090 except for 365
plastic viscosity compressive strength after 3days and compressive strength after 28days 366
which have coefficients of 070 086 and 087 respectively 367
Table 4 shows the average measured responses of the four replicate grouts the coefficients of 368
variation (COV) as well as the estimated errors with a 90 confidence limit for each of the 369
measured properties The estimated error levels for mini-slump plate cohesion meter Marsh 370
cone yield stress plastic viscosity induced bleeding at 1 min 5 min and 30 mins permeability 371
at 1 min and 30 min compressibility and compressive strengths at 1 3 7 28 days were plusmn 22 372
mm plusmn 0001mm plusmn 40 s plusmn 09 Pa plusmn 002 Pa s plusmn 28 ml plusmn 42 ml plusmn 45 ml plusmn 32x10-9 (ms) 373
plusmn 13x10-10 (ms) plusmn 00153 plusmn 13 MPa plusmn 35 MPa plusmn 33 MPa and plusmn 25 MPa respectively 374
The relative experimental errors for mini-slump plate cohesion meter Marsh cone yiled stress 375
plastic viscosity induced bleeding permeability compressibility compressive strengths were 376
limited to 3-11 On the other hand relative error for march cone was up to 30 377
Table 4 Repeatability of test parameters at the central point 378
379
Tests Mini-
slump
Plate
cohesion
Marsh
cone
Yield
stress
Plastic
viscosit
y
Induced
bleeding
at 1 min
Induced
bleedin
g at 5
min
Induced
bleeding
at 30
min
Mean (n=4) 736
mm
001
mm
1318
s
108
Pa
065
Pa s
325
ml
674
ml
679
ml
Coefficient
of variation
()
37 115 372 105 42 127 76 80
Estimate
error (90
confidence
limit)
22
mm
0001
mm
402
s
09
Pa
002
Pa s
28
ml
42
ml
45
ml
380
381 Table 4 Repeatability of test parameters at the central point (continued) 382
383
Tests
Permeability
1 min
x10-8
Permeability
30 min
x10-8
Compressibility frsquoc 1d frsquoc 3d frsquoc 7d frsquoc 28d
Mean (n=4) 463
ms
0388
ms 02323
189
MPa
293
MPa
411
MPa
558
MPa
Coefficient
of variation
()
85 39 8 84 144 98 53
15
Estimate
error (90
confidence
limit)
032
(ms)
0013
(ms)
00153
13
MPa
35
MPa
33
MPa
24
MPa
384
385
31 Accuracy of the established models 386
387
The ratio of predicted-to-measured properties for grout ranged between 087 and 115 388
indicating good accuracy for prediction of mini-slump plate cohesion induced bleeding at 1 389
min 5 mins and 30 mins yield stress plastic viscosity and compressive strength at 1-d 3-d 7-390
d and 28-d In general the proposed models for mini-slump plate cohesion Marsh cone and 391
compressive strength appeared to be accurate in predicting fluidity cohesivity induced 392
bleeding permeability at 30 min compressibility and compressive strength with low scatter 393
between measured and predicted values However the average values of predictedmeasured 394
ratio of yield values were slightly higher (074) 395
396
32 Isoresponses of the proposed models 397
398
The isoresponse surfaces and contour plots for mini-slump plate cohesion Marsh cone yield 399
stress plastic viscosity induced bleeding at 1 min 5 mins and 30 mins permeability at 1 min 400
and 30 mins compressibility and compressive strength at 1-d 3-d 7-d and 28-d were obtained 401
by using response surface methodology (RSM) The isoresponse surfaces and contour plots 402
were obtained from the regression models and because the models contained interaction and 403
second-order variables the contour lines were curved 404
The proposed statistical models can therefore be used to evaluate the effect of a group of 405
variables on the properties affecting the quality of supersulfated grout This allowed for the 406
calculation of isoresponse surfaces from the parameters under study outside the experimental 407
domain and the optimisation of their effects The next sections will discuss the results of each 408
experiment separately 409
331 Mini-slump 410
As shown in Eq 4 the mini-slump is influenced in order of significance by WB ratio 411
anhydrite proportion interaction of WB and ANH and the percentage of GGBS content The 412
WB ratio had the greatest effect on fluidity due to better lubrication of the particles in the paste 413
16
[29] The mini-slump test was accompanied by very low shear The value of mini-slump is to 414
characterise yield stress [38] therefore higher mini-slump value indicated a lower yield stress 415
The effect of WB on the increase of mini-slump was two and half-time than that of ANH (192 416
vs 781 in Eq 4) However increased ANH resulted in a 27 times greater increase in mini-417
slump than reduced GGBS (781 vs -294 in Eq 4) Figure 1(a) shows the effect of increased 418
WB on mini-slump vs ANH (when GGBS was kept constant at 70) and Figure 1(b) shows 419
GGBS vs ANH (when WB was fixed at 039) Based on these figures it is evident that mini-420
slump increased significantly when the dosage of WB and ANH increased 421
422
(a) (b) 423
Fig 1 Isoresponse curves of mini-slump (mm) (a) WB vs ANH and (b) GGBS vs ANH 424
425
332 Marsh cone 426
The time needed for a grout sample to flow through the Marsh cone is proportional to the 427
viscosity of the cement grout the flow time becomes an index of fluidity so the longer the 428
flow time the lower the fluidity Similar to the previous trends Eq 5 shows that the values of 429
Marsh cone are influenced in order of significance by WB GGBS and ANH This is 430
graphically illustrated in Figure 2 431
GGBS = 70
034 039 042 044
0
5
10
15
20
WB
AN
H (
)
65
74
83
92
101
037
AN
H(
)
WB = 039
60 65 70 75 80
0
5
10
15
20
GGBS()
70
75
80
85
17
432
(a) (b) 433
Fig 2 Isoresponse curves for flow time (s) (a) WB vs ANH and (b) GGBS vs ANH 434
435
It can be noted that an increase in WB and ANH or a reduction in GGBS led to decreasing 436
the Marsh cone flow time For example at fixed WB at 039 and GGBS of 70 respectively 437
the increase in ANH dosage from 5 to 20 led to a marked reduction of the Marsh cone flow 438
time from 170 to 140 s (Figure 2(a)) This behaviour is attributed to the change in plastic 439
viscosity of the grout as will be discussed later 440
333 Cohesion plate 441
As shown in Eq 6 the cohesion plate was influenced in order of magnitude by the WB and 442
the percentage of GGBS and ANH The increasing WB had a 34 times the influence on the 443
reduction of the cohesion plate test results as the increased ANH (for a GGBS constant) By 444
comparing the effects of WB and GGBS on plate cohesion the increased WB can be 445
interpreted as having approximately a 3 times greater influence on the reduction of plate 446
cohesion values than the increase in GGBS (-366 vs 122 in Eq 6) given that ANH is held 447
constant The effect of an increase in WB from 034 to 044 and ANH from 0 to 20 with a 448
fixed GGBS dosage of 70 is presented in Figure 3(a) Increased WB led to a decreased 449
cohesion plate value Conversely an increase in GGBS increased the cohesion plate value and 450
an increased ANH caused a reduction in cohesion plate (Figure 3(b)) 451
GGBS = 70
034 036 039 042 0440
5
10
15
20
WB
AN
H (
)
40
6080
100120
140160
180200
220
WB = 039
60 65 70 75 80
0
5
10
15
20
GGBS ()
AN
H (
)
100
120
140
160
180
18
452
(a) (b) 453
Fig 3 Isoresponse curves for plate cohesion meter (a) WB vs ANH and (b) GGBS vs 454 ANH 455
334 Yield stress 456
As shown in Eq 7 yield value was influenced in order of magnitude by WB and dosages of 457
ANH and GGBS Based on Figure 4 (a) when WB was fixed at 039 GGBS maintained at 458
70 and ANH increased to 5 the isoresponse curve showed a yield value of 15 Pa On the 459
other hand if the proportion of ANH was further increased to 20 while GBBS was 460
maintained at 70 the yield value decreased to 135 Pa This corresponds with Eq (7) in 461
which the proportion of WB and ANH were increased while GGBS was kept constant 462
resulting in a reduction in yield stress An increase in GGBS content resulted in an increase of 463
the yield stress 464
Figure 4 (b) shows the isoresponse curve of the yield value with a fixed proportion of GGBS 465
at 70 When WB was 039 and ANH was 5 the isoresponse of the predicted yield value 466
was 155 Pa If ANH was increased to 20 while maintaining WB at 039 the isoresponse of 467
the yield value was 135 Pa 468
It can be interesting to note that the observed results for the yield stress are closed to the one 469
observed with the cohesion plate and mini-slump tests This is expected as yield stress values 470
can be derived from those two simple tests 471
GGBS = 70
034 037 039 042 0440
5
10
15
20
WB
AN
H(
)
45
55
65
7585
95
105
115
WB = 039
60 65 70 75 800
5
10
15
20
GGBS ()
AN
H(
)
75
85
95
105
19
472
(a) (b) 473
Fig 4 Isoresponse curves for yield stress (Pa) (a) WB vs ANH and (b) GGBS vs ANH 474
335 Plastic viscosity 475
Plastic viscosity was influenced in order of magnitude by WB and the dosages of ANH and 476
GGBS ANH and GGBS had almost opposite effects on plastic viscosity (-0078 vs 0073 in 477
Eq 8) As shown in Eq (8) increased WB had the greatest primary effect on plastic viscosity 478
(034 vs 0078 and 0073) The increased WB had approximately a 44 times greater influence 479
on reducing plastic viscosity than increased ANH or decreased GGBS 480
In the isoresponse curve of plastic viscosity shown in Figure 5 (a) when GGBS was fixed at 481
70 WB set at 039 and ANH maintained at 5 the predicted plastic viscosity value was 482
068 Pas On the other hand if the dosage of ANHB was increased to 20 while maintaining 483
a similar WB the plastic viscosity was reduced to 055 Pas 484
In Figure 5 (b) WB was fixed at 039 when GGBS was held at 70 and ANH at 5 the 485
predicted plastic viscosity was 067 Pas However when ANH was increased to 20 and 486
GGBS was maintained at 70 the predicted plastic viscosity dropped to 055 Pas 487
AN
H(
)
GGBS = 70
034 037 039 042 044
0
5
10
15
20
WB
1012
1416
18
20
WB = 039
60 65 70 75 800
5
10
15
20
GGBS ()
AN
H(
)
13
14
15
20
488
(a) (b) 489
Fig 5 Isoresponse curve for plastic viscosity (Pas) (a) WB vs ANH and (b) GGBS vs 490
ANH 491
336 Induced bleeding 492
The induced bleeding equations for 1 and 5 minutes (Eqs 9 10) and 30 minutes (Eq 11) are 493
very similar The two influencing factors of induced bleeding are WB ratio and anhydrite 494
WB ratio has the greatest effect over two times the effect of anhydrite content Figure 6 shows 495
the isoresponse for bleeding versus the WB ratio for a fixed value of GGBS at 70 It can be 496
seen that when an anhydrite value is selected and the WB ratio is increased the bleeding will 497
also increase Similarly if a WB ratio is selected and the anhydrite content is increased the 498
bleeding will again increase 499
500
GGBS = 70
034 037 039 042 0440
5
10
15
20
WB
AN
H(
)
035
045
055
065
075
085
095
WB = 039
60 65 70 75 800
5
10
15
20
GGBS ()
AN
H(
)
055
060
065
075
034 036 039 042 044
0
5
10
15
20
WB
AN
H (
)
26
28
30
3234
36
38
40
GGBS=70
21
(a) 501
502
(b) (c) 503
Fig 6 Isoresponse curves for induced bleeding at 1 5 and 30 min WB vs ANH 504
337 Permeability 505
Figure 7 (a) and (b) showed firstly that the permeability decreased significantly from 1 min to 506
30 min Permeability at 1 min was influenced in order of magnitude by WB and the dosage 507
of ANH All interactions between 3 parameters had almost opposite effects on permeability 508
(Eq 12) As shown in Eq (12) increased WB and AHN had the greatest primary effect on 509
permeability at 1 min It seems there is an optimum reached at WB = 40 and AHN at 17 510
Similarly the permeability at 30 min is affected in order of significance by WB followed by 511
ANH (Eq 13) In Figure 7 (b) WB was fixed at 039 when GGBS was held at 70 and ANH 512
at 10 the predicted permeability was 038 x 10-8 (ms) However when ANH was increased 513
to 20 and GGBS was maintained at 70 the predicted permeability increased to 040x10-8 514
(ms) 515
516
GGBS = 70
034 036 039 042 0440
5
10
15
20
WB
AN
H (
)
545
61
675
74
805
GGBS = 70
034 036 039 042 0440
5
10
15
20
WB
AN
H (
)
56
60
64
68
72
7680
84
22
517
(a) (b) 518
Fig 7 Isoresponse curves for permeability at 1 and 30 min WB vs ANH 519
338 Compressibility 520
As shown in Eq (14) the compressibility was influenced in order of magnitude by the WB 521
and the percentage of ANH The interaction between 3 parameters affected also the 522
compressibility The increasing WB had a 32 times the influence on the increase of the 523
compressibility results as the increased ANH (for a GGBS constant) The effect of an increase 524
in WB from 034 to 044 and ANH from 0 to 20 with a fixed GGBS dosage of 70 is 525
presented in Figure 8 Increased WB led to an increase of compressibility Similarly an 526
increase in AHN increased the compressibility 527
528
Fig 8 Isoresponse curves for compressibility WB vs ANH 529
034 036 039 042 044
0
5
10
15
20
GGBS = 70 WB
AN
H (
)
3
35
4
4
45
5
034 036 039 042 044
0
5
10
15
20
WB
AN
H (
)
034
035
036 037 038 039 04
041
042
4
GGBS=70
034 036 039 042 044
0
5
10
15
20
WB
AN
H (
)
017
019
021 023 025 027
029
031
GGBS=70
23
530
339 Compressive strength 531
After one day from Eq 15 the influencing factors in order of significance are WB ratio 532
anhydrite content GGBS content and the interaction of WB and ANH The effect of the first 533
three was similar but WB had 11 times greater effect than anhydrite and 125 times greater 534
effect than GGBS While the interaction of WB and anhydrite had around a third of the 535
influence of WB Figures 9 (a) and (b) show the isoresponses for 1-day compressive strength 536
From Figure 9 (a) it can be seen when the GGBS content is fixed at 70 for a given anhydrite 537
content increasing the WB ratio will decrease the strength Also if a WB ratio is selected and 538
the anhydrite is increased similarly the strength will decrease From Figure 9 (b) with the WB 539
ratio fixed at 039 once again an increase in GGBS led to a reduction of compressive strength 540
at 1 day 541
542
(a) (b) 543
Fig9 Isoresponse curves for compressive strength at 1d (a) (WB vs ANH) and (b) (GGBS 544 vs ANH) 545
Eqs 16 17 and 18 show the effect of GGBS and ANH percentages on compressive strength at 546
3-d 7-d and 28-d Figures 10 11 and 12 show the isoresponse of the compressive strength at 547
3-d 7-d and 28-d respectively with WB vs ANH Increased ANH led to a decrease of 3-d 548
and 7-d compressive strength As expected an Increase in WB led to a decrease in compressive 549
strength The percentage of ANH had a negative effect on compressive strength and showed a 550
greater influence particularly at 3-d and 7-d (879 (3 d) amp 924 (7d) vs 382 (28 d)) GGBS has 551
a negative impact on early strength development The negative effect of GGBS on compressive 552
GGBS = 70
034 037 039 042 0440
5
10
15
20
WB
AN
H(
)
12
14
16
18
20
22
2426
WB = 039
60 65 70 75 800
5
10
15
20
GGBS ()
AN
H(
)
10
12
14
16
18
20
22
24
strength at early ages is clearly attributable to the fact that up to 80 of cement has been 553
replaced by GGBS and it takes some time for GGBS to start developing its pozzolanic action 554
at a noticeable level The results indicate that ANH content influences strength to a greater 555
extent than GGBS at all ages The SO3 content was reported to have great influence on the 556
strength [39 40] 557
558
(a) (b) 559
Fig10 Isoresponse curves for compressive strength at 3d (a) (WB vs ANH) and (b) 560 (GGBS vs ANH) 561
562
563
(a) (b) 564
Fig11 Isoresponse curves for compressive strength at 7d (a) (WB vs ANH) and (b) (WB 565 vs ANH) 566
567
GGBS = 70
034 036 039 042 0440
5
10
15
20
WB
AN
H (
)
24
2628
30
3234
3638
4042
WB = 039
60 65 70 75 80
0
5
10
15
20
GGBS ()
AN
H (
)
2426
2830
32
34
36
3840
42
GGBS = 70
034 037 039 042 044
0
5
10
15
20
WB
AN
H(
)
3032
34
3638
40
42
44
46
48
WB = 039
60 65 70 75 80
0
5
10
15
20
GGBS ()
AN
H(
)
32
34
36
38
40
42
44
46
48
25
568
(a) (b) 569
Fig12 Isoresponse curves for compressive strength at 28d (a) (WB vs ANH) and (b) 570
(ANH vs GGBS) 571
3310 Discussion of the effect of WB GGBS and ANH 572
As expected the increase of WB led to an increase in mini-slump induced bleeding and a 573
reduction in flow time plate cohesion yield stress plastic viscosity and compressive strengths 574
This can be attributed to more water in the system 575
An increase in GGBS content resulted in a reduction of the flow time plate cohesion yield 576
stress and plastic viscosity while the fluidity is improved This was due to the fact the specific 577
gravity of slag is lower than that of PC leading to an increase in the paste volume and thus 578
improving the fluidity of paste 579
In case of an increase of ANH proportion while WB and GGBS were kept constant it led to 580
an increased mini-slump and induced bleeding while the flow time plate cohesion yield stress 581
and plastic viscosity were reduced This was due to the lower reactivity of ANH resulting in an 582
increase of water needed for lubrication of paste 583
As expected an increase in WB lead to an increase in induced bleeding permeability and a 584
decrease in compressibility [33 35] This is due to the increase in liquid volume between the 585
particles and to the reduction in the amount of interparticle forces Globally the compressibility 586
decreases and the permeability increases with ANH It can be explained by the reduced specific 587
area and lower reactivity that can lead to more available water in the samples 588
3311 Heat of Hydration 589
Heat of hydration is considered an important factor in the cement design as low heat of 590
hydration reduces the effect of thermal cracking The heat flow results of the calorimeter test 591
performed over a three days period can be seen in Figure 13 592
GGBS = 70
034 036 039 042 0440
5
10
15
20
WB
AN
H (
)
46
48
50
52
54
56
58
60
WB = 039
0 5 10 15 2060
65
70
75
80
ANH ()
GG
BS
(
)
50
52
54
56
5860
62
26
593
Fig 13 Heat flow graphs for first 3 days of reaction 594
Figure 13 presents that the largest peaks were in mixes 1 2 5 and 6 This shows that these 595
reactions generated the most heat and that they were quick Mixes 1 and 2 have the highest 596
OPC content at 40 and this suggests that to lower the heat of the reaction minimal OPC 597
should be used This is confirmed by the fact that mixes 5 and 6 have the next highest OPC 598
contents the same percentage as mixes 3 4 and 9 (one of the repeated mixes) which have 599
anhydrite present This implies that the presence of anhydrite will lengthen the reaction process 600
and reduce the heat produced during setting significantly The graph shows this by the absence 601
of a sharp peak instead a gentle curved hump is shown over a 2-day period whereas the mixes 602
showing a sharp peak occur after about 12 hrs Mix 7 which has the same solids content as 603
mix 8 but a lower WB ratio and no cement present showed the lowest heat flow during the 604
hydration process 605
Figure 14 shows the cumulative heat generation during the first 3 days of setting It is clear that 606
the two mixes (1 and 2) with highest cement content and absence of anhydrite had the highest 607
cumulative heat development over the 3-day period 643J and 594J respectively Mixes 3456 608
and 9 which all have 20 OPC content generated similar heat value over the 3 days Results 609
of mixes containing ANH implies that over the period that the anhydrite did not reduce the 610
cumulative heat generated but slowed the reaction and reduce the peak heat generated The 611
0
0002
0004
0006
0008
001
0012
0 50000 100000 150000 200000 250000 300000
He
at F
low
(mW
)
Time s()
M1
M2
M3
M4
M5
M6
M7
M9
1Day
2Day
3day
1d 2d 3d
27
graphs also suggest that a higher WB ratio produced a lower cumulative and peak heat 612
generation613
614
Fig 14 Cumulative heat generation curves for first 3 days 615
3312 pH measurements 616
Fig 15 summarises the results of pH and the nine mixes with different compositions of WB 617
the percentages of cement GGBS and ANH It is shown that Supersulfated cements (SSCs) 618
have lower pH values (lt 125 at all ages) than PC which has a pH of 139 [41] making SSC 619
more preferable in essential applications such as nuclear waste encapsulation 620
The figure shows that the pH value decreased with time for all samples between 1 and 7 days 621
Similar trend was observed in the majority of mixes between 7 and 28 days except for sample 622
2 5 and 9 which showed slight increase in the pH values This decrease refers to the 623
consumption of ions in the pore structure due to the hydration process 624
0
100
200
300
400
500
600
700
800
0 50000 100000 150000 200000 250000 300000
(J)
Time (s)
M1
M2
M3
M4
M5
M6
M7
M9
1 Day
3 Day
2 day
1d 2d 3d
1
2
3
9
45
6
7
28
625
626 Fig 15 Summary of pore solution pH 627
628
The incorporation of ANH replacing the Portland cement (C) results in remarkable decrease in 629
pH at all ages as introducing the ANH reduced the lower initial pH Likewise the increase in 630
the content of GGBS led to a decrease in the pH value of the pore structure as GGBS has lower 631
initial pH than Portland cement The increase of WB ratio decreased the pH value This is in 632
agreement with Collier [41] who found that increasing the wb ratio from 05 to 06 increased 633
the pH by I unit This was attributed to the increased availability of water in the case of WB 634
of 06 allowing hydration of more cement powder thereby releasing more hydroxide anions 635
into solution However in this study the WB ratio did not show a significant effect on 636
lowering the pH These results are in agreement with [42] which also found that decreasing the 637
pH improved the bulk resistivity of SSC mixtures 638
3313 SEM 639
Figure 16 shows the SEM images of some mixes at various magnifications The images clearly 640
show the dense and compact structure of the cement after seven days The dense structure was 641
another requirement from the cement chosen to enclose the waste to prevent leaching The 642
microstructure consists mainly of C-S-H the main hydration product and unhydrated slag 643
grains C-S-H is formed after the dissolution of slag grains when contacting the water and 644
alkalis and then the ionic species saturate the solution and then precipitate as hydrated phases 645
[8] There were abundant grains of hydrated and partially hydrated slag grains some small 646
1080
1100
1120
1140
1160
1180
1200
1220
1240
1260
1280
1 2 3 4 5 6 7 8 9
pH
val
ue
Mix Number
1 Day
7 Days
28 Days
29
GGBS particles presented rims of reaction products (eg Mix 6-Figure 16 (f) and Mix 9-Figure 647
16 (h)) It was found by [11] that the composition of the reaction rims around slag was similar 648
to that of the C-S-H from PC However [12] found that in the CndashSndashH of SSC is apparently 649
more foil like which is different than the fibrillar morphology of C-S-H in OPC Mix 3 and 650
Mix 4 (Figure 16 (c) and (d) respectively) exhibits more micro voids in the micrsostructure 651
which could explain the low strength of these mixes compared to mix 1 and 2 Ettringite was 652
not detected Ettringite is not the most abundant phase and it is not easy to detect in dried 653
polished samples because it is easily decomposed under the drying conditions of the vacuum 654
of the microscope column [11] 655
(a) Mix 1 image at 1100 magnification (b) Mix 2 image at 900 magnification
(c) Particle of unreacted slag mix3 7 days (d) An overall image of mix 4 at 7days
showing CSH and BFS particles
30
(e) Mix 5 image at 1100 magnification (f) Mix 6 image at 2300 magnification
(g) Mix 7 image at 2000 magnification (h) Mix 9 image at 2700 magnification
Fig 16 SEM results 656
4 Conclusions 657
The paper focused on optimizing the SSC cement grout in order to get the best of it The effect 658
of GGBS WB and ANH dosages on the grout fluidity rheological properties induced 659
bleeding maximum heat of hydration and compressive strength was investigated using 660
factorial design approach and analysis The models derived in this study are valid for the 661
experimental area corresponding to grout mixes made with variable levels of WB ANH and 662
GGBS in the ranges of 034 to 044 0 to 20 by mass of binder 60 to 80 by mass of 663
binder respectively Based on the results from this study the following conclusions are drawn 664
- In comparison to GGBS and ANH WB ratio had more pronounced effects on the 665
results of mini-slump plate cohesion meter Marsh cone time yield stress plastic viscosity 666
induced bleeding permeability compressibility and compressive strength 667
31
- The increase in the dosage of GGBS led to an increase in the values of plate cohesion 668
meter Marsh cone time yield stress and plastic viscosity while reducing the mini-slump 669
values maximum hydration and compressive strength This is ascribed to the fine nature 670
of GGBS particles and pozzolanic effect 671
- While the ANH particles caused a decrease in the maximum of heat of hydration it 672
increased the induced bleeding permeability and compressibility due to its dominant effect 673
on increasing the dormant period and increasing the rates of solid sedimentation and 674
induced bleeding water 675
- Increasing the dosage of ANH in grout reduced the hydrations kinetic at early-age and 676
thus reduced the compressive strength at 1d 3d and 7d However this effect diminished 677
at later ages at 28 d in a manner similar to increasing WB 678
- The increase in the dosage of ANH led to an increase in the mini-slump values 679
(fluidity) but a decrease in the values of yield stress plastic viscosity plate cohesion and 680
Marsh cone time This is attributed to better deflocculation of particles at the fresh state 681
- The increase of GGBS percentage delayed the reaction process and decreased the total 682
heat after 3 days while WB slightly reduced the total heat it didnrsquot significantly affect the 683
reaction process 684
- pH measurements in the present study confirmed the suitability of these mixture to low-685
pH applications as the increase in both the GGBS and ANH markedly decreased the initial 686
pH thereby lowering the pH at different ages 687
- The modelling and prediction of the response of other points in the experimental domain 688
were therefore possible Although the models are based on a given set of materials they 689
can be easily used to generate future results using other materials 690
- Dense microstructure was observed for mixes examined in this study C-S-H is the main 691
reaction product with presence of unreacted slag grains embedded well in the structure 692
However some micro voids were observed in mixes containing ANH which led to lower 693
compressive strength of mixes with ANH 694
CRediT authorship contribution statement 695
MSonebi and YBai did the conceptualization and the design of investigation as well as 696 performing the experiments MSonebi carried out the software analysis of the results and the 697
32
visualization MSonebi AAbdalqader T Fayyad and APerrot analysed the results and 698 wrote the original draft and reviewed and edited the final version 699
Declaration of Competing Interest 700
The authors declare that they have no known competing financial interests or personal 701 relationships that could have appeared to influence the work reported in this paper 702
Acknowledgments 703
The authors would like to express their gratitude to P McCann from QUB and N Collier 704 from Eden Nuclear and Environment Ltd for their helps for some experiments 705
706
References 707
1 Schneider M Romer M Tschudin M Bolio H (2011) Sustainable cement production-708 present and future Cement and Concrete Research 41642ndash650 709
httpsdoiorg101016jcemconres201103019 710
2 Madlool NA Saidur R Hossain MS Rahim NA (2011) A critical review on energy use 711 and savings in the cement industries Renewable and Sustainable Energy Reviews 712
152042ndash2060 httpsdoiorg101016jrser201101005 713
3 EN15743 (2015) BS EN 157432010+A12015 Supersulfated cement - Composition 714
specifications and conformity criteria BSI 715
4 Khatib JM Wright L Mangat PS (2016) Mechanical and physical properties of concrete 716
containing FGD waste Magazine of Concrete Research 68550ndash560 717 httpsdoiorg101680macr1500092 718
5 Khatib JM Mangat PS Wright L (2008) Sulfate resistance of mortar containing 719
simulated FGD waste Proceedings of Institution of Civil Engineers Construction 720 Materials 161119ndash128 httpsdoiorg101680coma20081613119 721
6 (2020) Specifying Sustainable Concrete 722
7 Hewlett PC (2004) Learsquos Chemistry of Cement and Concrete fourth edi Elsevier 723 Science amp Technology Books Oxford 724
8 Gruskovnjak A Lothenbach B Winnefeld F et al (2008) Hydration mechanisms of 725 super sulphated slag cement Cement and Concrete Research 38983ndash992 726
httpsdoiorg101016jcemconres200803004 727
9 Grounds T Nowell D V Wilburn FW (2003) Resistance of supersulfated cement to 728 strong sulfate solutions Journal of Thermal Analysis and Calorimetry 72181ndash190 729
httpsdoiorg101023A1023928021602 730
10 Grounds T Nowell D V Wilburn FW (1995) The influence of temperature and 731
different storage conditions on the stability of supersulphated cement Journal of 732 Thermal Analysis 45385ndash394 httpsdoiorg101007BF02548772 733
33
11 Bazalduacutea-Medelliacuten ME Fuentes AF Gorokhovsky A Escalante-Garciacutea JI (2015) Early 734 and late hydration of supersulphated cements of blast furnace slag with fluorgypsum 735 Materiales de Construccion 65e043 httpsdoiorg103989mc201506013 736
12 Matschei T Bellmann F Stark J (2005) Hydration behaviour of sulphate-activated slag 737 cements Advances in Cement Research 17167ndash178 738
httpsdoiorg101680adcr2005174167 739
13 Richardson IG (2000) Nature of the hydration products in hardened cement pastes 740 Cement and Concrete Composites 2297ndash113 httpsdoiorg101016S0958-741 9465(99)00036-0 742
14 Baux C Phelipot-Mardeleacute A Lanos C et al (2013) PERFORMANCES OF SUPER 743 SULFATED CEMENTS In International Conference on Concrete Under Severe 744 Conditions pp 1857ndash1870 745
15 Annabelle Phelipot-Mardeleacute Gabriel Samson Christophe Lanos (2015) Super sulfated 746 cement formulation and uses In Construction Materials ConMat Whistler Canada 747
16 Milestone NB (2006) Reactions in cement encapsulated nuclear wastes need for 748 toolbox of different cement types Advances in Applied Ceramics 10513ndash20 749
httpsdoiorg101179174367606X81678 750
17 Batchelor B (2006) Overview of waste stabilization with cement Waste Management 751
26689ndash698 httpsdoiorg101016JWASMAN200601020 752
18 Zhang T Cheeseman CR Vandeperre LJ (2011) Development of low pH cement 753
systems forming magnesium silicate hydrate (MSH) Cement and Concrete Research 754 41439ndash442 httpsdoiorg101016jcemconres201101016 755
19 Mobasher N Bernal SA Provis JL (2016) Structural evolution of an alkali sulfate 756
activated slag cement Journal of Nuclear Materials 46897ndash104 757 httpsdoiorg101016JJNUCMAT201511016 758
20 Wang J Yu B Gao Y (2014) Hydration Characteristics of Super Sulphated Cement 759 with Different Fineness In Proceedings of the International Conference on Material 760 and Environmental Engineering (ICMAEE 2014) Atlantis Press Paris France 761
21 Naumlgele E (1986) The Zeta-potential of cement Part II Effect of pH-value Cement and 762 Concrete Research 16853ndash863 httpsdoiorg1010160008-8846(86)90008-6 763
22 Jain N Civil MG-IJ of M and 2015 U (2015) Formulation of Sulphate Resistant Super 764 Sulphated Cement Using Fluorogypsum and Granulated Blast Furnace Slag IOSR 765
Journal of Mechanical and Civil Engineering (IOSR-JMCE) 12153ndash159 766
23 Gao YX Yu BY Xu FL (2012) Effect of Modified Phosphogypsum on the Mechanical 767 Properties of Super Sulphate Cement Applied Mechanics and Materials 161264ndash268 768 httpsdoiorg104028wwwscientificnetAMM161264 769
24 Kantro D (1980) Influence of Water-Reducing Admixtures on Properties of Cement 770 PasteampmdashA Miniature Slump Test Cement Concrete and Aggregates 295ndash102 771
httpsdoiorg101520CCA10190J 772
34
25 Svermova L Sonebi M Bartos PJM (2003) Influence of mix proportions on rheology of 773 cement grouts containing limestone powder Cement and Concrete Composites 25737ndash774 749 httpsdoiorg101016S0958-9465(02)00115-4 775
26 Sonebi M (2006) Rheological properties of grouts with viscosity modifying agents as 776 diutan gum and welan gum incorporating pulverised fly ash Cement and Concrete 777
Research 361609ndash1618 httpsdoiorg101016JCEMCONRES200605016 778
27 Nehdi M Rahman M (2004) Effect of Geometry and Surface Friction of Test Accessory 779 on Oscillatory Rheological Properties of Cement Pastes ACI Materials Journal 780 101416ndash424 httpsdoiorg101435913428 781
28 Khayat KH Yahia A (1997) Effect of Welan Gum-High-Range Water Reducer 782 Combinations on Rheology of Cement Grout ACI Materials Journal 94365ndash372 783 httpsdoiorg1014359321 784
29 Lombardi G (1985) THE ROLE OF COHESION IN CEMENT GROUTING OF 785 ROCK In Proceedings of Fifteenth Congress on Large Dams International 786 Commission on Large Dams pp 235ndash261 787
30 Perrot A Rangeard D Picandet V Meacutelinge Y (2013) Hydro-mechanical properties of 788
fresh cement pastes containing polycarboxylate superplasticizer Cement and Concrete 789 Research 53221ndash228 httpsdoiorg101016JCEMCONRES201306015 790
31 Perrot A Lecompte T Khelifi H et al (2012) Yield stress and bleeding of fresh cement 791 pastes Cement and Concrete Research 42937ndash944 792
httpdxdoiorg101016jcemconres201203015 793
32 Sonebi M Perrot A (2019) Effect of mix proportions on rheology and permeability of 794 cement grouts containing viscosity modifying admixture Construction and Building 795
Materials 212687ndash697 httpsdoiorg101016jconbuildmat201904022 796
33 Picandet V Rangeard D Perrot A Lecompte T (2011) Permeability measurement of 797
fresh cement paste Cement and Concrete Research 41330ndash338 798 httpsdoiorg101016JCEMCONRES201011019 799
34 Perrot A Rangeard D (2017) Effects of mix design parameters on consolidation 800
behaviour of fresh cement-based materials Materials and Structures 50117 801 httpsdoiorg101617s11527-016-0988-0 802
35 Rangeard D Perrot A Picandet V et al (2015) Determination of the consolidation 803 coefficient of low compressibility materials application to fresh cement-based 804
materials Materials and Structures 481475ndash1483 httpsdoiorg101617s11527-014-805 0247-1 806
36 Massoussi N Keita E Roussel N (2017) The heterogeneous nature of bleeding in 807 cement pastes Cement and Concrete Research 95108ndash116 808 httpsdoiorg101016JCEMCONRES201702012 809
37 Montgomery D (2007) Design and Analysis of Experiments Second Edition John 810
Wiley amp Sons 811
35
38 Roussel N Stefani C Leroy R (2005) From mini-cone test to Abrams cone test 812 Measurement of cement-based materials yield stress using slump tests Cement and 813 Concrete Research 35817ndash822 httpsdoiorg101016jcemconres200407032 814
39 Mangat PS Khatib JM Wright L (2006) Optimum utilisation of FGD waste in blended 815 binders Proceedings of Institution of Civil Engineers Construction Materials 159119ndash816
127 httpsdoiorg101680coma20061593119 817
40 Khatib JM Mangat PS Wright L (2013) Early age porosity and pore size distribution of 818 cement paste with flue gas desulphurisation (FGD) waste Journal of Civil Engineering 819 and Management 19622ndash627 httpsdoiorg103846139237302013793609 820
41 Collier NC Milestone NB Gordon LE Ko SC (2014) The suitability of a supersulfated 821 cement for nuclear waste immobilisation Journal of Nuclear Materials 452457ndash464 822 httpsdoiorg101016jjnucmat201405078 823
42 Masoudi R (2018) Examining compositions hydration mechanisms and properties of 824 supersulfated cement for use in concrete by Examining compositions hydration 825 mechanisms and properties of supersulfated cement for use in concrete University of 826 Toronto 827
828
10
it was mixed with To get a pH reading for the samples a pH device was used where a probe 264
is placed in the solution The machine was calibrated with three buffer solutions of 7 10 and 265
13 pH levels before measuring the pH of the samples 266
SEM (scanning electron microscopy) was carried out using a JEOL JSM6400 on flat fractured 267
surface specimens obtained from compression testing at 7-day samples Prior to SEM testing 268
the samples were mounted onto metal stubs using carbon paste and coated with gold film to 269
ensure good conductivity The accelerated voltage was set at 20 kV 270
22 Statistical Design and Modelling of Experiments 271
The technique of analysis used in this study was a 2k factorial experimental design [37] to 272
evaluate the influence of two different levels (maximum and minimum) for each variable on 273
the relevant grout properties Three key parameters (WB ANH GGBS) that should have 274
significant influence on mix characteristics of supersulfated cements were selected to formulate 275
the mathematical models for evaluating relevant properties (ie k = 3 in this study thus the 276
total mixes for the factorial design was 23 = 8) Additionally a mix at the central point was 277
replicated four times to estimate the experimental error and improve the reliability of the 278
models The coding and levels of the variables (WB and dosages of GGBS and ANH) are 279
given Table 2 280
The statistical models are valid for supersulfated grout (SSC) mixes made with WB GGBS 281
and ANH in the ranges of 034 to 044 60 to 80 and 0 to 20 respectively The modelled 282
experimental region consisted of mixtures ranging from coded variables of ndash1 to +1 The coded 283
factors for variables were calculated by 284
Coded Factor = (Actual value-Factor means)[Range of factor value2] (2) 285
Hence 286
Coded WB = (Actual WB ndash 039)005 287
Coded GGBS = (Actual GGBS ndash 07)01 288
Coded Anhydrite = (Actual ANH ndash 01)01 289
The responses modelled were mini-slump plate cohesion Marsh cone yield stress plastic 290
viscosity induced bleeding at 1 min 5 and 30 mins permeability at 1 min and 30 mins 291
compressibility and compressive strength at 1 3 7 and 28 days The general model associated 292
11
with the two-level factorial design incorporating three independent variables (WB GGBS 293
ANH) is expressed by 294
Y1 = a0 + a1WB + a2GGBS + a3ANH+ a4WBGGBS + a5WBANH + a6GGBSANH 295
+ a7WBGGBSANH + ε (3) 296
where 297
Y1 Response (mini slump marsh cone plate cohesion etc) 298
a0 Overall mean factor effect 299
a1-a7 Regression coefficients representing model constants (contribution of independent 300
variables and their interaction to each response) 301
a1WB a2GGBS a3ANH Linear effect of factors WB GGBS and ANH 302
a4WBGGBS a5WBANH a6GGBSANH a7WBGGBSANH Interaction effects of 303
factors WB GGBS and ANH 304
ε Random error term representing the effects of uncontrolled variables 305
Analysis of variance (ANOVA) was used to test the significance of regression models and t-306
tests were performed to identify the non-significant (NS) variables and second order 307
interactions which were subsequently eliminated from the derived models Model coefficients 308
were determined using multi-linear regression analysis based on a normal distribution 309
assumption The error was assumed to be random and normally distributed so the residual 310
terms which represent the difference between the actual and predicted values should exhibit 311
similar properties [37] The probability value (Prob) obtained from ANOVA determines the 312
statistical significance of each factor and their interactions For most of the parameters the 313
probability that the derived coefficients associated with the various variables influencing each 314
response were limited to 10 This signifies that there is less than 10 chance or 90 315
confidence limit that the contribution of a given parameter to the tested response exceeds the 316
value of the specified coefficient A negative estimate indicates that an increase of the given 317
parameter results in a reduction of the measured response 318
12
3 Results and discussion 319
The results of the experimental work characterize the behaviour of the mortars with different 320
WB ANH and GGBS levels Table 3 summarises all results of the experimental work 321
performed The results were used to construct the regression models 322
Table 3 Average results from experimental work 323 324
Viscometer Induced bleeding
Mix Mini-
slump
Flow
time
Cohesion
meter
Yield
value
Plastic
viscosity
1min 5min 30min
(mm) (s) (mm) (Pa) (Pas) (mL) (mL) (mL)
1 61 230 105 191 0923 220 470 480
2 89 25 55 97 0323 290 780 810
3 67 200 118 172 0802 280 580 605
4 111 12 20 80 0199 490 860 860
5 52 360 143 251 1203 280 520 540
6 83 69 86 99 0403 360 700 700
7 60 250 125 211 0980 310 580 590
8 110 13 40 77 0224 350 910 950
9 71 150 87 101 0617 370 720 730
10 73 102 122 106 0681 290 620 620
11
12
77
74
192
83
89
110
124
101
0660
0641
290
350
640
715
645
720
325
Table 3 Average results from experimental work (continued) 326
Mix Permeability Permeability Compre-
ssibility
Compressive strength
1 min 30 min fc 1d fc 3d fc 7d fc 28d
(ms) (ms) (MPa) (MPa) (MPa) (MPa)
1 216E-09 317E-09 0155 299 506 581 704
2 512E-08 418E-09 0298 168 383 547 558
3 448E-08 366E-09 0194 213 334 406 527
4 374E-08 425E-09 0312 140 223 256 408
5 448E-08 342E-09 0173 233 434 507 535
6 512E-08 395E-09 0255 136 371 371 448
7 440E-08 361E-09 0187 108 232 343 532
8 451E-08 433E-09 0342 68 200 263 473
9 446E-08 402E-09 0250 196 328 398 592
10 468E-08 371E-09 0212 171 232 361 556
11
12
423E-08
516E-08
379E-09
400E-09
0221
0246
207
183
313
301
451
435
565
520
327
The derived quadratic statistical models of grout for mini-slump flow time cohesion plate 328
yield stress plastic viscosity induced bleeding at 1 min 5 min and 30 min permeability at 1 329
13
min and 30 min compressibility and compressive strength at 1 3 7 and 28 days are given in 330
Equations (4) to (18) where WB GGBS and ANH are given in codes values 331
Mini-Slump (mm) = 7881 + 1919 WB + 781 ANH + 444 WBANH - 294 GGBS (4) 332
333
Marsh flow time (s) = 1404 - 1153 WB ndash 261 ANH + 281 GGBS (5) 334
335
Plate Cohesion meter (microm) = 86 - 366 WB + 122 GGBS - 107 ANH - 091 WBANH (6) 336
337
Yield Value (Pa) = 1466 ndash 584 WB - 126 WBGGBS - 125 ANH + 124 GGBS (7) 338
339
Plastic Viscosity (Pas) = 063 - 034 WB - 0078 ANH + 0073 GGBS 340
- 0047 WBGGBS - 0022 ANHGGBS (8) 341
342
Induced Bleeding at 1 min (ml) = 3225 + 50 WB + 35 ANH ndash 225 WBANHGGBS (9) 343
344
Induced Bleeding at 5 mins (ml) = 675 + 1375 WB + 575 ANH (10) 345
346
Induced Bleeding at 30 mins (ml) = 6919 + 1381 WB + 594 ANH (11) 347
348
Permeability at 1 min (ms) x 10-8 = 4 + 0615 WB + 0621 AHN ndash 0773 WBGGBS 349
- 0426WBAHN - 0446 AHNGGBS (12) 350
351
Permeability at 30 min (ms) x 10-8 = 0382 + 0035 WB + 0014 ANH 352
+ 0008 WBANHGGBS (13) 353
354
Compressibility = 02396 + 00623 WB + 00194 ANH + 00012 WBANHGGBS (14) 355
356
ƒc 1 d (MPa) = 1705 - 426 WB - 384 ANH - 343 GGBS + 145 WBANH (15) 357
358
ƒc 3 d (MPa) = 3215 - 879 ANH - 412 WB ndash 261 GGBS (16) 359
360
ƒc 7 d (MPa) = 4092ndash 924 ANH - 5 WB - 383 GGBS (17) 361
362
14
ƒc 28 d (MPa) = 5348 - 515 WB - 382 ANH ndash 262 GGBS + 436 ANHGGBS (18) 363
364
The correlation coefficient of most of the proposed models were higher than 090 except for 365
plastic viscosity compressive strength after 3days and compressive strength after 28days 366
which have coefficients of 070 086 and 087 respectively 367
Table 4 shows the average measured responses of the four replicate grouts the coefficients of 368
variation (COV) as well as the estimated errors with a 90 confidence limit for each of the 369
measured properties The estimated error levels for mini-slump plate cohesion meter Marsh 370
cone yield stress plastic viscosity induced bleeding at 1 min 5 min and 30 mins permeability 371
at 1 min and 30 min compressibility and compressive strengths at 1 3 7 28 days were plusmn 22 372
mm plusmn 0001mm plusmn 40 s plusmn 09 Pa plusmn 002 Pa s plusmn 28 ml plusmn 42 ml plusmn 45 ml plusmn 32x10-9 (ms) 373
plusmn 13x10-10 (ms) plusmn 00153 plusmn 13 MPa plusmn 35 MPa plusmn 33 MPa and plusmn 25 MPa respectively 374
The relative experimental errors for mini-slump plate cohesion meter Marsh cone yiled stress 375
plastic viscosity induced bleeding permeability compressibility compressive strengths were 376
limited to 3-11 On the other hand relative error for march cone was up to 30 377
Table 4 Repeatability of test parameters at the central point 378
379
Tests Mini-
slump
Plate
cohesion
Marsh
cone
Yield
stress
Plastic
viscosit
y
Induced
bleeding
at 1 min
Induced
bleedin
g at 5
min
Induced
bleeding
at 30
min
Mean (n=4) 736
mm
001
mm
1318
s
108
Pa
065
Pa s
325
ml
674
ml
679
ml
Coefficient
of variation
()
37 115 372 105 42 127 76 80
Estimate
error (90
confidence
limit)
22
mm
0001
mm
402
s
09
Pa
002
Pa s
28
ml
42
ml
45
ml
380
381 Table 4 Repeatability of test parameters at the central point (continued) 382
383
Tests
Permeability
1 min
x10-8
Permeability
30 min
x10-8
Compressibility frsquoc 1d frsquoc 3d frsquoc 7d frsquoc 28d
Mean (n=4) 463
ms
0388
ms 02323
189
MPa
293
MPa
411
MPa
558
MPa
Coefficient
of variation
()
85 39 8 84 144 98 53
15
Estimate
error (90
confidence
limit)
032
(ms)
0013
(ms)
00153
13
MPa
35
MPa
33
MPa
24
MPa
384
385
31 Accuracy of the established models 386
387
The ratio of predicted-to-measured properties for grout ranged between 087 and 115 388
indicating good accuracy for prediction of mini-slump plate cohesion induced bleeding at 1 389
min 5 mins and 30 mins yield stress plastic viscosity and compressive strength at 1-d 3-d 7-390
d and 28-d In general the proposed models for mini-slump plate cohesion Marsh cone and 391
compressive strength appeared to be accurate in predicting fluidity cohesivity induced 392
bleeding permeability at 30 min compressibility and compressive strength with low scatter 393
between measured and predicted values However the average values of predictedmeasured 394
ratio of yield values were slightly higher (074) 395
396
32 Isoresponses of the proposed models 397
398
The isoresponse surfaces and contour plots for mini-slump plate cohesion Marsh cone yield 399
stress plastic viscosity induced bleeding at 1 min 5 mins and 30 mins permeability at 1 min 400
and 30 mins compressibility and compressive strength at 1-d 3-d 7-d and 28-d were obtained 401
by using response surface methodology (RSM) The isoresponse surfaces and contour plots 402
were obtained from the regression models and because the models contained interaction and 403
second-order variables the contour lines were curved 404
The proposed statistical models can therefore be used to evaluate the effect of a group of 405
variables on the properties affecting the quality of supersulfated grout This allowed for the 406
calculation of isoresponse surfaces from the parameters under study outside the experimental 407
domain and the optimisation of their effects The next sections will discuss the results of each 408
experiment separately 409
331 Mini-slump 410
As shown in Eq 4 the mini-slump is influenced in order of significance by WB ratio 411
anhydrite proportion interaction of WB and ANH and the percentage of GGBS content The 412
WB ratio had the greatest effect on fluidity due to better lubrication of the particles in the paste 413
16
[29] The mini-slump test was accompanied by very low shear The value of mini-slump is to 414
characterise yield stress [38] therefore higher mini-slump value indicated a lower yield stress 415
The effect of WB on the increase of mini-slump was two and half-time than that of ANH (192 416
vs 781 in Eq 4) However increased ANH resulted in a 27 times greater increase in mini-417
slump than reduced GGBS (781 vs -294 in Eq 4) Figure 1(a) shows the effect of increased 418
WB on mini-slump vs ANH (when GGBS was kept constant at 70) and Figure 1(b) shows 419
GGBS vs ANH (when WB was fixed at 039) Based on these figures it is evident that mini-420
slump increased significantly when the dosage of WB and ANH increased 421
422
(a) (b) 423
Fig 1 Isoresponse curves of mini-slump (mm) (a) WB vs ANH and (b) GGBS vs ANH 424
425
332 Marsh cone 426
The time needed for a grout sample to flow through the Marsh cone is proportional to the 427
viscosity of the cement grout the flow time becomes an index of fluidity so the longer the 428
flow time the lower the fluidity Similar to the previous trends Eq 5 shows that the values of 429
Marsh cone are influenced in order of significance by WB GGBS and ANH This is 430
graphically illustrated in Figure 2 431
GGBS = 70
034 039 042 044
0
5
10
15
20
WB
AN
H (
)
65
74
83
92
101
037
AN
H(
)
WB = 039
60 65 70 75 80
0
5
10
15
20
GGBS()
70
75
80
85
17
432
(a) (b) 433
Fig 2 Isoresponse curves for flow time (s) (a) WB vs ANH and (b) GGBS vs ANH 434
435
It can be noted that an increase in WB and ANH or a reduction in GGBS led to decreasing 436
the Marsh cone flow time For example at fixed WB at 039 and GGBS of 70 respectively 437
the increase in ANH dosage from 5 to 20 led to a marked reduction of the Marsh cone flow 438
time from 170 to 140 s (Figure 2(a)) This behaviour is attributed to the change in plastic 439
viscosity of the grout as will be discussed later 440
333 Cohesion plate 441
As shown in Eq 6 the cohesion plate was influenced in order of magnitude by the WB and 442
the percentage of GGBS and ANH The increasing WB had a 34 times the influence on the 443
reduction of the cohesion plate test results as the increased ANH (for a GGBS constant) By 444
comparing the effects of WB and GGBS on plate cohesion the increased WB can be 445
interpreted as having approximately a 3 times greater influence on the reduction of plate 446
cohesion values than the increase in GGBS (-366 vs 122 in Eq 6) given that ANH is held 447
constant The effect of an increase in WB from 034 to 044 and ANH from 0 to 20 with a 448
fixed GGBS dosage of 70 is presented in Figure 3(a) Increased WB led to a decreased 449
cohesion plate value Conversely an increase in GGBS increased the cohesion plate value and 450
an increased ANH caused a reduction in cohesion plate (Figure 3(b)) 451
GGBS = 70
034 036 039 042 0440
5
10
15
20
WB
AN
H (
)
40
6080
100120
140160
180200
220
WB = 039
60 65 70 75 80
0
5
10
15
20
GGBS ()
AN
H (
)
100
120
140
160
180
18
452
(a) (b) 453
Fig 3 Isoresponse curves for plate cohesion meter (a) WB vs ANH and (b) GGBS vs 454 ANH 455
334 Yield stress 456
As shown in Eq 7 yield value was influenced in order of magnitude by WB and dosages of 457
ANH and GGBS Based on Figure 4 (a) when WB was fixed at 039 GGBS maintained at 458
70 and ANH increased to 5 the isoresponse curve showed a yield value of 15 Pa On the 459
other hand if the proportion of ANH was further increased to 20 while GBBS was 460
maintained at 70 the yield value decreased to 135 Pa This corresponds with Eq (7) in 461
which the proportion of WB and ANH were increased while GGBS was kept constant 462
resulting in a reduction in yield stress An increase in GGBS content resulted in an increase of 463
the yield stress 464
Figure 4 (b) shows the isoresponse curve of the yield value with a fixed proportion of GGBS 465
at 70 When WB was 039 and ANH was 5 the isoresponse of the predicted yield value 466
was 155 Pa If ANH was increased to 20 while maintaining WB at 039 the isoresponse of 467
the yield value was 135 Pa 468
It can be interesting to note that the observed results for the yield stress are closed to the one 469
observed with the cohesion plate and mini-slump tests This is expected as yield stress values 470
can be derived from those two simple tests 471
GGBS = 70
034 037 039 042 0440
5
10
15
20
WB
AN
H(
)
45
55
65
7585
95
105
115
WB = 039
60 65 70 75 800
5
10
15
20
GGBS ()
AN
H(
)
75
85
95
105
19
472
(a) (b) 473
Fig 4 Isoresponse curves for yield stress (Pa) (a) WB vs ANH and (b) GGBS vs ANH 474
335 Plastic viscosity 475
Plastic viscosity was influenced in order of magnitude by WB and the dosages of ANH and 476
GGBS ANH and GGBS had almost opposite effects on plastic viscosity (-0078 vs 0073 in 477
Eq 8) As shown in Eq (8) increased WB had the greatest primary effect on plastic viscosity 478
(034 vs 0078 and 0073) The increased WB had approximately a 44 times greater influence 479
on reducing plastic viscosity than increased ANH or decreased GGBS 480
In the isoresponse curve of plastic viscosity shown in Figure 5 (a) when GGBS was fixed at 481
70 WB set at 039 and ANH maintained at 5 the predicted plastic viscosity value was 482
068 Pas On the other hand if the dosage of ANHB was increased to 20 while maintaining 483
a similar WB the plastic viscosity was reduced to 055 Pas 484
In Figure 5 (b) WB was fixed at 039 when GGBS was held at 70 and ANH at 5 the 485
predicted plastic viscosity was 067 Pas However when ANH was increased to 20 and 486
GGBS was maintained at 70 the predicted plastic viscosity dropped to 055 Pas 487
AN
H(
)
GGBS = 70
034 037 039 042 044
0
5
10
15
20
WB
1012
1416
18
20
WB = 039
60 65 70 75 800
5
10
15
20
GGBS ()
AN
H(
)
13
14
15
20
488
(a) (b) 489
Fig 5 Isoresponse curve for plastic viscosity (Pas) (a) WB vs ANH and (b) GGBS vs 490
ANH 491
336 Induced bleeding 492
The induced bleeding equations for 1 and 5 minutes (Eqs 9 10) and 30 minutes (Eq 11) are 493
very similar The two influencing factors of induced bleeding are WB ratio and anhydrite 494
WB ratio has the greatest effect over two times the effect of anhydrite content Figure 6 shows 495
the isoresponse for bleeding versus the WB ratio for a fixed value of GGBS at 70 It can be 496
seen that when an anhydrite value is selected and the WB ratio is increased the bleeding will 497
also increase Similarly if a WB ratio is selected and the anhydrite content is increased the 498
bleeding will again increase 499
500
GGBS = 70
034 037 039 042 0440
5
10
15
20
WB
AN
H(
)
035
045
055
065
075
085
095
WB = 039
60 65 70 75 800
5
10
15
20
GGBS ()
AN
H(
)
055
060
065
075
034 036 039 042 044
0
5
10
15
20
WB
AN
H (
)
26
28
30
3234
36
38
40
GGBS=70
21
(a) 501
502
(b) (c) 503
Fig 6 Isoresponse curves for induced bleeding at 1 5 and 30 min WB vs ANH 504
337 Permeability 505
Figure 7 (a) and (b) showed firstly that the permeability decreased significantly from 1 min to 506
30 min Permeability at 1 min was influenced in order of magnitude by WB and the dosage 507
of ANH All interactions between 3 parameters had almost opposite effects on permeability 508
(Eq 12) As shown in Eq (12) increased WB and AHN had the greatest primary effect on 509
permeability at 1 min It seems there is an optimum reached at WB = 40 and AHN at 17 510
Similarly the permeability at 30 min is affected in order of significance by WB followed by 511
ANH (Eq 13) In Figure 7 (b) WB was fixed at 039 when GGBS was held at 70 and ANH 512
at 10 the predicted permeability was 038 x 10-8 (ms) However when ANH was increased 513
to 20 and GGBS was maintained at 70 the predicted permeability increased to 040x10-8 514
(ms) 515
516
GGBS = 70
034 036 039 042 0440
5
10
15
20
WB
AN
H (
)
545
61
675
74
805
GGBS = 70
034 036 039 042 0440
5
10
15
20
WB
AN
H (
)
56
60
64
68
72
7680
84
22
517
(a) (b) 518
Fig 7 Isoresponse curves for permeability at 1 and 30 min WB vs ANH 519
338 Compressibility 520
As shown in Eq (14) the compressibility was influenced in order of magnitude by the WB 521
and the percentage of ANH The interaction between 3 parameters affected also the 522
compressibility The increasing WB had a 32 times the influence on the increase of the 523
compressibility results as the increased ANH (for a GGBS constant) The effect of an increase 524
in WB from 034 to 044 and ANH from 0 to 20 with a fixed GGBS dosage of 70 is 525
presented in Figure 8 Increased WB led to an increase of compressibility Similarly an 526
increase in AHN increased the compressibility 527
528
Fig 8 Isoresponse curves for compressibility WB vs ANH 529
034 036 039 042 044
0
5
10
15
20
GGBS = 70 WB
AN
H (
)
3
35
4
4
45
5
034 036 039 042 044
0
5
10
15
20
WB
AN
H (
)
034
035
036 037 038 039 04
041
042
4
GGBS=70
034 036 039 042 044
0
5
10
15
20
WB
AN
H (
)
017
019
021 023 025 027
029
031
GGBS=70
23
530
339 Compressive strength 531
After one day from Eq 15 the influencing factors in order of significance are WB ratio 532
anhydrite content GGBS content and the interaction of WB and ANH The effect of the first 533
three was similar but WB had 11 times greater effect than anhydrite and 125 times greater 534
effect than GGBS While the interaction of WB and anhydrite had around a third of the 535
influence of WB Figures 9 (a) and (b) show the isoresponses for 1-day compressive strength 536
From Figure 9 (a) it can be seen when the GGBS content is fixed at 70 for a given anhydrite 537
content increasing the WB ratio will decrease the strength Also if a WB ratio is selected and 538
the anhydrite is increased similarly the strength will decrease From Figure 9 (b) with the WB 539
ratio fixed at 039 once again an increase in GGBS led to a reduction of compressive strength 540
at 1 day 541
542
(a) (b) 543
Fig9 Isoresponse curves for compressive strength at 1d (a) (WB vs ANH) and (b) (GGBS 544 vs ANH) 545
Eqs 16 17 and 18 show the effect of GGBS and ANH percentages on compressive strength at 546
3-d 7-d and 28-d Figures 10 11 and 12 show the isoresponse of the compressive strength at 547
3-d 7-d and 28-d respectively with WB vs ANH Increased ANH led to a decrease of 3-d 548
and 7-d compressive strength As expected an Increase in WB led to a decrease in compressive 549
strength The percentage of ANH had a negative effect on compressive strength and showed a 550
greater influence particularly at 3-d and 7-d (879 (3 d) amp 924 (7d) vs 382 (28 d)) GGBS has 551
a negative impact on early strength development The negative effect of GGBS on compressive 552
GGBS = 70
034 037 039 042 0440
5
10
15
20
WB
AN
H(
)
12
14
16
18
20
22
2426
WB = 039
60 65 70 75 800
5
10
15
20
GGBS ()
AN
H(
)
10
12
14
16
18
20
22
24
strength at early ages is clearly attributable to the fact that up to 80 of cement has been 553
replaced by GGBS and it takes some time for GGBS to start developing its pozzolanic action 554
at a noticeable level The results indicate that ANH content influences strength to a greater 555
extent than GGBS at all ages The SO3 content was reported to have great influence on the 556
strength [39 40] 557
558
(a) (b) 559
Fig10 Isoresponse curves for compressive strength at 3d (a) (WB vs ANH) and (b) 560 (GGBS vs ANH) 561
562
563
(a) (b) 564
Fig11 Isoresponse curves for compressive strength at 7d (a) (WB vs ANH) and (b) (WB 565 vs ANH) 566
567
GGBS = 70
034 036 039 042 0440
5
10
15
20
WB
AN
H (
)
24
2628
30
3234
3638
4042
WB = 039
60 65 70 75 80
0
5
10
15
20
GGBS ()
AN
H (
)
2426
2830
32
34
36
3840
42
GGBS = 70
034 037 039 042 044
0
5
10
15
20
WB
AN
H(
)
3032
34
3638
40
42
44
46
48
WB = 039
60 65 70 75 80
0
5
10
15
20
GGBS ()
AN
H(
)
32
34
36
38
40
42
44
46
48
25
568
(a) (b) 569
Fig12 Isoresponse curves for compressive strength at 28d (a) (WB vs ANH) and (b) 570
(ANH vs GGBS) 571
3310 Discussion of the effect of WB GGBS and ANH 572
As expected the increase of WB led to an increase in mini-slump induced bleeding and a 573
reduction in flow time plate cohesion yield stress plastic viscosity and compressive strengths 574
This can be attributed to more water in the system 575
An increase in GGBS content resulted in a reduction of the flow time plate cohesion yield 576
stress and plastic viscosity while the fluidity is improved This was due to the fact the specific 577
gravity of slag is lower than that of PC leading to an increase in the paste volume and thus 578
improving the fluidity of paste 579
In case of an increase of ANH proportion while WB and GGBS were kept constant it led to 580
an increased mini-slump and induced bleeding while the flow time plate cohesion yield stress 581
and plastic viscosity were reduced This was due to the lower reactivity of ANH resulting in an 582
increase of water needed for lubrication of paste 583
As expected an increase in WB lead to an increase in induced bleeding permeability and a 584
decrease in compressibility [33 35] This is due to the increase in liquid volume between the 585
particles and to the reduction in the amount of interparticle forces Globally the compressibility 586
decreases and the permeability increases with ANH It can be explained by the reduced specific 587
area and lower reactivity that can lead to more available water in the samples 588
3311 Heat of Hydration 589
Heat of hydration is considered an important factor in the cement design as low heat of 590
hydration reduces the effect of thermal cracking The heat flow results of the calorimeter test 591
performed over a three days period can be seen in Figure 13 592
GGBS = 70
034 036 039 042 0440
5
10
15
20
WB
AN
H (
)
46
48
50
52
54
56
58
60
WB = 039
0 5 10 15 2060
65
70
75
80
ANH ()
GG
BS
(
)
50
52
54
56
5860
62
26
593
Fig 13 Heat flow graphs for first 3 days of reaction 594
Figure 13 presents that the largest peaks were in mixes 1 2 5 and 6 This shows that these 595
reactions generated the most heat and that they were quick Mixes 1 and 2 have the highest 596
OPC content at 40 and this suggests that to lower the heat of the reaction minimal OPC 597
should be used This is confirmed by the fact that mixes 5 and 6 have the next highest OPC 598
contents the same percentage as mixes 3 4 and 9 (one of the repeated mixes) which have 599
anhydrite present This implies that the presence of anhydrite will lengthen the reaction process 600
and reduce the heat produced during setting significantly The graph shows this by the absence 601
of a sharp peak instead a gentle curved hump is shown over a 2-day period whereas the mixes 602
showing a sharp peak occur after about 12 hrs Mix 7 which has the same solids content as 603
mix 8 but a lower WB ratio and no cement present showed the lowest heat flow during the 604
hydration process 605
Figure 14 shows the cumulative heat generation during the first 3 days of setting It is clear that 606
the two mixes (1 and 2) with highest cement content and absence of anhydrite had the highest 607
cumulative heat development over the 3-day period 643J and 594J respectively Mixes 3456 608
and 9 which all have 20 OPC content generated similar heat value over the 3 days Results 609
of mixes containing ANH implies that over the period that the anhydrite did not reduce the 610
cumulative heat generated but slowed the reaction and reduce the peak heat generated The 611
0
0002
0004
0006
0008
001
0012
0 50000 100000 150000 200000 250000 300000
He
at F
low
(mW
)
Time s()
M1
M2
M3
M4
M5
M6
M7
M9
1Day
2Day
3day
1d 2d 3d
27
graphs also suggest that a higher WB ratio produced a lower cumulative and peak heat 612
generation613
614
Fig 14 Cumulative heat generation curves for first 3 days 615
3312 pH measurements 616
Fig 15 summarises the results of pH and the nine mixes with different compositions of WB 617
the percentages of cement GGBS and ANH It is shown that Supersulfated cements (SSCs) 618
have lower pH values (lt 125 at all ages) than PC which has a pH of 139 [41] making SSC 619
more preferable in essential applications such as nuclear waste encapsulation 620
The figure shows that the pH value decreased with time for all samples between 1 and 7 days 621
Similar trend was observed in the majority of mixes between 7 and 28 days except for sample 622
2 5 and 9 which showed slight increase in the pH values This decrease refers to the 623
consumption of ions in the pore structure due to the hydration process 624
0
100
200
300
400
500
600
700
800
0 50000 100000 150000 200000 250000 300000
(J)
Time (s)
M1
M2
M3
M4
M5
M6
M7
M9
1 Day
3 Day
2 day
1d 2d 3d
1
2
3
9
45
6
7
28
625
626 Fig 15 Summary of pore solution pH 627
628
The incorporation of ANH replacing the Portland cement (C) results in remarkable decrease in 629
pH at all ages as introducing the ANH reduced the lower initial pH Likewise the increase in 630
the content of GGBS led to a decrease in the pH value of the pore structure as GGBS has lower 631
initial pH than Portland cement The increase of WB ratio decreased the pH value This is in 632
agreement with Collier [41] who found that increasing the wb ratio from 05 to 06 increased 633
the pH by I unit This was attributed to the increased availability of water in the case of WB 634
of 06 allowing hydration of more cement powder thereby releasing more hydroxide anions 635
into solution However in this study the WB ratio did not show a significant effect on 636
lowering the pH These results are in agreement with [42] which also found that decreasing the 637
pH improved the bulk resistivity of SSC mixtures 638
3313 SEM 639
Figure 16 shows the SEM images of some mixes at various magnifications The images clearly 640
show the dense and compact structure of the cement after seven days The dense structure was 641
another requirement from the cement chosen to enclose the waste to prevent leaching The 642
microstructure consists mainly of C-S-H the main hydration product and unhydrated slag 643
grains C-S-H is formed after the dissolution of slag grains when contacting the water and 644
alkalis and then the ionic species saturate the solution and then precipitate as hydrated phases 645
[8] There were abundant grains of hydrated and partially hydrated slag grains some small 646
1080
1100
1120
1140
1160
1180
1200
1220
1240
1260
1280
1 2 3 4 5 6 7 8 9
pH
val
ue
Mix Number
1 Day
7 Days
28 Days
29
GGBS particles presented rims of reaction products (eg Mix 6-Figure 16 (f) and Mix 9-Figure 647
16 (h)) It was found by [11] that the composition of the reaction rims around slag was similar 648
to that of the C-S-H from PC However [12] found that in the CndashSndashH of SSC is apparently 649
more foil like which is different than the fibrillar morphology of C-S-H in OPC Mix 3 and 650
Mix 4 (Figure 16 (c) and (d) respectively) exhibits more micro voids in the micrsostructure 651
which could explain the low strength of these mixes compared to mix 1 and 2 Ettringite was 652
not detected Ettringite is not the most abundant phase and it is not easy to detect in dried 653
polished samples because it is easily decomposed under the drying conditions of the vacuum 654
of the microscope column [11] 655
(a) Mix 1 image at 1100 magnification (b) Mix 2 image at 900 magnification
(c) Particle of unreacted slag mix3 7 days (d) An overall image of mix 4 at 7days
showing CSH and BFS particles
30
(e) Mix 5 image at 1100 magnification (f) Mix 6 image at 2300 magnification
(g) Mix 7 image at 2000 magnification (h) Mix 9 image at 2700 magnification
Fig 16 SEM results 656
4 Conclusions 657
The paper focused on optimizing the SSC cement grout in order to get the best of it The effect 658
of GGBS WB and ANH dosages on the grout fluidity rheological properties induced 659
bleeding maximum heat of hydration and compressive strength was investigated using 660
factorial design approach and analysis The models derived in this study are valid for the 661
experimental area corresponding to grout mixes made with variable levels of WB ANH and 662
GGBS in the ranges of 034 to 044 0 to 20 by mass of binder 60 to 80 by mass of 663
binder respectively Based on the results from this study the following conclusions are drawn 664
- In comparison to GGBS and ANH WB ratio had more pronounced effects on the 665
results of mini-slump plate cohesion meter Marsh cone time yield stress plastic viscosity 666
induced bleeding permeability compressibility and compressive strength 667
31
- The increase in the dosage of GGBS led to an increase in the values of plate cohesion 668
meter Marsh cone time yield stress and plastic viscosity while reducing the mini-slump 669
values maximum hydration and compressive strength This is ascribed to the fine nature 670
of GGBS particles and pozzolanic effect 671
- While the ANH particles caused a decrease in the maximum of heat of hydration it 672
increased the induced bleeding permeability and compressibility due to its dominant effect 673
on increasing the dormant period and increasing the rates of solid sedimentation and 674
induced bleeding water 675
- Increasing the dosage of ANH in grout reduced the hydrations kinetic at early-age and 676
thus reduced the compressive strength at 1d 3d and 7d However this effect diminished 677
at later ages at 28 d in a manner similar to increasing WB 678
- The increase in the dosage of ANH led to an increase in the mini-slump values 679
(fluidity) but a decrease in the values of yield stress plastic viscosity plate cohesion and 680
Marsh cone time This is attributed to better deflocculation of particles at the fresh state 681
- The increase of GGBS percentage delayed the reaction process and decreased the total 682
heat after 3 days while WB slightly reduced the total heat it didnrsquot significantly affect the 683
reaction process 684
- pH measurements in the present study confirmed the suitability of these mixture to low-685
pH applications as the increase in both the GGBS and ANH markedly decreased the initial 686
pH thereby lowering the pH at different ages 687
- The modelling and prediction of the response of other points in the experimental domain 688
were therefore possible Although the models are based on a given set of materials they 689
can be easily used to generate future results using other materials 690
- Dense microstructure was observed for mixes examined in this study C-S-H is the main 691
reaction product with presence of unreacted slag grains embedded well in the structure 692
However some micro voids were observed in mixes containing ANH which led to lower 693
compressive strength of mixes with ANH 694
CRediT authorship contribution statement 695
MSonebi and YBai did the conceptualization and the design of investigation as well as 696 performing the experiments MSonebi carried out the software analysis of the results and the 697
32
visualization MSonebi AAbdalqader T Fayyad and APerrot analysed the results and 698 wrote the original draft and reviewed and edited the final version 699
Declaration of Competing Interest 700
The authors declare that they have no known competing financial interests or personal 701 relationships that could have appeared to influence the work reported in this paper 702
Acknowledgments 703
The authors would like to express their gratitude to P McCann from QUB and N Collier 704 from Eden Nuclear and Environment Ltd for their helps for some experiments 705
706
References 707
1 Schneider M Romer M Tschudin M Bolio H (2011) Sustainable cement production-708 present and future Cement and Concrete Research 41642ndash650 709
httpsdoiorg101016jcemconres201103019 710
2 Madlool NA Saidur R Hossain MS Rahim NA (2011) A critical review on energy use 711 and savings in the cement industries Renewable and Sustainable Energy Reviews 712
152042ndash2060 httpsdoiorg101016jrser201101005 713
3 EN15743 (2015) BS EN 157432010+A12015 Supersulfated cement - Composition 714
specifications and conformity criteria BSI 715
4 Khatib JM Wright L Mangat PS (2016) Mechanical and physical properties of concrete 716
containing FGD waste Magazine of Concrete Research 68550ndash560 717 httpsdoiorg101680macr1500092 718
5 Khatib JM Mangat PS Wright L (2008) Sulfate resistance of mortar containing 719
simulated FGD waste Proceedings of Institution of Civil Engineers Construction 720 Materials 161119ndash128 httpsdoiorg101680coma20081613119 721
6 (2020) Specifying Sustainable Concrete 722
7 Hewlett PC (2004) Learsquos Chemistry of Cement and Concrete fourth edi Elsevier 723 Science amp Technology Books Oxford 724
8 Gruskovnjak A Lothenbach B Winnefeld F et al (2008) Hydration mechanisms of 725 super sulphated slag cement Cement and Concrete Research 38983ndash992 726
httpsdoiorg101016jcemconres200803004 727
9 Grounds T Nowell D V Wilburn FW (2003) Resistance of supersulfated cement to 728 strong sulfate solutions Journal of Thermal Analysis and Calorimetry 72181ndash190 729
httpsdoiorg101023A1023928021602 730
10 Grounds T Nowell D V Wilburn FW (1995) The influence of temperature and 731
different storage conditions on the stability of supersulphated cement Journal of 732 Thermal Analysis 45385ndash394 httpsdoiorg101007BF02548772 733
33
11 Bazalduacutea-Medelliacuten ME Fuentes AF Gorokhovsky A Escalante-Garciacutea JI (2015) Early 734 and late hydration of supersulphated cements of blast furnace slag with fluorgypsum 735 Materiales de Construccion 65e043 httpsdoiorg103989mc201506013 736
12 Matschei T Bellmann F Stark J (2005) Hydration behaviour of sulphate-activated slag 737 cements Advances in Cement Research 17167ndash178 738
httpsdoiorg101680adcr2005174167 739
13 Richardson IG (2000) Nature of the hydration products in hardened cement pastes 740 Cement and Concrete Composites 2297ndash113 httpsdoiorg101016S0958-741 9465(99)00036-0 742
14 Baux C Phelipot-Mardeleacute A Lanos C et al (2013) PERFORMANCES OF SUPER 743 SULFATED CEMENTS In International Conference on Concrete Under Severe 744 Conditions pp 1857ndash1870 745
15 Annabelle Phelipot-Mardeleacute Gabriel Samson Christophe Lanos (2015) Super sulfated 746 cement formulation and uses In Construction Materials ConMat Whistler Canada 747
16 Milestone NB (2006) Reactions in cement encapsulated nuclear wastes need for 748 toolbox of different cement types Advances in Applied Ceramics 10513ndash20 749
httpsdoiorg101179174367606X81678 750
17 Batchelor B (2006) Overview of waste stabilization with cement Waste Management 751
26689ndash698 httpsdoiorg101016JWASMAN200601020 752
18 Zhang T Cheeseman CR Vandeperre LJ (2011) Development of low pH cement 753
systems forming magnesium silicate hydrate (MSH) Cement and Concrete Research 754 41439ndash442 httpsdoiorg101016jcemconres201101016 755
19 Mobasher N Bernal SA Provis JL (2016) Structural evolution of an alkali sulfate 756
activated slag cement Journal of Nuclear Materials 46897ndash104 757 httpsdoiorg101016JJNUCMAT201511016 758
20 Wang J Yu B Gao Y (2014) Hydration Characteristics of Super Sulphated Cement 759 with Different Fineness In Proceedings of the International Conference on Material 760 and Environmental Engineering (ICMAEE 2014) Atlantis Press Paris France 761
21 Naumlgele E (1986) The Zeta-potential of cement Part II Effect of pH-value Cement and 762 Concrete Research 16853ndash863 httpsdoiorg1010160008-8846(86)90008-6 763
22 Jain N Civil MG-IJ of M and 2015 U (2015) Formulation of Sulphate Resistant Super 764 Sulphated Cement Using Fluorogypsum and Granulated Blast Furnace Slag IOSR 765
Journal of Mechanical and Civil Engineering (IOSR-JMCE) 12153ndash159 766
23 Gao YX Yu BY Xu FL (2012) Effect of Modified Phosphogypsum on the Mechanical 767 Properties of Super Sulphate Cement Applied Mechanics and Materials 161264ndash268 768 httpsdoiorg104028wwwscientificnetAMM161264 769
24 Kantro D (1980) Influence of Water-Reducing Admixtures on Properties of Cement 770 PasteampmdashA Miniature Slump Test Cement Concrete and Aggregates 295ndash102 771
httpsdoiorg101520CCA10190J 772
34
25 Svermova L Sonebi M Bartos PJM (2003) Influence of mix proportions on rheology of 773 cement grouts containing limestone powder Cement and Concrete Composites 25737ndash774 749 httpsdoiorg101016S0958-9465(02)00115-4 775
26 Sonebi M (2006) Rheological properties of grouts with viscosity modifying agents as 776 diutan gum and welan gum incorporating pulverised fly ash Cement and Concrete 777
Research 361609ndash1618 httpsdoiorg101016JCEMCONRES200605016 778
27 Nehdi M Rahman M (2004) Effect of Geometry and Surface Friction of Test Accessory 779 on Oscillatory Rheological Properties of Cement Pastes ACI Materials Journal 780 101416ndash424 httpsdoiorg101435913428 781
28 Khayat KH Yahia A (1997) Effect of Welan Gum-High-Range Water Reducer 782 Combinations on Rheology of Cement Grout ACI Materials Journal 94365ndash372 783 httpsdoiorg1014359321 784
29 Lombardi G (1985) THE ROLE OF COHESION IN CEMENT GROUTING OF 785 ROCK In Proceedings of Fifteenth Congress on Large Dams International 786 Commission on Large Dams pp 235ndash261 787
30 Perrot A Rangeard D Picandet V Meacutelinge Y (2013) Hydro-mechanical properties of 788
fresh cement pastes containing polycarboxylate superplasticizer Cement and Concrete 789 Research 53221ndash228 httpsdoiorg101016JCEMCONRES201306015 790
31 Perrot A Lecompte T Khelifi H et al (2012) Yield stress and bleeding of fresh cement 791 pastes Cement and Concrete Research 42937ndash944 792
httpdxdoiorg101016jcemconres201203015 793
32 Sonebi M Perrot A (2019) Effect of mix proportions on rheology and permeability of 794 cement grouts containing viscosity modifying admixture Construction and Building 795
Materials 212687ndash697 httpsdoiorg101016jconbuildmat201904022 796
33 Picandet V Rangeard D Perrot A Lecompte T (2011) Permeability measurement of 797
fresh cement paste Cement and Concrete Research 41330ndash338 798 httpsdoiorg101016JCEMCONRES201011019 799
34 Perrot A Rangeard D (2017) Effects of mix design parameters on consolidation 800
behaviour of fresh cement-based materials Materials and Structures 50117 801 httpsdoiorg101617s11527-016-0988-0 802
35 Rangeard D Perrot A Picandet V et al (2015) Determination of the consolidation 803 coefficient of low compressibility materials application to fresh cement-based 804
materials Materials and Structures 481475ndash1483 httpsdoiorg101617s11527-014-805 0247-1 806
36 Massoussi N Keita E Roussel N (2017) The heterogeneous nature of bleeding in 807 cement pastes Cement and Concrete Research 95108ndash116 808 httpsdoiorg101016JCEMCONRES201702012 809
37 Montgomery D (2007) Design and Analysis of Experiments Second Edition John 810
Wiley amp Sons 811
35
38 Roussel N Stefani C Leroy R (2005) From mini-cone test to Abrams cone test 812 Measurement of cement-based materials yield stress using slump tests Cement and 813 Concrete Research 35817ndash822 httpsdoiorg101016jcemconres200407032 814
39 Mangat PS Khatib JM Wright L (2006) Optimum utilisation of FGD waste in blended 815 binders Proceedings of Institution of Civil Engineers Construction Materials 159119ndash816
127 httpsdoiorg101680coma20061593119 817
40 Khatib JM Mangat PS Wright L (2013) Early age porosity and pore size distribution of 818 cement paste with flue gas desulphurisation (FGD) waste Journal of Civil Engineering 819 and Management 19622ndash627 httpsdoiorg103846139237302013793609 820
41 Collier NC Milestone NB Gordon LE Ko SC (2014) The suitability of a supersulfated 821 cement for nuclear waste immobilisation Journal of Nuclear Materials 452457ndash464 822 httpsdoiorg101016jjnucmat201405078 823
42 Masoudi R (2018) Examining compositions hydration mechanisms and properties of 824 supersulfated cement for use in concrete by Examining compositions hydration 825 mechanisms and properties of supersulfated cement for use in concrete University of 826 Toronto 827
828
11
with the two-level factorial design incorporating three independent variables (WB GGBS 293
ANH) is expressed by 294
Y1 = a0 + a1WB + a2GGBS + a3ANH+ a4WBGGBS + a5WBANH + a6GGBSANH 295
+ a7WBGGBSANH + ε (3) 296
where 297
Y1 Response (mini slump marsh cone plate cohesion etc) 298
a0 Overall mean factor effect 299
a1-a7 Regression coefficients representing model constants (contribution of independent 300
variables and their interaction to each response) 301
a1WB a2GGBS a3ANH Linear effect of factors WB GGBS and ANH 302
a4WBGGBS a5WBANH a6GGBSANH a7WBGGBSANH Interaction effects of 303
factors WB GGBS and ANH 304
ε Random error term representing the effects of uncontrolled variables 305
Analysis of variance (ANOVA) was used to test the significance of regression models and t-306
tests were performed to identify the non-significant (NS) variables and second order 307
interactions which were subsequently eliminated from the derived models Model coefficients 308
were determined using multi-linear regression analysis based on a normal distribution 309
assumption The error was assumed to be random and normally distributed so the residual 310
terms which represent the difference between the actual and predicted values should exhibit 311
similar properties [37] The probability value (Prob) obtained from ANOVA determines the 312
statistical significance of each factor and their interactions For most of the parameters the 313
probability that the derived coefficients associated with the various variables influencing each 314
response were limited to 10 This signifies that there is less than 10 chance or 90 315
confidence limit that the contribution of a given parameter to the tested response exceeds the 316
value of the specified coefficient A negative estimate indicates that an increase of the given 317
parameter results in a reduction of the measured response 318
12
3 Results and discussion 319
The results of the experimental work characterize the behaviour of the mortars with different 320
WB ANH and GGBS levels Table 3 summarises all results of the experimental work 321
performed The results were used to construct the regression models 322
Table 3 Average results from experimental work 323 324
Viscometer Induced bleeding
Mix Mini-
slump
Flow
time
Cohesion
meter
Yield
value
Plastic
viscosity
1min 5min 30min
(mm) (s) (mm) (Pa) (Pas) (mL) (mL) (mL)
1 61 230 105 191 0923 220 470 480
2 89 25 55 97 0323 290 780 810
3 67 200 118 172 0802 280 580 605
4 111 12 20 80 0199 490 860 860
5 52 360 143 251 1203 280 520 540
6 83 69 86 99 0403 360 700 700
7 60 250 125 211 0980 310 580 590
8 110 13 40 77 0224 350 910 950
9 71 150 87 101 0617 370 720 730
10 73 102 122 106 0681 290 620 620
11
12
77
74
192
83
89
110
124
101
0660
0641
290
350
640
715
645
720
325
Table 3 Average results from experimental work (continued) 326
Mix Permeability Permeability Compre-
ssibility
Compressive strength
1 min 30 min fc 1d fc 3d fc 7d fc 28d
(ms) (ms) (MPa) (MPa) (MPa) (MPa)
1 216E-09 317E-09 0155 299 506 581 704
2 512E-08 418E-09 0298 168 383 547 558
3 448E-08 366E-09 0194 213 334 406 527
4 374E-08 425E-09 0312 140 223 256 408
5 448E-08 342E-09 0173 233 434 507 535
6 512E-08 395E-09 0255 136 371 371 448
7 440E-08 361E-09 0187 108 232 343 532
8 451E-08 433E-09 0342 68 200 263 473
9 446E-08 402E-09 0250 196 328 398 592
10 468E-08 371E-09 0212 171 232 361 556
11
12
423E-08
516E-08
379E-09
400E-09
0221
0246
207
183
313
301
451
435
565
520
327
The derived quadratic statistical models of grout for mini-slump flow time cohesion plate 328
yield stress plastic viscosity induced bleeding at 1 min 5 min and 30 min permeability at 1 329
13
min and 30 min compressibility and compressive strength at 1 3 7 and 28 days are given in 330
Equations (4) to (18) where WB GGBS and ANH are given in codes values 331
Mini-Slump (mm) = 7881 + 1919 WB + 781 ANH + 444 WBANH - 294 GGBS (4) 332
333
Marsh flow time (s) = 1404 - 1153 WB ndash 261 ANH + 281 GGBS (5) 334
335
Plate Cohesion meter (microm) = 86 - 366 WB + 122 GGBS - 107 ANH - 091 WBANH (6) 336
337
Yield Value (Pa) = 1466 ndash 584 WB - 126 WBGGBS - 125 ANH + 124 GGBS (7) 338
339
Plastic Viscosity (Pas) = 063 - 034 WB - 0078 ANH + 0073 GGBS 340
- 0047 WBGGBS - 0022 ANHGGBS (8) 341
342
Induced Bleeding at 1 min (ml) = 3225 + 50 WB + 35 ANH ndash 225 WBANHGGBS (9) 343
344
Induced Bleeding at 5 mins (ml) = 675 + 1375 WB + 575 ANH (10) 345
346
Induced Bleeding at 30 mins (ml) = 6919 + 1381 WB + 594 ANH (11) 347
348
Permeability at 1 min (ms) x 10-8 = 4 + 0615 WB + 0621 AHN ndash 0773 WBGGBS 349
- 0426WBAHN - 0446 AHNGGBS (12) 350
351
Permeability at 30 min (ms) x 10-8 = 0382 + 0035 WB + 0014 ANH 352
+ 0008 WBANHGGBS (13) 353
354
Compressibility = 02396 + 00623 WB + 00194 ANH + 00012 WBANHGGBS (14) 355
356
ƒc 1 d (MPa) = 1705 - 426 WB - 384 ANH - 343 GGBS + 145 WBANH (15) 357
358
ƒc 3 d (MPa) = 3215 - 879 ANH - 412 WB ndash 261 GGBS (16) 359
360
ƒc 7 d (MPa) = 4092ndash 924 ANH - 5 WB - 383 GGBS (17) 361
362
14
ƒc 28 d (MPa) = 5348 - 515 WB - 382 ANH ndash 262 GGBS + 436 ANHGGBS (18) 363
364
The correlation coefficient of most of the proposed models were higher than 090 except for 365
plastic viscosity compressive strength after 3days and compressive strength after 28days 366
which have coefficients of 070 086 and 087 respectively 367
Table 4 shows the average measured responses of the four replicate grouts the coefficients of 368
variation (COV) as well as the estimated errors with a 90 confidence limit for each of the 369
measured properties The estimated error levels for mini-slump plate cohesion meter Marsh 370
cone yield stress plastic viscosity induced bleeding at 1 min 5 min and 30 mins permeability 371
at 1 min and 30 min compressibility and compressive strengths at 1 3 7 28 days were plusmn 22 372
mm plusmn 0001mm plusmn 40 s plusmn 09 Pa plusmn 002 Pa s plusmn 28 ml plusmn 42 ml plusmn 45 ml plusmn 32x10-9 (ms) 373
plusmn 13x10-10 (ms) plusmn 00153 plusmn 13 MPa plusmn 35 MPa plusmn 33 MPa and plusmn 25 MPa respectively 374
The relative experimental errors for mini-slump plate cohesion meter Marsh cone yiled stress 375
plastic viscosity induced bleeding permeability compressibility compressive strengths were 376
limited to 3-11 On the other hand relative error for march cone was up to 30 377
Table 4 Repeatability of test parameters at the central point 378
379
Tests Mini-
slump
Plate
cohesion
Marsh
cone
Yield
stress
Plastic
viscosit
y
Induced
bleeding
at 1 min
Induced
bleedin
g at 5
min
Induced
bleeding
at 30
min
Mean (n=4) 736
mm
001
mm
1318
s
108
Pa
065
Pa s
325
ml
674
ml
679
ml
Coefficient
of variation
()
37 115 372 105 42 127 76 80
Estimate
error (90
confidence
limit)
22
mm
0001
mm
402
s
09
Pa
002
Pa s
28
ml
42
ml
45
ml
380
381 Table 4 Repeatability of test parameters at the central point (continued) 382
383
Tests
Permeability
1 min
x10-8
Permeability
30 min
x10-8
Compressibility frsquoc 1d frsquoc 3d frsquoc 7d frsquoc 28d
Mean (n=4) 463
ms
0388
ms 02323
189
MPa
293
MPa
411
MPa
558
MPa
Coefficient
of variation
()
85 39 8 84 144 98 53
15
Estimate
error (90
confidence
limit)
032
(ms)
0013
(ms)
00153
13
MPa
35
MPa
33
MPa
24
MPa
384
385
31 Accuracy of the established models 386
387
The ratio of predicted-to-measured properties for grout ranged between 087 and 115 388
indicating good accuracy for prediction of mini-slump plate cohesion induced bleeding at 1 389
min 5 mins and 30 mins yield stress plastic viscosity and compressive strength at 1-d 3-d 7-390
d and 28-d In general the proposed models for mini-slump plate cohesion Marsh cone and 391
compressive strength appeared to be accurate in predicting fluidity cohesivity induced 392
bleeding permeability at 30 min compressibility and compressive strength with low scatter 393
between measured and predicted values However the average values of predictedmeasured 394
ratio of yield values were slightly higher (074) 395
396
32 Isoresponses of the proposed models 397
398
The isoresponse surfaces and contour plots for mini-slump plate cohesion Marsh cone yield 399
stress plastic viscosity induced bleeding at 1 min 5 mins and 30 mins permeability at 1 min 400
and 30 mins compressibility and compressive strength at 1-d 3-d 7-d and 28-d were obtained 401
by using response surface methodology (RSM) The isoresponse surfaces and contour plots 402
were obtained from the regression models and because the models contained interaction and 403
second-order variables the contour lines were curved 404
The proposed statistical models can therefore be used to evaluate the effect of a group of 405
variables on the properties affecting the quality of supersulfated grout This allowed for the 406
calculation of isoresponse surfaces from the parameters under study outside the experimental 407
domain and the optimisation of their effects The next sections will discuss the results of each 408
experiment separately 409
331 Mini-slump 410
As shown in Eq 4 the mini-slump is influenced in order of significance by WB ratio 411
anhydrite proportion interaction of WB and ANH and the percentage of GGBS content The 412
WB ratio had the greatest effect on fluidity due to better lubrication of the particles in the paste 413
16
[29] The mini-slump test was accompanied by very low shear The value of mini-slump is to 414
characterise yield stress [38] therefore higher mini-slump value indicated a lower yield stress 415
The effect of WB on the increase of mini-slump was two and half-time than that of ANH (192 416
vs 781 in Eq 4) However increased ANH resulted in a 27 times greater increase in mini-417
slump than reduced GGBS (781 vs -294 in Eq 4) Figure 1(a) shows the effect of increased 418
WB on mini-slump vs ANH (when GGBS was kept constant at 70) and Figure 1(b) shows 419
GGBS vs ANH (when WB was fixed at 039) Based on these figures it is evident that mini-420
slump increased significantly when the dosage of WB and ANH increased 421
422
(a) (b) 423
Fig 1 Isoresponse curves of mini-slump (mm) (a) WB vs ANH and (b) GGBS vs ANH 424
425
332 Marsh cone 426
The time needed for a grout sample to flow through the Marsh cone is proportional to the 427
viscosity of the cement grout the flow time becomes an index of fluidity so the longer the 428
flow time the lower the fluidity Similar to the previous trends Eq 5 shows that the values of 429
Marsh cone are influenced in order of significance by WB GGBS and ANH This is 430
graphically illustrated in Figure 2 431
GGBS = 70
034 039 042 044
0
5
10
15
20
WB
AN
H (
)
65
74
83
92
101
037
AN
H(
)
WB = 039
60 65 70 75 80
0
5
10
15
20
GGBS()
70
75
80
85
17
432
(a) (b) 433
Fig 2 Isoresponse curves for flow time (s) (a) WB vs ANH and (b) GGBS vs ANH 434
435
It can be noted that an increase in WB and ANH or a reduction in GGBS led to decreasing 436
the Marsh cone flow time For example at fixed WB at 039 and GGBS of 70 respectively 437
the increase in ANH dosage from 5 to 20 led to a marked reduction of the Marsh cone flow 438
time from 170 to 140 s (Figure 2(a)) This behaviour is attributed to the change in plastic 439
viscosity of the grout as will be discussed later 440
333 Cohesion plate 441
As shown in Eq 6 the cohesion plate was influenced in order of magnitude by the WB and 442
the percentage of GGBS and ANH The increasing WB had a 34 times the influence on the 443
reduction of the cohesion plate test results as the increased ANH (for a GGBS constant) By 444
comparing the effects of WB and GGBS on plate cohesion the increased WB can be 445
interpreted as having approximately a 3 times greater influence on the reduction of plate 446
cohesion values than the increase in GGBS (-366 vs 122 in Eq 6) given that ANH is held 447
constant The effect of an increase in WB from 034 to 044 and ANH from 0 to 20 with a 448
fixed GGBS dosage of 70 is presented in Figure 3(a) Increased WB led to a decreased 449
cohesion plate value Conversely an increase in GGBS increased the cohesion plate value and 450
an increased ANH caused a reduction in cohesion plate (Figure 3(b)) 451
GGBS = 70
034 036 039 042 0440
5
10
15
20
WB
AN
H (
)
40
6080
100120
140160
180200
220
WB = 039
60 65 70 75 80
0
5
10
15
20
GGBS ()
AN
H (
)
100
120
140
160
180
18
452
(a) (b) 453
Fig 3 Isoresponse curves for plate cohesion meter (a) WB vs ANH and (b) GGBS vs 454 ANH 455
334 Yield stress 456
As shown in Eq 7 yield value was influenced in order of magnitude by WB and dosages of 457
ANH and GGBS Based on Figure 4 (a) when WB was fixed at 039 GGBS maintained at 458
70 and ANH increased to 5 the isoresponse curve showed a yield value of 15 Pa On the 459
other hand if the proportion of ANH was further increased to 20 while GBBS was 460
maintained at 70 the yield value decreased to 135 Pa This corresponds with Eq (7) in 461
which the proportion of WB and ANH were increased while GGBS was kept constant 462
resulting in a reduction in yield stress An increase in GGBS content resulted in an increase of 463
the yield stress 464
Figure 4 (b) shows the isoresponse curve of the yield value with a fixed proportion of GGBS 465
at 70 When WB was 039 and ANH was 5 the isoresponse of the predicted yield value 466
was 155 Pa If ANH was increased to 20 while maintaining WB at 039 the isoresponse of 467
the yield value was 135 Pa 468
It can be interesting to note that the observed results for the yield stress are closed to the one 469
observed with the cohesion plate and mini-slump tests This is expected as yield stress values 470
can be derived from those two simple tests 471
GGBS = 70
034 037 039 042 0440
5
10
15
20
WB
AN
H(
)
45
55
65
7585
95
105
115
WB = 039
60 65 70 75 800
5
10
15
20
GGBS ()
AN
H(
)
75
85
95
105
19
472
(a) (b) 473
Fig 4 Isoresponse curves for yield stress (Pa) (a) WB vs ANH and (b) GGBS vs ANH 474
335 Plastic viscosity 475
Plastic viscosity was influenced in order of magnitude by WB and the dosages of ANH and 476
GGBS ANH and GGBS had almost opposite effects on plastic viscosity (-0078 vs 0073 in 477
Eq 8) As shown in Eq (8) increased WB had the greatest primary effect on plastic viscosity 478
(034 vs 0078 and 0073) The increased WB had approximately a 44 times greater influence 479
on reducing plastic viscosity than increased ANH or decreased GGBS 480
In the isoresponse curve of plastic viscosity shown in Figure 5 (a) when GGBS was fixed at 481
70 WB set at 039 and ANH maintained at 5 the predicted plastic viscosity value was 482
068 Pas On the other hand if the dosage of ANHB was increased to 20 while maintaining 483
a similar WB the plastic viscosity was reduced to 055 Pas 484
In Figure 5 (b) WB was fixed at 039 when GGBS was held at 70 and ANH at 5 the 485
predicted plastic viscosity was 067 Pas However when ANH was increased to 20 and 486
GGBS was maintained at 70 the predicted plastic viscosity dropped to 055 Pas 487
AN
H(
)
GGBS = 70
034 037 039 042 044
0
5
10
15
20
WB
1012
1416
18
20
WB = 039
60 65 70 75 800
5
10
15
20
GGBS ()
AN
H(
)
13
14
15
20
488
(a) (b) 489
Fig 5 Isoresponse curve for plastic viscosity (Pas) (a) WB vs ANH and (b) GGBS vs 490
ANH 491
336 Induced bleeding 492
The induced bleeding equations for 1 and 5 minutes (Eqs 9 10) and 30 minutes (Eq 11) are 493
very similar The two influencing factors of induced bleeding are WB ratio and anhydrite 494
WB ratio has the greatest effect over two times the effect of anhydrite content Figure 6 shows 495
the isoresponse for bleeding versus the WB ratio for a fixed value of GGBS at 70 It can be 496
seen that when an anhydrite value is selected and the WB ratio is increased the bleeding will 497
also increase Similarly if a WB ratio is selected and the anhydrite content is increased the 498
bleeding will again increase 499
500
GGBS = 70
034 037 039 042 0440
5
10
15
20
WB
AN
H(
)
035
045
055
065
075
085
095
WB = 039
60 65 70 75 800
5
10
15
20
GGBS ()
AN
H(
)
055
060
065
075
034 036 039 042 044
0
5
10
15
20
WB
AN
H (
)
26
28
30
3234
36
38
40
GGBS=70
21
(a) 501
502
(b) (c) 503
Fig 6 Isoresponse curves for induced bleeding at 1 5 and 30 min WB vs ANH 504
337 Permeability 505
Figure 7 (a) and (b) showed firstly that the permeability decreased significantly from 1 min to 506
30 min Permeability at 1 min was influenced in order of magnitude by WB and the dosage 507
of ANH All interactions between 3 parameters had almost opposite effects on permeability 508
(Eq 12) As shown in Eq (12) increased WB and AHN had the greatest primary effect on 509
permeability at 1 min It seems there is an optimum reached at WB = 40 and AHN at 17 510
Similarly the permeability at 30 min is affected in order of significance by WB followed by 511
ANH (Eq 13) In Figure 7 (b) WB was fixed at 039 when GGBS was held at 70 and ANH 512
at 10 the predicted permeability was 038 x 10-8 (ms) However when ANH was increased 513
to 20 and GGBS was maintained at 70 the predicted permeability increased to 040x10-8 514
(ms) 515
516
GGBS = 70
034 036 039 042 0440
5
10
15
20
WB
AN
H (
)
545
61
675
74
805
GGBS = 70
034 036 039 042 0440
5
10
15
20
WB
AN
H (
)
56
60
64
68
72
7680
84
22
517
(a) (b) 518
Fig 7 Isoresponse curves for permeability at 1 and 30 min WB vs ANH 519
338 Compressibility 520
As shown in Eq (14) the compressibility was influenced in order of magnitude by the WB 521
and the percentage of ANH The interaction between 3 parameters affected also the 522
compressibility The increasing WB had a 32 times the influence on the increase of the 523
compressibility results as the increased ANH (for a GGBS constant) The effect of an increase 524
in WB from 034 to 044 and ANH from 0 to 20 with a fixed GGBS dosage of 70 is 525
presented in Figure 8 Increased WB led to an increase of compressibility Similarly an 526
increase in AHN increased the compressibility 527
528
Fig 8 Isoresponse curves for compressibility WB vs ANH 529
034 036 039 042 044
0
5
10
15
20
GGBS = 70 WB
AN
H (
)
3
35
4
4
45
5
034 036 039 042 044
0
5
10
15
20
WB
AN
H (
)
034
035
036 037 038 039 04
041
042
4
GGBS=70
034 036 039 042 044
0
5
10
15
20
WB
AN
H (
)
017
019
021 023 025 027
029
031
GGBS=70
23
530
339 Compressive strength 531
After one day from Eq 15 the influencing factors in order of significance are WB ratio 532
anhydrite content GGBS content and the interaction of WB and ANH The effect of the first 533
three was similar but WB had 11 times greater effect than anhydrite and 125 times greater 534
effect than GGBS While the interaction of WB and anhydrite had around a third of the 535
influence of WB Figures 9 (a) and (b) show the isoresponses for 1-day compressive strength 536
From Figure 9 (a) it can be seen when the GGBS content is fixed at 70 for a given anhydrite 537
content increasing the WB ratio will decrease the strength Also if a WB ratio is selected and 538
the anhydrite is increased similarly the strength will decrease From Figure 9 (b) with the WB 539
ratio fixed at 039 once again an increase in GGBS led to a reduction of compressive strength 540
at 1 day 541
542
(a) (b) 543
Fig9 Isoresponse curves for compressive strength at 1d (a) (WB vs ANH) and (b) (GGBS 544 vs ANH) 545
Eqs 16 17 and 18 show the effect of GGBS and ANH percentages on compressive strength at 546
3-d 7-d and 28-d Figures 10 11 and 12 show the isoresponse of the compressive strength at 547
3-d 7-d and 28-d respectively with WB vs ANH Increased ANH led to a decrease of 3-d 548
and 7-d compressive strength As expected an Increase in WB led to a decrease in compressive 549
strength The percentage of ANH had a negative effect on compressive strength and showed a 550
greater influence particularly at 3-d and 7-d (879 (3 d) amp 924 (7d) vs 382 (28 d)) GGBS has 551
a negative impact on early strength development The negative effect of GGBS on compressive 552
GGBS = 70
034 037 039 042 0440
5
10
15
20
WB
AN
H(
)
12
14
16
18
20
22
2426
WB = 039
60 65 70 75 800
5
10
15
20
GGBS ()
AN
H(
)
10
12
14
16
18
20
22
24
strength at early ages is clearly attributable to the fact that up to 80 of cement has been 553
replaced by GGBS and it takes some time for GGBS to start developing its pozzolanic action 554
at a noticeable level The results indicate that ANH content influences strength to a greater 555
extent than GGBS at all ages The SO3 content was reported to have great influence on the 556
strength [39 40] 557
558
(a) (b) 559
Fig10 Isoresponse curves for compressive strength at 3d (a) (WB vs ANH) and (b) 560 (GGBS vs ANH) 561
562
563
(a) (b) 564
Fig11 Isoresponse curves for compressive strength at 7d (a) (WB vs ANH) and (b) (WB 565 vs ANH) 566
567
GGBS = 70
034 036 039 042 0440
5
10
15
20
WB
AN
H (
)
24
2628
30
3234
3638
4042
WB = 039
60 65 70 75 80
0
5
10
15
20
GGBS ()
AN
H (
)
2426
2830
32
34
36
3840
42
GGBS = 70
034 037 039 042 044
0
5
10
15
20
WB
AN
H(
)
3032
34
3638
40
42
44
46
48
WB = 039
60 65 70 75 80
0
5
10
15
20
GGBS ()
AN
H(
)
32
34
36
38
40
42
44
46
48
25
568
(a) (b) 569
Fig12 Isoresponse curves for compressive strength at 28d (a) (WB vs ANH) and (b) 570
(ANH vs GGBS) 571
3310 Discussion of the effect of WB GGBS and ANH 572
As expected the increase of WB led to an increase in mini-slump induced bleeding and a 573
reduction in flow time plate cohesion yield stress plastic viscosity and compressive strengths 574
This can be attributed to more water in the system 575
An increase in GGBS content resulted in a reduction of the flow time plate cohesion yield 576
stress and plastic viscosity while the fluidity is improved This was due to the fact the specific 577
gravity of slag is lower than that of PC leading to an increase in the paste volume and thus 578
improving the fluidity of paste 579
In case of an increase of ANH proportion while WB and GGBS were kept constant it led to 580
an increased mini-slump and induced bleeding while the flow time plate cohesion yield stress 581
and plastic viscosity were reduced This was due to the lower reactivity of ANH resulting in an 582
increase of water needed for lubrication of paste 583
As expected an increase in WB lead to an increase in induced bleeding permeability and a 584
decrease in compressibility [33 35] This is due to the increase in liquid volume between the 585
particles and to the reduction in the amount of interparticle forces Globally the compressibility 586
decreases and the permeability increases with ANH It can be explained by the reduced specific 587
area and lower reactivity that can lead to more available water in the samples 588
3311 Heat of Hydration 589
Heat of hydration is considered an important factor in the cement design as low heat of 590
hydration reduces the effect of thermal cracking The heat flow results of the calorimeter test 591
performed over a three days period can be seen in Figure 13 592
GGBS = 70
034 036 039 042 0440
5
10
15
20
WB
AN
H (
)
46
48
50
52
54
56
58
60
WB = 039
0 5 10 15 2060
65
70
75
80
ANH ()
GG
BS
(
)
50
52
54
56
5860
62
26
593
Fig 13 Heat flow graphs for first 3 days of reaction 594
Figure 13 presents that the largest peaks were in mixes 1 2 5 and 6 This shows that these 595
reactions generated the most heat and that they were quick Mixes 1 and 2 have the highest 596
OPC content at 40 and this suggests that to lower the heat of the reaction minimal OPC 597
should be used This is confirmed by the fact that mixes 5 and 6 have the next highest OPC 598
contents the same percentage as mixes 3 4 and 9 (one of the repeated mixes) which have 599
anhydrite present This implies that the presence of anhydrite will lengthen the reaction process 600
and reduce the heat produced during setting significantly The graph shows this by the absence 601
of a sharp peak instead a gentle curved hump is shown over a 2-day period whereas the mixes 602
showing a sharp peak occur after about 12 hrs Mix 7 which has the same solids content as 603
mix 8 but a lower WB ratio and no cement present showed the lowest heat flow during the 604
hydration process 605
Figure 14 shows the cumulative heat generation during the first 3 days of setting It is clear that 606
the two mixes (1 and 2) with highest cement content and absence of anhydrite had the highest 607
cumulative heat development over the 3-day period 643J and 594J respectively Mixes 3456 608
and 9 which all have 20 OPC content generated similar heat value over the 3 days Results 609
of mixes containing ANH implies that over the period that the anhydrite did not reduce the 610
cumulative heat generated but slowed the reaction and reduce the peak heat generated The 611
0
0002
0004
0006
0008
001
0012
0 50000 100000 150000 200000 250000 300000
He
at F
low
(mW
)
Time s()
M1
M2
M3
M4
M5
M6
M7
M9
1Day
2Day
3day
1d 2d 3d
27
graphs also suggest that a higher WB ratio produced a lower cumulative and peak heat 612
generation613
614
Fig 14 Cumulative heat generation curves for first 3 days 615
3312 pH measurements 616
Fig 15 summarises the results of pH and the nine mixes with different compositions of WB 617
the percentages of cement GGBS and ANH It is shown that Supersulfated cements (SSCs) 618
have lower pH values (lt 125 at all ages) than PC which has a pH of 139 [41] making SSC 619
more preferable in essential applications such as nuclear waste encapsulation 620
The figure shows that the pH value decreased with time for all samples between 1 and 7 days 621
Similar trend was observed in the majority of mixes between 7 and 28 days except for sample 622
2 5 and 9 which showed slight increase in the pH values This decrease refers to the 623
consumption of ions in the pore structure due to the hydration process 624
0
100
200
300
400
500
600
700
800
0 50000 100000 150000 200000 250000 300000
(J)
Time (s)
M1
M2
M3
M4
M5
M6
M7
M9
1 Day
3 Day
2 day
1d 2d 3d
1
2
3
9
45
6
7
28
625
626 Fig 15 Summary of pore solution pH 627
628
The incorporation of ANH replacing the Portland cement (C) results in remarkable decrease in 629
pH at all ages as introducing the ANH reduced the lower initial pH Likewise the increase in 630
the content of GGBS led to a decrease in the pH value of the pore structure as GGBS has lower 631
initial pH than Portland cement The increase of WB ratio decreased the pH value This is in 632
agreement with Collier [41] who found that increasing the wb ratio from 05 to 06 increased 633
the pH by I unit This was attributed to the increased availability of water in the case of WB 634
of 06 allowing hydration of more cement powder thereby releasing more hydroxide anions 635
into solution However in this study the WB ratio did not show a significant effect on 636
lowering the pH These results are in agreement with [42] which also found that decreasing the 637
pH improved the bulk resistivity of SSC mixtures 638
3313 SEM 639
Figure 16 shows the SEM images of some mixes at various magnifications The images clearly 640
show the dense and compact structure of the cement after seven days The dense structure was 641
another requirement from the cement chosen to enclose the waste to prevent leaching The 642
microstructure consists mainly of C-S-H the main hydration product and unhydrated slag 643
grains C-S-H is formed after the dissolution of slag grains when contacting the water and 644
alkalis and then the ionic species saturate the solution and then precipitate as hydrated phases 645
[8] There were abundant grains of hydrated and partially hydrated slag grains some small 646
1080
1100
1120
1140
1160
1180
1200
1220
1240
1260
1280
1 2 3 4 5 6 7 8 9
pH
val
ue
Mix Number
1 Day
7 Days
28 Days
29
GGBS particles presented rims of reaction products (eg Mix 6-Figure 16 (f) and Mix 9-Figure 647
16 (h)) It was found by [11] that the composition of the reaction rims around slag was similar 648
to that of the C-S-H from PC However [12] found that in the CndashSndashH of SSC is apparently 649
more foil like which is different than the fibrillar morphology of C-S-H in OPC Mix 3 and 650
Mix 4 (Figure 16 (c) and (d) respectively) exhibits more micro voids in the micrsostructure 651
which could explain the low strength of these mixes compared to mix 1 and 2 Ettringite was 652
not detected Ettringite is not the most abundant phase and it is not easy to detect in dried 653
polished samples because it is easily decomposed under the drying conditions of the vacuum 654
of the microscope column [11] 655
(a) Mix 1 image at 1100 magnification (b) Mix 2 image at 900 magnification
(c) Particle of unreacted slag mix3 7 days (d) An overall image of mix 4 at 7days
showing CSH and BFS particles
30
(e) Mix 5 image at 1100 magnification (f) Mix 6 image at 2300 magnification
(g) Mix 7 image at 2000 magnification (h) Mix 9 image at 2700 magnification
Fig 16 SEM results 656
4 Conclusions 657
The paper focused on optimizing the SSC cement grout in order to get the best of it The effect 658
of GGBS WB and ANH dosages on the grout fluidity rheological properties induced 659
bleeding maximum heat of hydration and compressive strength was investigated using 660
factorial design approach and analysis The models derived in this study are valid for the 661
experimental area corresponding to grout mixes made with variable levels of WB ANH and 662
GGBS in the ranges of 034 to 044 0 to 20 by mass of binder 60 to 80 by mass of 663
binder respectively Based on the results from this study the following conclusions are drawn 664
- In comparison to GGBS and ANH WB ratio had more pronounced effects on the 665
results of mini-slump plate cohesion meter Marsh cone time yield stress plastic viscosity 666
induced bleeding permeability compressibility and compressive strength 667
31
- The increase in the dosage of GGBS led to an increase in the values of plate cohesion 668
meter Marsh cone time yield stress and plastic viscosity while reducing the mini-slump 669
values maximum hydration and compressive strength This is ascribed to the fine nature 670
of GGBS particles and pozzolanic effect 671
- While the ANH particles caused a decrease in the maximum of heat of hydration it 672
increased the induced bleeding permeability and compressibility due to its dominant effect 673
on increasing the dormant period and increasing the rates of solid sedimentation and 674
induced bleeding water 675
- Increasing the dosage of ANH in grout reduced the hydrations kinetic at early-age and 676
thus reduced the compressive strength at 1d 3d and 7d However this effect diminished 677
at later ages at 28 d in a manner similar to increasing WB 678
- The increase in the dosage of ANH led to an increase in the mini-slump values 679
(fluidity) but a decrease in the values of yield stress plastic viscosity plate cohesion and 680
Marsh cone time This is attributed to better deflocculation of particles at the fresh state 681
- The increase of GGBS percentage delayed the reaction process and decreased the total 682
heat after 3 days while WB slightly reduced the total heat it didnrsquot significantly affect the 683
reaction process 684
- pH measurements in the present study confirmed the suitability of these mixture to low-685
pH applications as the increase in both the GGBS and ANH markedly decreased the initial 686
pH thereby lowering the pH at different ages 687
- The modelling and prediction of the response of other points in the experimental domain 688
were therefore possible Although the models are based on a given set of materials they 689
can be easily used to generate future results using other materials 690
- Dense microstructure was observed for mixes examined in this study C-S-H is the main 691
reaction product with presence of unreacted slag grains embedded well in the structure 692
However some micro voids were observed in mixes containing ANH which led to lower 693
compressive strength of mixes with ANH 694
CRediT authorship contribution statement 695
MSonebi and YBai did the conceptualization and the design of investigation as well as 696 performing the experiments MSonebi carried out the software analysis of the results and the 697
32
visualization MSonebi AAbdalqader T Fayyad and APerrot analysed the results and 698 wrote the original draft and reviewed and edited the final version 699
Declaration of Competing Interest 700
The authors declare that they have no known competing financial interests or personal 701 relationships that could have appeared to influence the work reported in this paper 702
Acknowledgments 703
The authors would like to express their gratitude to P McCann from QUB and N Collier 704 from Eden Nuclear and Environment Ltd for their helps for some experiments 705
706
References 707
1 Schneider M Romer M Tschudin M Bolio H (2011) Sustainable cement production-708 present and future Cement and Concrete Research 41642ndash650 709
httpsdoiorg101016jcemconres201103019 710
2 Madlool NA Saidur R Hossain MS Rahim NA (2011) A critical review on energy use 711 and savings in the cement industries Renewable and Sustainable Energy Reviews 712
152042ndash2060 httpsdoiorg101016jrser201101005 713
3 EN15743 (2015) BS EN 157432010+A12015 Supersulfated cement - Composition 714
specifications and conformity criteria BSI 715
4 Khatib JM Wright L Mangat PS (2016) Mechanical and physical properties of concrete 716
containing FGD waste Magazine of Concrete Research 68550ndash560 717 httpsdoiorg101680macr1500092 718
5 Khatib JM Mangat PS Wright L (2008) Sulfate resistance of mortar containing 719
simulated FGD waste Proceedings of Institution of Civil Engineers Construction 720 Materials 161119ndash128 httpsdoiorg101680coma20081613119 721
6 (2020) Specifying Sustainable Concrete 722
7 Hewlett PC (2004) Learsquos Chemistry of Cement and Concrete fourth edi Elsevier 723 Science amp Technology Books Oxford 724
8 Gruskovnjak A Lothenbach B Winnefeld F et al (2008) Hydration mechanisms of 725 super sulphated slag cement Cement and Concrete Research 38983ndash992 726
httpsdoiorg101016jcemconres200803004 727
9 Grounds T Nowell D V Wilburn FW (2003) Resistance of supersulfated cement to 728 strong sulfate solutions Journal of Thermal Analysis and Calorimetry 72181ndash190 729
httpsdoiorg101023A1023928021602 730
10 Grounds T Nowell D V Wilburn FW (1995) The influence of temperature and 731
different storage conditions on the stability of supersulphated cement Journal of 732 Thermal Analysis 45385ndash394 httpsdoiorg101007BF02548772 733
33
11 Bazalduacutea-Medelliacuten ME Fuentes AF Gorokhovsky A Escalante-Garciacutea JI (2015) Early 734 and late hydration of supersulphated cements of blast furnace slag with fluorgypsum 735 Materiales de Construccion 65e043 httpsdoiorg103989mc201506013 736
12 Matschei T Bellmann F Stark J (2005) Hydration behaviour of sulphate-activated slag 737 cements Advances in Cement Research 17167ndash178 738
httpsdoiorg101680adcr2005174167 739
13 Richardson IG (2000) Nature of the hydration products in hardened cement pastes 740 Cement and Concrete Composites 2297ndash113 httpsdoiorg101016S0958-741 9465(99)00036-0 742
14 Baux C Phelipot-Mardeleacute A Lanos C et al (2013) PERFORMANCES OF SUPER 743 SULFATED CEMENTS In International Conference on Concrete Under Severe 744 Conditions pp 1857ndash1870 745
15 Annabelle Phelipot-Mardeleacute Gabriel Samson Christophe Lanos (2015) Super sulfated 746 cement formulation and uses In Construction Materials ConMat Whistler Canada 747
16 Milestone NB (2006) Reactions in cement encapsulated nuclear wastes need for 748 toolbox of different cement types Advances in Applied Ceramics 10513ndash20 749
httpsdoiorg101179174367606X81678 750
17 Batchelor B (2006) Overview of waste stabilization with cement Waste Management 751
26689ndash698 httpsdoiorg101016JWASMAN200601020 752
18 Zhang T Cheeseman CR Vandeperre LJ (2011) Development of low pH cement 753
systems forming magnesium silicate hydrate (MSH) Cement and Concrete Research 754 41439ndash442 httpsdoiorg101016jcemconres201101016 755
19 Mobasher N Bernal SA Provis JL (2016) Structural evolution of an alkali sulfate 756
activated slag cement Journal of Nuclear Materials 46897ndash104 757 httpsdoiorg101016JJNUCMAT201511016 758
20 Wang J Yu B Gao Y (2014) Hydration Characteristics of Super Sulphated Cement 759 with Different Fineness In Proceedings of the International Conference on Material 760 and Environmental Engineering (ICMAEE 2014) Atlantis Press Paris France 761
21 Naumlgele E (1986) The Zeta-potential of cement Part II Effect of pH-value Cement and 762 Concrete Research 16853ndash863 httpsdoiorg1010160008-8846(86)90008-6 763
22 Jain N Civil MG-IJ of M and 2015 U (2015) Formulation of Sulphate Resistant Super 764 Sulphated Cement Using Fluorogypsum and Granulated Blast Furnace Slag IOSR 765
Journal of Mechanical and Civil Engineering (IOSR-JMCE) 12153ndash159 766
23 Gao YX Yu BY Xu FL (2012) Effect of Modified Phosphogypsum on the Mechanical 767 Properties of Super Sulphate Cement Applied Mechanics and Materials 161264ndash268 768 httpsdoiorg104028wwwscientificnetAMM161264 769
24 Kantro D (1980) Influence of Water-Reducing Admixtures on Properties of Cement 770 PasteampmdashA Miniature Slump Test Cement Concrete and Aggregates 295ndash102 771
httpsdoiorg101520CCA10190J 772
34
25 Svermova L Sonebi M Bartos PJM (2003) Influence of mix proportions on rheology of 773 cement grouts containing limestone powder Cement and Concrete Composites 25737ndash774 749 httpsdoiorg101016S0958-9465(02)00115-4 775
26 Sonebi M (2006) Rheological properties of grouts with viscosity modifying agents as 776 diutan gum and welan gum incorporating pulverised fly ash Cement and Concrete 777
Research 361609ndash1618 httpsdoiorg101016JCEMCONRES200605016 778
27 Nehdi M Rahman M (2004) Effect of Geometry and Surface Friction of Test Accessory 779 on Oscillatory Rheological Properties of Cement Pastes ACI Materials Journal 780 101416ndash424 httpsdoiorg101435913428 781
28 Khayat KH Yahia A (1997) Effect of Welan Gum-High-Range Water Reducer 782 Combinations on Rheology of Cement Grout ACI Materials Journal 94365ndash372 783 httpsdoiorg1014359321 784
29 Lombardi G (1985) THE ROLE OF COHESION IN CEMENT GROUTING OF 785 ROCK In Proceedings of Fifteenth Congress on Large Dams International 786 Commission on Large Dams pp 235ndash261 787
30 Perrot A Rangeard D Picandet V Meacutelinge Y (2013) Hydro-mechanical properties of 788
fresh cement pastes containing polycarboxylate superplasticizer Cement and Concrete 789 Research 53221ndash228 httpsdoiorg101016JCEMCONRES201306015 790
31 Perrot A Lecompte T Khelifi H et al (2012) Yield stress and bleeding of fresh cement 791 pastes Cement and Concrete Research 42937ndash944 792
httpdxdoiorg101016jcemconres201203015 793
32 Sonebi M Perrot A (2019) Effect of mix proportions on rheology and permeability of 794 cement grouts containing viscosity modifying admixture Construction and Building 795
Materials 212687ndash697 httpsdoiorg101016jconbuildmat201904022 796
33 Picandet V Rangeard D Perrot A Lecompte T (2011) Permeability measurement of 797
fresh cement paste Cement and Concrete Research 41330ndash338 798 httpsdoiorg101016JCEMCONRES201011019 799
34 Perrot A Rangeard D (2017) Effects of mix design parameters on consolidation 800
behaviour of fresh cement-based materials Materials and Structures 50117 801 httpsdoiorg101617s11527-016-0988-0 802
35 Rangeard D Perrot A Picandet V et al (2015) Determination of the consolidation 803 coefficient of low compressibility materials application to fresh cement-based 804
materials Materials and Structures 481475ndash1483 httpsdoiorg101617s11527-014-805 0247-1 806
36 Massoussi N Keita E Roussel N (2017) The heterogeneous nature of bleeding in 807 cement pastes Cement and Concrete Research 95108ndash116 808 httpsdoiorg101016JCEMCONRES201702012 809
37 Montgomery D (2007) Design and Analysis of Experiments Second Edition John 810
Wiley amp Sons 811
35
38 Roussel N Stefani C Leroy R (2005) From mini-cone test to Abrams cone test 812 Measurement of cement-based materials yield stress using slump tests Cement and 813 Concrete Research 35817ndash822 httpsdoiorg101016jcemconres200407032 814
39 Mangat PS Khatib JM Wright L (2006) Optimum utilisation of FGD waste in blended 815 binders Proceedings of Institution of Civil Engineers Construction Materials 159119ndash816
127 httpsdoiorg101680coma20061593119 817
40 Khatib JM Mangat PS Wright L (2013) Early age porosity and pore size distribution of 818 cement paste with flue gas desulphurisation (FGD) waste Journal of Civil Engineering 819 and Management 19622ndash627 httpsdoiorg103846139237302013793609 820
41 Collier NC Milestone NB Gordon LE Ko SC (2014) The suitability of a supersulfated 821 cement for nuclear waste immobilisation Journal of Nuclear Materials 452457ndash464 822 httpsdoiorg101016jjnucmat201405078 823
42 Masoudi R (2018) Examining compositions hydration mechanisms and properties of 824 supersulfated cement for use in concrete by Examining compositions hydration 825 mechanisms and properties of supersulfated cement for use in concrete University of 826 Toronto 827
828
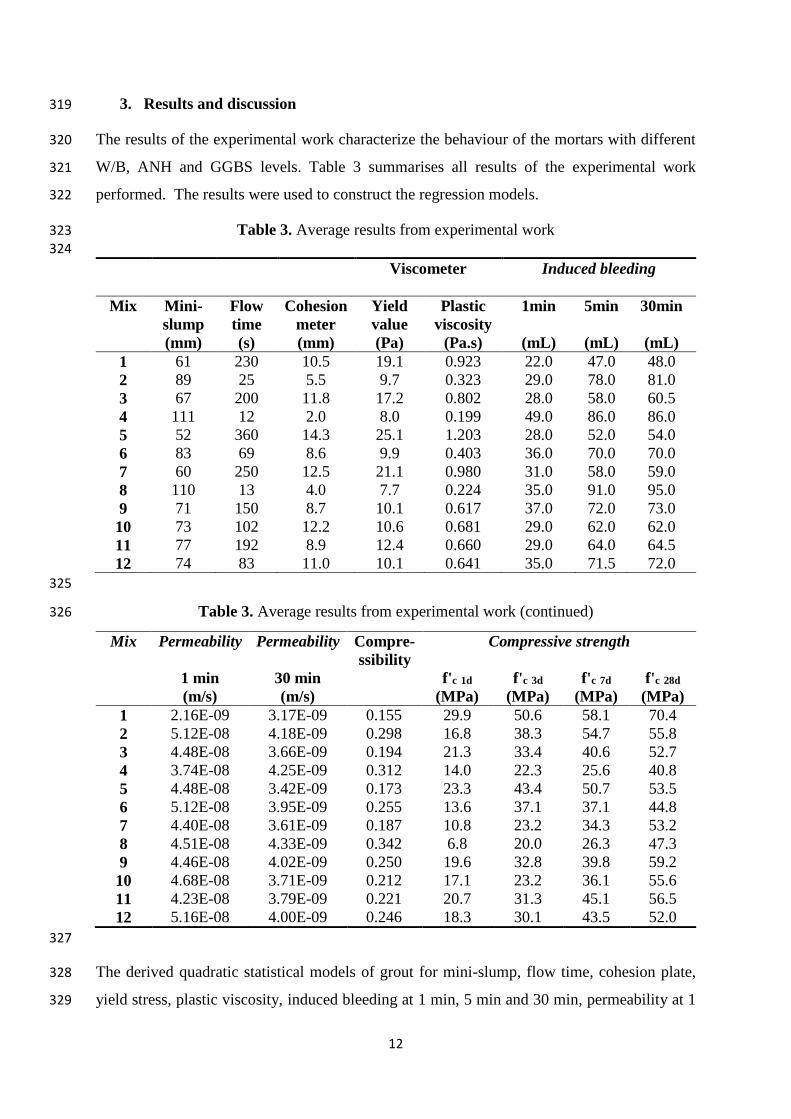
12
3 Results and discussion 319
The results of the experimental work characterize the behaviour of the mortars with different 320
WB ANH and GGBS levels Table 3 summarises all results of the experimental work 321
performed The results were used to construct the regression models 322
Table 3 Average results from experimental work 323 324
Viscometer Induced bleeding
Mix Mini-
slump
Flow
time
Cohesion
meter
Yield
value
Plastic
viscosity
1min 5min 30min
(mm) (s) (mm) (Pa) (Pas) (mL) (mL) (mL)
1 61 230 105 191 0923 220 470 480
2 89 25 55 97 0323 290 780 810
3 67 200 118 172 0802 280 580 605
4 111 12 20 80 0199 490 860 860
5 52 360 143 251 1203 280 520 540
6 83 69 86 99 0403 360 700 700
7 60 250 125 211 0980 310 580 590
8 110 13 40 77 0224 350 910 950
9 71 150 87 101 0617 370 720 730
10 73 102 122 106 0681 290 620 620
11
12
77
74
192
83
89
110
124
101
0660
0641
290
350
640
715
645
720
325
Table 3 Average results from experimental work (continued) 326
Mix Permeability Permeability Compre-
ssibility
Compressive strength
1 min 30 min fc 1d fc 3d fc 7d fc 28d
(ms) (ms) (MPa) (MPa) (MPa) (MPa)
1 216E-09 317E-09 0155 299 506 581 704
2 512E-08 418E-09 0298 168 383 547 558
3 448E-08 366E-09 0194 213 334 406 527
4 374E-08 425E-09 0312 140 223 256 408
5 448E-08 342E-09 0173 233 434 507 535
6 512E-08 395E-09 0255 136 371 371 448
7 440E-08 361E-09 0187 108 232 343 532
8 451E-08 433E-09 0342 68 200 263 473
9 446E-08 402E-09 0250 196 328 398 592
10 468E-08 371E-09 0212 171 232 361 556
11
12
423E-08
516E-08
379E-09
400E-09
0221
0246
207
183
313
301
451
435
565
520
327
The derived quadratic statistical models of grout for mini-slump flow time cohesion plate 328
yield stress plastic viscosity induced bleeding at 1 min 5 min and 30 min permeability at 1 329
13
min and 30 min compressibility and compressive strength at 1 3 7 and 28 days are given in 330
Equations (4) to (18) where WB GGBS and ANH are given in codes values 331
Mini-Slump (mm) = 7881 + 1919 WB + 781 ANH + 444 WBANH - 294 GGBS (4) 332
333
Marsh flow time (s) = 1404 - 1153 WB ndash 261 ANH + 281 GGBS (5) 334
335
Plate Cohesion meter (microm) = 86 - 366 WB + 122 GGBS - 107 ANH - 091 WBANH (6) 336
337
Yield Value (Pa) = 1466 ndash 584 WB - 126 WBGGBS - 125 ANH + 124 GGBS (7) 338
339
Plastic Viscosity (Pas) = 063 - 034 WB - 0078 ANH + 0073 GGBS 340
- 0047 WBGGBS - 0022 ANHGGBS (8) 341
342
Induced Bleeding at 1 min (ml) = 3225 + 50 WB + 35 ANH ndash 225 WBANHGGBS (9) 343
344
Induced Bleeding at 5 mins (ml) = 675 + 1375 WB + 575 ANH (10) 345
346
Induced Bleeding at 30 mins (ml) = 6919 + 1381 WB + 594 ANH (11) 347
348
Permeability at 1 min (ms) x 10-8 = 4 + 0615 WB + 0621 AHN ndash 0773 WBGGBS 349
- 0426WBAHN - 0446 AHNGGBS (12) 350
351
Permeability at 30 min (ms) x 10-8 = 0382 + 0035 WB + 0014 ANH 352
+ 0008 WBANHGGBS (13) 353
354
Compressibility = 02396 + 00623 WB + 00194 ANH + 00012 WBANHGGBS (14) 355
356
ƒc 1 d (MPa) = 1705 - 426 WB - 384 ANH - 343 GGBS + 145 WBANH (15) 357
358
ƒc 3 d (MPa) = 3215 - 879 ANH - 412 WB ndash 261 GGBS (16) 359
360
ƒc 7 d (MPa) = 4092ndash 924 ANH - 5 WB - 383 GGBS (17) 361
362
14
ƒc 28 d (MPa) = 5348 - 515 WB - 382 ANH ndash 262 GGBS + 436 ANHGGBS (18) 363
364
The correlation coefficient of most of the proposed models were higher than 090 except for 365
plastic viscosity compressive strength after 3days and compressive strength after 28days 366
which have coefficients of 070 086 and 087 respectively 367
Table 4 shows the average measured responses of the four replicate grouts the coefficients of 368
variation (COV) as well as the estimated errors with a 90 confidence limit for each of the 369
measured properties The estimated error levels for mini-slump plate cohesion meter Marsh 370
cone yield stress plastic viscosity induced bleeding at 1 min 5 min and 30 mins permeability 371
at 1 min and 30 min compressibility and compressive strengths at 1 3 7 28 days were plusmn 22 372
mm plusmn 0001mm plusmn 40 s plusmn 09 Pa plusmn 002 Pa s plusmn 28 ml plusmn 42 ml plusmn 45 ml plusmn 32x10-9 (ms) 373
plusmn 13x10-10 (ms) plusmn 00153 plusmn 13 MPa plusmn 35 MPa plusmn 33 MPa and plusmn 25 MPa respectively 374
The relative experimental errors for mini-slump plate cohesion meter Marsh cone yiled stress 375
plastic viscosity induced bleeding permeability compressibility compressive strengths were 376
limited to 3-11 On the other hand relative error for march cone was up to 30 377
Table 4 Repeatability of test parameters at the central point 378
379
Tests Mini-
slump
Plate
cohesion
Marsh
cone
Yield
stress
Plastic
viscosit
y
Induced
bleeding
at 1 min
Induced
bleedin
g at 5
min
Induced
bleeding
at 30
min
Mean (n=4) 736
mm
001
mm
1318
s
108
Pa
065
Pa s
325
ml
674
ml
679
ml
Coefficient
of variation
()
37 115 372 105 42 127 76 80
Estimate
error (90
confidence
limit)
22
mm
0001
mm
402
s
09
Pa
002
Pa s
28
ml
42
ml
45
ml
380
381 Table 4 Repeatability of test parameters at the central point (continued) 382
383
Tests
Permeability
1 min
x10-8
Permeability
30 min
x10-8
Compressibility frsquoc 1d frsquoc 3d frsquoc 7d frsquoc 28d
Mean (n=4) 463
ms
0388
ms 02323
189
MPa
293
MPa
411
MPa
558
MPa
Coefficient
of variation
()
85 39 8 84 144 98 53
15
Estimate
error (90
confidence
limit)
032
(ms)
0013
(ms)
00153
13
MPa
35
MPa
33
MPa
24
MPa
384
385
31 Accuracy of the established models 386
387
The ratio of predicted-to-measured properties for grout ranged between 087 and 115 388
indicating good accuracy for prediction of mini-slump plate cohesion induced bleeding at 1 389
min 5 mins and 30 mins yield stress plastic viscosity and compressive strength at 1-d 3-d 7-390
d and 28-d In general the proposed models for mini-slump plate cohesion Marsh cone and 391
compressive strength appeared to be accurate in predicting fluidity cohesivity induced 392
bleeding permeability at 30 min compressibility and compressive strength with low scatter 393
between measured and predicted values However the average values of predictedmeasured 394
ratio of yield values were slightly higher (074) 395
396
32 Isoresponses of the proposed models 397
398
The isoresponse surfaces and contour plots for mini-slump plate cohesion Marsh cone yield 399
stress plastic viscosity induced bleeding at 1 min 5 mins and 30 mins permeability at 1 min 400
and 30 mins compressibility and compressive strength at 1-d 3-d 7-d and 28-d were obtained 401
by using response surface methodology (RSM) The isoresponse surfaces and contour plots 402
were obtained from the regression models and because the models contained interaction and 403
second-order variables the contour lines were curved 404
The proposed statistical models can therefore be used to evaluate the effect of a group of 405
variables on the properties affecting the quality of supersulfated grout This allowed for the 406
calculation of isoresponse surfaces from the parameters under study outside the experimental 407
domain and the optimisation of their effects The next sections will discuss the results of each 408
experiment separately 409
331 Mini-slump 410
As shown in Eq 4 the mini-slump is influenced in order of significance by WB ratio 411
anhydrite proportion interaction of WB and ANH and the percentage of GGBS content The 412
WB ratio had the greatest effect on fluidity due to better lubrication of the particles in the paste 413
16
[29] The mini-slump test was accompanied by very low shear The value of mini-slump is to 414
characterise yield stress [38] therefore higher mini-slump value indicated a lower yield stress 415
The effect of WB on the increase of mini-slump was two and half-time than that of ANH (192 416
vs 781 in Eq 4) However increased ANH resulted in a 27 times greater increase in mini-417
slump than reduced GGBS (781 vs -294 in Eq 4) Figure 1(a) shows the effect of increased 418
WB on mini-slump vs ANH (when GGBS was kept constant at 70) and Figure 1(b) shows 419
GGBS vs ANH (when WB was fixed at 039) Based on these figures it is evident that mini-420
slump increased significantly when the dosage of WB and ANH increased 421
422
(a) (b) 423
Fig 1 Isoresponse curves of mini-slump (mm) (a) WB vs ANH and (b) GGBS vs ANH 424
425
332 Marsh cone 426
The time needed for a grout sample to flow through the Marsh cone is proportional to the 427
viscosity of the cement grout the flow time becomes an index of fluidity so the longer the 428
flow time the lower the fluidity Similar to the previous trends Eq 5 shows that the values of 429
Marsh cone are influenced in order of significance by WB GGBS and ANH This is 430
graphically illustrated in Figure 2 431
GGBS = 70
034 039 042 044
0
5
10
15
20
WB
AN
H (
)
65
74
83
92
101
037
AN
H(
)
WB = 039
60 65 70 75 80
0
5
10
15
20
GGBS()
70
75
80
85
17
432
(a) (b) 433
Fig 2 Isoresponse curves for flow time (s) (a) WB vs ANH and (b) GGBS vs ANH 434
435
It can be noted that an increase in WB and ANH or a reduction in GGBS led to decreasing 436
the Marsh cone flow time For example at fixed WB at 039 and GGBS of 70 respectively 437
the increase in ANH dosage from 5 to 20 led to a marked reduction of the Marsh cone flow 438
time from 170 to 140 s (Figure 2(a)) This behaviour is attributed to the change in plastic 439
viscosity of the grout as will be discussed later 440
333 Cohesion plate 441
As shown in Eq 6 the cohesion plate was influenced in order of magnitude by the WB and 442
the percentage of GGBS and ANH The increasing WB had a 34 times the influence on the 443
reduction of the cohesion plate test results as the increased ANH (for a GGBS constant) By 444
comparing the effects of WB and GGBS on plate cohesion the increased WB can be 445
interpreted as having approximately a 3 times greater influence on the reduction of plate 446
cohesion values than the increase in GGBS (-366 vs 122 in Eq 6) given that ANH is held 447
constant The effect of an increase in WB from 034 to 044 and ANH from 0 to 20 with a 448
fixed GGBS dosage of 70 is presented in Figure 3(a) Increased WB led to a decreased 449
cohesion plate value Conversely an increase in GGBS increased the cohesion plate value and 450
an increased ANH caused a reduction in cohesion plate (Figure 3(b)) 451
GGBS = 70
034 036 039 042 0440
5
10
15
20
WB
AN
H (
)
40
6080
100120
140160
180200
220
WB = 039
60 65 70 75 80
0
5
10
15
20
GGBS ()
AN
H (
)
100
120
140
160
180
18
452
(a) (b) 453
Fig 3 Isoresponse curves for plate cohesion meter (a) WB vs ANH and (b) GGBS vs 454 ANH 455
334 Yield stress 456
As shown in Eq 7 yield value was influenced in order of magnitude by WB and dosages of 457
ANH and GGBS Based on Figure 4 (a) when WB was fixed at 039 GGBS maintained at 458
70 and ANH increased to 5 the isoresponse curve showed a yield value of 15 Pa On the 459
other hand if the proportion of ANH was further increased to 20 while GBBS was 460
maintained at 70 the yield value decreased to 135 Pa This corresponds with Eq (7) in 461
which the proportion of WB and ANH were increased while GGBS was kept constant 462
resulting in a reduction in yield stress An increase in GGBS content resulted in an increase of 463
the yield stress 464
Figure 4 (b) shows the isoresponse curve of the yield value with a fixed proportion of GGBS 465
at 70 When WB was 039 and ANH was 5 the isoresponse of the predicted yield value 466
was 155 Pa If ANH was increased to 20 while maintaining WB at 039 the isoresponse of 467
the yield value was 135 Pa 468
It can be interesting to note that the observed results for the yield stress are closed to the one 469
observed with the cohesion plate and mini-slump tests This is expected as yield stress values 470
can be derived from those two simple tests 471
GGBS = 70
034 037 039 042 0440
5
10
15
20
WB
AN
H(
)
45
55
65
7585
95
105
115
WB = 039
60 65 70 75 800
5
10
15
20
GGBS ()
AN
H(
)
75
85
95
105
19
472
(a) (b) 473
Fig 4 Isoresponse curves for yield stress (Pa) (a) WB vs ANH and (b) GGBS vs ANH 474
335 Plastic viscosity 475
Plastic viscosity was influenced in order of magnitude by WB and the dosages of ANH and 476
GGBS ANH and GGBS had almost opposite effects on plastic viscosity (-0078 vs 0073 in 477
Eq 8) As shown in Eq (8) increased WB had the greatest primary effect on plastic viscosity 478
(034 vs 0078 and 0073) The increased WB had approximately a 44 times greater influence 479
on reducing plastic viscosity than increased ANH or decreased GGBS 480
In the isoresponse curve of plastic viscosity shown in Figure 5 (a) when GGBS was fixed at 481
70 WB set at 039 and ANH maintained at 5 the predicted plastic viscosity value was 482
068 Pas On the other hand if the dosage of ANHB was increased to 20 while maintaining 483
a similar WB the plastic viscosity was reduced to 055 Pas 484
In Figure 5 (b) WB was fixed at 039 when GGBS was held at 70 and ANH at 5 the 485
predicted plastic viscosity was 067 Pas However when ANH was increased to 20 and 486
GGBS was maintained at 70 the predicted plastic viscosity dropped to 055 Pas 487
AN
H(
)
GGBS = 70
034 037 039 042 044
0
5
10
15
20
WB
1012
1416
18
20
WB = 039
60 65 70 75 800
5
10
15
20
GGBS ()
AN
H(
)
13
14
15
20
488
(a) (b) 489
Fig 5 Isoresponse curve for plastic viscosity (Pas) (a) WB vs ANH and (b) GGBS vs 490
ANH 491
336 Induced bleeding 492
The induced bleeding equations for 1 and 5 minutes (Eqs 9 10) and 30 minutes (Eq 11) are 493
very similar The two influencing factors of induced bleeding are WB ratio and anhydrite 494
WB ratio has the greatest effect over two times the effect of anhydrite content Figure 6 shows 495
the isoresponse for bleeding versus the WB ratio for a fixed value of GGBS at 70 It can be 496
seen that when an anhydrite value is selected and the WB ratio is increased the bleeding will 497
also increase Similarly if a WB ratio is selected and the anhydrite content is increased the 498
bleeding will again increase 499
500
GGBS = 70
034 037 039 042 0440
5
10
15
20
WB
AN
H(
)
035
045
055
065
075
085
095
WB = 039
60 65 70 75 800
5
10
15
20
GGBS ()
AN
H(
)
055
060
065
075
034 036 039 042 044
0
5
10
15
20
WB
AN
H (
)
26
28
30
3234
36
38
40
GGBS=70
21
(a) 501
502
(b) (c) 503
Fig 6 Isoresponse curves for induced bleeding at 1 5 and 30 min WB vs ANH 504
337 Permeability 505
Figure 7 (a) and (b) showed firstly that the permeability decreased significantly from 1 min to 506
30 min Permeability at 1 min was influenced in order of magnitude by WB and the dosage 507
of ANH All interactions between 3 parameters had almost opposite effects on permeability 508
(Eq 12) As shown in Eq (12) increased WB and AHN had the greatest primary effect on 509
permeability at 1 min It seems there is an optimum reached at WB = 40 and AHN at 17 510
Similarly the permeability at 30 min is affected in order of significance by WB followed by 511
ANH (Eq 13) In Figure 7 (b) WB was fixed at 039 when GGBS was held at 70 and ANH 512
at 10 the predicted permeability was 038 x 10-8 (ms) However when ANH was increased 513
to 20 and GGBS was maintained at 70 the predicted permeability increased to 040x10-8 514
(ms) 515
516
GGBS = 70
034 036 039 042 0440
5
10
15
20
WB
AN
H (
)
545
61
675
74
805
GGBS = 70
034 036 039 042 0440
5
10
15
20
WB
AN
H (
)
56
60
64
68
72
7680
84
22
517
(a) (b) 518
Fig 7 Isoresponse curves for permeability at 1 and 30 min WB vs ANH 519
338 Compressibility 520
As shown in Eq (14) the compressibility was influenced in order of magnitude by the WB 521
and the percentage of ANH The interaction between 3 parameters affected also the 522
compressibility The increasing WB had a 32 times the influence on the increase of the 523
compressibility results as the increased ANH (for a GGBS constant) The effect of an increase 524
in WB from 034 to 044 and ANH from 0 to 20 with a fixed GGBS dosage of 70 is 525
presented in Figure 8 Increased WB led to an increase of compressibility Similarly an 526
increase in AHN increased the compressibility 527
528
Fig 8 Isoresponse curves for compressibility WB vs ANH 529
034 036 039 042 044
0
5
10
15
20
GGBS = 70 WB
AN
H (
)
3
35
4
4
45
5
034 036 039 042 044
0
5
10
15
20
WB
AN
H (
)
034
035
036 037 038 039 04
041
042
4
GGBS=70
034 036 039 042 044
0
5
10
15
20
WB
AN
H (
)
017
019
021 023 025 027
029
031
GGBS=70
23
530
339 Compressive strength 531
After one day from Eq 15 the influencing factors in order of significance are WB ratio 532
anhydrite content GGBS content and the interaction of WB and ANH The effect of the first 533
three was similar but WB had 11 times greater effect than anhydrite and 125 times greater 534
effect than GGBS While the interaction of WB and anhydrite had around a third of the 535
influence of WB Figures 9 (a) and (b) show the isoresponses for 1-day compressive strength 536
From Figure 9 (a) it can be seen when the GGBS content is fixed at 70 for a given anhydrite 537
content increasing the WB ratio will decrease the strength Also if a WB ratio is selected and 538
the anhydrite is increased similarly the strength will decrease From Figure 9 (b) with the WB 539
ratio fixed at 039 once again an increase in GGBS led to a reduction of compressive strength 540
at 1 day 541
542
(a) (b) 543
Fig9 Isoresponse curves for compressive strength at 1d (a) (WB vs ANH) and (b) (GGBS 544 vs ANH) 545
Eqs 16 17 and 18 show the effect of GGBS and ANH percentages on compressive strength at 546
3-d 7-d and 28-d Figures 10 11 and 12 show the isoresponse of the compressive strength at 547
3-d 7-d and 28-d respectively with WB vs ANH Increased ANH led to a decrease of 3-d 548
and 7-d compressive strength As expected an Increase in WB led to a decrease in compressive 549
strength The percentage of ANH had a negative effect on compressive strength and showed a 550
greater influence particularly at 3-d and 7-d (879 (3 d) amp 924 (7d) vs 382 (28 d)) GGBS has 551
a negative impact on early strength development The negative effect of GGBS on compressive 552
GGBS = 70
034 037 039 042 0440
5
10
15
20
WB
AN
H(
)
12
14
16
18
20
22
2426
WB = 039
60 65 70 75 800
5
10
15
20
GGBS ()
AN
H(
)
10
12
14
16
18
20
22
24
strength at early ages is clearly attributable to the fact that up to 80 of cement has been 553
replaced by GGBS and it takes some time for GGBS to start developing its pozzolanic action 554
at a noticeable level The results indicate that ANH content influences strength to a greater 555
extent than GGBS at all ages The SO3 content was reported to have great influence on the 556
strength [39 40] 557
558
(a) (b) 559
Fig10 Isoresponse curves for compressive strength at 3d (a) (WB vs ANH) and (b) 560 (GGBS vs ANH) 561
562
563
(a) (b) 564
Fig11 Isoresponse curves for compressive strength at 7d (a) (WB vs ANH) and (b) (WB 565 vs ANH) 566
567
GGBS = 70
034 036 039 042 0440
5
10
15
20
WB
AN
H (
)
24
2628
30
3234
3638
4042
WB = 039
60 65 70 75 80
0
5
10
15
20
GGBS ()
AN
H (
)
2426
2830
32
34
36
3840
42
GGBS = 70
034 037 039 042 044
0
5
10
15
20
WB
AN
H(
)
3032
34
3638
40
42
44
46
48
WB = 039
60 65 70 75 80
0
5
10
15
20
GGBS ()
AN
H(
)
32
34
36
38
40
42
44
46
48
25
568
(a) (b) 569
Fig12 Isoresponse curves for compressive strength at 28d (a) (WB vs ANH) and (b) 570
(ANH vs GGBS) 571
3310 Discussion of the effect of WB GGBS and ANH 572
As expected the increase of WB led to an increase in mini-slump induced bleeding and a 573
reduction in flow time plate cohesion yield stress plastic viscosity and compressive strengths 574
This can be attributed to more water in the system 575
An increase in GGBS content resulted in a reduction of the flow time plate cohesion yield 576
stress and plastic viscosity while the fluidity is improved This was due to the fact the specific 577
gravity of slag is lower than that of PC leading to an increase in the paste volume and thus 578
improving the fluidity of paste 579
In case of an increase of ANH proportion while WB and GGBS were kept constant it led to 580
an increased mini-slump and induced bleeding while the flow time plate cohesion yield stress 581
and plastic viscosity were reduced This was due to the lower reactivity of ANH resulting in an 582
increase of water needed for lubrication of paste 583
As expected an increase in WB lead to an increase in induced bleeding permeability and a 584
decrease in compressibility [33 35] This is due to the increase in liquid volume between the 585
particles and to the reduction in the amount of interparticle forces Globally the compressibility 586
decreases and the permeability increases with ANH It can be explained by the reduced specific 587
area and lower reactivity that can lead to more available water in the samples 588
3311 Heat of Hydration 589
Heat of hydration is considered an important factor in the cement design as low heat of 590
hydration reduces the effect of thermal cracking The heat flow results of the calorimeter test 591
performed over a three days period can be seen in Figure 13 592
GGBS = 70
034 036 039 042 0440
5
10
15
20
WB
AN
H (
)
46
48
50
52
54
56
58
60
WB = 039
0 5 10 15 2060
65
70
75
80
ANH ()
GG
BS
(
)
50
52
54
56
5860
62
26
593
Fig 13 Heat flow graphs for first 3 days of reaction 594
Figure 13 presents that the largest peaks were in mixes 1 2 5 and 6 This shows that these 595
reactions generated the most heat and that they were quick Mixes 1 and 2 have the highest 596
OPC content at 40 and this suggests that to lower the heat of the reaction minimal OPC 597
should be used This is confirmed by the fact that mixes 5 and 6 have the next highest OPC 598
contents the same percentage as mixes 3 4 and 9 (one of the repeated mixes) which have 599
anhydrite present This implies that the presence of anhydrite will lengthen the reaction process 600
and reduce the heat produced during setting significantly The graph shows this by the absence 601
of a sharp peak instead a gentle curved hump is shown over a 2-day period whereas the mixes 602
showing a sharp peak occur after about 12 hrs Mix 7 which has the same solids content as 603
mix 8 but a lower WB ratio and no cement present showed the lowest heat flow during the 604
hydration process 605
Figure 14 shows the cumulative heat generation during the first 3 days of setting It is clear that 606
the two mixes (1 and 2) with highest cement content and absence of anhydrite had the highest 607
cumulative heat development over the 3-day period 643J and 594J respectively Mixes 3456 608
and 9 which all have 20 OPC content generated similar heat value over the 3 days Results 609
of mixes containing ANH implies that over the period that the anhydrite did not reduce the 610
cumulative heat generated but slowed the reaction and reduce the peak heat generated The 611
0
0002
0004
0006
0008
001
0012
0 50000 100000 150000 200000 250000 300000
He
at F
low
(mW
)
Time s()
M1
M2
M3
M4
M5
M6
M7
M9
1Day
2Day
3day
1d 2d 3d
27
graphs also suggest that a higher WB ratio produced a lower cumulative and peak heat 612
generation613
614
Fig 14 Cumulative heat generation curves for first 3 days 615
3312 pH measurements 616
Fig 15 summarises the results of pH and the nine mixes with different compositions of WB 617
the percentages of cement GGBS and ANH It is shown that Supersulfated cements (SSCs) 618
have lower pH values (lt 125 at all ages) than PC which has a pH of 139 [41] making SSC 619
more preferable in essential applications such as nuclear waste encapsulation 620
The figure shows that the pH value decreased with time for all samples between 1 and 7 days 621
Similar trend was observed in the majority of mixes between 7 and 28 days except for sample 622
2 5 and 9 which showed slight increase in the pH values This decrease refers to the 623
consumption of ions in the pore structure due to the hydration process 624
0
100
200
300
400
500
600
700
800
0 50000 100000 150000 200000 250000 300000
(J)
Time (s)
M1
M2
M3
M4
M5
M6
M7
M9
1 Day
3 Day
2 day
1d 2d 3d
1
2
3
9
45
6
7
28
625
626 Fig 15 Summary of pore solution pH 627
628
The incorporation of ANH replacing the Portland cement (C) results in remarkable decrease in 629
pH at all ages as introducing the ANH reduced the lower initial pH Likewise the increase in 630
the content of GGBS led to a decrease in the pH value of the pore structure as GGBS has lower 631
initial pH than Portland cement The increase of WB ratio decreased the pH value This is in 632
agreement with Collier [41] who found that increasing the wb ratio from 05 to 06 increased 633
the pH by I unit This was attributed to the increased availability of water in the case of WB 634
of 06 allowing hydration of more cement powder thereby releasing more hydroxide anions 635
into solution However in this study the WB ratio did not show a significant effect on 636
lowering the pH These results are in agreement with [42] which also found that decreasing the 637
pH improved the bulk resistivity of SSC mixtures 638
3313 SEM 639
Figure 16 shows the SEM images of some mixes at various magnifications The images clearly 640
show the dense and compact structure of the cement after seven days The dense structure was 641
another requirement from the cement chosen to enclose the waste to prevent leaching The 642
microstructure consists mainly of C-S-H the main hydration product and unhydrated slag 643
grains C-S-H is formed after the dissolution of slag grains when contacting the water and 644
alkalis and then the ionic species saturate the solution and then precipitate as hydrated phases 645
[8] There were abundant grains of hydrated and partially hydrated slag grains some small 646
1080
1100
1120
1140
1160
1180
1200
1220
1240
1260
1280
1 2 3 4 5 6 7 8 9
pH
val
ue
Mix Number
1 Day
7 Days
28 Days
29
GGBS particles presented rims of reaction products (eg Mix 6-Figure 16 (f) and Mix 9-Figure 647
16 (h)) It was found by [11] that the composition of the reaction rims around slag was similar 648
to that of the C-S-H from PC However [12] found that in the CndashSndashH of SSC is apparently 649
more foil like which is different than the fibrillar morphology of C-S-H in OPC Mix 3 and 650
Mix 4 (Figure 16 (c) and (d) respectively) exhibits more micro voids in the micrsostructure 651
which could explain the low strength of these mixes compared to mix 1 and 2 Ettringite was 652
not detected Ettringite is not the most abundant phase and it is not easy to detect in dried 653
polished samples because it is easily decomposed under the drying conditions of the vacuum 654
of the microscope column [11] 655
(a) Mix 1 image at 1100 magnification (b) Mix 2 image at 900 magnification
(c) Particle of unreacted slag mix3 7 days (d) An overall image of mix 4 at 7days
showing CSH and BFS particles
30
(e) Mix 5 image at 1100 magnification (f) Mix 6 image at 2300 magnification
(g) Mix 7 image at 2000 magnification (h) Mix 9 image at 2700 magnification
Fig 16 SEM results 656
4 Conclusions 657
The paper focused on optimizing the SSC cement grout in order to get the best of it The effect 658
of GGBS WB and ANH dosages on the grout fluidity rheological properties induced 659
bleeding maximum heat of hydration and compressive strength was investigated using 660
factorial design approach and analysis The models derived in this study are valid for the 661
experimental area corresponding to grout mixes made with variable levels of WB ANH and 662
GGBS in the ranges of 034 to 044 0 to 20 by mass of binder 60 to 80 by mass of 663
binder respectively Based on the results from this study the following conclusions are drawn 664
- In comparison to GGBS and ANH WB ratio had more pronounced effects on the 665
results of mini-slump plate cohesion meter Marsh cone time yield stress plastic viscosity 666
induced bleeding permeability compressibility and compressive strength 667
31
- The increase in the dosage of GGBS led to an increase in the values of plate cohesion 668
meter Marsh cone time yield stress and plastic viscosity while reducing the mini-slump 669
values maximum hydration and compressive strength This is ascribed to the fine nature 670
of GGBS particles and pozzolanic effect 671
- While the ANH particles caused a decrease in the maximum of heat of hydration it 672
increased the induced bleeding permeability and compressibility due to its dominant effect 673
on increasing the dormant period and increasing the rates of solid sedimentation and 674
induced bleeding water 675
- Increasing the dosage of ANH in grout reduced the hydrations kinetic at early-age and 676
thus reduced the compressive strength at 1d 3d and 7d However this effect diminished 677
at later ages at 28 d in a manner similar to increasing WB 678
- The increase in the dosage of ANH led to an increase in the mini-slump values 679
(fluidity) but a decrease in the values of yield stress plastic viscosity plate cohesion and 680
Marsh cone time This is attributed to better deflocculation of particles at the fresh state 681
- The increase of GGBS percentage delayed the reaction process and decreased the total 682
heat after 3 days while WB slightly reduced the total heat it didnrsquot significantly affect the 683
reaction process 684
- pH measurements in the present study confirmed the suitability of these mixture to low-685
pH applications as the increase in both the GGBS and ANH markedly decreased the initial 686
pH thereby lowering the pH at different ages 687
- The modelling and prediction of the response of other points in the experimental domain 688
were therefore possible Although the models are based on a given set of materials they 689
can be easily used to generate future results using other materials 690
- Dense microstructure was observed for mixes examined in this study C-S-H is the main 691
reaction product with presence of unreacted slag grains embedded well in the structure 692
However some micro voids were observed in mixes containing ANH which led to lower 693
compressive strength of mixes with ANH 694
CRediT authorship contribution statement 695
MSonebi and YBai did the conceptualization and the design of investigation as well as 696 performing the experiments MSonebi carried out the software analysis of the results and the 697
32
visualization MSonebi AAbdalqader T Fayyad and APerrot analysed the results and 698 wrote the original draft and reviewed and edited the final version 699
Declaration of Competing Interest 700
The authors declare that they have no known competing financial interests or personal 701 relationships that could have appeared to influence the work reported in this paper 702
Acknowledgments 703
The authors would like to express their gratitude to P McCann from QUB and N Collier 704 from Eden Nuclear and Environment Ltd for their helps for some experiments 705
706
References 707
1 Schneider M Romer M Tschudin M Bolio H (2011) Sustainable cement production-708 present and future Cement and Concrete Research 41642ndash650 709
httpsdoiorg101016jcemconres201103019 710
2 Madlool NA Saidur R Hossain MS Rahim NA (2011) A critical review on energy use 711 and savings in the cement industries Renewable and Sustainable Energy Reviews 712
152042ndash2060 httpsdoiorg101016jrser201101005 713
3 EN15743 (2015) BS EN 157432010+A12015 Supersulfated cement - Composition 714
specifications and conformity criteria BSI 715
4 Khatib JM Wright L Mangat PS (2016) Mechanical and physical properties of concrete 716
containing FGD waste Magazine of Concrete Research 68550ndash560 717 httpsdoiorg101680macr1500092 718
5 Khatib JM Mangat PS Wright L (2008) Sulfate resistance of mortar containing 719
simulated FGD waste Proceedings of Institution of Civil Engineers Construction 720 Materials 161119ndash128 httpsdoiorg101680coma20081613119 721
6 (2020) Specifying Sustainable Concrete 722
7 Hewlett PC (2004) Learsquos Chemistry of Cement and Concrete fourth edi Elsevier 723 Science amp Technology Books Oxford 724
8 Gruskovnjak A Lothenbach B Winnefeld F et al (2008) Hydration mechanisms of 725 super sulphated slag cement Cement and Concrete Research 38983ndash992 726
httpsdoiorg101016jcemconres200803004 727
9 Grounds T Nowell D V Wilburn FW (2003) Resistance of supersulfated cement to 728 strong sulfate solutions Journal of Thermal Analysis and Calorimetry 72181ndash190 729
httpsdoiorg101023A1023928021602 730
10 Grounds T Nowell D V Wilburn FW (1995) The influence of temperature and 731
different storage conditions on the stability of supersulphated cement Journal of 732 Thermal Analysis 45385ndash394 httpsdoiorg101007BF02548772 733
33
11 Bazalduacutea-Medelliacuten ME Fuentes AF Gorokhovsky A Escalante-Garciacutea JI (2015) Early 734 and late hydration of supersulphated cements of blast furnace slag with fluorgypsum 735 Materiales de Construccion 65e043 httpsdoiorg103989mc201506013 736
12 Matschei T Bellmann F Stark J (2005) Hydration behaviour of sulphate-activated slag 737 cements Advances in Cement Research 17167ndash178 738
httpsdoiorg101680adcr2005174167 739
13 Richardson IG (2000) Nature of the hydration products in hardened cement pastes 740 Cement and Concrete Composites 2297ndash113 httpsdoiorg101016S0958-741 9465(99)00036-0 742
14 Baux C Phelipot-Mardeleacute A Lanos C et al (2013) PERFORMANCES OF SUPER 743 SULFATED CEMENTS In International Conference on Concrete Under Severe 744 Conditions pp 1857ndash1870 745
15 Annabelle Phelipot-Mardeleacute Gabriel Samson Christophe Lanos (2015) Super sulfated 746 cement formulation and uses In Construction Materials ConMat Whistler Canada 747
16 Milestone NB (2006) Reactions in cement encapsulated nuclear wastes need for 748 toolbox of different cement types Advances in Applied Ceramics 10513ndash20 749
httpsdoiorg101179174367606X81678 750
17 Batchelor B (2006) Overview of waste stabilization with cement Waste Management 751
26689ndash698 httpsdoiorg101016JWASMAN200601020 752
18 Zhang T Cheeseman CR Vandeperre LJ (2011) Development of low pH cement 753
systems forming magnesium silicate hydrate (MSH) Cement and Concrete Research 754 41439ndash442 httpsdoiorg101016jcemconres201101016 755
19 Mobasher N Bernal SA Provis JL (2016) Structural evolution of an alkali sulfate 756
activated slag cement Journal of Nuclear Materials 46897ndash104 757 httpsdoiorg101016JJNUCMAT201511016 758
20 Wang J Yu B Gao Y (2014) Hydration Characteristics of Super Sulphated Cement 759 with Different Fineness In Proceedings of the International Conference on Material 760 and Environmental Engineering (ICMAEE 2014) Atlantis Press Paris France 761
21 Naumlgele E (1986) The Zeta-potential of cement Part II Effect of pH-value Cement and 762 Concrete Research 16853ndash863 httpsdoiorg1010160008-8846(86)90008-6 763
22 Jain N Civil MG-IJ of M and 2015 U (2015) Formulation of Sulphate Resistant Super 764 Sulphated Cement Using Fluorogypsum and Granulated Blast Furnace Slag IOSR 765
Journal of Mechanical and Civil Engineering (IOSR-JMCE) 12153ndash159 766
23 Gao YX Yu BY Xu FL (2012) Effect of Modified Phosphogypsum on the Mechanical 767 Properties of Super Sulphate Cement Applied Mechanics and Materials 161264ndash268 768 httpsdoiorg104028wwwscientificnetAMM161264 769
24 Kantro D (1980) Influence of Water-Reducing Admixtures on Properties of Cement 770 PasteampmdashA Miniature Slump Test Cement Concrete and Aggregates 295ndash102 771
httpsdoiorg101520CCA10190J 772
34
25 Svermova L Sonebi M Bartos PJM (2003) Influence of mix proportions on rheology of 773 cement grouts containing limestone powder Cement and Concrete Composites 25737ndash774 749 httpsdoiorg101016S0958-9465(02)00115-4 775
26 Sonebi M (2006) Rheological properties of grouts with viscosity modifying agents as 776 diutan gum and welan gum incorporating pulverised fly ash Cement and Concrete 777
Research 361609ndash1618 httpsdoiorg101016JCEMCONRES200605016 778
27 Nehdi M Rahman M (2004) Effect of Geometry and Surface Friction of Test Accessory 779 on Oscillatory Rheological Properties of Cement Pastes ACI Materials Journal 780 101416ndash424 httpsdoiorg101435913428 781
28 Khayat KH Yahia A (1997) Effect of Welan Gum-High-Range Water Reducer 782 Combinations on Rheology of Cement Grout ACI Materials Journal 94365ndash372 783 httpsdoiorg1014359321 784
29 Lombardi G (1985) THE ROLE OF COHESION IN CEMENT GROUTING OF 785 ROCK In Proceedings of Fifteenth Congress on Large Dams International 786 Commission on Large Dams pp 235ndash261 787
30 Perrot A Rangeard D Picandet V Meacutelinge Y (2013) Hydro-mechanical properties of 788
fresh cement pastes containing polycarboxylate superplasticizer Cement and Concrete 789 Research 53221ndash228 httpsdoiorg101016JCEMCONRES201306015 790
31 Perrot A Lecompte T Khelifi H et al (2012) Yield stress and bleeding of fresh cement 791 pastes Cement and Concrete Research 42937ndash944 792
httpdxdoiorg101016jcemconres201203015 793
32 Sonebi M Perrot A (2019) Effect of mix proportions on rheology and permeability of 794 cement grouts containing viscosity modifying admixture Construction and Building 795
Materials 212687ndash697 httpsdoiorg101016jconbuildmat201904022 796
33 Picandet V Rangeard D Perrot A Lecompte T (2011) Permeability measurement of 797
fresh cement paste Cement and Concrete Research 41330ndash338 798 httpsdoiorg101016JCEMCONRES201011019 799
34 Perrot A Rangeard D (2017) Effects of mix design parameters on consolidation 800
behaviour of fresh cement-based materials Materials and Structures 50117 801 httpsdoiorg101617s11527-016-0988-0 802
35 Rangeard D Perrot A Picandet V et al (2015) Determination of the consolidation 803 coefficient of low compressibility materials application to fresh cement-based 804
materials Materials and Structures 481475ndash1483 httpsdoiorg101617s11527-014-805 0247-1 806
36 Massoussi N Keita E Roussel N (2017) The heterogeneous nature of bleeding in 807 cement pastes Cement and Concrete Research 95108ndash116 808 httpsdoiorg101016JCEMCONRES201702012 809
37 Montgomery D (2007) Design and Analysis of Experiments Second Edition John 810
Wiley amp Sons 811
35
38 Roussel N Stefani C Leroy R (2005) From mini-cone test to Abrams cone test 812 Measurement of cement-based materials yield stress using slump tests Cement and 813 Concrete Research 35817ndash822 httpsdoiorg101016jcemconres200407032 814
39 Mangat PS Khatib JM Wright L (2006) Optimum utilisation of FGD waste in blended 815 binders Proceedings of Institution of Civil Engineers Construction Materials 159119ndash816
127 httpsdoiorg101680coma20061593119 817
40 Khatib JM Mangat PS Wright L (2013) Early age porosity and pore size distribution of 818 cement paste with flue gas desulphurisation (FGD) waste Journal of Civil Engineering 819 and Management 19622ndash627 httpsdoiorg103846139237302013793609 820
41 Collier NC Milestone NB Gordon LE Ko SC (2014) The suitability of a supersulfated 821 cement for nuclear waste immobilisation Journal of Nuclear Materials 452457ndash464 822 httpsdoiorg101016jjnucmat201405078 823
42 Masoudi R (2018) Examining compositions hydration mechanisms and properties of 824 supersulfated cement for use in concrete by Examining compositions hydration 825 mechanisms and properties of supersulfated cement for use in concrete University of 826 Toronto 827
828
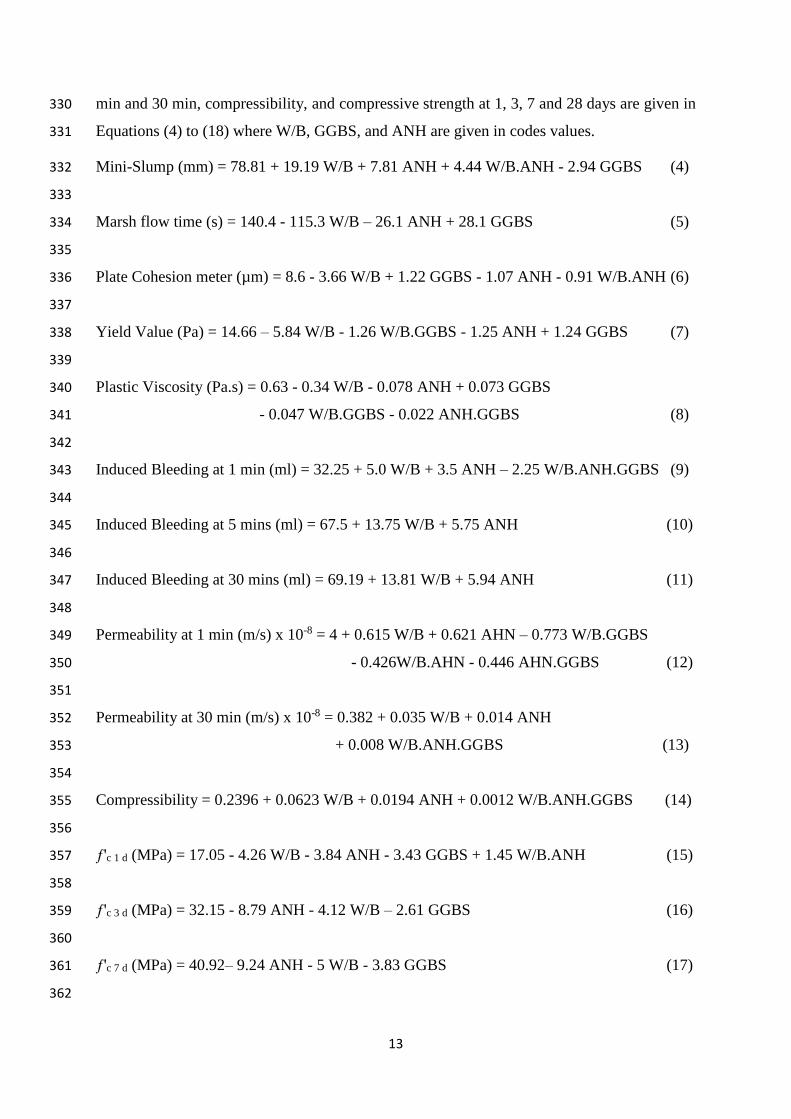
13
min and 30 min compressibility and compressive strength at 1 3 7 and 28 days are given in 330
Equations (4) to (18) where WB GGBS and ANH are given in codes values 331
Mini-Slump (mm) = 7881 + 1919 WB + 781 ANH + 444 WBANH - 294 GGBS (4) 332
333
Marsh flow time (s) = 1404 - 1153 WB ndash 261 ANH + 281 GGBS (5) 334
335
Plate Cohesion meter (microm) = 86 - 366 WB + 122 GGBS - 107 ANH - 091 WBANH (6) 336
337
Yield Value (Pa) = 1466 ndash 584 WB - 126 WBGGBS - 125 ANH + 124 GGBS (7) 338
339
Plastic Viscosity (Pas) = 063 - 034 WB - 0078 ANH + 0073 GGBS 340
- 0047 WBGGBS - 0022 ANHGGBS (8) 341
342
Induced Bleeding at 1 min (ml) = 3225 + 50 WB + 35 ANH ndash 225 WBANHGGBS (9) 343
344
Induced Bleeding at 5 mins (ml) = 675 + 1375 WB + 575 ANH (10) 345
346
Induced Bleeding at 30 mins (ml) = 6919 + 1381 WB + 594 ANH (11) 347
348
Permeability at 1 min (ms) x 10-8 = 4 + 0615 WB + 0621 AHN ndash 0773 WBGGBS 349
- 0426WBAHN - 0446 AHNGGBS (12) 350
351
Permeability at 30 min (ms) x 10-8 = 0382 + 0035 WB + 0014 ANH 352
+ 0008 WBANHGGBS (13) 353
354
Compressibility = 02396 + 00623 WB + 00194 ANH + 00012 WBANHGGBS (14) 355
356
ƒc 1 d (MPa) = 1705 - 426 WB - 384 ANH - 343 GGBS + 145 WBANH (15) 357
358
ƒc 3 d (MPa) = 3215 - 879 ANH - 412 WB ndash 261 GGBS (16) 359
360
ƒc 7 d (MPa) = 4092ndash 924 ANH - 5 WB - 383 GGBS (17) 361
362
14
ƒc 28 d (MPa) = 5348 - 515 WB - 382 ANH ndash 262 GGBS + 436 ANHGGBS (18) 363
364
The correlation coefficient of most of the proposed models were higher than 090 except for 365
plastic viscosity compressive strength after 3days and compressive strength after 28days 366
which have coefficients of 070 086 and 087 respectively 367
Table 4 shows the average measured responses of the four replicate grouts the coefficients of 368
variation (COV) as well as the estimated errors with a 90 confidence limit for each of the 369
measured properties The estimated error levels for mini-slump plate cohesion meter Marsh 370
cone yield stress plastic viscosity induced bleeding at 1 min 5 min and 30 mins permeability 371
at 1 min and 30 min compressibility and compressive strengths at 1 3 7 28 days were plusmn 22 372
mm plusmn 0001mm plusmn 40 s plusmn 09 Pa plusmn 002 Pa s plusmn 28 ml plusmn 42 ml plusmn 45 ml plusmn 32x10-9 (ms) 373
plusmn 13x10-10 (ms) plusmn 00153 plusmn 13 MPa plusmn 35 MPa plusmn 33 MPa and plusmn 25 MPa respectively 374
The relative experimental errors for mini-slump plate cohesion meter Marsh cone yiled stress 375
plastic viscosity induced bleeding permeability compressibility compressive strengths were 376
limited to 3-11 On the other hand relative error for march cone was up to 30 377
Table 4 Repeatability of test parameters at the central point 378
379
Tests Mini-
slump
Plate
cohesion
Marsh
cone
Yield
stress
Plastic
viscosit
y
Induced
bleeding
at 1 min
Induced
bleedin
g at 5
min
Induced
bleeding
at 30
min
Mean (n=4) 736
mm
001
mm
1318
s
108
Pa
065
Pa s
325
ml
674
ml
679
ml
Coefficient
of variation
()
37 115 372 105 42 127 76 80
Estimate
error (90
confidence
limit)
22
mm
0001
mm
402
s
09
Pa
002
Pa s
28
ml
42
ml
45
ml
380
381 Table 4 Repeatability of test parameters at the central point (continued) 382
383
Tests
Permeability
1 min
x10-8
Permeability
30 min
x10-8
Compressibility frsquoc 1d frsquoc 3d frsquoc 7d frsquoc 28d
Mean (n=4) 463
ms
0388
ms 02323
189
MPa
293
MPa
411
MPa
558
MPa
Coefficient
of variation
()
85 39 8 84 144 98 53
15
Estimate
error (90
confidence
limit)
032
(ms)
0013
(ms)
00153
13
MPa
35
MPa
33
MPa
24
MPa
384
385
31 Accuracy of the established models 386
387
The ratio of predicted-to-measured properties for grout ranged between 087 and 115 388
indicating good accuracy for prediction of mini-slump plate cohesion induced bleeding at 1 389
min 5 mins and 30 mins yield stress plastic viscosity and compressive strength at 1-d 3-d 7-390
d and 28-d In general the proposed models for mini-slump plate cohesion Marsh cone and 391
compressive strength appeared to be accurate in predicting fluidity cohesivity induced 392
bleeding permeability at 30 min compressibility and compressive strength with low scatter 393
between measured and predicted values However the average values of predictedmeasured 394
ratio of yield values were slightly higher (074) 395
396
32 Isoresponses of the proposed models 397
398
The isoresponse surfaces and contour plots for mini-slump plate cohesion Marsh cone yield 399
stress plastic viscosity induced bleeding at 1 min 5 mins and 30 mins permeability at 1 min 400
and 30 mins compressibility and compressive strength at 1-d 3-d 7-d and 28-d were obtained 401
by using response surface methodology (RSM) The isoresponse surfaces and contour plots 402
were obtained from the regression models and because the models contained interaction and 403
second-order variables the contour lines were curved 404
The proposed statistical models can therefore be used to evaluate the effect of a group of 405
variables on the properties affecting the quality of supersulfated grout This allowed for the 406
calculation of isoresponse surfaces from the parameters under study outside the experimental 407
domain and the optimisation of their effects The next sections will discuss the results of each 408
experiment separately 409
331 Mini-slump 410
As shown in Eq 4 the mini-slump is influenced in order of significance by WB ratio 411
anhydrite proportion interaction of WB and ANH and the percentage of GGBS content The 412
WB ratio had the greatest effect on fluidity due to better lubrication of the particles in the paste 413
16
[29] The mini-slump test was accompanied by very low shear The value of mini-slump is to 414
characterise yield stress [38] therefore higher mini-slump value indicated a lower yield stress 415
The effect of WB on the increase of mini-slump was two and half-time than that of ANH (192 416
vs 781 in Eq 4) However increased ANH resulted in a 27 times greater increase in mini-417
slump than reduced GGBS (781 vs -294 in Eq 4) Figure 1(a) shows the effect of increased 418
WB on mini-slump vs ANH (when GGBS was kept constant at 70) and Figure 1(b) shows 419
GGBS vs ANH (when WB was fixed at 039) Based on these figures it is evident that mini-420
slump increased significantly when the dosage of WB and ANH increased 421
422
(a) (b) 423
Fig 1 Isoresponse curves of mini-slump (mm) (a) WB vs ANH and (b) GGBS vs ANH 424
425
332 Marsh cone 426
The time needed for a grout sample to flow through the Marsh cone is proportional to the 427
viscosity of the cement grout the flow time becomes an index of fluidity so the longer the 428
flow time the lower the fluidity Similar to the previous trends Eq 5 shows that the values of 429
Marsh cone are influenced in order of significance by WB GGBS and ANH This is 430
graphically illustrated in Figure 2 431
GGBS = 70
034 039 042 044
0
5
10
15
20
WB
AN
H (
)
65
74
83
92
101
037
AN
H(
)
WB = 039
60 65 70 75 80
0
5
10
15
20
GGBS()
70
75
80
85
17
432
(a) (b) 433
Fig 2 Isoresponse curves for flow time (s) (a) WB vs ANH and (b) GGBS vs ANH 434
435
It can be noted that an increase in WB and ANH or a reduction in GGBS led to decreasing 436
the Marsh cone flow time For example at fixed WB at 039 and GGBS of 70 respectively 437
the increase in ANH dosage from 5 to 20 led to a marked reduction of the Marsh cone flow 438
time from 170 to 140 s (Figure 2(a)) This behaviour is attributed to the change in plastic 439
viscosity of the grout as will be discussed later 440
333 Cohesion plate 441
As shown in Eq 6 the cohesion plate was influenced in order of magnitude by the WB and 442
the percentage of GGBS and ANH The increasing WB had a 34 times the influence on the 443
reduction of the cohesion plate test results as the increased ANH (for a GGBS constant) By 444
comparing the effects of WB and GGBS on plate cohesion the increased WB can be 445
interpreted as having approximately a 3 times greater influence on the reduction of plate 446
cohesion values than the increase in GGBS (-366 vs 122 in Eq 6) given that ANH is held 447
constant The effect of an increase in WB from 034 to 044 and ANH from 0 to 20 with a 448
fixed GGBS dosage of 70 is presented in Figure 3(a) Increased WB led to a decreased 449
cohesion plate value Conversely an increase in GGBS increased the cohesion plate value and 450
an increased ANH caused a reduction in cohesion plate (Figure 3(b)) 451
GGBS = 70
034 036 039 042 0440
5
10
15
20
WB
AN
H (
)
40
6080
100120
140160
180200
220
WB = 039
60 65 70 75 80
0
5
10
15
20
GGBS ()
AN
H (
)
100
120
140
160
180
18
452
(a) (b) 453
Fig 3 Isoresponse curves for plate cohesion meter (a) WB vs ANH and (b) GGBS vs 454 ANH 455
334 Yield stress 456
As shown in Eq 7 yield value was influenced in order of magnitude by WB and dosages of 457
ANH and GGBS Based on Figure 4 (a) when WB was fixed at 039 GGBS maintained at 458
70 and ANH increased to 5 the isoresponse curve showed a yield value of 15 Pa On the 459
other hand if the proportion of ANH was further increased to 20 while GBBS was 460
maintained at 70 the yield value decreased to 135 Pa This corresponds with Eq (7) in 461
which the proportion of WB and ANH were increased while GGBS was kept constant 462
resulting in a reduction in yield stress An increase in GGBS content resulted in an increase of 463
the yield stress 464
Figure 4 (b) shows the isoresponse curve of the yield value with a fixed proportion of GGBS 465
at 70 When WB was 039 and ANH was 5 the isoresponse of the predicted yield value 466
was 155 Pa If ANH was increased to 20 while maintaining WB at 039 the isoresponse of 467
the yield value was 135 Pa 468
It can be interesting to note that the observed results for the yield stress are closed to the one 469
observed with the cohesion plate and mini-slump tests This is expected as yield stress values 470
can be derived from those two simple tests 471
GGBS = 70
034 037 039 042 0440
5
10
15
20
WB
AN
H(
)
45
55
65
7585
95
105
115
WB = 039
60 65 70 75 800
5
10
15
20
GGBS ()
AN
H(
)
75
85
95
105
19
472
(a) (b) 473
Fig 4 Isoresponse curves for yield stress (Pa) (a) WB vs ANH and (b) GGBS vs ANH 474
335 Plastic viscosity 475
Plastic viscosity was influenced in order of magnitude by WB and the dosages of ANH and 476
GGBS ANH and GGBS had almost opposite effects on plastic viscosity (-0078 vs 0073 in 477
Eq 8) As shown in Eq (8) increased WB had the greatest primary effect on plastic viscosity 478
(034 vs 0078 and 0073) The increased WB had approximately a 44 times greater influence 479
on reducing plastic viscosity than increased ANH or decreased GGBS 480
In the isoresponse curve of plastic viscosity shown in Figure 5 (a) when GGBS was fixed at 481
70 WB set at 039 and ANH maintained at 5 the predicted plastic viscosity value was 482
068 Pas On the other hand if the dosage of ANHB was increased to 20 while maintaining 483
a similar WB the plastic viscosity was reduced to 055 Pas 484
In Figure 5 (b) WB was fixed at 039 when GGBS was held at 70 and ANH at 5 the 485
predicted plastic viscosity was 067 Pas However when ANH was increased to 20 and 486
GGBS was maintained at 70 the predicted plastic viscosity dropped to 055 Pas 487
AN
H(
)
GGBS = 70
034 037 039 042 044
0
5
10
15
20
WB
1012
1416
18
20
WB = 039
60 65 70 75 800
5
10
15
20
GGBS ()
AN
H(
)
13
14
15
20
488
(a) (b) 489
Fig 5 Isoresponse curve for plastic viscosity (Pas) (a) WB vs ANH and (b) GGBS vs 490
ANH 491
336 Induced bleeding 492
The induced bleeding equations for 1 and 5 minutes (Eqs 9 10) and 30 minutes (Eq 11) are 493
very similar The two influencing factors of induced bleeding are WB ratio and anhydrite 494
WB ratio has the greatest effect over two times the effect of anhydrite content Figure 6 shows 495
the isoresponse for bleeding versus the WB ratio for a fixed value of GGBS at 70 It can be 496
seen that when an anhydrite value is selected and the WB ratio is increased the bleeding will 497
also increase Similarly if a WB ratio is selected and the anhydrite content is increased the 498
bleeding will again increase 499
500
GGBS = 70
034 037 039 042 0440
5
10
15
20
WB
AN
H(
)
035
045
055
065
075
085
095
WB = 039
60 65 70 75 800
5
10
15
20
GGBS ()
AN
H(
)
055
060
065
075
034 036 039 042 044
0
5
10
15
20
WB
AN
H (
)
26
28
30
3234
36
38
40
GGBS=70
21
(a) 501
502
(b) (c) 503
Fig 6 Isoresponse curves for induced bleeding at 1 5 and 30 min WB vs ANH 504
337 Permeability 505
Figure 7 (a) and (b) showed firstly that the permeability decreased significantly from 1 min to 506
30 min Permeability at 1 min was influenced in order of magnitude by WB and the dosage 507
of ANH All interactions between 3 parameters had almost opposite effects on permeability 508
(Eq 12) As shown in Eq (12) increased WB and AHN had the greatest primary effect on 509
permeability at 1 min It seems there is an optimum reached at WB = 40 and AHN at 17 510
Similarly the permeability at 30 min is affected in order of significance by WB followed by 511
ANH (Eq 13) In Figure 7 (b) WB was fixed at 039 when GGBS was held at 70 and ANH 512
at 10 the predicted permeability was 038 x 10-8 (ms) However when ANH was increased 513
to 20 and GGBS was maintained at 70 the predicted permeability increased to 040x10-8 514
(ms) 515
516
GGBS = 70
034 036 039 042 0440
5
10
15
20
WB
AN
H (
)
545
61
675
74
805
GGBS = 70
034 036 039 042 0440
5
10
15
20
WB
AN
H (
)
56
60
64
68
72
7680
84
22
517
(a) (b) 518
Fig 7 Isoresponse curves for permeability at 1 and 30 min WB vs ANH 519
338 Compressibility 520
As shown in Eq (14) the compressibility was influenced in order of magnitude by the WB 521
and the percentage of ANH The interaction between 3 parameters affected also the 522
compressibility The increasing WB had a 32 times the influence on the increase of the 523
compressibility results as the increased ANH (for a GGBS constant) The effect of an increase 524
in WB from 034 to 044 and ANH from 0 to 20 with a fixed GGBS dosage of 70 is 525
presented in Figure 8 Increased WB led to an increase of compressibility Similarly an 526
increase in AHN increased the compressibility 527
528
Fig 8 Isoresponse curves for compressibility WB vs ANH 529
034 036 039 042 044
0
5
10
15
20
GGBS = 70 WB
AN
H (
)
3
35
4
4
45
5
034 036 039 042 044
0
5
10
15
20
WB
AN
H (
)
034
035
036 037 038 039 04
041
042
4
GGBS=70
034 036 039 042 044
0
5
10
15
20
WB
AN
H (
)
017
019
021 023 025 027
029
031
GGBS=70
23
530
339 Compressive strength 531
After one day from Eq 15 the influencing factors in order of significance are WB ratio 532
anhydrite content GGBS content and the interaction of WB and ANH The effect of the first 533
three was similar but WB had 11 times greater effect than anhydrite and 125 times greater 534
effect than GGBS While the interaction of WB and anhydrite had around a third of the 535
influence of WB Figures 9 (a) and (b) show the isoresponses for 1-day compressive strength 536
From Figure 9 (a) it can be seen when the GGBS content is fixed at 70 for a given anhydrite 537
content increasing the WB ratio will decrease the strength Also if a WB ratio is selected and 538
the anhydrite is increased similarly the strength will decrease From Figure 9 (b) with the WB 539
ratio fixed at 039 once again an increase in GGBS led to a reduction of compressive strength 540
at 1 day 541
542
(a) (b) 543
Fig9 Isoresponse curves for compressive strength at 1d (a) (WB vs ANH) and (b) (GGBS 544 vs ANH) 545
Eqs 16 17 and 18 show the effect of GGBS and ANH percentages on compressive strength at 546
3-d 7-d and 28-d Figures 10 11 and 12 show the isoresponse of the compressive strength at 547
3-d 7-d and 28-d respectively with WB vs ANH Increased ANH led to a decrease of 3-d 548
and 7-d compressive strength As expected an Increase in WB led to a decrease in compressive 549
strength The percentage of ANH had a negative effect on compressive strength and showed a 550
greater influence particularly at 3-d and 7-d (879 (3 d) amp 924 (7d) vs 382 (28 d)) GGBS has 551
a negative impact on early strength development The negative effect of GGBS on compressive 552
GGBS = 70
034 037 039 042 0440
5
10
15
20
WB
AN
H(
)
12
14
16
18
20
22
2426
WB = 039
60 65 70 75 800
5
10
15
20
GGBS ()
AN
H(
)
10
12
14
16
18
20
22
24
strength at early ages is clearly attributable to the fact that up to 80 of cement has been 553
replaced by GGBS and it takes some time for GGBS to start developing its pozzolanic action 554
at a noticeable level The results indicate that ANH content influences strength to a greater 555
extent than GGBS at all ages The SO3 content was reported to have great influence on the 556
strength [39 40] 557
558
(a) (b) 559
Fig10 Isoresponse curves for compressive strength at 3d (a) (WB vs ANH) and (b) 560 (GGBS vs ANH) 561
562
563
(a) (b) 564
Fig11 Isoresponse curves for compressive strength at 7d (a) (WB vs ANH) and (b) (WB 565 vs ANH) 566
567
GGBS = 70
034 036 039 042 0440
5
10
15
20
WB
AN
H (
)
24
2628
30
3234
3638
4042
WB = 039
60 65 70 75 80
0
5
10
15
20
GGBS ()
AN
H (
)
2426
2830
32
34
36
3840
42
GGBS = 70
034 037 039 042 044
0
5
10
15
20
WB
AN
H(
)
3032
34
3638
40
42
44
46
48
WB = 039
60 65 70 75 80
0
5
10
15
20
GGBS ()
AN
H(
)
32
34
36
38
40
42
44
46
48
25
568
(a) (b) 569
Fig12 Isoresponse curves for compressive strength at 28d (a) (WB vs ANH) and (b) 570
(ANH vs GGBS) 571
3310 Discussion of the effect of WB GGBS and ANH 572
As expected the increase of WB led to an increase in mini-slump induced bleeding and a 573
reduction in flow time plate cohesion yield stress plastic viscosity and compressive strengths 574
This can be attributed to more water in the system 575
An increase in GGBS content resulted in a reduction of the flow time plate cohesion yield 576
stress and plastic viscosity while the fluidity is improved This was due to the fact the specific 577
gravity of slag is lower than that of PC leading to an increase in the paste volume and thus 578
improving the fluidity of paste 579
In case of an increase of ANH proportion while WB and GGBS were kept constant it led to 580
an increased mini-slump and induced bleeding while the flow time plate cohesion yield stress 581
and plastic viscosity were reduced This was due to the lower reactivity of ANH resulting in an 582
increase of water needed for lubrication of paste 583
As expected an increase in WB lead to an increase in induced bleeding permeability and a 584
decrease in compressibility [33 35] This is due to the increase in liquid volume between the 585
particles and to the reduction in the amount of interparticle forces Globally the compressibility 586
decreases and the permeability increases with ANH It can be explained by the reduced specific 587
area and lower reactivity that can lead to more available water in the samples 588
3311 Heat of Hydration 589
Heat of hydration is considered an important factor in the cement design as low heat of 590
hydration reduces the effect of thermal cracking The heat flow results of the calorimeter test 591
performed over a three days period can be seen in Figure 13 592
GGBS = 70
034 036 039 042 0440
5
10
15
20
WB
AN
H (
)
46
48
50
52
54
56
58
60
WB = 039
0 5 10 15 2060
65
70
75
80
ANH ()
GG
BS
(
)
50
52
54
56
5860
62
26
593
Fig 13 Heat flow graphs for first 3 days of reaction 594
Figure 13 presents that the largest peaks were in mixes 1 2 5 and 6 This shows that these 595
reactions generated the most heat and that they were quick Mixes 1 and 2 have the highest 596
OPC content at 40 and this suggests that to lower the heat of the reaction minimal OPC 597
should be used This is confirmed by the fact that mixes 5 and 6 have the next highest OPC 598
contents the same percentage as mixes 3 4 and 9 (one of the repeated mixes) which have 599
anhydrite present This implies that the presence of anhydrite will lengthen the reaction process 600
and reduce the heat produced during setting significantly The graph shows this by the absence 601
of a sharp peak instead a gentle curved hump is shown over a 2-day period whereas the mixes 602
showing a sharp peak occur after about 12 hrs Mix 7 which has the same solids content as 603
mix 8 but a lower WB ratio and no cement present showed the lowest heat flow during the 604
hydration process 605
Figure 14 shows the cumulative heat generation during the first 3 days of setting It is clear that 606
the two mixes (1 and 2) with highest cement content and absence of anhydrite had the highest 607
cumulative heat development over the 3-day period 643J and 594J respectively Mixes 3456 608
and 9 which all have 20 OPC content generated similar heat value over the 3 days Results 609
of mixes containing ANH implies that over the period that the anhydrite did not reduce the 610
cumulative heat generated but slowed the reaction and reduce the peak heat generated The 611
0
0002
0004
0006
0008
001
0012
0 50000 100000 150000 200000 250000 300000
He
at F
low
(mW
)
Time s()
M1
M2
M3
M4
M5
M6
M7
M9
1Day
2Day
3day
1d 2d 3d
27
graphs also suggest that a higher WB ratio produced a lower cumulative and peak heat 612
generation613
614
Fig 14 Cumulative heat generation curves for first 3 days 615
3312 pH measurements 616
Fig 15 summarises the results of pH and the nine mixes with different compositions of WB 617
the percentages of cement GGBS and ANH It is shown that Supersulfated cements (SSCs) 618
have lower pH values (lt 125 at all ages) than PC which has a pH of 139 [41] making SSC 619
more preferable in essential applications such as nuclear waste encapsulation 620
The figure shows that the pH value decreased with time for all samples between 1 and 7 days 621
Similar trend was observed in the majority of mixes between 7 and 28 days except for sample 622
2 5 and 9 which showed slight increase in the pH values This decrease refers to the 623
consumption of ions in the pore structure due to the hydration process 624
0
100
200
300
400
500
600
700
800
0 50000 100000 150000 200000 250000 300000
(J)
Time (s)
M1
M2
M3
M4
M5
M6
M7
M9
1 Day
3 Day
2 day
1d 2d 3d
1
2
3
9
45
6
7
28
625
626 Fig 15 Summary of pore solution pH 627
628
The incorporation of ANH replacing the Portland cement (C) results in remarkable decrease in 629
pH at all ages as introducing the ANH reduced the lower initial pH Likewise the increase in 630
the content of GGBS led to a decrease in the pH value of the pore structure as GGBS has lower 631
initial pH than Portland cement The increase of WB ratio decreased the pH value This is in 632
agreement with Collier [41] who found that increasing the wb ratio from 05 to 06 increased 633
the pH by I unit This was attributed to the increased availability of water in the case of WB 634
of 06 allowing hydration of more cement powder thereby releasing more hydroxide anions 635
into solution However in this study the WB ratio did not show a significant effect on 636
lowering the pH These results are in agreement with [42] which also found that decreasing the 637
pH improved the bulk resistivity of SSC mixtures 638
3313 SEM 639
Figure 16 shows the SEM images of some mixes at various magnifications The images clearly 640
show the dense and compact structure of the cement after seven days The dense structure was 641
another requirement from the cement chosen to enclose the waste to prevent leaching The 642
microstructure consists mainly of C-S-H the main hydration product and unhydrated slag 643
grains C-S-H is formed after the dissolution of slag grains when contacting the water and 644
alkalis and then the ionic species saturate the solution and then precipitate as hydrated phases 645
[8] There were abundant grains of hydrated and partially hydrated slag grains some small 646
1080
1100
1120
1140
1160
1180
1200
1220
1240
1260
1280
1 2 3 4 5 6 7 8 9
pH
val
ue
Mix Number
1 Day
7 Days
28 Days
29
GGBS particles presented rims of reaction products (eg Mix 6-Figure 16 (f) and Mix 9-Figure 647
16 (h)) It was found by [11] that the composition of the reaction rims around slag was similar 648
to that of the C-S-H from PC However [12] found that in the CndashSndashH of SSC is apparently 649
more foil like which is different than the fibrillar morphology of C-S-H in OPC Mix 3 and 650
Mix 4 (Figure 16 (c) and (d) respectively) exhibits more micro voids in the micrsostructure 651
which could explain the low strength of these mixes compared to mix 1 and 2 Ettringite was 652
not detected Ettringite is not the most abundant phase and it is not easy to detect in dried 653
polished samples because it is easily decomposed under the drying conditions of the vacuum 654
of the microscope column [11] 655
(a) Mix 1 image at 1100 magnification (b) Mix 2 image at 900 magnification
(c) Particle of unreacted slag mix3 7 days (d) An overall image of mix 4 at 7days
showing CSH and BFS particles
30
(e) Mix 5 image at 1100 magnification (f) Mix 6 image at 2300 magnification
(g) Mix 7 image at 2000 magnification (h) Mix 9 image at 2700 magnification
Fig 16 SEM results 656
4 Conclusions 657
The paper focused on optimizing the SSC cement grout in order to get the best of it The effect 658
of GGBS WB and ANH dosages on the grout fluidity rheological properties induced 659
bleeding maximum heat of hydration and compressive strength was investigated using 660
factorial design approach and analysis The models derived in this study are valid for the 661
experimental area corresponding to grout mixes made with variable levels of WB ANH and 662
GGBS in the ranges of 034 to 044 0 to 20 by mass of binder 60 to 80 by mass of 663
binder respectively Based on the results from this study the following conclusions are drawn 664
- In comparison to GGBS and ANH WB ratio had more pronounced effects on the 665
results of mini-slump plate cohesion meter Marsh cone time yield stress plastic viscosity 666
induced bleeding permeability compressibility and compressive strength 667
31
- The increase in the dosage of GGBS led to an increase in the values of plate cohesion 668
meter Marsh cone time yield stress and plastic viscosity while reducing the mini-slump 669
values maximum hydration and compressive strength This is ascribed to the fine nature 670
of GGBS particles and pozzolanic effect 671
- While the ANH particles caused a decrease in the maximum of heat of hydration it 672
increased the induced bleeding permeability and compressibility due to its dominant effect 673
on increasing the dormant period and increasing the rates of solid sedimentation and 674
induced bleeding water 675
- Increasing the dosage of ANH in grout reduced the hydrations kinetic at early-age and 676
thus reduced the compressive strength at 1d 3d and 7d However this effect diminished 677
at later ages at 28 d in a manner similar to increasing WB 678
- The increase in the dosage of ANH led to an increase in the mini-slump values 679
(fluidity) but a decrease in the values of yield stress plastic viscosity plate cohesion and 680
Marsh cone time This is attributed to better deflocculation of particles at the fresh state 681
- The increase of GGBS percentage delayed the reaction process and decreased the total 682
heat after 3 days while WB slightly reduced the total heat it didnrsquot significantly affect the 683
reaction process 684
- pH measurements in the present study confirmed the suitability of these mixture to low-685
pH applications as the increase in both the GGBS and ANH markedly decreased the initial 686
pH thereby lowering the pH at different ages 687
- The modelling and prediction of the response of other points in the experimental domain 688
were therefore possible Although the models are based on a given set of materials they 689
can be easily used to generate future results using other materials 690
- Dense microstructure was observed for mixes examined in this study C-S-H is the main 691
reaction product with presence of unreacted slag grains embedded well in the structure 692
However some micro voids were observed in mixes containing ANH which led to lower 693
compressive strength of mixes with ANH 694
CRediT authorship contribution statement 695
MSonebi and YBai did the conceptualization and the design of investigation as well as 696 performing the experiments MSonebi carried out the software analysis of the results and the 697
32
visualization MSonebi AAbdalqader T Fayyad and APerrot analysed the results and 698 wrote the original draft and reviewed and edited the final version 699
Declaration of Competing Interest 700
The authors declare that they have no known competing financial interests or personal 701 relationships that could have appeared to influence the work reported in this paper 702
Acknowledgments 703
The authors would like to express their gratitude to P McCann from QUB and N Collier 704 from Eden Nuclear and Environment Ltd for their helps for some experiments 705
706
References 707
1 Schneider M Romer M Tschudin M Bolio H (2011) Sustainable cement production-708 present and future Cement and Concrete Research 41642ndash650 709
httpsdoiorg101016jcemconres201103019 710
2 Madlool NA Saidur R Hossain MS Rahim NA (2011) A critical review on energy use 711 and savings in the cement industries Renewable and Sustainable Energy Reviews 712
152042ndash2060 httpsdoiorg101016jrser201101005 713
3 EN15743 (2015) BS EN 157432010+A12015 Supersulfated cement - Composition 714
specifications and conformity criteria BSI 715
4 Khatib JM Wright L Mangat PS (2016) Mechanical and physical properties of concrete 716
containing FGD waste Magazine of Concrete Research 68550ndash560 717 httpsdoiorg101680macr1500092 718
5 Khatib JM Mangat PS Wright L (2008) Sulfate resistance of mortar containing 719
simulated FGD waste Proceedings of Institution of Civil Engineers Construction 720 Materials 161119ndash128 httpsdoiorg101680coma20081613119 721
6 (2020) Specifying Sustainable Concrete 722
7 Hewlett PC (2004) Learsquos Chemistry of Cement and Concrete fourth edi Elsevier 723 Science amp Technology Books Oxford 724
8 Gruskovnjak A Lothenbach B Winnefeld F et al (2008) Hydration mechanisms of 725 super sulphated slag cement Cement and Concrete Research 38983ndash992 726
httpsdoiorg101016jcemconres200803004 727
9 Grounds T Nowell D V Wilburn FW (2003) Resistance of supersulfated cement to 728 strong sulfate solutions Journal of Thermal Analysis and Calorimetry 72181ndash190 729
httpsdoiorg101023A1023928021602 730
10 Grounds T Nowell D V Wilburn FW (1995) The influence of temperature and 731
different storage conditions on the stability of supersulphated cement Journal of 732 Thermal Analysis 45385ndash394 httpsdoiorg101007BF02548772 733
33
11 Bazalduacutea-Medelliacuten ME Fuentes AF Gorokhovsky A Escalante-Garciacutea JI (2015) Early 734 and late hydration of supersulphated cements of blast furnace slag with fluorgypsum 735 Materiales de Construccion 65e043 httpsdoiorg103989mc201506013 736
12 Matschei T Bellmann F Stark J (2005) Hydration behaviour of sulphate-activated slag 737 cements Advances in Cement Research 17167ndash178 738
httpsdoiorg101680adcr2005174167 739
13 Richardson IG (2000) Nature of the hydration products in hardened cement pastes 740 Cement and Concrete Composites 2297ndash113 httpsdoiorg101016S0958-741 9465(99)00036-0 742
14 Baux C Phelipot-Mardeleacute A Lanos C et al (2013) PERFORMANCES OF SUPER 743 SULFATED CEMENTS In International Conference on Concrete Under Severe 744 Conditions pp 1857ndash1870 745
15 Annabelle Phelipot-Mardeleacute Gabriel Samson Christophe Lanos (2015) Super sulfated 746 cement formulation and uses In Construction Materials ConMat Whistler Canada 747
16 Milestone NB (2006) Reactions in cement encapsulated nuclear wastes need for 748 toolbox of different cement types Advances in Applied Ceramics 10513ndash20 749
httpsdoiorg101179174367606X81678 750
17 Batchelor B (2006) Overview of waste stabilization with cement Waste Management 751
26689ndash698 httpsdoiorg101016JWASMAN200601020 752
18 Zhang T Cheeseman CR Vandeperre LJ (2011) Development of low pH cement 753
systems forming magnesium silicate hydrate (MSH) Cement and Concrete Research 754 41439ndash442 httpsdoiorg101016jcemconres201101016 755
19 Mobasher N Bernal SA Provis JL (2016) Structural evolution of an alkali sulfate 756
activated slag cement Journal of Nuclear Materials 46897ndash104 757 httpsdoiorg101016JJNUCMAT201511016 758
20 Wang J Yu B Gao Y (2014) Hydration Characteristics of Super Sulphated Cement 759 with Different Fineness In Proceedings of the International Conference on Material 760 and Environmental Engineering (ICMAEE 2014) Atlantis Press Paris France 761
21 Naumlgele E (1986) The Zeta-potential of cement Part II Effect of pH-value Cement and 762 Concrete Research 16853ndash863 httpsdoiorg1010160008-8846(86)90008-6 763
22 Jain N Civil MG-IJ of M and 2015 U (2015) Formulation of Sulphate Resistant Super 764 Sulphated Cement Using Fluorogypsum and Granulated Blast Furnace Slag IOSR 765
Journal of Mechanical and Civil Engineering (IOSR-JMCE) 12153ndash159 766
23 Gao YX Yu BY Xu FL (2012) Effect of Modified Phosphogypsum on the Mechanical 767 Properties of Super Sulphate Cement Applied Mechanics and Materials 161264ndash268 768 httpsdoiorg104028wwwscientificnetAMM161264 769
24 Kantro D (1980) Influence of Water-Reducing Admixtures on Properties of Cement 770 PasteampmdashA Miniature Slump Test Cement Concrete and Aggregates 295ndash102 771
httpsdoiorg101520CCA10190J 772
34
25 Svermova L Sonebi M Bartos PJM (2003) Influence of mix proportions on rheology of 773 cement grouts containing limestone powder Cement and Concrete Composites 25737ndash774 749 httpsdoiorg101016S0958-9465(02)00115-4 775
26 Sonebi M (2006) Rheological properties of grouts with viscosity modifying agents as 776 diutan gum and welan gum incorporating pulverised fly ash Cement and Concrete 777
Research 361609ndash1618 httpsdoiorg101016JCEMCONRES200605016 778
27 Nehdi M Rahman M (2004) Effect of Geometry and Surface Friction of Test Accessory 779 on Oscillatory Rheological Properties of Cement Pastes ACI Materials Journal 780 101416ndash424 httpsdoiorg101435913428 781
28 Khayat KH Yahia A (1997) Effect of Welan Gum-High-Range Water Reducer 782 Combinations on Rheology of Cement Grout ACI Materials Journal 94365ndash372 783 httpsdoiorg1014359321 784
29 Lombardi G (1985) THE ROLE OF COHESION IN CEMENT GROUTING OF 785 ROCK In Proceedings of Fifteenth Congress on Large Dams International 786 Commission on Large Dams pp 235ndash261 787
30 Perrot A Rangeard D Picandet V Meacutelinge Y (2013) Hydro-mechanical properties of 788
fresh cement pastes containing polycarboxylate superplasticizer Cement and Concrete 789 Research 53221ndash228 httpsdoiorg101016JCEMCONRES201306015 790
31 Perrot A Lecompte T Khelifi H et al (2012) Yield stress and bleeding of fresh cement 791 pastes Cement and Concrete Research 42937ndash944 792
httpdxdoiorg101016jcemconres201203015 793
32 Sonebi M Perrot A (2019) Effect of mix proportions on rheology and permeability of 794 cement grouts containing viscosity modifying admixture Construction and Building 795
Materials 212687ndash697 httpsdoiorg101016jconbuildmat201904022 796
33 Picandet V Rangeard D Perrot A Lecompte T (2011) Permeability measurement of 797
fresh cement paste Cement and Concrete Research 41330ndash338 798 httpsdoiorg101016JCEMCONRES201011019 799
34 Perrot A Rangeard D (2017) Effects of mix design parameters on consolidation 800
behaviour of fresh cement-based materials Materials and Structures 50117 801 httpsdoiorg101617s11527-016-0988-0 802
35 Rangeard D Perrot A Picandet V et al (2015) Determination of the consolidation 803 coefficient of low compressibility materials application to fresh cement-based 804
materials Materials and Structures 481475ndash1483 httpsdoiorg101617s11527-014-805 0247-1 806
36 Massoussi N Keita E Roussel N (2017) The heterogeneous nature of bleeding in 807 cement pastes Cement and Concrete Research 95108ndash116 808 httpsdoiorg101016JCEMCONRES201702012 809
37 Montgomery D (2007) Design and Analysis of Experiments Second Edition John 810
Wiley amp Sons 811
35
38 Roussel N Stefani C Leroy R (2005) From mini-cone test to Abrams cone test 812 Measurement of cement-based materials yield stress using slump tests Cement and 813 Concrete Research 35817ndash822 httpsdoiorg101016jcemconres200407032 814
39 Mangat PS Khatib JM Wright L (2006) Optimum utilisation of FGD waste in blended 815 binders Proceedings of Institution of Civil Engineers Construction Materials 159119ndash816
127 httpsdoiorg101680coma20061593119 817
40 Khatib JM Mangat PS Wright L (2013) Early age porosity and pore size distribution of 818 cement paste with flue gas desulphurisation (FGD) waste Journal of Civil Engineering 819 and Management 19622ndash627 httpsdoiorg103846139237302013793609 820
41 Collier NC Milestone NB Gordon LE Ko SC (2014) The suitability of a supersulfated 821 cement for nuclear waste immobilisation Journal of Nuclear Materials 452457ndash464 822 httpsdoiorg101016jjnucmat201405078 823
42 Masoudi R (2018) Examining compositions hydration mechanisms and properties of 824 supersulfated cement for use in concrete by Examining compositions hydration 825 mechanisms and properties of supersulfated cement for use in concrete University of 826 Toronto 827
828
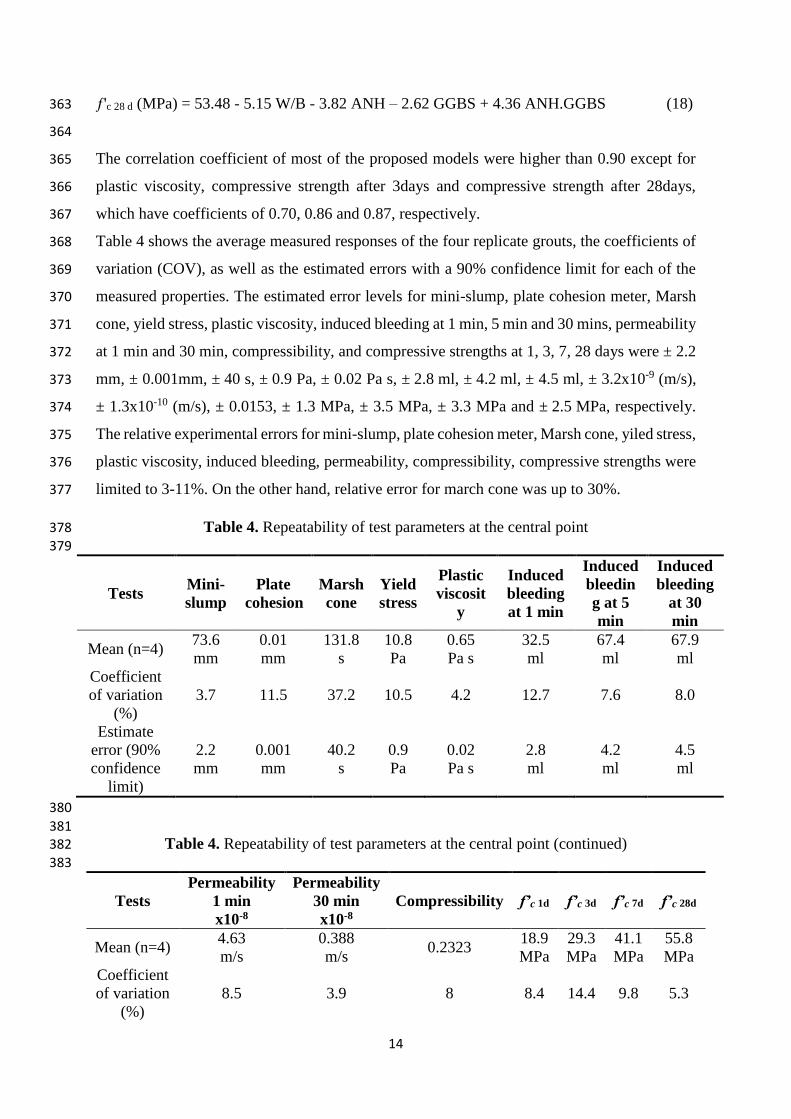
14
ƒc 28 d (MPa) = 5348 - 515 WB - 382 ANH ndash 262 GGBS + 436 ANHGGBS (18) 363
364
The correlation coefficient of most of the proposed models were higher than 090 except for 365
plastic viscosity compressive strength after 3days and compressive strength after 28days 366
which have coefficients of 070 086 and 087 respectively 367
Table 4 shows the average measured responses of the four replicate grouts the coefficients of 368
variation (COV) as well as the estimated errors with a 90 confidence limit for each of the 369
measured properties The estimated error levels for mini-slump plate cohesion meter Marsh 370
cone yield stress plastic viscosity induced bleeding at 1 min 5 min and 30 mins permeability 371
at 1 min and 30 min compressibility and compressive strengths at 1 3 7 28 days were plusmn 22 372
mm plusmn 0001mm plusmn 40 s plusmn 09 Pa plusmn 002 Pa s plusmn 28 ml plusmn 42 ml plusmn 45 ml plusmn 32x10-9 (ms) 373
plusmn 13x10-10 (ms) plusmn 00153 plusmn 13 MPa plusmn 35 MPa plusmn 33 MPa and plusmn 25 MPa respectively 374
The relative experimental errors for mini-slump plate cohesion meter Marsh cone yiled stress 375
plastic viscosity induced bleeding permeability compressibility compressive strengths were 376
limited to 3-11 On the other hand relative error for march cone was up to 30 377
Table 4 Repeatability of test parameters at the central point 378
379
Tests Mini-
slump
Plate
cohesion
Marsh
cone
Yield
stress
Plastic
viscosit
y
Induced
bleeding
at 1 min
Induced
bleedin
g at 5
min
Induced
bleeding
at 30
min
Mean (n=4) 736
mm
001
mm
1318
s
108
Pa
065
Pa s
325
ml
674
ml
679
ml
Coefficient
of variation
()
37 115 372 105 42 127 76 80
Estimate
error (90
confidence
limit)
22
mm
0001
mm
402
s
09
Pa
002
Pa s
28
ml
42
ml
45
ml
380
381 Table 4 Repeatability of test parameters at the central point (continued) 382
383
Tests
Permeability
1 min
x10-8
Permeability
30 min
x10-8
Compressibility frsquoc 1d frsquoc 3d frsquoc 7d frsquoc 28d
Mean (n=4) 463
ms
0388
ms 02323
189
MPa
293
MPa
411
MPa
558
MPa
Coefficient
of variation
()
85 39 8 84 144 98 53
15
Estimate
error (90
confidence
limit)
032
(ms)
0013
(ms)
00153
13
MPa
35
MPa
33
MPa
24
MPa
384
385
31 Accuracy of the established models 386
387
The ratio of predicted-to-measured properties for grout ranged between 087 and 115 388
indicating good accuracy for prediction of mini-slump plate cohesion induced bleeding at 1 389
min 5 mins and 30 mins yield stress plastic viscosity and compressive strength at 1-d 3-d 7-390
d and 28-d In general the proposed models for mini-slump plate cohesion Marsh cone and 391
compressive strength appeared to be accurate in predicting fluidity cohesivity induced 392
bleeding permeability at 30 min compressibility and compressive strength with low scatter 393
between measured and predicted values However the average values of predictedmeasured 394
ratio of yield values were slightly higher (074) 395
396
32 Isoresponses of the proposed models 397
398
The isoresponse surfaces and contour plots for mini-slump plate cohesion Marsh cone yield 399
stress plastic viscosity induced bleeding at 1 min 5 mins and 30 mins permeability at 1 min 400
and 30 mins compressibility and compressive strength at 1-d 3-d 7-d and 28-d were obtained 401
by using response surface methodology (RSM) The isoresponse surfaces and contour plots 402
were obtained from the regression models and because the models contained interaction and 403
second-order variables the contour lines were curved 404
The proposed statistical models can therefore be used to evaluate the effect of a group of 405
variables on the properties affecting the quality of supersulfated grout This allowed for the 406
calculation of isoresponse surfaces from the parameters under study outside the experimental 407
domain and the optimisation of their effects The next sections will discuss the results of each 408
experiment separately 409
331 Mini-slump 410
As shown in Eq 4 the mini-slump is influenced in order of significance by WB ratio 411
anhydrite proportion interaction of WB and ANH and the percentage of GGBS content The 412
WB ratio had the greatest effect on fluidity due to better lubrication of the particles in the paste 413
16
[29] The mini-slump test was accompanied by very low shear The value of mini-slump is to 414
characterise yield stress [38] therefore higher mini-slump value indicated a lower yield stress 415
The effect of WB on the increase of mini-slump was two and half-time than that of ANH (192 416
vs 781 in Eq 4) However increased ANH resulted in a 27 times greater increase in mini-417
slump than reduced GGBS (781 vs -294 in Eq 4) Figure 1(a) shows the effect of increased 418
WB on mini-slump vs ANH (when GGBS was kept constant at 70) and Figure 1(b) shows 419
GGBS vs ANH (when WB was fixed at 039) Based on these figures it is evident that mini-420
slump increased significantly when the dosage of WB and ANH increased 421
422
(a) (b) 423
Fig 1 Isoresponse curves of mini-slump (mm) (a) WB vs ANH and (b) GGBS vs ANH 424
425
332 Marsh cone 426
The time needed for a grout sample to flow through the Marsh cone is proportional to the 427
viscosity of the cement grout the flow time becomes an index of fluidity so the longer the 428
flow time the lower the fluidity Similar to the previous trends Eq 5 shows that the values of 429
Marsh cone are influenced in order of significance by WB GGBS and ANH This is 430
graphically illustrated in Figure 2 431
GGBS = 70
034 039 042 044
0
5
10
15
20
WB
AN
H (
)
65
74
83
92
101
037
AN
H(
)
WB = 039
60 65 70 75 80
0
5
10
15
20
GGBS()
70
75
80
85
17
432
(a) (b) 433
Fig 2 Isoresponse curves for flow time (s) (a) WB vs ANH and (b) GGBS vs ANH 434
435
It can be noted that an increase in WB and ANH or a reduction in GGBS led to decreasing 436
the Marsh cone flow time For example at fixed WB at 039 and GGBS of 70 respectively 437
the increase in ANH dosage from 5 to 20 led to a marked reduction of the Marsh cone flow 438
time from 170 to 140 s (Figure 2(a)) This behaviour is attributed to the change in plastic 439
viscosity of the grout as will be discussed later 440
333 Cohesion plate 441
As shown in Eq 6 the cohesion plate was influenced in order of magnitude by the WB and 442
the percentage of GGBS and ANH The increasing WB had a 34 times the influence on the 443
reduction of the cohesion plate test results as the increased ANH (for a GGBS constant) By 444
comparing the effects of WB and GGBS on plate cohesion the increased WB can be 445
interpreted as having approximately a 3 times greater influence on the reduction of plate 446
cohesion values than the increase in GGBS (-366 vs 122 in Eq 6) given that ANH is held 447
constant The effect of an increase in WB from 034 to 044 and ANH from 0 to 20 with a 448
fixed GGBS dosage of 70 is presented in Figure 3(a) Increased WB led to a decreased 449
cohesion plate value Conversely an increase in GGBS increased the cohesion plate value and 450
an increased ANH caused a reduction in cohesion plate (Figure 3(b)) 451
GGBS = 70
034 036 039 042 0440
5
10
15
20
WB
AN
H (
)
40
6080
100120
140160
180200
220
WB = 039
60 65 70 75 80
0
5
10
15
20
GGBS ()
AN
H (
)
100
120
140
160
180
18
452
(a) (b) 453
Fig 3 Isoresponse curves for plate cohesion meter (a) WB vs ANH and (b) GGBS vs 454 ANH 455
334 Yield stress 456
As shown in Eq 7 yield value was influenced in order of magnitude by WB and dosages of 457
ANH and GGBS Based on Figure 4 (a) when WB was fixed at 039 GGBS maintained at 458
70 and ANH increased to 5 the isoresponse curve showed a yield value of 15 Pa On the 459
other hand if the proportion of ANH was further increased to 20 while GBBS was 460
maintained at 70 the yield value decreased to 135 Pa This corresponds with Eq (7) in 461
which the proportion of WB and ANH were increased while GGBS was kept constant 462
resulting in a reduction in yield stress An increase in GGBS content resulted in an increase of 463
the yield stress 464
Figure 4 (b) shows the isoresponse curve of the yield value with a fixed proportion of GGBS 465
at 70 When WB was 039 and ANH was 5 the isoresponse of the predicted yield value 466
was 155 Pa If ANH was increased to 20 while maintaining WB at 039 the isoresponse of 467
the yield value was 135 Pa 468
It can be interesting to note that the observed results for the yield stress are closed to the one 469
observed with the cohesion plate and mini-slump tests This is expected as yield stress values 470
can be derived from those two simple tests 471
GGBS = 70
034 037 039 042 0440
5
10
15
20
WB
AN
H(
)
45
55
65
7585
95
105
115
WB = 039
60 65 70 75 800
5
10
15
20
GGBS ()
AN
H(
)
75
85
95
105
19
472
(a) (b) 473
Fig 4 Isoresponse curves for yield stress (Pa) (a) WB vs ANH and (b) GGBS vs ANH 474
335 Plastic viscosity 475
Plastic viscosity was influenced in order of magnitude by WB and the dosages of ANH and 476
GGBS ANH and GGBS had almost opposite effects on plastic viscosity (-0078 vs 0073 in 477
Eq 8) As shown in Eq (8) increased WB had the greatest primary effect on plastic viscosity 478
(034 vs 0078 and 0073) The increased WB had approximately a 44 times greater influence 479
on reducing plastic viscosity than increased ANH or decreased GGBS 480
In the isoresponse curve of plastic viscosity shown in Figure 5 (a) when GGBS was fixed at 481
70 WB set at 039 and ANH maintained at 5 the predicted plastic viscosity value was 482
068 Pas On the other hand if the dosage of ANHB was increased to 20 while maintaining 483
a similar WB the plastic viscosity was reduced to 055 Pas 484
In Figure 5 (b) WB was fixed at 039 when GGBS was held at 70 and ANH at 5 the 485
predicted plastic viscosity was 067 Pas However when ANH was increased to 20 and 486
GGBS was maintained at 70 the predicted plastic viscosity dropped to 055 Pas 487
AN
H(
)
GGBS = 70
034 037 039 042 044
0
5
10
15
20
WB
1012
1416
18
20
WB = 039
60 65 70 75 800
5
10
15
20
GGBS ()
AN
H(
)
13
14
15
20
488
(a) (b) 489
Fig 5 Isoresponse curve for plastic viscosity (Pas) (a) WB vs ANH and (b) GGBS vs 490
ANH 491
336 Induced bleeding 492
The induced bleeding equations for 1 and 5 minutes (Eqs 9 10) and 30 minutes (Eq 11) are 493
very similar The two influencing factors of induced bleeding are WB ratio and anhydrite 494
WB ratio has the greatest effect over two times the effect of anhydrite content Figure 6 shows 495
the isoresponse for bleeding versus the WB ratio for a fixed value of GGBS at 70 It can be 496
seen that when an anhydrite value is selected and the WB ratio is increased the bleeding will 497
also increase Similarly if a WB ratio is selected and the anhydrite content is increased the 498
bleeding will again increase 499
500
GGBS = 70
034 037 039 042 0440
5
10
15
20
WB
AN
H(
)
035
045
055
065
075
085
095
WB = 039
60 65 70 75 800
5
10
15
20
GGBS ()
AN
H(
)
055
060
065
075
034 036 039 042 044
0
5
10
15
20
WB
AN
H (
)
26
28
30
3234
36
38
40
GGBS=70
21
(a) 501
502
(b) (c) 503
Fig 6 Isoresponse curves for induced bleeding at 1 5 and 30 min WB vs ANH 504
337 Permeability 505
Figure 7 (a) and (b) showed firstly that the permeability decreased significantly from 1 min to 506
30 min Permeability at 1 min was influenced in order of magnitude by WB and the dosage 507
of ANH All interactions between 3 parameters had almost opposite effects on permeability 508
(Eq 12) As shown in Eq (12) increased WB and AHN had the greatest primary effect on 509
permeability at 1 min It seems there is an optimum reached at WB = 40 and AHN at 17 510
Similarly the permeability at 30 min is affected in order of significance by WB followed by 511
ANH (Eq 13) In Figure 7 (b) WB was fixed at 039 when GGBS was held at 70 and ANH 512
at 10 the predicted permeability was 038 x 10-8 (ms) However when ANH was increased 513
to 20 and GGBS was maintained at 70 the predicted permeability increased to 040x10-8 514
(ms) 515
516
GGBS = 70
034 036 039 042 0440
5
10
15
20
WB
AN
H (
)
545
61
675
74
805
GGBS = 70
034 036 039 042 0440
5
10
15
20
WB
AN
H (
)
56
60
64
68
72
7680
84
22
517
(a) (b) 518
Fig 7 Isoresponse curves for permeability at 1 and 30 min WB vs ANH 519
338 Compressibility 520
As shown in Eq (14) the compressibility was influenced in order of magnitude by the WB 521
and the percentage of ANH The interaction between 3 parameters affected also the 522
compressibility The increasing WB had a 32 times the influence on the increase of the 523
compressibility results as the increased ANH (for a GGBS constant) The effect of an increase 524
in WB from 034 to 044 and ANH from 0 to 20 with a fixed GGBS dosage of 70 is 525
presented in Figure 8 Increased WB led to an increase of compressibility Similarly an 526
increase in AHN increased the compressibility 527
528
Fig 8 Isoresponse curves for compressibility WB vs ANH 529
034 036 039 042 044
0
5
10
15
20
GGBS = 70 WB
AN
H (
)
3
35
4
4
45
5
034 036 039 042 044
0
5
10
15
20
WB
AN
H (
)
034
035
036 037 038 039 04
041
042
4
GGBS=70
034 036 039 042 044
0
5
10
15
20
WB
AN
H (
)
017
019
021 023 025 027
029
031
GGBS=70
23
530
339 Compressive strength 531
After one day from Eq 15 the influencing factors in order of significance are WB ratio 532
anhydrite content GGBS content and the interaction of WB and ANH The effect of the first 533
three was similar but WB had 11 times greater effect than anhydrite and 125 times greater 534
effect than GGBS While the interaction of WB and anhydrite had around a third of the 535
influence of WB Figures 9 (a) and (b) show the isoresponses for 1-day compressive strength 536
From Figure 9 (a) it can be seen when the GGBS content is fixed at 70 for a given anhydrite 537
content increasing the WB ratio will decrease the strength Also if a WB ratio is selected and 538
the anhydrite is increased similarly the strength will decrease From Figure 9 (b) with the WB 539
ratio fixed at 039 once again an increase in GGBS led to a reduction of compressive strength 540
at 1 day 541
542
(a) (b) 543
Fig9 Isoresponse curves for compressive strength at 1d (a) (WB vs ANH) and (b) (GGBS 544 vs ANH) 545
Eqs 16 17 and 18 show the effect of GGBS and ANH percentages on compressive strength at 546
3-d 7-d and 28-d Figures 10 11 and 12 show the isoresponse of the compressive strength at 547
3-d 7-d and 28-d respectively with WB vs ANH Increased ANH led to a decrease of 3-d 548
and 7-d compressive strength As expected an Increase in WB led to a decrease in compressive 549
strength The percentage of ANH had a negative effect on compressive strength and showed a 550
greater influence particularly at 3-d and 7-d (879 (3 d) amp 924 (7d) vs 382 (28 d)) GGBS has 551
a negative impact on early strength development The negative effect of GGBS on compressive 552
GGBS = 70
034 037 039 042 0440
5
10
15
20
WB
AN
H(
)
12
14
16
18
20
22
2426
WB = 039
60 65 70 75 800
5
10
15
20
GGBS ()
AN
H(
)
10
12
14
16
18
20
22
24
strength at early ages is clearly attributable to the fact that up to 80 of cement has been 553
replaced by GGBS and it takes some time for GGBS to start developing its pozzolanic action 554
at a noticeable level The results indicate that ANH content influences strength to a greater 555
extent than GGBS at all ages The SO3 content was reported to have great influence on the 556
strength [39 40] 557
558
(a) (b) 559
Fig10 Isoresponse curves for compressive strength at 3d (a) (WB vs ANH) and (b) 560 (GGBS vs ANH) 561
562
563
(a) (b) 564
Fig11 Isoresponse curves for compressive strength at 7d (a) (WB vs ANH) and (b) (WB 565 vs ANH) 566
567
GGBS = 70
034 036 039 042 0440
5
10
15
20
WB
AN
H (
)
24
2628
30
3234
3638
4042
WB = 039
60 65 70 75 80
0
5
10
15
20
GGBS ()
AN
H (
)
2426
2830
32
34
36
3840
42
GGBS = 70
034 037 039 042 044
0
5
10
15
20
WB
AN
H(
)
3032
34
3638
40
42
44
46
48
WB = 039
60 65 70 75 80
0
5
10
15
20
GGBS ()
AN
H(
)
32
34
36
38
40
42
44
46
48
25
568
(a) (b) 569
Fig12 Isoresponse curves for compressive strength at 28d (a) (WB vs ANH) and (b) 570
(ANH vs GGBS) 571
3310 Discussion of the effect of WB GGBS and ANH 572
As expected the increase of WB led to an increase in mini-slump induced bleeding and a 573
reduction in flow time plate cohesion yield stress plastic viscosity and compressive strengths 574
This can be attributed to more water in the system 575
An increase in GGBS content resulted in a reduction of the flow time plate cohesion yield 576
stress and plastic viscosity while the fluidity is improved This was due to the fact the specific 577
gravity of slag is lower than that of PC leading to an increase in the paste volume and thus 578
improving the fluidity of paste 579
In case of an increase of ANH proportion while WB and GGBS were kept constant it led to 580
an increased mini-slump and induced bleeding while the flow time plate cohesion yield stress 581
and plastic viscosity were reduced This was due to the lower reactivity of ANH resulting in an 582
increase of water needed for lubrication of paste 583
As expected an increase in WB lead to an increase in induced bleeding permeability and a 584
decrease in compressibility [33 35] This is due to the increase in liquid volume between the 585
particles and to the reduction in the amount of interparticle forces Globally the compressibility 586
decreases and the permeability increases with ANH It can be explained by the reduced specific 587
area and lower reactivity that can lead to more available water in the samples 588
3311 Heat of Hydration 589
Heat of hydration is considered an important factor in the cement design as low heat of 590
hydration reduces the effect of thermal cracking The heat flow results of the calorimeter test 591
performed over a three days period can be seen in Figure 13 592
GGBS = 70
034 036 039 042 0440
5
10
15
20
WB
AN
H (
)
46
48
50
52
54
56
58
60
WB = 039
0 5 10 15 2060
65
70
75
80
ANH ()
GG
BS
(
)
50
52
54
56
5860
62
26
593
Fig 13 Heat flow graphs for first 3 days of reaction 594
Figure 13 presents that the largest peaks were in mixes 1 2 5 and 6 This shows that these 595
reactions generated the most heat and that they were quick Mixes 1 and 2 have the highest 596
OPC content at 40 and this suggests that to lower the heat of the reaction minimal OPC 597
should be used This is confirmed by the fact that mixes 5 and 6 have the next highest OPC 598
contents the same percentage as mixes 3 4 and 9 (one of the repeated mixes) which have 599
anhydrite present This implies that the presence of anhydrite will lengthen the reaction process 600
and reduce the heat produced during setting significantly The graph shows this by the absence 601
of a sharp peak instead a gentle curved hump is shown over a 2-day period whereas the mixes 602
showing a sharp peak occur after about 12 hrs Mix 7 which has the same solids content as 603
mix 8 but a lower WB ratio and no cement present showed the lowest heat flow during the 604
hydration process 605
Figure 14 shows the cumulative heat generation during the first 3 days of setting It is clear that 606
the two mixes (1 and 2) with highest cement content and absence of anhydrite had the highest 607
cumulative heat development over the 3-day period 643J and 594J respectively Mixes 3456 608
and 9 which all have 20 OPC content generated similar heat value over the 3 days Results 609
of mixes containing ANH implies that over the period that the anhydrite did not reduce the 610
cumulative heat generated but slowed the reaction and reduce the peak heat generated The 611
0
0002
0004
0006
0008
001
0012
0 50000 100000 150000 200000 250000 300000
He
at F
low
(mW
)
Time s()
M1
M2
M3
M4
M5
M6
M7
M9
1Day
2Day
3day
1d 2d 3d
27
graphs also suggest that a higher WB ratio produced a lower cumulative and peak heat 612
generation613
614
Fig 14 Cumulative heat generation curves for first 3 days 615
3312 pH measurements 616
Fig 15 summarises the results of pH and the nine mixes with different compositions of WB 617
the percentages of cement GGBS and ANH It is shown that Supersulfated cements (SSCs) 618
have lower pH values (lt 125 at all ages) than PC which has a pH of 139 [41] making SSC 619
more preferable in essential applications such as nuclear waste encapsulation 620
The figure shows that the pH value decreased with time for all samples between 1 and 7 days 621
Similar trend was observed in the majority of mixes between 7 and 28 days except for sample 622
2 5 and 9 which showed slight increase in the pH values This decrease refers to the 623
consumption of ions in the pore structure due to the hydration process 624
0
100
200
300
400
500
600
700
800
0 50000 100000 150000 200000 250000 300000
(J)
Time (s)
M1
M2
M3
M4
M5
M6
M7
M9
1 Day
3 Day
2 day
1d 2d 3d
1
2
3
9
45
6
7
28
625
626 Fig 15 Summary of pore solution pH 627
628
The incorporation of ANH replacing the Portland cement (C) results in remarkable decrease in 629
pH at all ages as introducing the ANH reduced the lower initial pH Likewise the increase in 630
the content of GGBS led to a decrease in the pH value of the pore structure as GGBS has lower 631
initial pH than Portland cement The increase of WB ratio decreased the pH value This is in 632
agreement with Collier [41] who found that increasing the wb ratio from 05 to 06 increased 633
the pH by I unit This was attributed to the increased availability of water in the case of WB 634
of 06 allowing hydration of more cement powder thereby releasing more hydroxide anions 635
into solution However in this study the WB ratio did not show a significant effect on 636
lowering the pH These results are in agreement with [42] which also found that decreasing the 637
pH improved the bulk resistivity of SSC mixtures 638
3313 SEM 639
Figure 16 shows the SEM images of some mixes at various magnifications The images clearly 640
show the dense and compact structure of the cement after seven days The dense structure was 641
another requirement from the cement chosen to enclose the waste to prevent leaching The 642
microstructure consists mainly of C-S-H the main hydration product and unhydrated slag 643
grains C-S-H is formed after the dissolution of slag grains when contacting the water and 644
alkalis and then the ionic species saturate the solution and then precipitate as hydrated phases 645
[8] There were abundant grains of hydrated and partially hydrated slag grains some small 646
1080
1100
1120
1140
1160
1180
1200
1220
1240
1260
1280
1 2 3 4 5 6 7 8 9
pH
val
ue
Mix Number
1 Day
7 Days
28 Days
29
GGBS particles presented rims of reaction products (eg Mix 6-Figure 16 (f) and Mix 9-Figure 647
16 (h)) It was found by [11] that the composition of the reaction rims around slag was similar 648
to that of the C-S-H from PC However [12] found that in the CndashSndashH of SSC is apparently 649
more foil like which is different than the fibrillar morphology of C-S-H in OPC Mix 3 and 650
Mix 4 (Figure 16 (c) and (d) respectively) exhibits more micro voids in the micrsostructure 651
which could explain the low strength of these mixes compared to mix 1 and 2 Ettringite was 652
not detected Ettringite is not the most abundant phase and it is not easy to detect in dried 653
polished samples because it is easily decomposed under the drying conditions of the vacuum 654
of the microscope column [11] 655
(a) Mix 1 image at 1100 magnification (b) Mix 2 image at 900 magnification
(c) Particle of unreacted slag mix3 7 days (d) An overall image of mix 4 at 7days
showing CSH and BFS particles
30
(e) Mix 5 image at 1100 magnification (f) Mix 6 image at 2300 magnification
(g) Mix 7 image at 2000 magnification (h) Mix 9 image at 2700 magnification
Fig 16 SEM results 656
4 Conclusions 657
The paper focused on optimizing the SSC cement grout in order to get the best of it The effect 658
of GGBS WB and ANH dosages on the grout fluidity rheological properties induced 659
bleeding maximum heat of hydration and compressive strength was investigated using 660
factorial design approach and analysis The models derived in this study are valid for the 661
experimental area corresponding to grout mixes made with variable levels of WB ANH and 662
GGBS in the ranges of 034 to 044 0 to 20 by mass of binder 60 to 80 by mass of 663
binder respectively Based on the results from this study the following conclusions are drawn 664
- In comparison to GGBS and ANH WB ratio had more pronounced effects on the 665
results of mini-slump plate cohesion meter Marsh cone time yield stress plastic viscosity 666
induced bleeding permeability compressibility and compressive strength 667
31
- The increase in the dosage of GGBS led to an increase in the values of plate cohesion 668
meter Marsh cone time yield stress and plastic viscosity while reducing the mini-slump 669
values maximum hydration and compressive strength This is ascribed to the fine nature 670
of GGBS particles and pozzolanic effect 671
- While the ANH particles caused a decrease in the maximum of heat of hydration it 672
increased the induced bleeding permeability and compressibility due to its dominant effect 673
on increasing the dormant period and increasing the rates of solid sedimentation and 674
induced bleeding water 675
- Increasing the dosage of ANH in grout reduced the hydrations kinetic at early-age and 676
thus reduced the compressive strength at 1d 3d and 7d However this effect diminished 677
at later ages at 28 d in a manner similar to increasing WB 678
- The increase in the dosage of ANH led to an increase in the mini-slump values 679
(fluidity) but a decrease in the values of yield stress plastic viscosity plate cohesion and 680
Marsh cone time This is attributed to better deflocculation of particles at the fresh state 681
- The increase of GGBS percentage delayed the reaction process and decreased the total 682
heat after 3 days while WB slightly reduced the total heat it didnrsquot significantly affect the 683
reaction process 684
- pH measurements in the present study confirmed the suitability of these mixture to low-685
pH applications as the increase in both the GGBS and ANH markedly decreased the initial 686
pH thereby lowering the pH at different ages 687
- The modelling and prediction of the response of other points in the experimental domain 688
were therefore possible Although the models are based on a given set of materials they 689
can be easily used to generate future results using other materials 690
- Dense microstructure was observed for mixes examined in this study C-S-H is the main 691
reaction product with presence of unreacted slag grains embedded well in the structure 692
However some micro voids were observed in mixes containing ANH which led to lower 693
compressive strength of mixes with ANH 694
CRediT authorship contribution statement 695
MSonebi and YBai did the conceptualization and the design of investigation as well as 696 performing the experiments MSonebi carried out the software analysis of the results and the 697
32
visualization MSonebi AAbdalqader T Fayyad and APerrot analysed the results and 698 wrote the original draft and reviewed and edited the final version 699
Declaration of Competing Interest 700
The authors declare that they have no known competing financial interests or personal 701 relationships that could have appeared to influence the work reported in this paper 702
Acknowledgments 703
The authors would like to express their gratitude to P McCann from QUB and N Collier 704 from Eden Nuclear and Environment Ltd for their helps for some experiments 705
706
References 707
1 Schneider M Romer M Tschudin M Bolio H (2011) Sustainable cement production-708 present and future Cement and Concrete Research 41642ndash650 709
httpsdoiorg101016jcemconres201103019 710
2 Madlool NA Saidur R Hossain MS Rahim NA (2011) A critical review on energy use 711 and savings in the cement industries Renewable and Sustainable Energy Reviews 712
152042ndash2060 httpsdoiorg101016jrser201101005 713
3 EN15743 (2015) BS EN 157432010+A12015 Supersulfated cement - Composition 714
specifications and conformity criteria BSI 715
4 Khatib JM Wright L Mangat PS (2016) Mechanical and physical properties of concrete 716
containing FGD waste Magazine of Concrete Research 68550ndash560 717 httpsdoiorg101680macr1500092 718
5 Khatib JM Mangat PS Wright L (2008) Sulfate resistance of mortar containing 719
simulated FGD waste Proceedings of Institution of Civil Engineers Construction 720 Materials 161119ndash128 httpsdoiorg101680coma20081613119 721
6 (2020) Specifying Sustainable Concrete 722
7 Hewlett PC (2004) Learsquos Chemistry of Cement and Concrete fourth edi Elsevier 723 Science amp Technology Books Oxford 724
8 Gruskovnjak A Lothenbach B Winnefeld F et al (2008) Hydration mechanisms of 725 super sulphated slag cement Cement and Concrete Research 38983ndash992 726
httpsdoiorg101016jcemconres200803004 727
9 Grounds T Nowell D V Wilburn FW (2003) Resistance of supersulfated cement to 728 strong sulfate solutions Journal of Thermal Analysis and Calorimetry 72181ndash190 729
httpsdoiorg101023A1023928021602 730
10 Grounds T Nowell D V Wilburn FW (1995) The influence of temperature and 731
different storage conditions on the stability of supersulphated cement Journal of 732 Thermal Analysis 45385ndash394 httpsdoiorg101007BF02548772 733
33
11 Bazalduacutea-Medelliacuten ME Fuentes AF Gorokhovsky A Escalante-Garciacutea JI (2015) Early 734 and late hydration of supersulphated cements of blast furnace slag with fluorgypsum 735 Materiales de Construccion 65e043 httpsdoiorg103989mc201506013 736
12 Matschei T Bellmann F Stark J (2005) Hydration behaviour of sulphate-activated slag 737 cements Advances in Cement Research 17167ndash178 738
httpsdoiorg101680adcr2005174167 739
13 Richardson IG (2000) Nature of the hydration products in hardened cement pastes 740 Cement and Concrete Composites 2297ndash113 httpsdoiorg101016S0958-741 9465(99)00036-0 742
14 Baux C Phelipot-Mardeleacute A Lanos C et al (2013) PERFORMANCES OF SUPER 743 SULFATED CEMENTS In International Conference on Concrete Under Severe 744 Conditions pp 1857ndash1870 745
15 Annabelle Phelipot-Mardeleacute Gabriel Samson Christophe Lanos (2015) Super sulfated 746 cement formulation and uses In Construction Materials ConMat Whistler Canada 747
16 Milestone NB (2006) Reactions in cement encapsulated nuclear wastes need for 748 toolbox of different cement types Advances in Applied Ceramics 10513ndash20 749
httpsdoiorg101179174367606X81678 750
17 Batchelor B (2006) Overview of waste stabilization with cement Waste Management 751
26689ndash698 httpsdoiorg101016JWASMAN200601020 752
18 Zhang T Cheeseman CR Vandeperre LJ (2011) Development of low pH cement 753
systems forming magnesium silicate hydrate (MSH) Cement and Concrete Research 754 41439ndash442 httpsdoiorg101016jcemconres201101016 755
19 Mobasher N Bernal SA Provis JL (2016) Structural evolution of an alkali sulfate 756
activated slag cement Journal of Nuclear Materials 46897ndash104 757 httpsdoiorg101016JJNUCMAT201511016 758
20 Wang J Yu B Gao Y (2014) Hydration Characteristics of Super Sulphated Cement 759 with Different Fineness In Proceedings of the International Conference on Material 760 and Environmental Engineering (ICMAEE 2014) Atlantis Press Paris France 761
21 Naumlgele E (1986) The Zeta-potential of cement Part II Effect of pH-value Cement and 762 Concrete Research 16853ndash863 httpsdoiorg1010160008-8846(86)90008-6 763
22 Jain N Civil MG-IJ of M and 2015 U (2015) Formulation of Sulphate Resistant Super 764 Sulphated Cement Using Fluorogypsum and Granulated Blast Furnace Slag IOSR 765
Journal of Mechanical and Civil Engineering (IOSR-JMCE) 12153ndash159 766
23 Gao YX Yu BY Xu FL (2012) Effect of Modified Phosphogypsum on the Mechanical 767 Properties of Super Sulphate Cement Applied Mechanics and Materials 161264ndash268 768 httpsdoiorg104028wwwscientificnetAMM161264 769
24 Kantro D (1980) Influence of Water-Reducing Admixtures on Properties of Cement 770 PasteampmdashA Miniature Slump Test Cement Concrete and Aggregates 295ndash102 771
httpsdoiorg101520CCA10190J 772
34
25 Svermova L Sonebi M Bartos PJM (2003) Influence of mix proportions on rheology of 773 cement grouts containing limestone powder Cement and Concrete Composites 25737ndash774 749 httpsdoiorg101016S0958-9465(02)00115-4 775
26 Sonebi M (2006) Rheological properties of grouts with viscosity modifying agents as 776 diutan gum and welan gum incorporating pulverised fly ash Cement and Concrete 777
Research 361609ndash1618 httpsdoiorg101016JCEMCONRES200605016 778
27 Nehdi M Rahman M (2004) Effect of Geometry and Surface Friction of Test Accessory 779 on Oscillatory Rheological Properties of Cement Pastes ACI Materials Journal 780 101416ndash424 httpsdoiorg101435913428 781
28 Khayat KH Yahia A (1997) Effect of Welan Gum-High-Range Water Reducer 782 Combinations on Rheology of Cement Grout ACI Materials Journal 94365ndash372 783 httpsdoiorg1014359321 784
29 Lombardi G (1985) THE ROLE OF COHESION IN CEMENT GROUTING OF 785 ROCK In Proceedings of Fifteenth Congress on Large Dams International 786 Commission on Large Dams pp 235ndash261 787
30 Perrot A Rangeard D Picandet V Meacutelinge Y (2013) Hydro-mechanical properties of 788
fresh cement pastes containing polycarboxylate superplasticizer Cement and Concrete 789 Research 53221ndash228 httpsdoiorg101016JCEMCONRES201306015 790
31 Perrot A Lecompte T Khelifi H et al (2012) Yield stress and bleeding of fresh cement 791 pastes Cement and Concrete Research 42937ndash944 792
httpdxdoiorg101016jcemconres201203015 793
32 Sonebi M Perrot A (2019) Effect of mix proportions on rheology and permeability of 794 cement grouts containing viscosity modifying admixture Construction and Building 795
Materials 212687ndash697 httpsdoiorg101016jconbuildmat201904022 796
33 Picandet V Rangeard D Perrot A Lecompte T (2011) Permeability measurement of 797
fresh cement paste Cement and Concrete Research 41330ndash338 798 httpsdoiorg101016JCEMCONRES201011019 799
34 Perrot A Rangeard D (2017) Effects of mix design parameters on consolidation 800
behaviour of fresh cement-based materials Materials and Structures 50117 801 httpsdoiorg101617s11527-016-0988-0 802
35 Rangeard D Perrot A Picandet V et al (2015) Determination of the consolidation 803 coefficient of low compressibility materials application to fresh cement-based 804
materials Materials and Structures 481475ndash1483 httpsdoiorg101617s11527-014-805 0247-1 806
36 Massoussi N Keita E Roussel N (2017) The heterogeneous nature of bleeding in 807 cement pastes Cement and Concrete Research 95108ndash116 808 httpsdoiorg101016JCEMCONRES201702012 809
37 Montgomery D (2007) Design and Analysis of Experiments Second Edition John 810
Wiley amp Sons 811
35
38 Roussel N Stefani C Leroy R (2005) From mini-cone test to Abrams cone test 812 Measurement of cement-based materials yield stress using slump tests Cement and 813 Concrete Research 35817ndash822 httpsdoiorg101016jcemconres200407032 814
39 Mangat PS Khatib JM Wright L (2006) Optimum utilisation of FGD waste in blended 815 binders Proceedings of Institution of Civil Engineers Construction Materials 159119ndash816
127 httpsdoiorg101680coma20061593119 817
40 Khatib JM Mangat PS Wright L (2013) Early age porosity and pore size distribution of 818 cement paste with flue gas desulphurisation (FGD) waste Journal of Civil Engineering 819 and Management 19622ndash627 httpsdoiorg103846139237302013793609 820
41 Collier NC Milestone NB Gordon LE Ko SC (2014) The suitability of a supersulfated 821 cement for nuclear waste immobilisation Journal of Nuclear Materials 452457ndash464 822 httpsdoiorg101016jjnucmat201405078 823
42 Masoudi R (2018) Examining compositions hydration mechanisms and properties of 824 supersulfated cement for use in concrete by Examining compositions hydration 825 mechanisms and properties of supersulfated cement for use in concrete University of 826 Toronto 827
828

15
Estimate
error (90
confidence
limit)
032
(ms)
0013
(ms)
00153
13
MPa
35
MPa
33
MPa
24
MPa
384
385
31 Accuracy of the established models 386
387
The ratio of predicted-to-measured properties for grout ranged between 087 and 115 388
indicating good accuracy for prediction of mini-slump plate cohesion induced bleeding at 1 389
min 5 mins and 30 mins yield stress plastic viscosity and compressive strength at 1-d 3-d 7-390
d and 28-d In general the proposed models for mini-slump plate cohesion Marsh cone and 391
compressive strength appeared to be accurate in predicting fluidity cohesivity induced 392
bleeding permeability at 30 min compressibility and compressive strength with low scatter 393
between measured and predicted values However the average values of predictedmeasured 394
ratio of yield values were slightly higher (074) 395
396
32 Isoresponses of the proposed models 397
398
The isoresponse surfaces and contour plots for mini-slump plate cohesion Marsh cone yield 399
stress plastic viscosity induced bleeding at 1 min 5 mins and 30 mins permeability at 1 min 400
and 30 mins compressibility and compressive strength at 1-d 3-d 7-d and 28-d were obtained 401
by using response surface methodology (RSM) The isoresponse surfaces and contour plots 402
were obtained from the regression models and because the models contained interaction and 403
second-order variables the contour lines were curved 404
The proposed statistical models can therefore be used to evaluate the effect of a group of 405
variables on the properties affecting the quality of supersulfated grout This allowed for the 406
calculation of isoresponse surfaces from the parameters under study outside the experimental 407
domain and the optimisation of their effects The next sections will discuss the results of each 408
experiment separately 409
331 Mini-slump 410
As shown in Eq 4 the mini-slump is influenced in order of significance by WB ratio 411
anhydrite proportion interaction of WB and ANH and the percentage of GGBS content The 412
WB ratio had the greatest effect on fluidity due to better lubrication of the particles in the paste 413
16
[29] The mini-slump test was accompanied by very low shear The value of mini-slump is to 414
characterise yield stress [38] therefore higher mini-slump value indicated a lower yield stress 415
The effect of WB on the increase of mini-slump was two and half-time than that of ANH (192 416
vs 781 in Eq 4) However increased ANH resulted in a 27 times greater increase in mini-417
slump than reduced GGBS (781 vs -294 in Eq 4) Figure 1(a) shows the effect of increased 418
WB on mini-slump vs ANH (when GGBS was kept constant at 70) and Figure 1(b) shows 419
GGBS vs ANH (when WB was fixed at 039) Based on these figures it is evident that mini-420
slump increased significantly when the dosage of WB and ANH increased 421
422
(a) (b) 423
Fig 1 Isoresponse curves of mini-slump (mm) (a) WB vs ANH and (b) GGBS vs ANH 424
425
332 Marsh cone 426
The time needed for a grout sample to flow through the Marsh cone is proportional to the 427
viscosity of the cement grout the flow time becomes an index of fluidity so the longer the 428
flow time the lower the fluidity Similar to the previous trends Eq 5 shows that the values of 429
Marsh cone are influenced in order of significance by WB GGBS and ANH This is 430
graphically illustrated in Figure 2 431
GGBS = 70
034 039 042 044
0
5
10
15
20
WB
AN
H (
)
65
74
83
92
101
037
AN
H(
)
WB = 039
60 65 70 75 80
0
5
10
15
20
GGBS()
70
75
80
85
17
432
(a) (b) 433
Fig 2 Isoresponse curves for flow time (s) (a) WB vs ANH and (b) GGBS vs ANH 434
435
It can be noted that an increase in WB and ANH or a reduction in GGBS led to decreasing 436
the Marsh cone flow time For example at fixed WB at 039 and GGBS of 70 respectively 437
the increase in ANH dosage from 5 to 20 led to a marked reduction of the Marsh cone flow 438
time from 170 to 140 s (Figure 2(a)) This behaviour is attributed to the change in plastic 439
viscosity of the grout as will be discussed later 440
333 Cohesion plate 441
As shown in Eq 6 the cohesion plate was influenced in order of magnitude by the WB and 442
the percentage of GGBS and ANH The increasing WB had a 34 times the influence on the 443
reduction of the cohesion plate test results as the increased ANH (for a GGBS constant) By 444
comparing the effects of WB and GGBS on plate cohesion the increased WB can be 445
interpreted as having approximately a 3 times greater influence on the reduction of plate 446
cohesion values than the increase in GGBS (-366 vs 122 in Eq 6) given that ANH is held 447
constant The effect of an increase in WB from 034 to 044 and ANH from 0 to 20 with a 448
fixed GGBS dosage of 70 is presented in Figure 3(a) Increased WB led to a decreased 449
cohesion plate value Conversely an increase in GGBS increased the cohesion plate value and 450
an increased ANH caused a reduction in cohesion plate (Figure 3(b)) 451
GGBS = 70
034 036 039 042 0440
5
10
15
20
WB
AN
H (
)
40
6080
100120
140160
180200
220
WB = 039
60 65 70 75 80
0
5
10
15
20
GGBS ()
AN
H (
)
100
120
140
160
180
18
452
(a) (b) 453
Fig 3 Isoresponse curves for plate cohesion meter (a) WB vs ANH and (b) GGBS vs 454 ANH 455
334 Yield stress 456
As shown in Eq 7 yield value was influenced in order of magnitude by WB and dosages of 457
ANH and GGBS Based on Figure 4 (a) when WB was fixed at 039 GGBS maintained at 458
70 and ANH increased to 5 the isoresponse curve showed a yield value of 15 Pa On the 459
other hand if the proportion of ANH was further increased to 20 while GBBS was 460
maintained at 70 the yield value decreased to 135 Pa This corresponds with Eq (7) in 461
which the proportion of WB and ANH were increased while GGBS was kept constant 462
resulting in a reduction in yield stress An increase in GGBS content resulted in an increase of 463
the yield stress 464
Figure 4 (b) shows the isoresponse curve of the yield value with a fixed proportion of GGBS 465
at 70 When WB was 039 and ANH was 5 the isoresponse of the predicted yield value 466
was 155 Pa If ANH was increased to 20 while maintaining WB at 039 the isoresponse of 467
the yield value was 135 Pa 468
It can be interesting to note that the observed results for the yield stress are closed to the one 469
observed with the cohesion plate and mini-slump tests This is expected as yield stress values 470
can be derived from those two simple tests 471
GGBS = 70
034 037 039 042 0440
5
10
15
20
WB
AN
H(
)
45
55
65
7585
95
105
115
WB = 039
60 65 70 75 800
5
10
15
20
GGBS ()
AN
H(
)
75
85
95
105
19
472
(a) (b) 473
Fig 4 Isoresponse curves for yield stress (Pa) (a) WB vs ANH and (b) GGBS vs ANH 474
335 Plastic viscosity 475
Plastic viscosity was influenced in order of magnitude by WB and the dosages of ANH and 476
GGBS ANH and GGBS had almost opposite effects on plastic viscosity (-0078 vs 0073 in 477
Eq 8) As shown in Eq (8) increased WB had the greatest primary effect on plastic viscosity 478
(034 vs 0078 and 0073) The increased WB had approximately a 44 times greater influence 479
on reducing plastic viscosity than increased ANH or decreased GGBS 480
In the isoresponse curve of plastic viscosity shown in Figure 5 (a) when GGBS was fixed at 481
70 WB set at 039 and ANH maintained at 5 the predicted plastic viscosity value was 482
068 Pas On the other hand if the dosage of ANHB was increased to 20 while maintaining 483
a similar WB the plastic viscosity was reduced to 055 Pas 484
In Figure 5 (b) WB was fixed at 039 when GGBS was held at 70 and ANH at 5 the 485
predicted plastic viscosity was 067 Pas However when ANH was increased to 20 and 486
GGBS was maintained at 70 the predicted plastic viscosity dropped to 055 Pas 487
AN
H(
)
GGBS = 70
034 037 039 042 044
0
5
10
15
20
WB
1012
1416
18
20
WB = 039
60 65 70 75 800
5
10
15
20
GGBS ()
AN
H(
)
13
14
15
20
488
(a) (b) 489
Fig 5 Isoresponse curve for plastic viscosity (Pas) (a) WB vs ANH and (b) GGBS vs 490
ANH 491
336 Induced bleeding 492
The induced bleeding equations for 1 and 5 minutes (Eqs 9 10) and 30 minutes (Eq 11) are 493
very similar The two influencing factors of induced bleeding are WB ratio and anhydrite 494
WB ratio has the greatest effect over two times the effect of anhydrite content Figure 6 shows 495
the isoresponse for bleeding versus the WB ratio for a fixed value of GGBS at 70 It can be 496
seen that when an anhydrite value is selected and the WB ratio is increased the bleeding will 497
also increase Similarly if a WB ratio is selected and the anhydrite content is increased the 498
bleeding will again increase 499
500
GGBS = 70
034 037 039 042 0440
5
10
15
20
WB
AN
H(
)
035
045
055
065
075
085
095
WB = 039
60 65 70 75 800
5
10
15
20
GGBS ()
AN
H(
)
055
060
065
075
034 036 039 042 044
0
5
10
15
20
WB
AN
H (
)
26
28
30
3234
36
38
40
GGBS=70
21
(a) 501
502
(b) (c) 503
Fig 6 Isoresponse curves for induced bleeding at 1 5 and 30 min WB vs ANH 504
337 Permeability 505
Figure 7 (a) and (b) showed firstly that the permeability decreased significantly from 1 min to 506
30 min Permeability at 1 min was influenced in order of magnitude by WB and the dosage 507
of ANH All interactions between 3 parameters had almost opposite effects on permeability 508
(Eq 12) As shown in Eq (12) increased WB and AHN had the greatest primary effect on 509
permeability at 1 min It seems there is an optimum reached at WB = 40 and AHN at 17 510
Similarly the permeability at 30 min is affected in order of significance by WB followed by 511
ANH (Eq 13) In Figure 7 (b) WB was fixed at 039 when GGBS was held at 70 and ANH 512
at 10 the predicted permeability was 038 x 10-8 (ms) However when ANH was increased 513
to 20 and GGBS was maintained at 70 the predicted permeability increased to 040x10-8 514
(ms) 515
516
GGBS = 70
034 036 039 042 0440
5
10
15
20
WB
AN
H (
)
545
61
675
74
805
GGBS = 70
034 036 039 042 0440
5
10
15
20
WB
AN
H (
)
56
60
64
68
72
7680
84
22
517
(a) (b) 518
Fig 7 Isoresponse curves for permeability at 1 and 30 min WB vs ANH 519
338 Compressibility 520
As shown in Eq (14) the compressibility was influenced in order of magnitude by the WB 521
and the percentage of ANH The interaction between 3 parameters affected also the 522
compressibility The increasing WB had a 32 times the influence on the increase of the 523
compressibility results as the increased ANH (for a GGBS constant) The effect of an increase 524
in WB from 034 to 044 and ANH from 0 to 20 with a fixed GGBS dosage of 70 is 525
presented in Figure 8 Increased WB led to an increase of compressibility Similarly an 526
increase in AHN increased the compressibility 527
528
Fig 8 Isoresponse curves for compressibility WB vs ANH 529
034 036 039 042 044
0
5
10
15
20
GGBS = 70 WB
AN
H (
)
3
35
4
4
45
5
034 036 039 042 044
0
5
10
15
20
WB
AN
H (
)
034
035
036 037 038 039 04
041
042
4
GGBS=70
034 036 039 042 044
0
5
10
15
20
WB
AN
H (
)
017
019
021 023 025 027
029
031
GGBS=70
23
530
339 Compressive strength 531
After one day from Eq 15 the influencing factors in order of significance are WB ratio 532
anhydrite content GGBS content and the interaction of WB and ANH The effect of the first 533
three was similar but WB had 11 times greater effect than anhydrite and 125 times greater 534
effect than GGBS While the interaction of WB and anhydrite had around a third of the 535
influence of WB Figures 9 (a) and (b) show the isoresponses for 1-day compressive strength 536
From Figure 9 (a) it can be seen when the GGBS content is fixed at 70 for a given anhydrite 537
content increasing the WB ratio will decrease the strength Also if a WB ratio is selected and 538
the anhydrite is increased similarly the strength will decrease From Figure 9 (b) with the WB 539
ratio fixed at 039 once again an increase in GGBS led to a reduction of compressive strength 540
at 1 day 541
542
(a) (b) 543
Fig9 Isoresponse curves for compressive strength at 1d (a) (WB vs ANH) and (b) (GGBS 544 vs ANH) 545
Eqs 16 17 and 18 show the effect of GGBS and ANH percentages on compressive strength at 546
3-d 7-d and 28-d Figures 10 11 and 12 show the isoresponse of the compressive strength at 547
3-d 7-d and 28-d respectively with WB vs ANH Increased ANH led to a decrease of 3-d 548
and 7-d compressive strength As expected an Increase in WB led to a decrease in compressive 549
strength The percentage of ANH had a negative effect on compressive strength and showed a 550
greater influence particularly at 3-d and 7-d (879 (3 d) amp 924 (7d) vs 382 (28 d)) GGBS has 551
a negative impact on early strength development The negative effect of GGBS on compressive 552
GGBS = 70
034 037 039 042 0440
5
10
15
20
WB
AN
H(
)
12
14
16
18
20
22
2426
WB = 039
60 65 70 75 800
5
10
15
20
GGBS ()
AN
H(
)
10
12
14
16
18
20
22
24
strength at early ages is clearly attributable to the fact that up to 80 of cement has been 553
replaced by GGBS and it takes some time for GGBS to start developing its pozzolanic action 554
at a noticeable level The results indicate that ANH content influences strength to a greater 555
extent than GGBS at all ages The SO3 content was reported to have great influence on the 556
strength [39 40] 557
558
(a) (b) 559
Fig10 Isoresponse curves for compressive strength at 3d (a) (WB vs ANH) and (b) 560 (GGBS vs ANH) 561
562
563
(a) (b) 564
Fig11 Isoresponse curves for compressive strength at 7d (a) (WB vs ANH) and (b) (WB 565 vs ANH) 566
567
GGBS = 70
034 036 039 042 0440
5
10
15
20
WB
AN
H (
)
24
2628
30
3234
3638
4042
WB = 039
60 65 70 75 80
0
5
10
15
20
GGBS ()
AN
H (
)
2426
2830
32
34
36
3840
42
GGBS = 70
034 037 039 042 044
0
5
10
15
20
WB
AN
H(
)
3032
34
3638
40
42
44
46
48
WB = 039
60 65 70 75 80
0
5
10
15
20
GGBS ()
AN
H(
)
32
34
36
38
40
42
44
46
48
25
568
(a) (b) 569
Fig12 Isoresponse curves for compressive strength at 28d (a) (WB vs ANH) and (b) 570
(ANH vs GGBS) 571
3310 Discussion of the effect of WB GGBS and ANH 572
As expected the increase of WB led to an increase in mini-slump induced bleeding and a 573
reduction in flow time plate cohesion yield stress plastic viscosity and compressive strengths 574
This can be attributed to more water in the system 575
An increase in GGBS content resulted in a reduction of the flow time plate cohesion yield 576
stress and plastic viscosity while the fluidity is improved This was due to the fact the specific 577
gravity of slag is lower than that of PC leading to an increase in the paste volume and thus 578
improving the fluidity of paste 579
In case of an increase of ANH proportion while WB and GGBS were kept constant it led to 580
an increased mini-slump and induced bleeding while the flow time plate cohesion yield stress 581
and plastic viscosity were reduced This was due to the lower reactivity of ANH resulting in an 582
increase of water needed for lubrication of paste 583
As expected an increase in WB lead to an increase in induced bleeding permeability and a 584
decrease in compressibility [33 35] This is due to the increase in liquid volume between the 585
particles and to the reduction in the amount of interparticle forces Globally the compressibility 586
decreases and the permeability increases with ANH It can be explained by the reduced specific 587
area and lower reactivity that can lead to more available water in the samples 588
3311 Heat of Hydration 589
Heat of hydration is considered an important factor in the cement design as low heat of 590
hydration reduces the effect of thermal cracking The heat flow results of the calorimeter test 591
performed over a three days period can be seen in Figure 13 592
GGBS = 70
034 036 039 042 0440
5
10
15
20
WB
AN
H (
)
46
48
50
52
54
56
58
60
WB = 039
0 5 10 15 2060
65
70
75
80
ANH ()
GG
BS
(
)
50
52
54
56
5860
62
26
593
Fig 13 Heat flow graphs for first 3 days of reaction 594
Figure 13 presents that the largest peaks were in mixes 1 2 5 and 6 This shows that these 595
reactions generated the most heat and that they were quick Mixes 1 and 2 have the highest 596
OPC content at 40 and this suggests that to lower the heat of the reaction minimal OPC 597
should be used This is confirmed by the fact that mixes 5 and 6 have the next highest OPC 598
contents the same percentage as mixes 3 4 and 9 (one of the repeated mixes) which have 599
anhydrite present This implies that the presence of anhydrite will lengthen the reaction process 600
and reduce the heat produced during setting significantly The graph shows this by the absence 601
of a sharp peak instead a gentle curved hump is shown over a 2-day period whereas the mixes 602
showing a sharp peak occur after about 12 hrs Mix 7 which has the same solids content as 603
mix 8 but a lower WB ratio and no cement present showed the lowest heat flow during the 604
hydration process 605
Figure 14 shows the cumulative heat generation during the first 3 days of setting It is clear that 606
the two mixes (1 and 2) with highest cement content and absence of anhydrite had the highest 607
cumulative heat development over the 3-day period 643J and 594J respectively Mixes 3456 608
and 9 which all have 20 OPC content generated similar heat value over the 3 days Results 609
of mixes containing ANH implies that over the period that the anhydrite did not reduce the 610
cumulative heat generated but slowed the reaction and reduce the peak heat generated The 611
0
0002
0004
0006
0008
001
0012
0 50000 100000 150000 200000 250000 300000
He
at F
low
(mW
)
Time s()
M1
M2
M3
M4
M5
M6
M7
M9
1Day
2Day
3day
1d 2d 3d
27
graphs also suggest that a higher WB ratio produced a lower cumulative and peak heat 612
generation613
614
Fig 14 Cumulative heat generation curves for first 3 days 615
3312 pH measurements 616
Fig 15 summarises the results of pH and the nine mixes with different compositions of WB 617
the percentages of cement GGBS and ANH It is shown that Supersulfated cements (SSCs) 618
have lower pH values (lt 125 at all ages) than PC which has a pH of 139 [41] making SSC 619
more preferable in essential applications such as nuclear waste encapsulation 620
The figure shows that the pH value decreased with time for all samples between 1 and 7 days 621
Similar trend was observed in the majority of mixes between 7 and 28 days except for sample 622
2 5 and 9 which showed slight increase in the pH values This decrease refers to the 623
consumption of ions in the pore structure due to the hydration process 624
0
100
200
300
400
500
600
700
800
0 50000 100000 150000 200000 250000 300000
(J)
Time (s)
M1
M2
M3
M4
M5
M6
M7
M9
1 Day
3 Day
2 day
1d 2d 3d
1
2
3
9
45
6
7
28
625
626 Fig 15 Summary of pore solution pH 627
628
The incorporation of ANH replacing the Portland cement (C) results in remarkable decrease in 629
pH at all ages as introducing the ANH reduced the lower initial pH Likewise the increase in 630
the content of GGBS led to a decrease in the pH value of the pore structure as GGBS has lower 631
initial pH than Portland cement The increase of WB ratio decreased the pH value This is in 632
agreement with Collier [41] who found that increasing the wb ratio from 05 to 06 increased 633
the pH by I unit This was attributed to the increased availability of water in the case of WB 634
of 06 allowing hydration of more cement powder thereby releasing more hydroxide anions 635
into solution However in this study the WB ratio did not show a significant effect on 636
lowering the pH These results are in agreement with [42] which also found that decreasing the 637
pH improved the bulk resistivity of SSC mixtures 638
3313 SEM 639
Figure 16 shows the SEM images of some mixes at various magnifications The images clearly 640
show the dense and compact structure of the cement after seven days The dense structure was 641
another requirement from the cement chosen to enclose the waste to prevent leaching The 642
microstructure consists mainly of C-S-H the main hydration product and unhydrated slag 643
grains C-S-H is formed after the dissolution of slag grains when contacting the water and 644
alkalis and then the ionic species saturate the solution and then precipitate as hydrated phases 645
[8] There were abundant grains of hydrated and partially hydrated slag grains some small 646
1080
1100
1120
1140
1160
1180
1200
1220
1240
1260
1280
1 2 3 4 5 6 7 8 9
pH
val
ue
Mix Number
1 Day
7 Days
28 Days
29
GGBS particles presented rims of reaction products (eg Mix 6-Figure 16 (f) and Mix 9-Figure 647
16 (h)) It was found by [11] that the composition of the reaction rims around slag was similar 648
to that of the C-S-H from PC However [12] found that in the CndashSndashH of SSC is apparently 649
more foil like which is different than the fibrillar morphology of C-S-H in OPC Mix 3 and 650
Mix 4 (Figure 16 (c) and (d) respectively) exhibits more micro voids in the micrsostructure 651
which could explain the low strength of these mixes compared to mix 1 and 2 Ettringite was 652
not detected Ettringite is not the most abundant phase and it is not easy to detect in dried 653
polished samples because it is easily decomposed under the drying conditions of the vacuum 654
of the microscope column [11] 655
(a) Mix 1 image at 1100 magnification (b) Mix 2 image at 900 magnification
(c) Particle of unreacted slag mix3 7 days (d) An overall image of mix 4 at 7days
showing CSH and BFS particles
30
(e) Mix 5 image at 1100 magnification (f) Mix 6 image at 2300 magnification
(g) Mix 7 image at 2000 magnification (h) Mix 9 image at 2700 magnification
Fig 16 SEM results 656
4 Conclusions 657
The paper focused on optimizing the SSC cement grout in order to get the best of it The effect 658
of GGBS WB and ANH dosages on the grout fluidity rheological properties induced 659
bleeding maximum heat of hydration and compressive strength was investigated using 660
factorial design approach and analysis The models derived in this study are valid for the 661
experimental area corresponding to grout mixes made with variable levels of WB ANH and 662
GGBS in the ranges of 034 to 044 0 to 20 by mass of binder 60 to 80 by mass of 663
binder respectively Based on the results from this study the following conclusions are drawn 664
- In comparison to GGBS and ANH WB ratio had more pronounced effects on the 665
results of mini-slump plate cohesion meter Marsh cone time yield stress plastic viscosity 666
induced bleeding permeability compressibility and compressive strength 667
31
- The increase in the dosage of GGBS led to an increase in the values of plate cohesion 668
meter Marsh cone time yield stress and plastic viscosity while reducing the mini-slump 669
values maximum hydration and compressive strength This is ascribed to the fine nature 670
of GGBS particles and pozzolanic effect 671
- While the ANH particles caused a decrease in the maximum of heat of hydration it 672
increased the induced bleeding permeability and compressibility due to its dominant effect 673
on increasing the dormant period and increasing the rates of solid sedimentation and 674
induced bleeding water 675
- Increasing the dosage of ANH in grout reduced the hydrations kinetic at early-age and 676
thus reduced the compressive strength at 1d 3d and 7d However this effect diminished 677
at later ages at 28 d in a manner similar to increasing WB 678
- The increase in the dosage of ANH led to an increase in the mini-slump values 679
(fluidity) but a decrease in the values of yield stress plastic viscosity plate cohesion and 680
Marsh cone time This is attributed to better deflocculation of particles at the fresh state 681
- The increase of GGBS percentage delayed the reaction process and decreased the total 682
heat after 3 days while WB slightly reduced the total heat it didnrsquot significantly affect the 683
reaction process 684
- pH measurements in the present study confirmed the suitability of these mixture to low-685
pH applications as the increase in both the GGBS and ANH markedly decreased the initial 686
pH thereby lowering the pH at different ages 687
- The modelling and prediction of the response of other points in the experimental domain 688
were therefore possible Although the models are based on a given set of materials they 689
can be easily used to generate future results using other materials 690
- Dense microstructure was observed for mixes examined in this study C-S-H is the main 691
reaction product with presence of unreacted slag grains embedded well in the structure 692
However some micro voids were observed in mixes containing ANH which led to lower 693
compressive strength of mixes with ANH 694
CRediT authorship contribution statement 695
MSonebi and YBai did the conceptualization and the design of investigation as well as 696 performing the experiments MSonebi carried out the software analysis of the results and the 697
32
visualization MSonebi AAbdalqader T Fayyad and APerrot analysed the results and 698 wrote the original draft and reviewed and edited the final version 699
Declaration of Competing Interest 700
The authors declare that they have no known competing financial interests or personal 701 relationships that could have appeared to influence the work reported in this paper 702
Acknowledgments 703
The authors would like to express their gratitude to P McCann from QUB and N Collier 704 from Eden Nuclear and Environment Ltd for their helps for some experiments 705
706
References 707
1 Schneider M Romer M Tschudin M Bolio H (2011) Sustainable cement production-708 present and future Cement and Concrete Research 41642ndash650 709
httpsdoiorg101016jcemconres201103019 710
2 Madlool NA Saidur R Hossain MS Rahim NA (2011) A critical review on energy use 711 and savings in the cement industries Renewable and Sustainable Energy Reviews 712
152042ndash2060 httpsdoiorg101016jrser201101005 713
3 EN15743 (2015) BS EN 157432010+A12015 Supersulfated cement - Composition 714
specifications and conformity criteria BSI 715
4 Khatib JM Wright L Mangat PS (2016) Mechanical and physical properties of concrete 716
containing FGD waste Magazine of Concrete Research 68550ndash560 717 httpsdoiorg101680macr1500092 718
5 Khatib JM Mangat PS Wright L (2008) Sulfate resistance of mortar containing 719
simulated FGD waste Proceedings of Institution of Civil Engineers Construction 720 Materials 161119ndash128 httpsdoiorg101680coma20081613119 721
6 (2020) Specifying Sustainable Concrete 722
7 Hewlett PC (2004) Learsquos Chemistry of Cement and Concrete fourth edi Elsevier 723 Science amp Technology Books Oxford 724
8 Gruskovnjak A Lothenbach B Winnefeld F et al (2008) Hydration mechanisms of 725 super sulphated slag cement Cement and Concrete Research 38983ndash992 726
httpsdoiorg101016jcemconres200803004 727
9 Grounds T Nowell D V Wilburn FW (2003) Resistance of supersulfated cement to 728 strong sulfate solutions Journal of Thermal Analysis and Calorimetry 72181ndash190 729
httpsdoiorg101023A1023928021602 730
10 Grounds T Nowell D V Wilburn FW (1995) The influence of temperature and 731
different storage conditions on the stability of supersulphated cement Journal of 732 Thermal Analysis 45385ndash394 httpsdoiorg101007BF02548772 733
33
11 Bazalduacutea-Medelliacuten ME Fuentes AF Gorokhovsky A Escalante-Garciacutea JI (2015) Early 734 and late hydration of supersulphated cements of blast furnace slag with fluorgypsum 735 Materiales de Construccion 65e043 httpsdoiorg103989mc201506013 736
12 Matschei T Bellmann F Stark J (2005) Hydration behaviour of sulphate-activated slag 737 cements Advances in Cement Research 17167ndash178 738
httpsdoiorg101680adcr2005174167 739
13 Richardson IG (2000) Nature of the hydration products in hardened cement pastes 740 Cement and Concrete Composites 2297ndash113 httpsdoiorg101016S0958-741 9465(99)00036-0 742
14 Baux C Phelipot-Mardeleacute A Lanos C et al (2013) PERFORMANCES OF SUPER 743 SULFATED CEMENTS In International Conference on Concrete Under Severe 744 Conditions pp 1857ndash1870 745
15 Annabelle Phelipot-Mardeleacute Gabriel Samson Christophe Lanos (2015) Super sulfated 746 cement formulation and uses In Construction Materials ConMat Whistler Canada 747
16 Milestone NB (2006) Reactions in cement encapsulated nuclear wastes need for 748 toolbox of different cement types Advances in Applied Ceramics 10513ndash20 749
httpsdoiorg101179174367606X81678 750
17 Batchelor B (2006) Overview of waste stabilization with cement Waste Management 751
26689ndash698 httpsdoiorg101016JWASMAN200601020 752
18 Zhang T Cheeseman CR Vandeperre LJ (2011) Development of low pH cement 753
systems forming magnesium silicate hydrate (MSH) Cement and Concrete Research 754 41439ndash442 httpsdoiorg101016jcemconres201101016 755
19 Mobasher N Bernal SA Provis JL (2016) Structural evolution of an alkali sulfate 756
activated slag cement Journal of Nuclear Materials 46897ndash104 757 httpsdoiorg101016JJNUCMAT201511016 758
20 Wang J Yu B Gao Y (2014) Hydration Characteristics of Super Sulphated Cement 759 with Different Fineness In Proceedings of the International Conference on Material 760 and Environmental Engineering (ICMAEE 2014) Atlantis Press Paris France 761
21 Naumlgele E (1986) The Zeta-potential of cement Part II Effect of pH-value Cement and 762 Concrete Research 16853ndash863 httpsdoiorg1010160008-8846(86)90008-6 763
22 Jain N Civil MG-IJ of M and 2015 U (2015) Formulation of Sulphate Resistant Super 764 Sulphated Cement Using Fluorogypsum and Granulated Blast Furnace Slag IOSR 765
Journal of Mechanical and Civil Engineering (IOSR-JMCE) 12153ndash159 766
23 Gao YX Yu BY Xu FL (2012) Effect of Modified Phosphogypsum on the Mechanical 767 Properties of Super Sulphate Cement Applied Mechanics and Materials 161264ndash268 768 httpsdoiorg104028wwwscientificnetAMM161264 769
24 Kantro D (1980) Influence of Water-Reducing Admixtures on Properties of Cement 770 PasteampmdashA Miniature Slump Test Cement Concrete and Aggregates 295ndash102 771
httpsdoiorg101520CCA10190J 772
34
25 Svermova L Sonebi M Bartos PJM (2003) Influence of mix proportions on rheology of 773 cement grouts containing limestone powder Cement and Concrete Composites 25737ndash774 749 httpsdoiorg101016S0958-9465(02)00115-4 775
26 Sonebi M (2006) Rheological properties of grouts with viscosity modifying agents as 776 diutan gum and welan gum incorporating pulverised fly ash Cement and Concrete 777
Research 361609ndash1618 httpsdoiorg101016JCEMCONRES200605016 778
27 Nehdi M Rahman M (2004) Effect of Geometry and Surface Friction of Test Accessory 779 on Oscillatory Rheological Properties of Cement Pastes ACI Materials Journal 780 101416ndash424 httpsdoiorg101435913428 781
28 Khayat KH Yahia A (1997) Effect of Welan Gum-High-Range Water Reducer 782 Combinations on Rheology of Cement Grout ACI Materials Journal 94365ndash372 783 httpsdoiorg1014359321 784
29 Lombardi G (1985) THE ROLE OF COHESION IN CEMENT GROUTING OF 785 ROCK In Proceedings of Fifteenth Congress on Large Dams International 786 Commission on Large Dams pp 235ndash261 787
30 Perrot A Rangeard D Picandet V Meacutelinge Y (2013) Hydro-mechanical properties of 788
fresh cement pastes containing polycarboxylate superplasticizer Cement and Concrete 789 Research 53221ndash228 httpsdoiorg101016JCEMCONRES201306015 790
31 Perrot A Lecompte T Khelifi H et al (2012) Yield stress and bleeding of fresh cement 791 pastes Cement and Concrete Research 42937ndash944 792
httpdxdoiorg101016jcemconres201203015 793
32 Sonebi M Perrot A (2019) Effect of mix proportions on rheology and permeability of 794 cement grouts containing viscosity modifying admixture Construction and Building 795
Materials 212687ndash697 httpsdoiorg101016jconbuildmat201904022 796
33 Picandet V Rangeard D Perrot A Lecompte T (2011) Permeability measurement of 797
fresh cement paste Cement and Concrete Research 41330ndash338 798 httpsdoiorg101016JCEMCONRES201011019 799
34 Perrot A Rangeard D (2017) Effects of mix design parameters on consolidation 800
behaviour of fresh cement-based materials Materials and Structures 50117 801 httpsdoiorg101617s11527-016-0988-0 802
35 Rangeard D Perrot A Picandet V et al (2015) Determination of the consolidation 803 coefficient of low compressibility materials application to fresh cement-based 804
materials Materials and Structures 481475ndash1483 httpsdoiorg101617s11527-014-805 0247-1 806
36 Massoussi N Keita E Roussel N (2017) The heterogeneous nature of bleeding in 807 cement pastes Cement and Concrete Research 95108ndash116 808 httpsdoiorg101016JCEMCONRES201702012 809
37 Montgomery D (2007) Design and Analysis of Experiments Second Edition John 810
Wiley amp Sons 811
35
38 Roussel N Stefani C Leroy R (2005) From mini-cone test to Abrams cone test 812 Measurement of cement-based materials yield stress using slump tests Cement and 813 Concrete Research 35817ndash822 httpsdoiorg101016jcemconres200407032 814
39 Mangat PS Khatib JM Wright L (2006) Optimum utilisation of FGD waste in blended 815 binders Proceedings of Institution of Civil Engineers Construction Materials 159119ndash816
127 httpsdoiorg101680coma20061593119 817
40 Khatib JM Mangat PS Wright L (2013) Early age porosity and pore size distribution of 818 cement paste with flue gas desulphurisation (FGD) waste Journal of Civil Engineering 819 and Management 19622ndash627 httpsdoiorg103846139237302013793609 820
41 Collier NC Milestone NB Gordon LE Ko SC (2014) The suitability of a supersulfated 821 cement for nuclear waste immobilisation Journal of Nuclear Materials 452457ndash464 822 httpsdoiorg101016jjnucmat201405078 823
42 Masoudi R (2018) Examining compositions hydration mechanisms and properties of 824 supersulfated cement for use in concrete by Examining compositions hydration 825 mechanisms and properties of supersulfated cement for use in concrete University of 826 Toronto 827
828
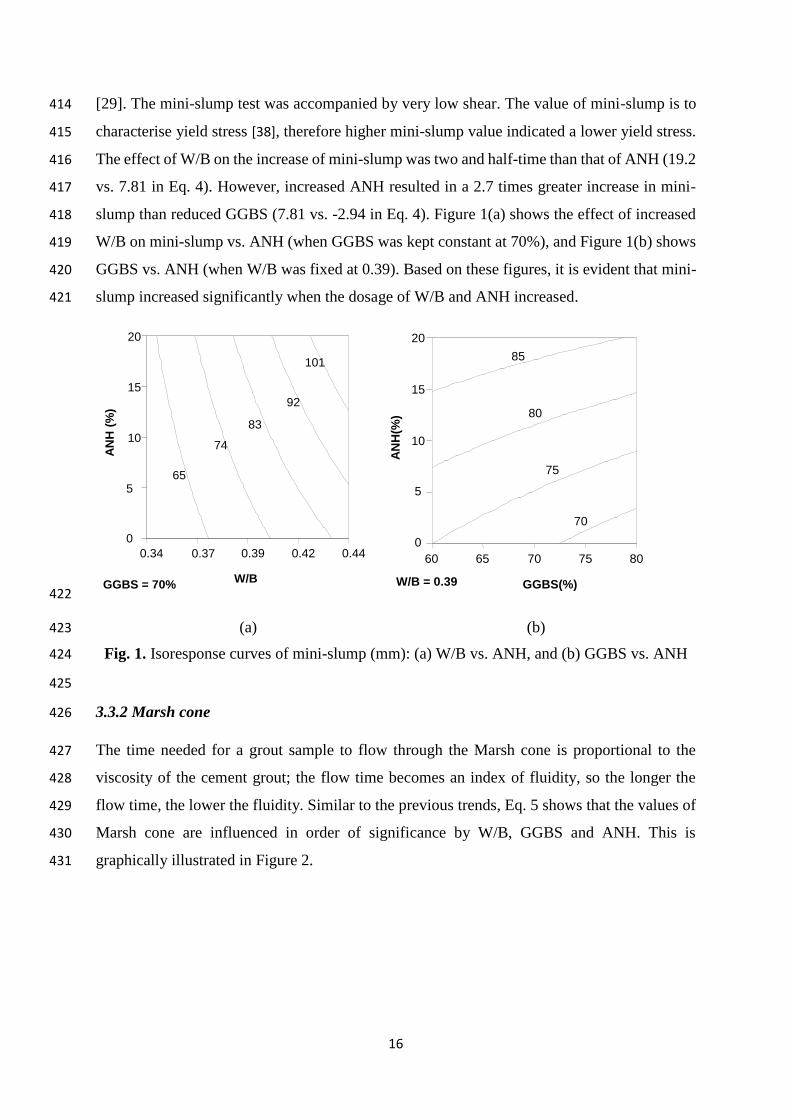
16
[29] The mini-slump test was accompanied by very low shear The value of mini-slump is to 414
characterise yield stress [38] therefore higher mini-slump value indicated a lower yield stress 415
The effect of WB on the increase of mini-slump was two and half-time than that of ANH (192 416
vs 781 in Eq 4) However increased ANH resulted in a 27 times greater increase in mini-417
slump than reduced GGBS (781 vs -294 in Eq 4) Figure 1(a) shows the effect of increased 418
WB on mini-slump vs ANH (when GGBS was kept constant at 70) and Figure 1(b) shows 419
GGBS vs ANH (when WB was fixed at 039) Based on these figures it is evident that mini-420
slump increased significantly when the dosage of WB and ANH increased 421
422
(a) (b) 423
Fig 1 Isoresponse curves of mini-slump (mm) (a) WB vs ANH and (b) GGBS vs ANH 424
425
332 Marsh cone 426
The time needed for a grout sample to flow through the Marsh cone is proportional to the 427
viscosity of the cement grout the flow time becomes an index of fluidity so the longer the 428
flow time the lower the fluidity Similar to the previous trends Eq 5 shows that the values of 429
Marsh cone are influenced in order of significance by WB GGBS and ANH This is 430
graphically illustrated in Figure 2 431
GGBS = 70
034 039 042 044
0
5
10
15
20
WB
AN
H (
)
65
74
83
92
101
037
AN
H(
)
WB = 039
60 65 70 75 80
0
5
10
15
20
GGBS()
70
75
80
85
17
432
(a) (b) 433
Fig 2 Isoresponse curves for flow time (s) (a) WB vs ANH and (b) GGBS vs ANH 434
435
It can be noted that an increase in WB and ANH or a reduction in GGBS led to decreasing 436
the Marsh cone flow time For example at fixed WB at 039 and GGBS of 70 respectively 437
the increase in ANH dosage from 5 to 20 led to a marked reduction of the Marsh cone flow 438
time from 170 to 140 s (Figure 2(a)) This behaviour is attributed to the change in plastic 439
viscosity of the grout as will be discussed later 440
333 Cohesion plate 441
As shown in Eq 6 the cohesion plate was influenced in order of magnitude by the WB and 442
the percentage of GGBS and ANH The increasing WB had a 34 times the influence on the 443
reduction of the cohesion plate test results as the increased ANH (for a GGBS constant) By 444
comparing the effects of WB and GGBS on plate cohesion the increased WB can be 445
interpreted as having approximately a 3 times greater influence on the reduction of plate 446
cohesion values than the increase in GGBS (-366 vs 122 in Eq 6) given that ANH is held 447
constant The effect of an increase in WB from 034 to 044 and ANH from 0 to 20 with a 448
fixed GGBS dosage of 70 is presented in Figure 3(a) Increased WB led to a decreased 449
cohesion plate value Conversely an increase in GGBS increased the cohesion plate value and 450
an increased ANH caused a reduction in cohesion plate (Figure 3(b)) 451
GGBS = 70
034 036 039 042 0440
5
10
15
20
WB
AN
H (
)
40
6080
100120
140160
180200
220
WB = 039
60 65 70 75 80
0
5
10
15
20
GGBS ()
AN
H (
)
100
120
140
160
180
18
452
(a) (b) 453
Fig 3 Isoresponse curves for plate cohesion meter (a) WB vs ANH and (b) GGBS vs 454 ANH 455
334 Yield stress 456
As shown in Eq 7 yield value was influenced in order of magnitude by WB and dosages of 457
ANH and GGBS Based on Figure 4 (a) when WB was fixed at 039 GGBS maintained at 458
70 and ANH increased to 5 the isoresponse curve showed a yield value of 15 Pa On the 459
other hand if the proportion of ANH was further increased to 20 while GBBS was 460
maintained at 70 the yield value decreased to 135 Pa This corresponds with Eq (7) in 461
which the proportion of WB and ANH were increased while GGBS was kept constant 462
resulting in a reduction in yield stress An increase in GGBS content resulted in an increase of 463
the yield stress 464
Figure 4 (b) shows the isoresponse curve of the yield value with a fixed proportion of GGBS 465
at 70 When WB was 039 and ANH was 5 the isoresponse of the predicted yield value 466
was 155 Pa If ANH was increased to 20 while maintaining WB at 039 the isoresponse of 467
the yield value was 135 Pa 468
It can be interesting to note that the observed results for the yield stress are closed to the one 469
observed with the cohesion plate and mini-slump tests This is expected as yield stress values 470
can be derived from those two simple tests 471
GGBS = 70
034 037 039 042 0440
5
10
15
20
WB
AN
H(
)
45
55
65
7585
95
105
115
WB = 039
60 65 70 75 800
5
10
15
20
GGBS ()
AN
H(
)
75
85
95
105
19
472
(a) (b) 473
Fig 4 Isoresponse curves for yield stress (Pa) (a) WB vs ANH and (b) GGBS vs ANH 474
335 Plastic viscosity 475
Plastic viscosity was influenced in order of magnitude by WB and the dosages of ANH and 476
GGBS ANH and GGBS had almost opposite effects on plastic viscosity (-0078 vs 0073 in 477
Eq 8) As shown in Eq (8) increased WB had the greatest primary effect on plastic viscosity 478
(034 vs 0078 and 0073) The increased WB had approximately a 44 times greater influence 479
on reducing plastic viscosity than increased ANH or decreased GGBS 480
In the isoresponse curve of plastic viscosity shown in Figure 5 (a) when GGBS was fixed at 481
70 WB set at 039 and ANH maintained at 5 the predicted plastic viscosity value was 482
068 Pas On the other hand if the dosage of ANHB was increased to 20 while maintaining 483
a similar WB the plastic viscosity was reduced to 055 Pas 484
In Figure 5 (b) WB was fixed at 039 when GGBS was held at 70 and ANH at 5 the 485
predicted plastic viscosity was 067 Pas However when ANH was increased to 20 and 486
GGBS was maintained at 70 the predicted plastic viscosity dropped to 055 Pas 487
AN
H(
)
GGBS = 70
034 037 039 042 044
0
5
10
15
20
WB
1012
1416
18
20
WB = 039
60 65 70 75 800
5
10
15
20
GGBS ()
AN
H(
)
13
14
15
20
488
(a) (b) 489
Fig 5 Isoresponse curve for plastic viscosity (Pas) (a) WB vs ANH and (b) GGBS vs 490
ANH 491
336 Induced bleeding 492
The induced bleeding equations for 1 and 5 minutes (Eqs 9 10) and 30 minutes (Eq 11) are 493
very similar The two influencing factors of induced bleeding are WB ratio and anhydrite 494
WB ratio has the greatest effect over two times the effect of anhydrite content Figure 6 shows 495
the isoresponse for bleeding versus the WB ratio for a fixed value of GGBS at 70 It can be 496
seen that when an anhydrite value is selected and the WB ratio is increased the bleeding will 497
also increase Similarly if a WB ratio is selected and the anhydrite content is increased the 498
bleeding will again increase 499
500
GGBS = 70
034 037 039 042 0440
5
10
15
20
WB
AN
H(
)
035
045
055
065
075
085
095
WB = 039
60 65 70 75 800
5
10
15
20
GGBS ()
AN
H(
)
055
060
065
075
034 036 039 042 044
0
5
10
15
20
WB
AN
H (
)
26
28
30
3234
36
38
40
GGBS=70
21
(a) 501
502
(b) (c) 503
Fig 6 Isoresponse curves for induced bleeding at 1 5 and 30 min WB vs ANH 504
337 Permeability 505
Figure 7 (a) and (b) showed firstly that the permeability decreased significantly from 1 min to 506
30 min Permeability at 1 min was influenced in order of magnitude by WB and the dosage 507
of ANH All interactions between 3 parameters had almost opposite effects on permeability 508
(Eq 12) As shown in Eq (12) increased WB and AHN had the greatest primary effect on 509
permeability at 1 min It seems there is an optimum reached at WB = 40 and AHN at 17 510
Similarly the permeability at 30 min is affected in order of significance by WB followed by 511
ANH (Eq 13) In Figure 7 (b) WB was fixed at 039 when GGBS was held at 70 and ANH 512
at 10 the predicted permeability was 038 x 10-8 (ms) However when ANH was increased 513
to 20 and GGBS was maintained at 70 the predicted permeability increased to 040x10-8 514
(ms) 515
516
GGBS = 70
034 036 039 042 0440
5
10
15
20
WB
AN
H (
)
545
61
675
74
805
GGBS = 70
034 036 039 042 0440
5
10
15
20
WB
AN
H (
)
56
60
64
68
72
7680
84
22
517
(a) (b) 518
Fig 7 Isoresponse curves for permeability at 1 and 30 min WB vs ANH 519
338 Compressibility 520
As shown in Eq (14) the compressibility was influenced in order of magnitude by the WB 521
and the percentage of ANH The interaction between 3 parameters affected also the 522
compressibility The increasing WB had a 32 times the influence on the increase of the 523
compressibility results as the increased ANH (for a GGBS constant) The effect of an increase 524
in WB from 034 to 044 and ANH from 0 to 20 with a fixed GGBS dosage of 70 is 525
presented in Figure 8 Increased WB led to an increase of compressibility Similarly an 526
increase in AHN increased the compressibility 527
528
Fig 8 Isoresponse curves for compressibility WB vs ANH 529
034 036 039 042 044
0
5
10
15
20
GGBS = 70 WB
AN
H (
)
3
35
4
4
45
5
034 036 039 042 044
0
5
10
15
20
WB
AN
H (
)
034
035
036 037 038 039 04
041
042
4
GGBS=70
034 036 039 042 044
0
5
10
15
20
WB
AN
H (
)
017
019
021 023 025 027
029
031
GGBS=70
23
530
339 Compressive strength 531
After one day from Eq 15 the influencing factors in order of significance are WB ratio 532
anhydrite content GGBS content and the interaction of WB and ANH The effect of the first 533
three was similar but WB had 11 times greater effect than anhydrite and 125 times greater 534
effect than GGBS While the interaction of WB and anhydrite had around a third of the 535
influence of WB Figures 9 (a) and (b) show the isoresponses for 1-day compressive strength 536
From Figure 9 (a) it can be seen when the GGBS content is fixed at 70 for a given anhydrite 537
content increasing the WB ratio will decrease the strength Also if a WB ratio is selected and 538
the anhydrite is increased similarly the strength will decrease From Figure 9 (b) with the WB 539
ratio fixed at 039 once again an increase in GGBS led to a reduction of compressive strength 540
at 1 day 541
542
(a) (b) 543
Fig9 Isoresponse curves for compressive strength at 1d (a) (WB vs ANH) and (b) (GGBS 544 vs ANH) 545
Eqs 16 17 and 18 show the effect of GGBS and ANH percentages on compressive strength at 546
3-d 7-d and 28-d Figures 10 11 and 12 show the isoresponse of the compressive strength at 547
3-d 7-d and 28-d respectively with WB vs ANH Increased ANH led to a decrease of 3-d 548
and 7-d compressive strength As expected an Increase in WB led to a decrease in compressive 549
strength The percentage of ANH had a negative effect on compressive strength and showed a 550
greater influence particularly at 3-d and 7-d (879 (3 d) amp 924 (7d) vs 382 (28 d)) GGBS has 551
a negative impact on early strength development The negative effect of GGBS on compressive 552
GGBS = 70
034 037 039 042 0440
5
10
15
20
WB
AN
H(
)
12
14
16
18
20
22
2426
WB = 039
60 65 70 75 800
5
10
15
20
GGBS ()
AN
H(
)
10
12
14
16
18
20
22
24
strength at early ages is clearly attributable to the fact that up to 80 of cement has been 553
replaced by GGBS and it takes some time for GGBS to start developing its pozzolanic action 554
at a noticeable level The results indicate that ANH content influences strength to a greater 555
extent than GGBS at all ages The SO3 content was reported to have great influence on the 556
strength [39 40] 557
558
(a) (b) 559
Fig10 Isoresponse curves for compressive strength at 3d (a) (WB vs ANH) and (b) 560 (GGBS vs ANH) 561
562
563
(a) (b) 564
Fig11 Isoresponse curves for compressive strength at 7d (a) (WB vs ANH) and (b) (WB 565 vs ANH) 566
567
GGBS = 70
034 036 039 042 0440
5
10
15
20
WB
AN
H (
)
24
2628
30
3234
3638
4042
WB = 039
60 65 70 75 80
0
5
10
15
20
GGBS ()
AN
H (
)
2426
2830
32
34
36
3840
42
GGBS = 70
034 037 039 042 044
0
5
10
15
20
WB
AN
H(
)
3032
34
3638
40
42
44
46
48
WB = 039
60 65 70 75 80
0
5
10
15
20
GGBS ()
AN
H(
)
32
34
36
38
40
42
44
46
48
25
568
(a) (b) 569
Fig12 Isoresponse curves for compressive strength at 28d (a) (WB vs ANH) and (b) 570
(ANH vs GGBS) 571
3310 Discussion of the effect of WB GGBS and ANH 572
As expected the increase of WB led to an increase in mini-slump induced bleeding and a 573
reduction in flow time plate cohesion yield stress plastic viscosity and compressive strengths 574
This can be attributed to more water in the system 575
An increase in GGBS content resulted in a reduction of the flow time plate cohesion yield 576
stress and plastic viscosity while the fluidity is improved This was due to the fact the specific 577
gravity of slag is lower than that of PC leading to an increase in the paste volume and thus 578
improving the fluidity of paste 579
In case of an increase of ANH proportion while WB and GGBS were kept constant it led to 580
an increased mini-slump and induced bleeding while the flow time plate cohesion yield stress 581
and plastic viscosity were reduced This was due to the lower reactivity of ANH resulting in an 582
increase of water needed for lubrication of paste 583
As expected an increase in WB lead to an increase in induced bleeding permeability and a 584
decrease in compressibility [33 35] This is due to the increase in liquid volume between the 585
particles and to the reduction in the amount of interparticle forces Globally the compressibility 586
decreases and the permeability increases with ANH It can be explained by the reduced specific 587
area and lower reactivity that can lead to more available water in the samples 588
3311 Heat of Hydration 589
Heat of hydration is considered an important factor in the cement design as low heat of 590
hydration reduces the effect of thermal cracking The heat flow results of the calorimeter test 591
performed over a three days period can be seen in Figure 13 592
GGBS = 70
034 036 039 042 0440
5
10
15
20
WB
AN
H (
)
46
48
50
52
54
56
58
60
WB = 039
0 5 10 15 2060
65
70
75
80
ANH ()
GG
BS
(
)
50
52
54
56
5860
62
26
593
Fig 13 Heat flow graphs for first 3 days of reaction 594
Figure 13 presents that the largest peaks were in mixes 1 2 5 and 6 This shows that these 595
reactions generated the most heat and that they were quick Mixes 1 and 2 have the highest 596
OPC content at 40 and this suggests that to lower the heat of the reaction minimal OPC 597
should be used This is confirmed by the fact that mixes 5 and 6 have the next highest OPC 598
contents the same percentage as mixes 3 4 and 9 (one of the repeated mixes) which have 599
anhydrite present This implies that the presence of anhydrite will lengthen the reaction process 600
and reduce the heat produced during setting significantly The graph shows this by the absence 601
of a sharp peak instead a gentle curved hump is shown over a 2-day period whereas the mixes 602
showing a sharp peak occur after about 12 hrs Mix 7 which has the same solids content as 603
mix 8 but a lower WB ratio and no cement present showed the lowest heat flow during the 604
hydration process 605
Figure 14 shows the cumulative heat generation during the first 3 days of setting It is clear that 606
the two mixes (1 and 2) with highest cement content and absence of anhydrite had the highest 607
cumulative heat development over the 3-day period 643J and 594J respectively Mixes 3456 608
and 9 which all have 20 OPC content generated similar heat value over the 3 days Results 609
of mixes containing ANH implies that over the period that the anhydrite did not reduce the 610
cumulative heat generated but slowed the reaction and reduce the peak heat generated The 611
0
0002
0004
0006
0008
001
0012
0 50000 100000 150000 200000 250000 300000
He
at F
low
(mW
)
Time s()
M1
M2
M3
M4
M5
M6
M7
M9
1Day
2Day
3day
1d 2d 3d
27
graphs also suggest that a higher WB ratio produced a lower cumulative and peak heat 612
generation613
614
Fig 14 Cumulative heat generation curves for first 3 days 615
3312 pH measurements 616
Fig 15 summarises the results of pH and the nine mixes with different compositions of WB 617
the percentages of cement GGBS and ANH It is shown that Supersulfated cements (SSCs) 618
have lower pH values (lt 125 at all ages) than PC which has a pH of 139 [41] making SSC 619
more preferable in essential applications such as nuclear waste encapsulation 620
The figure shows that the pH value decreased with time for all samples between 1 and 7 days 621
Similar trend was observed in the majority of mixes between 7 and 28 days except for sample 622
2 5 and 9 which showed slight increase in the pH values This decrease refers to the 623
consumption of ions in the pore structure due to the hydration process 624
0
100
200
300
400
500
600
700
800
0 50000 100000 150000 200000 250000 300000
(J)
Time (s)
M1
M2
M3
M4
M5
M6
M7
M9
1 Day
3 Day
2 day
1d 2d 3d
1
2
3
9
45
6
7
28
625
626 Fig 15 Summary of pore solution pH 627
628
The incorporation of ANH replacing the Portland cement (C) results in remarkable decrease in 629
pH at all ages as introducing the ANH reduced the lower initial pH Likewise the increase in 630
the content of GGBS led to a decrease in the pH value of the pore structure as GGBS has lower 631
initial pH than Portland cement The increase of WB ratio decreased the pH value This is in 632
agreement with Collier [41] who found that increasing the wb ratio from 05 to 06 increased 633
the pH by I unit This was attributed to the increased availability of water in the case of WB 634
of 06 allowing hydration of more cement powder thereby releasing more hydroxide anions 635
into solution However in this study the WB ratio did not show a significant effect on 636
lowering the pH These results are in agreement with [42] which also found that decreasing the 637
pH improved the bulk resistivity of SSC mixtures 638
3313 SEM 639
Figure 16 shows the SEM images of some mixes at various magnifications The images clearly 640
show the dense and compact structure of the cement after seven days The dense structure was 641
another requirement from the cement chosen to enclose the waste to prevent leaching The 642
microstructure consists mainly of C-S-H the main hydration product and unhydrated slag 643
grains C-S-H is formed after the dissolution of slag grains when contacting the water and 644
alkalis and then the ionic species saturate the solution and then precipitate as hydrated phases 645
[8] There were abundant grains of hydrated and partially hydrated slag grains some small 646
1080
1100
1120
1140
1160
1180
1200
1220
1240
1260
1280
1 2 3 4 5 6 7 8 9
pH
val
ue
Mix Number
1 Day
7 Days
28 Days
29
GGBS particles presented rims of reaction products (eg Mix 6-Figure 16 (f) and Mix 9-Figure 647
16 (h)) It was found by [11] that the composition of the reaction rims around slag was similar 648
to that of the C-S-H from PC However [12] found that in the CndashSndashH of SSC is apparently 649
more foil like which is different than the fibrillar morphology of C-S-H in OPC Mix 3 and 650
Mix 4 (Figure 16 (c) and (d) respectively) exhibits more micro voids in the micrsostructure 651
which could explain the low strength of these mixes compared to mix 1 and 2 Ettringite was 652
not detected Ettringite is not the most abundant phase and it is not easy to detect in dried 653
polished samples because it is easily decomposed under the drying conditions of the vacuum 654
of the microscope column [11] 655
(a) Mix 1 image at 1100 magnification (b) Mix 2 image at 900 magnification
(c) Particle of unreacted slag mix3 7 days (d) An overall image of mix 4 at 7days
showing CSH and BFS particles
30
(e) Mix 5 image at 1100 magnification (f) Mix 6 image at 2300 magnification
(g) Mix 7 image at 2000 magnification (h) Mix 9 image at 2700 magnification
Fig 16 SEM results 656
4 Conclusions 657
The paper focused on optimizing the SSC cement grout in order to get the best of it The effect 658
of GGBS WB and ANH dosages on the grout fluidity rheological properties induced 659
bleeding maximum heat of hydration and compressive strength was investigated using 660
factorial design approach and analysis The models derived in this study are valid for the 661
experimental area corresponding to grout mixes made with variable levels of WB ANH and 662
GGBS in the ranges of 034 to 044 0 to 20 by mass of binder 60 to 80 by mass of 663
binder respectively Based on the results from this study the following conclusions are drawn 664
- In comparison to GGBS and ANH WB ratio had more pronounced effects on the 665
results of mini-slump plate cohesion meter Marsh cone time yield stress plastic viscosity 666
induced bleeding permeability compressibility and compressive strength 667
31
- The increase in the dosage of GGBS led to an increase in the values of plate cohesion 668
meter Marsh cone time yield stress and plastic viscosity while reducing the mini-slump 669
values maximum hydration and compressive strength This is ascribed to the fine nature 670
of GGBS particles and pozzolanic effect 671
- While the ANH particles caused a decrease in the maximum of heat of hydration it 672
increased the induced bleeding permeability and compressibility due to its dominant effect 673
on increasing the dormant period and increasing the rates of solid sedimentation and 674
induced bleeding water 675
- Increasing the dosage of ANH in grout reduced the hydrations kinetic at early-age and 676
thus reduced the compressive strength at 1d 3d and 7d However this effect diminished 677
at later ages at 28 d in a manner similar to increasing WB 678
- The increase in the dosage of ANH led to an increase in the mini-slump values 679
(fluidity) but a decrease in the values of yield stress plastic viscosity plate cohesion and 680
Marsh cone time This is attributed to better deflocculation of particles at the fresh state 681
- The increase of GGBS percentage delayed the reaction process and decreased the total 682
heat after 3 days while WB slightly reduced the total heat it didnrsquot significantly affect the 683
reaction process 684
- pH measurements in the present study confirmed the suitability of these mixture to low-685
pH applications as the increase in both the GGBS and ANH markedly decreased the initial 686
pH thereby lowering the pH at different ages 687
- The modelling and prediction of the response of other points in the experimental domain 688
were therefore possible Although the models are based on a given set of materials they 689
can be easily used to generate future results using other materials 690
- Dense microstructure was observed for mixes examined in this study C-S-H is the main 691
reaction product with presence of unreacted slag grains embedded well in the structure 692
However some micro voids were observed in mixes containing ANH which led to lower 693
compressive strength of mixes with ANH 694
CRediT authorship contribution statement 695
MSonebi and YBai did the conceptualization and the design of investigation as well as 696 performing the experiments MSonebi carried out the software analysis of the results and the 697
32
visualization MSonebi AAbdalqader T Fayyad and APerrot analysed the results and 698 wrote the original draft and reviewed and edited the final version 699
Declaration of Competing Interest 700
The authors declare that they have no known competing financial interests or personal 701 relationships that could have appeared to influence the work reported in this paper 702
Acknowledgments 703
The authors would like to express their gratitude to P McCann from QUB and N Collier 704 from Eden Nuclear and Environment Ltd for their helps for some experiments 705
706
References 707
1 Schneider M Romer M Tschudin M Bolio H (2011) Sustainable cement production-708 present and future Cement and Concrete Research 41642ndash650 709
httpsdoiorg101016jcemconres201103019 710
2 Madlool NA Saidur R Hossain MS Rahim NA (2011) A critical review on energy use 711 and savings in the cement industries Renewable and Sustainable Energy Reviews 712
152042ndash2060 httpsdoiorg101016jrser201101005 713
3 EN15743 (2015) BS EN 157432010+A12015 Supersulfated cement - Composition 714
specifications and conformity criteria BSI 715
4 Khatib JM Wright L Mangat PS (2016) Mechanical and physical properties of concrete 716
containing FGD waste Magazine of Concrete Research 68550ndash560 717 httpsdoiorg101680macr1500092 718
5 Khatib JM Mangat PS Wright L (2008) Sulfate resistance of mortar containing 719
simulated FGD waste Proceedings of Institution of Civil Engineers Construction 720 Materials 161119ndash128 httpsdoiorg101680coma20081613119 721
6 (2020) Specifying Sustainable Concrete 722
7 Hewlett PC (2004) Learsquos Chemistry of Cement and Concrete fourth edi Elsevier 723 Science amp Technology Books Oxford 724
8 Gruskovnjak A Lothenbach B Winnefeld F et al (2008) Hydration mechanisms of 725 super sulphated slag cement Cement and Concrete Research 38983ndash992 726
httpsdoiorg101016jcemconres200803004 727
9 Grounds T Nowell D V Wilburn FW (2003) Resistance of supersulfated cement to 728 strong sulfate solutions Journal of Thermal Analysis and Calorimetry 72181ndash190 729
httpsdoiorg101023A1023928021602 730
10 Grounds T Nowell D V Wilburn FW (1995) The influence of temperature and 731
different storage conditions on the stability of supersulphated cement Journal of 732 Thermal Analysis 45385ndash394 httpsdoiorg101007BF02548772 733
33
11 Bazalduacutea-Medelliacuten ME Fuentes AF Gorokhovsky A Escalante-Garciacutea JI (2015) Early 734 and late hydration of supersulphated cements of blast furnace slag with fluorgypsum 735 Materiales de Construccion 65e043 httpsdoiorg103989mc201506013 736
12 Matschei T Bellmann F Stark J (2005) Hydration behaviour of sulphate-activated slag 737 cements Advances in Cement Research 17167ndash178 738
httpsdoiorg101680adcr2005174167 739
13 Richardson IG (2000) Nature of the hydration products in hardened cement pastes 740 Cement and Concrete Composites 2297ndash113 httpsdoiorg101016S0958-741 9465(99)00036-0 742
14 Baux C Phelipot-Mardeleacute A Lanos C et al (2013) PERFORMANCES OF SUPER 743 SULFATED CEMENTS In International Conference on Concrete Under Severe 744 Conditions pp 1857ndash1870 745
15 Annabelle Phelipot-Mardeleacute Gabriel Samson Christophe Lanos (2015) Super sulfated 746 cement formulation and uses In Construction Materials ConMat Whistler Canada 747
16 Milestone NB (2006) Reactions in cement encapsulated nuclear wastes need for 748 toolbox of different cement types Advances in Applied Ceramics 10513ndash20 749
httpsdoiorg101179174367606X81678 750
17 Batchelor B (2006) Overview of waste stabilization with cement Waste Management 751
26689ndash698 httpsdoiorg101016JWASMAN200601020 752
18 Zhang T Cheeseman CR Vandeperre LJ (2011) Development of low pH cement 753
systems forming magnesium silicate hydrate (MSH) Cement and Concrete Research 754 41439ndash442 httpsdoiorg101016jcemconres201101016 755
19 Mobasher N Bernal SA Provis JL (2016) Structural evolution of an alkali sulfate 756
activated slag cement Journal of Nuclear Materials 46897ndash104 757 httpsdoiorg101016JJNUCMAT201511016 758
20 Wang J Yu B Gao Y (2014) Hydration Characteristics of Super Sulphated Cement 759 with Different Fineness In Proceedings of the International Conference on Material 760 and Environmental Engineering (ICMAEE 2014) Atlantis Press Paris France 761
21 Naumlgele E (1986) The Zeta-potential of cement Part II Effect of pH-value Cement and 762 Concrete Research 16853ndash863 httpsdoiorg1010160008-8846(86)90008-6 763
22 Jain N Civil MG-IJ of M and 2015 U (2015) Formulation of Sulphate Resistant Super 764 Sulphated Cement Using Fluorogypsum and Granulated Blast Furnace Slag IOSR 765
Journal of Mechanical and Civil Engineering (IOSR-JMCE) 12153ndash159 766
23 Gao YX Yu BY Xu FL (2012) Effect of Modified Phosphogypsum on the Mechanical 767 Properties of Super Sulphate Cement Applied Mechanics and Materials 161264ndash268 768 httpsdoiorg104028wwwscientificnetAMM161264 769
24 Kantro D (1980) Influence of Water-Reducing Admixtures on Properties of Cement 770 PasteampmdashA Miniature Slump Test Cement Concrete and Aggregates 295ndash102 771
httpsdoiorg101520CCA10190J 772
34
25 Svermova L Sonebi M Bartos PJM (2003) Influence of mix proportions on rheology of 773 cement grouts containing limestone powder Cement and Concrete Composites 25737ndash774 749 httpsdoiorg101016S0958-9465(02)00115-4 775
26 Sonebi M (2006) Rheological properties of grouts with viscosity modifying agents as 776 diutan gum and welan gum incorporating pulverised fly ash Cement and Concrete 777
Research 361609ndash1618 httpsdoiorg101016JCEMCONRES200605016 778
27 Nehdi M Rahman M (2004) Effect of Geometry and Surface Friction of Test Accessory 779 on Oscillatory Rheological Properties of Cement Pastes ACI Materials Journal 780 101416ndash424 httpsdoiorg101435913428 781
28 Khayat KH Yahia A (1997) Effect of Welan Gum-High-Range Water Reducer 782 Combinations on Rheology of Cement Grout ACI Materials Journal 94365ndash372 783 httpsdoiorg1014359321 784
29 Lombardi G (1985) THE ROLE OF COHESION IN CEMENT GROUTING OF 785 ROCK In Proceedings of Fifteenth Congress on Large Dams International 786 Commission on Large Dams pp 235ndash261 787
30 Perrot A Rangeard D Picandet V Meacutelinge Y (2013) Hydro-mechanical properties of 788
fresh cement pastes containing polycarboxylate superplasticizer Cement and Concrete 789 Research 53221ndash228 httpsdoiorg101016JCEMCONRES201306015 790
31 Perrot A Lecompte T Khelifi H et al (2012) Yield stress and bleeding of fresh cement 791 pastes Cement and Concrete Research 42937ndash944 792
httpdxdoiorg101016jcemconres201203015 793
32 Sonebi M Perrot A (2019) Effect of mix proportions on rheology and permeability of 794 cement grouts containing viscosity modifying admixture Construction and Building 795
Materials 212687ndash697 httpsdoiorg101016jconbuildmat201904022 796
33 Picandet V Rangeard D Perrot A Lecompte T (2011) Permeability measurement of 797
fresh cement paste Cement and Concrete Research 41330ndash338 798 httpsdoiorg101016JCEMCONRES201011019 799
34 Perrot A Rangeard D (2017) Effects of mix design parameters on consolidation 800
behaviour of fresh cement-based materials Materials and Structures 50117 801 httpsdoiorg101617s11527-016-0988-0 802
35 Rangeard D Perrot A Picandet V et al (2015) Determination of the consolidation 803 coefficient of low compressibility materials application to fresh cement-based 804
materials Materials and Structures 481475ndash1483 httpsdoiorg101617s11527-014-805 0247-1 806
36 Massoussi N Keita E Roussel N (2017) The heterogeneous nature of bleeding in 807 cement pastes Cement and Concrete Research 95108ndash116 808 httpsdoiorg101016JCEMCONRES201702012 809
37 Montgomery D (2007) Design and Analysis of Experiments Second Edition John 810
Wiley amp Sons 811
35
38 Roussel N Stefani C Leroy R (2005) From mini-cone test to Abrams cone test 812 Measurement of cement-based materials yield stress using slump tests Cement and 813 Concrete Research 35817ndash822 httpsdoiorg101016jcemconres200407032 814
39 Mangat PS Khatib JM Wright L (2006) Optimum utilisation of FGD waste in blended 815 binders Proceedings of Institution of Civil Engineers Construction Materials 159119ndash816
127 httpsdoiorg101680coma20061593119 817
40 Khatib JM Mangat PS Wright L (2013) Early age porosity and pore size distribution of 818 cement paste with flue gas desulphurisation (FGD) waste Journal of Civil Engineering 819 and Management 19622ndash627 httpsdoiorg103846139237302013793609 820
41 Collier NC Milestone NB Gordon LE Ko SC (2014) The suitability of a supersulfated 821 cement for nuclear waste immobilisation Journal of Nuclear Materials 452457ndash464 822 httpsdoiorg101016jjnucmat201405078 823
42 Masoudi R (2018) Examining compositions hydration mechanisms and properties of 824 supersulfated cement for use in concrete by Examining compositions hydration 825 mechanisms and properties of supersulfated cement for use in concrete University of 826 Toronto 827
828
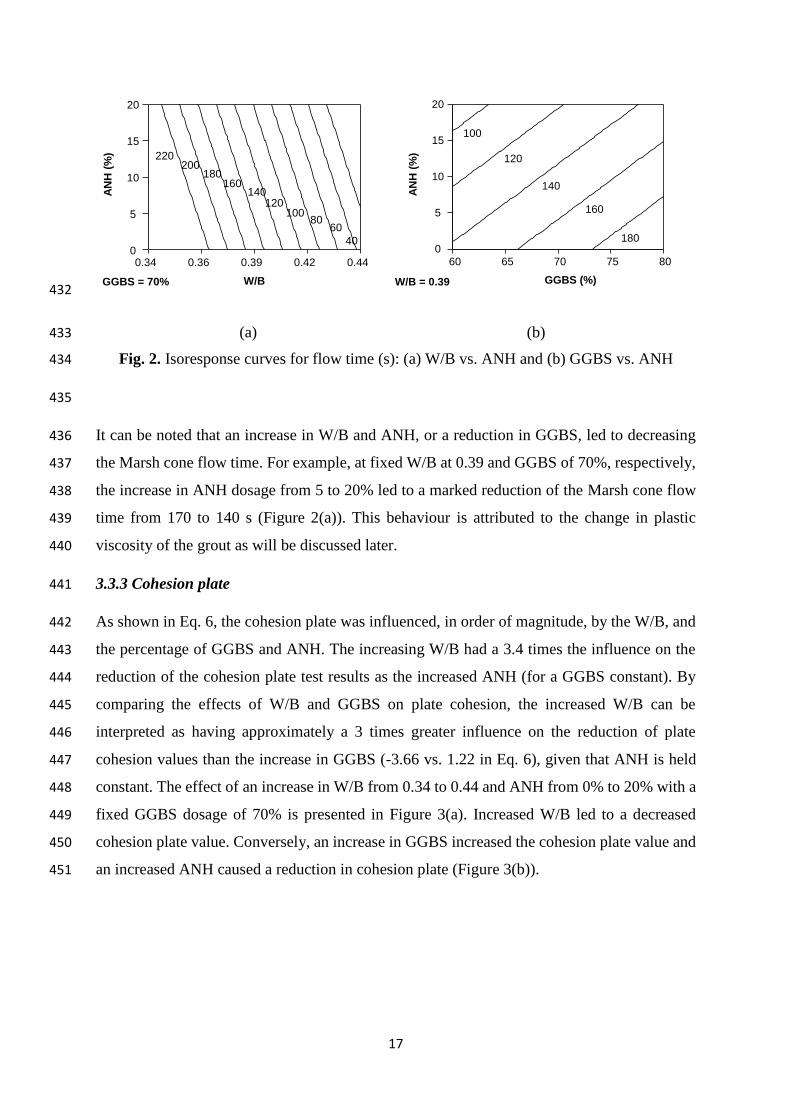
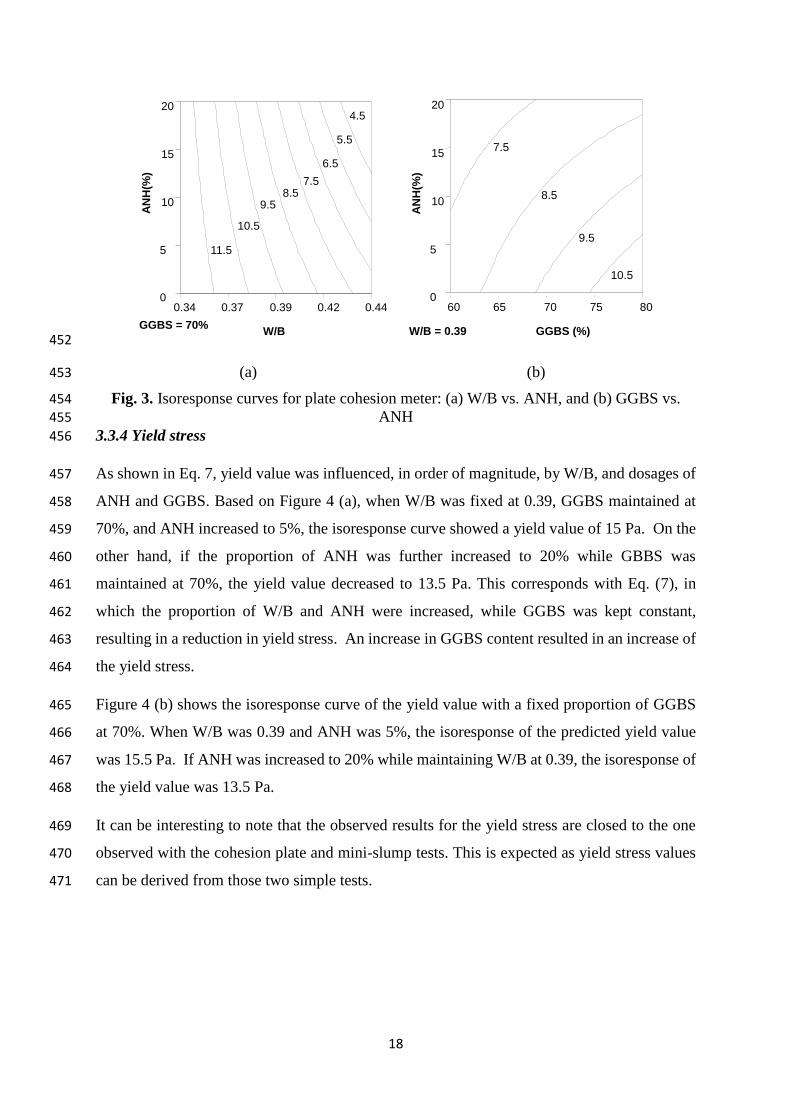
18
452
(a) (b) 453
Fig 3 Isoresponse curves for plate cohesion meter (a) WB vs ANH and (b) GGBS vs 454 ANH 455
334 Yield stress 456
As shown in Eq 7 yield value was influenced in order of magnitude by WB and dosages of 457
ANH and GGBS Based on Figure 4 (a) when WB was fixed at 039 GGBS maintained at 458
70 and ANH increased to 5 the isoresponse curve showed a yield value of 15 Pa On the 459
other hand if the proportion of ANH was further increased to 20 while GBBS was 460
maintained at 70 the yield value decreased to 135 Pa This corresponds with Eq (7) in 461
which the proportion of WB and ANH were increased while GGBS was kept constant 462
resulting in a reduction in yield stress An increase in GGBS content resulted in an increase of 463
the yield stress 464
Figure 4 (b) shows the isoresponse curve of the yield value with a fixed proportion of GGBS 465
at 70 When WB was 039 and ANH was 5 the isoresponse of the predicted yield value 466
was 155 Pa If ANH was increased to 20 while maintaining WB at 039 the isoresponse of 467
the yield value was 135 Pa 468
It can be interesting to note that the observed results for the yield stress are closed to the one 469
observed with the cohesion plate and mini-slump tests This is expected as yield stress values 470
can be derived from those two simple tests 471
GGBS = 70
034 037 039 042 0440
5
10
15
20
WB
AN
H(
)
45
55
65
7585
95
105
115
WB = 039
60 65 70 75 800
5
10
15
20
GGBS ()
AN
H(
)
75
85
95
105
19
472
(a) (b) 473
Fig 4 Isoresponse curves for yield stress (Pa) (a) WB vs ANH and (b) GGBS vs ANH 474
335 Plastic viscosity 475
Plastic viscosity was influenced in order of magnitude by WB and the dosages of ANH and 476
GGBS ANH and GGBS had almost opposite effects on plastic viscosity (-0078 vs 0073 in 477
Eq 8) As shown in Eq (8) increased WB had the greatest primary effect on plastic viscosity 478
(034 vs 0078 and 0073) The increased WB had approximately a 44 times greater influence 479
on reducing plastic viscosity than increased ANH or decreased GGBS 480
In the isoresponse curve of plastic viscosity shown in Figure 5 (a) when GGBS was fixed at 481
70 WB set at 039 and ANH maintained at 5 the predicted plastic viscosity value was 482
068 Pas On the other hand if the dosage of ANHB was increased to 20 while maintaining 483
a similar WB the plastic viscosity was reduced to 055 Pas 484
In Figure 5 (b) WB was fixed at 039 when GGBS was held at 70 and ANH at 5 the 485
predicted plastic viscosity was 067 Pas However when ANH was increased to 20 and 486
GGBS was maintained at 70 the predicted plastic viscosity dropped to 055 Pas 487
AN
H(
)
GGBS = 70
034 037 039 042 044
0
5
10
15
20
WB
1012
1416
18
20
WB = 039
60 65 70 75 800
5
10
15
20
GGBS ()
AN
H(
)
13
14
15
20
488
(a) (b) 489
Fig 5 Isoresponse curve for plastic viscosity (Pas) (a) WB vs ANH and (b) GGBS vs 490
ANH 491
336 Induced bleeding 492
The induced bleeding equations for 1 and 5 minutes (Eqs 9 10) and 30 minutes (Eq 11) are 493
very similar The two influencing factors of induced bleeding are WB ratio and anhydrite 494
WB ratio has the greatest effect over two times the effect of anhydrite content Figure 6 shows 495
the isoresponse for bleeding versus the WB ratio for a fixed value of GGBS at 70 It can be 496
seen that when an anhydrite value is selected and the WB ratio is increased the bleeding will 497
also increase Similarly if a WB ratio is selected and the anhydrite content is increased the 498
bleeding will again increase 499
500
GGBS = 70
034 037 039 042 0440
5
10
15
20
WB
AN
H(
)
035
045
055
065
075
085
095
WB = 039
60 65 70 75 800
5
10
15
20
GGBS ()
AN
H(
)
055
060
065
075
034 036 039 042 044
0
5
10
15
20
WB
AN
H (
)
26
28
30
3234
36
38
40
GGBS=70
21
(a) 501
502
(b) (c) 503
Fig 6 Isoresponse curves for induced bleeding at 1 5 and 30 min WB vs ANH 504
337 Permeability 505
Figure 7 (a) and (b) showed firstly that the permeability decreased significantly from 1 min to 506
30 min Permeability at 1 min was influenced in order of magnitude by WB and the dosage 507
of ANH All interactions between 3 parameters had almost opposite effects on permeability 508
(Eq 12) As shown in Eq (12) increased WB and AHN had the greatest primary effect on 509
permeability at 1 min It seems there is an optimum reached at WB = 40 and AHN at 17 510
Similarly the permeability at 30 min is affected in order of significance by WB followed by 511
ANH (Eq 13) In Figure 7 (b) WB was fixed at 039 when GGBS was held at 70 and ANH 512
at 10 the predicted permeability was 038 x 10-8 (ms) However when ANH was increased 513
to 20 and GGBS was maintained at 70 the predicted permeability increased to 040x10-8 514
(ms) 515
516
GGBS = 70
034 036 039 042 0440
5
10
15
20
WB
AN
H (
)
545
61
675
74
805
GGBS = 70
034 036 039 042 0440
5
10
15
20
WB
AN
H (
)
56
60
64
68
72
7680
84
22
517
(a) (b) 518
Fig 7 Isoresponse curves for permeability at 1 and 30 min WB vs ANH 519
338 Compressibility 520
As shown in Eq (14) the compressibility was influenced in order of magnitude by the WB 521
and the percentage of ANH The interaction between 3 parameters affected also the 522
compressibility The increasing WB had a 32 times the influence on the increase of the 523
compressibility results as the increased ANH (for a GGBS constant) The effect of an increase 524
in WB from 034 to 044 and ANH from 0 to 20 with a fixed GGBS dosage of 70 is 525
presented in Figure 8 Increased WB led to an increase of compressibility Similarly an 526
increase in AHN increased the compressibility 527
528
Fig 8 Isoresponse curves for compressibility WB vs ANH 529
034 036 039 042 044
0
5
10
15
20
GGBS = 70 WB
AN
H (
)
3
35
4
4
45
5
034 036 039 042 044
0
5
10
15
20
WB
AN
H (
)
034
035
036 037 038 039 04
041
042
4
GGBS=70
034 036 039 042 044
0
5
10
15
20
WB
AN
H (
)
017
019
021 023 025 027
029
031
GGBS=70
23
530
339 Compressive strength 531
After one day from Eq 15 the influencing factors in order of significance are WB ratio 532
anhydrite content GGBS content and the interaction of WB and ANH The effect of the first 533
three was similar but WB had 11 times greater effect than anhydrite and 125 times greater 534
effect than GGBS While the interaction of WB and anhydrite had around a third of the 535
influence of WB Figures 9 (a) and (b) show the isoresponses for 1-day compressive strength 536
From Figure 9 (a) it can be seen when the GGBS content is fixed at 70 for a given anhydrite 537
content increasing the WB ratio will decrease the strength Also if a WB ratio is selected and 538
the anhydrite is increased similarly the strength will decrease From Figure 9 (b) with the WB 539
ratio fixed at 039 once again an increase in GGBS led to a reduction of compressive strength 540
at 1 day 541
542
(a) (b) 543
Fig9 Isoresponse curves for compressive strength at 1d (a) (WB vs ANH) and (b) (GGBS 544 vs ANH) 545
Eqs 16 17 and 18 show the effect of GGBS and ANH percentages on compressive strength at 546
3-d 7-d and 28-d Figures 10 11 and 12 show the isoresponse of the compressive strength at 547
3-d 7-d and 28-d respectively with WB vs ANH Increased ANH led to a decrease of 3-d 548
and 7-d compressive strength As expected an Increase in WB led to a decrease in compressive 549
strength The percentage of ANH had a negative effect on compressive strength and showed a 550
greater influence particularly at 3-d and 7-d (879 (3 d) amp 924 (7d) vs 382 (28 d)) GGBS has 551
a negative impact on early strength development The negative effect of GGBS on compressive 552
GGBS = 70
034 037 039 042 0440
5
10
15
20
WB
AN
H(
)
12
14
16
18
20
22
2426
WB = 039
60 65 70 75 800
5
10
15
20
GGBS ()
AN
H(
)
10
12
14
16
18
20
22
24
strength at early ages is clearly attributable to the fact that up to 80 of cement has been 553
replaced by GGBS and it takes some time for GGBS to start developing its pozzolanic action 554
at a noticeable level The results indicate that ANH content influences strength to a greater 555
extent than GGBS at all ages The SO3 content was reported to have great influence on the 556
strength [39 40] 557
558
(a) (b) 559
Fig10 Isoresponse curves for compressive strength at 3d (a) (WB vs ANH) and (b) 560 (GGBS vs ANH) 561
562
563
(a) (b) 564
Fig11 Isoresponse curves for compressive strength at 7d (a) (WB vs ANH) and (b) (WB 565 vs ANH) 566
567
GGBS = 70
034 036 039 042 0440
5
10
15
20
WB
AN
H (
)
24
2628
30
3234
3638
4042
WB = 039
60 65 70 75 80
0
5
10
15
20
GGBS ()
AN
H (
)
2426
2830
32
34
36
3840
42
GGBS = 70
034 037 039 042 044
0
5
10
15
20
WB
AN
H(
)
3032
34
3638
40
42
44
46
48
WB = 039
60 65 70 75 80
0
5
10
15
20
GGBS ()
AN
H(
)
32
34
36
38
40
42
44
46
48
25
568
(a) (b) 569
Fig12 Isoresponse curves for compressive strength at 28d (a) (WB vs ANH) and (b) 570
(ANH vs GGBS) 571
3310 Discussion of the effect of WB GGBS and ANH 572
As expected the increase of WB led to an increase in mini-slump induced bleeding and a 573
reduction in flow time plate cohesion yield stress plastic viscosity and compressive strengths 574
This can be attributed to more water in the system 575
An increase in GGBS content resulted in a reduction of the flow time plate cohesion yield 576
stress and plastic viscosity while the fluidity is improved This was due to the fact the specific 577
gravity of slag is lower than that of PC leading to an increase in the paste volume and thus 578
improving the fluidity of paste 579
In case of an increase of ANH proportion while WB and GGBS were kept constant it led to 580
an increased mini-slump and induced bleeding while the flow time plate cohesion yield stress 581
and plastic viscosity were reduced This was due to the lower reactivity of ANH resulting in an 582
increase of water needed for lubrication of paste 583
As expected an increase in WB lead to an increase in induced bleeding permeability and a 584
decrease in compressibility [33 35] This is due to the increase in liquid volume between the 585
particles and to the reduction in the amount of interparticle forces Globally the compressibility 586
decreases and the permeability increases with ANH It can be explained by the reduced specific 587
area and lower reactivity that can lead to more available water in the samples 588
3311 Heat of Hydration 589
Heat of hydration is considered an important factor in the cement design as low heat of 590
hydration reduces the effect of thermal cracking The heat flow results of the calorimeter test 591
performed over a three days period can be seen in Figure 13 592
GGBS = 70
034 036 039 042 0440
5
10
15
20
WB
AN
H (
)
46
48
50
52
54
56
58
60
WB = 039
0 5 10 15 2060
65
70
75
80
ANH ()
GG
BS
(
)
50
52
54
56
5860
62
26
593
Fig 13 Heat flow graphs for first 3 days of reaction 594
Figure 13 presents that the largest peaks were in mixes 1 2 5 and 6 This shows that these 595
reactions generated the most heat and that they were quick Mixes 1 and 2 have the highest 596
OPC content at 40 and this suggests that to lower the heat of the reaction minimal OPC 597
should be used This is confirmed by the fact that mixes 5 and 6 have the next highest OPC 598
contents the same percentage as mixes 3 4 and 9 (one of the repeated mixes) which have 599
anhydrite present This implies that the presence of anhydrite will lengthen the reaction process 600
and reduce the heat produced during setting significantly The graph shows this by the absence 601
of a sharp peak instead a gentle curved hump is shown over a 2-day period whereas the mixes 602
showing a sharp peak occur after about 12 hrs Mix 7 which has the same solids content as 603
mix 8 but a lower WB ratio and no cement present showed the lowest heat flow during the 604
hydration process 605
Figure 14 shows the cumulative heat generation during the first 3 days of setting It is clear that 606
the two mixes (1 and 2) with highest cement content and absence of anhydrite had the highest 607
cumulative heat development over the 3-day period 643J and 594J respectively Mixes 3456 608
and 9 which all have 20 OPC content generated similar heat value over the 3 days Results 609
of mixes containing ANH implies that over the period that the anhydrite did not reduce the 610
cumulative heat generated but slowed the reaction and reduce the peak heat generated The 611
0
0002
0004
0006
0008
001
0012
0 50000 100000 150000 200000 250000 300000
He
at F
low
(mW
)
Time s()
M1
M2
M3
M4
M5
M6
M7
M9
1Day
2Day
3day
1d 2d 3d
27
graphs also suggest that a higher WB ratio produced a lower cumulative and peak heat 612
generation613
614
Fig 14 Cumulative heat generation curves for first 3 days 615
3312 pH measurements 616
Fig 15 summarises the results of pH and the nine mixes with different compositions of WB 617
the percentages of cement GGBS and ANH It is shown that Supersulfated cements (SSCs) 618
have lower pH values (lt 125 at all ages) than PC which has a pH of 139 [41] making SSC 619
more preferable in essential applications such as nuclear waste encapsulation 620
The figure shows that the pH value decreased with time for all samples between 1 and 7 days 621
Similar trend was observed in the majority of mixes between 7 and 28 days except for sample 622
2 5 and 9 which showed slight increase in the pH values This decrease refers to the 623
consumption of ions in the pore structure due to the hydration process 624
0
100
200
300
400
500
600
700
800
0 50000 100000 150000 200000 250000 300000
(J)
Time (s)
M1
M2
M3
M4
M5
M6
M7
M9
1 Day
3 Day
2 day
1d 2d 3d
1
2
3
9
45
6
7
28
625
626 Fig 15 Summary of pore solution pH 627
628
The incorporation of ANH replacing the Portland cement (C) results in remarkable decrease in 629
pH at all ages as introducing the ANH reduced the lower initial pH Likewise the increase in 630
the content of GGBS led to a decrease in the pH value of the pore structure as GGBS has lower 631
initial pH than Portland cement The increase of WB ratio decreased the pH value This is in 632
agreement with Collier [41] who found that increasing the wb ratio from 05 to 06 increased 633
the pH by I unit This was attributed to the increased availability of water in the case of WB 634
of 06 allowing hydration of more cement powder thereby releasing more hydroxide anions 635
into solution However in this study the WB ratio did not show a significant effect on 636
lowering the pH These results are in agreement with [42] which also found that decreasing the 637
pH improved the bulk resistivity of SSC mixtures 638
3313 SEM 639
Figure 16 shows the SEM images of some mixes at various magnifications The images clearly 640
show the dense and compact structure of the cement after seven days The dense structure was 641
another requirement from the cement chosen to enclose the waste to prevent leaching The 642
microstructure consists mainly of C-S-H the main hydration product and unhydrated slag 643
grains C-S-H is formed after the dissolution of slag grains when contacting the water and 644
alkalis and then the ionic species saturate the solution and then precipitate as hydrated phases 645
[8] There were abundant grains of hydrated and partially hydrated slag grains some small 646
1080
1100
1120
1140
1160
1180
1200
1220
1240
1260
1280
1 2 3 4 5 6 7 8 9
pH
val
ue
Mix Number
1 Day
7 Days
28 Days
29
GGBS particles presented rims of reaction products (eg Mix 6-Figure 16 (f) and Mix 9-Figure 647
16 (h)) It was found by [11] that the composition of the reaction rims around slag was similar 648
to that of the C-S-H from PC However [12] found that in the CndashSndashH of SSC is apparently 649
more foil like which is different than the fibrillar morphology of C-S-H in OPC Mix 3 and 650
Mix 4 (Figure 16 (c) and (d) respectively) exhibits more micro voids in the micrsostructure 651
which could explain the low strength of these mixes compared to mix 1 and 2 Ettringite was 652
not detected Ettringite is not the most abundant phase and it is not easy to detect in dried 653
polished samples because it is easily decomposed under the drying conditions of the vacuum 654
of the microscope column [11] 655
(a) Mix 1 image at 1100 magnification (b) Mix 2 image at 900 magnification
(c) Particle of unreacted slag mix3 7 days (d) An overall image of mix 4 at 7days
showing CSH and BFS particles
30
(e) Mix 5 image at 1100 magnification (f) Mix 6 image at 2300 magnification
(g) Mix 7 image at 2000 magnification (h) Mix 9 image at 2700 magnification
Fig 16 SEM results 656
4 Conclusions 657
The paper focused on optimizing the SSC cement grout in order to get the best of it The effect 658
of GGBS WB and ANH dosages on the grout fluidity rheological properties induced 659
bleeding maximum heat of hydration and compressive strength was investigated using 660
factorial design approach and analysis The models derived in this study are valid for the 661
experimental area corresponding to grout mixes made with variable levels of WB ANH and 662
GGBS in the ranges of 034 to 044 0 to 20 by mass of binder 60 to 80 by mass of 663
binder respectively Based on the results from this study the following conclusions are drawn 664
- In comparison to GGBS and ANH WB ratio had more pronounced effects on the 665
results of mini-slump plate cohesion meter Marsh cone time yield stress plastic viscosity 666
induced bleeding permeability compressibility and compressive strength 667
31
- The increase in the dosage of GGBS led to an increase in the values of plate cohesion 668
meter Marsh cone time yield stress and plastic viscosity while reducing the mini-slump 669
values maximum hydration and compressive strength This is ascribed to the fine nature 670
of GGBS particles and pozzolanic effect 671
- While the ANH particles caused a decrease in the maximum of heat of hydration it 672
increased the induced bleeding permeability and compressibility due to its dominant effect 673
on increasing the dormant period and increasing the rates of solid sedimentation and 674
induced bleeding water 675
- Increasing the dosage of ANH in grout reduced the hydrations kinetic at early-age and 676
thus reduced the compressive strength at 1d 3d and 7d However this effect diminished 677
at later ages at 28 d in a manner similar to increasing WB 678
- The increase in the dosage of ANH led to an increase in the mini-slump values 679
(fluidity) but a decrease in the values of yield stress plastic viscosity plate cohesion and 680
Marsh cone time This is attributed to better deflocculation of particles at the fresh state 681
- The increase of GGBS percentage delayed the reaction process and decreased the total 682
heat after 3 days while WB slightly reduced the total heat it didnrsquot significantly affect the 683
reaction process 684
- pH measurements in the present study confirmed the suitability of these mixture to low-685
pH applications as the increase in both the GGBS and ANH markedly decreased the initial 686
pH thereby lowering the pH at different ages 687
- The modelling and prediction of the response of other points in the experimental domain 688
were therefore possible Although the models are based on a given set of materials they 689
can be easily used to generate future results using other materials 690
- Dense microstructure was observed for mixes examined in this study C-S-H is the main 691
reaction product with presence of unreacted slag grains embedded well in the structure 692
However some micro voids were observed in mixes containing ANH which led to lower 693
compressive strength of mixes with ANH 694
CRediT authorship contribution statement 695
MSonebi and YBai did the conceptualization and the design of investigation as well as 696 performing the experiments MSonebi carried out the software analysis of the results and the 697
32
visualization MSonebi AAbdalqader T Fayyad and APerrot analysed the results and 698 wrote the original draft and reviewed and edited the final version 699
Declaration of Competing Interest 700
The authors declare that they have no known competing financial interests or personal 701 relationships that could have appeared to influence the work reported in this paper 702
Acknowledgments 703
The authors would like to express their gratitude to P McCann from QUB and N Collier 704 from Eden Nuclear and Environment Ltd for their helps for some experiments 705
706
References 707
1 Schneider M Romer M Tschudin M Bolio H (2011) Sustainable cement production-708 present and future Cement and Concrete Research 41642ndash650 709
httpsdoiorg101016jcemconres201103019 710
2 Madlool NA Saidur R Hossain MS Rahim NA (2011) A critical review on energy use 711 and savings in the cement industries Renewable and Sustainable Energy Reviews 712
152042ndash2060 httpsdoiorg101016jrser201101005 713
3 EN15743 (2015) BS EN 157432010+A12015 Supersulfated cement - Composition 714
specifications and conformity criteria BSI 715
4 Khatib JM Wright L Mangat PS (2016) Mechanical and physical properties of concrete 716
containing FGD waste Magazine of Concrete Research 68550ndash560 717 httpsdoiorg101680macr1500092 718
5 Khatib JM Mangat PS Wright L (2008) Sulfate resistance of mortar containing 719
simulated FGD waste Proceedings of Institution of Civil Engineers Construction 720 Materials 161119ndash128 httpsdoiorg101680coma20081613119 721
6 (2020) Specifying Sustainable Concrete 722
7 Hewlett PC (2004) Learsquos Chemistry of Cement and Concrete fourth edi Elsevier 723 Science amp Technology Books Oxford 724
8 Gruskovnjak A Lothenbach B Winnefeld F et al (2008) Hydration mechanisms of 725 super sulphated slag cement Cement and Concrete Research 38983ndash992 726
httpsdoiorg101016jcemconres200803004 727
9 Grounds T Nowell D V Wilburn FW (2003) Resistance of supersulfated cement to 728 strong sulfate solutions Journal of Thermal Analysis and Calorimetry 72181ndash190 729
httpsdoiorg101023A1023928021602 730
10 Grounds T Nowell D V Wilburn FW (1995) The influence of temperature and 731
different storage conditions on the stability of supersulphated cement Journal of 732 Thermal Analysis 45385ndash394 httpsdoiorg101007BF02548772 733
33
11 Bazalduacutea-Medelliacuten ME Fuentes AF Gorokhovsky A Escalante-Garciacutea JI (2015) Early 734 and late hydration of supersulphated cements of blast furnace slag with fluorgypsum 735 Materiales de Construccion 65e043 httpsdoiorg103989mc201506013 736
12 Matschei T Bellmann F Stark J (2005) Hydration behaviour of sulphate-activated slag 737 cements Advances in Cement Research 17167ndash178 738
httpsdoiorg101680adcr2005174167 739
13 Richardson IG (2000) Nature of the hydration products in hardened cement pastes 740 Cement and Concrete Composites 2297ndash113 httpsdoiorg101016S0958-741 9465(99)00036-0 742
14 Baux C Phelipot-Mardeleacute A Lanos C et al (2013) PERFORMANCES OF SUPER 743 SULFATED CEMENTS In International Conference on Concrete Under Severe 744 Conditions pp 1857ndash1870 745
15 Annabelle Phelipot-Mardeleacute Gabriel Samson Christophe Lanos (2015) Super sulfated 746 cement formulation and uses In Construction Materials ConMat Whistler Canada 747
16 Milestone NB (2006) Reactions in cement encapsulated nuclear wastes need for 748 toolbox of different cement types Advances in Applied Ceramics 10513ndash20 749
httpsdoiorg101179174367606X81678 750
17 Batchelor B (2006) Overview of waste stabilization with cement Waste Management 751
26689ndash698 httpsdoiorg101016JWASMAN200601020 752
18 Zhang T Cheeseman CR Vandeperre LJ (2011) Development of low pH cement 753
systems forming magnesium silicate hydrate (MSH) Cement and Concrete Research 754 41439ndash442 httpsdoiorg101016jcemconres201101016 755
19 Mobasher N Bernal SA Provis JL (2016) Structural evolution of an alkali sulfate 756
activated slag cement Journal of Nuclear Materials 46897ndash104 757 httpsdoiorg101016JJNUCMAT201511016 758
20 Wang J Yu B Gao Y (2014) Hydration Characteristics of Super Sulphated Cement 759 with Different Fineness In Proceedings of the International Conference on Material 760 and Environmental Engineering (ICMAEE 2014) Atlantis Press Paris France 761
21 Naumlgele E (1986) The Zeta-potential of cement Part II Effect of pH-value Cement and 762 Concrete Research 16853ndash863 httpsdoiorg1010160008-8846(86)90008-6 763
22 Jain N Civil MG-IJ of M and 2015 U (2015) Formulation of Sulphate Resistant Super 764 Sulphated Cement Using Fluorogypsum and Granulated Blast Furnace Slag IOSR 765
Journal of Mechanical and Civil Engineering (IOSR-JMCE) 12153ndash159 766
23 Gao YX Yu BY Xu FL (2012) Effect of Modified Phosphogypsum on the Mechanical 767 Properties of Super Sulphate Cement Applied Mechanics and Materials 161264ndash268 768 httpsdoiorg104028wwwscientificnetAMM161264 769
24 Kantro D (1980) Influence of Water-Reducing Admixtures on Properties of Cement 770 PasteampmdashA Miniature Slump Test Cement Concrete and Aggregates 295ndash102 771
httpsdoiorg101520CCA10190J 772
34
25 Svermova L Sonebi M Bartos PJM (2003) Influence of mix proportions on rheology of 773 cement grouts containing limestone powder Cement and Concrete Composites 25737ndash774 749 httpsdoiorg101016S0958-9465(02)00115-4 775
26 Sonebi M (2006) Rheological properties of grouts with viscosity modifying agents as 776 diutan gum and welan gum incorporating pulverised fly ash Cement and Concrete 777
Research 361609ndash1618 httpsdoiorg101016JCEMCONRES200605016 778
27 Nehdi M Rahman M (2004) Effect of Geometry and Surface Friction of Test Accessory 779 on Oscillatory Rheological Properties of Cement Pastes ACI Materials Journal 780 101416ndash424 httpsdoiorg101435913428 781
28 Khayat KH Yahia A (1997) Effect of Welan Gum-High-Range Water Reducer 782 Combinations on Rheology of Cement Grout ACI Materials Journal 94365ndash372 783 httpsdoiorg1014359321 784
29 Lombardi G (1985) THE ROLE OF COHESION IN CEMENT GROUTING OF 785 ROCK In Proceedings of Fifteenth Congress on Large Dams International 786 Commission on Large Dams pp 235ndash261 787
30 Perrot A Rangeard D Picandet V Meacutelinge Y (2013) Hydro-mechanical properties of 788
fresh cement pastes containing polycarboxylate superplasticizer Cement and Concrete 789 Research 53221ndash228 httpsdoiorg101016JCEMCONRES201306015 790
31 Perrot A Lecompte T Khelifi H et al (2012) Yield stress and bleeding of fresh cement 791 pastes Cement and Concrete Research 42937ndash944 792
httpdxdoiorg101016jcemconres201203015 793
32 Sonebi M Perrot A (2019) Effect of mix proportions on rheology and permeability of 794 cement grouts containing viscosity modifying admixture Construction and Building 795
Materials 212687ndash697 httpsdoiorg101016jconbuildmat201904022 796
33 Picandet V Rangeard D Perrot A Lecompte T (2011) Permeability measurement of 797
fresh cement paste Cement and Concrete Research 41330ndash338 798 httpsdoiorg101016JCEMCONRES201011019 799
34 Perrot A Rangeard D (2017) Effects of mix design parameters on consolidation 800
behaviour of fresh cement-based materials Materials and Structures 50117 801 httpsdoiorg101617s11527-016-0988-0 802
35 Rangeard D Perrot A Picandet V et al (2015) Determination of the consolidation 803 coefficient of low compressibility materials application to fresh cement-based 804
materials Materials and Structures 481475ndash1483 httpsdoiorg101617s11527-014-805 0247-1 806
36 Massoussi N Keita E Roussel N (2017) The heterogeneous nature of bleeding in 807 cement pastes Cement and Concrete Research 95108ndash116 808 httpsdoiorg101016JCEMCONRES201702012 809
37 Montgomery D (2007) Design and Analysis of Experiments Second Edition John 810
Wiley amp Sons 811
35
38 Roussel N Stefani C Leroy R (2005) From mini-cone test to Abrams cone test 812 Measurement of cement-based materials yield stress using slump tests Cement and 813 Concrete Research 35817ndash822 httpsdoiorg101016jcemconres200407032 814
39 Mangat PS Khatib JM Wright L (2006) Optimum utilisation of FGD waste in blended 815 binders Proceedings of Institution of Civil Engineers Construction Materials 159119ndash816
127 httpsdoiorg101680coma20061593119 817
40 Khatib JM Mangat PS Wright L (2013) Early age porosity and pore size distribution of 818 cement paste with flue gas desulphurisation (FGD) waste Journal of Civil Engineering 819 and Management 19622ndash627 httpsdoiorg103846139237302013793609 820
41 Collier NC Milestone NB Gordon LE Ko SC (2014) The suitability of a supersulfated 821 cement for nuclear waste immobilisation Journal of Nuclear Materials 452457ndash464 822 httpsdoiorg101016jjnucmat201405078 823
42 Masoudi R (2018) Examining compositions hydration mechanisms and properties of 824 supersulfated cement for use in concrete by Examining compositions hydration 825 mechanisms and properties of supersulfated cement for use in concrete University of 826 Toronto 827
828
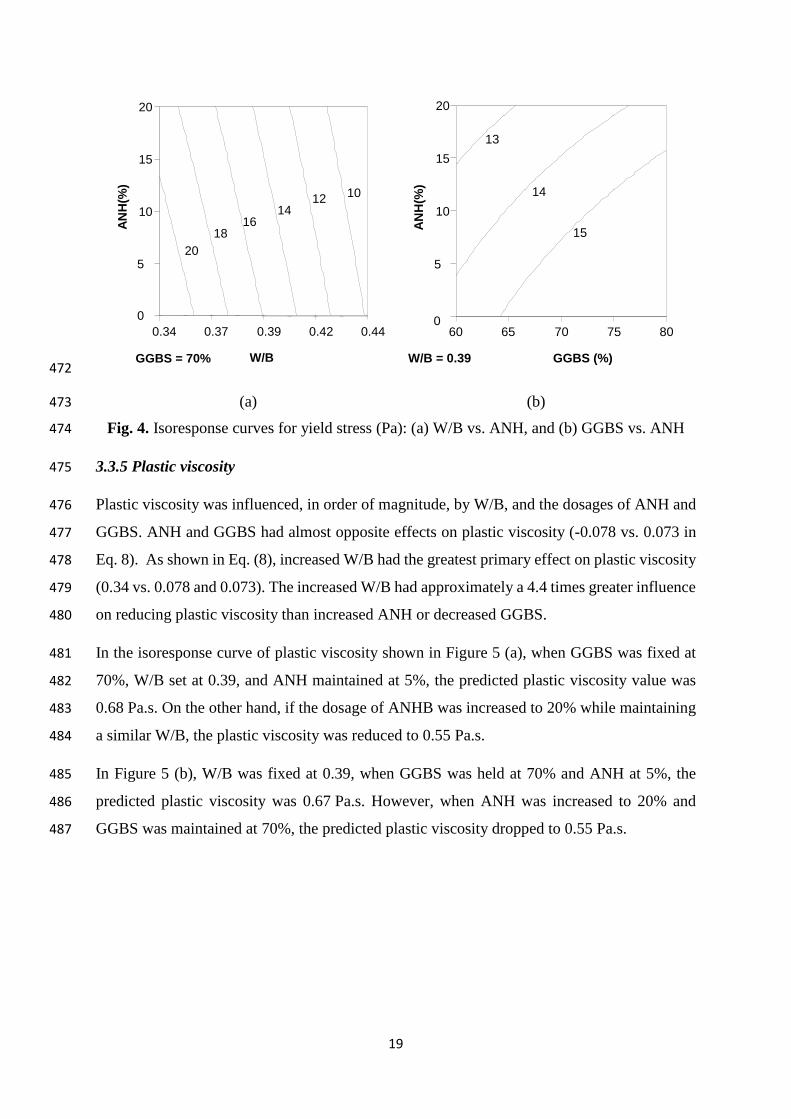
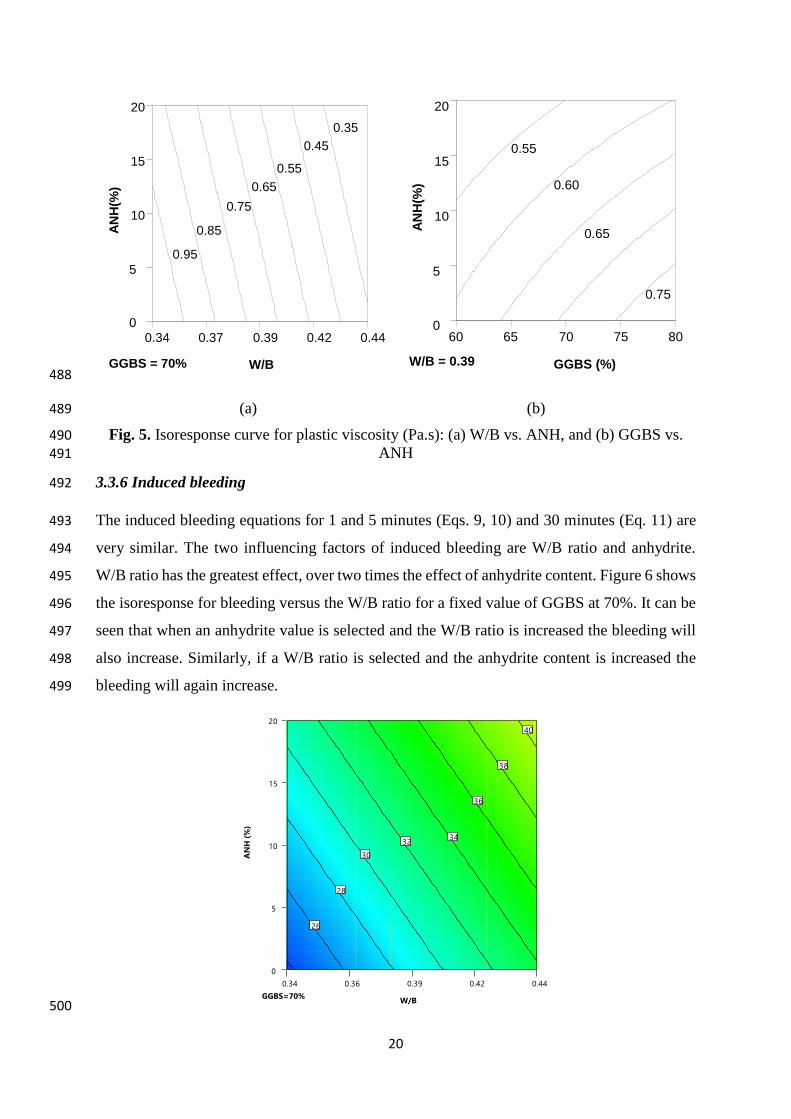
20
488
(a) (b) 489
Fig 5 Isoresponse curve for plastic viscosity (Pas) (a) WB vs ANH and (b) GGBS vs 490
ANH 491
336 Induced bleeding 492
The induced bleeding equations for 1 and 5 minutes (Eqs 9 10) and 30 minutes (Eq 11) are 493
very similar The two influencing factors of induced bleeding are WB ratio and anhydrite 494
WB ratio has the greatest effect over two times the effect of anhydrite content Figure 6 shows 495
the isoresponse for bleeding versus the WB ratio for a fixed value of GGBS at 70 It can be 496
seen that when an anhydrite value is selected and the WB ratio is increased the bleeding will 497
also increase Similarly if a WB ratio is selected and the anhydrite content is increased the 498
bleeding will again increase 499
500
GGBS = 70
034 037 039 042 0440
5
10
15
20
WB
AN
H(
)
035
045
055
065
075
085
095
WB = 039
60 65 70 75 800
5
10
15
20
GGBS ()
AN
H(
)
055
060
065
075
034 036 039 042 044
0
5
10
15
20
WB
AN
H (
)
26
28
30
3234
36
38
40
GGBS=70
21
(a) 501
502
(b) (c) 503
Fig 6 Isoresponse curves for induced bleeding at 1 5 and 30 min WB vs ANH 504
337 Permeability 505
Figure 7 (a) and (b) showed firstly that the permeability decreased significantly from 1 min to 506
30 min Permeability at 1 min was influenced in order of magnitude by WB and the dosage 507
of ANH All interactions between 3 parameters had almost opposite effects on permeability 508
(Eq 12) As shown in Eq (12) increased WB and AHN had the greatest primary effect on 509
permeability at 1 min It seems there is an optimum reached at WB = 40 and AHN at 17 510
Similarly the permeability at 30 min is affected in order of significance by WB followed by 511
ANH (Eq 13) In Figure 7 (b) WB was fixed at 039 when GGBS was held at 70 and ANH 512
at 10 the predicted permeability was 038 x 10-8 (ms) However when ANH was increased 513
to 20 and GGBS was maintained at 70 the predicted permeability increased to 040x10-8 514
(ms) 515
516
GGBS = 70
034 036 039 042 0440
5
10
15
20
WB
AN
H (
)
545
61
675
74
805
GGBS = 70
034 036 039 042 0440
5
10
15
20
WB
AN
H (
)
56
60
64
68
72
7680
84
22
517
(a) (b) 518
Fig 7 Isoresponse curves for permeability at 1 and 30 min WB vs ANH 519
338 Compressibility 520
As shown in Eq (14) the compressibility was influenced in order of magnitude by the WB 521
and the percentage of ANH The interaction between 3 parameters affected also the 522
compressibility The increasing WB had a 32 times the influence on the increase of the 523
compressibility results as the increased ANH (for a GGBS constant) The effect of an increase 524
in WB from 034 to 044 and ANH from 0 to 20 with a fixed GGBS dosage of 70 is 525
presented in Figure 8 Increased WB led to an increase of compressibility Similarly an 526
increase in AHN increased the compressibility 527
528
Fig 8 Isoresponse curves for compressibility WB vs ANH 529
034 036 039 042 044
0
5
10
15
20
GGBS = 70 WB
AN
H (
)
3
35
4
4
45
5
034 036 039 042 044
0
5
10
15
20
WB
AN
H (
)
034
035
036 037 038 039 04
041
042
4
GGBS=70
034 036 039 042 044
0
5
10
15
20
WB
AN
H (
)
017
019
021 023 025 027
029
031
GGBS=70
23
530
339 Compressive strength 531
After one day from Eq 15 the influencing factors in order of significance are WB ratio 532
anhydrite content GGBS content and the interaction of WB and ANH The effect of the first 533
three was similar but WB had 11 times greater effect than anhydrite and 125 times greater 534
effect than GGBS While the interaction of WB and anhydrite had around a third of the 535
influence of WB Figures 9 (a) and (b) show the isoresponses for 1-day compressive strength 536
From Figure 9 (a) it can be seen when the GGBS content is fixed at 70 for a given anhydrite 537
content increasing the WB ratio will decrease the strength Also if a WB ratio is selected and 538
the anhydrite is increased similarly the strength will decrease From Figure 9 (b) with the WB 539
ratio fixed at 039 once again an increase in GGBS led to a reduction of compressive strength 540
at 1 day 541
542
(a) (b) 543
Fig9 Isoresponse curves for compressive strength at 1d (a) (WB vs ANH) and (b) (GGBS 544 vs ANH) 545
Eqs 16 17 and 18 show the effect of GGBS and ANH percentages on compressive strength at 546
3-d 7-d and 28-d Figures 10 11 and 12 show the isoresponse of the compressive strength at 547
3-d 7-d and 28-d respectively with WB vs ANH Increased ANH led to a decrease of 3-d 548
and 7-d compressive strength As expected an Increase in WB led to a decrease in compressive 549
strength The percentage of ANH had a negative effect on compressive strength and showed a 550
greater influence particularly at 3-d and 7-d (879 (3 d) amp 924 (7d) vs 382 (28 d)) GGBS has 551
a negative impact on early strength development The negative effect of GGBS on compressive 552
GGBS = 70
034 037 039 042 0440
5
10
15
20
WB
AN
H(
)
12
14
16
18
20
22
2426
WB = 039
60 65 70 75 800
5
10
15
20
GGBS ()
AN
H(
)
10
12
14
16
18
20
22
24
strength at early ages is clearly attributable to the fact that up to 80 of cement has been 553
replaced by GGBS and it takes some time for GGBS to start developing its pozzolanic action 554
at a noticeable level The results indicate that ANH content influences strength to a greater 555
extent than GGBS at all ages The SO3 content was reported to have great influence on the 556
strength [39 40] 557
558
(a) (b) 559
Fig10 Isoresponse curves for compressive strength at 3d (a) (WB vs ANH) and (b) 560 (GGBS vs ANH) 561
562
563
(a) (b) 564
Fig11 Isoresponse curves for compressive strength at 7d (a) (WB vs ANH) and (b) (WB 565 vs ANH) 566
567
GGBS = 70
034 036 039 042 0440
5
10
15
20
WB
AN
H (
)
24
2628
30
3234
3638
4042
WB = 039
60 65 70 75 80
0
5
10
15
20
GGBS ()
AN
H (
)
2426
2830
32
34
36
3840
42
GGBS = 70
034 037 039 042 044
0
5
10
15
20
WB
AN
H(
)
3032
34
3638
40
42
44
46
48
WB = 039
60 65 70 75 80
0
5
10
15
20
GGBS ()
AN
H(
)
32
34
36
38
40
42
44
46
48
25
568
(a) (b) 569
Fig12 Isoresponse curves for compressive strength at 28d (a) (WB vs ANH) and (b) 570
(ANH vs GGBS) 571
3310 Discussion of the effect of WB GGBS and ANH 572
As expected the increase of WB led to an increase in mini-slump induced bleeding and a 573
reduction in flow time plate cohesion yield stress plastic viscosity and compressive strengths 574
This can be attributed to more water in the system 575
An increase in GGBS content resulted in a reduction of the flow time plate cohesion yield 576
stress and plastic viscosity while the fluidity is improved This was due to the fact the specific 577
gravity of slag is lower than that of PC leading to an increase in the paste volume and thus 578
improving the fluidity of paste 579
In case of an increase of ANH proportion while WB and GGBS were kept constant it led to 580
an increased mini-slump and induced bleeding while the flow time plate cohesion yield stress 581
and plastic viscosity were reduced This was due to the lower reactivity of ANH resulting in an 582
increase of water needed for lubrication of paste 583
As expected an increase in WB lead to an increase in induced bleeding permeability and a 584
decrease in compressibility [33 35] This is due to the increase in liquid volume between the 585
particles and to the reduction in the amount of interparticle forces Globally the compressibility 586
decreases and the permeability increases with ANH It can be explained by the reduced specific 587
area and lower reactivity that can lead to more available water in the samples 588
3311 Heat of Hydration 589
Heat of hydration is considered an important factor in the cement design as low heat of 590
hydration reduces the effect of thermal cracking The heat flow results of the calorimeter test 591
performed over a three days period can be seen in Figure 13 592
GGBS = 70
034 036 039 042 0440
5
10
15
20
WB
AN
H (
)
46
48
50
52
54
56
58
60
WB = 039
0 5 10 15 2060
65
70
75
80
ANH ()
GG
BS
(
)
50
52
54
56
5860
62
26
593
Fig 13 Heat flow graphs for first 3 days of reaction 594
Figure 13 presents that the largest peaks were in mixes 1 2 5 and 6 This shows that these 595
reactions generated the most heat and that they were quick Mixes 1 and 2 have the highest 596
OPC content at 40 and this suggests that to lower the heat of the reaction minimal OPC 597
should be used This is confirmed by the fact that mixes 5 and 6 have the next highest OPC 598
contents the same percentage as mixes 3 4 and 9 (one of the repeated mixes) which have 599
anhydrite present This implies that the presence of anhydrite will lengthen the reaction process 600
and reduce the heat produced during setting significantly The graph shows this by the absence 601
of a sharp peak instead a gentle curved hump is shown over a 2-day period whereas the mixes 602
showing a sharp peak occur after about 12 hrs Mix 7 which has the same solids content as 603
mix 8 but a lower WB ratio and no cement present showed the lowest heat flow during the 604
hydration process 605
Figure 14 shows the cumulative heat generation during the first 3 days of setting It is clear that 606
the two mixes (1 and 2) with highest cement content and absence of anhydrite had the highest 607
cumulative heat development over the 3-day period 643J and 594J respectively Mixes 3456 608
and 9 which all have 20 OPC content generated similar heat value over the 3 days Results 609
of mixes containing ANH implies that over the period that the anhydrite did not reduce the 610
cumulative heat generated but slowed the reaction and reduce the peak heat generated The 611
0
0002
0004
0006
0008
001
0012
0 50000 100000 150000 200000 250000 300000
He
at F
low
(mW
)
Time s()
M1
M2
M3
M4
M5
M6
M7
M9
1Day
2Day
3day
1d 2d 3d
27
graphs also suggest that a higher WB ratio produced a lower cumulative and peak heat 612
generation613
614
Fig 14 Cumulative heat generation curves for first 3 days 615
3312 pH measurements 616
Fig 15 summarises the results of pH and the nine mixes with different compositions of WB 617
the percentages of cement GGBS and ANH It is shown that Supersulfated cements (SSCs) 618
have lower pH values (lt 125 at all ages) than PC which has a pH of 139 [41] making SSC 619
more preferable in essential applications such as nuclear waste encapsulation 620
The figure shows that the pH value decreased with time for all samples between 1 and 7 days 621
Similar trend was observed in the majority of mixes between 7 and 28 days except for sample 622
2 5 and 9 which showed slight increase in the pH values This decrease refers to the 623
consumption of ions in the pore structure due to the hydration process 624
0
100
200
300
400
500
600
700
800
0 50000 100000 150000 200000 250000 300000
(J)
Time (s)
M1
M2
M3
M4
M5
M6
M7
M9
1 Day
3 Day
2 day
1d 2d 3d
1
2
3
9
45
6
7
28
625
626 Fig 15 Summary of pore solution pH 627
628
The incorporation of ANH replacing the Portland cement (C) results in remarkable decrease in 629
pH at all ages as introducing the ANH reduced the lower initial pH Likewise the increase in 630
the content of GGBS led to a decrease in the pH value of the pore structure as GGBS has lower 631
initial pH than Portland cement The increase of WB ratio decreased the pH value This is in 632
agreement with Collier [41] who found that increasing the wb ratio from 05 to 06 increased 633
the pH by I unit This was attributed to the increased availability of water in the case of WB 634
of 06 allowing hydration of more cement powder thereby releasing more hydroxide anions 635
into solution However in this study the WB ratio did not show a significant effect on 636
lowering the pH These results are in agreement with [42] which also found that decreasing the 637
pH improved the bulk resistivity of SSC mixtures 638
3313 SEM 639
Figure 16 shows the SEM images of some mixes at various magnifications The images clearly 640
show the dense and compact structure of the cement after seven days The dense structure was 641
another requirement from the cement chosen to enclose the waste to prevent leaching The 642
microstructure consists mainly of C-S-H the main hydration product and unhydrated slag 643
grains C-S-H is formed after the dissolution of slag grains when contacting the water and 644
alkalis and then the ionic species saturate the solution and then precipitate as hydrated phases 645
[8] There were abundant grains of hydrated and partially hydrated slag grains some small 646
1080
1100
1120
1140
1160
1180
1200
1220
1240
1260
1280
1 2 3 4 5 6 7 8 9
pH
val
ue
Mix Number
1 Day
7 Days
28 Days
29
GGBS particles presented rims of reaction products (eg Mix 6-Figure 16 (f) and Mix 9-Figure 647
16 (h)) It was found by [11] that the composition of the reaction rims around slag was similar 648
to that of the C-S-H from PC However [12] found that in the CndashSndashH of SSC is apparently 649
more foil like which is different than the fibrillar morphology of C-S-H in OPC Mix 3 and 650
Mix 4 (Figure 16 (c) and (d) respectively) exhibits more micro voids in the micrsostructure 651
which could explain the low strength of these mixes compared to mix 1 and 2 Ettringite was 652
not detected Ettringite is not the most abundant phase and it is not easy to detect in dried 653
polished samples because it is easily decomposed under the drying conditions of the vacuum 654
of the microscope column [11] 655
(a) Mix 1 image at 1100 magnification (b) Mix 2 image at 900 magnification
(c) Particle of unreacted slag mix3 7 days (d) An overall image of mix 4 at 7days
showing CSH and BFS particles
30
(e) Mix 5 image at 1100 magnification (f) Mix 6 image at 2300 magnification
(g) Mix 7 image at 2000 magnification (h) Mix 9 image at 2700 magnification
Fig 16 SEM results 656
4 Conclusions 657
The paper focused on optimizing the SSC cement grout in order to get the best of it The effect 658
of GGBS WB and ANH dosages on the grout fluidity rheological properties induced 659
bleeding maximum heat of hydration and compressive strength was investigated using 660
factorial design approach and analysis The models derived in this study are valid for the 661
experimental area corresponding to grout mixes made with variable levels of WB ANH and 662
GGBS in the ranges of 034 to 044 0 to 20 by mass of binder 60 to 80 by mass of 663
binder respectively Based on the results from this study the following conclusions are drawn 664
- In comparison to GGBS and ANH WB ratio had more pronounced effects on the 665
results of mini-slump plate cohesion meter Marsh cone time yield stress plastic viscosity 666
induced bleeding permeability compressibility and compressive strength 667
31
- The increase in the dosage of GGBS led to an increase in the values of plate cohesion 668
meter Marsh cone time yield stress and plastic viscosity while reducing the mini-slump 669
values maximum hydration and compressive strength This is ascribed to the fine nature 670
of GGBS particles and pozzolanic effect 671
- While the ANH particles caused a decrease in the maximum of heat of hydration it 672
increased the induced bleeding permeability and compressibility due to its dominant effect 673
on increasing the dormant period and increasing the rates of solid sedimentation and 674
induced bleeding water 675
- Increasing the dosage of ANH in grout reduced the hydrations kinetic at early-age and 676
thus reduced the compressive strength at 1d 3d and 7d However this effect diminished 677
at later ages at 28 d in a manner similar to increasing WB 678
- The increase in the dosage of ANH led to an increase in the mini-slump values 679
(fluidity) but a decrease in the values of yield stress plastic viscosity plate cohesion and 680
Marsh cone time This is attributed to better deflocculation of particles at the fresh state 681
- The increase of GGBS percentage delayed the reaction process and decreased the total 682
heat after 3 days while WB slightly reduced the total heat it didnrsquot significantly affect the 683
reaction process 684
- pH measurements in the present study confirmed the suitability of these mixture to low-685
pH applications as the increase in both the GGBS and ANH markedly decreased the initial 686
pH thereby lowering the pH at different ages 687
- The modelling and prediction of the response of other points in the experimental domain 688
were therefore possible Although the models are based on a given set of materials they 689
can be easily used to generate future results using other materials 690
- Dense microstructure was observed for mixes examined in this study C-S-H is the main 691
reaction product with presence of unreacted slag grains embedded well in the structure 692
However some micro voids were observed in mixes containing ANH which led to lower 693
compressive strength of mixes with ANH 694
CRediT authorship contribution statement 695
MSonebi and YBai did the conceptualization and the design of investigation as well as 696 performing the experiments MSonebi carried out the software analysis of the results and the 697
32
visualization MSonebi AAbdalqader T Fayyad and APerrot analysed the results and 698 wrote the original draft and reviewed and edited the final version 699
Declaration of Competing Interest 700
The authors declare that they have no known competing financial interests or personal 701 relationships that could have appeared to influence the work reported in this paper 702
Acknowledgments 703
The authors would like to express their gratitude to P McCann from QUB and N Collier 704 from Eden Nuclear and Environment Ltd for their helps for some experiments 705
706
References 707
1 Schneider M Romer M Tschudin M Bolio H (2011) Sustainable cement production-708 present and future Cement and Concrete Research 41642ndash650 709
httpsdoiorg101016jcemconres201103019 710
2 Madlool NA Saidur R Hossain MS Rahim NA (2011) A critical review on energy use 711 and savings in the cement industries Renewable and Sustainable Energy Reviews 712
152042ndash2060 httpsdoiorg101016jrser201101005 713
3 EN15743 (2015) BS EN 157432010+A12015 Supersulfated cement - Composition 714
specifications and conformity criteria BSI 715
4 Khatib JM Wright L Mangat PS (2016) Mechanical and physical properties of concrete 716
containing FGD waste Magazine of Concrete Research 68550ndash560 717 httpsdoiorg101680macr1500092 718
5 Khatib JM Mangat PS Wright L (2008) Sulfate resistance of mortar containing 719
simulated FGD waste Proceedings of Institution of Civil Engineers Construction 720 Materials 161119ndash128 httpsdoiorg101680coma20081613119 721
6 (2020) Specifying Sustainable Concrete 722
7 Hewlett PC (2004) Learsquos Chemistry of Cement and Concrete fourth edi Elsevier 723 Science amp Technology Books Oxford 724
8 Gruskovnjak A Lothenbach B Winnefeld F et al (2008) Hydration mechanisms of 725 super sulphated slag cement Cement and Concrete Research 38983ndash992 726
httpsdoiorg101016jcemconres200803004 727
9 Grounds T Nowell D V Wilburn FW (2003) Resistance of supersulfated cement to 728 strong sulfate solutions Journal of Thermal Analysis and Calorimetry 72181ndash190 729
httpsdoiorg101023A1023928021602 730
10 Grounds T Nowell D V Wilburn FW (1995) The influence of temperature and 731
different storage conditions on the stability of supersulphated cement Journal of 732 Thermal Analysis 45385ndash394 httpsdoiorg101007BF02548772 733
33
11 Bazalduacutea-Medelliacuten ME Fuentes AF Gorokhovsky A Escalante-Garciacutea JI (2015) Early 734 and late hydration of supersulphated cements of blast furnace slag with fluorgypsum 735 Materiales de Construccion 65e043 httpsdoiorg103989mc201506013 736
12 Matschei T Bellmann F Stark J (2005) Hydration behaviour of sulphate-activated slag 737 cements Advances in Cement Research 17167ndash178 738
httpsdoiorg101680adcr2005174167 739
13 Richardson IG (2000) Nature of the hydration products in hardened cement pastes 740 Cement and Concrete Composites 2297ndash113 httpsdoiorg101016S0958-741 9465(99)00036-0 742
14 Baux C Phelipot-Mardeleacute A Lanos C et al (2013) PERFORMANCES OF SUPER 743 SULFATED CEMENTS In International Conference on Concrete Under Severe 744 Conditions pp 1857ndash1870 745
15 Annabelle Phelipot-Mardeleacute Gabriel Samson Christophe Lanos (2015) Super sulfated 746 cement formulation and uses In Construction Materials ConMat Whistler Canada 747
16 Milestone NB (2006) Reactions in cement encapsulated nuclear wastes need for 748 toolbox of different cement types Advances in Applied Ceramics 10513ndash20 749
httpsdoiorg101179174367606X81678 750
17 Batchelor B (2006) Overview of waste stabilization with cement Waste Management 751
26689ndash698 httpsdoiorg101016JWASMAN200601020 752
18 Zhang T Cheeseman CR Vandeperre LJ (2011) Development of low pH cement 753
systems forming magnesium silicate hydrate (MSH) Cement and Concrete Research 754 41439ndash442 httpsdoiorg101016jcemconres201101016 755
19 Mobasher N Bernal SA Provis JL (2016) Structural evolution of an alkali sulfate 756
activated slag cement Journal of Nuclear Materials 46897ndash104 757 httpsdoiorg101016JJNUCMAT201511016 758
20 Wang J Yu B Gao Y (2014) Hydration Characteristics of Super Sulphated Cement 759 with Different Fineness In Proceedings of the International Conference on Material 760 and Environmental Engineering (ICMAEE 2014) Atlantis Press Paris France 761
21 Naumlgele E (1986) The Zeta-potential of cement Part II Effect of pH-value Cement and 762 Concrete Research 16853ndash863 httpsdoiorg1010160008-8846(86)90008-6 763
22 Jain N Civil MG-IJ of M and 2015 U (2015) Formulation of Sulphate Resistant Super 764 Sulphated Cement Using Fluorogypsum and Granulated Blast Furnace Slag IOSR 765
Journal of Mechanical and Civil Engineering (IOSR-JMCE) 12153ndash159 766
23 Gao YX Yu BY Xu FL (2012) Effect of Modified Phosphogypsum on the Mechanical 767 Properties of Super Sulphate Cement Applied Mechanics and Materials 161264ndash268 768 httpsdoiorg104028wwwscientificnetAMM161264 769
24 Kantro D (1980) Influence of Water-Reducing Admixtures on Properties of Cement 770 PasteampmdashA Miniature Slump Test Cement Concrete and Aggregates 295ndash102 771
httpsdoiorg101520CCA10190J 772
34
25 Svermova L Sonebi M Bartos PJM (2003) Influence of mix proportions on rheology of 773 cement grouts containing limestone powder Cement and Concrete Composites 25737ndash774 749 httpsdoiorg101016S0958-9465(02)00115-4 775
26 Sonebi M (2006) Rheological properties of grouts with viscosity modifying agents as 776 diutan gum and welan gum incorporating pulverised fly ash Cement and Concrete 777
Research 361609ndash1618 httpsdoiorg101016JCEMCONRES200605016 778
27 Nehdi M Rahman M (2004) Effect of Geometry and Surface Friction of Test Accessory 779 on Oscillatory Rheological Properties of Cement Pastes ACI Materials Journal 780 101416ndash424 httpsdoiorg101435913428 781
28 Khayat KH Yahia A (1997) Effect of Welan Gum-High-Range Water Reducer 782 Combinations on Rheology of Cement Grout ACI Materials Journal 94365ndash372 783 httpsdoiorg1014359321 784
29 Lombardi G (1985) THE ROLE OF COHESION IN CEMENT GROUTING OF 785 ROCK In Proceedings of Fifteenth Congress on Large Dams International 786 Commission on Large Dams pp 235ndash261 787
30 Perrot A Rangeard D Picandet V Meacutelinge Y (2013) Hydro-mechanical properties of 788
fresh cement pastes containing polycarboxylate superplasticizer Cement and Concrete 789 Research 53221ndash228 httpsdoiorg101016JCEMCONRES201306015 790
31 Perrot A Lecompte T Khelifi H et al (2012) Yield stress and bleeding of fresh cement 791 pastes Cement and Concrete Research 42937ndash944 792
httpdxdoiorg101016jcemconres201203015 793
32 Sonebi M Perrot A (2019) Effect of mix proportions on rheology and permeability of 794 cement grouts containing viscosity modifying admixture Construction and Building 795
Materials 212687ndash697 httpsdoiorg101016jconbuildmat201904022 796
33 Picandet V Rangeard D Perrot A Lecompte T (2011) Permeability measurement of 797
fresh cement paste Cement and Concrete Research 41330ndash338 798 httpsdoiorg101016JCEMCONRES201011019 799
34 Perrot A Rangeard D (2017) Effects of mix design parameters on consolidation 800
behaviour of fresh cement-based materials Materials and Structures 50117 801 httpsdoiorg101617s11527-016-0988-0 802
35 Rangeard D Perrot A Picandet V et al (2015) Determination of the consolidation 803 coefficient of low compressibility materials application to fresh cement-based 804
materials Materials and Structures 481475ndash1483 httpsdoiorg101617s11527-014-805 0247-1 806
36 Massoussi N Keita E Roussel N (2017) The heterogeneous nature of bleeding in 807 cement pastes Cement and Concrete Research 95108ndash116 808 httpsdoiorg101016JCEMCONRES201702012 809
37 Montgomery D (2007) Design and Analysis of Experiments Second Edition John 810
Wiley amp Sons 811
35
38 Roussel N Stefani C Leroy R (2005) From mini-cone test to Abrams cone test 812 Measurement of cement-based materials yield stress using slump tests Cement and 813 Concrete Research 35817ndash822 httpsdoiorg101016jcemconres200407032 814
39 Mangat PS Khatib JM Wright L (2006) Optimum utilisation of FGD waste in blended 815 binders Proceedings of Institution of Civil Engineers Construction Materials 159119ndash816
127 httpsdoiorg101680coma20061593119 817
40 Khatib JM Mangat PS Wright L (2013) Early age porosity and pore size distribution of 818 cement paste with flue gas desulphurisation (FGD) waste Journal of Civil Engineering 819 and Management 19622ndash627 httpsdoiorg103846139237302013793609 820
41 Collier NC Milestone NB Gordon LE Ko SC (2014) The suitability of a supersulfated 821 cement for nuclear waste immobilisation Journal of Nuclear Materials 452457ndash464 822 httpsdoiorg101016jjnucmat201405078 823
42 Masoudi R (2018) Examining compositions hydration mechanisms and properties of 824 supersulfated cement for use in concrete by Examining compositions hydration 825 mechanisms and properties of supersulfated cement for use in concrete University of 826 Toronto 827
828
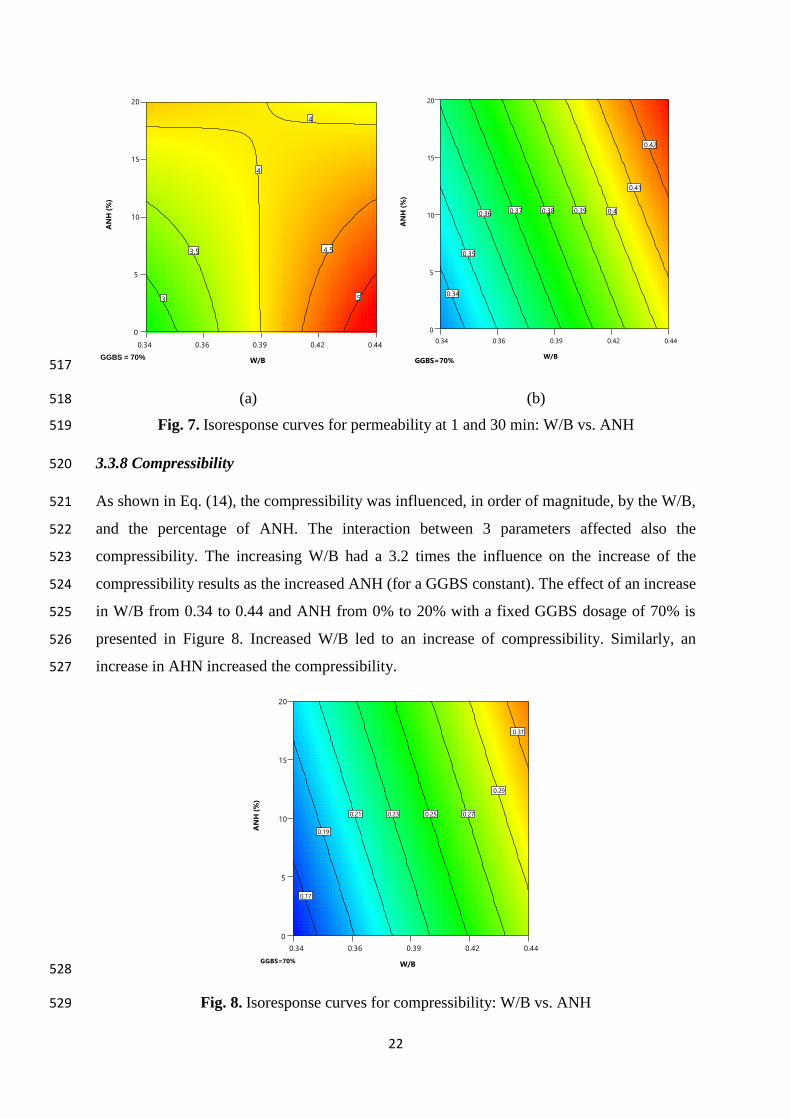
22
517
(a) (b) 518
Fig 7 Isoresponse curves for permeability at 1 and 30 min WB vs ANH 519
338 Compressibility 520
As shown in Eq (14) the compressibility was influenced in order of magnitude by the WB 521
and the percentage of ANH The interaction between 3 parameters affected also the 522
compressibility The increasing WB had a 32 times the influence on the increase of the 523
compressibility results as the increased ANH (for a GGBS constant) The effect of an increase 524
in WB from 034 to 044 and ANH from 0 to 20 with a fixed GGBS dosage of 70 is 525
presented in Figure 8 Increased WB led to an increase of compressibility Similarly an 526
increase in AHN increased the compressibility 527
528
Fig 8 Isoresponse curves for compressibility WB vs ANH 529
034 036 039 042 044
0
5
10
15
20
GGBS = 70 WB
AN
H (
)
3
35
4
4
45
5
034 036 039 042 044
0
5
10
15
20
WB
AN
H (
)
034
035
036 037 038 039 04
041
042
4
GGBS=70
034 036 039 042 044
0
5
10
15
20
WB
AN
H (
)
017
019
021 023 025 027
029
031
GGBS=70
23
530
339 Compressive strength 531
After one day from Eq 15 the influencing factors in order of significance are WB ratio 532
anhydrite content GGBS content and the interaction of WB and ANH The effect of the first 533
three was similar but WB had 11 times greater effect than anhydrite and 125 times greater 534
effect than GGBS While the interaction of WB and anhydrite had around a third of the 535
influence of WB Figures 9 (a) and (b) show the isoresponses for 1-day compressive strength 536
From Figure 9 (a) it can be seen when the GGBS content is fixed at 70 for a given anhydrite 537
content increasing the WB ratio will decrease the strength Also if a WB ratio is selected and 538
the anhydrite is increased similarly the strength will decrease From Figure 9 (b) with the WB 539
ratio fixed at 039 once again an increase in GGBS led to a reduction of compressive strength 540
at 1 day 541
542
(a) (b) 543
Fig9 Isoresponse curves for compressive strength at 1d (a) (WB vs ANH) and (b) (GGBS 544 vs ANH) 545
Eqs 16 17 and 18 show the effect of GGBS and ANH percentages on compressive strength at 546
3-d 7-d and 28-d Figures 10 11 and 12 show the isoresponse of the compressive strength at 547
3-d 7-d and 28-d respectively with WB vs ANH Increased ANH led to a decrease of 3-d 548
and 7-d compressive strength As expected an Increase in WB led to a decrease in compressive 549
strength The percentage of ANH had a negative effect on compressive strength and showed a 550
greater influence particularly at 3-d and 7-d (879 (3 d) amp 924 (7d) vs 382 (28 d)) GGBS has 551
a negative impact on early strength development The negative effect of GGBS on compressive 552
GGBS = 70
034 037 039 042 0440
5
10
15
20
WB
AN
H(
)
12
14
16
18
20
22
2426
WB = 039
60 65 70 75 800
5
10
15
20
GGBS ()
AN
H(
)
10
12
14
16
18
20
22
24
strength at early ages is clearly attributable to the fact that up to 80 of cement has been 553
replaced by GGBS and it takes some time for GGBS to start developing its pozzolanic action 554
at a noticeable level The results indicate that ANH content influences strength to a greater 555
extent than GGBS at all ages The SO3 content was reported to have great influence on the 556
strength [39 40] 557
558
(a) (b) 559
Fig10 Isoresponse curves for compressive strength at 3d (a) (WB vs ANH) and (b) 560 (GGBS vs ANH) 561
562
563
(a) (b) 564
Fig11 Isoresponse curves for compressive strength at 7d (a) (WB vs ANH) and (b) (WB 565 vs ANH) 566
567
GGBS = 70
034 036 039 042 0440
5
10
15
20
WB
AN
H (
)
24
2628
30
3234
3638
4042
WB = 039
60 65 70 75 80
0
5
10
15
20
GGBS ()
AN
H (
)
2426
2830
32
34
36
3840
42
GGBS = 70
034 037 039 042 044
0
5
10
15
20
WB
AN
H(
)
3032
34
3638
40
42
44
46
48
WB = 039
60 65 70 75 80
0
5
10
15
20
GGBS ()
AN
H(
)
32
34
36
38
40
42
44
46
48
25
568
(a) (b) 569
Fig12 Isoresponse curves for compressive strength at 28d (a) (WB vs ANH) and (b) 570
(ANH vs GGBS) 571
3310 Discussion of the effect of WB GGBS and ANH 572
As expected the increase of WB led to an increase in mini-slump induced bleeding and a 573
reduction in flow time plate cohesion yield stress plastic viscosity and compressive strengths 574
This can be attributed to more water in the system 575
An increase in GGBS content resulted in a reduction of the flow time plate cohesion yield 576
stress and plastic viscosity while the fluidity is improved This was due to the fact the specific 577
gravity of slag is lower than that of PC leading to an increase in the paste volume and thus 578
improving the fluidity of paste 579
In case of an increase of ANH proportion while WB and GGBS were kept constant it led to 580
an increased mini-slump and induced bleeding while the flow time plate cohesion yield stress 581
and plastic viscosity were reduced This was due to the lower reactivity of ANH resulting in an 582
increase of water needed for lubrication of paste 583
As expected an increase in WB lead to an increase in induced bleeding permeability and a 584
decrease in compressibility [33 35] This is due to the increase in liquid volume between the 585
particles and to the reduction in the amount of interparticle forces Globally the compressibility 586
decreases and the permeability increases with ANH It can be explained by the reduced specific 587
area and lower reactivity that can lead to more available water in the samples 588
3311 Heat of Hydration 589
Heat of hydration is considered an important factor in the cement design as low heat of 590
hydration reduces the effect of thermal cracking The heat flow results of the calorimeter test 591
performed over a three days period can be seen in Figure 13 592
GGBS = 70
034 036 039 042 0440
5
10
15
20
WB
AN
H (
)
46
48
50
52
54
56
58
60
WB = 039
0 5 10 15 2060
65
70
75
80
ANH ()
GG
BS
(
)
50
52
54
56
5860
62
26
593
Fig 13 Heat flow graphs for first 3 days of reaction 594
Figure 13 presents that the largest peaks were in mixes 1 2 5 and 6 This shows that these 595
reactions generated the most heat and that they were quick Mixes 1 and 2 have the highest 596
OPC content at 40 and this suggests that to lower the heat of the reaction minimal OPC 597
should be used This is confirmed by the fact that mixes 5 and 6 have the next highest OPC 598
contents the same percentage as mixes 3 4 and 9 (one of the repeated mixes) which have 599
anhydrite present This implies that the presence of anhydrite will lengthen the reaction process 600
and reduce the heat produced during setting significantly The graph shows this by the absence 601
of a sharp peak instead a gentle curved hump is shown over a 2-day period whereas the mixes 602
showing a sharp peak occur after about 12 hrs Mix 7 which has the same solids content as 603
mix 8 but a lower WB ratio and no cement present showed the lowest heat flow during the 604
hydration process 605
Figure 14 shows the cumulative heat generation during the first 3 days of setting It is clear that 606
the two mixes (1 and 2) with highest cement content and absence of anhydrite had the highest 607
cumulative heat development over the 3-day period 643J and 594J respectively Mixes 3456 608
and 9 which all have 20 OPC content generated similar heat value over the 3 days Results 609
of mixes containing ANH implies that over the period that the anhydrite did not reduce the 610
cumulative heat generated but slowed the reaction and reduce the peak heat generated The 611
0
0002
0004
0006
0008
001
0012
0 50000 100000 150000 200000 250000 300000
He
at F
low
(mW
)
Time s()
M1
M2
M3
M4
M5
M6
M7
M9
1Day
2Day
3day
1d 2d 3d
27
graphs also suggest that a higher WB ratio produced a lower cumulative and peak heat 612
generation613
614
Fig 14 Cumulative heat generation curves for first 3 days 615
3312 pH measurements 616
Fig 15 summarises the results of pH and the nine mixes with different compositions of WB 617
the percentages of cement GGBS and ANH It is shown that Supersulfated cements (SSCs) 618
have lower pH values (lt 125 at all ages) than PC which has a pH of 139 [41] making SSC 619
more preferable in essential applications such as nuclear waste encapsulation 620
The figure shows that the pH value decreased with time for all samples between 1 and 7 days 621
Similar trend was observed in the majority of mixes between 7 and 28 days except for sample 622
2 5 and 9 which showed slight increase in the pH values This decrease refers to the 623
consumption of ions in the pore structure due to the hydration process 624
0
100
200
300
400
500
600
700
800
0 50000 100000 150000 200000 250000 300000
(J)
Time (s)
M1
M2
M3
M4
M5
M6
M7
M9
1 Day
3 Day
2 day
1d 2d 3d
1
2
3
9
45
6
7
28
625
626 Fig 15 Summary of pore solution pH 627
628
The incorporation of ANH replacing the Portland cement (C) results in remarkable decrease in 629
pH at all ages as introducing the ANH reduced the lower initial pH Likewise the increase in 630
the content of GGBS led to a decrease in the pH value of the pore structure as GGBS has lower 631
initial pH than Portland cement The increase of WB ratio decreased the pH value This is in 632
agreement with Collier [41] who found that increasing the wb ratio from 05 to 06 increased 633
the pH by I unit This was attributed to the increased availability of water in the case of WB 634
of 06 allowing hydration of more cement powder thereby releasing more hydroxide anions 635
into solution However in this study the WB ratio did not show a significant effect on 636
lowering the pH These results are in agreement with [42] which also found that decreasing the 637
pH improved the bulk resistivity of SSC mixtures 638
3313 SEM 639
Figure 16 shows the SEM images of some mixes at various magnifications The images clearly 640
show the dense and compact structure of the cement after seven days The dense structure was 641
another requirement from the cement chosen to enclose the waste to prevent leaching The 642
microstructure consists mainly of C-S-H the main hydration product and unhydrated slag 643
grains C-S-H is formed after the dissolution of slag grains when contacting the water and 644
alkalis and then the ionic species saturate the solution and then precipitate as hydrated phases 645
[8] There were abundant grains of hydrated and partially hydrated slag grains some small 646
1080
1100
1120
1140
1160
1180
1200
1220
1240
1260
1280
1 2 3 4 5 6 7 8 9
pH
val
ue
Mix Number
1 Day
7 Days
28 Days
29
GGBS particles presented rims of reaction products (eg Mix 6-Figure 16 (f) and Mix 9-Figure 647
16 (h)) It was found by [11] that the composition of the reaction rims around slag was similar 648
to that of the C-S-H from PC However [12] found that in the CndashSndashH of SSC is apparently 649
more foil like which is different than the fibrillar morphology of C-S-H in OPC Mix 3 and 650
Mix 4 (Figure 16 (c) and (d) respectively) exhibits more micro voids in the micrsostructure 651
which could explain the low strength of these mixes compared to mix 1 and 2 Ettringite was 652
not detected Ettringite is not the most abundant phase and it is not easy to detect in dried 653
polished samples because it is easily decomposed under the drying conditions of the vacuum 654
of the microscope column [11] 655
(a) Mix 1 image at 1100 magnification (b) Mix 2 image at 900 magnification
(c) Particle of unreacted slag mix3 7 days (d) An overall image of mix 4 at 7days
showing CSH and BFS particles
30
(e) Mix 5 image at 1100 magnification (f) Mix 6 image at 2300 magnification
(g) Mix 7 image at 2000 magnification (h) Mix 9 image at 2700 magnification
Fig 16 SEM results 656
4 Conclusions 657
The paper focused on optimizing the SSC cement grout in order to get the best of it The effect 658
of GGBS WB and ANH dosages on the grout fluidity rheological properties induced 659
bleeding maximum heat of hydration and compressive strength was investigated using 660
factorial design approach and analysis The models derived in this study are valid for the 661
experimental area corresponding to grout mixes made with variable levels of WB ANH and 662
GGBS in the ranges of 034 to 044 0 to 20 by mass of binder 60 to 80 by mass of 663
binder respectively Based on the results from this study the following conclusions are drawn 664
- In comparison to GGBS and ANH WB ratio had more pronounced effects on the 665
results of mini-slump plate cohesion meter Marsh cone time yield stress plastic viscosity 666
induced bleeding permeability compressibility and compressive strength 667
31
- The increase in the dosage of GGBS led to an increase in the values of plate cohesion 668
meter Marsh cone time yield stress and plastic viscosity while reducing the mini-slump 669
values maximum hydration and compressive strength This is ascribed to the fine nature 670
of GGBS particles and pozzolanic effect 671
- While the ANH particles caused a decrease in the maximum of heat of hydration it 672
increased the induced bleeding permeability and compressibility due to its dominant effect 673
on increasing the dormant period and increasing the rates of solid sedimentation and 674
induced bleeding water 675
- Increasing the dosage of ANH in grout reduced the hydrations kinetic at early-age and 676
thus reduced the compressive strength at 1d 3d and 7d However this effect diminished 677
at later ages at 28 d in a manner similar to increasing WB 678
- The increase in the dosage of ANH led to an increase in the mini-slump values 679
(fluidity) but a decrease in the values of yield stress plastic viscosity plate cohesion and 680
Marsh cone time This is attributed to better deflocculation of particles at the fresh state 681
- The increase of GGBS percentage delayed the reaction process and decreased the total 682
heat after 3 days while WB slightly reduced the total heat it didnrsquot significantly affect the 683
reaction process 684
- pH measurements in the present study confirmed the suitability of these mixture to low-685
pH applications as the increase in both the GGBS and ANH markedly decreased the initial 686
pH thereby lowering the pH at different ages 687
- The modelling and prediction of the response of other points in the experimental domain 688
were therefore possible Although the models are based on a given set of materials they 689
can be easily used to generate future results using other materials 690
- Dense microstructure was observed for mixes examined in this study C-S-H is the main 691
reaction product with presence of unreacted slag grains embedded well in the structure 692
However some micro voids were observed in mixes containing ANH which led to lower 693
compressive strength of mixes with ANH 694
CRediT authorship contribution statement 695
MSonebi and YBai did the conceptualization and the design of investigation as well as 696 performing the experiments MSonebi carried out the software analysis of the results and the 697
32
visualization MSonebi AAbdalqader T Fayyad and APerrot analysed the results and 698 wrote the original draft and reviewed and edited the final version 699
Declaration of Competing Interest 700
The authors declare that they have no known competing financial interests or personal 701 relationships that could have appeared to influence the work reported in this paper 702
Acknowledgments 703
The authors would like to express their gratitude to P McCann from QUB and N Collier 704 from Eden Nuclear and Environment Ltd for their helps for some experiments 705
706
References 707
1 Schneider M Romer M Tschudin M Bolio H (2011) Sustainable cement production-708 present and future Cement and Concrete Research 41642ndash650 709
httpsdoiorg101016jcemconres201103019 710
2 Madlool NA Saidur R Hossain MS Rahim NA (2011) A critical review on energy use 711 and savings in the cement industries Renewable and Sustainable Energy Reviews 712
152042ndash2060 httpsdoiorg101016jrser201101005 713
3 EN15743 (2015) BS EN 157432010+A12015 Supersulfated cement - Composition 714
specifications and conformity criteria BSI 715
4 Khatib JM Wright L Mangat PS (2016) Mechanical and physical properties of concrete 716
containing FGD waste Magazine of Concrete Research 68550ndash560 717 httpsdoiorg101680macr1500092 718
5 Khatib JM Mangat PS Wright L (2008) Sulfate resistance of mortar containing 719
simulated FGD waste Proceedings of Institution of Civil Engineers Construction 720 Materials 161119ndash128 httpsdoiorg101680coma20081613119 721
6 (2020) Specifying Sustainable Concrete 722
7 Hewlett PC (2004) Learsquos Chemistry of Cement and Concrete fourth edi Elsevier 723 Science amp Technology Books Oxford 724
8 Gruskovnjak A Lothenbach B Winnefeld F et al (2008) Hydration mechanisms of 725 super sulphated slag cement Cement and Concrete Research 38983ndash992 726
httpsdoiorg101016jcemconres200803004 727
9 Grounds T Nowell D V Wilburn FW (2003) Resistance of supersulfated cement to 728 strong sulfate solutions Journal of Thermal Analysis and Calorimetry 72181ndash190 729
httpsdoiorg101023A1023928021602 730
10 Grounds T Nowell D V Wilburn FW (1995) The influence of temperature and 731
different storage conditions on the stability of supersulphated cement Journal of 732 Thermal Analysis 45385ndash394 httpsdoiorg101007BF02548772 733
33
11 Bazalduacutea-Medelliacuten ME Fuentes AF Gorokhovsky A Escalante-Garciacutea JI (2015) Early 734 and late hydration of supersulphated cements of blast furnace slag with fluorgypsum 735 Materiales de Construccion 65e043 httpsdoiorg103989mc201506013 736
12 Matschei T Bellmann F Stark J (2005) Hydration behaviour of sulphate-activated slag 737 cements Advances in Cement Research 17167ndash178 738
httpsdoiorg101680adcr2005174167 739
13 Richardson IG (2000) Nature of the hydration products in hardened cement pastes 740 Cement and Concrete Composites 2297ndash113 httpsdoiorg101016S0958-741 9465(99)00036-0 742
14 Baux C Phelipot-Mardeleacute A Lanos C et al (2013) PERFORMANCES OF SUPER 743 SULFATED CEMENTS In International Conference on Concrete Under Severe 744 Conditions pp 1857ndash1870 745
15 Annabelle Phelipot-Mardeleacute Gabriel Samson Christophe Lanos (2015) Super sulfated 746 cement formulation and uses In Construction Materials ConMat Whistler Canada 747
16 Milestone NB (2006) Reactions in cement encapsulated nuclear wastes need for 748 toolbox of different cement types Advances in Applied Ceramics 10513ndash20 749
httpsdoiorg101179174367606X81678 750
17 Batchelor B (2006) Overview of waste stabilization with cement Waste Management 751
26689ndash698 httpsdoiorg101016JWASMAN200601020 752
18 Zhang T Cheeseman CR Vandeperre LJ (2011) Development of low pH cement 753
systems forming magnesium silicate hydrate (MSH) Cement and Concrete Research 754 41439ndash442 httpsdoiorg101016jcemconres201101016 755
19 Mobasher N Bernal SA Provis JL (2016) Structural evolution of an alkali sulfate 756
activated slag cement Journal of Nuclear Materials 46897ndash104 757 httpsdoiorg101016JJNUCMAT201511016 758
20 Wang J Yu B Gao Y (2014) Hydration Characteristics of Super Sulphated Cement 759 with Different Fineness In Proceedings of the International Conference on Material 760 and Environmental Engineering (ICMAEE 2014) Atlantis Press Paris France 761
21 Naumlgele E (1986) The Zeta-potential of cement Part II Effect of pH-value Cement and 762 Concrete Research 16853ndash863 httpsdoiorg1010160008-8846(86)90008-6 763
22 Jain N Civil MG-IJ of M and 2015 U (2015) Formulation of Sulphate Resistant Super 764 Sulphated Cement Using Fluorogypsum and Granulated Blast Furnace Slag IOSR 765
Journal of Mechanical and Civil Engineering (IOSR-JMCE) 12153ndash159 766
23 Gao YX Yu BY Xu FL (2012) Effect of Modified Phosphogypsum on the Mechanical 767 Properties of Super Sulphate Cement Applied Mechanics and Materials 161264ndash268 768 httpsdoiorg104028wwwscientificnetAMM161264 769
24 Kantro D (1980) Influence of Water-Reducing Admixtures on Properties of Cement 770 PasteampmdashA Miniature Slump Test Cement Concrete and Aggregates 295ndash102 771
httpsdoiorg101520CCA10190J 772
34
25 Svermova L Sonebi M Bartos PJM (2003) Influence of mix proportions on rheology of 773 cement grouts containing limestone powder Cement and Concrete Composites 25737ndash774 749 httpsdoiorg101016S0958-9465(02)00115-4 775
26 Sonebi M (2006) Rheological properties of grouts with viscosity modifying agents as 776 diutan gum and welan gum incorporating pulverised fly ash Cement and Concrete 777
Research 361609ndash1618 httpsdoiorg101016JCEMCONRES200605016 778
27 Nehdi M Rahman M (2004) Effect of Geometry and Surface Friction of Test Accessory 779 on Oscillatory Rheological Properties of Cement Pastes ACI Materials Journal 780 101416ndash424 httpsdoiorg101435913428 781
28 Khayat KH Yahia A (1997) Effect of Welan Gum-High-Range Water Reducer 782 Combinations on Rheology of Cement Grout ACI Materials Journal 94365ndash372 783 httpsdoiorg1014359321 784
29 Lombardi G (1985) THE ROLE OF COHESION IN CEMENT GROUTING OF 785 ROCK In Proceedings of Fifteenth Congress on Large Dams International 786 Commission on Large Dams pp 235ndash261 787
30 Perrot A Rangeard D Picandet V Meacutelinge Y (2013) Hydro-mechanical properties of 788
fresh cement pastes containing polycarboxylate superplasticizer Cement and Concrete 789 Research 53221ndash228 httpsdoiorg101016JCEMCONRES201306015 790
31 Perrot A Lecompte T Khelifi H et al (2012) Yield stress and bleeding of fresh cement 791 pastes Cement and Concrete Research 42937ndash944 792
httpdxdoiorg101016jcemconres201203015 793
32 Sonebi M Perrot A (2019) Effect of mix proportions on rheology and permeability of 794 cement grouts containing viscosity modifying admixture Construction and Building 795
Materials 212687ndash697 httpsdoiorg101016jconbuildmat201904022 796
33 Picandet V Rangeard D Perrot A Lecompte T (2011) Permeability measurement of 797
fresh cement paste Cement and Concrete Research 41330ndash338 798 httpsdoiorg101016JCEMCONRES201011019 799
34 Perrot A Rangeard D (2017) Effects of mix design parameters on consolidation 800
behaviour of fresh cement-based materials Materials and Structures 50117 801 httpsdoiorg101617s11527-016-0988-0 802
35 Rangeard D Perrot A Picandet V et al (2015) Determination of the consolidation 803 coefficient of low compressibility materials application to fresh cement-based 804
materials Materials and Structures 481475ndash1483 httpsdoiorg101617s11527-014-805 0247-1 806
36 Massoussi N Keita E Roussel N (2017) The heterogeneous nature of bleeding in 807 cement pastes Cement and Concrete Research 95108ndash116 808 httpsdoiorg101016JCEMCONRES201702012 809
37 Montgomery D (2007) Design and Analysis of Experiments Second Edition John 810
Wiley amp Sons 811
35
38 Roussel N Stefani C Leroy R (2005) From mini-cone test to Abrams cone test 812 Measurement of cement-based materials yield stress using slump tests Cement and 813 Concrete Research 35817ndash822 httpsdoiorg101016jcemconres200407032 814
39 Mangat PS Khatib JM Wright L (2006) Optimum utilisation of FGD waste in blended 815 binders Proceedings of Institution of Civil Engineers Construction Materials 159119ndash816
127 httpsdoiorg101680coma20061593119 817
40 Khatib JM Mangat PS Wright L (2013) Early age porosity and pore size distribution of 818 cement paste with flue gas desulphurisation (FGD) waste Journal of Civil Engineering 819 and Management 19622ndash627 httpsdoiorg103846139237302013793609 820
41 Collier NC Milestone NB Gordon LE Ko SC (2014) The suitability of a supersulfated 821 cement for nuclear waste immobilisation Journal of Nuclear Materials 452457ndash464 822 httpsdoiorg101016jjnucmat201405078 823
42 Masoudi R (2018) Examining compositions hydration mechanisms and properties of 824 supersulfated cement for use in concrete by Examining compositions hydration 825 mechanisms and properties of supersulfated cement for use in concrete University of 826 Toronto 827
828
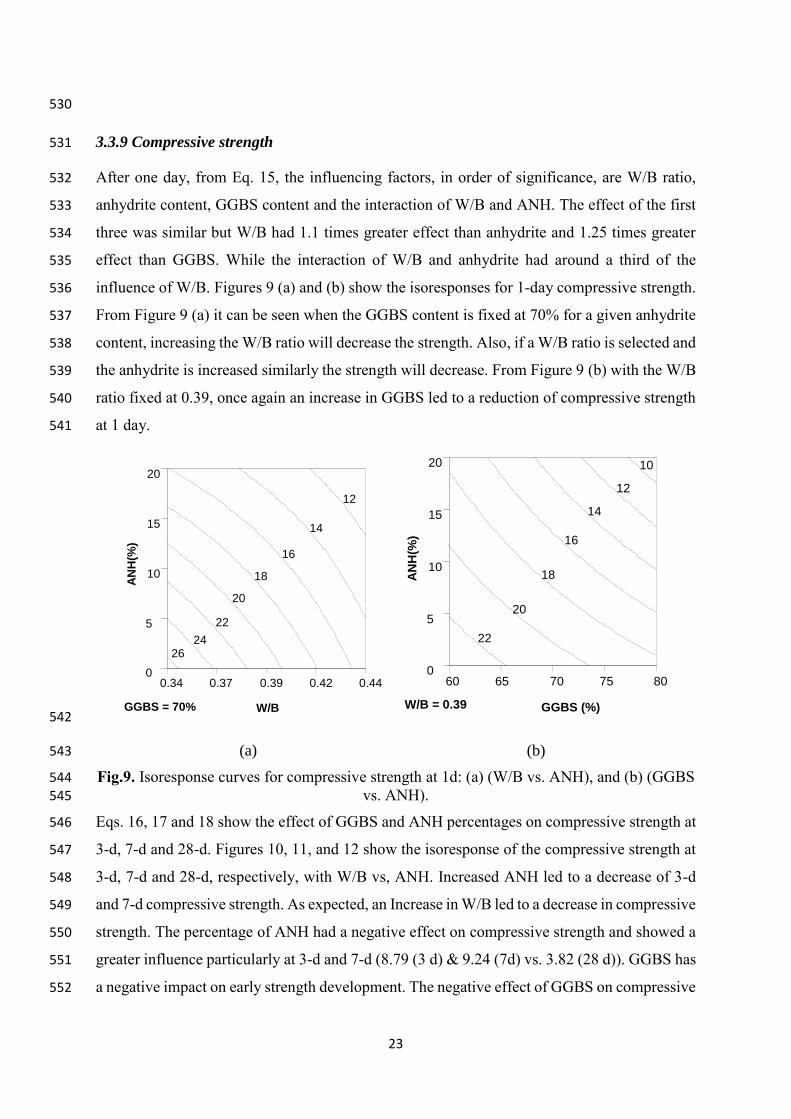
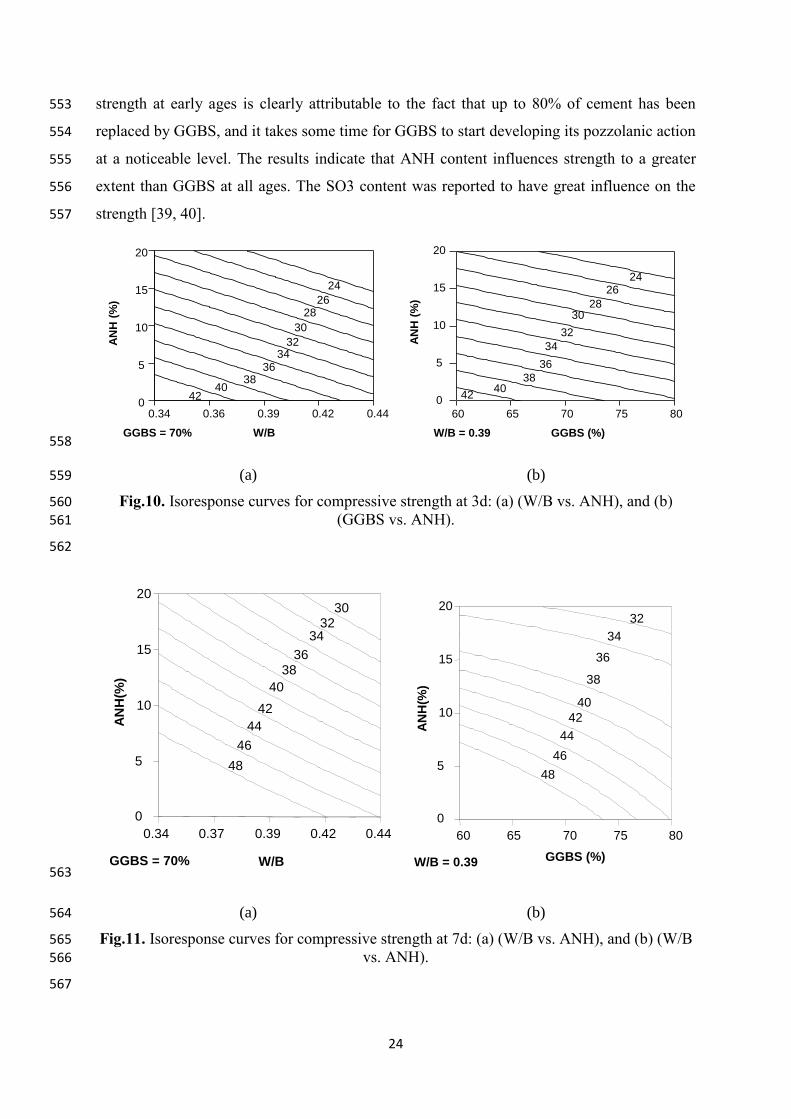
24
strength at early ages is clearly attributable to the fact that up to 80 of cement has been 553
replaced by GGBS and it takes some time for GGBS to start developing its pozzolanic action 554
at a noticeable level The results indicate that ANH content influences strength to a greater 555
extent than GGBS at all ages The SO3 content was reported to have great influence on the 556
strength [39 40] 557
558
(a) (b) 559
Fig10 Isoresponse curves for compressive strength at 3d (a) (WB vs ANH) and (b) 560 (GGBS vs ANH) 561
562
563
(a) (b) 564
Fig11 Isoresponse curves for compressive strength at 7d (a) (WB vs ANH) and (b) (WB 565 vs ANH) 566
567
GGBS = 70
034 036 039 042 0440
5
10
15
20
WB
AN
H (
)
24
2628
30
3234
3638
4042
WB = 039
60 65 70 75 80
0
5
10
15
20
GGBS ()
AN
H (
)
2426
2830
32
34
36
3840
42
GGBS = 70
034 037 039 042 044
0
5
10
15
20
WB
AN
H(
)
3032
34
3638
40
42
44
46
48
WB = 039
60 65 70 75 80
0
5
10
15
20
GGBS ()
AN
H(
)
32
34
36
38
40
42
44
46
48
25
568
(a) (b) 569
Fig12 Isoresponse curves for compressive strength at 28d (a) (WB vs ANH) and (b) 570
(ANH vs GGBS) 571
3310 Discussion of the effect of WB GGBS and ANH 572
As expected the increase of WB led to an increase in mini-slump induced bleeding and a 573
reduction in flow time plate cohesion yield stress plastic viscosity and compressive strengths 574
This can be attributed to more water in the system 575
An increase in GGBS content resulted in a reduction of the flow time plate cohesion yield 576
stress and plastic viscosity while the fluidity is improved This was due to the fact the specific 577
gravity of slag is lower than that of PC leading to an increase in the paste volume and thus 578
improving the fluidity of paste 579
In case of an increase of ANH proportion while WB and GGBS were kept constant it led to 580
an increased mini-slump and induced bleeding while the flow time plate cohesion yield stress 581
and plastic viscosity were reduced This was due to the lower reactivity of ANH resulting in an 582
increase of water needed for lubrication of paste 583
As expected an increase in WB lead to an increase in induced bleeding permeability and a 584
decrease in compressibility [33 35] This is due to the increase in liquid volume between the 585
particles and to the reduction in the amount of interparticle forces Globally the compressibility 586
decreases and the permeability increases with ANH It can be explained by the reduced specific 587
area and lower reactivity that can lead to more available water in the samples 588
3311 Heat of Hydration 589
Heat of hydration is considered an important factor in the cement design as low heat of 590
hydration reduces the effect of thermal cracking The heat flow results of the calorimeter test 591
performed over a three days period can be seen in Figure 13 592
GGBS = 70
034 036 039 042 0440
5
10
15
20
WB
AN
H (
)
46
48
50
52
54
56
58
60
WB = 039
0 5 10 15 2060
65
70
75
80
ANH ()
GG
BS
(
)
50
52
54
56
5860
62
26
593
Fig 13 Heat flow graphs for first 3 days of reaction 594
Figure 13 presents that the largest peaks were in mixes 1 2 5 and 6 This shows that these 595
reactions generated the most heat and that they were quick Mixes 1 and 2 have the highest 596
OPC content at 40 and this suggests that to lower the heat of the reaction minimal OPC 597
should be used This is confirmed by the fact that mixes 5 and 6 have the next highest OPC 598
contents the same percentage as mixes 3 4 and 9 (one of the repeated mixes) which have 599
anhydrite present This implies that the presence of anhydrite will lengthen the reaction process 600
and reduce the heat produced during setting significantly The graph shows this by the absence 601
of a sharp peak instead a gentle curved hump is shown over a 2-day period whereas the mixes 602
showing a sharp peak occur after about 12 hrs Mix 7 which has the same solids content as 603
mix 8 but a lower WB ratio and no cement present showed the lowest heat flow during the 604
hydration process 605
Figure 14 shows the cumulative heat generation during the first 3 days of setting It is clear that 606
the two mixes (1 and 2) with highest cement content and absence of anhydrite had the highest 607
cumulative heat development over the 3-day period 643J and 594J respectively Mixes 3456 608
and 9 which all have 20 OPC content generated similar heat value over the 3 days Results 609
of mixes containing ANH implies that over the period that the anhydrite did not reduce the 610
cumulative heat generated but slowed the reaction and reduce the peak heat generated The 611
0
0002
0004
0006
0008
001
0012
0 50000 100000 150000 200000 250000 300000
He
at F
low
(mW
)
Time s()
M1
M2
M3
M4
M5
M6
M7
M9
1Day
2Day
3day
1d 2d 3d
27
graphs also suggest that a higher WB ratio produced a lower cumulative and peak heat 612
generation613
614
Fig 14 Cumulative heat generation curves for first 3 days 615
3312 pH measurements 616
Fig 15 summarises the results of pH and the nine mixes with different compositions of WB 617
the percentages of cement GGBS and ANH It is shown that Supersulfated cements (SSCs) 618
have lower pH values (lt 125 at all ages) than PC which has a pH of 139 [41] making SSC 619
more preferable in essential applications such as nuclear waste encapsulation 620
The figure shows that the pH value decreased with time for all samples between 1 and 7 days 621
Similar trend was observed in the majority of mixes between 7 and 28 days except for sample 622
2 5 and 9 which showed slight increase in the pH values This decrease refers to the 623
consumption of ions in the pore structure due to the hydration process 624
0
100
200
300
400
500
600
700
800
0 50000 100000 150000 200000 250000 300000
(J)
Time (s)
M1
M2
M3
M4
M5
M6
M7
M9
1 Day
3 Day
2 day
1d 2d 3d
1
2
3
9
45
6
7
28
625
626 Fig 15 Summary of pore solution pH 627
628
The incorporation of ANH replacing the Portland cement (C) results in remarkable decrease in 629
pH at all ages as introducing the ANH reduced the lower initial pH Likewise the increase in 630
the content of GGBS led to a decrease in the pH value of the pore structure as GGBS has lower 631
initial pH than Portland cement The increase of WB ratio decreased the pH value This is in 632
agreement with Collier [41] who found that increasing the wb ratio from 05 to 06 increased 633
the pH by I unit This was attributed to the increased availability of water in the case of WB 634
of 06 allowing hydration of more cement powder thereby releasing more hydroxide anions 635
into solution However in this study the WB ratio did not show a significant effect on 636
lowering the pH These results are in agreement with [42] which also found that decreasing the 637
pH improved the bulk resistivity of SSC mixtures 638
3313 SEM 639
Figure 16 shows the SEM images of some mixes at various magnifications The images clearly 640
show the dense and compact structure of the cement after seven days The dense structure was 641
another requirement from the cement chosen to enclose the waste to prevent leaching The 642
microstructure consists mainly of C-S-H the main hydration product and unhydrated slag 643
grains C-S-H is formed after the dissolution of slag grains when contacting the water and 644
alkalis and then the ionic species saturate the solution and then precipitate as hydrated phases 645
[8] There were abundant grains of hydrated and partially hydrated slag grains some small 646
1080
1100
1120
1140
1160
1180
1200
1220
1240
1260
1280
1 2 3 4 5 6 7 8 9
pH
val
ue
Mix Number
1 Day
7 Days
28 Days
29
GGBS particles presented rims of reaction products (eg Mix 6-Figure 16 (f) and Mix 9-Figure 647
16 (h)) It was found by [11] that the composition of the reaction rims around slag was similar 648
to that of the C-S-H from PC However [12] found that in the CndashSndashH of SSC is apparently 649
more foil like which is different than the fibrillar morphology of C-S-H in OPC Mix 3 and 650
Mix 4 (Figure 16 (c) and (d) respectively) exhibits more micro voids in the micrsostructure 651
which could explain the low strength of these mixes compared to mix 1 and 2 Ettringite was 652
not detected Ettringite is not the most abundant phase and it is not easy to detect in dried 653
polished samples because it is easily decomposed under the drying conditions of the vacuum 654
of the microscope column [11] 655
(a) Mix 1 image at 1100 magnification (b) Mix 2 image at 900 magnification
(c) Particle of unreacted slag mix3 7 days (d) An overall image of mix 4 at 7days
showing CSH and BFS particles
30
(e) Mix 5 image at 1100 magnification (f) Mix 6 image at 2300 magnification
(g) Mix 7 image at 2000 magnification (h) Mix 9 image at 2700 magnification
Fig 16 SEM results 656
4 Conclusions 657
The paper focused on optimizing the SSC cement grout in order to get the best of it The effect 658
of GGBS WB and ANH dosages on the grout fluidity rheological properties induced 659
bleeding maximum heat of hydration and compressive strength was investigated using 660
factorial design approach and analysis The models derived in this study are valid for the 661
experimental area corresponding to grout mixes made with variable levels of WB ANH and 662
GGBS in the ranges of 034 to 044 0 to 20 by mass of binder 60 to 80 by mass of 663
binder respectively Based on the results from this study the following conclusions are drawn 664
- In comparison to GGBS and ANH WB ratio had more pronounced effects on the 665
results of mini-slump plate cohesion meter Marsh cone time yield stress plastic viscosity 666
induced bleeding permeability compressibility and compressive strength 667
31
- The increase in the dosage of GGBS led to an increase in the values of plate cohesion 668
meter Marsh cone time yield stress and plastic viscosity while reducing the mini-slump 669
values maximum hydration and compressive strength This is ascribed to the fine nature 670
of GGBS particles and pozzolanic effect 671
- While the ANH particles caused a decrease in the maximum of heat of hydration it 672
increased the induced bleeding permeability and compressibility due to its dominant effect 673
on increasing the dormant period and increasing the rates of solid sedimentation and 674
induced bleeding water 675
- Increasing the dosage of ANH in grout reduced the hydrations kinetic at early-age and 676
thus reduced the compressive strength at 1d 3d and 7d However this effect diminished 677
at later ages at 28 d in a manner similar to increasing WB 678
- The increase in the dosage of ANH led to an increase in the mini-slump values 679
(fluidity) but a decrease in the values of yield stress plastic viscosity plate cohesion and 680
Marsh cone time This is attributed to better deflocculation of particles at the fresh state 681
- The increase of GGBS percentage delayed the reaction process and decreased the total 682
heat after 3 days while WB slightly reduced the total heat it didnrsquot significantly affect the 683
reaction process 684
- pH measurements in the present study confirmed the suitability of these mixture to low-685
pH applications as the increase in both the GGBS and ANH markedly decreased the initial 686
pH thereby lowering the pH at different ages 687
- The modelling and prediction of the response of other points in the experimental domain 688
were therefore possible Although the models are based on a given set of materials they 689
can be easily used to generate future results using other materials 690
- Dense microstructure was observed for mixes examined in this study C-S-H is the main 691
reaction product with presence of unreacted slag grains embedded well in the structure 692
However some micro voids were observed in mixes containing ANH which led to lower 693
compressive strength of mixes with ANH 694
CRediT authorship contribution statement 695
MSonebi and YBai did the conceptualization and the design of investigation as well as 696 performing the experiments MSonebi carried out the software analysis of the results and the 697
32
visualization MSonebi AAbdalqader T Fayyad and APerrot analysed the results and 698 wrote the original draft and reviewed and edited the final version 699
Declaration of Competing Interest 700
The authors declare that they have no known competing financial interests or personal 701 relationships that could have appeared to influence the work reported in this paper 702
Acknowledgments 703
The authors would like to express their gratitude to P McCann from QUB and N Collier 704 from Eden Nuclear and Environment Ltd for their helps for some experiments 705
706
References 707
1 Schneider M Romer M Tschudin M Bolio H (2011) Sustainable cement production-708 present and future Cement and Concrete Research 41642ndash650 709
httpsdoiorg101016jcemconres201103019 710
2 Madlool NA Saidur R Hossain MS Rahim NA (2011) A critical review on energy use 711 and savings in the cement industries Renewable and Sustainable Energy Reviews 712
152042ndash2060 httpsdoiorg101016jrser201101005 713
3 EN15743 (2015) BS EN 157432010+A12015 Supersulfated cement - Composition 714
specifications and conformity criteria BSI 715
4 Khatib JM Wright L Mangat PS (2016) Mechanical and physical properties of concrete 716
containing FGD waste Magazine of Concrete Research 68550ndash560 717 httpsdoiorg101680macr1500092 718
5 Khatib JM Mangat PS Wright L (2008) Sulfate resistance of mortar containing 719
simulated FGD waste Proceedings of Institution of Civil Engineers Construction 720 Materials 161119ndash128 httpsdoiorg101680coma20081613119 721
6 (2020) Specifying Sustainable Concrete 722
7 Hewlett PC (2004) Learsquos Chemistry of Cement and Concrete fourth edi Elsevier 723 Science amp Technology Books Oxford 724
8 Gruskovnjak A Lothenbach B Winnefeld F et al (2008) Hydration mechanisms of 725 super sulphated slag cement Cement and Concrete Research 38983ndash992 726
httpsdoiorg101016jcemconres200803004 727
9 Grounds T Nowell D V Wilburn FW (2003) Resistance of supersulfated cement to 728 strong sulfate solutions Journal of Thermal Analysis and Calorimetry 72181ndash190 729
httpsdoiorg101023A1023928021602 730
10 Grounds T Nowell D V Wilburn FW (1995) The influence of temperature and 731
different storage conditions on the stability of supersulphated cement Journal of 732 Thermal Analysis 45385ndash394 httpsdoiorg101007BF02548772 733
33
11 Bazalduacutea-Medelliacuten ME Fuentes AF Gorokhovsky A Escalante-Garciacutea JI (2015) Early 734 and late hydration of supersulphated cements of blast furnace slag with fluorgypsum 735 Materiales de Construccion 65e043 httpsdoiorg103989mc201506013 736
12 Matschei T Bellmann F Stark J (2005) Hydration behaviour of sulphate-activated slag 737 cements Advances in Cement Research 17167ndash178 738
httpsdoiorg101680adcr2005174167 739
13 Richardson IG (2000) Nature of the hydration products in hardened cement pastes 740 Cement and Concrete Composites 2297ndash113 httpsdoiorg101016S0958-741 9465(99)00036-0 742
14 Baux C Phelipot-Mardeleacute A Lanos C et al (2013) PERFORMANCES OF SUPER 743 SULFATED CEMENTS In International Conference on Concrete Under Severe 744 Conditions pp 1857ndash1870 745
15 Annabelle Phelipot-Mardeleacute Gabriel Samson Christophe Lanos (2015) Super sulfated 746 cement formulation and uses In Construction Materials ConMat Whistler Canada 747
16 Milestone NB (2006) Reactions in cement encapsulated nuclear wastes need for 748 toolbox of different cement types Advances in Applied Ceramics 10513ndash20 749
httpsdoiorg101179174367606X81678 750
17 Batchelor B (2006) Overview of waste stabilization with cement Waste Management 751
26689ndash698 httpsdoiorg101016JWASMAN200601020 752
18 Zhang T Cheeseman CR Vandeperre LJ (2011) Development of low pH cement 753
systems forming magnesium silicate hydrate (MSH) Cement and Concrete Research 754 41439ndash442 httpsdoiorg101016jcemconres201101016 755
19 Mobasher N Bernal SA Provis JL (2016) Structural evolution of an alkali sulfate 756
activated slag cement Journal of Nuclear Materials 46897ndash104 757 httpsdoiorg101016JJNUCMAT201511016 758
20 Wang J Yu B Gao Y (2014) Hydration Characteristics of Super Sulphated Cement 759 with Different Fineness In Proceedings of the International Conference on Material 760 and Environmental Engineering (ICMAEE 2014) Atlantis Press Paris France 761
21 Naumlgele E (1986) The Zeta-potential of cement Part II Effect of pH-value Cement and 762 Concrete Research 16853ndash863 httpsdoiorg1010160008-8846(86)90008-6 763
22 Jain N Civil MG-IJ of M and 2015 U (2015) Formulation of Sulphate Resistant Super 764 Sulphated Cement Using Fluorogypsum and Granulated Blast Furnace Slag IOSR 765
Journal of Mechanical and Civil Engineering (IOSR-JMCE) 12153ndash159 766
23 Gao YX Yu BY Xu FL (2012) Effect of Modified Phosphogypsum on the Mechanical 767 Properties of Super Sulphate Cement Applied Mechanics and Materials 161264ndash268 768 httpsdoiorg104028wwwscientificnetAMM161264 769
24 Kantro D (1980) Influence of Water-Reducing Admixtures on Properties of Cement 770 PasteampmdashA Miniature Slump Test Cement Concrete and Aggregates 295ndash102 771
httpsdoiorg101520CCA10190J 772
34
25 Svermova L Sonebi M Bartos PJM (2003) Influence of mix proportions on rheology of 773 cement grouts containing limestone powder Cement and Concrete Composites 25737ndash774 749 httpsdoiorg101016S0958-9465(02)00115-4 775
26 Sonebi M (2006) Rheological properties of grouts with viscosity modifying agents as 776 diutan gum and welan gum incorporating pulverised fly ash Cement and Concrete 777
Research 361609ndash1618 httpsdoiorg101016JCEMCONRES200605016 778
27 Nehdi M Rahman M (2004) Effect of Geometry and Surface Friction of Test Accessory 779 on Oscillatory Rheological Properties of Cement Pastes ACI Materials Journal 780 101416ndash424 httpsdoiorg101435913428 781
28 Khayat KH Yahia A (1997) Effect of Welan Gum-High-Range Water Reducer 782 Combinations on Rheology of Cement Grout ACI Materials Journal 94365ndash372 783 httpsdoiorg1014359321 784
29 Lombardi G (1985) THE ROLE OF COHESION IN CEMENT GROUTING OF 785 ROCK In Proceedings of Fifteenth Congress on Large Dams International 786 Commission on Large Dams pp 235ndash261 787
30 Perrot A Rangeard D Picandet V Meacutelinge Y (2013) Hydro-mechanical properties of 788
fresh cement pastes containing polycarboxylate superplasticizer Cement and Concrete 789 Research 53221ndash228 httpsdoiorg101016JCEMCONRES201306015 790
31 Perrot A Lecompte T Khelifi H et al (2012) Yield stress and bleeding of fresh cement 791 pastes Cement and Concrete Research 42937ndash944 792
httpdxdoiorg101016jcemconres201203015 793
32 Sonebi M Perrot A (2019) Effect of mix proportions on rheology and permeability of 794 cement grouts containing viscosity modifying admixture Construction and Building 795
Materials 212687ndash697 httpsdoiorg101016jconbuildmat201904022 796
33 Picandet V Rangeard D Perrot A Lecompte T (2011) Permeability measurement of 797
fresh cement paste Cement and Concrete Research 41330ndash338 798 httpsdoiorg101016JCEMCONRES201011019 799
34 Perrot A Rangeard D (2017) Effects of mix design parameters on consolidation 800
behaviour of fresh cement-based materials Materials and Structures 50117 801 httpsdoiorg101617s11527-016-0988-0 802
35 Rangeard D Perrot A Picandet V et al (2015) Determination of the consolidation 803 coefficient of low compressibility materials application to fresh cement-based 804
materials Materials and Structures 481475ndash1483 httpsdoiorg101617s11527-014-805 0247-1 806
36 Massoussi N Keita E Roussel N (2017) The heterogeneous nature of bleeding in 807 cement pastes Cement and Concrete Research 95108ndash116 808 httpsdoiorg101016JCEMCONRES201702012 809
37 Montgomery D (2007) Design and Analysis of Experiments Second Edition John 810
Wiley amp Sons 811
35
38 Roussel N Stefani C Leroy R (2005) From mini-cone test to Abrams cone test 812 Measurement of cement-based materials yield stress using slump tests Cement and 813 Concrete Research 35817ndash822 httpsdoiorg101016jcemconres200407032 814
39 Mangat PS Khatib JM Wright L (2006) Optimum utilisation of FGD waste in blended 815 binders Proceedings of Institution of Civil Engineers Construction Materials 159119ndash816
127 httpsdoiorg101680coma20061593119 817
40 Khatib JM Mangat PS Wright L (2013) Early age porosity and pore size distribution of 818 cement paste with flue gas desulphurisation (FGD) waste Journal of Civil Engineering 819 and Management 19622ndash627 httpsdoiorg103846139237302013793609 820
41 Collier NC Milestone NB Gordon LE Ko SC (2014) The suitability of a supersulfated 821 cement for nuclear waste immobilisation Journal of Nuclear Materials 452457ndash464 822 httpsdoiorg101016jjnucmat201405078 823
42 Masoudi R (2018) Examining compositions hydration mechanisms and properties of 824 supersulfated cement for use in concrete by Examining compositions hydration 825 mechanisms and properties of supersulfated cement for use in concrete University of 826 Toronto 827
828
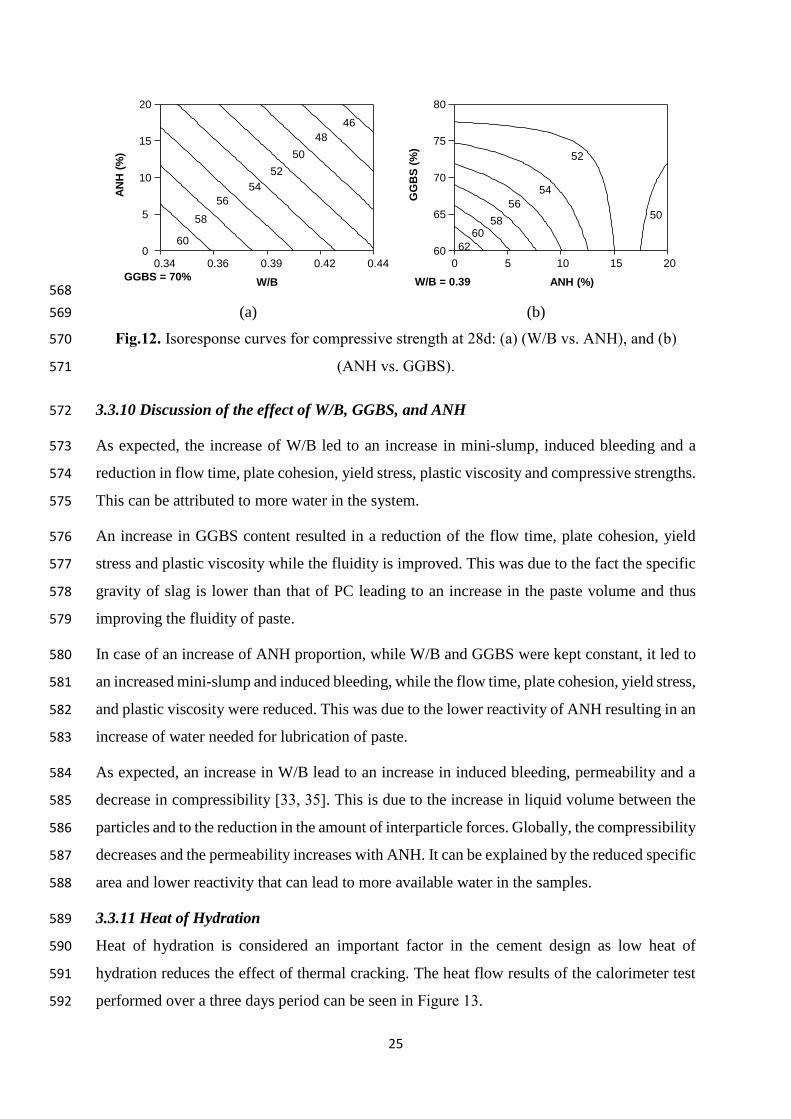
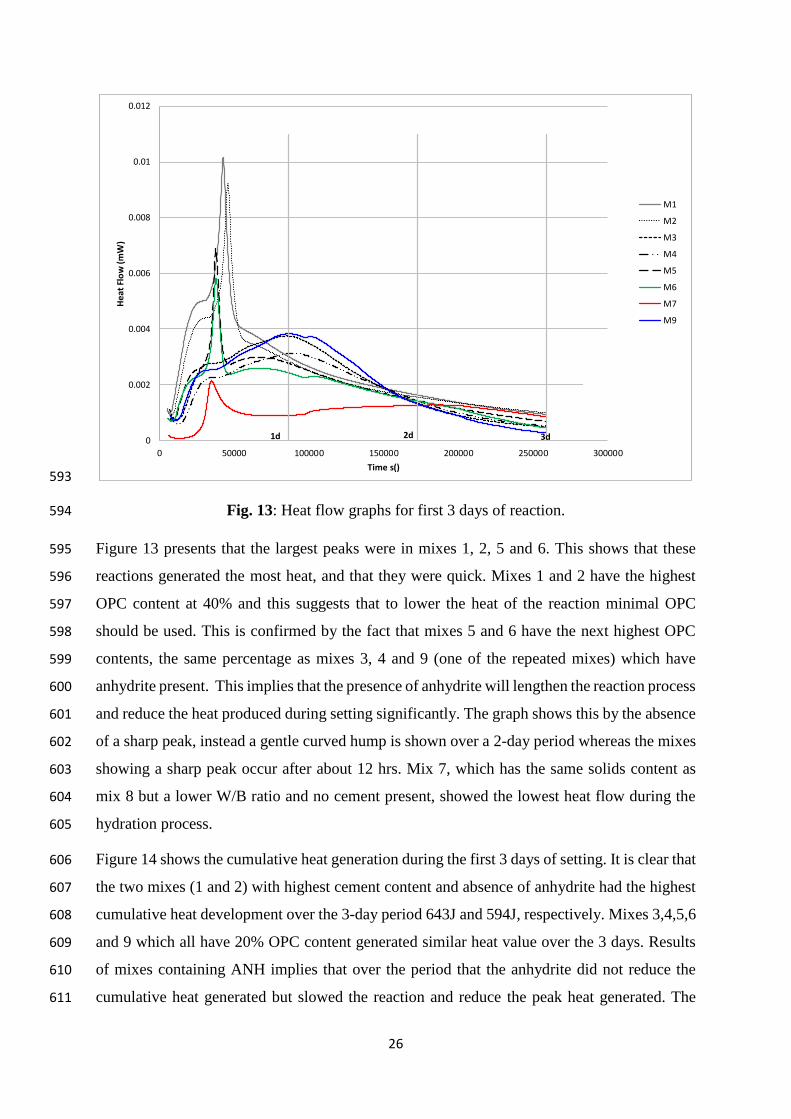
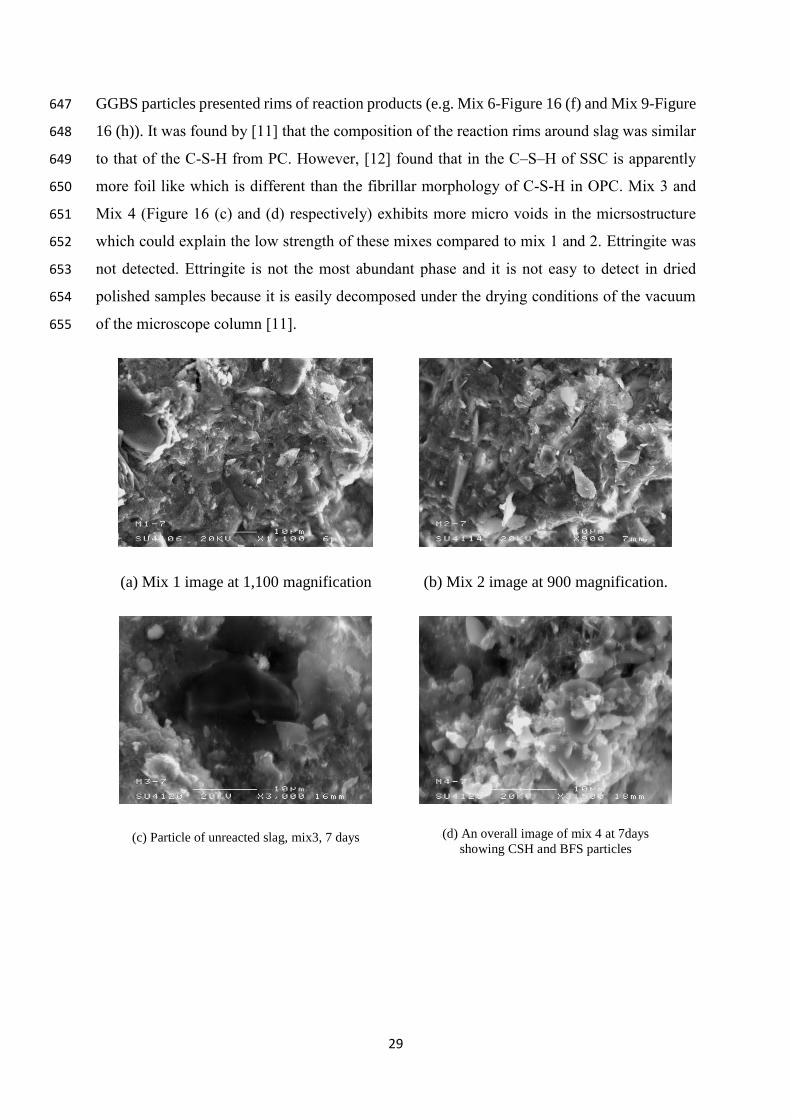