Embed Size (px)
Citation preview
OPTIMAL PREDICTION AND DESIGN OF SURFACE ROUGHNESS FOR CNC TURNING OFAL7075-T6 BY USING THE TAGUCHI HYBRID QPSO ALGORITHM
Wen-Jong Chen, Chuan-Kuei Huang, Qi-Zheng Yang and Yin-Liang YangDepartment of Industrial Education and Technology, National Changhua University of Education, Taiwan, R.O.C.
E-mail: [email protected]
IMETI-2015 SB502_SCINo.16-CSME-55,E.I.C.Accession 3941
ABSTRACTThis paper combines the Taguchi-based response surface methodology (RSM) with a multi-objective hybridquantum-behaved particle swarm optimization (MOHQPSO) to predict the optimal surface roughness ofAl7075-T6 workpiece through a CNC turning machining. First, the Taguchi orthogonal array L27 (36) wasapplied to determine the crucial cutting parameters: feed rate, tool relief angle, and cutting depth. Sub-sequently, the RSM was used to construct the predictive models of surface roughness (Ra, Rmax, and Rz).Finally, the MOHQPSO with mutation was used to determine the optimal roughness and cutting conditions.The results show that, compared with the non-optimization, Taguchi and classical multi-objective parti-cle swarm optimization methods (MOPSO), the roughness Ra using MOHQPSO along the Pareto optimalsolution are improved by 68.24, 59.31 and 33.80%, respectively. This reveals that the predictive modelsestablished can improve the machining quality in CNC turning of Al7075-T6.
Keywords: Taguchi method; RSM; MOHQPSO; CNC turning; surface roughness.
PRÉVISION OPTIMALE ET CONCEPTION DE LA RUGOSITÉ DE SURFACE POUR LETOURNAGE SUR UNE MACHINE CNC DE AL7075-T6 EN UTILISANT L’ALGORITHME
HYBRIDE TAGUCHI QPSO
RÉSUMÉCet article combine la méthode Taguchi de réponse de surface (RSM) avec un algorithme d’optimisationpar essaims particulaires pour prédire la rugosité de surface optimale d’une pièce de Al7075-T6 passant parl’usinage CNC. En premier lieu, les tableaux d’orthogonalité de Taguchi ont été appliqués pour déterminerles paramètres de coupe cruciaux : vitesse d’avancement ; angle de dépouille, profondeur de la coupe. En-suite, la réponse de surface a été utilisée pour la construction du modèle prédictif de la rugosité de surface(Ra, Rmax, et Rz). Finalement, le MOHQPSO avec mutation a été utilisé pour déterminer la rugosité opti-male, et les conditions de coupe. Les résultats indiquent, en comparaison avec la non-optimisation, que lacombinaison de la méthode Taguchi et l’algorithme d’optimisation multi-objectif par essaims particulaires(MOPSO) et la rugosité Ra utilisant MOHQPSO avec la solution optimale Pareto, ont été améliorés de68.24, 59.31 et 33.80% respectivement. Ceci démontre que le modèle prédictif peut améliorer la qualité detournage sur CNC de Al7075-T6.
Mots-clés : méthode Taguchi; RSM; MOHQPSO; tournage CNC; rugosité de surface.
Transactions of the Canadian Society for Mechanical Engineering, Vol. 40, No. 5, 2016 883

1. INTRODUCTION
Aluminum Al7075-T6 is an age-hardened Al-Zn-Mg-Cu alloy with a strength comparable to many steels.When this type of alloy is subjected to heat treatment to produce high density, it exhibits exceptional plas-ticity after solution treatment. Moreover, the tensile strength of Al7075 T6 alloys subjected to temperingtreatment is around 570 MPa [1], which is close to the hardness of medium carbon steel and has good fatiguestrength. With its excellent resistance to corrosion and mechanical strength at low temperatures, Al7075-T6is suitable for sports products, aircraft structural components, and moulds requiring high-intensity condi-tions and resistance to corrosion. However, although Al7075-T6 possesses high strength and hardness formachining operations, the influence of built-up edge (BUE) make controlling the surface roughness in turn-ing machining difficult. Therefore, selecting the appropriate cutting parameters for turning Al7075-T6 playsa critical role in improving its roughness. Numerous previous studies have mentioned the surface roughnessof cutting Al7075-T6. Basak and Goktas [2] used fuzzy theory to analyze the turning of Al7075-T6 foroptimizing the cutting parameters involved in polishing processes. Bhushan et al. [3] employed a numeri-cal method to analyze the surface roughness of Al7075-T6 in computer numerical control (CNC) turning.Chavoshi [4] employed an artificial neural networks and fuzzy theory to predict the parameter conditionsof the CNC turning of Al7075 T6 for analyzing the relationships among the surface roughness, wear, andfriction of the relief angle of tools. Choudhary and Chauhan [5] applied the response surface methodology(RSM) to determine the processability of Al7075-T6 and the minimal cutting force required to obtain theoptimal roughness. In addition, Singh and Sodhi [6] employed the RSM to investigate the cutting parametersof the CNC turning of Al7020 to obtain the maximal material removal (MMR) and a lower roughness. Raoand Krishna [7] used a non-dominated Sorting Genetic Algorithm-II (NSGA II) for evaluating the surfaceroughness, MMR, and wire-electrode wear when performing electrical discharge machining (EDM). Subra-manian et al. [8] used RSM to predict the surface roughness of Al7075-T651 work piece with high-speedsteel end milling in terms of tool geometry. Vakondios et al. [9] studied the effects of tool angles on surfaceroughness for the milling of Al7075 T6 by using ball nose end mills. Kurt et al. [10] performed a grey rela-tional analysis in the milling of Al7075-T651 to investigate and discuss the measurement errors in surfaceroughness.
According to the aforementioned studies, using artificial intelligence algorithms is a highly efficientmethod of improving the surface roughness in turning machining. However, there are only few studiesconducted artificial intelligence algorithms to determine the optimal cutting parameters required for im-proving the surface roughness of Al7075-T6 in CNC turning processes. In this study, the Taguchi methodwas applied and an analysis of variance (ANOVA) was performed to determine the crucial cutting param-eters related to the CNC turning of Al7075-T6. First, the spindle speed, feed rate, cutting depth, cuttinglength, tool nose radius, and tool relief angle were investigated to determine how they influence the de-gree of surface roughness and to determine the crucial cutting parameters for obtaining the optimal surfaceroughness. Subsequently, the RSM was applied to construct the models for predicting surface roughnessincluding centre-line average roughness (Ra), maximum-height roughness (Rmax), and ten-point height (Rz).Finally, a multi-objective hybrid quantum-behaved particle swarm optimization (MOHQPSO) method withmutation operator was employed to identify the appropriate parameter conditions along the Pareto-optimalfront to determine the optimal predictive values of surface roughness.
2. DESCRIPTION OF SURFACE ROUGHNESS
Surface roughness indicates the degree to which the surface of a machined surface of a work piece is un-dulating. Machined surfaces typically exhibit short distances between two peaks or two valleys, whichare indistinguishable to the naked eye. Numerous parameters can be employed to calculate the roughnessthrough the measurement,including Ra, Rmax, and Rz, as shown in Fig. 1.
884 Transactions of the Canadian Society for Mechanical Engineering, Vol. 40, No. 5, 2016

Fig. 1. Center line and parameters of Surface roughness.
3. MULTI-OBJECTIVE OPTIMIZATION MODEL
In practical applications,many optimization problems consider various objectives at the same time; there-fore,there is no single solution to a multi-objective optimization problem, but rather a set of solutions,whichare referred to as trade-off solutions. A multi-objective optimization problem is described in the following:
Min R(x) = {R1(x),R2(x),R3(x), . . . ,Rm(x)}
s.t. x(a) ≤ x≤ x(b) (1)
where solution x = [x1,x2, . . . ,xk]T ∈ D, D is the design parameter space; a and b are the lower limit and
upper limit of each design parameter value. To identify trade-off solutions despite conflicts between objec-tive functions, a superior method called the Pareto optimal method was used to obtain the trade-off solutionsalong the Pareto optimal frontier, which is called Pareto optimal solutions.
4. RESEARCH METHOD
4.1. Taguchi Method and Analysis of VarianceThe Taguchi method [11, 12] is used to transform quality characteristics into a signal-to-noise ratio (S/NdB). This involves employing the S/N ratio to convert experimental results in an orthogonal array into avalue for evaluation; this value is the quantity index of measuring qualities and is used to evaluate the degreeof stability of processes and products. After the S/N ratios for each of the trials are determined, an analysisof variance (ANOVA) is used to determine the control parameters that are significant. The distinguishedparameters in ANOVA are treated as optimal design parameters for creating a predictive model of qualitycharacteristics. In this study, “the smaller-the-better” (STB) concept was used to determine the qualitycharacteristic of the surface roughness. For STB, the more the better target approaches zero. Let ye be theeth trial result and n the number of trials. The method is described as
S/N (dB) =−10log(
1n ∑y2
e
)(2)
Transactions of the Canadian Society for Mechanical Engineering, Vol. 40, No. 5, 2016 885

4.2. Response Surface MethodologyThe Response Surface Methodology (RSM) is based on the suitability of empirical models and involvesusing a sequence of designed experiments to construct a predictive model consisting of linear or squarepolynomial functions [13]. It enables determining the relationships between specified ranges of designvariables and one or more response variables. In this study, a second-order polynomial model with a centralcomposite design (CCD) fitted to the experimental data was used to model the response surface. Let xi
and x j are input variables that influence the response R; ε is the error item. The second-order polynomialresponse surface can be expressed using
R = β0 +k
∑i=1
βixi +k
∑i=1
βiix2i +∑∑
i< jβi jxix j + ε (3)
4.3. Description of Multi-objective Hybrid Quantum Behaved Particle Swarm Optimization4.3.1. Overview of classical and quantum behaved particle swarm optimizationsClassical particle swarm optimization [14] (PSO) is a global search technique which was inspired by thesocial behaviour of flocks of birds and schools of fish. PSO identifies the most appropriate solution byconsidering the past behaviour of each particle and comparing it with the past and present behaviour ofother particles in a group of particles that move simultaneously. After iterative calculation, most of theparticles gradually move to the vicinity of the optimal solution of an entire group. The formula for theupdating process is expressed as
vp(t +1) = w(t)×vp(t)+ c1× randi× (pbestp(t)−xp(t))+ c2× rand2× (gbest(t)−xp(t)) (4)
xp(t +1) = xp(t)+vp(t +1) (5)
w(t) = wmax− [(wmax−wmin)/(itermax)]× iter(t) (6)
The current position and velocity vectors associated with each particle p are xp(t) and vp(t). t is thecurrent iteration number. wmax and wmin are the maximal and minimal inertia weight factors in the range[0,1]. rand1 and rand2 are the random values within [0,1], c1 and c2 are learning factors which is positivevalue, and w(t) is the dynamic weighting factor. Pbestp(t) is the best position of the pth particle, andgbest(t) is the best position among the individual (group best). However, the convergent speed of classicalPSO decreases and the process easily stalls at a local optimal solution when the iterative algorithm proceedsto the late period. In 2004, Sun [15] proposed quantum behaved PSO (QPSO), which is an improvementof the classical PSO algorithm used in quantum mechanics. In a quantum space, the position and velocityof each particle cannot be simultaneously determined but can be depicted by a wave function Φ(x, t). Ifeach particle is described by the same wave function, then the probability density |Φ|2 of its position in thesolution space can be described. QPSO algorithm is no velocity vector for each particle, and therefore, itssearch capability is superior to all presented PSO algorithms. The formulations of QPSO are described asfollows:
mbestp(t) =N
∑p=1
gp(t)N
(7)
gp(t) = φ(t)× pbestp(t)+(1−φ(t))×gbest(t) (8)
xp(t +1) = gp±α|mbestp(t)−xp(t)|× ln(
1u(t)
)(9)
α = (αmax−αmin)×(itermax− t)
itermax+αmin (10)
886 Transactions of the Canadian Society for Mechanical Engineering, Vol. 40, No. 5, 2016

where mbest is defined as the mean of the pbest positions of all particles, N is the number of all particles(population size), and the random variables u and φ are the uniform probability distribution in range [0,1].α is a design parameter called contraction-expansion coefficient, which can be tuned to control the conver-gence speed of the algorithms. This coefficient has a dynamic value that decreases from αmax to αmin withthe number of iterations increases. The term gp(t) is the best position of particle p at time t.
4.3.2. MOHQPSO algorithm with mutation operatorThe search area of each particle greatly depends on the particle best (pbest) and global best (gbest) whetherthe classical PSO or QPSO algorithm is applied. The diversity of a particle swarm markedly decreasesduring the early evolutional iterations; consequently, the solutions are easily trapped in a local optimal area.In this study, a broader search area was achieved by employing a mutation mechanism and using a realparameter in QPSO; this process is called hybrid quantum behaved particle swarm optimization (HQPSO).As the effects of pbest and gbest in HQPSO can be reduced gradually, the number of cutting parameters ismultiplied by a random value within the range [0, 1] to identify the the mutation performed for each particle.If the fitness value of a new particle mutated in HQPSO is superior to the current optimal fitness value, thenthis new particle is adopted as the new global optimal position. In this study, the mutation probability foreach particle was set to 10%.
xp,h(t +1)mut = x(a)p,h(t +1)+ rand4× [x(b)p.h(t +1)−x(a)p,h(t +1)] (11)
where h = ceil(rand3× k), k ∈ Z.The term “ceil (·)”, called the “ceiling function”, represents the lowest integer greater than or equal to
the value of (rand3× k), and h is the variable sequence position at which a mutation is obtained. rand3 andrand4 are random numbers within [0,1]. In this study, k = 3 was conducted in the variable space x; thus,h was an integral value within the range [1,3]. Cutting conditions affect various characteristics of surfaceroughness; therefore, Ra, Rmax, and Rz were simultaneously used as the fitness values for formulating a multi-objective optimization problem. The multi-objective hybrid quantum behaved particle swarm optimization(MOHQPSO) algorithm was used in this study. During the computing process, the MOHQPSO algorithmwas designed to update the variables repeatedly according to Eqs. (7)–(11), until termination conditionswere reached.
5. RESEARCH PROCESS
This paper proposes an integrated approach for investigating the effects of the cutting parameters and surfaceroughness Ra, Rmax, and Rz in CNC turning of Al7075-T6, accordingly, identifying the optimal cuttingparameters and predictive model for the turning process. A flow diagram of the proposed approach is shownin Fig. 2.
6. EXPERIMENTAL APPARATUS
As shown in Fig. 3, the experimental apparatus contained Fanuc O-T CNC turning and tungsten carbidetools, which were used in machining an Al 7075-T6 alloy of φ 30 mm and 55 mm in length.
The feed rate was within the range 0.107 to 0.303 mm/rev; the spindle speed ranged from 1750 to2550 rpm; the cutting depth of the tool ranged from 1.5 to 2.5 mm; the nose radii of the used tools were 1.5,2, and 2.5 mm; and the relief angles of the tools were 8, 10, and 12◦. The surface roughness was measuredusing a Sufcorder SE1200 machine.
Transactions of the Canadian Society for Mechanical Engineering, Vol. 40, No. 5, 2016 887

Fig. 2. The flowchart of research process.
Fig. 3. Experimental installations: (a) CNC turning lathe; (b) cutting depth and end relief angle; (c) spindle speed andfeed rate.
Table 1. Factors and levels of L27(36) orthogonal array.Factor Level
Level 1 Level 2 Level 3A Feed rate (mm/rev) 0. 107 0. 205 0. 303B Spindle speed (rpm) 1750 2150 2550C Tool relief angle (◦) 8 10 12D Cutting length (mm) 6 8 10E Cutting depth (mm) 1.5 2 2. 5F Tool nose radius (mm) 2 2.5 3
7. RESULTS AND VERIFICATION
7.1. Determination of Crucial Cutting ParametersThis section presents an orthogonal array L27 (36) identified using the Taguchi method to determine thecrucial cutting parameters, including the spindle speed, feed rate, end relief angle, tool nose radius, cuttinglength, and cutting depth, as shown in Table 1; this involved conducting 27 experiments in the CNC turning
888 Transactions of the Canadian Society for Mechanical Engineering, Vol. 40, No. 5, 2016

Table 2. The L27 (36) Orthogonal array and output response.No. Cutting Parameters (Factors) Ra (µm) Rmax (µm) Rz (µm) Average S/N (dB)
A B C D E F1 0.107 1750 8 6 1.5 2.0 0.155 1.199 0.591 0.648 3.7642 0.107 1750 8 6 2.0 2.5 0.114 0.565 0.390 0.356 8.9633 0.107 1750 8 6 2.5 3.0 0.260 1.947 1.158 1.122 –0.9974 0.107 2150 10 8 1.5 2.0 0.134 0.817 0.575 0.509 5.8715 0.107 2150 10 8 2.0 2.5 0.100 0.528 0.339 0.322 9.8346 0.107 2150 10 8 2.5 3.0 0.294 2.086 1.032 1.137 –1.1187 0.107 2550 12 10 1.5 2.0 0.096 0.679 0.321 0.365 8.7468 0.107 2550 12 10 2.0 2.5 0.115 0.523 0.383 0.340 9.3629 0.107 2550 12 10 2.5 3.0 0.167 1.122 0.700 0.663 3.57010 0.205 1750 10 10 1.5 2.5 0.100 0.519 0.379 0.333 9.56011 0.205 1750 10 10 2.0 3.0 0.151 1.019 0.565 0.578 4.75612 0.205 1750 10 10 2.5 2.0 0.239 1.138 0.769 0.715 2.91013 0.205 2150 12 6 1.5 2.5 0.130 0.769 0.517 0.472 6.52114 0.205 2150 12 6 2.0 3.0 0.493 2.374 1.717 1.528 –3.68315 0.205 2150 12 6 2.5 2.0 0.138 0.964 0.511 0.538 5.39016 0.205 2550 8 8 1.5 2.5 0.302 2.294 0.971 1.189 –1.50417 0.205 2550 8 8 2.0 3.0 0.145 1.216 0.648 0.670 3.48318 0.205 2550 8 8 2.5 2.0 0.786 5.720 3.324 3.277 –10.30919 0.303 1750 12 8 1.5 3.0 0.145 0.598 0.500 0.414 7.65320 0.303 1750 12 8 2.0 2.0 0.215 1.276 0.805 0.765 2.32321 0.303 1750 12 8 2.5 2.5 0.161 0.978 0.632 0.590 4.57822 0.303 2150 8 10 1.5 3.0 0.213 1.196 0.622 0.677 3.38823 0.303 2150 8 10 2.0 2.0 0.438 1.782 1.543 1.254 –1.96824 0.303 2150 8 10 2.5 2.5 0.438 2.195 1.250 1.294 –2.24125 0.303 2550 10 6 1.5 3.0 0.129 0.804 0.462 0.465 6.65126 0.303 2550 10 6 2.0 2.0 0.273 1.490 0.806 0.856 1.34727 0.303 2550 10 6 2.5 2.5 0.463 2.652 1.439 1.518 –3.625
All results average 0.837 3.082
Fig. 4. Main effect plots for response.
of Al7075-T6 to identify the optimal levels and transform the target value in each experiment of factors intoan S/N ratio.
As shown in Table 2 and Figs. 5(a–f), the optimal combination was A2B3C1D2E3F1. According to theANOVA, Factors A, C, and E were greater than F0.1,6,27 = 2.300 at a 90% confidence level, demonstrating
Transactions of the Canadian Society for Mechanical Engineering, Vol. 40, No. 5, 2016 889

Table 3. The ANOVA results.Parameters DOF SS Var F ρ% Confidence Significant?A 2 68.418 34.209 2.427 10.673 >90% YesB 2 42.452 21.226 1.506 6.622 <75% NoC 2 120.767 60.383 4.285 18.839 >95% YesD 2 18.511 9.255 0.657 2.888 <75% NoE 2 160.516 80.258 5.695 25.04 >95% YesF 2 33.069 16.534 1.173 5.159 <75% NoError 14 197. 306 14.093 At least 90% confidenceTotal 26 641.038
Table 4. Level for design variables in actual and coded value.Parameters Level
–1.682 –1 0 1 1.6818x1 Feed rate (mm/rev) 0.009 0.058 0.107 0.156 0.205x2 Relief angle (◦) 8 10 12 14 16x3 Cutting depth (mm) 0.5 1 1.5 2 2.5
Fig. 5. Predictive models of Ra.
that the feed rate, tool relief angle, and cutting depth exerted a significant effect. The cutting depth was themost crucial factor. In other words, the combination of the Taguchi method in conjuction with the ANOVAmarkedly improved the quality of the surface roughness when the cutting depth was slightly adjusted.
7.2. Constructions of Predictive Model from RSMThe experimental design involved constructing 20 sets of coded conditions and raw experimental data inRSM, according to Eq. (3) and Table 4. The mathematical predictive models with three-level of CCD were
890 Transactions of the Canadian Society for Mechanical Engineering, Vol. 40, No. 5, 2016

Fig. 6. Predictive models of Rmax.
expressed as follows:
Ra(x) = 0.17426+0.03939x1−0.09361x2−0.01638x3 +0.03118x21 +0.03206x2
2 +0.02835x33
+0.01887x1x2−0.03913x1x3 +0.01612x2x3
Rmax(x) = 1.01573+0.32269x1−0.64265x2−0.12371x3 +0.19924x21 +0.19977x2
2 +0.23777x23
+0.05187x1x2−0.12037x1x3−0.02038x2x3
Rz(x) = 0.57875+0.15661x1−0.34859x2−0.08481x3 +0.13862x21 +0.15011x2
2 +0.08294x23
+0.03875x1x2−0.052x1x3 +0.04125x1x2 (12)
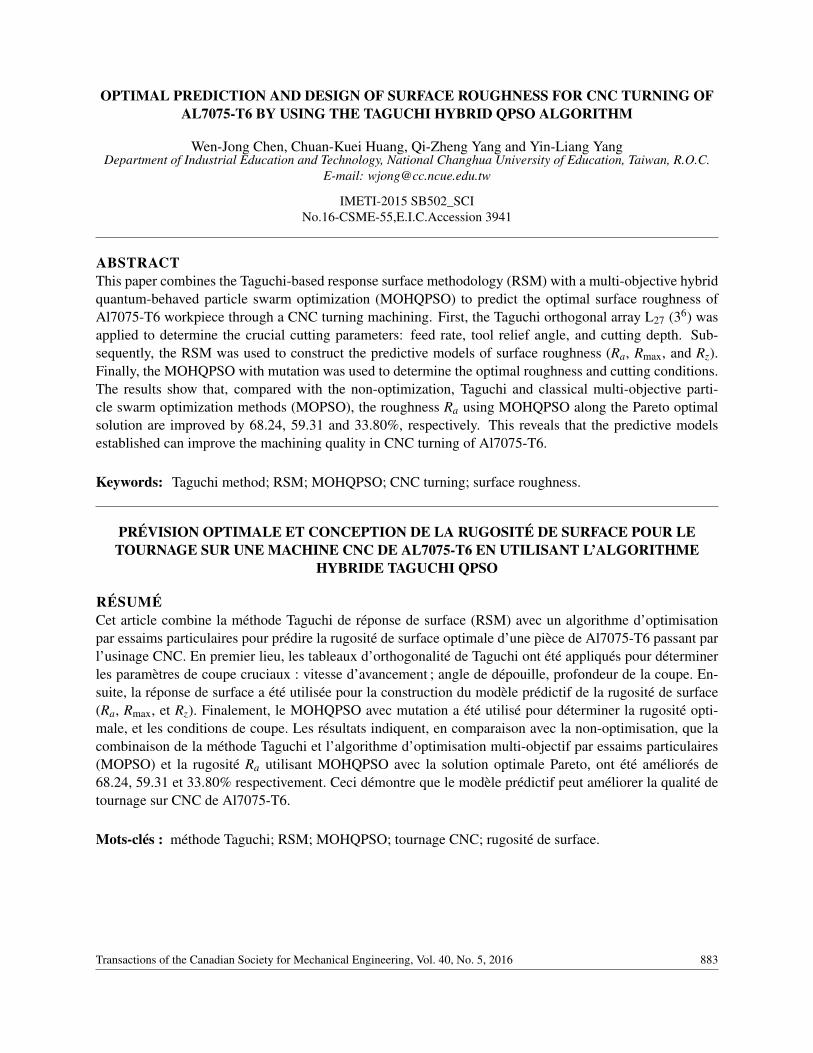
The 3-D surface diagrams and 2-D contour maps of the RSM predictive models from Eqs. (12) are shownin Figs. 5–7. Figures 5(a) and 5(d), 6(a) and 6(d), and 7(a) and 7(d) show that Ra, Rmax, and Rz, respectively,were low when a cutting depth of 1.5 mm was used, the feed rates were low, and the relief angles werelarge. Figures 5(b) and 5(e), 6(b) and 6(e), and 7(b) and 7(e) show that Ra, Rmax, and Rz, respectively, werelow when a relief angle of 12◦ was used, the feed rates were low with a large end relief angle. Rmax islow when the feed rate of 0. 03–0.1 mm/rev and the cutting depth of 1.2–1.8 mm were used. Figures 5(c)and 5(f), 6(c) and 6(f), and 7(c) and 7(f) show that Ra, Rmax, and Rz, respectively, were low when a feedrate of 0.107 mm/rev and a cutting depth of 1.5 mm with a larger end relief angle were applied. Selectingany cutting depth can cause Ra to get lower values when the relief angle was greater than 14◦. In addition,the cutting depth between 1 and 2.2 mm caused Rz to be low when the small relief angle was used in themachining process.
7.3. Pareto Optimal Solutions and Experimental VerificationAs shown in Eqs. (7)–(11), the mathematical predictive models were optimized using MOHQPSO algo-rithm to determine the optimal values of cutting parameters. Because the objective was attaining a minimalsurface roughness according to Eq. (12), the MOHQPSO algorithm was used to solve this multi-objectiveminimization problem. The multi-objective optimization functions were shown in Eq. (13). The initial num-
Transactions of the Canadian Society for Mechanical Engineering, Vol. 40, No. 5, 2016 891
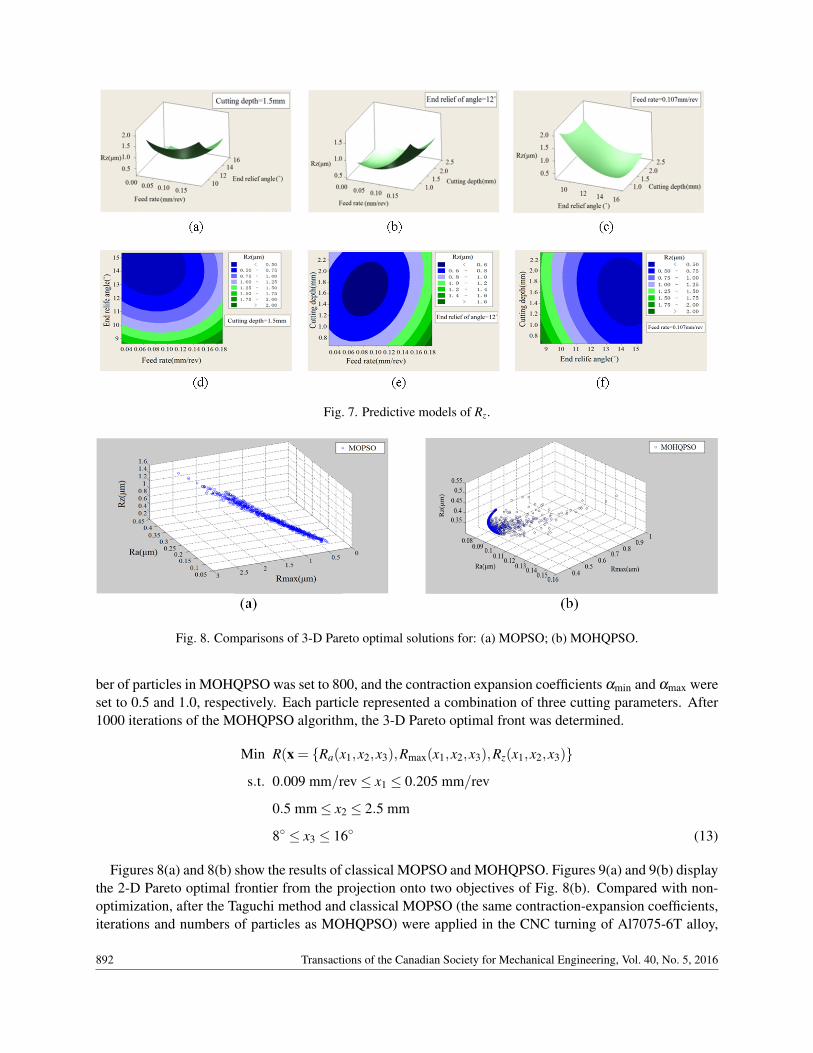
Fig. 7. Predictive models of Rz.
Fig. 8. Comparisons of 3-D Pareto optimal solutions for: (a) MOPSO; (b) MOHQPSO.
ber of particles in MOHQPSO was set to 800, and the contraction expansion coefficients αmin and αmax wereset to 0.5 and 1.0, respectively. Each particle represented a combination of three cutting parameters. After1000 iterations of the MOHQPSO algorithm, the 3-D Pareto optimal front was determined.
Min R(x = {Ra(x1,x2,x3),Rmax(x1,x2,x3),Rz(x1,x2,x3)}
s.t. 0.009 mm/rev≤ x1 ≤ 0.205 mm/rev
0.5 mm≤ x2 ≤ 2.5 mm
8◦ ≤ x3 ≤ 16◦ (13)
Figures 8(a) and 8(b) show the results of classical MOPSO and MOHQPSO. Figures 9(a) and 9(b) displaythe 2-D Pareto optimal frontier from the projection onto two objectives of Fig. 8(b). Compared with non-optimization, after the Taguchi method and classical MOPSO (the same contraction-expansion coefficients,iterations and numbers of particles as MOHQPSO) were applied in the CNC turning of Al7075-6T alloy,
892 Transactions of the Canadian Society for Mechanical Engineering, Vol. 40, No. 5, 2016

Fig. 9. Two objectives from 3D Pareto optimal front of MOHQPSO: (a) Ra vs. Rz; (b) Ra vs. Rmax.
Table 5. Comparisons of non-optimization, Taguchi method, MOPSO and MOHQPSO.Method Ra (µm) Rmax (µm) Rz (µm)Non-optimization 0.296 1.607 0.899Taguchi method 0.231 1.215 0.807MOPSO 0.142 0.669 0.633MOHQPSO 0.094 0.558 0.369
Table 6. Comparisons of MOHQPSO and experiments for Ra, Rmax and Rz.No. Feed Spindle Relief Cutting Cutting Nose MOHQPSO (µm) Experiment (µm)
Rate Speed Angle Length Depth Radius Ra Rmax Rz Ra Rmax Rz(mm/rev) (rpm) (◦) (mm) (mm) (mm)
1 0.107 2550 14 6 1.157 2 0.072 0.519 0.357 0.070 0.477 0.3162 0.107 2550 14 6 1.175 2 0.072 0.508 0.353 0.081 0.546 0.3363 0.110 2550 14 6 1.302 2 0.075 0.442 0.331 0.094 0.490 0.3244 0.125 2550 14 6 1.237 2 0.077 0.486 0.337 0.072 0.493 0.3915 0.156 2550 14 6 1.283 2 0.088 0.514 0.340 0.087 0.536 0.299
the surface roughness Ra achieved using MOHQPSO was reduced by 68.24, 59.31 and 33.80%; Rmax wasreduced by 65.28, 54.07, and 16.59%; and Rz was reduced by 58.95, 54.28, and 41.71% as shown in Table 5.
Table 6 shows the experimental results with five groups of optimal cutting conditions. Compared withthe results of MOHQPSO, the mean squared errors (MSE) in Ra, Rmax, and Rz were 0.0097, 0.0348, and0.0364 µm, respectively. Figure 10 shows the results of experimental verification when non-optimization,the Taguchi method, or MOHQPSO was applied. Above all, Figs. 10(c)–10(g) display that the roughnesshave larger variations with the cutting depth adjusted. The reason is that the cutting depth is identified asthe most significant parameter controlling the surface roughness. The MSE of Ra in Table 6 was extremelysmall. Because the Ra, Rmax and Rz are different types of formulations with different definitions, the errorsof Rmax and Rz were amplified with different measuring positions of the roughness curve. The resultsshowed that applying MOHQPSO algorithm effectively reduced surface roughness and enabled accuratelypredicting the surface roughness in the CNC turning of Al 7075-T6 alloy.
8. CONCLUSION
In this study, the Taguchi method and RSM were first applied to develop a second-order mathematicalmodel for predicting surface roughness values for known values of the tool relief angle, cutting depth, and
Transactions of the Canadian Society for Mechanical Engineering, Vol. 40, No. 5, 2016 893

Fig. 10. Experimental results (µm): (a) non-optimization, (b) Taguchi method, (c)–(g) MOHQPSO.
feed rate in the CNC turning of Al7075-T6 alloy. The direct and interaction effects of the input parameterswere analyzed using the predictive models. The mathematical predictive models were optimized usingMOHQPSO to attain the optimal surface roughness according to trade-off solutions. The predicted valuesof roughness were consistent with the observed values. The findings of this study are valuable for improvingthe machining performance and product qualities because they enable achieving optimal surface roughnessand reducing the cost of turning operations.
ACKNOWLEDGEMENT
This work is supported by the Ministry of Science and Technology in Taiwan (MOST 103-2221-E-018-008).
REFERENCES
1. William, F.S. and Hashemi, J., Foundations of Materials Science and Engineering, 5th ed., McGraw-Hill, 2011.2. Basak, H. and Goktas, H.H., “Burnishing process on al-alloy and optimization of surface roughness and surface
hardness by fuzzy logic”, Material & Design, Vol. 30, No. 4, pp. 1275–1281, 2009.3. Bhushan, R.K., Kumar, S. and Das, S., “Effect of machining parameters on surface roughness and tool wear for
7075 Al alloy SiC composite”, International Journal of Advanced Manufacturing Technology, Vol. 50, No. 5–8,pp. 459–469, 2010.
4. Chavoshi, S.Z. , “Tool flank wear prediction in CNC turning of 7075 AL alloy SiC composite”, ProductionEngineering, Vol. 5, No. 1, pp. 37–47, 2011.
5. Choudhary, A. and Chauhan, S.R., “Application of response surface methodology to evaluate the effect of cuttingtool inserts on machining of aluminium 7075 alloy on CNC turning centre”, International Journal of Machine,Vol. 13, No. 1, pp. 17–33, 2013.
6. Singh, B.J. and Sodhi, H.S., “Parametric optimization of CNC turning for Al-7020 with RSM”, InternationalJournal of Operational Research, Vol. 20, No. 2, pp. 180–206, 2014.
7. Rao, T.B. and Krishna, A.G., “Selection of optimal process parameters in WEDM while machining Al7075/SiCpmetal matrix composites”, International Journal of Advanced Manufacturing Technology, Vol. 73, No. 1–4, pp.299–314, 2014.
8. Subramanian, M., Sakthivel, M. and Sudhakaran, R., “Modeling and analysis of surface roughness of AL7075-T6 in end milling process using response surface methodology”, Arabian Journal for Science and Engineering,Vol. 39, No. 10, pp. 7299–7313, 2014.
9. Vakondios, D., Kyratsis, P., Yaldiz, S. and Antoniadis, A., “Influence of milling strategy on the surface roughnessin ball end milling of the aluminum alloy Al7075-T6”, Measurement, Vol. 45, No. 6, pp. 1480–1488, 2012.
10. Kurt, M., Hartomacýodlu, S., Mutlu, B. and Köklü, U., “Minimization of the surface roughness and form erroron the milling of free-form surfaces using a grey relational analysis”, Materials and Technology, Vol. 46, No. 3,pp. 205–213, 2012.
894 Transactions of the Canadian Society for Mechanical Engineering, Vol. 40, No. 5, 2016

11. Pandey, R.K. and Panda, S.S. , “Multi-performance optimization of bone drilling using Taguchi method basedon membership function”, Measurement, Vol. 59, pp. 9–13, 2015.
12. Yen, C.T., Zong, J.D. and Lai, W., “Optimization of an ultrathin centrifugal fan based on the Taguchi method withfuzzy logics”, Transactions of the Canadian Society for Mechanical Engineering, Vol. 37, No. 3, pp. 459–465,2013.
13. Chu, T.H., Fuh, K.H. and Yeh, W.C., “Modelling and analysis of deep drawing with utilisation of vibrationsand servo press using response surface methodology”, Materials Research Innovations, Vol. 18, No. S2, pp.936–939, 2014.
14. Kennedy, J. and Eberhart, R.C., “Particle swarm optimization”, in Proceedings of 1995 IEEE InternationalConference on Neural Networks, Piscataway, NJ, pp. 1942–1948, 27 November–1 December, 1995.
15. Sun, J., Wu, X.J., Palade, V., Fang, W., Lai, C.H. and Xu, W.B., “Convergence analysis and improvements ofquantum-behaved particle swarm optimization”, Information Sciences, Vol. 193, No. 15, pp. 81–103, 2012.
Transactions of the Canadian Society for Mechanical Engineering, Vol. 40, No. 5, 2016 895