Embed Size (px)
Citation preview

Opportunities to Improve Air Qualitythrough Transportation Pricing Programs
September 1997
Regional and State Programs Division
Office of Mobile Sources
U.S. Environmental Protection Agency
Prepared by:
ICF Incorporated
9300 Lee Highway
Fairfax, Virginia
With support from:
Apogee Research Incorporated
4350 East West Highway
Bethesda, Maryland
NOTICE
This technical report does not necessarily represent final EPA decisions or positions. It isintended to present technical analysis of issues using data which are currently available.
The purpose in the release of such reports is to facilitate the exchange of technicalinformation and to inform the public of technical developments which may form the basis
for a final EPA decision, position, or regulatory action.

Acknowledgements
EPA would like to thank the following people for providing information about theirorganization’s transportation pricing program:
Dan Paradee Maine Turnpike AuthoritySam SewardMilwaukee County Transit System
Michelle KingSan Diego Association of GovernmentsDeborah RedmanSouthern California Association of GovernmentsT.J. JohnsonWashington State Commute Trip Reduction Program
This document benefits greatly from these real examples of transportation programs. Detailedinformation about each of these programs can be found in Appendix A.

Table of Contents i
TABLE OF CONTENTS
PAGE #
Chapter 1Why Should I Be Interested in Transportation Pricing?.......................................................................................................1
The Costs of Automobile Use................................................................................... 1 Estimates of the Hidden Costs of Automobile Use................................................... 7
Fixing the Market Distortion.....................................................................................8 Advantages of transportation pricing measures........................................................9
Chapter 2The Current Price of Driving................................................13 Distinction Between Use-Related and Non-Use-Related Fees................................13 Conclusion: The Role of Transportation Pricing Measures...................................16
Chapter 3 Examples of Transportation Pricing Programs....................17 Types of Transportation Pricing Measures...............................................................17
The Effects of Transportation Pricing Measures on Travel and Emissions........................................................................................................ 27
Chapter 4 Institutional Relationships.......................................................43 Program Initiation......................................................................................................43 Selecting a Lead Agency............................................................................................44
Promoting Coordination Among Multiple Agencies, Organizations, and Levels of Government............................................................47
Chapter 5 Public Involvement and Acceptance......................................55 What is Public Involvement and Why Does It Matter?.............................................55 Elements of a Successful Public Education and Outreach Campaign.......................57 Techniques for Effective Public Education and Involvement....................................66
Evaluating the Success of the Public Outreach and Involvement Effort.................................................................................................72 Conclusion.................................................................................................................73
Chapter 6 Equity and Transportation Pricing.........................................75 Overview of the Equity Issue......................................................................................75 Equity and the Current Transportation System...........................................................76 The Equity Effects of Transportation Pricing Programs.............................................79 Using Transportation Pricing to Address Equity Concerns........................................83 Conclusion..................................................................................................................85

Table of Contentsii
Chapter 7 Funding Sources.....................................................................87 Federal Funding Sources............................................................................................87 Other Funding Sources..............................................................................................97
Summary....................................................................................................................100
Appendix A: Case Studies..........................................................................101
Appendix B: List of Acronyms.................................................................123
Appendix C: List of References................................................................125

Table of Contents iii
FIGURES AND TABLES
Chapter 3 Page #Table 3-1 Estimated Effects of Transportation Pricing Measures
on Travel Demand and Emissions..................................................... 30 Table 3-2 Summary of Transportation Pricing Projects.....................................33
Chapter 4Table 4-1 Potential Lead Agencies and Institutional
Relationships for Various Transportation Pricing Measures............. 50 Table 4-2 Examples of Institutional Relationships in Transportation
Pricing Programs................................................................................51
Chapter 7Table 7-1 Summary of Funding Sources............................................................100

iv

Chapter 1 - Why Should I be Interested in Transportation Pricing? 1
? ! Question: What do the following have in common?
A. Smog, particulate matter, carbon monoxideB. Greenhouse gasesC. Traffic congestion
Answer: They are just a few of the many reasons to employ transportation pricing programs.
CHAPTER 1Why Should I Be Interested in
Transportation Pricing?
This document is intended to give state and local air quality and transportation planners,elected government officials, and other interested parties background information ontransportation pricing programs. Specifically, this document explains why pricing can makesense, the institutional relationships necessary for pricing measures to work, and some pitfallsto avoid in implementing a program. Examples of pricing programs adopted throughout thecountry illustrate these points. Our hope is to provide sufficient background information forcity, county, regional or state governments to consider using pricing programs to help achievebetter air quality, reduced congestion, reduced pollution of all media from the transportationsector, a more livable community, or all of the above.
The term “transportation pricing programs” encompasses a variety of differentprograms that have a common element: they attempt to incorporate the costs of transportationdecisions into a price that a consumer sees and pays directly. The current pricing oftransportation falls short of this objective.
THE COSTS OF AUTOMOBILE USE
Driving an automobile imposes many different costs on society as a whole. The effectsare both direct and indirect and result from the production, use, servicing, and disposal ofmotor vehicles. Environmental effects include air and water pollution, ozone depletion, effectson climate, hazardous and solid waste production, noise pollution, loss of habitat, species andbiodiversity, and reduced visibility. Every car trip creates additional air pollution, water qualityimpacts, noise, and waste.
U.S. Department of Transportation, Bureau of Transportation Statistics, Transportation Statistics Annual1
Report, 1996, Washington, D.C., 1996.
Ibid.2
Shoup, Donald C., “An Opportunity to Reduce Minimum Parking Requirements,” Journal of the3
American Planning Association, Winter 1995, p.19.
Chapter 1 - Why Should I be Interested in Transportation Pricing?2
Other societal costs include traffic congestion, increased travel time, and money spentto construct, maintain, and monitor the transportation system. In the 50 largest U.S. cities,traffic congestion and delays in 1991 resulted in estimated total economic losses of over $45billion. Driving cars also creates a need for additional public services to handle the problems1
caused by accidents: a significant portion of state and local police, fire, ambulance, and courtsystem’s resources are related to automobiles. In 1994, 40,676 lives were lost and 3,215,000injuries resulted from motor vehicle accidents in the U.S. There are also very high monetary2
and environmental costs associated with building and widening roads and constructing parkinglots. Often, these costs are paid for roads to relieve heavy congestion only in the peak periods,which may only be 5 to 15 hours per week in each direction, or only 3 to 10 percent of theweek. The other 90 to 97 percent of the time these large investments may not be in full use. Similarly, high costs are incurred in constructing parking lots. Most cities’ parkingrequirements leave spaces vacant more than 99 percent of the time a shopping center is openfor business, and leave at least half the spaces vacant at least 40 percent of the time.3
Though some of the costs of automobile use are paid through gasoline taxes, these taxesare not sufficient to cover all of these costs. The remainder of these costs are paid indirectlythrough property or income taxes, or are borne by society in the form of additional health costs,nuisance, or poor environmental quality. Most of these costs are “hidden” costs that are notdirectly paid by drivers at the time they make the decision to use their car.

Chapter 1 - Why Should I be Interested in Transportation Pricing? 3
Hidden Costs of Automobile Use
ENVIRONMENTAL C Air and water pollutionC Ozone depletion and global climate changeC Hazardous and solid waste productionC Noise pollutionC Loss of habitat, species and biodiversityC Reduced visibility
SOCIETAL C Increased traffic congestion and travel timesC Increased money spent to construct, maintain, and monitor the
transportation systemC Need for additional public services to handle the problems
caused by accidents
Pollution Volumes Resulting from On-Road Transportation Emissions in 1995
C Nearly one-third (27 percent) of VOCemissions;
C Over one third of the NO (35 percent)x
emissions;C 64 percent of the CO emissions; andC 12 percent of PM emissions.
Source: U.S. EPA. National Air Quality andEmissions Trends Report, 1995
Environmental Costs
Automobile use imposes significant costs on society in terms of the environmentalimpacts. The relationship between vehicle use and air pollution, global climate change, andother environmental concerns is discussed briefly below.
Air Pollution
Despite considerable progresssince the Clean Air Act of 1970,unhealthy air pollution levels still plaguevirtually every major city in the nation. Motor vehicle emissions contribute tofour of the six criteria pollutants: volatileorganic compounds (VOC) and oxides ofnitrogen (NO ) emissions, which combinex
to form ozone; carbon monoxide (CO);nitrogen dioxide (NO ); and PM-10.2
Although today’s cars are 70 to 90percent cleaner than their 1970counterparts, transportation emissions continue to be a significant cause of air pollution due tothe rapid increase in vehicle travel since 1970. Vehicle miles traveled (VMT) have more than

U.S. Environmental Protection Agency, National Air Quality and Emissions Trends Report, 1995,4
Research Triangle Park, NC, October 1996.
Information compiled by EPA based on reports from local air quality agencies.5
Calculations based on data found in: U.S. Department of Transportation, Bureau of Transportation6
Statistics, National Transportation Statistics, 1997, and U.S. Department of Transportation, FederalHighway Administration, Federal Highway Statistics, 1995, Washington, DC, 1996.
U.S. Department of Transportation, Bureau of Transportation Statistics, National Transportation7
Statistics, 1997.
U.S. Environmental Protection Agency, National Air Quality and Emissions Trends Report, 1995,8
Research Triangle Park, NC, October 1996.
American Lung Association web page. http://www.lungusa.org9
Chapter 1 - Why Should I be Interested in Transportation Pricing?4
Transportation Emission Sources
On Road: Cars, light trucks,motorcycles, andheavy dutyvehicles (e.g., trucks, busses)
Non-Road: Recreation, construction,industrial, lightcommercial andlogging vehicles,
doubled in the U.S. from 1970 to 1990, tripled from 1960, and increased even faster in many4
specific metropolitan areas. For example, VMT in Las Vegas increased 160 percent from 1981to 1991, and nearly doubled in Phoenix in the same ten years. From 1970 to 1990, VMTincreased 120 percent in the Los Angeles region, and 216 percent in San Diego. 5
From 1960 to 1995, per-mileemissions declined by 82 percent forVOC, 48 percent for NO , and 70x
percent for CO. Total emissions from6
on-road vehicles, however, have notfared as well: total VOC emissionsdeclined only 41 percent, total NOx
emissions increased by 73 percent, andtotal CO emissions increased by onepercent. The available data for PM-107
show that on-road emissions decreasedby 31 percent per mile between 1985and 1995, but increased 9 percentoverall.8
The health effects of these air pollutants range from headaches and eye irritation toreduced lung function, lung damage, respiratory disease (such as asthma and bronchitis), andcancer. According to the American Lung Association, the death rate for lung disease has risenfaster than that of any of the other leading causes of death in the last decade. According to theAmerican Lung Association, the health effects of air pollution are estimated to cost $50 billioneach year.9
“Climate Change 1995: The Science of Climate Change,” edited by J.T. Houghton, L.G. Meira Filho, et10
al, Contribution of WG1 to the Second Assessment Report of the Intergovernmental Panel on ClimateChange, 1996.
Flavin, Christopher, “Storm Warnings: Climate Change Hits the Insurance Industry,” World Watch,11
November/December 1994, p. 11.
Ibid, p. 12.12
U.S. Department of Energy, Annual Energy Outlook 1997, Energy Information Administration,13
DOE/EIA-0383(97), December 1996.
Chapter 1 - Why Should I be Interested in Transportation Pricing? 5
Global Climate Change
There is no question that the concentration of greenhouse gases in the atmosphere --most notably carbon dioxide -- has been increasing, nor that the climate is undergoing changes. The questions are (1) how great that change is, and (2) to what extent human activity, such asthe burning of fossil fuels, is responsible. The most recent assessment of the United Nations’Intergovernmental Panel on Climate Change (IPCC), made up of about 2,500 distinguishedscientists from around the world, sheds light on these questions. In November of 1995, thisgroup of scientists predicted that global temperatures would rise 2 to 6 degrees Fahrenheit overthe next century. The IPCC has concluded that “the balance of evidence suggests that there is10
a discernable human influence on global climate.” In December of 1997, the U.S. and othergovernments will convene in Kyoto, Japan to establish internationally binding targets forgreenhouse gas reductions.
If temperatures rise as predicted, the potential cost of climate change to ourenvironment and economy is enormous. Between September 1989 and September 1994, theworld experienced at least 15 separate weather-related disasters in which financial lossesexceeded $1 billion. In addition to these weather-related events, predicted effects of large-11
scale climate change are loss of agricultural and forestry production, and large-scale damagefrom flooding and drought. According to Franklin Nutter, President of the ReinsuranceAssociation of America, “the insurance business is first in line to be affected by climatechange... it could bankrupt the industry.”12
The combustion of fossil fuels is one of the major contributors to the increase in carbondioxide emissions and emissions of other greenhouse gases. Our transportation sector alone isresponsible for 32 percent of anthropogenic (those caused by human activities) CO emissions2
in the U.S., which is seven percent of greenhouse gases world-wide. The transportation sectoralso has the highest rate of growth of CO emissions in the U.S.2
13
Other Environmental Impacts
U.S. Environmental Protection Agency, Solid Waste and Emergency Response, Summary of Markets14
for Scrap Tires, 1991.
Chapter 1 - Why Should I be Interested in Transportation Pricing?6
This introduction has an emphasis on air impacts because protecting air quality is theparticular mission of EPA’s Office of Mobile Sources. However, transportation activitiesaffect and contribute to a great many environmental and ecological problems corresponding toEPA’s mission as a whole. These effects are just as critical to public health and the health ofthe environment. Some of these environmental impacts are described below.
Water Pollution
Automobiles are a substantial source of water pollution in the form of urbanrunoff and atmospheric deposition. Urban runoff, loaded with pollutants that leak fromor wear off automobiles, is washed off roads and other paved surfaces into surfacewaters and seeps into groundwater. The paving of land for roads and parking (around40 percent of urban areas) increases the amount of impervious surface which in turnincreases runoff and reduces groundwater recharge. This has the effect of increasingstormwater flows to sewer systems, which can lead to discharges of polluted waterwhen municipal sewer systems become overloaded. Pollutants originating as airemissions from vehicles are also deposited from the atmosphere into surface waters.
Some of the pollutants associated with automobile use include grease,antifreeze, coolant and other engine fluids that contain tiny metal particles and othertoxics; copper, lead and zinc from eroded brake pads; ferrous oxide and other metalsfrom body rust and paint; rubber, steel and zinc from worn tires; motor oil andantifreeze spilled or dumped improperly; nitrogen from deposition of nitrogen oxideemissions; salt used on roads; gasoline from leaking underground storage tanks; and oiland other petroleum products that are spilled in transport.
Solid Waste
Solid waste generated from the construction of vehicles and roadways and thedisposal of obsolete vehicles, as well as asphalt, concrete, and other materials, adds tolandfills, contributes to air pollution if incinerated, and contaminates water systems. Inaddition, the improper disposal of materials, such as old tires, lead and acid in batteries,and pavement, remains a serious problem. Of the 242 million tires scrapped in 1990,77.6 percent of them were landfilled, stockpiled, or illegally dumped.14
Land Use and Habitat

U.S. Department of Transportation, 1996.15
Chapter 1 - Why Should I be Interested in Transportation Pricing? 7
In the U.S., paved and unpaved public roads occupy 25,000 square miles ofland, an area equal to the size of West Virginia. Transportation infrastructure causes15
changes in drainage patterns, creation of microclimates, and fragmentation of animalhabitat by creating barriers between previously joined areas. In addition, constructionhas led to the filling in of wetlands and other loss of habitat, which can have deleteriouseffects on the species that depend on each of those areas.
Widespread reliance on private vehicles has also encouraged low-densitysuburban sprawl. Such development consumes much larger amounts of land to serve apopulation than was needed in the past. Low-density development makes it much moredifficult to carry out normal activities by walking, bicycling, or using public transit. Asa consequence, less land can be protected and preserved, and open space is lost.

U.S. Department of Transportation, Bureau of Transportation Statistics, Transportation Statistics16
Annual Report, 1996, Washington, D.C. 1996.
The resulting data from five studies referenced here were compiled by John Holtzclaw, a Ph.D. urban17
sociologist and regional planner in San Francisco, CA: Ketcham & Komanoff, 1992; Litman, 1992; MacKenzie, Dower, & Chen, 1992; Moffet, 1991; and Vorhees, 1992. The full citations for thesestudies can be found in the references section at the end of the document.
Chapter 1 - Why Should I be Interested in Transportation Pricing?8
Pollution Control Costs
In addition to the environmental costs imposed by automobile use, there are alsosubstantial costs to control pollution from mobile sources. According to the U.S.Department of Commerce, consumers, businesses, and governments in the U.S. spent$17.2 billion (in 1994 dollars) on air and water pollution controls for highwaytransportation in 1993. This is roughly $1,150 per vehicle for emissions control.16
ESTIMATES OF THE HIDDEN COSTS OF AUTOMOBILE USE
Several studies by the World Resources Institute, the Natural Resources DefenseCouncil, and others have quantified the hidden costs of automobile use in the U.S. These 17
hidden costs represent the costs or impacts of automobile use borne by society that theindividual consumer does not see or pay when choosing to use his or her automobile. Inestimating these figures, these studies included the costs of all or some part of the following:
C Police, fire, ambulance, road construction and maintenance, and other relatedlocal government expenditures;
C Property taxes lost from land cleared for freeways;C Parking;C Air, water, land pollution;C Noise, vibration damage to structures;C Global warming;C Petroleum supply line policing, security, petroleum production subsidies;C Trade deficit, infrastructure deficit;C Sprawl, loss of transportation options;C Uncompensated auto accidents; andC Congestion.
These studies determined that the total annual hidden costs of automobile usage rangedfrom $378 to $730 billion dollars (in 1991 dollars). This represents a subsidy of $5.21 to$10.07 per gallon of gasoline or $2,185 to $4,220 per car (in 1991 dollars) to automobile

Holtzclaw used the following estimates to make these conversions: 20 mph average fuel consumption;18
72.5 x 10 gallons/yr U.S. gasoline consumption; 173 x 10 cars in U.S.6 4
Chapter 1 - Why Should I be Interested in Transportation Pricing? 9
users. Though some of the costs outlined above are paid by automobile users indirectly as18
taxpayers, the remainder of these costs (or impacts on society through lower quality of life)represent a subsidy to automobile users. That is, the known or direct cost of vehicle use to theindividual is less than the true or social cost of vehicle use. Thus, the “price” of vehicle use isdistorted.
FIXING THE MARKET DISTORTION
As the figures above indicate, driving is severely underpriced because many of the costsare hidden, not incurred at the time of travel, or not paid based on how and when people driveat all. Only a small fraction of the total costs are paid directly by drivers at the time they maketheir decision use the car. This small fraction is what the driver pays in existing fuel taxes andtolls.
Consumers usually consider only their visible, immediate costs when making decisionsabout what to consume. Consumers of the roadways -- drivers -- may consider the cost of thegasoline or the wear and tear on their car when they are deciding whether or not to drive, butthe other costs such as air pollution, potential effects of greenhouse gases, noise pollution,water pollution, traffic congestion, potential cost of accidents, or the costs of roads are mostlikely not factored into the decision. People will drive more when driving is cheap, and lesswhen driving is more expensive. The subsidy on automobile usage leads to increased VMTand must be paid for through higher taxes, increased health costs, and increased costs ofconsumer goods. The current transportation system denies people choice and control over whatthey pay for and information about the true costs they bear.
Transportation pricing programs seek to remedy that disconnect. These programs usethe power of the market by incorporating the cost of driving into consumer decisions. Increasingly, people are realizing that transportation pricing programs make sense: preventingpollution by reducing the incentives for more automobile travel is more efficient than findingexpensive ways to clean it up later or imposing additional restrictions on other sources.
Though they have the common purpose of incorporating the “real costs” of driving intoa person’s travel decision-making process, each market incentive program will yield a differentresult depending on how it is designed, and at what point the person is aware of the cost oftravel. These programs can be targeted towards specific pollutants, specific problems or goals,or particular areas. Though these programs can vary greatly because each one will be tailoredfor a specific area, transportation-related market incentive programs can be grouped according

Chapter 1 - Why Should I be Interested in Transportation Pricing?10
to which aspect of driving is charged. The types of programs discussed in this document are asfollows:
C Fuel taxes or other at-the-pump charges, such as “pay-at-the-pump” insurance;
C Fees based on vehicle use and/or emissions;
C Roadway pricing, including road tolls, premium tolls, and congestion pricing;and
C Paying for parking and parking cash-out.
Also discussed in this document are the following:
C Subsidies for other modes of travel, such as transit and high occupancy vehicle(HOV) lanes. Subsidy programs do not try to incorporate the “real costs” ofdriving into a person’s travel decision making, but instead try to makealternatives more appealing by lowering their price.
ADVANTAGES OF TRANSPORTATION PRICING MEASURES
Some key advantages of transportation pricing measures, which may be used to increasesupport for their introduction, include the following (adapted from Guidance on the Use ofMarket Mechanisms to Reduce Transportation Emissions, EPA and DOT, forthcoming):
C Applying pricing measures to achieve program objectives, in contrast toregulatory actions that compel governments or individuals to assume particularcourses of action, provides considerable latitude for individual freedom ofchoice.
C By reducing driving subsidies and shifting costs to those who are responsible forthem, pricing measures give individuals more information about theirtransportation costs and choices and are more fair.
C Consumers can make more rational trade-offs between how much they want to
pay and how and when they want to travel under a pricing system based on truecosts; the current system of indirect taxes and subsidies obscures theinformation necessary for such choices.
C Pricing measures can potentially be effective in reducing congestion oremissions much more quickly than building facilities or changing vehicles.

Chapter 1 - Why Should I be Interested in Transportation Pricing? 11
C Transportation pricing measures encourage markets to develop new and moreefficient solutions to meet travel and access needs that are currently met mainlythrough private vehicle travel.
C Transportation pricing measures can be applied to all types of travel and trips,not just employment-related travel. This is in contrast to some TCM programs,which have been criticized as having a limited (and perhaps inequitable) impactbecause they affect only a portion of travel activity.
C Transportation pricing measures are typically self-financing and, in fact, mayprovide revenue to support their implementation as well as other transportationimprovements.
C Transportation pricing measures can substantially reduce the cost oftransportation (both direct and indirect). Reduced vehicle dependency can resultin improved travel time and reliability in the movement of people and goods,reduced construction and maintenance costs, lower taxes, and fewer accidents inaddition to lower health costs, and less environmental damage and clean up(water, climate, noise, solid and hazardous wastes, loss of open space, andhabitat and species).
C Transportation pricing measures can help states and local areas delay or offsetthe need for expensive new transportation capacity, help finance that capacity,and bring about its most efficient use. They also can help cut costs formaintenance and government services.
C Longer-term, structural changes induced by transportation pricing measures arecritical to the sustainability of transportation and air quality plans, and can helpareas avoid recurring updates of their SIPs in search of new and stronger (andmore expensive) controls to offset VMT growth.
Transportation pricing programs are not required by the Clean Air Act, they are anadditional method for nonattainment areas to use in reducing emissions and can be adoptedwith a large degree of flexibility. Although EPA is enthusiastic about pricing programs, theseprograms are not necessarily a “quick-fix,” or the solution for every area. These programs areanother tool in the toolbox of strategies an area can use in the effort to attain better air qualityand other benefits for its citizens. The actual results achieved will depend on the quality of theeffort invested, as well as other factors, such as the availability of alternatives (e.g., transit orwalking) to realistically accomplish trip purposes. But well-designed programs have greatpotential to reduce air pollution at a lower cost than other approaches, while also reducing ahost of other environmental and social problems.

Chapter 1 - Why Should I be Interested in Transportation Pricing?12
The remainder of this document is organized as follows:
C Chapter 2 discusses, in more detail, the current price of automobile usage to theindividual.
C Chapter 3 introduces the various types of transportation pricing measures thatcan be used.
C Chapter 4 investigates the institutional relationships that are necessary for thesuccessful implementation of transportation pricing programs.
C Chapter 5 discusses the role of public involvement and acceptance in thesuccess of transportation pricing programs.
C Chapter 6 examines the issue of equity in the context of transportation pricingprograms.
C Chapter 7 reviews the manner in which existing transportation pricingprograms have been funded and identifies potential sources of funding for futureprograms.
In addition, the document includes appendices containing case studies on specifictransportation pricing programs, a list of acronyms used throughout the document, and a list ofreferences for obtaining additional information.

Chapter 1 - Why Should I be Interested in Transportation Pricing? 13

14
CHAPTER 2The Current Price of Driving
Automobile drivers experience many costs in our society and must pay for many things. However, as noted in Chapter 1, drivers rarely pay directly for using the road network andrarely pay for the air pollution and other costs they impose on others. Rather, the road network,air pollution costs, and many other driving-related costs are paid for by society in general. Given the current situation, a stronger link must be made between the price of vehicle usageand the costs to society.
This chapter focuses on the various prices or expenses that drivers (or vehicle owners)must pay in order to drive their vehicles. For each of the costs paid by drivers or vehicleowners, the chapter attempts to divide these costs into those that are “use-related” and thosethat are “non-use-related.” The chapter concludes with a brief discussion of the role thattransportation pricing measures can play in making the price of driving more comparable to thecosts of driving.
DISTINCTION BETWEEN USE-RELATED AND
NON-USE-RELATED FEES
Drivers (or sometimes vehicle owners) pay for a multitude of vehicle-related expenses. These expenses can be broken down into three categories:
C Costs that are incurred at the beginning, during, or at the end of a trip are use-related expenses;
C Costs that are related only indirectly to travel (or vehicle use) and may or maynot be incurred during travel (trip or driving cycle) are indirect use-relatedexpenses; and
C Costs that are incurred regardless of whether the vehicle is actually driven at allare non-use-related expenses.
This chapter uses these three categories of expenses to describe the costs paid by travelconsumers (i.e., drivers or public transit riders). These costs include vehicle purchase costs;gasoline costs and fuel taxes; automobile insurance costs; sales, property, and income taxes;registration fees; automobile repair and maintenance costs; tolls; parking fees; and transit fares. Recognizing where consumers pay for transportation, and whether these costs depend on theamount of driving done, is helpful in creating effective transportation pricing strategies. Transportation pricing programs can be designed to replace existing costs, such as vehicle

Chapter 2 - The Current Price of Driving 15
registration fees, sales taxes, or insurance costs. If designed appropriately, a transportationpricing program can yield the same amount of revenue while encouraging cleaner air.
Vehicle Purchase Costs
Most drivers who wish to have unlimited access to a vehicle must pay a price for thatprivilege, commonly known as the purchase price. The purchase price (primarily a componentof the cost of vehicle ownership) is not used to support the transportation infrastructure, is notrelated to a trip, and thus is a non-use-related expense. The purchase price pays for thematerials and resources that were consumed in manufacturing the vehicle, not for developing ormaintaining the transportation infrastructure necessary for vehicle travel.
Gasoline Costs and Fuel Taxes
A driver or vehicle owner must buy gasoline (or some other fuel) in order to operate avehicle. While the cost of gasoline is associated with personal mobility, drivers may notassociate it with a specific trip, particularly if the trip is short; most drivers purchase gasoline atregular intervals rather than each time the car is driven. Fuel consumption costs depend on avehicle’s efficiency and how far the vehicle has traveled. Therefore, gasoline costs are use-related.
Gasoline taxes, which are collected by the federal government, are primarily used tosubsidize construction and maintenance of the National Highway System and state roads. (Thisis not to say that fuel taxes fund all of the maintenance and construction costs of roads.)
Automobile Insurance Costs
Part of the responsibility of owning a vehicle is the purchase of automobile insurance.Because a driver's automobile insurance typically covers costs that result from mishaps thatoccur while driving, one might be tempted to call these costs “vehicle/travel use-related.” However, insurance premiums are assessed periodically to cover costs that occur as a result ofaccidents or risky behavior (e.g., speeding or driving under the influence). While insurancecosts may be in part based on yearly mileage, they are not incurred during a trip, and thusrepresent an indirect use-related expense. Finally, while insurance premiums are sometimesrelated to the number of miles an individual drives in a year, this relationship is not substantial.

Chapter 2 - The Current Price of Driving16
Sales, Property, and Income Taxes
A consumer who purchases a vehicle must also pay sales and property taxes associatedwith the sale and ownership of the vehicle. Employed vehicle owners also incur income taxes. Each of these taxes supports government operations and pays for public services, includingsome related to the transportation system. These taxes are non-use-related because the fee (i.e.,the tax) and the time at which the fee is incurred by an individual driver or vehicle owner arenot associated with an actual trip.
Registration Fees
An additional cost of vehicle ownership is the registration fee. In most cases,registration fees cover the administrative cost of collecting and maintaining automobile andvehicle owner data. Registration fees are non-use-related, since vehicle owners must registertheir vehicles regardless of use. Registration fees are usually based on automobile marketvalue (which discourages the purchase of newer cleaner vehicles), and not on vehicle milestraveled or time of day during which the vehicle is used.
Automotive Repair and Maintenance Costs
Sooner or later, all vehicle owners are faced with automotive repair and maintenancecosts. Maintenance might consist of (but is not limited to) tire rotation/replacement, engine oilchanges, windshield wiper replacement, replacement of worn brake pads, maintaining propertire inflation levels, etc. The costs associated with routine maintenance and non-routine repairsare use-related, but only indirectly. Many maintenance activities are not absolutely necessaryfor vehicle operation, only for extended or enhanced vehicle performance. Also, maintenancecosts only occur occasionally and are not associated with individual trips.
Tolls
At some point almost every driver comes across a road, bridge, or tunnel with a toll. Tolled facilities normally have booths set up to charge drivers some set price for utilizing thefacility (stretch of road, bridge, or tunnel). The toll only covers a particular portion of the trip,and is encountered during a trip, rather than at the beginning or the end. Normally tollrevenues are used to pay for road construction or maintenance or other transportationinfrastructure expenses. Because toll road fees are incurred while driving, they are use-related(but are not congestion-related).

Chapter 2 - The Current Price of Driving 17

Chapter 2 - The Current Price of Driving18
Parking Fees
In urban areas, drivers are often confronted with parking fees once they have reachedtheir destination. In most suburban or rural areas, parking fees are extremely rare. Expensiveparking charges may affect a driver's ability or willingness to travel to a certain destination. Since parking fees are assessed at the end of a trip, these charges are generally considered use-related. The fees collected normally do not support public road network expenses.
Transit Fares
Some travel consumers choose other options to meet their mobility needs. Many ofthem use public transportation (buses, light rail, subway, etc.) and are charged a transit fare. Insome cases, transit riders are charged for a trip based on its length. In other cases, transit riderspay a fixed fee per use, regardless of the distance traveled. Transit fares are directly use-relatedbecause the consumers of public transportation are charged at the time of service, and the fareis used specifically to support the service.
CONCLUSION: THE ROLE OF TRANSPORTATION
PRICING MEASURES
As this chapter has demonstrated, there are many costs that drivers must pay in order toown and drive their vehicles. As noted in Chapter 1, driving also imposes many costs onsociety as a whole, including pollution and congestion, that are not paid for by the individualswho created them. Market-incentive measures, such as transportation pricing, can be used toincorporate these external costs in the prices consumers pay for transportation, and thus candirectly or indirectly affect consumer choices for transportation modes, travel times, as well asorder and coordination of trips. Transportation pricing can replace other costs consumers face. In addition, transportation pricing can ensure that consumers in the marketplace pay a price thatmore accurately reflects the true costs of travel.

Chapter 3 - Examples of Transportation Pricing Programs 19
CHAPTER 3Examples of Transportation Pricing Programs
In recent years, a growing body of studies, proposals and projects experimenting withtransportation pricing measures has begun to emerge. Although many case studies continue tocome from abroad, where political and cultural differences cloud some of the lessons thoseexperiences might offer, transportation pricing measures are beginning to be used in the UnitedStates as well, particularly in severely congested and polluted areas like Southern California.Currently, FHWA’s Congestion Pricing Pilot Project Program appears to provide the greatestimpetus for such programs, offering funding, support and the opportunity to explore thesemeasures in an experimental context (relieving some of the political opposition that mightotherwise exist). A review of example projects, both hypothetical and applied, can be extremelyuseful in understanding the future such of market-based incentive measures in the U.S.
Parking pricing, roadway pricing, gasoline taxes, and modal subsidies have all beenimplemented to some extent while emissions fees and VMT fees have been the subjects of proposals. Other approaches, however, remain theoretical and have not been implemented. Because these measures are still in the early stages of development, there is significantvariability and uncertainty as to the projected impact on congestion and air quality from eachstrategy. This chapter provides a general discussion of each measure, including examples ofspecific programs where possible, and discusses the projected travel and emissions impacts ofthese measures.
TYPES OF TRANSPORTATION PRICING MEASURES
There is theoretical and empirical evidence that mobile source pricing and market-basedtransportation controls can achieve effective and economically efficient greenhouse gas andcriteria pollutant emissions reductions via travel demand management. As with any othereconomic activity that consumes scarce resources, motor vehicle travel involves a cost. Facedwith alternative modes of transportation, multiple destination options, and a variety of routesfrom an origin to a destination, travelers select modes and routes on the basis of monetary cost,travel time, comfort, and convenience. In the case of motor vehicle travel, monetary costs ofteninclude operating costs, such as gasoline, parking, vehicle repair, and toll costs, as well asownership costs, such as vehicle depreciation and insurance. While the latter costs may notseem to factor into each trip decision, the fact that the automobile owner has already investedheavily into that mode may encourage him or her to use it as much as possible rather than payanother set of costs to use mass transit, for example.

Shoup, Donald, “An Opportunity to Reduce Minimum Parking Requirements,” Journal of the American 19
Planning Association, Winter, 1995, p. 15.
Downs, Anthony, Stuck in Traffic: Coping with Peak-Hour Traffic Congestion, Brookings20
Institute/Lincoln Institute, 1992.
Chapter 3 - Examples of Transportation Pricing Programs20
Travel demand is inversely related to the costs described above — as costs increase, thedemand for motor vehicle travel decreases. The relationship between cost and the demand formotor vehicle travel has served as the underlying rationale for the design, development, andimplementation of strategies that attempt to mitigate the detrimental externalities associated withmotor vehicle travel (e.g., air pollution, energy consumption, noise, etc.).
The purpose of this section is to review the types of transportation pricing programs thatStates and localities can implement to promote a more efficient use of the transportation system. The goal of these measures is to incorporate pricing signals that affect consumer travel decisionsto encourage the use of environmentally cleaner modes of transport in an economically efficientmanner. More specifically, the cost of travel, or transportation, is adjusted so that consumers inthe marketplace pay a price for automobile travel that more accurately reflects the actual cost ofdriving in terms of air quality (among other societal costs - see Chapters 1 and 2). The pricingprograms reviewed here are classified into the following categories:
C Parking management and pricing; C Fuel taxes; C Pay-at-the pump charges; C VMT fees; C Emissions fees; C Road pricing; andC Modal subsidies.
Each of these pricing strategies is discussed below. In addition, Table 3-1 summarizes the majortransportation pricing programs in place in the United States and abroad. Detailed case studiesare provided for several of these projects in Appendix A.
Parking Pricing
Given that employer-paid parking subsidizes about one-third of all automobile travel, andabout two-thirds of all automobile travel in the morning peak, parking pricing has the potential19
to be one of the most effective measures in reducing peak-hour congestion. Well over 90percent of American workers receive free parking at their places of employment, an untaxedfringe benefit. Employers and municipalities can reduce the number of automobile trips into a20
given area with parking strategies, thus reducing congestion, VMT, and vehicle emissions.

For more information on parking cash-out, see Shoup, Donald, “An Opportunity to Reduce Minimum21
Parking Requirements,” Journal of American Planning Association, Winter 1995, p. 14.
Chapter 3 - Examples of Transportation Pricing Programs 21
These strategies can take the form of higher parking prices to account for parking’s true cost anda charge to employees for parking. Parking strategies also include allowing employees to cashout of their parking benefits, or the choice of a parking space or a transit subsidy equivalent tothe value of the parking space.
Increasingly, employers are beginning to raise parking costs to bring them closer tomarket price in order to discourage the use of single occupancy vehicles (SOV), largely due tomore stringent air quality requirements. In addition to employer-based policies, some cities andregions are also looking to use area-wide parking strategies to address severe congestionproblems, particularly in large central business districts (CBDs). Some analysts encourage thedevelopment of these policies on a metropolitan scale in order to prevent overflow parking onresidential streets or surrounding lots. Although few region-wide parking pricing programs arein place, the City of Minneapolis, Minnesota, Portland, Oregon, and King County inWashington have made efforts to put in place metropolitan-wide policies.
Despite recent discussions, there has been no action to reduce or abolish subsidizedparking’s tax-exempt status. There has been recent attention, however, regarding proposals toallow employers to offer transit subsidies, which can work in conjunction with increasedparking prices to reduce SOV travel as an untaxed fringe benefit. There has also been recentattention regarding proposals to allow employers to give their employees the option of a parkingspace or the equivalent monetary value. This is known as “parking cash-out.” 21
Parking cash-out was recently made easier by the Tax Relief Act of 1997, which wassigned on August 6, 1997. The new act changes the tax code to permit employees to accept cashin lieu of parking benefits. Effective during tax years beginning after December 31, 1997,employees may choose between receiving parking and taxable salary. And employers who wantto offer their employees a choice between free parking or a raise in salary can now do so withoutlosing the parking tax exemption for those employees who choose to keep their parking spaces(previously, the Internal Revenue Code provided that if an employer offered commuters theoption to choose cash in lieu of a parking subsidy, the parking subsidy itself ceased to qualify asa tax-exempt fringe benefit).
This change gives employees greater freedom to choose how they commute to work. For employees whose only transportation benefit is parking can now accept a salaryenhancement instead and use transit, walk, vanpool, carpool, or ride a bicycle to work. Thisgreater flexibility may shift single occupant vehicles from our highways and contribute toreduced congestion.

Downs, Anthony, Stuck in Traffic: Coping with Peak-Hour Traffic Congestion, Brookings22
Institute/Lincoln Institute, 1992.
Chapter 3 - Examples of Transportation Pricing Programs22
Effect of Fuel Taxes on Motorist Behavior
Advocates of higher fuel taxes point to their ability tolevy the costs at the source of the activity. The oilcrises of the 1970s are often pointed to as anindication of the enormous response of the Americanpublic to radically increased gasoline prices. Someeconomists argue, however, that scarcity played moreof a role in that situation than price. While variousestimates for the elasticity of gasoline demand exist(see later discussion on elasticity),it is clear that certain factors canaffect a consumer’s response to achange in the cost of fuel. Onesuch factor, which is crucial to thesuccess of most transportationpricing measures, is the availabilityof alternative forms oftransportation in the affectedregion.
Case studies suggest that parking pricing strategies are most effective in areas wheretransit is already available. However, even where no public transportation exists, higher parkingcosts would encourage more ridesharing. If rideshare or park-and-ride services are offered in22
addition to increased parking prices, this would further promote van- and carpooling.
Fuel Taxes
This pricing strategy involves taxing fuel to more accurately reflect the costs associatedwith single occupancy vehicle highway travel. The primary goal of fuel taxes is to discourageprivate vehicle (principally single occupancy vehicle or SOV) use by effectively and directlyincreasing the cost of travel. Fuel consumers (drivers), through their pocketbooks, become morecognizant of the societal costs or externalities (e.g. air pollution) imposed by SOV travel.
Because driving becomes more costly for all travelers, fuel taxes tend to indirectly affectmode shift, as well as the frequency and duration of trips. These impacts often lead to decreasesin vehicle miles traveled (VMT). VMT reductions, in turn, can positively impact air quality byreducing emissions. If the primary goal of a pricing strategy is to reduce air pollution, thentaxing fuel can be viewed as a means ofpricing the pollution associated with fueluse.
Fuel taxes have long been used inthis country to recover a portion of roadconstruction and maintenance costs. Inrecent years, however, federal and/or statefuel taxes have increasingly been viewedas a potential tool for recovering othercosts as well as for reducing VMT andencouraging improvements in fuelefficiency. Proposals to tax fuel based oncarbon emissions, to increase taxes tocover all road costs, or to use high taxesto discourage driving in general have allsurfaced. In 1993, fuel taxes made upapproximately 23 percent of fuel prices,but a very small percentage of total car

U.S. Bureau of the Census, Statistical Abstract of the United States: 1993, 1993.23
MacKenzie, James J., Roger C. Dower, and Donald D. T. Chen, The Going Rate: What It Really Costs24
to Drive, World Resources Institute, Washington, DC, 1992. Also, Downs, 1992.
Chapter 3 - Examples of Transportation Pricing Programs 23
ownership costs. As fuel tax advocates point out, American gasoline prices are a mere fraction23
of those in other industrialized nations, most notably Japan and Italy. Countries such as Swedenmay levy several taxes on fuel alone.
There are significant obstacles to increasing fuel taxes to capture more of the social costsof driving (e.g., congestion and pollution costs). Most estimates suggest that prices would haveto be raised by more than $1 per gallon to significantly influence driving behavior. Public24
outrage at higher taxes in itself is probably enough to prevent any proposal from getting very farwithout a very thorough public education campaign. In addition, border issues can play animportant role, unless the majority of fuel taxes were levied on the federal level. For thesereasons and others, discussion of higher fuel taxes in this country remains just that for the timebeing.
Another fuel tax strategy, which could be used as a transportation pricing strategy, is toreduce existing taxes for “clean” or alternative fuels. In fact, until the year 2000, a 5.4 centexemption from federal gasoline taxes exists for fuels containing at least 10 percent ethanol.
Pay-at-the-Pump Charges
Pay-at-the-pump (PATP) charges are distinguished from fuel taxes in that they aredesigned to shift the collection of driving-related costs away from the current system of annualor semi-annual lump-sum payments, to payments made when gasoline is purchased. In mostscenarios, this measure does not add costs, but simply shifts the point of payment in order toreinforce the perceived relationship between cost and behavior. As noted by EDF economistMichael Cameron, “the longer the period between the time people drive and the time when theymust pay the fee, the less impact the fee will likely have on people’s decision to drive.” Thecosts shifted to the pump could include insurance premiums, vehicle registration fees, andemissions testing and inspection/maintenance fees. Some proposals also suggest that asurcharge be added to more fully recover the costs of road construction and maintenance. Although this measure has not been implemented, it closely resembles the widespread use offuel taxes to cover a portion of such costs. If implemented, however, this type of PATP chargewould factor in the remaining portion of road costs that are currently not paid for throughgasoline taxes. The most salient distinction between PATP fees and simpler fuel taxes is thatPATP charges could replace emissions testing fees and registration fees, or other costs thatdrivers must pay, such as automobile insurance.

Deakin, Elizabeth and Greig Harvey, Transportation Pricing Strategies for California: An Assessment25
of Congestion, Emission, Energy and Equity Impacts, Technical Report prepared for the California AirResources Board, June, 1995.
Cameron, Michael, Efficiency and Fairness on the Road: Strategies for Unsnarling Traffic in Southern26
California, Environmental Defense Fund, Oakland, CA,1994; also Downs, 1992.
Cameron, 1994.27
Chapter 3 - Examples of Transportation Pricing Programs24
Price Elasticity
Elasticity is a measure of the sensitivity of demand relative to price. Elasticity indicates howconsumers will respond if the price of a product changes. Technically, price elasticity measuresthe percentage change in demand for a good relative to a one percent change in the price of thatgood. Thus, a price elasticity for fuel of -0.02 indicates that if fuel prices increase by 10 percent,the demand for gasoline would decrease by 2 percent (-2%/10% = -0.02)
PATP charges would generally be levied on a per-gallon basis, therefore discouragingfuel use, VMT and vehicle emissions. Traffic congestion and the associated air quality impactsare only indirectly affected (depending on the price of the charge) because peak travel and travelon crowded roadways is not specifically discouraged. Reductions in both congestion and airpollution are expected, however, as some travel would be reduced in response to the change inthe collection of the various costs of driving. At least initially, higher fuel prices would result inmotorists cutting down on the most unnecessary or lowest value trips. Work trips, which tend tofall during peak hours, would likely be the last to go. PATP charges are also expected toencourage shifts to more fuel-efficient engines, because reducing fuel use could result in asignificant amount of savings.
Estimates of the elasticity of fuel use in relation to fuel costs range from -0.2 to -0.3 inthe short term, and from -0.05 to -0.22 in the long-term. Short-term responses to higher fuel25
prices will likely be slight decreases in VMT, while the longer term will bring slightly morereliance on fuel-efficient engines, depending on the magnitude of the price change. (See sidebarfor further explanation of price elasticity.)
Theoretical estimates for PATP charges, factoring in road construction and maintenancecosts, suggest adding an additional 10 cents per gallon fee to cover these costs. If insurance26
costs were included, the additional fee would rise to 25 cents per gallon. Any large-scale27
efforts to shift driving costs to pump charges are likely to include insurance reform. Statesconsidering automobile insurance reform, such as Florida and California, have in fact, tended tobe the ones considering PATP scenarios.

Deakin, 1995.28
Deakin, 1995.29
Chapter 3 - Examples of Transportation Pricing Programs 25
In a PATP insurance scenario, drivers would pay a small premium per gallon of gasolinethat would cover the “actual risk associated with driving the distance that a typical car can travelon a gallon of gas.” A similar system can be applied based on the number of vehicle miles28
traveled (see below). High-risk vehicles or drivers would most likely be required to pay aregistration or licensing surcharge to make up the difference in their insurance premiums. Theprocess of obtaining insurance would be simplified, and uninsured portions of the population(close to 30 percent of drivers in some areas) would be significantly (if not entirely) reduced. Ina California proposal, the money would be collected by the state with the tax money it alreadycollects at the pump. The funds would then be distributed to a series of private insurers29
proportional to their coverage. Such a program could save many drivers money by reducingcosts for uninsured motorists and would provide incentives to increase fuel efficiency. Furthermore, PATP charges encourage a reduction in VMT because drivers will be more awareof how much money they actually spend per mile of travel.
One of the greatest barriers to PATP measures are border issues. PATP charges wouldrequire state or large regional participation in order to make all of the necessary institutionalchanges. Residents of jurisdictions that have implemented the program would have significantincentives to cross jurisdictional lines for cheaper gasoline. As a result, implementation on alarger scale, whether county, state or federal level, could be useful in reducing side effects thatmight result around border communities. Although a growing number of states have begun toconsider PATP charges, this type of measure has not yet been implemented. In addition, publicacceptance of any type of gasoline price increase might make a PATP program difficult toimplement. Thus, any such program would need to be augmented with significant publiceducation efforts.
VMT Fees
Fees based on the number of vehicle miles traveled (VMT fees), which are levied as asurcharge on every mile of travel, generally fall into one of several categories depending onwhere and when they are levied. If the fees are assessed at the pump as additions to the price ofgasoline (assuming that each gallon represents a certain number of miles traveled), they areviewed as PATP charges. If they are assessed as per-mile tolls for the use of specific facilities,they fall under roadway pricing. They may also be attached to registration or emissions fees, inthe form of per-mile surcharges that may vary by the emissions class that a vehicle falls into ormeasured emissions.
However they are levied, VMT fees promote reductions of both congestion andpollution. In contrast to measures such as gasoline taxes, where the costs can be reduced with

Chapter 3 - Examples of Transportation Pricing Programs26
more efficient engines, the only way to reduce one’s costs under this measure is to drive less,thus reducing emissions and traffic. Although VMT fees can impact both pollution andcongestion, they are likely to have a lesser effect on either than a fee designed specifically toreduce vehicle emissions or traffic congestion individually. This is primarily because VMT feescharge a flat fee for every mile driven, whereas a more specialized fee would vary based on theemissions characteristics of the vehicle, the air quality conditions during the time of travel or thetraffic conditions during the time of travel. The effect of a VMT fee will depend on the size ofthe fee, the types of vehicles currently driven, how the program is administered, and theavailability of travel alternatives in a particular area.
Emissions Fees
Emissions fees (often referred to as “smog fees,” particularly in California) propose tointernalize the costs of pollution by charging drivers per pound of gaseous emissions they create. These fees directly affect emissions by encouraging a shift to cleaner burning engines andreduced use of higher polluting vehicles. A recent study in Southern California reviewed thepossible impacts of emissions fees and concluded that, when combined with other measures,emissions fees could reduce emissions and congestion significantly. This and other studiesshowed emissions fees to be very effective for reducing gaseous emissions.
The use of emissions-based fees has been considered by several states includingCalifornia, where smog fees have been repeatedly proposed, and Maryland, where the statelegislature adopted a system of emissions fees in 1994. The Maryland emissions fee plan wasoverturned, however, on the grounds that it violated the State’s constitution. Thus, althoughemissions tests are required and often associated with testing fees in some parts of the U.S.,charges on actual emissions have not been implemented.
It is also possible to vary other related fees and taxes, including taxes on the purchase ofan automobile (very high in Scandinavian countries and Singapore) or registration fees, basedon the automobile’s fuel efficiency, engine type (diesel, gasoline, alternative fuel), engine sizeor power, or vehicle age or weight. These types of fees are related to emissions fees and couldaffect the types of vehicles purchased depending on how the fees are determined.
Roadway Pricing
Roadway pricing refers to the use of fees on any road for any purpose. As atransportation pricing strategy, this measure attempts to cover road costs and can serve to reducecongestion or travel on specific facilities, roadways, or in general regions by implementing feesthat increase the costs of driving in these areas and/or at specific times of the day. The idea isthat drivers will respond by (1) driving during non-peak hours, thus spreading out traffic more

Chapter 3 - Examples of Transportation Pricing Programs 27
Roadway Pricing and Technology
The use of roadway pricing has been greatly facilitated inrecent years by significant advances in technology, whichreduce operational costs, radically improve trafficmovement (by eliminating the need to stop at toll plazas),and facilitate toll collection and enforcement. The majorinnovations include automatic vehicle identification (AVI),which utilizes vehicle-mounted transponders and roadsidesensors, and automatic toll collection (ATC), which oftenuses pre-paid monthly balances to facilitate billing. Suchtechnology is in the process of being implemented inSingapore, and is already in place along California’s StateRoute 91. Opened in December of 1995, the California SR-91 Project operates on a 10-mile stretch of highly-congestedhighway in the Los Angeles metropolitan area and isheralded as the world’s first entirely automated congestionpricing program (see Appendix A for more information onthis project). This type of technology is an enormous boostin the practicality, effectiveness, and public appeal ofcongestion pricing.
evenly throughout the day; (2) driving on other, less-congested and perhaps underutilized roads;(3) telecommuting rather than driving to work; or (4) switching to other modes (such as transit,bicycle, walking, or higher occupancy vehicles). This measure may also be used to fund roadconstruction and maintenance. Generally, roadway pricing falls into one of three categories.
C Facility pricing, under which fees are assessed for travel on a bridge, tunnel, orsimilarly small, but easily controlled segment of a road. Facility pricing may beeasier to implement on a local level than pricing a longer segment of road.
C Road pricing, which is assessed at one or more points (traditionally, toll booths)along a specific roadway. This pricing may be more effective in reducing VMTthan facility pricing.
C Cordon pricing, under which fees are assessed for travel within a particular area. Cordon pricing establishes a series of pricing points in a ring around thecongested area, whether it be a central business district or a greater metropolitanarea. Motorists are then charged as they enter the cordoned area.
Congestion pricing is a type ofroadway pricing that refers to the use offees for the specific purpose of reducingcongestion. Under a congestion pricingstrategy, the fees for traveling on acongested transportation facility or areamay vary by location, time, distancetraveled, or vehicle occupancy accordingto the level of congestion. Duringperiods of congestion, or “peak” periods,the charges will be higher. Travel during“off-peak” periods (i.e., periods of lesseror no congestion) will be less expensiveor free.
Roadway pricing, and particularlycongestion pricing, is the market-basedmeasure that appears to be receiving thegreatest attention in the United States(particularly as a result of FHWA’sCongestion Pricing Pilot Project, whichhas led to a number of studies, proposalsand actual projects). In addition, international experience provides further insights into theseconcepts. The city-state of Singapore introduced a cordon scheme of congestion pricing in thelate 1970s that continues to expand today. In Norway, the three largest cities have used a

U.S. DOT, Federal Highway Administration, Congestion Pricing Notes, (various from 1996).30
Deakin, 1995.31
Chapter 3 - Examples of Transportation Pricing Programs28
Example: The California SR-91 Project and the San Diego I-15 Express Lanes Project
California SR-91 is the result of a public-private partnership in which a private company sets up,maintains and operates a stretch of toll road for profit. The California Department of Transportation(Caltrans), the main public partner, benefits by gaining additional HOV lanes that could not have beenbuilt without private financial support. Early in the development of this project, public support wasexceedingly low, based on objections to the pricing of an historically free roadway. After an extensiveeducational campaign, however, public response improved significantly as road users understood thatthe tolls would make possible the construction of new capacity, that congestion was likely to decline,and that existing lanes would not be charged. A similar situation exists with San Diego’s I-15 ExpressLanes Project. Under this project, SOVs may pay for access to underused HOV lanes. Surveys foundsignificant support for the San Diego measure and a widespread willingness-to-pay for reductions intravel time. (See Appendix A for more information on these projects.)
similar system to raise funds for transportation projects, and Sweden will be following throughwith a series of measures to combat congestion and pollution in the greater Stockholm area.30
Currently, twenty states have roadway pricing in the form of toll roads, bridges ortunnels with costs averaging between $0.02 and $0.10 per mile. Congestion pricing schemes31
greatly increase those rates, but drivers have demonstrated a fairly strong willingness-to-paywhen the fees offer some perceived value, such as time savings or improved road conditions. This is perhaps why congestion pricing is an increasingly popular form of transportation pricing.
Modal Subsidies
Modal subsidies involve providing financial support to alternative modes of transit,including bus, rail, HOV, or alternative fuel vehicle travel. A subsidy represents a situationwhere the amount users pay for a given transportation mode is intentionally set at less than thecost to the supplier of that service. Subsidies are most often used as a means of encouraging theuse of particular transit modes. Providing subsidies to alternative travel modes can serve tosupport increased transit options for citizens as well as increase air quality and decreasecongestion.
Chapter 3 - Examples of Transportation Pricing Programs 29
Example: Milwaukee County “Commuter Check”Program
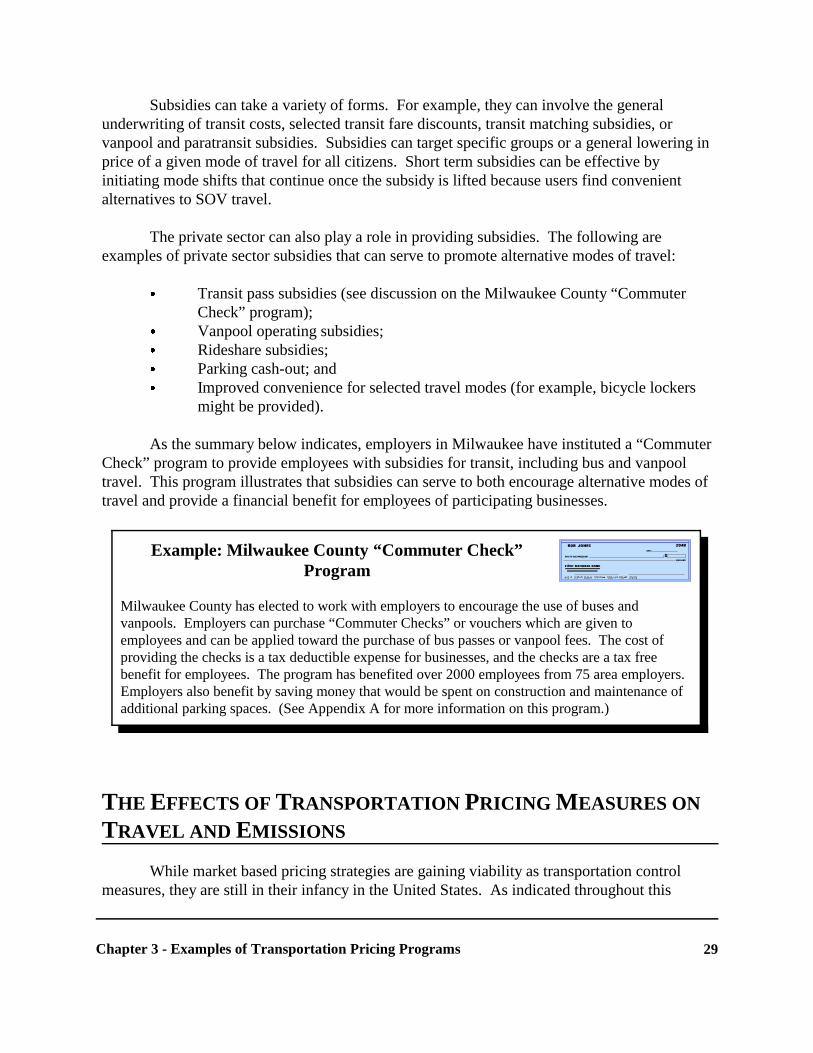
Milwaukee County has elected to work with employers to encourage the use of buses andvanpools. Employers can purchase “Commuter Checks” or vouchers which are given toemployees and can be applied toward the purchase of bus passes or vanpool fees. The cost ofproviding the checks is a tax deductible expense for businesses, and the checks are a tax freebenefit for employees. The program has benefited over 2000 employees from 75 area employers. Employers also benefit by saving money that would be spent on construction and maintenance ofadditional parking spaces. (See Appendix A for more information on this program.)
Subsidies can take a variety of forms. For example, they can involve the generalunderwriting of transit costs, selected transit fare discounts, transit matching subsidies, orvanpool and paratransit subsidies. Subsidies can target specific groups or a general lowering inprice of a given mode of travel for all citizens. Short term subsidies can be effective byinitiating mode shifts that continue once the subsidy is lifted because users find convenientalternatives to SOV travel.
The private sector can also play a role in providing subsidies. The following areexamples of private sector subsidies that can serve to promote alternative modes of travel:
C Transit pass subsidies (see discussion on the Milwaukee County “CommuterCheck” program);
C Vanpool operating subsidies;C Rideshare subsidies;C Parking cash-out; andC Improved convenience for selected travel modes (for example, bicycle lockers
might be provided).
As the summary below indicates, employers in Milwaukee have instituted a “CommuterCheck” program to provide employees with subsidies for transit, including bus and vanpooltravel. This program illustrates that subsidies can serve to both encourage alternative modes oftravel and provide a financial benefit for employees of participating businesses.
THE EFFECTS OF TRANSPORTATION PRICING MEASURES ON
TRAVEL AND EMISSIONS
While market based pricing strategies are gaining viability as transportation controlmeasures, they are still in their infancy in the United States. As indicated throughout this

Chapter 3 - Examples of Transportation Pricing Programs30
chapter, the projects that are being executed are in very early stages of implementation. As aresult, almost no real-world observations of the effectiveness of these measures in reducingcongestion and emissions are available. As these projects are completed and enter theirevaluation stages, this information should be available.
Despite the lack of case specific information, a number of theoretical studies haveattempted to estimate the impacts of transportation pricing measures, particularly in the morecongested, heavily-polluted areas of the country. Various integrated modeling techniques havebeen used to make these projections. Researchers have used travel demand analysis models anddemand elasticity estimates to analyze the effectiveness of transportation pricing on travelbehavior, traffic flow, and emissions. In addition, inferences from limited real-worldexperiences with transportation pricing and results of stated preference studies have been usedto estimate the benefits of these measures. Table 3-1 provides a brief summary of the estimatedeffects of various transportation pricing measures on vehicle travel and vehicle emissions.
Parking pricing has been one of the more popular measures in the U.S., providing morecertain information as to its effectiveness. Several studies have found that people are fairlywilling to use alternative modes of travel, such as carpooling and transit, as opposed to SOVtrips, in response to higher parking prices. Price elasticities, in terms of SOV trips, areestimated to range between -0.1 and -0.2, indicating that, for example, a 100 percent increase inparking prices would result in a 10 to 20 percent reduction in SOV trips. Therefore, raisingparking prices is a fairly effective way to reduce VMT, congestion, and air pollution. Theprojects cited in Table 3-1, almost all of which were conducted by employers of more than 100people, showed significant impacts on SOV use, with reductions ranging from 66 to 81 percentat a given worksite. Vehicle trips, a similar indicator, also showed considerable reductions. Noemissions information was available for parking pricing, though it is possible to makeprojections based on estimated VMT reduction figures for a specific area.
Estimates suggest that VMT will decline by 2 to 2.5 percent when VMT fees are raisedby 10 percent (representing estimated price elasticity between -0.2 and -0.25). Because they donot encourage a shift to cleaner burning engines (because every car is charged the same rate permile), the effects of VMT fees on gaseous emissions are smaller and more indirect than wouldbe expected from emissions-based fees. The studies discussed in Table 3-1 found that VMTfees of $0.01 to $0.05 per mile alone would reduce gaseous emissions and VMT by about 4 to11 percent, while a VMT fee weighted by emissions was estimated to have a significantlygreater impact on emissions, particularly for VOC and NO . x
Congestion fees are similar to VMT fees. However, according to the studies below, theytend to have lower air quality impacts but a greater ability to reduce congestion. The reducedimpact on emissions is possibly due to the fact that congestion pricing is more likely to shifttravel from congested periods to less congested periods than to have a significant impact on thetotal number of trips. Although the study summarized in Table 3-1 estimates very limitedimpacts, congestion pricing programs are being widely embraced under FHWA’s Congestion

Deakin, 1995.32
Fuel elasticity is defined as the percentage change in quantity of gasoline purchased for each percentage33
change in gasoline price.
EPA and DOT, forthcoming.34
Chapter 3 - Examples of Transportation Pricing Programs 31
Pricing Pilot Project Program, in part because congestion is of greater concern than emissions inthis program. Thus, several projects are expected to provide concrete results regarding theeffect of congestion pricing in the next few years.
Just as VMT fees are effective at reducing VMT, emissions fees which vary dependingon how much the vehicle pollutes are estimated to be quite effective at reducing pollutantemissions, though not as effective at reducing congestion or VMT. Estimates show that a 10percent increase in an emissions fee would be expected to reduce emissions by 5 percent, butreduce VMT by only 1.5 percent. One of the primary reasons that emissions fees are not likelyto result in a significant VMT effect is because some drivers can substitute a cleaner car tooffset fees. As a result, however, emissions fees are expected to lead to improvements invehicle fleet fuel efficiency over the long term because they give people a financial incentive tobuy cleaner cars.
Fuel elasticity estimates vary considerably (ranging between -0.05 and -0.22 ). In the32 33
short term, a driver’s response to fuel taxes would be to eliminate unnecessary trips or VMT,while over the long term, drivers would shift towards cars with improved fuel efficiency with asmaller change in VMT. The studies summarized in Table 3-1 estimated very small impactsfrom fuel taxes on both emissions and VMT.
Modal subsidies have not received significant attention on their own, as they are usuallyapplied in tandem with other measures. The existence of alternative modes of transportation,however, can be extremely important in determining the effect of subsidies on the demand forvehicle travel.
As projections, the studies summarized in Table 3-1 involve a considerable degree ofuncertainty, relying on a number of significant assumptions about a variety of factors rangingfrom shifting demographics to behavioral responses. Nonetheless, the findings of these studiesindicate that transportation pricing measures have the potential to offer substantial reductions inair pollution, greenhouse gases, and traffic congestion.
A companion document, “Guidance on the Use of Market Mechanisms to ReduceTransportation Emissions” provides guidance on estimating the emissions reductions and traveldemand changes for a specific transportation pricing program.34

S
urb
er,
Mon
ica;
Don
ald
Sh
oup
, an
d M
artin
Wac
hs,
“E
ffect
s of
En
din
g E
mp
loye
r P
aid
Par
kin
g fo
r S
olo
Driv
ers.
” T
ran
spor
tatio
n R
esea
rch
35 Rec
ord
95
7,
19
94
.
W
illia
ms,
Mic
hae
l E.
and
Kat
hle
en P
etra
it, U
-Pas
s: A
Mod
el fo
r T
ran
spor
tatio
n M
anag
emen
t th
at W
orks
, P
rese
nte
d a
t Tra
nsp
orta
tion
Res
earc
h36 B
oard
An
nu
al M
eetin
g, J
anu
ary,
19
93
.
U
.S.
EP
A,
Offi
ce o
f Pol
icy,
Pla
nn
ing,
an
d E
valu
atio
n,
Gu
idan
ce o
n th
e U
se o
f Mar
ket M
ech
anis
ms
to R
edu
ce T
ran
spor
tatio
n E
mis
sion
s,
37 Alm
ost F
inal
Dra
ft, M
ay 3
0,
19
96
.
Cha
pter
3 -
Exa
mpl
es o
f T
rans
port
atio
n P
ricin
g P
rogr
ams
32
TA
BLE
3-1
E
ST
IMA
TE
D E
FF
EC
TS
OF
TR
AN
SP
OR
TA
TIO
N P
RIC
ING
ME
AS
UR
ES
ON
TR
AV
EL
DE
MA
ND
AN
D E
MIS
SIO
NS
(RE
SU
LTS
FR
OM
VA
RIO
US
ST
UD
IES
)
CA
TE
GO
RY
STR
AT
EG
YSO
UR
CE
SCE
NA
RIO
RE
SU
LTS
Par
king
Pric
ing
Em
ploy
eepa
rkin
gfe
es:
35,3
6,37
Var
ious
pro
ject
s (b
oth
$1.
37 to
$2.
73/v
ehic
le/d
ayC
12 to
39
perc
ent r
educ
tions
in V
MT
to a
shor
t and
long
term
)in
crea
se in
par
king
fees
.w
orks
itein
whi
ch p
arki
ng fe
esC
66 to
81
perc
ent d
ecre
ase
in S
OV
s at
aw
ere
rais
ed.
wor
ksite

CA
TE
GO
RY
STR
AT
EG
YSO
UR
CE
SCE
NA
RIO
RE
SU
LTS
U
.S.
EP
A,
19
96
.38
P
uget
Sou
nd R
egio
nal
Cou
ncil,
199
5 U
pdat
e of
the
Met
ropo
litan
Tra
nspo
rtat
ion
Pla
n fo
r th
e C
entr
al P
uget
Sou
nd R
egio
n:
Eva
luat
ing
39 Con
gest
ion
Pric
ing
Alte
rnat
ives
for
the
Pu
get S
oun
d R
egio
nal
Cou
nci
l,
Tec
hn
ical
Pap
er M
TP
17
a,
Au
gust
, 1
99
4.
Cha
pter
3 -
Exa
mpl
es o
f T
rans
port
atio
n P
ricin
g P
rogr
ams
33
Diff
eren
tial
fees
:38
Var
ious
pro
ject
s in
$1.6
0 to
$5
per
vehi
cle/
day
C19
to 3
1 pe
rcen
t red
uctio
ns in
veh
icle
trip
sw
hich
SO
V p
arki
ngfo
r S
OV
s;co
mm
unity
wid
era
tes
wer
e ra
ised
or
$0 to
$2
per
vehi
cle/
day
for
HO
V r
ates
wer
eca
rpoo
ls;
low
ered
.up
to $
42/m
onth
tran
sit
subs
idy;
up to
$15
/mon
th c
arpo
olsu
bsid
y.
Fue
l Tax
esF
uel t
ax:
39S
tudy
of v
ario
us r
ates
.$0
.40
to $
2 ad
ditio
nal
C1.
4 to
7.2
per
cent
dec
reas
e in
VM
Tch
arge
per
gal
lon.
C1.
2 to
6.7
per
cent
trip
red
uctio
nC
1.4
to 2
5.7
perc
ent d
ecre
ase
in C
O2
C1.
4 to
7.1
per
cent
dec
reas
e in
VO
CC
1.3
to 7
per
cent
dec
reas
e in
CO
C1.
2 to
6.9
per
cent
dec
reas
e in
NO
x

CA
TE
GO
RY
STR
AT
EG
YSO
UR
CE
SCE
NA
RIO
RE
SU
LTS
C
amer
on,
19
94
.40
C
OM
SIS
Cor
por
atio
n,
Dra
ft P
ricin
g D
ocu
men
t,
19
95
.41
Cha
pter
3 -
Exa
mpl
es o
f T
rans
port
atio
n P
ricin
g P
rogr
ams
34
Em
issi
ons
Fee
sV
arie
d by
vehi
cle
effic
ienc
y:
40
Stu
dy o
f var
ious
rat
es.
$0.0
1 to
$0.
05/m
ile o
nC
2 to
7 p
erce
nt d
ecre
ase
in p
eak
perio
dhi
ghw
ays.
VM
TC
2 to
12
perc
ent d
ecre
ase
in p
eak
perio
dve
hicl
e ho
urs
trav
eled
(V
HT
)C
8 to
37
perc
ent d
ecre
ase
in d
aily
VO
CC
4 to
17
perc
ent d
ecre
ase
in d
aily
NO
xC
8 to
20
perc
ent d
ecre
ase
in d
aily
CO
C3
to 7
per
cent
dec
reas
e in
dai
ly P
M10
VM
T-
Wei
ghte
dE
mis
sion
sfe
e:
41
$200
to $
1,20
0/ye
ar p
erC
1 to
7 p
erce
nt tr
ip r
educ
tion
vehi
cle.
Am
ount
dep
ends
C14
to 3
7 pe
rcen
t dec
reas
e in
VO
Con
the
estim
ated
em
issi
ons
C14
to 3
5 pe
rcen
t dec
reas
e in
CO
of in
divi
dual
veh
icle
type
s.C
5 to
18
perc
ent d
ecre
ase
in N
Ox

Ta
ble
3-1
, co
ntin
ue
d
CA
TE
GO
RY
STR
AT
EG
YSO
UR
CE
SCE
NA
RIO
RE
SU
LTS
P
uge
t Sou
nd
Reg
ion
al C
oun
cil,
19
94
.42
C
amer
on,
Mic
hae
l, E
ffici
ency
an
d F
airn
ess
on th
e R
oad
: Str
ateg
ies
for
Un
snar
ling
Tra
ffic
in S
outh
ern
Cal
iforn
ia.
En
viro
nm
enta
l Def
ense
Fu
nd
. 43 O
akla
nd
, C
A,
19
94
.
P
uge
t Sou
nd
Reg
ion
al C
oun
cil,
19
94
.44
Cha
pter
3 -
Exa
mpl
es o
f T
rans
port
atio
n P
ricin
g P
rogr
ams
35
At t
he P
ump
VM
TC
harg
esfe
es,
:42
43V
ario
us s
tudi
es$0
.01
to $
0.05
/mile
C9.
3 to
11
perc
ent d
ecre
ases
in V
MT
estim
atin
g re
sults
of
C8.
6 pe
rcen
t dec
reas
e in
trip
s; 1
0 pe
rcen
tV
MT
fees
in W
est
shift
to tr
ansi
tC
oast
met
ropo
litan
C4.
5 to
8.6
per
cent
dec
reas
es in
CO
area
s.C
4.1
to 9
.1 p
erce
nt d
ecre
ases
in V
OC
sC
5 to
8.6
per
cent
dec
reas
es in
NO
xC
9.4
perc
ent d
ecre
ase
in C
O2
C11
per
cent
dec
reas
e in
PM
10
Pay
-as-
you-
go c
arin
sura
nce:
Stu
dy e
stim
atin
g$0
.10
to $
0.40
/gal
lon
CE
stim
ated
32
MM
T/y
r re
duct
ion
in c
arbo
nre
sults
of a
nat
iona
lsu
rcha
rge
on g
asol
ine.
emis
sion
sP
AT
P s
chem
e.
Roa
dway
Con
gest
ion
Pric
ing
pric
ing
fees
:44
Stu
dy o
f var
ious
rat
es.
$0.0
5 to
$0.
30 p
er m
ile o
fC
5 to
10
perc
ent d
ecre
ase
in p
eak
perio
dro
ad, d
epen
ding
on
fact
ors
VM
Tsu
ch a
s th
e le
vel o
fC
No
effe
ct to
2 p
erce
nt d
ecre
ase
in N
Ox
cong
estio
n, ti
me
of d
ay, e
tc.
CN
o ef
fect
to 7
per
cent
dec
reas
e in
VO
CC
2 to
3 p
erce
nt d
ecre
ase
in P
M10

Ta
ble
3-1
, co
ntin
ue
d
Cha
pter
3 -
Exa
mpl
es o
f T
rans
port
atio
n P
ricin
g P
rogr
ams
36

Cha
pter
3 -
Exa
mpl
es o
f T
rans
port
atio
n P
ricin
g P
rogr
ams
37
TA
BLE
3-2
SUM
MA
RY
OF
TR
AN
SP
OR
TA
TIO
N P
RIC
ING
PR
OJE
CT
S
PR
OJE
CT
PH
AS
EC
OV
ER
AG
ED
ES
CR
IPT
ION
RE
SU
LTS
FU
ND
ING
Ber
kele
y T
RIP
Pro
ject
Impl
emen
ted
Pub
lic p
arki
ngP
arki
ng r
ates
rai
sed
toN
/AC
ity o
f Ber
kele
ylo
ts a
ndm
arke
t pric
ean
d U
nive
rsity
of
gara
ges
($3.
20/d
ay)
Fre
e fo
rC
alifo
rnia
at
HO
V-3
s.B
erke
ley.
*Cal
iforn
ia S
R 9
1P
roje
ctIm
plem
ente
d10
-mile
str
etch
Con
gest
ion
pric
ing
fees
Exp
ress
traf
fic h
as in
crea
sed
Priv
ate
fund
ing.
1995
of S
R-9
1 in
vary
from
$.5
0 to
$2.
75an
d sa
les
of tr
ansp
onde
rs h
asO
rang
epe
r ve
hicl
e, d
epen
ding
exce
eded
exp
ecta
tions
. 20
toC
ount
y; tw
oon
occ
upan
cy a
nd le
vel
25 p
erce
nt o
f the
traf
fic is
pric
ed la
nes,
inof
con
gest
ion.
Fre
quen
tm
ade
up o
f HO
V-3
+.
each
dire
ctio
n,T
rave
ler
Pro
gram
giv
esw
ere
adde
d in
user
s a
$0.5
0 di
scou
ntth
e m
edia
n of
on e
ach
trip
for
ath
e ex
istin
g$1
5/m
onth
fee.
Use
shi
ghw
ay.
AT
C.
*Cal
iforn
ia’s
Par
king
Cas
h-O
utP
rogr
am
Impl
emen
ted
Em
ploy
ers
ofC
alifo
rnia
sta
te la
wN
/AS
elf-
fund
ed b
y19
9350
or
mor
e, in
requ
ires
deve
lopm
ent o
fem
ploy
ers.
non-
atta
inm
ent
park
ing
cash
-out
area
s, w
hopr
ogra
ms
for
all
subs
idiz
eem
ploy
ers
of 5
0 or
park
ing
mor
e, lo
cate
d in
nona
ttain
men
t are
as.

Ta
ble
3-2
, co
ntin
ue
d
PR
OJE
CT
PH
AS
EC
OV
ER
AG
ED
ES
CR
IPT
ION
RE
SU
LTS
FU
ND
ING
Cha
pter
3 -
Exa
mpl
es o
f T
rans
port
atio
n P
ricin
g P
rogr
ams
38
Coa
litio
n fo
r Lo
cal
Env
ironm
enta
lS
olut
ions
and
aC
ompe
titiv
eE
cono
my
(CO
ALE
SC
E)
Em
issi
ons
Fee
and
Cou
pon
Pro
gram
Pro
posa
lS
outh
ern
Per
-mile
em
issi
ons
fees
N/A
CO
ALE
SC
E fu
nds.
Cal
iforn
iare
flect
ing
true
em
issi
ons
rate
s of
aut
o. Y
early
coup
on to
war
ds v
ehic
lem
aint
enan
ce o
rH
OV
/tran
sit u
se.
Dul
les
Gre
enw
ayP
roje
ctIm
plem
ente
d14
-mile
str
etch
Bui
lt to
div
ert t
raffi
cT
raffi
c vo
lum
e fo
r th
e fir
stT
oll R
oad
1995
of p
rivat
ely
from
hea
vily
con
gest
edth
ree
mon
ths
was
10,
500
Inve
stor
sow
ned
and
Rt.
7 an
d 28
. C
urre
ntve
hicl
es/d
ay -
- lo
wer
than
part
ners
hip
IIop
erat
ed to
llto
ll is
$1.
75 fo
ror
igin
ally
exp
ecte
d. V
olum
e(T
RIP
),V
irgin
iaro
ad in
com
plet
e tr
ip (
$0.1
25is
exp
ecte
d to
incr
ease
as
DO
T.
Loud
enpe
r m
ile).
Ant
enna
em
ore
com
mer
cial
driv
ers
Rev
enue
s w
ill fu
ndC
ount
y,pl
aced
in p
avem
ent
beco
me
awar
e of
the
road
’sH
OV
lane
Virg
inia
reco
rd to
lls fo
r A
TC
.be
nefit
s.co
nstr
uctio
n.
For
t Mye
rs/L
eeC
ount
y, F
lorid
aV
aria
ble
Brid
geT
oll P
roje
ct
Stu
dyC
ape
Cor
alP
hase
I -
Fea
sibi
lity
and
N/A
Loca
l fun
ds w
illco
nclu
ded
and
San
ibel
impa
ct s
tudi
es.
mak
e up
for
1997
Brid
ges
(to
beP
hase
II -
off-
peak
toll
pote
ntia
l los
tex
tend
ed to
disc
ount
s, 3
3 pe
rcen
tre
venu
e fr
omth
e M
idP
oint
peak
toll
incr
ease
.de
ferr
ed tr
affic
. B
ridge
afte
rS
urpl
uses
will
fund
com
plet
ion)
othe
r co
nges
tion
miti
gatio
n pr
ojec
ts.

Ta
ble
3-2
, co
ntin
ue
d
PR
OJE
CT
PH
AS
EC
OV
ER
AG
ED
ES
CR
IPT
ION
RE
SU
LTS
FU
ND
ING
Cha
pter
3 -
Exa
mpl
es o
f T
rans
port
atio
n P
ricin
g P
rogr
ams
39
Gle
ndal
e T
MA
Par
king
Man
agem
ent
Pro
gram
Impl
emen
ted
Gle
ndal
e,P
arki
ng p
ricin
g at
$40
N/A
Pub
lic-p
rivat
eC
alifo
rnia
to $
50/m
onth
. C
arpo
ols
part
ners
hip.
area
;pa
rk fr
ee a
nd r
ecei
veem
ploy
ees
of$3
/day
sub
sidy
. N
estle
US
A,
Inc.
, and
Com
mon
w’lt
hLa
nd T
itle
Co.
GO
Bou
lder
Pro
gram
Und
er s
tudy
Bou
lder
, CO
Con
gest
ion
pric
ing
Pro
ject
has
bee
n hi
ghly
FH
WA
Pilo
t(c
ompl
etio
nm
etro
are
afe
asib
ility
stu
dy.
succ
essf
ul in
sol
iciti
ng p
ublic
Pro
ject
, City
of
expe
cted
inV
ario
us s
trat
egie
s,in
put a
nd in
volv
emen
t. N
otB
ould
er, a
ndD
ecem
ber
fore
cast
ing
impa
cts,
yet i
mpl
emen
ted.
Col
orad
o D
OT
1997
)pu
blic
out
reac
h.fu
nds.
Kat
y F
reew
ayP
riorit
y La
neP
ricin
g P
roje
ct,
Hou
ston
, Tex
as
Und
er s
tudy
13-m
ile s
tret
chH
OV
-2 c
an b
uy in
toN
/AT
exas
DO
T a
nd(c
ompl
etio
nof
I-10
inH
OV
-3+
lane
s du
ring
Hou
ston
Met
roex
pect
ed in
Har
ris C
ount
ype
ak p
erio
ds.
fund
s. T
exas
1997
)T
rans
port
atio
nIn
stitu
te s
tudy
.
Kin
g C
ount
yF
lexP
ass
Pro
gram
Impl
emen
ted
Kin
g C
ount
y,In
itiat
ives
for
empl
oyer
sA
fter
two
year
s, th
e F
lexP
ass
Sel
f-fu
nded
by
Was
hing
ton
to o
ffer
empl
oyee
spr
ogra
m le
d to
30
to 1
75em
ploy
ers.
tran
sit s
ubsi
dies
,pe
rcen
t inc
reas
es in
tran
sit u
sevo
uche
r in
cent
ives
, and
for
a nu
mbe
r of
em
ploy
ers.
flexp
ass
com
mut
ing
choi
ces.

Ta
ble
3-2
, co
ntin
ue
d
PR
OJE
CT
PH
AS
EC
OV
ER
AG
ED
ES
CR
IPT
ION
RE
SU
LTS
FU
ND
ING
Cha
pter
3 -
Exa
mpl
es o
f T
rans
port
atio
n P
ricin
g P
rogr
ams
40
*Mai
ne T
urnp
ike
Aut
horit
y (M
TA
)Im
plem
ente
dM
aine
Cou
pons
dis
trib
uted
for
Tra
vel t
ime
shift
s by
tour
ists
Mai
ne T
urnp
ike
(stu
dy)
Tur
npik
edi
scou
nts
on o
ff-pe
akw
ere
mod
est,
how
ever
MT
AA
utho
rity.
tolls
dur
ing
Aug
ust
hope
s to
take
a m
ore
1995
and
199
6.
aggr
essi
ve a
ppro
ach
this
yea
r.E
duca
tiona
l effo
rts.
*Milw
auke
e C
ount
yT
rans
it S
ervi
ce(M
CT
S)
Par
king
Cas
h-O
ut
Impl
emen
ted
Milw
auke
eM
onth
ly tr
ansi
tP
roje
ct g
ener
ated
$90
0,00
0 in
Pub
lic-p
rivat
e19
91m
etro
are
asu
bsid
ies
up to
reve
nues
for
MC
TS
. pa
rtne
rshi
p.$6
0/m
onth
from
loca
lA
ppro
xim
atel
y 2,
000
empl
oyer
s. T
ax fr
eeem
ploy
ees
at 7
5 co
mpa
nies
bene
fit fo
r bo
thpa
rtic
ipat
e in
the
prog
ram
.em
ploy
ers
and
empl
oyee
s.
Por
tland
, Ore
gon
Reg
iona
l Pric
ing
Pro
ject
Und
er s
tudy
Por
tland
met
roT
wo
year
con
gest
ion
N/A
Ore
gon
DO
T a
ndar
eapr
icin
g fe
asib
ility
stu
dy.
Por
tland
ME
TR
OE
xten
sive
pub
licfu
nds.
educ
atio
n.
Pug
et S
ound
,W
ashi
ngto
nS
tudy
Pug
et S
ound
Pea
k-pe
riod
HO
V “
buy-
N/A
Pub
lic-p
rivat
edi
scon
tinue
dR
egio
nin
,” w
hen
SO
Vs
may
part
ners
hip.
pa
y fo
r ac
cess
to u
nder
-R
even
ue w
ill fu
ndus
ed H
OV
lane
s.ad
ditio
nal 2
00m
iles
of H
OV
lane
s.

Ta
ble
3-2
, co
ntin
ue
d
PR
OJE
CT
PH
AS
EC
OV
ER
AG
ED
ES
CR
IPT
ION
RE
SU
LTS
FU
ND
ING
Cha
pter
3 -
Exa
mpl
es o
f T
rans
port
atio
n P
ricin
g P
rogr
ams
41
*San
Die
go I-
15E
xpre
ss L
anes
Pro
ject
Impl
emen
ted
I -15
in N
orth
SO
V a
nd H
OV
-2 c
anM
ay le
ad to
dec
reas
es in
FH
WA
Pilo
t19
96S
an D
iego
buy
into
HO
V-3
+ la
nes
cong
estio
n. S
ince
oth
er c
ars
Pro
ject
.fo
r a
fixed
mon
thly
fee;
can
buy-
in to
HO
V-3
+ la
nes,
Rev
enue
will
fund
fees
var
ying
with
leve
lth
is p
roje
ct m
ay n
ot d
ecre
ase
addi
tiona
l mas
sof
con
gest
ion
will
be
SO
V V
MT
gre
atly
.tr
ansi
t in
the
impl
emen
ted
in la
teco
rrid
or.
1997
. U
ses
AT
C.
San
Fra
ncis
co -
Oak
land
Bay
Brid
ge
Exp
ecte
dS
an F
ranc
isco
$3 p
eak
perio
d to
ll,N
/AF
HW
A P
ilot
to b
e-
Oak
land
Bay
keep
ing
off-
peak
at
Pro
ject
.im
plem
ente
dB
ridge
curr
ent $
1 fo
r S
OV
and
Rev
enue
will
fund
1997
HO
V-2
veh
icle
str
ansi
t alte
rnat
ives
(con
stitu
tes
80 p
erce
ntan
d im
prov
emen
ts.
of p
eak
traf
fic).
Use
sA
VI.
*Sou
ther
nC
alifo
rnia
Ass
ocia
tion
ofG
over
nmen
ts
Und
er s
tudy
Los
Ang
eles
Pre
-pro
ject
stu
dy o
f 24
Stu
dy fo
und
that
a n
umbe
r of
FH
WA
Pilo
tm
etro
are
aco
nges
tion
pric
ing,
stra
tegi
es c
an a
chie
veP
roje
ct, S
CA
G,
VM
T, e
mis
sion
s fe
es,
sign
ifica
nt p
ollu
tion
and
and
CO
ALE
SC
Ean
d ot
her
pric
ing
cong
estio
n de
crea
ses,
fund
s.st
rate
gies
. E
xten
sive
espe
cial
ly a
mod
est a
ppro
ach
soci
alof
am
/pm
pea
k pe
riod
rese
arch
/out
reac
h.
cong
estio
n pr
icin
g co
uple
dC
oord
inat
ion
betw
een
aw
ith e
mis
sion
fees
.nu
mbe
r of
gov
ernm
ent
and
priv
ate
agen
cies
and
inst
itutio
ns.

Ta
ble
3-2
, co
ntin
ue
d
PR
OJE
CT
PH
AS
EC
OV
ER
AG
ED
ES
CR
IPT
ION
RE
SU
LTS
FU
ND
ING
Cha
pter
3 -
Exa
mpl
es o
f T
rans
port
atio
n P
ricin
g P
rogr
ams
42
Tac
oma
Nar
row
sP
ublic
-Priv
ate
Brid
ge P
roje
ct
Und
er s
tudy
Tac
oma
Con
gest
ion
pric
ing.
N/A
Pub
lic-p
rivat
eN
arro
ws
part
ners
hip
with
Brid
geW
ashi
ngto
n D
OT
. T
olls
will
fina
nce
enha
ncem
ent o
fbr
idge
and
oth
erm
obili
ty is
sues
inco
rrid
or.
Tap
pen
Zee
Brid
geV
aria
ble
Tol
lP
roje
ct
Und
er s
tudy
Tap
pen
Zee
Con
gest
ion
pric
ing
N/A
FH
WA
Pilo
tB
ridge
, New
feas
ibili
ty s
tudy
. P
roje
ct, N
ew Y
ork
Yor
kV
ario
us to
lls a
nd tr
ansi
tS
tate
Thr
uway
impr
ovem
ents
. A
utho
rity
and
New
Out
reac
h.Y
ork
DO
T fu
nds.
Tw
in C
ities
Con
gest
ion
Pric
ing
Stu
dy
Und
er s
tudy
Pro
pose
dS
tudy
of m
echa
nism
sN
/AF
HW
A P
ilot
Hig
hway
212
such
as
VM
T fe
es a
ndP
roje
ct a
ndco
nges
tion
pric
ing.
M
inne
sota
DO
TS
tudy
ing
Hig
hway
212
fund
s.pe
ak-h
our
fees
.

Ta
ble
3-2
, co
ntin
ue
d
PR
OJE
CT
PH
AS
EC
OV
ER
AG
ED
ES
CR
IPT
ION
RE
SU
LTS
FU
ND
ING
Cha
pter
3 -
Exa
mpl
es o
f T
rans
port
atio
n P
ricin
g P
rogr
ams
43
*Was
hing
ton
Sta
teC
omm
ute
Trip
Red
uctio
n La
w
Impl
emen
ted
Was
hing
ton
Em
ploy
ers
of 1
00 o
rB
y 19
95, t
wo
third
s of
the
Som
e st
ate
fund
ing
1991
Sta
tem
ore
pers
ons
insi
tes
redu
ced
SO
V/V
MT
; one
to h
elp
loca
litie
sco
untie
s w
ithth
ird b
y 15
per
cent
. de
sign
gui
delin
es.
popu
latio
ns o
ver
App
roxi
mat
ely
80 m
illio
nIn
divi
dual
150,
000
mus
t mak
eV
MT
wer
e el
imin
ated
; CO
prog
ram
s ar
ego
od fa
ith e
ffort
s to
emis
sion
s de
crea
sed
by 3
3,00
0pr
ivat
ely
fund
ed.
redu
ce S
OV
/VM
T to
tons
/yea
r an
d ga
s co
nsum
ptio
nth
e w
orkp
lace
.by
4.5
mill
ion
gallo
ns/y
ear.
2

Ta
ble
3-2
, co
ntin
ue
d
PR
OJE
CT
PH
AS
EC
OV
ER
AG
ED
ES
CR
IPT
ION
RE
SU
LTS
FU
ND
ING
Cha
pter
3 -
Exa
mpl
es o
f T
rans
port
atio
n P
ricin
g P
rogr
ams
44
I NT
ER
NA
TIO
NA
L P
RO
GR
AM
S
A1
Lille
-Par
isM
otor
way
Pro
ject
Impl
emen
ted
A1
from
Par
isT
olls
are
25
perc
ent
Up
to 1
5 pe
rcen
t of n
orm
alS
AN
EF
(qu
asi-
Apr
il 19
92to
Lill
e (1
20hi
gher
than
nor
mal
peak
Sun
day
even
ing
traf
ficco
mm
erci
alm
iles)
durin
g pe
ak p
erio
dsha
s sh
ifted
to o
ff-pe
ak h
ours
.go
vern
men
t-ow
ned
(Sun
day,
4:3
0 to
8:3
0to
ll ro
ad o
pera
tor)
.pm
); b
efor
e an
d af
ter
peak
per
iods
, tol
ls a
re25
per
cent
low
er th
anno
rmal
.
Cam
brid
ge,
Eng
land
Con
gest
ion
Pric
ing
Pro
ject
Stu
dyC
ambr
idge
’sC
ordo
n pr
icin
g w
ithN
/AU
nite
d K
ingd
omdi
scon
tinue
dci
ty c
ente
rre
al-t
ime
cong
estio
nD
OT
.pr
icin
g; z
one
fees
cons
ider
ed.
Gre
ater
Lon
don
Con
gest
ion
Pric
ing
Pro
posa
l
Pro
posa
lIn
ner
and
Thr
ee y
ear
rese
arch
N/A
Uni
ted
Kin
gdom
cent
ral L
ondo
npr
ojec
t loo
king
at
DO
T.
tech
nolo
gy, p
ublic
opin
ion
and
trav
elbe
havi
or.
Hon
g K
ong
Roa
dP
ricin
g E
xper
imen
tIm
plem
ente
dC
ity o
f Hon
gT
wo
year
exp
erim
ent
N/A
Gov
ernm
ent o
fan
dK
ong
with
ele
ctro
nic
num
ber
Hon
g K
ong.
disc
ontin
ued
plat
es a
nd a
utom
atic
tolli
ng.
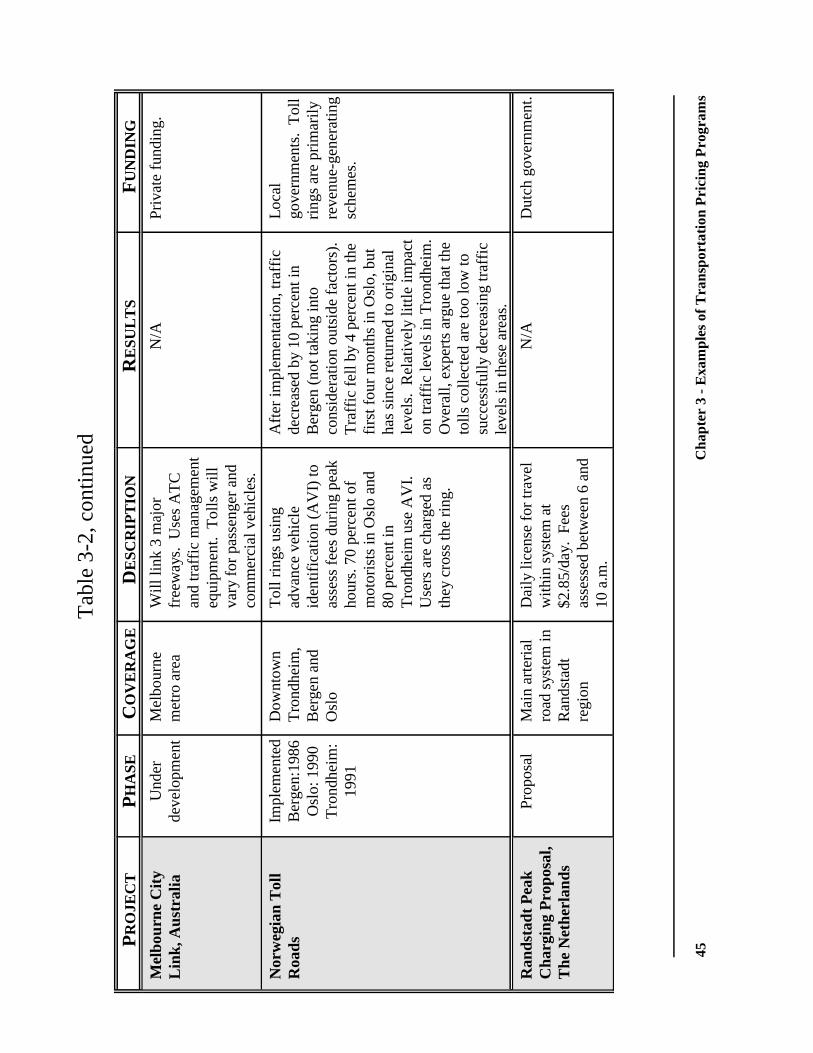
Ta
ble
3-2
, co
ntin
ue
d
PR
OJE
CT
PH
AS
EC
OV
ER
AG
ED
ES
CR
IPT
ION
RE
SU
LTS
FU
ND
ING
Cha
pter
3 -
Exa
mpl
es o
f T
rans
port
atio
n P
ricin
g P
rogr
ams
45
Mel
bour
ne C
ityLi
nk, A
ustr
alia
Und
erM
elbo
urne
Will
link
3 m
ajor
N/A
Priv
ate
fund
ing.
deve
lopm
ent
met
ro a
rea
free
way
s. U
ses
AT
Can
d tr
affic
man
agem
ent
equi
pmen
t. T
olls
will
vary
for
pass
enge
r an
dco
mm
erci
al v
ehic
les.
Nor
weg
ian
Tol
lR
oads
Impl
emen
ted
Dow
ntow
nT
oll r
ings
usi
ngA
fter
impl
emen
tatio
n, tr
affic
Loca
lB
erge
n:19
86T
rond
heim
,ad
vanc
e ve
hicl
ede
crea
sed
by 1
0 pe
rcen
t in
gove
rnm
ents
. T
oll
Osl
o: 1
990
Ber
gen
and
iden
tific
atio
n (A
VI)
toB
erge
n (n
ot ta
king
into
rings
are
prim
arily
Tro
ndhe
im:
Osl
oas
sess
fees
dur
ing
peak
cons
ider
atio
n ou
tsid
e fa
ctor
s).
reve
nue-
gene
ratin
g19
91ho
urs.
70
perc
ent o
fT
raffi
c fe
ll by
4 p
erce
nt in
the
sche
mes
.m
otor
ists
in O
slo
and
first
four
mon
ths
in O
slo,
but
80 p
erce
nt in
has
sinc
e re
turn
ed to
orig
inal
Tro
ndhe
im u
se A
VI.
leve
ls.
Rel
ativ
ely
little
impa
ctU
sers
are
cha
rged
as
on tr
affic
leve
ls in
Tro
ndhe
im.
they
cro
ss th
e rin
g.O
vera
ll, e
xper
ts a
rgue
that
the
tolls
col
lect
ed a
re to
o lo
w to
succ
essf
ully
dec
reas
ing
traf
ficle
vels
in th
ese
area
s.
Ran
dsta
dt P
eak
Cha
rgin
g P
ropo
sal,
The
Net
herla
nds
Pro
posa
lM
ain
arte
rial
Dai
ly li
cens
e fo
r tr
avel
N/A
Dut
ch g
over
nmen
t.ro
ad s
yste
m in
with
in s
yste
m a
tR
ands
tadt
$2.8
5/da
y. F
ees
regi
onas
sess
ed b
etw
een
6 an
d10
a.m
.

PR
OJE
CT
PH
AS
EC
OV
ER
AG
ED
ES
CR
IPT
ION
RE
SU
LTS
FU
ND
ING
46
Sin
gapo
re A
rea
Lice
nse
Sch
eme
Impl
emen
ted
Tw
o sq
uare
Cor
don
pric
ing
durin
gP
eak
hour
veh
icle
trip
s in
toS
inga
poria
n19
75;
mile
are
a in
peak
per
iods
: Mon
day
the
city
cen
ter
have
dec
reas
edgo
vern
men
t.U
pdat
edS
inga
pore
to F
riday
mor
ning
and
from
23
to 5
6 pe
rcen
t and
1989
(eve
ntua
llyev
enin
gs; S
atur
day
have
rem
aine
d at
this
leve
lw
ill c
over
mor
ning
s. D
aily
fees
sinc
e th
e pr
ojec
t was
upd
ated
.en
tire
isla
nd)
are
appr
oxim
atel
y $2
.00
to e
nter
the
zone
dur
ing
peak
per
iods
; mon
thly
pass
ava
ilabl
e fo
rap
prox
imat
ely
$50.
S
oon
fees
will
var
y w
ithco
nges
tion.
Sto
ckho
lm’s
Den
nis
Pac
kage
Pro
posa
lS
tock
holm
Pub
lic tr
ansi
tN
/AS
wed
ish
met
ro a
rea
impr
ovem
ents
, byp
ass
gove
rnm
ent.
Goa
lro
ads,
and
roa
d pr
icin
g.
is to
gen
erat
eT
oll r
ing
road
in c
ityre
venu
es, 7
0w
ith fe
es a
t $2.
50 p
erpe
rcen
t of w
hich
day
or $
50 p
er m
onth
. w
ill b
e us
ed fo
rE
vent
ually
will
use
AV
Itr
ansi
tan
d va
ry fe
es b
y tim
e of
impr
ovem
ents
and
day
and
vehi
cle
30 p
erce
nt fo
r au
toem
issi
ons.
trav
elim
prov
emen
ts.

47

48
CHAPTER 4Institutional Relationships
Transportation pricing programs often require the cooperation of various public andprivate sector entities. Most of the programs that have been implemented thus far in the UnitedStates are highway- or corridor-specific, although parking management strategies are oftenimplemented on a regional basis. The geographic coverage of programs often dictates theinstitutional relationships that must be developed and fostered during the design, development,testing, implementation, monitoring, evaluation, and enforcement phases of the program, as dothe sources of funding used to finance a project.
The relationships necessary for successful program implementation depend on the typeof program, how that program is initiated, and the manner in which the program is executedduring the implementation and management stages and the legal structure in that area.Implementing agencies often face institutional barriers as a result of jurisdictional authorityrelated to program implementation, monitoring, and enforcement. An important aspect ofmany of the successful programs is the active solicitation of program partners, both public andprivate.
The purpose of this chapter is to review the types of institutional issues that must beaddressed during the various phases of project design and implementation. Often, institutionalissues that arise in the early stages of program development are driven by dynamic and pre-established relationships among local agencies and can set the stage for the program*s outcomeduring the implementation and operation phases.
This chapter reviews the relevant institutional issues associated with program initiation,the selection of a lead agency, and the coordination of effort between multiple agencies andlevels of government in the design, development, and implementation of a successfultransportation pricing program.
PROGRAM INITIATION
Although economists have promoted the use of market-based incentive programs toaddress transportation problems and reduce pollution from mobile sources for some time,public officials have only recently considered using these approaches. In the case studiesreviewed, there were generally two methods by which market-based incentive programs wereintroduced:
(1) The local or state legislature passed laws mandating the program; or
(2) The local transportation and/or air authority developed the program to addresstransportation problems related to congestion, air quality, or other issues.

Chapter 4 - Institutional Relationships 49
The method by which a program is introduced sets its tone and influences the institutionalissues that a program may encounter.
Programs initiated at the state legislature usually involve the introduction of new lawsthat require regions to develop strategies for addressing transportation problems. State-mandated programs have the benefit of requiring public agencies and private entities to complywith the law. Yet, when these laws are developed into programs, the participation of otheragencies, local governments, and private entities is critical for success.
In other cases, the program concept was initiated in the local legislature or regulatorybody in response to a specific transportation need or related issue, such as air quality. Forinstance, San Diego I-15 Express Lanes Project was initiated on the suggestion of a locallegislator to address congestion on the interstate.
SELECTING A LEAD AGENCY
As programs are initiated by state-mandated laws or local efforts, the first step is toidentify a lead agency, agencies, or parties to implement and manage the program. In manycases, a number of different agencies participate throughout the program, and often more thanone agency will lead the program at different stages. In determining which agency should lead aproject, many factors need to be considered, including, but not limited to:
C Jurisdictional lines;C Level of government or other parties/agencies that would have the best success
in implementing the program;C The possibility that a new authority might better administer the program; and C Levels of government that should participate.
In selecting a lead agency, a key question is the agency*s authority to conduct the program. Thelead agency will most likely need to have the authority to implement and enforce the program,collect revenue, and spend funds. If an agency does not have the necessary authority, enablinglegislation may need to be considered, or another agency might be considered to serve as thelead agency.
The jurisdictional authority of the lead agency should correspond to the scope of themeasure being implemented. For example, a state-mandated program is probably bestimplemented by a state-level agency, which can ensure consistent implementation of themeasure across the state. An area-specific measure, on the other hand, might best be developedand implemented by a local authority who might better understand the specific concerns andconstraints of the area. It is possible to have a state-level agency or a regional-authoritymandate a program in a specific area, such as a nonattainment area. However, more often thannot, the geographic scope of the problem being addressed, such as congestion or air quality in anonattainment area or areas, will determine the scope of the measure to be implemented and,thus, jurisdictional authority of the lead agency.

Chapter 4 - Institutional Relationships50
Determining the appropriate level of government to lead a program can be a difficultprocess, particularly in governmentally-fragmented and decentralized metropolitan areas. Overthe last 35 years, government institutions at the municipal and special district levels haveincreased in number, resulting in more government entities managing the same geographicarea. This not only complicates the selection of a lead agency but also increases the number ofinstitutions that must be considered and included in the decision-making process.
Potential Lead Agencies and Participating Agencies/Organizations
C State Agencies: The benefit of having a state agency serve as the lead agency isthat it can apply a program across a broad geographic area, often covering acomplete metropolitan area (with exceptions for metropolitan areas that spanmore than one state) or an entire state. This helps to ensure that a program isconsistently implemented across different jurisdictions. A second benefitcomes in the state's authority (either legislative or regulatory authority) tomandate a program. A mandated program might have greater success than avoluntary program implemented at the local or regional level. A state-levelagency will have limited success implementing a transportation program,however, if the program is inflexible in its consideration of local concerns. TheWashington Commute Trip Reduction (CTR) program incorporated localconcerns by organizing a task force, which included local governmentrepresentatives, business leaders, and citizens, to develop the programguidelines.
C Local and Regional Agencies or Special Districts: These agencies are often intouch with local perspectives and can customize a transportation pricingprogram to the region. A benefit of the metropolitan planning organization(MPO) being the lead agency is that they are the agency responsible fortransportation planning and understanding the transportation needs of theregion. Local or regional agencies may be at a disadvantage, however, if theylack legislative or regulatory authority.
C New Public Entities: The option of creating a new entity to implement, operate,and manage a program has primarily been discussed in the literature ontransportation pricing programs. A new entity is suggested when existing localagencies do not have authority over the jurisdiction of the project area. Inactuality, no new entities have been created, but this continues to be an option asinstitutional arrangements are explored.
C Private Companies: Using a private company to manage a program resolvesauthority issues, in particular with respect to collecting revenues across localand regional jurisdictions. A state may need to establish a franchise to allowprivate entities to manage a portion of an interstate or state road. There mayalso be restrictions on the type of funds available for the development andimplementation of certain projects, as some state and federal funds may not be

Chapter 4 - Institutional Relationships 51
California Private Transportation Corporation’s (CPTC) Role in Transportation Pricing Projects
A private entity, the California Private Transportation Corporation (CPTC), has played an important(if not crucial) role in two of the case studies:
C Under a partnership with the California Department of Transportation (Caltrans), CPTCplanned, constructed, and runs the California SR 91 Project. It did extensive publiceducation, outreach, and marketing work, organizing meetings with local legislatures andcommunity groups to solicit input from and educate the different interest groups about theprojects components and goals.
C Under a partnership with another private entity, United Infrastructure, CPTC is responsiblefor the management of the San Diego I-15 Express Lanes Pricing Project, including suchactivities as toll collection, billing, and other day-to-day management duties.
In both cases, the public-private partnership has proven to be beneficial for all involved parties,however, initially there were concerns about the objectives of CPTC (to raise revenues) in relation tothose of the State of California (to reduce congestion, and maximize non-paying HOV traffic). According to CPTC, the goals of all the involved parties have been aligned and all groups arerealizing the maximum benefits. (See Appendix A for more information on these projects)
used to finance roads that restrict access. However, there might be publicconcern about a private firm seeking to raise revenues and increase profit asopposed to a state or local governmental agency.
C Federal Agencies: Although federal agencies do not have the authority todevelop and implement transportation pricing programs, federal participationcould lead to the designation of a project as a model or pilot program, whichcould provide additional funding.
C Affected Businesses/Parties: Participation of the affected parties in the initialstages of a transportation pricing project can help the project avoid pitfalls laterand lends support. Examples of affected parties may including businesses witha certain number of employees, companies that own parking facilities, gasstations, and businesses along a priced route.

Chapter 4 - Institutional Relationships52
Coordination Between Agencies, Organizations and Government Promoting Support for Transportation Pricing Projects:
Case Studies
After the Maine Transportation Authority proposed to increase peak-hour tolls on theturnpike to reduce congestion, the tourism industry pressed the state legislature to prevent tollincreases. Consequently, the program now offers discounts during off-peak hours, but has left peak-hour tolls unchanged. The unfortunate result of the program was an increase in off-peak travel andno change in congestion during peak periods.
PROMOTING COORDINATION AMONG MULTIPLE AGENCIES,ORGANIZATIONS , AND LEVELS OF GOVERNMENT
Regardless of which entity serves as the lead agency, a successful program will requirecoordination with institutions at multiple levels of government, including state and locallegislators and regulators, as well as state and local industry and citizen groups. (See alsoChapter 5 - Public Involvement and Acceptance.) Involving all potential stakeholders in thedevelopment and implementation of a program and partnering with agencies at multiple levelsof government serves many goals in that it:
C Ensures broader support for the project;C Facilitates funding;C Provides access to additional staff to help implement the program; andC Helps to identify and resolve problems.
Coordination Promotes Support. Establishing strong institutional relationships duringthe early stages of a project can help in building support for a program by ensuring that theneeds and concerns of different parties are identified and addressed. The lack of coordinationbetween different institutional entities can have a devastating impact on a transportation pricingprogram.
Coordination Provides Access to Additional Staff. If multiple organizations areinvolved, each entity may take responsibility for a distinct aspect of a project, thus distributingthe program resource requirements among staff of multiple agencies. Access to staff withindifferent agencies or levels of government can be particularly helpful by providing access to

Chapter 4 - Institutional Relationships 53
Coordination Between Agencies, Organizations and Government Promoting Support for Transportation Pricing Projects:
Case Studies, continued
The Washington State (CTR) Law, which requires all affected employers to make a “goodfaith” attempt to try to the reduce both the number of employees who commute in single occupancyvehicles (SOVs) and the total vehicle mile traveled (VMT) by employees, was successful indeveloping support among local agencies. Under the CTR program, a task force composed ofcounty, city, and transit personnel, private employers, state agencies, and citizens, was formed todevelop the guidelines that each local agency would follow to implement and manage the program. The task force held regular public meetings to receive input. The guidelines were so well-received byall public agencies that they were approved as written. After completing the guidelines, the statenamed a technical assistance team to aid local governments in implementation. Finally, the taskforce continues to help the state by making additional recommendations as the guidelines are testedin practice.
Likewise for the San Diego I-15 Express Lanes Project, partnerships were formed in theearly stages between Federal, state, and local agencies, leading to a smooth implementation andtransition of responsibilities. Those involved in theproject team included the San Diego Association ofGovernments (SANDAG), Caltrans, the FederalHighway Administration (FHWA), the Federal TransitAdministration (FTA), the California Highway Patrol,local politicians, and local transit agencies. In the earlystages of program development, the process was open toall agencies interested in participating. The openprocess encouraged participation and helped divide theresponsibilities of program implementation. Ultimately,program management will be handled by a privateentity. (See Appendix A for more information of all ofthese projects).
different agencies with different areas of expertise. It can also aid in the enforcement of aprogram and the collection or distribution of funds. Often some activities required under the transportation pricing program can be conducted at the same time as other enforcement (e.g.,inspections) or collection (e.g., registration or toll collection) activities.
Coordination Can Identify and Resolve Problems. There is always the potential forproblems associated with any new program, including a transportation pricing program, many ofwhich will be unique to the specific program and area implementing the program. Coordinationbetween the various interested parties involved and affected by the proposed pricing programcan help to ensure that potential problems are identified early and resolved in a way that ensuressuccess of the program.

Chapter 4 - Institutional Relationships54
Coordination Between Geographic Areas
Competition between affected rural, urban and metropolitan areas for economic developmentis a potential problem that can affect how transportation pricing programs are developed andimplemented. A jurisdiction that might otherwise have been interested in a transportationpricing program may be apprehensive if it believes that economic development would beslowed or that existing businesses may relocate to other locations. In cases whereneighboring cities, towns and other urban areas have competing goals, a regional authoritywith power over the local jurisdictions might be a better choice as the lead agency toimplement the program and resolve disputes between the local jurisdictions.
Problems due to Lack of Coordination:California’s Parking Cash-Out Program
The California’s Parking Cash-Out program is an example of a program that had limitedcoordination between agencies and private participants. Initially, the program was well-receivedby employers, who could deduct any expenses associated with the program from their Stateincome tax. However, under the previous Federal tax code, once employers allowed employeesto cash out, all parking subsidies became taxable. As a result, employers lost their incentive toimplement the program. Although all affected employers are required by law to comply with thecash-out program, the program is designed to be self-enforcing, and many employers are notactively participating. A recent change to the tax code made in 1997 has resolved this problem(see the section in chapter 3, “Parking Pricing” and Appendix A for more information).
Table 4-1 discusses the likely institution(s) for initiating and implementing each majortype of transportation pricing measure and identifies institutions and groups with which thelead agency should coordinate and develop an institutional relationship to facilitate thedevelopment and implementation of the program. Table 4-2 provides this information forseveral specific projects (also discussed in Appendix A).

Cha
pter
4 -
Inst
itutio
nal R
elat
ions
hips
55
TA
BLE
4-1
PO
TE
NT
IAL
LE
AD
AG
EN
CIE
S A
ND
IN
ST
ITU
TIO
NA
L R
ELA
TIO
NS
HIP
S F
OR
VA
RIO
US
TR
AN
SP
OR
TA
TIO
N P
RIC
ING
ME
AS
UR
ES
TR
AN
SP
OR
TA
TIO
N P
RIC
ING
INIT
IAT
ING
L
EA
DIN
ST
ITU
TIO
NA
L R
ELA
TIO
NS
HIP
S
ME
AS
UR
EA
GE
NC
IES
AG
EN
CIE
S
PO
SS
IBLE
PO
SS
IBLE
P
OT
EN
TIA
LLY
U
SE
FU
L
Fue
l Tax
es/P
ay-a
t-th
e-P
ump
Cha
rges
Fed
eral
/Sta
teS
tate
/Reg
iona
lS
tate
/loca
l pol
itici
ans,
Fue
l ind
ustr
yLe
gisl
atio
n A
genc
yre
gula
tors
and
rep
rese
ntat
ives
,C
itize
n/st
akeh
olde
r gr
oups
.
VM
T/E
mis
sion
s/U
se F
ees
Sta
te/lo
cal L
egis
latio
n,S
tate
/Reg
iona
lS
tate
/loca
l pol
itici
ans,
Sta
te a
genc
ies
Sta
te/lo
cal R
egul
ator
yA
genc
y(in
clud
ing
DO
T),
Citi
zen/
stak
ehol
der
Bod
ygr
oups
.
Roa
d T
olls
/Con
gest
ion
Pric
ing
Sta
te/lo
cal L
egis
latio
n,R
egio
nal/l
ocal
Reg
iona
l/loc
al tr
ansi
t aut
horit
ies,
Sta
teS
tate
/loca
l Reg
ulat
ory
Aut
horit
y, S
tate
DO
T, R
egio
nal/l
ocal
pol
itici
ans,
Bod
yD
OT
, Priv
ate
Citi
zen/
stak
ehol
der
grou
ps.
Com
pany
Par
king
Pric
ing/
Par
king
Cas
h-O
utS
tate
/reg
iona
l/loc
alR
egio
nal/l
ocal
Reg
iona
l/loc
al tr
ansi
t aut
horit
ies,
Legi
slat
ion,
Sta
te/lo
cal
Aut
horit
yR
egio
nal/l
ocal
pol
itici
ans,
Reg
iona
l/loc
alR
egul
ator
y B
ody
com
pani
es (
wor
kpla
ces,
sho
ppin
gce
nter
s), C
itize
n/st
akeh
olde
r gr
oups
.
Tra
nsit
Sub
sidi
esS
tate
/reg
iona
l/loc
alR
egio
nal/l
ocal
Reg
iona
l/loc
al tr
ansi
t aut
horit
ies,
Legi
slat
ion,
Sta
te/lo
cal
Aut
horit
y, T
rans
itR
egio
nal/l
ocal
pol
itici
ans,
Reg
iona
l/loc
alR
egul
ator
y B
ody,
Aut
horit
yco
mpa
nies
(w
orkp
lace
s, s
hopp
ing
Tra
nsit
Aut
horit
yce
nter
s), C
itize
n/st
akeh
olde
r gr
oups
.

Cha
pter
4 -
Inst
itutio
nal R
elat
ions
hips
56
TA
BLE
4-2
EX
AM
PLE
S O
F I
NS
TIT
UT
ION
AL
RE
LAT
ION
SH
IPS
IN T
RA
NS
PO
RT
AT
ION
PR
ICIN
G P
RO
GR
AM
S
TR
AN
SP
OR
TA
TIO
NL
EA
DO
TH
ER
IN
VO
LVE
DP
RIC
ING
PR
OG
RA
MA
GE
NC
Y( IE
S)
AG
EN
CIE
S/G
RO
UP
SI N
ST
ITU
TIO
NA
L R
ELA
TIO
NS
HIP
S
San
Die
go I-
15 E
xpre
ss L
anes
SA
ND
AG
Cal
tran
s, F
HW
A, F
TA
,A
ll of
the
agen
cies
wer
e in
volv
ed in
the
Pro
ject
Cal
iforn
ia H
ighw
ay P
atro
l,pr
ojec
t fro
m it
s on
set,
and
each
age
ncy
was
loca
l pol
itici
ans,
loca
las
sign
ed s
peci
fic r
espo
nsib
ilitie
s. T
his
tran
sit a
genc
y of
ficia
ls,
mea
sure
d en
sure
d th
at e
very
thin
g go
t don
eC
PT
C (
priv
ate
firm
);an
d th
at th
ere
wer
e no
dis
agre
emen
ts o
ver
Citi
zens
Adv
isor
yw
ho h
ad w
hat r
oles
.C
omm
ittee
.
Cal
iforn
ia’s
Par
king
Cas
h-O
utC
alifo
rnia
Sta
teC
AR
BT
he la
w is
mea
nt to
be
self
enfo
rcin
g, w
ithP
rogr
amLa
wm
inim
al o
vers
ight
and
invo
lvem
ent f
rom
CA
RB
. T
here
wer
e no
inst
itutio
nal
rela
tions
hips
ass
ocia
ted
with
this
pro
gram
.
Cal
iforn
ia S
R-9
1 P
roje
ctP
artn
ersh
ipF
HW
A; F
TA
; Cal
iforn
iaT
he p
ublic
-priv
ate
part
ners
hip
has
prov
en to
betw
een
Cal
tran
sP
olyt
echn
ic S
tate
be b
enef
icia
l for
the
deve
lopm
ent a
ndan
d C
PT
CU
nive
rsity
; loc
al C
ham
bers
impl
emen
tatio
n of
the
prog
ram
, how
ever
(priv
ate
firm
)of
Com
mer
ce, l
egis
latu
res,
ther
e ha
ve b
een
diffe
renc
es in
wha
t CP
TC
city
cou
ncils
, tra
nspo
rtat
ion
and
Cal
tran
s se
e as
the
obje
ctiv
es a
nd g
oals
orga
niza
tions
, citi
zens
of th
e pr
ogra
m.
Pub
lic o
utre
ach
and
grou
ps, e
tc.
mar
ketin
g ef
fort
s so
licite
d in
put a
ndin
volv
emen
t fro
m a
wid
e va
riety
of l
ocal
and
stat
e ag
enci
es in
add
ition
to th
e ge
nera
lpu
blic
.

Tab
le 4
-2, c
ontin
ued
TR
AN
SP
OR
TA
TIO
NL
EA
DO
TH
ER
IN
VO
LVE
DP
RIC
ING
PR
OG
RA
MA
GE
NC
Y( IE
S)
AG
EN
CIE
S/G
RO
UP
SI N
ST
ITU
TIO
NA
L R
ELA
TIO
NS
HIP
S
Cha
pter
4 -
Inst
itutio
nal R
elat
ions
hips
57
Sou
ther
n C
alifo
rnia
SC
AG
Cal
tran
s, S
CA
QM
D,
The
invo
lved
age
ncie
s ha
ve h
ad to
lear
n to
Ass
ocia
tion
of G
over
nmen
tsC
OA
LES
CE
, RE
AC
Hw
ork
with
and
trus
t eac
h ot
her
in(S
CA
G)
Stu
dyT
ask
For
ceex
perim
entin
g w
ith n
ew id
eas
and
in g
uidi
ngth
e de
velo
pmen
t of t
he p
roje
ct th
roug
h a
num
ber
of d
iffer
ent p
hase
s. T
his
prel
imin
ary
wor
k sh
ould
faci
litat
e th
e de
velo
pmen
t of
inst
itutio
nal r
elat
ions
hips
with
loca
lgo
vern
men
ts a
nd a
genc
ies
and
priv
ate
inte
rest
s in
the
futu
re w
hen
the
stud
ied
proj
ects
are
impl
emen
ted.
GO
Bou
lder
Pro
gram
City
of B
ould
erC
olor
ado
DO
T, k
ey s
taff
The
age
ncie
s ar
e w
orki
ng to
geth
er to
def
ine
from
bot
h th
e C
ity o
fth
e co
nges
tion
prob
lem
s in
Bou
lder
, and
toB
ould
er a
nd o
ther
loca
lor
gani
ze a
nd im
plem
ent i
nnov
ativ
e pu
blic
gove
rnm
ents
outr
each
and
invo
lvem
ent a
ctiv
ities
.
The
Dul
les
Tol
l Roa
dT
oll R
oad
The
Sta
te o
f Virg
inia
The
pub
lic-p
rivat
e pa
rtne
rshi
p m
ade
the
Inve
stor
sde
velo
pmen
t, im
plem
enta
tion
and
Par
tner
ship
IIm
aint
enan
ce o
f the
roa
d fin
anci
ally
feas
ible
. (T
RIP
) (p
rivat
eT
he r
oad
was
the
first
priv
atel
y bu
ilt a
ndpa
rtne
rshi
p)op
erat
ed h
ighw
ay in
mod
ern
times
in th
eU
nite
d S
tate
s.

TR
AN
SP
OR
TA
TIO
NL
EA
DO
TH
ER
IN
VO
LVE
D
PR
ICIN
G P
RO
GR
AM
AG
EN
CY
(IES)
AG
EN
CIE
S/G
RO
UP
SIN
ST
ITU
TIO
NA
L R
ELA
TIO
NS
HIP
S
58
San
Fra
ncis
co-O
akla
nd B
ayM
etro
polit
anF
ocus
gro
ups,
com
mun
ityN
o in
stitu
tiona
l bar
riers
wer
e en
coun
tere
dB
ridge
Pro
ject
Tra
nspo
rtat
ion
and
med
ia o
utre
ach
betw
een
MC
T a
nd C
altr
ans,
how
ever
MT
CC
omm
issi
onle
arne
d th
at it
is e
ssen
tial f
or a
ny(M
TC
), C
altr
ans
gove
rnm
enta
l ent
ity p
ropo
sing
con
gest
ion
pric
ing
to b
uild
a c
oalit
ion
ofno
n-go
vern
men
tal s
uppo
rt g
roup
s in
the
begi
nnin
g of
the
prog
ram
so
the
appl
icat
ion
has
broa
d-ba
sed
supp
ort.

59

Munnich, Lee, et al, Institutional and Political Issues in Congestion Pricing: New Models for Federal,45
State and Local Cooperation in Infrastructure Investment, Hubert Humphrey Institute of Public Affairs, University of Minnesota, Minneapolis, Minnesota, p. 6.
60
Public Involvement
Public Acceptance
Education and Outreach
CHAPTER 5Public Involvement and Acceptance
A large part of the success of a project aimed at changing existing patterns andbehaviors, including those related to transportation issues, depends on the level of publicacceptance and support for the project. One common thread running through successfultransportation pricing programs has been an aggressive public education, awareness andinvolvement program. An expert from the Hubert Humphrey Institute of Public Affairs goes sofar as to state that “citizen understanding and support will be essential to introducingtransportation pricing in an urban area.” The ability of planners and developers to recognize45
and involve the public in the development and implementation phases of a program is crucialfor the success of a program.
This chapter discusses the role of public involvement in the success of a transportationpricing program by defining the elements of a successful public education and outreachprogram, examining specific initiatives, and reviewing current research in this area. The firstsection defines public involvement and discusses the benefits of gaining strong publicinvolvement and acceptance for a program. The next section identifies and discusses thevarious elements of a successful public education and outreach initiative, drawing on theexperience of several initiatives and current research. The third section explores the varioustechniques that can be employed to involve the public and gain acceptance for a program. Finally, this chapter considers methods for measuring the success of a public education andoutreach campaign.
WHAT IS PUBLIC INVOLVEMENT AND WHY DOES IT
MATTER ?
Public involvement is two-waycommunication between the public andtransportation planners aimed atincorporating the views, concerns, andissues of the public in the decision-makingprocess. A public outreach campaignmight also involve one-waycommunication in the form of publiceducation, public relations, and marketing. Public education can be a vital componentof public involvement by informing the public of critical issues to ensure that their input ismost effective. Public relations and marketing can be used to identify the means of interaction

Chapter 5 - Public Involvement and Acceptance 61
Lessons on Public Acceptance
Based on lessons learned from theTwin Cities Congestion Pricing Study inMinneapolis-St. Paul, Minnesota, and othercongestion pricing programs, Lee Munnich of theHumphrey Institute emphasized a number of keyissues which any congestion pricing program mustaddress.
C Elected officials’ support, not necessarilyas advocates, but as enablers is essential.
C The public, including the businesscommunity, environmental organizationsand neighborhood groups, must understandthe proposals and be involved in theprocess.
C A great deal of attention must be paid tomarketing and media strategies, involvingthe media in the process from the onset andfostering a positive relationship.
Source: Munnich, Lee, Summary of Proceedings:FHWA Midwestern Region Congestion PricingWorkshop, Chicago, IL, 1995.
that work best for a given sub-group of the population, identify the issues of greatest concern,and influence the public's perception or opinion on a subject and possibly lead to behavioralchanges.
Effective public education andinvolvement is important in thetransportation planning processbecause it results in decisions andprograms that are generally moreacceptable to the public and therefore,more easily implemented. People aremore likely to accept a new programor plan when they understand it andhave had a part in its development andimplementation. In addition, severallaws, regulations, and agencies requirethat the public be involved intransportation planning.
Initially, many planners do nothave a clear idea of the kind of publicoutreach or education program thatshould be implemented in conjunctionwith a proposed transportation pricingprogram. Determining the mostappropriate and effective methods for addressing and publicizing the goalsof the pricing project can be difficult. All public outreach and educationprograms should have clearly definedgoals and a strategy to meet them. Aprogram must also be flexible so thatit can be modified and adapted toaddress new developments or problems. The following sections describe a number of factorswhich must be taken into consideration when developing and implementing a public outreachand education program. These factors can also be used to help determine what kind of publiceducation program best compliments a proposed pricing project. By recognizing andaddressing these same factors, planners can better define the goals, audience and other elementsof their pricing program. This in turn will facilitate the selection of a public education programthat will work with the proposed transportation pricing project.
ELEMENTS OF A SUCCESSFUL PUBLIC EDUCATION AND
OUTREACH CAMPAIGN

Chapter 5 - Public Involvement and Acceptance62
Perhaps the single most important component of a successful public outreach campaignis credibility, both institutional and personal. The public must trust that their concerns arebeing taken seriously and that they have a significant role in the decision-making process. Inaddition to credibility, a number of other factors must be taken into consideration whendeveloping a public involvement and outreach campaign. These include:
C Defining the audience;C Defining the area of concern;C Recognizing the present situation;C Defining the goals of the project;C Educating all interested and affected parties;C Involving the public; andC Anticipating common issues and concerns.
This section discusses these factors which are central to determining the success of a publicinvolvement and education program.
Define the Audience
It is important that the “public” be correctly defined. The “public” includes any personor group that is affected by the transportation program (even if they are not aware that they areaffected) as well as any person or group that thinks that they are affected (even if they are notactually affected). Thus, exactly who represents the stakeholders or the "public" with respectto a public education and involvement campaign will depend, to a great extent, on the natureand scope of the program and the area for which it is being developed. The stakeholders mayalso vary depending on the phase (such as planning or development) of the decision-makingprocess.
It is also important to recognize that the “public” is not a single entity with one uniformopinion. In reality, it consists of a wide variety of persons, each with their own opinions,needs, wants, and motivations. These individuals come from all walks of life and have variedlevels of education and income. It is essential to recognize these differences and to addressthem accordingly because they will influence people’s reactions to and concerns about aproposed transportation pricing project. The public or stakeholders can include:
C Residents of the affected geographic area; C Non-governmental organizations, such as environmental, health, citizen,
neighborhood, and civic groups;C Businesses; C Traditionally under-served communities, including low-income, racial and
ethnic minorities, people with disabilities, the elderly, and youth; C Transportation professionals and service providers; C Members of academia; C Government agencies, including transportation and air agencies; and

Chapter 5 - Public Involvement and Acceptance 63
Example: Twin Cities Congestion Pricing Study
The benefits of soliciting the support of various groups have been realized by a number ofsuccessful transportation pricing programs. Under this program, the Minnesota Department ofTransportation (MNDOT) conducted a feasibility study of different congestion pricing programs,including a proposal for the construction of a new Highway 212 with peak-hour fees. The projectincluded a great deal of public outreach efforts to different special interest and other affectedgroups. For the Twin Cities Congestion Pricing Study, each group was able to identify specificbenefits from the project:
C Local community and environmental groups viewed transportation pricing as a tool whichcould be used to help reduce the probability of future congestion problems as the region’spopulation growth led to increased urban sprawl and therefore increased traffic problems.
C Businesses found benefits in the increased transportation efficiency and decreases in taxesthat would result from such a program.
C Community leaders focused on the opportunities that the project provided for improvedtransit services.
C Transportation professionals were interested in using transportation pricing as a tool formanaging traffic problems and influencing modal shifts.
C Local elected officials recognized all of the above benefits, as well as the potential forsuch a program to increase revenues while, at the same time, improving the efficiency ofland and energy usage.
Source: Munnich, Lee, et al. p. 3.
C Politicians.
Planners must also recognize that the residents of the immediate community are not the onlypeople who may be affected and, therefore, need to be informed of the program's goals. Persons who live outside the metropolitan area but who use the transportation system on a
semi-regular to regular basis for commuting or other travel purposes should also be included inthe definition of the “public.” For a public outreach campaign to be successful, it must be ableto connect with all of the affected groups and integrate their concerns, needs and wants into theprogram.
Businesses: The support of and leadership from the business community can beextremely important for the success of a transportation pricing program. Businessestend to be concerned about issues related to the movement of goods, access to deliveryand services, accessibility to and from other suburban-based operations, access toskilled labor, and reducing the commuting time for employees. The planners must,therefore, convince businesses that the proposed mechanisms will not adversely affect

Munnich, Lee, et al, p. 6.46
Midwestern Region Congestion Pricing Workshop: Summary of Proceedings, Developing Political47
and Public Support, Chicago, IL, May, 1996, Hubert H. Humphrey Institute of Public Affairs web site:http://www.hhh.umd.edu/Centers/SLP/Conpric/chicago.htm.
Chapter 5 - Public Involvement and Acceptance64
business and that the changes will reduce current traffic problems, such as reducing thecosts of time delays. In the past, business leaders have generally favored transportationprograms and funding that will increase the efficiency and reliability of travel on thearea’s highways and transit system, and contribute to the area’s economic productivity.
Community Groups: Groups such as environmental organizations, neighborhoodgroups and transit advocates, are another public sector whose support must be gainedfor a transportation pricing project to be successfully adopted. At the local level, theseorganizations are concerned with improving traffic problems, reducing pollution,increasing the accessibility of public transit for all population groups, and improvingcommunity vitality and the overall quality of life. If planners can show them that theseends can be achieved through the means of a market-based transportation program, theywill most likely be able to gain broad-based local community support.
Government Officials: The leadership and support of local elected governmentalofficials and their staff are also necessary for a transportation pricing program to moveforward. Despite the uncertainty surrounding such mechanisms, Lee Munnich of theHumphrey Institute of Public Affairs found that state and local officials from manygovernment agencies tend to be interested in, and occasionally strong supporters of,transportation pricing programs. Senator Sandra Pappas, a political advocate of46
transportation pricing who has been directly involved in the Twin Cities CongestionPricing Study, stressed the need for "coalition building of legislators" and broad-basedpolitical support. At the Federal Highway Administration’s (FHWA’s) ChicagoWorkshop, she stated that, “while it is important to have the support of an electedofficial, congestion pricing needs more than one champion.” 47
Define the Area of Concern
As part of identifying the full audience for a public outreach campaign, it is essential todefine the geographic area that will be affected. As with defining the public, planners shouldnot ignore any sectors of the population who might be affected by these proposed changes. It isessential to look not only at the metropolitan area which will be directly affected, but also atsuburban or other adjoining areas whose traffic and residential patterns could be affected bychanges in transportation policy. These parameters will help to shape both the audience andthe definition of the public.
Recognizing the Present Situation

Chapter 5 - Public Involvement and Acceptance 65
For a transportation pricing program to be successful, it has to be compatible with thecurrent transportation structure. This includes infrastructure (e.g., the current roadways,bridges and tunnels), availability of public transit, any transportation pricing programs currentlyin effect, and the attitude of the public towards the status quo. Planners must recognize thelimitations that the present structure would place on certain program possibilities and be able toidentify those sections where transportation pricing mechanisms could be successfullyimplemented.
Define the Goal of the Outreach Effort
Public education and outreach programs will differ considerably from place to place aswell as over the life of a project. The aim of the education and outreach program will dependon several factors:
C The ultimate goals and scope of the program; C How the public is defined (i.e., who is the intended audience - this may vary for
each activity under the outreach program);C The stage of the project (e.g, scoping, planning, development or
implementation); andC To what extent the public is already a participant in the overall process.
In some cases, planners may be more concerned with keeping the public informed ofdevelopments through education and outreach efforts. Other projects may rely heavily on theuse of education and public involvement to change public opinion on certain issues or promotethe acceptance of controversial solutions. Planners might also want the public to be activelyinvolved in the development of goals and criteria, and the design and implementation of theprogram, and therefore might want to solicit feedback or input through more interactiveapproaches.
Educate the Interested Parties
Define the Problems with the Current Transportation System
Before solutions can be developed to deal with access problems affecting an area,current and possible future concerns must first be clearly identified and defined. For people tobe willing to accept changes in their behavior and in the pricing associated with travel, theymust first be aware that problems exist within the present system. The problems associatedwith traffic, congestion and air pollution tend to be regional, and may differ considerablybetween metropolitan areas. In some areas, citizens may believe that the present transportationsystem is adequate or, when viewed in relation to other urban areas, believe that traffic and airquality are not major issues. Other areas may face major deficiencies in air quality, the currenttransportation system, or increased levels of traffic. It is also important to:

Midwestern Region Congestion Pricing Workshop: Summary of Proceedings, Developing Political48
and Public Support, p. 7.
Chapter 5 - Public Involvement and Acceptance66
Example: Twin Cities CongestionPricing Study
In the Twin Cities Congestion Pricing Study, theMetropolitan Council, Citizens League and othertask forces published newsletters featuringarticles and studies explaining the concepts ofmarket-based transportation policies andadvocating their benefits. These publicationshelped educate the public, shape the views ofpolicy makers, and inform interested parties onthe issues.
C Identify how affected interest groups view the current transportation structure;C Determine the major issues which a proposed program would need to address;
andC Identify all barriers to the implementation of a proposed program.
This information may help to identify people’s willingness to accept changes in thetransportation system and potential problems that might arise in the future with implementingnew programs.
Explain the New Policy or Program and How it Addresses Specific Problems or Concerns
The reasons for pursuing a transportation pricing program over other available optionsmust be made clear to all segments of the public. Judson Bryant, a citizen activist fromHouston, Texas, stressed the need for transportation pricing advocates to “define andthoroughly explain the overall benefits of [transportation] pricing to the public and the press.” 48
The potential benefits of many transportation pricing programs are not widely understoodbecause these techniques are relatively new and have not been widely implemented. As aresult, planners will need to educate people on the true costs of transportation and the benefitsof a market-based method. One approach is to explain market-based pricing mechanisms usinga familiar context to illustrate that these methods are currently used to determine the prices of a
number of goods and services. Examplesinclude long distance telephone service,whose fees vary depending on the time ofday, and airline ticket prices, which varydepending on when the ticket waspurchased and the time of day, the day ofthe week, and the time of year.
The goals of any new transportationpricing program must be clearly defined andplanners should demonstrate how theproposed changes will specifically addressthose problems that citizens and all otheraffected parties view as important. Inaddition, the relationship between the
transportation pricing program and any other programs currently in effect must be established. For example, it may be necessary to consider and explain how the new pricing program willmesh with the scope and level of tolls currently collected, how the new program will affect theavailability of alternate modes of transportation or whether there is enough infrastructureavailable to handle the increased demand for alternatives. The level of acceptance for a newtechnique, policy, or program will depend greatly on how well it addresses current problems, towhat extent it makes use of the available infrastructure, and how it works with programs

Deakin, Elizabeth and Greig Harvey, Transportation Pricing Strategies for California: An49
Assessment of Congestion, Emission, Energy and Equity Impacts, Technical Report prepared for theCalifornia Air Resources Board, June, 1995, p. 10-2.
Dittmar, Hank, Karen Frick, and David Tannehill, “Institutional and Political Challenges in50
Implementing Congestion Pricing: Case Study of the San Francisco Bay Area,” Curbing Gridlock: PeakPeriod Fees to Relieve Traffic Congestion, National Academy Press, Washington D.C. Special Report242, Volume 2, 1994: pp. 300-317.
Chapter 5 - Public Involvement and Acceptance 67
already in place. The proposed use or return of any funds collected under the transportationpricing program should also be detailed so the public understands exactly how and where itsmoney is being spent. By educating the people about a project, planners can clear up a greatdeal of uncertainty and the public will tend to be more receptive to the approach.
Involve the Public in the Decision-Making Process
Transportation planners or other agencies, such as air quality management agencies,looking at the use of transportation pricing measures, should, whenever possible, involve allsegments of the public in the development and decision-making processes. It is appropriate toinvolve the public in the very initial stages of planning and development of a transportationpricing project. Structured public involvement and input will result in improved decisions thattake into account the concerns of diverse interests, produce decisions that are generally moreacceptable and therefore more easily implemented, and improve relations between the publicand the transportation agency. Involving the public in the planning process of a transportationpricing program will help to clarify the public's concerns for planners and help to avoid delaysduring implementation.
Anticipate Common Issues and Concerns
Planners must be able to anticipate concerns that the public may have concerning newtransportation policies and be prepared to address them directly. There are several commonissues that are likely to arise with any transportation pricing program, regardless of themetropolitan area or region. This section highlights several common issues and concerns asidentified in three recent studies examining the reaction of different groups to differenttransportation pricing mechanisms. The three studies include:
C A study on public perceptions of various transportation pricing strategiesconducted for the California Air Resources Board. This study involved over49
100 individuals on eight focus groups held in four different metropolitan areas.
C A case study on the pricing program for the San Francisco-Oakland Bay BridgeProject.50

Van Hattum, David; Sether, Laura. Citizen Jury on Traffic Congestion Pricing, Saint Paul,51
Minnesota June 6-10, 1996. Context. Hubert H. Humphrey Institute for Public Affairs web site.http://www.hhh.umn.edu/Centers/SLP/Conpric/citjur.htm.
Chapter 5 - Public Involvement and Acceptance68
C A citizen jury created to evaluate and comment on traffic congestion pricing inthe Twin Cities Congestion Pricing Study. 51
Issue: "Roads should be free"
People in general often feel that an implied or specific covenant exists that roads shouldbe free, because they are already paid for through gasoline and other taxes, and that if tolls arebeing collected, they should be removed once construction costs have been repaid. Membersof all three study groups believed that other techniques should be able to decrease congestionproblems without making people pay to travel. To address this issue, planners need to educatepeople on the full costs of vehicle transportation, illustrate the inefficiencies of cost vs. useinherent in the current system, and demonstrate that transportation pricing is the best approachfor correcting these problems.
Issue: "The public should vote for any new fees"
The public may generally believe that any increases in taxes or fees, as well as theallocation of any collected revenues, should be decided on by the voters, not by electedofficials. It may be possible to provide the public the opportunity to vote on the design of atransportation pricing program. Alternatively, planners could look for other methods forobtaining and incorporating the public's opinions into program decisions.
Issue: "There are inadequate alternatives to single-occupancy vehicles"
Few people believe that adequate alternatives to commuting by single occupant vehicles(SOVs) are available. This issue may be addressed by the transportation pricing program byincreasing awareness of the current alternatives to single-occupancy vehicle travel, and bymaking additional funds available to increase the availability of transit and other travelalternatives.
Issue: "These policies benefit the rich at the expense of the poor and middle class"
Pricing proposals are often seen as disproportionately benefiting the wealthy, who canafford to pay for special services, at the expense of the poor and middle class. To address thisconcern, planners need to pay special attention to potential inequities of all transportationdecisions and educate the public on how a specific transportation pricing strategy would alsobenefit the poor, disadvantaged, other under-represented group as well as the middle class. Forexample, by offering access to special uncongested lanes for a fee, some drivers will opt to payfor the use of those lanes. This will help to reduce congestion levels on the normal lanes,thereby indirectly benefiting all drivers who either choose not to, or are not able to buy into thespecial lanes.

Chapter 5 - Public Involvement and Acceptance 69
Transportation pricing programs can remove or mitigate the inequity found in thecurrent transportation system, especially if the fees collected through the program replacerevenue generated in other ways. For example, fuel taxes are a more equitable way of payingfor road construction and maintenance than a general sales tax. People who pay a fuel tax willbe certainly drive on roads, and therefore are paying for road use. They will pay more the morethey drive. In contrast, if a general sales tax is used to pay for roads, a person must pay themregardless of whether that person owns a car. Proponents of a planned transportation pricingprogram need to think about whether the program will mitigate current inequities, and if so,inform the public of the benefits. Planners could also tailor the program to directly benefitunderprivileged groups to counteract any inequity brought about by the program itself.
Issue: "Certain fees might be okay if they address specific problems and improve transportation efficiency"
Although people are rarely enthusiastic about paying more for goods or services, severalstudies have found that people are often more open to such suggestions when it can be shownthat such increases would most likely lead to decreases in undesirable factors. In general, theparticipants of the focus groups in California were willing to consider paying highertransportation prices if they could be assured that the funds raised would be devoted toimproving transportation efficiency, and that the persons administering these funds would beaccountable to the public. In relation to congestion pricing or other market-based pricingmechanisms, participants said that, on occasion, they would be willing to pay a fee during peakperiods to avoid congestion, however, very few people stated that they would be willing to paysuch a fee on a regular basis, as part of their daily commute.
An increase in fuel taxes was the strategy most widely accepted by the California focusgroup. The focus group and other recent studies suggest that people are more willing tosupport transportation pricing strategies if they are familiar.
There was also consistent agreement among focus group members that any revenuesgenerated from a transportation pricing program should be earmarked for improvements inalternative modes of transportation, especially transit systems. Thus, if planners take intoaccount how the public would like to see the additional funds spent and provide adequateassurances regarding the use of these funds, the public is likely to be more willing to accept atransportation pricing policy.
Issue: "How will fees and fuel taxes affect driving behavior and emissions?"
People will often have a difficult time seeing the connection between fuel consumptionand traffic conditions or emissions levels. People are also likely to have difficultyunderstanding how some transportation pricing strategies would achieve their goals. Forexample, participants in the California focus groups did not think vehicle emissions reductionfees would be a plausible or efficient mechanism for reducing congestion and improving airquality. Some participants thought that an at the pump gasoline tax could, in the short run,alter drivers behavior. Most members of the focus groups, however, believed that an increasein the price of gasoline would have to be significant, upwards of fifty cents a gallon, to have
Chapter 5 - Public Involvement and Acceptance70
A Successful Public Involvement Program:
C Defines the audience and the area of concern; C Recognizes and addresses current issues and
concerns; C Clearly defines the goals of the project; C Educates all interested and affected parties; C Involves the public in the decision-making
process; C Incorporates public feedback; and C Anticipates and addresses common issues and concerns.
any noticeable impact on consumption. Overall, the focus group members believed that at thepump charges could be an effective tool to increase revenues, but that they would not be aneffective instrument in reducing levels of congestion, emissions, and improving air quality.
Although the public generally has difficulties seeing the connection betweentransportation pricing measures and decreased levels of congestion and pollution, they tend tohave a basic understanding of some issues (e.g, that appropriate pricing measures must beapplied to affect the behavior of targeted groups). Planners must recognize and build uponthese basic understandings, engaging different interest groups in discussions to clarify theobjectives of transportation pricing programs, and identifying and communicating the potentialimpacts any program might have on the current transportation structure. This will give thepeople the necessary tools to reach informed conclusions about the different transportationpricing mechanisms. Focus groups or community meetings can provide a forum where thepublic can articulate their views and perspectives to planners and decision makers.
Issue: "Such a program is unnecessary and/or would not be cost-effective"
The reactions of the study participants towards transportation pricing policies variedwidely; those persons who lived in areas which tended to be highly congested with poor airquality thought the transportation pricing policies might possibly be effective, while thoseliving in areas with only slight congestion and relatively better air quality thought such policieshad little importance.
Given the current state of the technology and the levels of enforcement and surveillancethat would be necessary to implement some transportation pricing programs, the public maybelieve that such a program would not be cost-effective or feasible. Although opinions willdiffer between metropolitan regions, the participants in the Twin Cities Congestion PricingStudy’s “citizens jury” suggested that planners would “need to quantify the monetary benefitsof congestion relief under a [congestion] pricing scenario relative to imposition of a gas taxincrease or a mileage-based tax” in order for people to accept the program.

U.S. Department of Transportation, Public Involvement Techniques for Transportation Decision52
Making, Federal Highway Administration; Federal Transit Authority, Pub.#FHWA-PD-96-31; HEP-30/9-96(4M)QE, September 1996.
Hubert H. Humphrey Institute of Public Affairs web site: 53
http://www.hhh.umd.edu/Centers/SLP/Conpric/conpric.htm.
Chapter 5 - Public Involvement and Acceptance 71
TECHNIQUES FOR EFFECTIVE PUBLIC EDUCATION AND
INVOLVEMENT
Planners should seek out and make use of a variety of tools to educate and informdifferent interest groups of the program's goals and developments. This section identifies anumber of different techniques that have been used by planners to inform and educate thepublic. These techniques are broken into two general categories: (1) techniques primarilyintended to educate, inform, or persuade those affected by the program; and (2) techniquesdesigned to actively involve the public in the decision-making process. It is important torealize, however, that some forums used to educate and inform people can also be used toreceive feedback, and many techniques used to research the opinions or obtain input fromdifferent interest groups also serve to educate. In addition to the information provided here,planners might also consult the U.S. Department of Transportation’s Public Involvement forTransportation Decision Making or the Hubert H. Humphrey Institute for Public Affairswebsite.52,53
Education and Outreach
The availability of substantial and accurate and relevant information enhances peoples’understanding of a project or a plan and encourages more people to participate in the planningand decision-making process. In addition, well-informed individuals bring issues and concernsto planners that are thoughtful and insightful, and that often lead to better decisions by thoseimplementing the program.
Written Informational Materials
Written materials are one of the best techniques for educating your audience andproviding detailed information on a transportation pricing plan or program. Examples ofwritten materials include:
C Fact Sheets or BrochuresC NewslettersC Public NoticesC Letters to Specific Individuals or OrganizationsC Surveys

Chapter 5 - Public Involvement and Acceptance72
Example: California SR 91Project
The California Private TransportationCorporation (CPTC) conducted an extensivepublic education and involvement campaignfor the congestion pricing project onCalifornia SR-91. The project consists oftolls on four new express lanes, opened inDecember 1995, which vary by congestionlevel and vehicleoccupancy; no tolls onexisting lanes (seeappendix for moreinformation). The tolls areassessed with the use oftransponders mounted inthe cars. Six weeks prior to the projects’implementation, the CPTC undertook amassive media campaign, which includeddirect mailings to residents, radioannouncements, billboards and printadvertisements. These efforts helped tokeep the public informed of events, educatethem on the issues and benefits associated
with the proposedproject and gain theirsupport for the project.
The California SR 91Project also held
public meetings as part of their publicoutreach program. Significant marketingand outreach efforts were made both to localgovernments, including Chambers ofCommerce, and citizen organizations asearly as two years prior to the adoption ofthe program. These parties were invited toand hosted a series of presentations on theproject throughout its development stage. The primary goals of these meetings were toassess the knowledge and perceptions ofaffected tax payers on the issue of toll roadsand to educate them on the benefits of theSR-91 project.
Providing written materials allows planners todeliver a uniform message to all stakeholdersand also helps to alleviate the spread ofmisinformation that can create a barrier tosuccessful implementation of a transportationpricing project. Written materials should bewritten in simple language and format and inappropriate languages to ensure that all affectedindividuals can understand the information. Graphics should be used to enhance any writtenmaterials distributed to the public. Charts,graphs and other illustrations can be helpful indescribing the organization and goals of aprogram, emphasizing key concepts and points,or showing expected changes and benefits to thepresent transportation system.
In addition, materials targeted at aspecific group of stakeholders that explain howa program would benefit, impact or address thespecial needs of their constituency can also bebeneficial. By narrowing the audience, plannerscan address, in detail, those issues that are mostrelevant to special interest groups or theircommunity as a whole. When used inconjunction with uniform messages, suchslightly different, targeted messages cancontribute to a program’s success.

Munnich, Lee et al., p. 7.54
Chapter 5 - Public Involvement and Acceptance 73
Example: GO Boulder Project
The City of Boulder and Colorado DOT are workingtogether to conduct a study on the feasibility ofcongestion pricing in the metropolitan area. TheCongestion Relief Study, which is part of the GOBoulder Project is expected to be completed inDecember, 1997. A combination of several publicoutreach strategies and techniques are being used in thisprogram to involve the citizens of the Boulder region inresolving issues related to traffic congestion. Inaddition to general forms of public education, a largenumber of neighborhood meetings have been heldthroughout the affected area, and local residents havebeen polled on their opinions. These techniques arebeing used to create a foundation of public awarenessand support and to gather continuous public feedback. In addition, the City is proposing to leverage existingregional opportunities, such as the Boulder CountyConsortium of Cities and the Boulder County HealthCommunities Initiative, to further engage neighborhoodcommunities in discussions of regional transportationproblems and potential solutions.
Source: 1995 Listserv Discussions. Boulder, CO--Congestion Relief Study Update. Hubert H.Humphrey Institute of Public Affairs.www.hhh.umn.edu/Centers/SLP/Conpric/1995.htm
Mass Media
Forms of mass media, such as radio, television and print, have proven to be veryinfluential in educating and informing the general public. Through the publication of pressreleases or purchase of air time on local television and radio stations, planners can reach out toa wide base of people. Planners should concentrate on the following when dealing with themedia:
C Develop a good relationship early on;C Maintain open and honest communications; andC Always have useful facts available.
Of the different types of media,the press is one of the most influentialand visible to the general public. It isimportant to develop a good relationshipwith the press early on in a project'sdevelopment. Due to the controversialnature of transportation pricing policies,the press may initially be hostile to theproposed policy. If planners have “thefacts” available, and deal honestly andopenly with the media and other groupswhich raise concerns about the program,the support of such groups should not bedifficult to secure. Not only would54
such a relationship help to guard againstthe release of biased or falseinformation about the program, but itcan also help to ensure that the majorconcerns of all potentially affectedparties are addressed. If the support ofthe press and other forms of media canbe secured, the planners will have aninfluential tool with which they caninform and educate a broad base ofpeople on all aspects of a transportationpricing project.

Chapter 5 - Public Involvement and Acceptance74
The Family Budget Trial
The GO-Boulder Project has embarked on aninnovative case-study program called theFamily Budget Trial. Under this program,six households in the Boulder area wereselected to work with a “personal trainer.” The trainer works together with the family tocalculate the present costs of travel incurredby the family and to estimate how these costswould change under different transportationpricing scenarios.
Public Forums
In addition to keeping the different interest groups informed through the use ofinformational materials and mass media, it is also essential to connect with groups on a morepersonal level. Public forums, such as transportation fairs, open houses, public andneighborhood meetings, and public hearings, provide the opportunity for planners to speakdirectly to the persons potentially affected by changes in transportation patterns. These types ofactivities allow the public to learn about the project and ask questions. Public forums alsoprovide an avenue through which planners can collect a great deal of uncensored feedback,both positive and negative, on the proposed changes. By soliciting input through publicmeetings and other forums, and incorporating such feedback into a proposed project,developers can help to ensure the successful adoption and implementation of a transportationpricing program.
Obtaining Public Input
This section discusses some techniques available, in addition to public meetings, forinvolving the public and obtaining their input. As discussed earlier, involving people in thedecision-making process increases the chances of successfully implementing a transportationpricing project.
Citizen surveys
Citizen surveys can be a helpful tool for planners to gain a better understanding of whatpeople think about a proposed transportation pricing project and what the citizens think are theprimary issues of concern with respect to implementing such a project. In using surveys, it isimportant to remember that the information received will be more useful if the citizens have abetter understanding of the current situation and the proposed project. Thus, surveys mostoften will be combined with some sort of educational technique, such as enclosing writteninformational materials or distributing the survey to attendees at public meetings. It is alsoimportant to recognize, however, that surveys are subject to bias, depending on the selection ofparticipants, the educational materialsdistributed, how the questions are framed, andthe overall aim of the survey.
Focus Groups
Focus groups provide an environment inwhich planners and group members can focuson specific issues of concern. As a result, focusgroups are often used to identify specific issueswith respect to the development orimplementation of a program or to educate thepublic on more detailed or technical topics. Forexample, the GO Boulder project is working to

Midwestern Region Congestion Pricing Workshop, Boulder Project. 55
Chapter 5 - Public Involvement and Acceptance 75
Example: Washington Commute Trip Reduction Task Force
The State of Washington solicited a great deal of public input when it was developing theframework for its Commute Trip Reduction (CTR) Law in 1991 (see appendix for moreinformation). The state relied heavily on the input from a 22-member task force, made upof County, City, and Transit Agency personnel, private employers, State agencies andcitizens at large, all appointed by the Governor of Washington. This task force wasresponsible for the guidelines of the program and played an important role theirimplementation. The task force held meetings with City Chambers of Commerce andemployer groups, set up focus groups for citizens and employers, and held forums wherethe issues could be discussed with affected parties. The task force used this input toformulate guidelines for a model local ordinance, from which local governments couldmold their individual programs. They were so successful in integrating the public’sfeedback into their proposed guidelines that almost every localgovernment adopted the model with few changes. Now that theprogram has been successfully implemented, the role of the task forcehas changed. At this time, they are working in a review capacity,making recommendations to the State legislature on guidelines whichare not working or that need to be amended as well as proposingchanges which should be made.
educate the citizens and other affected parties on the more technical issues associated withtransportation pricing strategies, namely how market-based techniques can affect driverbehavior, traffic flow, and the environment through a combination of small focus groups andspecific case studies. Planners hope to use the results of the case study program (see sidebar)55
to directly educate the citizens on the impacts of transportation pricing and illustrate how travelbehavior can be altered by using market-based approaches to address transportation problems.
Task Forces
Task forces and citizen or civic advisory committees provide a formal opportunity tobring together representatives from the many stakeholder groups affected by a transportationpricing program to identify, discuss, and resolve issues regarding the design, development,implementation, and operation of such a program. Task forces and similar groups have beenused successfully in many situations, including a variety of transportation issues.
In addition to the success of the Commute Trip Reduction (CTR) Task Force inWashington state (see sidebar), the City of Boulder has also set up a task force and otherinteractive community groups to address the issues and concerns associated with its proposedtransportation pricing program. To date, the City of Boulder has set up over 45 focus groupsand formed a Transportation Advisory Board, made up of representatives from a variety of

1995 Listserv Discussions, Boulder, CO--Congestion Relief Study Update.56
Munnich, Lee et al., p. 5.57
Chapter 5 - Public Involvement and Acceptance76
stakeholder groups. The goal of these efforts is to bring together public officials, private56
citizens, businesses and other groups to discuss difficult and controversial issues, buildconsensus between otherwise disparate groups, and reach compromises on appropriatesolutions and approaches.
Reporting Back to the Public
Planners should report back to the public on a regular basis to keep them informed ofnew developments, changes in plans, and ultimately the end result of the program. The TaskForce created to develop the Washington State CTR Law was particularly successful inachieving this goal. Not only were people informed of changes being made to the guidelines,but their feedback was solicited after the law was passed and is being integrated intoimprovements to the current guidelines.
In addition to using a variety of approaches to involve the public, the GO BoulderProject, in Boulder, Colorado also published “A Cost of Travel Report” at the beginning of1996, to help keep people informed on the development of the project. This report, whichincluded information collected from a number of community meetings and focus groups heldthroughout the development phase of the project, also helped to assure the public that theirinput was valued and being taken into consideration.
Utilizing Coalitions and Partnerships
In addition to working with the public to gain broad-based support, developing acoalition of community and government leaders can help ensure a project’s successfuldevelopment and implementation. As Lee Munnich advises, a coalition should, at a minimum,include the major institutional advocates from three areas: transportation policy, business, andcommunity organizations. Task forces, initially formed to obtain public input and57
involvement, may lead to the building of new consensus between groups that have traditionallyhad diverse interests and different objectives.
In addition to coalitions between local interest groups, existing coalitions andpartnerships between like organizations should be targeted. Transportation organizations, suchas the State DOTs, metropolitan planning organizations (MPO), and other authorities, are morelikely to support transportation pricing mechanisms if the revenues realized from suchprograms could be used to help finance the improvement of current roads and transit routes. Air quality and other environmental offices and organizations should be targeted due to theenvironmental benefits derived from decreased levels of travel. Organizing and involvingvarious stakeholder organizations in the program’s technical, financial and institutional issues

Chapter 5 - Public Involvement and Acceptance 77
as early as possible will help ensure that all parties understand the potential benefits and pitfallsassociated with the program. Chapter 4 provides a more in-depth discussion of the importantrole of institutional relationships.
EVALUATING THE SUCCESS OF THE PUBLIC OUTREACH AND
INVOLVEMENT EFFORT
An important component of a public education and involvement campaign that is oftenneglected is the evaluation of the success of the campaign. It is important to decide upon thestructure of the evaluation component of a public outreach and education program before theprogram is undertaken. One should also plan to evaluate the public involvement effortthroughout the process and to make adjustments as necessary to improve the public outreachcampaign. These actions will help establish a baseline by which to measure the success of theprogram.
There are two key elements to evaluating a public outreach campaign:
(1) Defining the success criteria; and (2) Building in milestones during the public involvement process to review the
status of the public outreach and involvement activities against the objectives ofthe process and the success criteria.
By building in evaluation components into a public education and involvement plan,transportation planners can determine how successful the program has been and make anyadjustments that might be necessary to improve the program.
Approaches for evaluating a public outreach and involvement effort include:
C Obtaining feedback from the people on their satisfaction with the decision-making process and their understanding of and involvement in that process;
C Documenting how the participants influenced the decision(s), highlighting areaswhere public input changed the final decision;
C Repeating some of the steps undertaken initially to define the audience andissues to determine if the outreach and involvement program is effectivelyreaching the full audience and addressing all of the relevant issues;
C Summarizing the lessons learned and providing feedback to participants thatdemonstrates what input was received and how it was used; and
C Conducting before and after surveys to assess changes in public attitudes towardthe transportation pricing initiative.

Chapter 5 - Public Involvement and Acceptance78
Public input can be obtained through a number of means including mail-in responsesdistributed through newsletters, and evaluation forms completed by participants of focusgroups, public meetings, and peer review panels. The amount and scope of feedback obtainedwill depend on the nature and/or structure of the evaluation form used.
CONCLUSION
In general, people are wary of any new techniques or mechanisms that will claim toreduce inefficiencies through unfamiliar practices. How people ultimately respond to anyproposal to change existing transportation patterns and regulations will, to a large extent,depend on how successful the public outreach program is in educating and involving allaffected groups and individuals.
Numerous studies and demonstration programs have shown that for a market-basedtransportation program to be successful, the citizens and potentially affected parties must beinvolved in the planning process, they must be educated on the issues at hand and the proposedsolutions, and their input must be taken into consideration in developing a final plan. The levelof public acceptance for a transportation pricing initiative will vary considerably depending onwhat changes have been proposed, the transportation system presently in place, and how wellthe project planners have adapted to and incorporated the public’s views. Only through broadbased support from all affected groups can a transportation pricing program successfullyachieve its goals.

Chapter 5 - Public Involvement and Acceptance 79

80
CHAPTER 6Equity and Transportation Pricing
Equity is an important consideration in any transportation pricing program, whether itbe a parking cash-out program, an emissions-based vehicle fee, or any other pricing strategy. The recognition that various groups and individuals are affected differently by such measures isvital to the success of any transportation pricing program. However, equity can be enhancedgreatly by pricing programs. Since the aim of these programs is to have people pay the coststhey create, they are likely to be inherently more fair than current financing systems. Thisprinciple has been characterized as “paying for what you get, getting what you pay for” (inCalifornia’s Transportation Future, December, 1995, California Market-based TransportationStrategies Working Group). EPA considers this a highly appropriate principle to follow.
Some people assume that if anyone has to pay more under a new pricing program thatthis indicates inequity. That is not the case. Many people are subsidized now while manyothers pay a disproportionate share of the costs. Reducing subsidies and increasing theconnection between the costs people create and what they pay should create a fairer system.
This chapter examines equity in transportation pricing programs. The first sectionpresents an overview of the equity issue. In order to provide a baseline against whichtransportation pricing programs can be weighed, the second section briefly assesses the equityand inequities of the current transportation financing system. The third section discussesvarious equity issues relevant to transportation pricing programs. The last section discussesspecific ways to increase equity through new transportation pricing systems.
OVERVIEW OF THE EQUITY ISSUE
Equity with respect to a transportation system is both an issue of the distribution ofcosts and benefits among groups and a question of access and mobility for all individuals.Developing and implementing an equitable transportation system only means that all groupsshould be treated fairly. It also means that each individual should be able to adequately meethis or her transportation needs while paying for them fairly. Paying for them fairly needs toinclude the recognition that not everyone can necessarily pay their full share and that societybenefits if they are assisted. Realizing these goals in an efficient manner is at the heart of theequity issue. Equity has traditionally been defined in terms of the allocation of benefits andcosts between income classes and races. But considering the equity of the transportationsystem for other groups may be just as important. These other groups include the disabled, theelderly, the young, women, those who drive little or not at all, those who live near traffic,businesses, rural and urban residents, current and future travelers, peak-period users and thosewho do not travel at the peaks.
Equity is very difficult to define. Different people may have different ideas. Theseinclude some of the following possibilities:
1. Equal shares: everyone gets an equal share of the benefits.
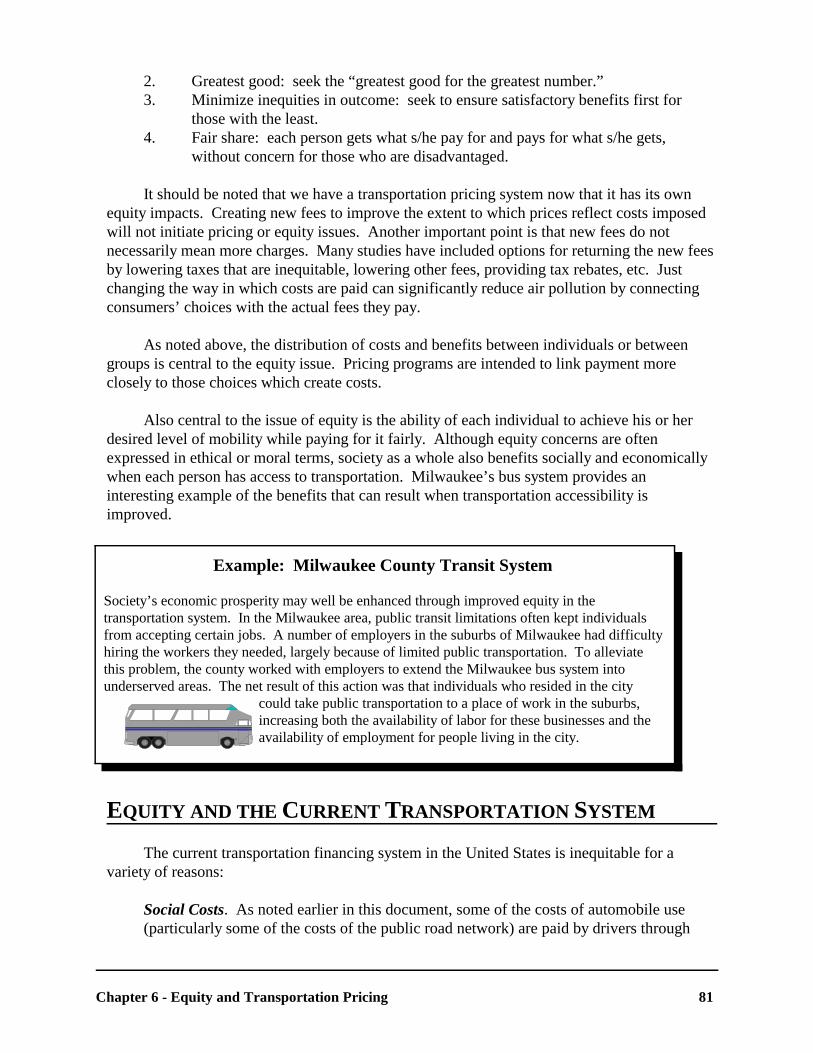
Chapter 6 - Equity and Transportation Pricing 81
Example: Milwaukee County Transit System
Society’s economic prosperity may well be enhanced through improved equity in thetransportation system. In the Milwaukee area, public transit limitations often kept individualsfrom accepting certain jobs. A number of employers in the suburbs of Milwaukee had difficultyhiring the workers they needed, largely because of limited public transportation. To alleviatethis problem, the county worked with employers to extend the Milwaukee bus system intounderserved areas. The net result of this action was that individuals who resided in the city
could take public transportation to a place of work in the suburbs,increasing both the availability of labor for these businesses and theavailability of employment for people living in the city.
2. Greatest good: seek the “greatest good for the greatest number.”3. Minimize inequities in outcome: seek to ensure satisfactory benefits first for
those with the least.4. Fair share: each person gets what s/he pay for and pays for what s/he gets,
without concern for those who are disadvantaged.
It should be noted that we have a transportation pricing system now that it has its ownequity impacts. Creating new fees to improve the extent to which prices reflect costs imposedwill not initiate pricing or equity issues. Another important point is that new fees do notnecessarily mean more charges. Many studies have included options for returning the new feesby lowering taxes that are inequitable, lowering other fees, providing tax rebates, etc. Justchanging the way in which costs are paid can significantly reduce air pollution by connectingconsumers’ choices with the actual fees they pay.
As noted above, the distribution of costs and benefits between individuals or betweengroups is central to the equity issue. Pricing programs are intended to link payment moreclosely to those choices which create costs.
Also central to the issue of equity is the ability of each individual to achieve his or herdesired level of mobility while paying for it fairly. Although equity concerns are oftenexpressed in ethical or moral terms, society as a whole also benefits socially and economicallywhen each person has access to transportation. Milwaukee’s bus system provides aninteresting example of the benefits that can result when transportation accessibility isimproved.
EQUITY AND THE CURRENT TRANSPORTATION SYSTEM
The current transportation financing system in the United States is inequitable for avariety of reasons:
Social Costs. As noted earlier in this document, some of the costs of automobile use(particularly some of the costs of the public road network) are paid by drivers through

U.S. Department of Transportation, Bureau of Transportation Statistics, Transportation Statistics58
Annual Report, 1996, Washington, D.C., 1996, p. 45.
82
gasoline taxes and tolls. However, these payments are not sufficient to cover all of thecosts of automobile use. The remainder of the costs are paid in several different ways.The additional direct costs of building and maintaining roads are paid indirectly throughproperty, sales and income taxes. Indirect costs of supporting vehicles by localgovernments are paid for in the same way. These include the costs of providing policeand fire services, public works and more general government operations that supportprivate vehicles (planning, etc.) The more general social costs of pollution, nuisances,etc. are borne by people and society in the form of additional health costs, poorenvironmental quality, disease and discomfort, congestion, and other unpleasant effects. As a result, the current transportation system unfairly forces those members of societywho do not drive or drive relatively little to help pay for the cost of heavy automobile useby others. Subsidies also encourage a level of driving that exceeds what people wouldactually choose if they had to pay the costs. This increases costs and negative effects foreveryone above a desirable level. Some people pay a disproportionate share of thosecosts.
It is worth noting, that everyone benefits from the public road network, as well assuffering from the use of it. This is because most goods and services are available toconsumers as a result in part of the public road network and because buses and bicyclesalso use the roads.
Marginal Costs. Besides the issue of getting drivers to pay more of the costs they areresponsible for, there is an issue that some drivers are responsible for much more costbecause of when and where they drive. Those who drive in congested areas at peakperiods impose heavy costs on others by the delays they contribute to. They also createdemand for widening roads, which is has very high economic and environmental costs. Itis more fair that those who drive at peak periods should pay for the costs of wideningroads and of delaying others. Congestion pricing seeks to enhance equity by chargingthose who create the costs these “marginal” costs, as opposed to averaging the costs ofroad building over all drivers or taxpayers, even those who do not create much of thedemand.
Private Costs. In the U.S., households spent an average of $6,044 on transportation-related services in 1995. While those with lower incomes may pay less than this per58
year, they still may not be able to afford an automobile. Without a car, such individualsand families often achieve limited mobility because other options are not readilyavailable.
Access. Not all individuals have equal access to employment and services. This is due,in part, to a lack of access to transportation sources and to land use patterns that areauto-supporting and that arise from current transportation pricing policies. This deniespeople economic opportunities, as well as access to shopping, services, socialopportunities, etc.

Parking costs are for Stanford University, referenced in Blueprint for a Sustainable Bay Area, Urban59
Ecology, 1996.
Shoup, Donald C., “An Opportunity to Reduce Minimum Parking Requirements,” Journal of the60
American Planning Association, Winter 1995, p. 25.
Chapter 6 - Equity and Transportation Pricing 83
Transportation-RelatedExpenditures by Households in 1994
(1997 dollars)
All Transportation: $6,044Vehicle Purchases: $2,725Gas and Oil: $986Other Vehicle Expenditures: $1,953Purchased Transportation Services: $389
Source: U.S. Department ofTransportation, 1996, p. 45.
Parking. The current system providesfree or reduced prices for parking atmost work places, shopping and publicareas. This subsidizes automobiletravel and provides a disproportionatebenefit to upper- and middle-incomeindividuals who are more likely todrive. It penalizes those who do notdrive by charging them higher pricesto cover the costs of parking. Parkingspaces cost money: one reportindicated a cost of $2,500 to build asurface space and $1,066 per year tomaintain it, with the comparable costsof $18,000 initially and $1,300-4,600 ayear for multi-level spaces. 59
Underground spaces can be muchmore expensive. “Free” parkingmandated by city ordinances with minimum parking requirements is also likely to havenegative effects on lower-income residents because of the hidden costs associated withmeeting the requirements. Minimum parking requirements raise the price of housingbecause more land and materials are consumed. Developers, in turn, often respond tosuch parking requirements by building larger and more expensive units. This results in60
a smaller supply of housing at increased prices. If there are fewer and larger units due tominimum parking requirements, low-income people are hurt, as are many middle-incomepeople. Because housing is made more expensive as a consequence of minimum parkingrequirements, the poor pay for parking even if they do not own cars. In addition, lowerhousing density also tends to lower transit feasibility, thereby hurting the poor and manyothers. Lower density has many costs for society as a whole, including the additionalcosts of government and utilities in lower-density areas.
The Elderly, Disabled and Young. The elderly, disabled, and the young are particularlyaffected by limited public transit and reliance on the automobile for mobility. Unlessthey live near a public transit stop with good, affordable access to key destinations, theseindividuals often have to depend on family, friends, and neighbors for transportationand/or be deprived.
Minorities. Minority groups are often disproportionately affected by the inequity of thecurrent transportation system because they tend to represent a relatively large percentage

U.S. Department of Transportation, 1996. p.14.61
84
of the lower income population. In addition, they may be more likely to be subject to thehealth risks and annoyance of having major roads near their homes.
Geography. Geographic disparities are another significant factor in the current system. Urban residents are often exposed to higher levels of mobile source pollution thansuburban residents because many people drive into the city from the suburbs for work. Although it may be desirable to base the “price” of driving, at least in part, on the numberof vehicle miles traveled, it may be necessary to consider issues such as a driver’scontribution to congestion and air pollution as well. For example, although those livingin rural areas are particularly reliant on the automobile for travel and also tend to drivemore miles than urban residents, these individuals may have little impact on air quality orcongestion in urban areas.
Transit Fees. Most transit fees do not vary by income level and, thus, represent a greaterpercentage of income for those with lower incomes (this is true for many goods andservices purchased). In addition, individuals at the lowest income level use publictransportation nearly three times as much as those at the highest income levels, yetbecause transit fares do not vary greatly with distance traveled, higher-income individualsgenerally pay less per mile to use public transportation. (This result is largely due to thefact that higher-income individuals rely more heavily on commuter transit services,which provide travel over longer distances and are often more heavily subsidized.)61
THE EQUITY EFFECTS OF TRANSPORTATION PRICING
PROGRAMS
Although transportation pricing programs can be used to address the inequities of thecurrent transportation system (and also to reduce traffic congestion and improve air quality), itis important to consider their equity effects as well. While many of these programs may not beentirely equitable, they may nevertheless improve upon the current system and generatesignificant benefits for society if carefully designed and implemented.
There are a number of important equity considerations that should be taken into accountwhen designing and implementing a transportation pricing program:
C How will individuals in different groups be affected?C Have individuals in these groups been given a voice in the program development
process?C Will the program increase mobility?C How will funds generated from the program be utilized?C Is there a more equitable means of achieving the program’s goals?

Congestion costs (i.e., potential value of time savings) to an individual depend on the amount of time62
spent in traffic delay and the value of his or her time. Congestion costs, therefore, are higher for high-income individuals ($1,570 per year) compared to low-income individuals ($60 per year) because high-income individuals generally spend more time traveling and because their wage rate is higher. U.S.Department of Transportation, 1996. p. 16-17.
Chapter 6 - Equity and Transportation Pricing 85
Addressing these questions, particularly during the program development stage, will providefor a more equitable policy and ensure that individuals in different classifications (urban, rural,minorities, different income levels, etc.) are treated fairly.
In evaluating a transportation pricing program from an equity perspective, one must keepin mind that higher-income people tend to drive more than lower-income people. Those in thelowest income levels tend to use the highway system very little and to drive very little duringcongested periods. As a result, transportation pricing programs aimed at highway travel willlikely affect a greater proportion of higher-income people than low-income people. Indiscussing the impact of pricing programs on low-income people, it is also important to notethat minorities, women, and young people tend to be disproportionately represented inlower-income categories.
The remainder of this section discusses specific equity issues of transportation pricingmeasures. To simplify the discussion, transportation pricing measures are divided into twogeneral categories: (1) taxes, tolls, and fees, and (2) direct subsidies and parking cash-outprograms. These two categories differ in that one takes money away from transportationconsumers while the other gives money to certain consumers.
Tolls, Fees, and Taxes
Tolls, fees and taxes will affect different income groups in different ways. Under apricing scheme, those with high-incomes enjoy the benefits of less congested roads (e.g.,shorter commutes) and may only need to eliminate “discretionary” driving. Higher-incomegroups are much more likely to be affected by new transportation fees, but also have thegreatest ability to pay for them. In general, road users who value time savings over increasedexpense, such as commercial delivery services, are likely to benefit from reduced congestion. 62
Furthermore, in the case of peak-pricing or time-of-day tolls, higher-income people are oftenbetter able to alter their travel schedules and take advantage of less expensive fares.
While lower-income individuals tend to drive (and park) less than higher-incomeindividuals, transportation pricing measures such as tolls, fees, and taxes have a greater impactfor low-income groups if they do have to pay them. Low-income people may be forced toforgo “necessary” trips. Those most likely to be hurt are those who are employed in 9-to-5 jobswith inflexible schedules. Those who are unemployed, or who work during later shifts will notbe affected to the same degree.
In addition to tolls, fees, and taxes that are designed to reduce congestion (i.e., byreducing trips), pricing programs that are based on the emission rates of vehicles, such as an

Instead of paying a fixed rate for insurance that is largely independent of the number of miles traveled, a63
pay-at-the-pump program would allow motorists to “pay as they go” when they fill up their tank with gas.
The total cost of driving on a per-mile basis includes the fixed cost of insurance divided by total mileage64
driven.
86
emissions fee program, can potentially have differential effects on individuals at differentincome levels. This is because individuals with lower incomes are somewhat more likely todrive older vehicles that pollute at relatively high levels and they have less ability to repairthem. As a result, an emissions-based vehicle tax may impact lower-income individuals moresignificantly if they do not have other options for achieving their required level of mobility. For this reason many such proposals include lifeline components, where the charge is based onthe ability to pay.
Pay-at-the-pump charges represent somewhat of an exception to the general rule that isapplicable under tolls, fees, and taxes. A pay-at-the-pump insurance program, for example,63
would clearly benefit lower-income individuals if they currently have insurance. Since theydrive less, their total cost per trip would decrease if insurance costs are based on miles driven. 64
The same is true for other drivers who currently drive less than average. Drivers who travellong distances, such as higher-income people and commercial drivers, may pay more forinsurance than they currently pay, which is more equitable. They may, however, receive somebenefit from the program, particularly in terms of reduced congestion and pollution, as well asa reduction in the number of uninsured motorists.
The lower- and middle-income sectors of the population may be most likely to respond totransportation pricing measures such as tolls, fees, and taxes by switching to mass transit. (Seesidebar.) Individuals who already rely on mass transit for transportation may benefit fromtransportation pricing programs if they lead to increased transit ridership. This is becauseincreased ridership could make transit more efficient and therefore less expensive, and/or itcould facilitate an increase in transit options and service frequency.
In addition to examining the relative effects of transportation pricing on different incomegroups, it is also important to consider the equity implications based on geographicdistribution. If transportation pricing is implemented on a region-wide basis, those who live indenser, urban core areas have more options to avoid the new charges than their suburbancounterparts. Urban dwellers generally have greater access to transit, and to a larger variety ofservices and amenities that can be reached via walking, bicycling, transit, and short drives. Forexample, it has been estimated that there are at least 700 restaurants within walking distance of residences in the North Beach neighborhood of San Francisco.
Tolls and parking fees may affect people and businesses in downtown areas differentlythan those in suburban areas. If tolls are instituted on highways that link people to inner cities,people may choose to avoid the added travel expense and shop in suburban areas. Downtownbusinesses may also experience a loss of employees to suburban competitors due to the addedcost of tolls or parking for employees. Suburban areas may therefore see more congestion if people avoid tolls and choose to shop in less congested areas. Additionally, these businessesmay benefit from drawing employees out of downtown areas because they can offer a cheaper

Linton, Gordon, Administrator, Federal Transit Administration, spoken remarks at Southeastern65
Michigan Council of Governments’ conference “Building Livable Communities Through Transportation,”University of Detroit - Mercy, June 3, 1997.
U.S. Department of Transportation, Highway Statistics 1991, Federal Highway Administration, 1992,66
p.31.
Chapter 6 - Equity and Transportation Pricing 87
commute. This may adversely impact people who live in urban areas if their employers movetheir businesses to suburban areas. Only six percent of welfare recipients have cars, yet two-thirds of the new jobs being created are outside of the urban core. In addition, roughly a third65
of the population is not licensed to drive, and 13 percent of the driving age population do nothave driver’s licences.66
On the other hand, if transportation pricing revenues are used to reduce other taxes indowntown areas, downtown businesses could be more competitive. Parking pricing would belikely to free up parking, making more available for shopping and also reducing the costs ofdoing business and increasing the number of destinations accessible via transit and walking. Reducing space devoted to parking tends to enhance the attractiveness of downtown areas andmake them more appealing for both shopping and businesses.
Parking fees and transit infrastructure are important considerations in any transportationplan. While charging for parking in urban areas may serve to limit congestion and pollution,alternative forms of transportation should be made available to ensure easy access to downtownareas. Increasing parking fees in congested downtown areas may also have a “spillovereffect,” as people park in unregulated areas if those areas do not price their parkingappropriately. Regional parking pricing may offer the potential to level the playing fieldbetween downtown and suburban areas.
Direct Subsidies and Parking Cash-Out Programs
Adding new subsidies is not necessarily more equitable. Allowing even more travelwithout paying the full costs is not a particularly desirable approach. Nevertheless, given thecurrent transportation system, subsidies may be an appropriate step to level the playing field forindividuals with limited mobility and income. Transportation pricing programs that subsidizepublic transit may improve the overall equity of the area’s transportation system becauselower-income and minority individuals are more likely to benefit from such programs. Ofcourse, how such a subsidy program is funded may undermine the benefits to lower-incomeand minority individuals if it relies on regressive fund-raising mechanisms such as sales taxes. However, the pricing ideas discussed in this report are all designed to increase the equity offinancing, perhaps in part by replacing unfair taxes and fees.
One transportation pricing measure that may benefit lower-income and minority people inboth downtown and suburban areas is the employer parking “cash-out” system. This policygives employees the option of receiving cash instead of subsidized parking. Although not

The recent tax code legislation has changed the tax status of cash received in programs such as parking67
cash-out.
88
everyone will choose the cash instead of free parking, it is predicted that many people wouldselect the taxable cash in a cash-out program. If this is the case, cash-out programs may67
benefit low-income employees the most, because the cash allowance would be larger inproportion to their income than it would be for employees earning a higher income and they aremore likely to forego parking. A cash-out policy would also benefit disabled workers who areunable to drive a car to work.
USING TRANSPORTATION PRICING TO ADDRESS
EQUITY CONCERNS
As noted earlier in this chapter, the current transportation system is inequitable for avariety of reasons. In addition, there may be equity concerns associated with a specifictransportation pricing program. If carefully designed with equity as a particular consideration,however, transportation pricing programs can be made more equitable and at the same time canbe used to actually reduce the inequities found in the current transportation system. Examplesof how this can be achieved are discussed below.
Lifeline Pricing and Similar Variable Pricing Options
Lifeline pricing is the concept that, rather than charging all individuals the same rate,those with lower incomes should get a lower rate for at least some of their costs. Often thelower rate applies for a limited service. Lifeline fees are already used to provide heating andtelephone and other basic services to low-income families. Using this type of pricing schemefor transportation services would serve to provide at least a basic level of mobility andaccessibility to many people.
Improvement of Alternative Transportation Services
Another means of employing transportation pricing in an efficient and equitable mannermay be to use the funds generated from such measures to improve or increase transit service. This is a simple yet effective method of addressing some of the equity concerns raised bypricing mechanisms. By increasing or improving the level of service or by lowering the cost oftransit, individuals with lower incomes benefit. In addition, people who cannot drive a car,such as some disabled and elderly individuals and those too young to drive benefit as well. However, one of the other virtues of equitable pricing programs is that they encourage themarket itself to provide alternatives. If driving subsidies are reduced, then it improves the

Cameron, Michael. Efficiency and Fairness on the Road: Strategies for Unsnarling Traffic in Southern68
California. Environmental Defense Fund. Oakland, CA. 1994., p. 42.
Chapter 6 - Equity and Transportation Pricing 89
Alternative Revenue DistributionPolicies Examined
1. Retain the status quo or currenttransportation system;
2. Distribute fee revenues to drivers ineach income quintile proportional toVMT fees paid by that quintile;
3. Distribute a per-capita rebate whereeach income quintile would receivetwenty percent of the fee revenues;
4. Eliminate and pay for transit faresthrough VMT-fee revenue; and
5. Use fee revenues to eliminate existingtransportation taxes.
opportunities for private companies to provide shuttle service, deliveries, telecommunicationsalternatives, neighborhood stores and other alternatives to driving.
Rebates or Subsidies to Lower-Income Individuals
Another transportation pricing approachthat could be successful in addressing equityconcerns is a voucher system wherebyindividuals with lower incomes receive avoucher or rebate for transportation services. The U.S. currently provides food stamps forlow-income individuals and families to ensurethat all citizens have a basic level ofsustenance. The same concept might beapplied to mobility. One recent study stronglysupports the idea of a rebate system, noting thatthe way transportation revenues are distributedsignificantly impacts the equitableness of atransporation fee. This study compared the68
distributional impact of five uses of revenuefrom a hypothetical $0.05 per mile VMT fee(see sidebar).
When the impacts of these five alternatives were compared across income quintiles, thestudy found that all of the alternatives to the status quo led to increased benefits for the lowestincome quintile. The second lowest income quintile also fared the same or better under allscenarios except the revenue neutral scheme (using fees to eliminate existing transportationtaxes). A VMT-fee rebate system where rebates are made or fees eliminate other chargeswould create an incentive to drive less, thereby reducing pollution levels, and depending onhow it is structured, can also result in increased benefits for lower income groups. Opendiscussion of the merits and drawbacks of various fee-rebate scenarios, how they compare tothe current transportation financing system, and their potential impacts on different groupsshould lead to the best choice for each area. Those whose current benefits would be reduced bya transportation pricing program will likely reject such a program. Public education could playan important role by illustrating that much of the true costs of automobile transportation,including pollution and congestion, are currently not paid by consumers, and that a per-capitaVMT-fee rebate would help to remedy this situation.

90
CONCLUSION
While issues such as feasibility, economics, and political realities play a vital role in thedesign of any transportation pricing program, it is important to include considerations of equityas well. Incorporating equity concerns early on in the development of a pricing program, asopposed to addressing them as they arise in the course of implementation, will result in a moreeffective program. In short, if equity concerns are addressed up front, a transportation pricingprogram will be more successful at resolving the equity problems inherent in the currenttransportation system.
The significant amount of revenue that may be generated by a transportation pricingprogram will be sought after by many agencies and groups. The use of revenues from pricingprograms may be one of the most important factors affecting equity. Without makingprovisions to insure accessibility for all individuals, regulatory and market-based strategies runthe risk of excluding a substantial segment of the population. Yet one of the key advantages ofmarket-based transportation pricing programs is that they allow a great deal of flexibility andtherefore provide the opportunity to address equity concerns. Prices can be varied to increaseopportunities for low-income individuals and others who are not served well by currenttransportation policies. Revenues can be used to improve transportation accessibility, increaseefficiency, and reduce the cost of public transit.

91

92
CHAPTER 7Funding Sources
Earlier chapters of this report have focused on issues that drive the feasibility ofimplementing transportation pricing programs for a specific highway, corridor, locality, orregion. For example, Chapter 4 investigated the institutional relationships that are necessaryfor successful program implementation, while Chapters 5 and 6 discussed the importance ofpublic acceptance and the need to account for equity in program design, development, testing,and implementation. Although these issues are critical to the successful implementation oftransportation pricing programs, public and private sector decision makers will also need toaddress issues related to program funding. Without sufficient funds to design, develop, test,and implement transportation pricing measures, issues such as institutional relationships, publicacceptance, and equity may not be adequately addressed in the process, thereby compromisingthe overall success of the project.
The objectives of this chapter are (1) to review the manner in which existingtransportation pricing programs have been funded, and (2) to identify potential funding sourcesavailable to new transportation pricing initiatives. The chapter is organized into three generalsections. The first section reviews federal funding sources stemming from the IntermodalSurface Transportation Efficiency Act of 1991 (ISTEA) that have been (or could be) employedto fund existing programs. The second section address other funding sources and discusses therole of state and local governments in financing the design, development, testing, andimplementation of such programs. This section also discusses private sector funding initiativesand innovative financing strategies available to the public sector that can be used to fund futuretransportation pricing programs. The third section presents a summary table of possiblefunding sources.
FEDERAL FUNDING SOURCES
General federal financial assistance for the planning, development, and improvement ofthe nation’s surface transportation system is provided to states and local governments throughseveral programs, including, for example, the Surface Transportation Program (STP), the TransitBlock Grant Program, and the Bridge Replacement and Rehabilitation Program. The fundingprograms for highway activities are known collectively as the Federal-Aid Highway Program(FAHP), through which funds are distributed to the states. Funding for the FAHP is madeavailable through periodic surface transportation legislation, the most recent of which is ISTEA. It is important to note that ISTEA is up for reauthorization in 1997 and, although the potentialoutcome of this reauthorization is still uncertain, early indications are that at least some of theflexible funding opportunities provided under ISTEA will remain under its successor. Therefore,this section discusses the current funding options under ISTEA. Later, the chapter discusses somespecific changes proposed under the reauthorization.

Title 23 of the United States Code is titled “Highways” and includes most of the laws that govern the69
Federal-Aid Highway Program.
Chapter 7 - Funding Sources 93
ISTEA authorized $121 billion for highway related activities under Title I (SurfaceTransportation). This title contains various funding provisions that states and localitiespotentially could use to finance transportation pricing initiatives. Likewise, Title III (FederalTransit Act Amendments of 1991) and Title VI (Research) of ISTEA include funding programsthat could potentially be used to finance transportation pricing programs. For instance, theFederal Transit Administration (FTA) has been actively involved in various pilot projects, such asthe California SR-91 Project and the San Diego I-15 Express Lanes Project. The major federal-aid programs under Titles I, III, and VI that can be used to finance transportation pricing projectsare discussed below.
Title I -- Surface Transportation
Congestion Pricing Pilot Program
Authorized under Section 1012(b) of ISTEA, the objective of the Congestion Pricing PilotProgram was to encourage the testing and evaluation of congestion pricing projects in a variety ofsettings nationwide on an experimental, or pilot, basis. Under the Pilot Program, the FederalHighway Administration (FHWA) was authorized to enter into cooperative agreements with up tofive state or local governments, or other public authorities, to establish, maintain, and monitorcongestion pricing projects. Up to three of these cooperative agreements could involve the use oftolls on the Interstate Highway System. In addition, pre-project studies, including publicoutreach, project design, and related activities, could be supported with Pilot Program funds.
The Pilot Program gave special attention to formulating plans for monitoring andevaluating the impacts of congestion pricing projects, including those related to travel behavior,environmental quality, equity, and economic development. Federal funds were available tosupport pilot projects for a period of at least one year, or until such time as the project wasgenerating sufficient revenues to fund its operations without federal participation. However, nopilot project could be funded by FHWA for more than three years after implementation. Revenues generated by congestion pricing pilot projects were to be used for project operatingcosts and other Title 23 United States Code purposes, such as costs associated with expandingtravel alternatives in the affected area.69
Originally, ISTEA funded the Pilot Program at an annual stipend of $25 million over theperiod from 1992 to 1997. However, Congress rescinded $50 million of the unused balance ofPilot Program funds in FY 1995. The National Highway System Designation Act of 1995rescinded the remaining balance of the Pilot Program funds authorized through 1995, andtransferred authorizations for 1996 and 1997 to other purposes. Thus, unless additional funds aremade available for congestion pricing projects, there will be no further funds available to currentPilot Program participants for activities planned under future phases, or to new applicants.

Chapter 7 - Funding Sources94
Funding of Implementation ProjectsUnder the Congestion Pricing Pilot Program
C San Diego I-15 Express Lanes Project. Categorized as an implementation project, thisproject was accepted under the Pilot Program in 1995 and will receive $7.96 million over thecourse of three years (1995, 1996, and 1997). Other project funds include $1.99 million inlocal matching funds and $115,000 in Phase I funding from FTA (these funding sources arediscussed in more detail in other sections of this chapter). (See Appendix A for moreinformation on this project.)
C Fort Myers/Lee County, Florida Variable Bridge Toll Project. This project involves theimplementation of off-peak toll discounts in combination with the 33 percent increase in tollsalready implemented on the Cape Coral and Sanibel Bridges in Lee County, Florida. Thispricing scheme will also apply to the MidPoint Bridge, which is currently under construction. The innovative financing element of this implementation project is the use of Pilot Programfunds to support the establishment of a “revenue reserve fund” that will be available toreplace potential revenue loss associated with the adoption of the congestion pricing strategy. Current funding for this project is $20 million, of which 80 percent is federal, 10 percent isfrom the State of Florida, and 10 percent is from Lee County.
C California SR-91 Project. This implementation project is a partnership between theCalifornia Department of Transportation (Caltrans) and the California Private TransportationCorporation (CPTC), a private company that planned, constructed, and operates the variabletolls facility. Since this is not a federal-aid highway project, however, it is not formally apilot project under the Pilot Program. Nevertheless, because the operation of this privatefacility will provide many valuable lessons for the rest of the country, Pilot Program funds arebeing used to support a monitoring and evaluation study of the project in the post-implementation phase. (See Appendix A for more information on this project).
Since 1992, approximately $31 million in Pilot Program funds have been obligated tosupport local congestion project planning and implementation activities. Two projects wereinitiated during the period between 1992 and 1994, and eight new agreements were negotiated in1995. Of the ten projects, three are classified as implementation projects (see box above). Inaddition to the implementation programs being partly funded by the Pilot Program, seven pre-project studies have been supported with these federal funds:
1. The San Francisco-Oakland Bay Bridge Project developed by a consortium ofpublic and private entities headed by the Metropolitan TransportationCommission;
2. The Twin Cities Congestion Pricing Study conducted by the MinnesotaDepartment of Transportation, which relied on $640,000 from the Pilot Program;
3. The Southern California Association of Governments (SCAG) Study under apartnership of the SCAG, Caltrans, the South Coast Air Quality Management

The term “obligation limitation” refers to the limit to which states can commit federal-aid highway70
dollars to their transportation improvement program (TIP) projects resulting from the ceiling imposed bythe annual appropriations bill.
Chapter 7 - Funding Sources 95
District (SCAQMD), and the Coalition for Local Environmental Solutions(COALESCE), which is being funded primarily with Pilot Program monies ($1.5million) and by a local match of $300,000 from SCAG and COALESCE (seeAppendix A for more information on this study);
4. The GO Boulder Congestion Relief Project (part of the GO Boulder Program)being developed by the City of Boulder and the Colorado Department ofTransportation and funded with $492,000 from the Pilot Program, $221,400 fromthe City of Boulder, and $50,000 from the Colorado Office of EnergyConservation;
5. The Portland, Oregon Regional Pricing Project headed by the Portland Metro andOregon Department of Transportation;
6. The Houston, Texas Express Lanes Pricing Project led by the Texas Departmentof Transportation, with support from Houston Metro, and funded with $400,000from the Pilot Program; and
7. The Tappen Zee Bridge Variable Toll Project being conducted by the New YorkState Thruway Authority in cooperation with the New York Department ofTransportation.
The future of these pre-project studies is uncertain, given that Congress rescinded theunused balance of the Pilot Program funds through passage of the National Highway SystemDesignation Act. The result is that only two of the projects discussed above, the San Diego I-15Express Lanes Project and the Fort Myers/Lee County, Florida Variable Bridge Toll Project, willhave sufficient Pilot Program funds available to fully implement their congestion pricingprograms (note that the National Highway System Designation Act does not affect Pilot Programdisbursements for the evaluation study of the California SR-91 Project). However, the FY 1997Department of Transportation (DOT) budget proposes to reserve $15 million in obligationlimitation to be used for congestion pricing projects.70
Surface Transportation Program (STP)
The STP is a new block grant program authorized under Title I of ISTEA that may beused by states and localities for any roads, including the National Highway System, that are notfunctionally classified as local or rural minor collectors. These roads are now collectivelyreferred to as federal-aid roads. Potential uses of funds under the STP include the following:
C Construction or improvement of roads and bridges;C Construction of bicycle facilities and pedestrian walkways;C Development and implementation of carpool and vanpool projects;

Chapter 7 - Funding Sources96
C Funding of capital and operating costs for traffic management and control;C Funding of projects related to safety improvements; andC Funding of wetland mitigation projects.
The total funding authorized for the STP over the period from 1991 to 1997 is $23.9 billion.
To date, states and localities have not used this financing vehicle to partly or fully fund atransportation pricing project. Various issues related with the formula for the distribution offunds and constraints on the use of such funds may diminish the attractiveness of this financingvehicle for such projects. Specifically, the formula for distribution of funds is based on eachstate’s FY 1987 to 1991 share of total national funding, with an appropriate adjustment forInterstate Maintenance and Bridge apportionments. Once the funds are distributed to the states,the following restrictions govern the types of projects that these monies can fund:
C Each state must set aside 10 percent for safety construction activities and 10percent for transportation enhancements, which encompass a broad range ofenvironment-related activities;
C A state must divide 50 percent of the funds by population between each of itsareas with populations greater than 200,000 and the remaining areas of the state(i.e., areas with populations less than 200,000);
C The remaining 30 percent of the funds can be used in any area of the state; and
C Areas with populations of 5,000 or less must receive at least 110 percent of theamount apportioned to the state in FY 1991 for the old federal-aid secondaryhighway system (i.e., rural arterial and collector roads).
Given these constraints, the types of projects that these monies are targeted for, and thelimited financial resources at the state and local levels, states have not used STP funds to fundtransportation pricing projects.
Congestion Mitigation and Air Quality Improvement Program (CMAQ)
CMAQ directs funds toward transportation projects in Clean Air Act nonattainment areasfor ozone, carbon monoxide, and particulate matter. If a state does not contain any nonattainmentareas for ozone, carbon monoxide, or particulate matter, the funds may be used as if they wereSTP funds.
Total funding for the CMAQ program is $6 billion over the period from 1991 to 1997. Funding is distributed based on each state’s share of total population located within an air qualitynonattainment area weighted by the severity of the air quality problem in each area. A minimumof one-half of a percent apportionment is guaranteed to each state. States with ozone or carbonmonoxide (and, under certain conditions, PM10) nonattainment areas may only use CMAQ fundsfor projects that are likely to contribute to the attainment of the national ambient air quality

Chapter 7 - Funding Sources 97
Example: Demand ManagementProject Under CMAQ
In a public-private partnership with theGlendale (California) TransportationManagement Associates (TMA), NestleUSA and Commonwealth Land TitleCompany participated in a demonstrationprogram that rewarded employees whovoluntarily chose alternatives to drivingalone (e.g., carpools, vanpools, transit,walking, etc.). The program combined agraduated parking charge for all employeeswith incentives such as prizes, awards, andguaranteed rides home for participatingemployees. Ultimately, the demonstrationproject (of which $48.7 thousand wasfunded using CMAQ funds and $55.3thousand was matched by the private sector)will produce information that planners canuse to compare parking managementstrategies with other transportation demandmanagement strategies.
standards (NAAQS). CMAQ projects can generally be classified in one of the categoriesdescribed below.
C Transit Improvements. Possible projects in this category relate to system/serviceexpansion for bus and rail services, operational improvements, or demand/marketstrategies to increase the attractiveness of transit.
C Shared-Ride Services. Typical shared-ride projects include the establishment ofvanpool or carpool programs, parking areas for travelers using these services, andprograms to match drivers and riders.
C Traffic Flow Improvements. Eligible highway/road projects include those thatimprove air quality by reducing congestion without adding lane mileage. Examples include signalization to improve traffic flow; trafficmanagement/control, such as incident management and ramp metering;improvements at intersections, such as the addition of turn lanes; and theconstruction or dedication of high-occupancy vehicle (HOV) lanes. However,increasing concern has developed that flow improvements are not good CMAQinvestments because they encourage more vehicle use and make walking andbicycling more dangerous and unpleasant.
C Demand Management Strategies. Typical projects under this category includeemployee trip reduction programs and “auto-free zones.” Projects under thiscategory most closely resembletransportation pricing strategies. (See sidebar for an exampleproject.)
C Pedestrian and BicyclePrograms. Possible programs forCMAQ funding include thecreation of trails and bicyclestorage facilities, as well aspromotional activities designed toencourage the use of non-motorized modes oftransportation.
C Inspection and MaintenancePrograms. CMAQ funds can beused for activities related toemissions testing and controlprograms that detect and repairhigh-emitting vehicles. Funds canbe used for projects related toupdating quality assurance

Chapter 7 - Funding Sources98
software, developing mechanic training curricula, constructing high-techdiagnostic facilities, and other related activities.
C Other Projects and Programs. For example, feasibility studies necessary toprovide environmental documentation for a project are eligible for CMAQfunding, although general planning studies, traffic data collection activities, andsimilar assessments are not.
In this manner, improvements to transportation system efficiency, reductions in vehicleuse or travel, and most other measures that directly or indirectly reduce motor vehicle emissionsmay be funded under CMAQ by documenting the projected air quality improvement. In addition,transportation projects that already are part of an approved state implementation plan (SIP) areeligible for CMAQ funding. No projects that provide new capacity for single-occupancy vehicles(SOVs) may be funded with CMAQ funds unless the project is an HOV facility open to SOVssolely during off-peak travel times.
Assuming that CMAQ maintains its funding under the new ISTEA legislation, states andlocalities will continue to be able to use CMAQ funds to help finance transportation pricingprojects. Although to date CMAQ funds have not been used extensively in the area oftransportation pricing, projects such as the Glendale TMA Parking Management Program (seebox, previous page) have shown that CMAQ can be an effective mechanism for fundingtransportation pricing projects.
Special Financing for Toll Roads
Under Title I of ISTEA, toll roads on federal-aid facilities (i.e., roads, bridges, andtunnels) are permitted to a much greater degree than in the past. The types of toll road projectwork that can be funded under ISTEA authorizations include the following:
C Initial construction of toll facilities (except on interstate highways);
C Rehabilitation, restoration, resurfacing, and reconstruction highway projects ontoll facilities;
C Reconstruction or replacement of free bridges or tunnels and their conversion totoll facilities;
C Reconstruction of free highways (except interstate highways) to convert to tollfacilities; and
C Preliminary studies to determine the feasibility of the work described above.
For the first time, federal legislation allows ownership of toll facilities by private entities. However, the applicable public authority, regardless of ownership, must ensure that the Title 23requirements are being carried out. A state may loan the federal share of a project’s cost toanother public or private entity constructing the project. Funds repaid to the state under the loan

Chapter 7 - Funding Sources 99
agreement may be used for any of the purposes that fall under the original category from whichthe loan monies were drawn.
In addition to the toll road financing opportunities discussed above, FHWA launched anew initiative in 1995 to allow the use of Pilot Program funds by toll authorities to replace lostrevenue resulting from a pilot test of variable pricing. The fact that the Pilot Program is the onlyfederal program under which localities can introduce tolls on interstate highway segments islikely to generate continued interest and participation in this program. The availability of fundsfor this purpose will help to assure toll authorities that the revenue stream associated with a tollfacility will not be jeopardized by the adoption of a transportation pricing toll strategy. As in thecase of the Fort Myers/Lee County, Florida Variable Bridge Toll Project, reserve funds remainingafter completion of the congestion pricing pilot test may be used for other congestion reliefprojects. This serves to further induce the adoption of variable toll strategies.
Perhaps even more significant, however, is ISTEA’s promulgation of policies that provideprivate sector entities with the ability to own toll facilities. This facilitates public/private sectorpartnerships that help to diversify the financial risks that may be associated with transportationpricing programs. Such relationships can also help to generate much needed funds for thedevelopment and implementation of projects that (because of constraints) cannot be fully fundedwith public sector resources. This change in policy contributed significantly to the success of theCalifornia SR-91 Project, which is generally heralded as not only the first congestion pricingproject in the United States, but also as the first fully automated congestion pricing project in theworld. In fact, the California Private Transportation Corporation’s franchise was the firstawarded by Caltrans under the provisions of Assembly Bill 680, California’s innovative programto encourage public/private partnerships to finance needed transportation improvements.
Title III -- Federal Transit Act Amendments of 1991
Under ISTEA, the transit formula and discretionary program requirements and structureremain basically unchanged from previous law. ISTEA achieves important objectives, however,such as providing additional transit and highway funding flexibility, thereby facilitating the use ofFTA funds for transportation pricing projects. ISTEA also allows for identical matching shares offederal funds by states, rail modernization funding via a specified formula, increased use of thetrust fund for multimodal projects, and an expanded research program (e.g., the TransitCooperative Research Program). A total of $31.5 billion has been authorized over the six-yearperiod of ISTEA for these programs. Of this amount, $18.2 billion is to come from the MassTransit Account of the Highway Trust Fund, while the remaining $13.3 billion is to come fromthe general fund.
The most significant change in the law from the perspective of transportation pricingprograms is greater flexibility in the use of funds under ISTEA for transit-related activities andhighway-related activities. For example, it is theoretically possible for state and localgovernments to use up to 70 percent of the highway funds for transit projects and/or about one-third of the transit funds for highway projects.

Chapter 7 - Funding Sources100
Example of Increased Flexibility in the Use of Funds Under ISTEA
An example of how ISTEA introduces flexibility into the use of funds is the Transit Block Grant(Section 9) Program. The basic transit program provides capital and operating assistance tourbanized areas with populations of 50,000 or more. Section 9 funds are apportioned by a statutoryformula based on population and population density for areas under 200,000 in population and onpopulation, population density, and transportation data for areas over 200,000 in population. Section9 capital-only funds can be used for highway projects in Transportation Management Areas (TMAs)if the metropolitan planning organization (MPO) approves and requirements under the Americanswith Disabilities Act have been met. Funds used from the matching share can be used for eitherhighway or transit projects.
Flexibility in the use of transit-targeted funds presents an additional financing option tostates and localities interested in developing, testing, and implementing transportation pricingprograms. For example, FTA has actively participated in the financing the San Diego I-15Express Lanes Project and the California SR-91 Project.
Title VI -- Research (Part B, Intelligent Vehicle Highway Systems Act)
ISTEA established an Intelligent Vehicle-Highway Systems Act, now commonly referredto as Intelligent Transportation Systems (ITS), requiring the promotion of compatible standardsand protocols to streamline widespread use of ITS technologies, user services, and products. ISTEA authorized approximately $660 million for this purpose.
To date, federal ITS funds have been predominantly used to fund field operational testsand research related to the direct and indirect impacts of technology deployment. Various ITStechnologies, especially advanced vehicle identification (AVI) systems and smart cards, can helpto enable transportation pricing measures. The California SR-91 Project, for example, usesFastTrak transponders programmed with individual account numbers and real time variablemessage signs to facilitate the fare setting and collection aspects of the program. Although theCalifornia SR-91 Project did not rely on ITS-designated funds, states and localities can use ITSfunds for technology testing and deployment to help finance transportation pricing measures.
ISTEA Reauthorization
The future of many of the federal transportation programs reviewed above is uncertaindepending on the outcome of the ISTEA reauthorization process slated for 1997. For instance,many states view the CMAQ program to be problematic and support its elimination from the newtransportation legislation. Likewise, the future of FHWA’s Congestion Pricing Pilot Program is

Chapter 7 - Funding Sources 101
uncertain, particularly given the decision by Congress to rescind remaining funds in 1995. Currently, transportation stakeholders are jockeying for position to influence the types ofprograms that will be supported by the next version of ISTEA. At this stage, however, it isdifficult to assess with any degree of certainty how the new transportation law will affect thedesign, evaluation, and implementation of transportation pricing programs.
As part of the ISTEA reauthorization process, the Clinton Administration proposed theNational Economic Crossroads Transportation Efficiency Act (NEXTEA) in March 1997. NEXTEA is a six-year, $175 billion plan that attempts to improve on ISTEA while keeping thegeneral intent of ISTEA intact. The future of transportation pricing looks promising underNEXTEA, as the proposal includes an 11 percent overall increase in ISTEA funding and an a 30percent increase in CMAQ funding. In addition, CMAQ funding eligibility would be expandedunder NEXTEA, and an ITS Incentives Program would be created to promote integration of ITSin both urban and rural areas.
In addition to NEXTEA, several other proposals are being considered in the ISTEAreauthorization process. These proposals, some of which have not yet been formally introduced,include the following:
C The “Truth in Budgeting Act,” which would place the Highway Trust Fund andthree other trust funds “off-budget” in order to authorize more expenditure in thereauthorization of ISTEA;
C The “Surface Transportation Authority and Regulatory Streamlining Act (STARS2000),” which would increase annual highway spending from the Highway TrustFund to $26 billion;
C The “ISTEA Integrity Restoration Act,” which would replace ISTEA’s fundingcategories with two programs, the Streamlined Surface Transportation Programand the National Highway System, which would receive 60 percent and 40 percentof funding, respectively;
C A shift of the portion of the 18.3-cent federal gasoline tax that is dedicated todeficit reduction (i.e., 4.3 cents) to the Highway Trust Fund; and
C A proposal that aims to (1) retain most of the principles and programs of ISTEA,(2) base the funding formula on need, system usage, and historic distributionpatterns, (3) allocate the maximum feasible funding amount to ISTEA programs,(4) maintain the partnerships developed under ISTEA, and (5) reduce“unnecessary regulatory burden” at both the federal and state levels.

Chapter 7 - Funding Sources102
Transportation Pricing Programs Funded Through Cooperative AgreementsBetween Different Government and Private Agencies
C The California SR-91 Project, which is being funded by FHWA, FTA, Caltrans, and CPTC,a private organization.
C The SCAG study, which is being funded by FHWA, SCAG, and COALESCE, anorganization comprised of private businesses.
C The San Diego I-15 Express Lanes Project, which is being funded by FHWA, FTA, andlocal matching funds.
OTHER FUNDING SOURCES
State, Local, and PrivateFinancing
In addition to funds available through the various federal programs described above,states, localities, and private organizations have been actively involved in the provision offinancing for transportation pricing programs. As highlighted in Chapter 3, most programs haverelied on cooperative agreements between state, local, and federal agencies for the development,implementation, evaluation, and funding of projects.
As discussed in Chapter 4, a project’s geographic coverage and stage of implementationoften dictate the types of institutional relationships that must be developed. Geographic coverageand institutional relationships, in turn, may also determine the funding pool available forimplementation and management of a project. In general, those projects that involve roadwaypricing, such as congestion pricing, must rely on a consortium of funding sources for the variousfacets of implementation and enforcement. Other transportation pricing programs, however,often rely solely on state or local funding or on the private sector.
Parking management programs have traditionally relied on private businesses to providethe necessary financing for project implementation. However, most of these programs alsoincorporate incentives (e.g., tax credits) for businesses that offset, at least partially, theirexpenditures on these programs. In this way, state agencies indirectly subsidize parkingmanagement programs through reductions in state revenues (e.g., tax revenues).

Chapter 7 - Funding Sources 103
Transportation Pricing Programs Using State, Local, or Private Funding
C The Maine Turnpike Authority Project is funded entirely by the Authority, which in turn isfunded by toll revenues.
C The Washington State Commute Trip Reduction (CTR) program is funded entirely by statefunds appropriated through Clean Air Act provisions.
C California’s parking cash-out program relies on the private sector and the State’s tax code toprovide the necessary funding for the program.
C The California SR-91 Project relies exclusively on the private sector to finance theconstruction, operation, and management of facilities.
(See Appendix A for more information on these programs.)
TE-045 Innovative Financing Project Initiative
Under traditional funding procedures, the share of federal funds for a surfacetransportation project is not differentiated by the stage of the project (i.e., pre-construction,construction, and operation). As a result, a state may have difficulty funding certain elements of aproject (e.g., feasibility studies, environmental assessments), which could be problematic if thestate hopes to bring the project to the private capital markets. One of the principal objectives ofinnovative finance is to attract capital to transportation infrastructure from new sources. Often,debt instruments can capitalize the necessary funds to undertake a project, but only if the potentialinvestors are confident that the project will be completed on time and on budget and that therevenue stream dedicated to service the debt will materialize. The closer a project is to actualconstruction, the lower the risk to potential investors, especially if engineering, environmental,and other potential hurdles have already been cleared. Consequently, before a project reaches thisstage, the state will have difficulty attracting financing and will rely more on available grantmonies, such as federal assistance.
The TE-045 Innovative Financing Project initiative is the first stage of a new effort byFHWA to move the current transportation financing process from a “grant reimbursement” basisto a diversified approach that provides new options drawn from the most innovative financingconcepts developed by both the public and private sectors. By creating incentives and removingbarriers, FHWA hopes to increase states’ use of the flexibility introduced under ISTEA and toallow states to leverage capital for needed investments more effectively across funding sources. As a result of this initiative, a number of states have proposed innovative financing strategies thatwill improve both physical and operational investments on highways and bridges. The variousfinancing innovations developed to date include the following:
C Innovative management of federal funds. New consideration is being given toinnovations that will remove procedural barriers to project finance, with the goal

Chapter 7 - Funding Sources104
of improving the ability of state and local governments to leverage federal fundsmore effectively, thereby accelerating projects and avoiding increasing costs. Forinstance, phased funding allows states to begin projects before they haveaccumulated the full budget capacity to cover the federal reimbursement of totalproject costs. Likewise, tapering allows states to more effectively manage federalcontributions by allowing these contributions to vary from year-to-year.
C Bonds and other forms of debt financing. Increasingly, states are using federalapportionments as a secondary source to support revenues pledged for bondpayments (e.g., tolls and fees). The use of federal apportionments as creditenhancements would make it easier for states to raise private capital for projects.
C Expanded matching opportunities. In an effort to maximize the use of allavailable resources, projects in the innovative financing program may countprivate donations and local in-kind contributions toward the 20 percent non-federal matching requirement. Furthermore, local capital, in addition to cash, isconsidered for non-federal matching purposes. A number of state proposals alsouse private capital as the required match.
C New leveraging tools, including revolving funds. Under the innovative financinginitiative and ISTEA Section 1012, federal funds can now be used for eligibleprojects, which include facilities with revenue-generating potential such as tollhighways, tunnels, and bridges; loans made to projects regardless of whether thesponsor is a public, quasi-public, or private entity; and other credit enhancementarrangements, such as lines of credit or contingent loans.
C Innovative income generation schemes. To shift the burden of transportationfunding away from traditional funding generated from taxes, states are beingencouraged to identify and capitalize on available commercial income resources. States can now earn revenue through a variety of methods, including (in somecases) leasing public facilities and/or rights-of-way to private entities, profitsharing, and the sale of advertising space.
The implications of innovative financing mechanisms for the development andimplementation of transportation pricing programs are significant. Although these mechanismsdo not represent formal funding sources per se, they provide state and local governments with acompletely new array of financing options that are especially well suited for such programs. Forinstance, the flexibility to better leverage federal funds and develop income generation schemeswith private sector participation creates an attractive environment for transportation pricingprojects that may have been previously viewed as low-priority and risky endeavors. State andlocal agencies can now employ innovative mechanisms to minimize the risk inherent in suchprojects, such as by entering into partnerships with private organizations. The California SR-91Project is the best example of this type of arrangement and will likely be the first of many similarprojects in the future.

Chapter 7 - Funding Sources 105
SUMMARY
This chapter has reviewed the funding sources that have been used to finance existingtransportation pricing programs, and has identified other sources of funds that potentially may beused for transportation pricing programs in the future. The funding sources discussed in thischapter are summarized in Table 7-1 below.
TABLE 7-1SUMMARY OF FUNDING SOURCES
TYPE OF FUNDS FUNDING SOURCE
Federal
Title I of ISTEAC Congestion Pricing Pilot Program (no longer
available)C Surface Transportation ProgramC Congestion Mitigation and Air Quality Improvement
ProgramC Special Financing for Toll Roads
Title III of ISTEATitle VI of ISTEA
Non-Federal
State FinancingLocal FinancingPrivate FinancingCooperative AgreementsTE-045 Innovative Financing Project Initiative

Appendix A - Case Studies106
APPENDIX ACase Studies
CALIFORNIA ’S PARKING CASH-OUT PROGRAM
Contact: Jeff WeirAssociate Transportation Planner California Air Resources Board (CARB)
Telephone: (916) 445-0098
I. GENERAL DESCRIPTION
California’s parking cash-out program, which became effective in January of 1993,requires certain employers to offer commuters the option of receiving cash in lieu of anyparking subsidy offered. Its goal was to level the commute subsidy playing field betweenpeople who drive alone to work and people who rideshare or take public transit. The theory isthat when an employee has the choice between cash and a subsidized parking space, someemployees will take the cash and not drive to work alone. All California employers who arelocated in a nonattainment area, have 50 or more employees, and subsidize employee parkingare required to establish a parking cash-out program. The law applies only to employers whodo not own the parking spaces they are subsidizing. It does not apply to employers withparking spaces subject to existing leases as of January 1, 1993, unless the terms of the leaseallow the number of leased spaces to be reduced. With the exception of several counties inNorthern California, nearly all of California is in nonattainment for at least one criteriapollutant.
Employers who offer parking cash-out may deduct program expenses as ordinary andnecessary business expenses on their state income tax returns. Any cash allowances receivedby employees, except for any portion of the allowance used for tax-exempt ridesharingpurposes, are considered gross income and therefore subject to state income taxation.
II. I NSTITUTIONAL ISSUES
Donald Shoup, a professor of Urban Planning in the UCLA School of Public Policy andSocial Research, developed the concept behind this law. His initial theoretical study onparking cash-out was funded by the U.S. Department of Transportation (DOT). Shoup passedthe idea on to Assemblyman Richard Katz, the chairman of the Assembly TransportationCommittee. Katz liked the idea and crafted a bill, AB 2109, which made the cash-out programa law under the California Health and Safety Code, under the General Administration of theCalifornia Air Resources Board (CARB).

Appendix A - Case Studies 107
The parking cash-out statute is self-implementing, meaning that no action is required ofadministrative agencies in order to implement the law. Actual enforcement by CARB islimited to the filing of a civil suit for penalties. CARB has not exercised its authority to seekcivil penalties, nor has it been requested to do so by any party. A recent California AttorneyGeneral opinion excludes enforcement of the parking cash-out law by local air districts. Oneimportant result of the law is that an increased focus was placed on parking and, in particular,the effects of free parking on transportation and environmental issues.
III. B ARRIERS
Although the program offers State tax benefits for employees, it conflicted with theprevious federal tax code. This was the largest barrier to implementation. Under the previoustax code employee parking subsidies qualified as a tax-exempt fringe benefit. However, if anemployer offered employees the option to choose taxable cash in lieu of a parking subsidy, theparking subsidy itself became taxable income to employees who continue to take parking. (This is because the parking subsidy was provided in lieu of, and not in addition to,compensation otherwise payable to the employee.) Therefore, if an employer offered cash asan alternative to a parking subsidy, commuters who continued to take the parking had to payincome tax on the full market value of the parking. This negative tax consequence deterredemployers from offering the option to cash out a parking subsidy.
However, recent tax code legislation (August 1997) has eliminated this problem. Beginning in 1998, employers will be able to offer the choice between subsidized parking andcash without the disincentive of making all parking benefits taxable. Hopefully this changewill increase the program’s implementation in 1998 and beyond.
IV. E QUITY
One of the primary reasons the law was passed is that it was viewed as leveling the playingfield between drivers and individuals who take public transit, carpool or walk to work. The taxrevenues generated from the program are placed in the state’s general tax fund and therefore donot disproportionately benefit any one group. Although downtown areas are most affected bythis law, the structure of the program is such that they tend to participate in the program to thegreatest degree and realize the largest benefits.
V. PUBLIC EDUCATION , OUTREACH AND MARKETING STRATEGIES
The Air Resources Board has developed an implementation guide for employers, hasspoken to many rideshare and employer groups, and has staff available to answer employerinquiries. Parking cash-out is also promoted by many local air districts and ridesharingagencies as an effective transportation demand management tool.

Appendix A - Case Studies108
VI. E FFECTS AND BENEFITS
The parking cash-out law includes many exemptions which limit its scope. One survey ofemployers in Southern California in 1993 indicated that about 13 percent had some parkingsubject to the law. A more detailed survey in 1995 found that only three percent of theemployers surveyed were subject to the law. In addition, most employers with cash-outeligible parking have put the implementation of parking cash-out “on hold” due to theunfavorable tax implications, estimated administrative costs, and lack of enforcement of theprovision.
The only emission or vehicle miles traveled (VMT) reduction estimates are from Shoup’sstudy of eight employers currently participating in the program, conducted in 1996. Althoughthese eight employers may not be representative of all employers, Shoup found that, onaverage:
C VMT, per employee, per year decreased by 12 percent; the greatest single decrease wasrealized by a company in Downtown LA whose VMT decreased by 24 percent.
C Single occupancy vehicles (SOVs) decreased 13 percent, from 76 percent of employeesto 63 percent.
C Carpooling increased from 14 percent to 23 percent of employees. C CO emissions were reduced by 12 percent.2
C 26 gallons of gas, per employee, per year, was saved.
The program has a number of important advantages. First, it shows commuters that thereis an opportunity cost for free parking, i.e., the cash they decline in return for continued use ofthe parking space. Since parking costs tend to be higher in areas where congestion is also high,the option to receive cash instead of subsidized parking creates a strong incentive to rideshareor use public transit in areas where this is most needed.
Secondly, the program was viewed favorably by employees because it provides them witha new choice. This offer clearly benefits those who select the cash, but not at any direct cost tothose that elect to use subsidized parking. The number of employees who opted to take thecash-out rather than the subsidized parking tended to increase with time. This is largelyattributed to the fact that new employees tended to take the cash-out because they did not haveto undergo a major behavioral change (e.g., they had not yet fallen into a routine of driving sothey did not feel like they were giving up a great deal of convenience).
Third, the program costs the eight employers very little, if anything. The employer isrequired to offer the cash-out option only for spaces which are not owned and not part of apreexisting lease. Therefore, affected employers must simply lease fewer spaces and transferthe money directly to employees who do not use the parking subsidy. In the Shoup study,employers saw a 3 percent average increase in total subsidy costs, with the individual costsranging from a 59 percent increase to a 74 percent decrease. Most firms indicated that theadministrative costs of overseeing the program were negligible.

Appendix A - Case Studies 109
A number of other benefits may result from the program as well. Cashing-out would tendto benefit low-income and disabled employees because many such employees already takepublic transit to work. Urban employees may benefit because it will be easier for them toswitch to public transit since such areas tend to have better access to public transportation. The cash-out program also may strengthen central business districts and urban areas byleveling the playing field with suburban areas. Downtown employers would offer more moneyin return for employees giving up the parking subsidy, thereby opening up parking spaces toshoppers, tourists, or other development. Finally, tax-windfall that results from the programwould benefit both the State and Federal government. When a commuter chooses cash insteadof the parking space, this cash is taxable.

Appendix A - Case Studies110
CALIFORNIA SR-91 PROJECT
Contact: Ed SullivanCalifornia Polytechnic State University
Telephone: (805) 756-1166Fax: (805) 756-1702
I. GENERAL PROJECT DESCRIPTION
The transportation pricing project on California SR-91 is generally heralded as the firstprogram in the United States where tolls vary by the level of congestion. Opened in Decemberof 1995 under the Federal Highway Administration’s (FHWA’s) Congestion Pricing PilotProject Program, this project covers a 10 mile stretch of highly congested road in the LosAngeles metropolitan area. The road is now fully functional and evaluation is underway.
The stretch of road, which connects the Riverside County suburbs to the Los Angelesemployment centers, was built as a two-way, four-lane toll road where HOV-3+ originallywere exempt from paying tolls. Effective January 1, 1997, single occupancy vehicles (SOVs)and HOV-2s must pay anywhere from $0.50 to $2.75 to access the lanes, while HOV-3+s getin free. An optional “frequent traveler” program gives users a $0.50 discount on each tripmade for a flat monthly fee of $15. Existing non-tolled lanes will not be affected by thepricing program, therefore people have a choice. Price varies by congestion, with feescalculated on the basis of time saved at a rate of $0.22 per minute for a SOV during peakperiods. Westbound, the price peaks at $2.75 at 5 a.m., drops to around $1.50 at 9 a.m., dropsagain at 11 a.m., until the afternoon peak period. The price bottoms at $.50 between 10 p.m.and 4 a.m. For eastbound traffic, an inverse schedule exists, with a $2.75 charge during theafternoon peak period. FastTrak transponders, programmed with individual account numberscan be “rented” from CPTC by motorists who maintain a positive pre-paid account balance of$30. Antennas on the road mark the time of entry on the transponders and exit sensors at themidpoint facility read the transponders, calculate the toll and transfer the account number to abusiness management system that deducts the charge.
The California Private Transportation Corporation (CPTC) has installed a facility at theroad’s mid-point from which compliance is constantly monitored. In addition, 35 camerasalong the road monitor traffic levels.
II. I NSTITUTIONAL ISSUES
The California SR-91 Project is the product of a partnership between Caltrans and theCPTC, the private company that planned, constructed, and maintains the program. Fees areadjusted to maintain consistent movement and volume along the road. FHWA and FederalTransit Administration (FTA) are participating in, and financially supporting, the post-implementation evaluation studies of the road, which are being conducted by researchers at theCalifornia Polytechnic State University. However, the road itself is entirely privately fundedand the owners are permitted to collect a maximum return of 17 - 23 percent in revenues,

Appendix A - Case Studies 111
depending on vehicle occupancy and travel volumes. As a result, CPTC reserves the right toextend charges to HOV-3+s as well (at a discounted rate) if costs are not being recovered bythe proposed fare structure. State money can not be used for road construction or operation(though local funds are allowed). In thirty years, CPTC’s franchise on the road will expire andoperation rights will be transferred to the State.
This public-private partnership clearly provides benefits to both parties - Caltrans gets theHOV lanes it cannot afford to otherwise build, and CPTC gets to run a profitable business. However, there is some disparity in the objectives of the two main parties. CPTC’s primarygoal is to increase revenue by maximizing tolled traffic. Meanwhile, Caltrans’ goal is tomaximize HOV (non-paying) traffic. It is not clear how these goals will play out in actualpractice. According to Michelle MacDowell of CPTC, the goals of the two organizations areperfectly aligned at this time.
Within the next few years, another toll road will be constructed nearby which shouldreduce SR-91 traffic considerably. It is not clear if the economic viability of SR-91 will bejeopardized as a result.
III. B ARRIERS
No federal or state funds were available to fund this project, which led the projectdevelopers to look to private sources for funds. The greatest public awareness barrier to thisproject seems to have been the perception on the part of taxpayers that they were double-paying for this road. Education seems to have been a successful response. The greatest barrierto road usage seems to be the $30 deposit price of the transponder, which some users who payin cash find to be excessive.
IV. E QUITY
According to CPTC, equity was an integral consideration in the development of thisprogram. A number of different account options are offered so that motorists with differentincomes can participate in a way in which they are comfortable. Accounts for disabledpersons, disabled veterans, motorcyclists, HOV-3s are all offered in addition to standardaccounts. Because no federal or state funds existed for the improvement of this extremelycongested road, CPTC views its role in reducing congestion in the area as an asset to allmotorists, whether or not they will use the express lanes themselves. According toMacDowell, no one is forced to use the toll portion of the road, yet all lanes benefit from thereduced congestion. Mass transit from metro buses to private shuttles and carpools, all ridefree in the express lanes.
V. PUBLIC EDUCATION , OUTREACH, AND MARKETING STRATEGIES
CPTC has done extensive work in this area. Marketing efforts in the form of publicperception research began two years before the project opened. The goal of early surveys wasto assess the views of tax-paying voters in the affected area with respect to toll roads. Value oftime studies and traffic modeling research were also conducted to help determine appropriate

Appendix A - Case Studies112
pricing strategies. Significant outreach was made to local legislatures, city councils and localtransportation organizations. These groups as well as local Chambers of Commerce and othercitizens’ organizations were invited to and hosted a series of presentations on the project. Sixweeks before the project completion, a mass media campaign was introduced by CPTC whichincluded direct mailings, radio advertisements, on-road signage, as well as printadvertisements. Since then, CPTC has been deluged with speaking requests from communityorganizations, citizens, engineering firms, and a gamut of other interest groups.
Support for the project came from the state legislature (which promulgated the enablinglegislation) as well as the city councils in the area of the project. Two fundamental sources ofresistance were the Riverside County Transportation Commission, which was concerned thatthe private company’s franchise over the median lanes of SR-91 would preclude the Countyextending HOV lanes from Orange County, and from residents of Riverside County, whothought they were being tolled on a road that had been paid for with their taxes. CPTCresponded with extensive education campaigns explaining that no tax dollars were going intothis project and that private funding was the only way to add capacity to this stretch of road. MacDowell claims that the outreach was successful. Rather than the projected 30,000customers, SR-91 currently has over 70,000 customers in only 10 months of operation.
In general, it seems that voters support this measure since it was the only way to get fundsfor the construction of HOV lanes. Earlier attempts to issue bonds and introduce a special taxfor that reason were rejected. Currently, surveys of the public are being conducted primarily toinvestigate travel patterns and demand. Cal Poly’s research team is conducting a 2.5 yearstudy (beginning with a pre-implementation baseline). The research will include surveys ofarea businesses regarding their attitudes toward the project.
VI. E FFECTS AND BENEFITS
The stated goal of the project is to guarantee a smooth-flowing 50 mph ride. Although it istoo early to tell how successful it will be, express traffic has increased weekly from the onsetof the project, and transponder sales have significantly out paced projected rates. After only 10months, over 70,000 transponders had been sold. The road’s location in a severely congestedcorridor (with no alternate routes nearby) bodes well for its success. Cal Poly’s study willinclude observations of traffic conditions, transit ridership, factors that influence day-to-dayuse, origin-destination studies, and comparisons to traditional toll facilities. In addition, CPTCand Caltrans will conduct on-going studies. They have already determined that 20 to 25percent of daily trips made on this portion of the road are HOV-3+s. This project has alsobeen endorsed by a prominent environmental organization.

Appendix A - Case Studies 113
MAINE TURNPIKE AUTHORITY PROJECT
Contact: Dan ParadeeMaine Turnpike Authority
Telephone: (207) 871-7713Fax: (207) 871-7739
I. GENERAL DESCRIPTION
In response to congestion on the Maine Turnpike and to 1991 legislation requiring theevaluation of alternatives before adding capacity to state roads, the Maine Turnpike Authorityconducted a two-summer demonstration with congestion pricing. The original proposalinvolved a $2 peak-period toll surcharge as well as off-peak toll discounts. However, the statelegislature, responding to protests from the tourism industry in the State, precluded theAuthority from increasing tolls on the Turnpike. Instead, the Authority implemented a pricingscheme which maintained peak-period prices but introduced coupons to be used toward off-peak tolls. This scheme, which was in effect during a five-week period in the summer of 1995,involving distributing coupons worth $1.60 (the price for driving from exit 1 in York through 7in Portland, the most congested leg of the road). Millions of coupons were given out at tollplazas, in newspapers, and in mailings. The project was repeated again for five weeks in thesummer of 1996. In 1996, however, the coupons were replaced with a reusable “SummerSmart Pass,” which could be scanned at toll booths. Off-peak periods (when the discountsapplied) were defined as 11 a.m. to 1 p.m. and 7 to 9 p.m. on Fridays; 8 to 10 a.m. and 3 to 5p.m. on Saturdays; and 10 a.m. to 12 p.m. and 7 p.m. to 9 p.m. on Sundays.
The results of this program are now being studied, along with other measures which areunder consideration for future study. A number of other transportation alternatives werestudied and implemented as well, including ridesharing programs and reviews of the viabilityof rail and transit in the corridor. In general, this study was found to have very limited successin influencing drivers’ choices of travel times.
II. I NSTITUTIONAL ISSUES
Although the Turnpike Authority is almost solely responsible for the Turnpike’smanagement, it lost considerable power over its own domain with the State legislature’spreclusion of surcharges. Conflict with the State’s prominent tourism industry appeared to bethe greatest institutional barrier in this case. It is not clear if the Authority will make futureefforts to coordinate with potential partners in the public or private sectors. According to Mr.Paradee, some economic measures will most likely be incorporated into future projects.
This project was funded entirely by the Turnpike Authority, which in turn is funded by tollrevenues. The project was originally intended to be a congestion measure, whereby priceswere raised during peak travel periods in an effort to reduce the number of cars traveling alongthe road, thereby reducing the amount of tolls collected and the Authority’s revenue andbudget.

Appendix A - Case Studies114
III. B ARRIERS
No relevant data was given on the barriers associated with the project.
IV. E QUITY
Equity was not a major issue for this project. According to Mr. Paradee, this project wasmerely a study to investigate whether financial incentives could change driver’s habits. Hesuggested that equity would have come up later if the decision were made to actuallyimplement a full-fledged pricing program.
V. PUBLIC EDUCATION , OUTREACH, AND MARKETING STRATEGIES
Public outreach for this project primarily involved promotion of the program to localresidents and tourists. Brochures were distributed to everyone driving on the turnpike duringpeak hours, advertisements were placed throughout the Boston and Maine areas, and couponswere widely available. Since upwards of 40 percent of the people driving into this area onweekends do so every weekend (during the summer), this tourist market was seen as one forwhom this offer would be worthwhile. However, the 1995 study met with limited success. Educational and promotional efforts were increased in 1996.
VI. E FFECTS AND BENEFITS
The first summer of testing resulted in an increase in off-peak travel, but no noticeabledecrease in peak traffic. A survey of 5,000 peak period weekend travelers found that over two-thirds were regular weekend users of the Turnpike. Studies for the second summer wereprojected to be available at the end of 1996. Over 35,000 Smart Cards were sold in thesummer of 1996. Because the cards represent personal accounts, the follow-up research willinclude information regarding origin and destination, how many times each card was used,what time of day it was used, as well as data on travel habits that will be collected throughphone interviews with card holders. The priority of the study, however, will be to determinehow many drivers moved from peak to non-peak hours.

Appendix A - Case Studies 115
MILWAUKEE COUNTY TRANSIT SYSTEM
“C OMMUTER CHECK” PROGRAM
Contact: Sam SewardBusiness Development Coordinator
Telephone: (414) 937-3251
I. GENERAL DESCRIPTION
The Milwaukee County Transit System (MCTS) initiated the “Commuter Check” programin 1991 as a result of policy direction after County board members became aware of thesuccess of a similar program in New York City. The program has been implementedthroughout the MCTS service area. Participating businesses provide employees with avoucher, or “Commuter Check,” that can only be applied to the purchase of bus passes ortickets, and VanPool fees. Employers decide which employees are eligible to receive vouchersand how often they receive them. Each voucher is worth $9 and is mailed directly toemployees who may use them to purchase transit tickets at 300 locations throughout themetropolitan Milwaukee area. The cost of providing Commuter Checks to employees is a taxdeductible expense for businesses, and the checks are a tax free benefit for employees.
II. INSTITUTIONAL ISSUES
The MCTS was solely responsible for instituting the program, which is run through aprivate contractor, Commuter Check Services Corporation; no other government or privatesector entities participated in its implementation. Initial marketing efforts and the printing ofvouchers constituted most of the up-front costs which totaled approximately $30,000. Milwaukee County supplied the budget for the program.
III. B ARRIERS
The most difficult obstacle that the program encountered were recruiting more businessesfor participation and convincing managers that transportation subsidies are an attractive benefitfor their employees. The most common reason for companies choosing not to participate inthe program is the cost of supplying the benefit to employees.
IV. E QUITY
Because individuals with lower incomes tend to use public transit more than those withhigh incomes, the program may have the side affect of improving the level of equity oftransportation in the area. This will, however, be largely dependent on how employers use thetransit vouchers. Because businesses choose which employees receive vouchers, not allemployees may be treated similarly.
V. PUBLIC EDUCATION , OUTREACH AND MARKETING STRATEGIES

Appendix A - Case Studies116
The business development coordinator of the MCTS is responsible for marketing theprogram and encouraging businesses to participate. Three main strategies have been used toincrease sales: direct mail, on-bus marketing, and business reply cards; advertising in newsmedia has not been used. It is important to emphasize that the program was created andimplemented for purely economic reasons -- air quality improvement, congestion mitigation,and equity concerns were not considered.
VI. EFFECTS AND BENEFITS
MCTS instituted the program after experiencing budget cuts as an effort to help generatemuch needed revenue. Over the past five years, the program has generated about $900,000 ofrevenue for the MCTS (these revenues from the program are not separated from the generaltransit fare revenue). Over 2,000 employees from nearly 75 companies have benefited fromthe program, and participation increases each year. The success of the program depends on theparticipation of large businesses, as evidenced by the fact that 20 percent of the participatingcompanies account for 80 percent of the volume of vouchers. In addition to the financial
benefits, the program has likely reduced highway congestion during rush hour and improvedair quality -- one full bus takes the place of 44 automobiles and eliminates nearly 3,300 poundsof air pollutants annually.
Employers benefit from the program by saving money in construction and maintenance
costs ordinarily spent on providing parking. Employees, especially those who have usedtransit in the past, benefit by receiving the tax-free vouchers. According to the MCTS,employees who use transit also tend to arrive at work less stressed and more productive thanemployees who drive. In addition, the commuter check program is an easy way to providetransit subsidies in an environment where a number of different transit carriers operate. Underthe program, employers provide the financial support, while leaving the decisions concerningmodes of transit to employees.

The access fee for the month of December was set at $50, with the lanes open Monday through Friday,71
6:00 - 9:00 am southbound, and 3:00 - 6:30 pm northbound.
Projections suggest that revenues will total $3 to 6 million during the three-year experiment.72
Appendix A - Case Studies 117
SAN DIEGO I-15 EXPRESS LANES PROJECT
Contact: Michelle KingProject CoordinatorSan Diego Association of Governments
Telephone: (619) 595-5603Fax: (619) 595-5305
I. GENERAL DESCRIPTION
In 1988, two reversible high occupancy vehicle (HOV) lanes were built in the median of I-15, near San Diego, to address the area’s severe congestion problem. Use of the lanes byHOV-3s was so low that the San Diego Association of Governments (SANDAG) decided toinitiated a HOV buy-in demonstration project in an effort to address the under use of the lanes. The project, which was anticipated to be implemented in December, 1996, would allow singleoccupancy vehicles (SOVs) and HOV-2s to pay for access to the existing HOV-3 lanes on an8.5 mile stretch of I-15. Although this program weakens the incentive for motorist torideshare, the San Diego I-15 Express Lanes Project is an example of a congestion pricingprogram currently in effect.
The first phase of the project was a six month long process, including the preparation ofenvironmental clearance documents, selection of electronic tolling technology, anddevelopment of a preliminary pricing strategy. The second phase, which began in December,1996, includes the installation of electronic tolling equipment and the implementation of atemporary pricing scheme. During this phase, a fixed monthly fee, based on motorist demandfor access to the lanes, will be charged. Observations made during the preliminary months71
will be used to develop an even more sophisticated pricing scheme during the second and thirdyears, with fares varying by the time of day and level of congestion. Revenue generated fromthe program will be used for transit expansion on I-15, beginning with two new bus routes andmore frequent bus trips through the corridor. 72
The technology used to run the project will also be implemented in phases. Brightlycolored decals (similar to those used in Singapore’s area licensing scheme) will initially beused to indicate which motorists have paid the monthly fee for access to the lanes. Thesummer of 1997 will act as a transitional phase, with transponders for electronic toll collectionbeing mounted on automobiles, while maintaining a monthly fee system. During the secondyear of implementation, the entire system will be automated, with charges being assessed on aper-trip basis. At that time, variable message signs will be used to communicate current faresto motorists, depending on time of day and level of congestion.

Appendix A - Case Studies118
II. I NSTITUTIONAL ISSUES
SANDAG has partnered with the California Department of Transportation (Caltrans), theFederal Highway Administration (FHWA), the Federal Transit Administration (FTA),California Highway Patrol, as well as local politicians and transit agency officials to plan andimplement this project. Each participating institution has specific responsibilities:
C SANDAG acts primarily as the contract administrator for the project;C Caltrans administers the project’s design specifications and equipment installation; C The California Highway Patrol is responsible for law enforcement, with minimum fines
for traffic violations set at $271;C The Metropolitan Transit Development Board is responsible for implementing related
transit improvements; andC The Project Management Team, which is made up of members from each of the
institutions involved in the project, reviews and comments on all planning andimplementation issues and concerns.
In addition, a Citizens’ Advisory Committee, made up of interest groups and elected officials,was developed in an effort to both educate and involve the public in the planning of the SanDiego I-15 Express Lanes Project. Private sector firms and organizations are also involved inthe project. The primary private sector partners are:
C Consultants who aided in the planning process;C United Infrastructure/CPTC, a private firm, also responsible for the SR-91 project, who
was selected to manage the road. This will include toll collection, billing, and other day-to-day management duties.
C A second private firm will conduct ongoing monitoring and evaluation of the project.
According to Michelle King, Project Coordinator at SANDAG, coordination among thevarious partners and participants has largely been successful, although time-consuming andchallenging. She stressed the importance of establishing relationships between interested andaffected institutions early in the process, and of keeping the project’s planning anddevelopment open to anyone who wants to participate. She stated that all of the participants inthe San Diego I-15 Express Lanes Project were involved from the beginning. This turned outto be an important factor, particularly given the speed at which the project took off.
An early barrier in this project involved the legality of congestion pricing. Because I-15 isan interstate road, this pricing measure could only be introduced under the provisions of theIntermodal Surface Transportation Efficiency Act of 1991(ISTEA). Within the State ofCalifornia, SANDAG had to secure state-level project authorization through enablinglegislation passed in 1994. The project was accepted as a FHWA Congestion Pricing PilotProgram in 1995, providing $7.96 million over the course of three years. Other project fundsinclude $1.99 million in local matching funds, and $115,000 in Phase I funding from FTA.
Appendix A - Case Studies 119
III. B ARRIERS
This measure is likely not to create much public opposition because it takes nothing awayfrom the average motorist. SOVs are offered a premium service at a reasonable cost. If theydo not wish to pay, they can continue to use the congested lanes. At the very least, those userswill benefit to the extent that congestion is reduced by the availability of the nearby lanes. HOV users will continue to have access to uncongested lanes at no cost. In addition, the factsthat this project began at the local level and that revenues would be used for transitimprovements meant that it already enjoyed public support.
IV. E QUITY
While equity has not been a specific component of program development, it will beaddressed as the project continues, particularly in the use of revenues for transit improvements. Furthermore, three workshops were held to encourage participation of low-income and otherhistorically under-represented groups.
Area residents who do not have access to automobiles are likely to benefit from the newtransit that will be funded by revenue from this project. In addition, drivers that can afford topay the fee for use of the HOV lanes will enjoy some time savings. The average driver shouldalso experience some improvement in travel time.
V. PUBLIC EDUCATION , OUTREACH, AND MARKETING STRATEGIES
A Citizens’ Advisory Committee, made up of interest groups and elected officials, wascreated under this program. The committee, which currently holds well-publicized monthlymeetings, has received relatively high participation from the public. The Board of Directormeetings have been open to the public and well-publicized, and “press kits” have been mailedto area residents to further market the program. The greatest amount of public outreachinvolves focus groups and the distribution of surveys, both aimed at estimating potentialdemand for the use of the road. Local SOV motorists were the main target of these outreachefforts. In general, these techniques found significant support for the proposed measures, and awidespread willingness among motorists to pay for reductions in travel time. Efforts were alsomade to inform current express lane users on how the proposed program and the associatedchanges would affect them.
VI. E FFECTS AND BENEFITS
Prior to the program’s implementation, the existing HOV lanes were extremely under used. By offering all motorists access to these lanes for a fee, the San Diego I-15 Express LanesProject greatly reduced the incentives for motorists to carpool. Therefore, while the programmay lead to reductions in congestion and traffic, it is unknown whether it will lead to decreasesin VMT, the number of trips taken, or vehicle emissions.

Appendix A - Case Studies120
SOUTHERN CALIFORNIA ASSOCIATION OF GOVERNMENTS (SCAG)STUDY
Contact: Deborah RedmanPlanning and Policy DepartmentSouthern California Association of Governments
Telephone: (213) 236-1928Fax: (213) 236-1962
I. GENERAL DESCRIPTION
For the past two years, the Southern California Association of Governments (SCAG) hasconducted an ongoing pre-project study of 24 pricing strategies that have the potential toreduce both congestion and pollutant emissions in five counties in southern California. Thestudy area, made up of Ventura, Los Angeles, Orange, San Bernadino, and Riverside Counties,and populated by 15 million people, is one of the nation’s most congested areas. It is alsohome to SR 91 and other market-based transportation control measure (TCM) initiatives. TheSCAG study looked at various combinations of a peak-period congestion fee and an emissionsfee (a vehicle miles traveled (VMT) fee weighted for actual vehicle emissions). The study,concluded in January, 1997, has been sent to the SCAG Regional Council for approval. It isanticipated that, feasibility studies will be conducted and an implementation plan produced forthe chosen measures.
According to Deborah Redman of SCAG, the study found that a number of strategies canachieve significant pollution and congestion reductions. One of the more modest proposalswas a combination of an a.m. and p.m. peak period congestion pricing fee of $0.05 per mile onless congested portions of roadway and $0.10 on more congested portions, as well as anemissions fee of (on average) $0.016 per mile (weighted by actual vehicle emissions). Inaddition, “HOT lane” demonstration projects (like SR-91) are recommended as a short termtrial stage which will allow fine-tuning of the policy and a chance for the public to experiencethe benefits of pricing.
II. I NSTITUTIONAL ISSUES
This project is being conducted under a partnership of SCAG, Caltrans, the South CoastAir Quality Management District (SCAQMD), and the Coalition for Local EnvironmentalSolutions and a Competitive Economy (COALESCE). These partners have met monthly todevelop and direct the project through such processes as technology review, workshops, andstrategy subcommittee sessions. Redman describes the partnership as a “very complex, deepinvolvement,” stressing the importance of this “trust-building effort.” Essentially, that efforthas meant that the various partners have had to learn to trust each other in guiding thedevelopment of the project and experimenting with new ideas.

Appendix A - Case Studies 121
In addition to the major partners, a stakeholder taskforce, known as the REACH TaskForce (Reduce Emissions and Congestion on Highways), consisting of 75 elected officials,business and environmental representatives, as well as other interested parties, has participatedin project development over the last year. Once the project moves beyond its study phase, newpartnerships will need to be created with local governments and agencies such astransportation commissions and the California Highway Patrol.
Funding for this program comes primarily from FHWA’s Congestion Pricing PilotProject, which contributed $1.5 million. A local match of $300,000 came from SCAG andCOALESCE. If the proposed project is implemented, it is expected to net $3.5 billion per year(after a 10 percent deduction for administrative costs). It is not yet clear who will beresponsible for the management and implementation of the scheme, but some privateparticipation seems likely. In any case, some of the revenue will likely be returned to localitiesto be used for transit improvements and the creation of other transportation alternatives onpriced corridors. Furthermore, this study investigates possible scenarios for returning moneyto local communities. Some possibilities are coupons for discounted car repair, maintenance,or emissions improvements; transit funding or transit discount coupons; state tax credits; orreductions in other taxes. Another possible benefit could be that regulations such as theCommuter Law could be rendered unnecessary in light of the gains made by this program.
While operational and management issues have only begun to be considered, SCAG hopesto work out many of the details through the trial “HOT lanes” project.
III. B ARRIERS
In Ms. Redman’s opinion, the greatest barrier to future implementation will be the fact thatsome carpoolers who now ride for free will suddenly be charged. Outreach efforts for theseindividuals are now being planned. Another barrier is finding places where a “HOT lane”project can be implemented without disrupting the State’s existing network of high occupancyvehicle (HOV) lanes. This issue is raising a lot of concern and will have to be addressed if a“HOT lane” project is approved. Finally, there have been equity concerns, but Ms. Redmanfeels they have been dealt with and that most groups will actually benefit from the project
IV. E QUITY
Equity has been an important consideration throughout this project. Populations that havebeen specifically considered have been the area’s Latino community, low-income groups, andthe population of 2-person carpoolers who now ride for free but who might have to pay undersome HOT lane scenarios.
Ms. Redman maintains that, while equity concerns have been seriously considered, thisproject will actually benefit all groups, particularly since money is proposed to be returned toindividuals in communities in a variety of ways. In addition, transit will be further developedin the area, and a light rail project is already underway.
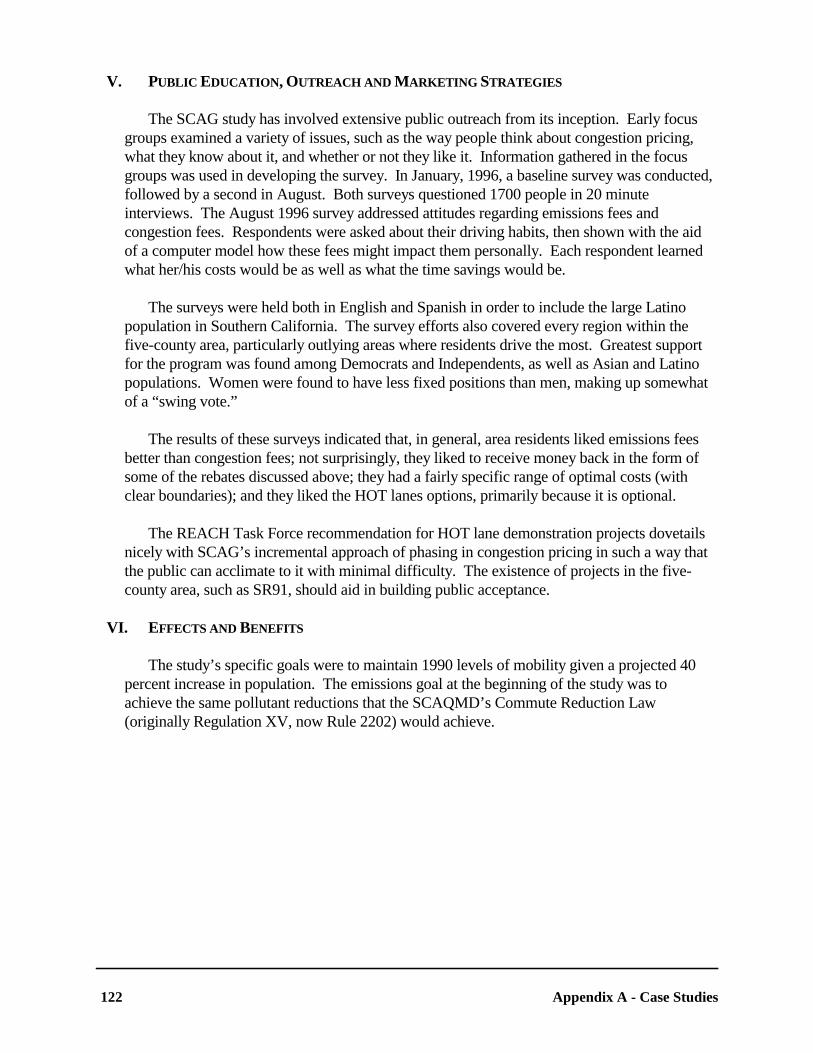
Appendix A - Case Studies122
V. PUBLIC EDUCATION , OUTREACH AND MARKETING STRATEGIES
The SCAG study has involved extensive public outreach from its inception. Early focusgroups examined a variety of issues, such as the way people think about congestion pricing,what they know about it, and whether or not they like it. Information gathered in the focusgroups was used in developing the survey. In January, 1996, a baseline survey was conducted,followed by a second in August. Both surveys questioned 1700 people in 20 minuteinterviews. The August 1996 survey addressed attitudes regarding emissions fees andcongestion fees. Respondents were asked about their driving habits, then shown with the aidof a computer model how these fees might impact them personally. Each respondent learnedwhat her/his costs would be as well as what the time savings would be.
The surveys were held both in English and Spanish in order to include the large Latinopopulation in Southern California. The survey efforts also covered every region within thefive-county area, particularly outlying areas where residents drive the most. Greatest supportfor the program was found among Democrats and Independents, as well as Asian and Latinopopulations. Women were found to have less fixed positions than men, making up somewhatof a “swing vote.”
The results of these surveys indicated that, in general, area residents liked emissions feesbetter than congestion fees; not surprisingly, they liked to receive money back in the form ofsome of the rebates discussed above; they had a fairly specific range of optimal costs (withclear boundaries); and they liked the HOT lanes options, primarily because it is optional.
The REACH Task Force recommendation for HOT lane demonstration projects dovetailsnicely with SCAG’s incremental approach of phasing in congestion pricing in such a way thatthe public can acclimate to it with minimal difficulty. The existence of projects in the five-county area, such as SR91, should aid in building public acceptance.
VI. E FFECTS AND BENEFITS
The study’s specific goals were to maintain 1990 levels of mobility given a projected 40percent increase in population. The emissions goal at the beginning of the study was toachieve the same pollutant reductions that the SCAQMD’s Commute Reduction Law(originally Regulation XV, now Rule 2202) would achieve.

Appendix A - Case Studies 123
WASHINGTON STATE
COMMUTE TRIP REDUCTION (CTR) PROGRAM
Contact: T.J. JohnsonTelephone: (360) 705-7508Fax: (360) 705-6862
I. GENERAL DESCRIPTION
In 1991, Washington State passed the Commute Trip Reduction (CTR) Law,which set the parameters and framework for the CTR program. The Law affected majoremployers (those with 100 or more full time employees) in counties with populationsgreater than 150,000. In all, nine counties were affected, and sixty-two local jurisdictionstherein. The goals of the program are three fold: to reduce air pollution, to decrease energyconsumption and to decrease traffic flow, especially in terms of single-occupancy vehicles(SOV) and vehicle miles traveled (VMT). Using 1992 as a traffic baseline, the programhopes to achieve a 15 percent reduction in SOV/VMT by January 1, 1995, 25 percent by1997, and 35 percent by 1999. Approximately 1/3 of the sites achieved the 15 percentgoal in 1995, and 2/3 of the sites realized reductions. The program planners have beenmore concerned with progress in reducing the SOV/VMT than with achieving setnumbers.
A lead agency was appointed at the State level to administer the program. Originally this was the State Energy Office, however, responsibility was turned over to theState Department of Transportation (DOT) when the Energy Office was disbanded. A 22Governor appointed member task force, made up of County, City, and Transit Agencypersonnel, private employers, State agencies, and citizens at large developed theguidelines of the program, which were to be used by local officials to develop their ownlocal ordinances. A State technical assistance team worked with the affected counties andjurisdictions to assist them in developing and implementing local programs. CTR hasapproximately a $3 million annual budget, 80 percent of which is passed onto counties foradministrative costs and 20 percent which is used for administrative purposes at the Statelevel. All of the funding for the CTR program comes from the State Air Pollution ControlAccount, which is made up of the proceeds from a $2 motor vehicle registration tax.
Under the CTR program, employers are free to develop trip reduction programswhich compliment the needs and characteristics of their individual worksites. This led toa number of variations in the CTR plans for different employers, some of which includetransportation pricing measures. For example, some employers are offering preferentialparking terms (e.g., lower fares) to those employees who carpool or vanpool to work,while others are subsidizing the cost of mass transit for their employees. Localjurisdictions and transit agencies have also gotten involved in the program, offeringincentives such as discounted mass transit fares or passes, and subsidizing the costsassociated with the formation of vanpools.

Appendix A - Case Studies124
II . INSTITUTIONAL ISSUES
The CTR Law requires employers to make a “good faith” attempt to try to reducethe number of employees who commute to work in SOVs and reduce the overall numberof VMT. In addition, each affected work site is required to fill out a survey once everytwo years that measures the progress of the program and details any changes in employeecommute behavior. An annual report of each individual program must also be completed. These requirements allow the employers, jurisdictions, and State task force to identifyproblems with the program, follow trends, and use successful programs from onejurisdiction as models for others. As long as employers have made a “good faith” attempt,and have completed the required surveys and reports, regardless of whether they have metthe goals of the program, they have complied with the law. If, however, employers refuseto comply with the law, the local jurisdictions have the authority to sanction fines.
III . BARRIERS
The State of Washington ran into some barriers during development andimplementation of the CTR program. Although the program is heavily supported byemployers, they find it difficult to encourage their employees to participate because of thelack of available public information. The general public must be informed of theprogram’s goals, why these issues are important, and why CTR is part of the solution. The project developers realize that a more aggressive, statewide, public education andoutreach program must be developed. The State also recognizes that, in order to do this, itmust involve the media. However, funds for a large scale public outreach program are notavailable at this time.
Every affected employer is required to appoint a transportation coordinator tooversee the implementation of a CTR plan in the office place. The State has developed atraining program, which has been adopted by a number of local jurisdictions, and manyemployers try to ensure that their employee transportation coordinators (ETC) receive thistraining. However, factors such as employee turnover can lead to difficulties in ensuringthat an employee ETC is properly trained and understands the CTR program. The Stateis trying to encourage employers to ensure that their employee ETC is properly trained by getting the media involved and recognizing those employers who have successfulinstituted CTR programs in the workplace. They hope to reward people who arededicating time and resources to the project and, in this way, get other employers moreinvolved in programs, thereby increasing their effectiveness.
Another barrier that the CTR program encountered was the lack of infrastructurein some areas of the State. Public transit lines do not always cross county boundaries,which can make cross county commuting very difficult and time consuming. Some areasof the State do not have extensive transit alternatives to automobile travel. The StateDOT is addressing this issue and is trying to find ways to redirect resources to targetspecific regions that are experiencing these sort of problems. They are relying heavily onemployer feedback to tell them where barriers such as these exist and what, at the locallevel, needs to be done to help alleviate the situation.

Appendix A - Case Studies 125
IV. E QUITY
A number of equity issues are relevant to this CTR program. Geographic locationhas been a big concern. The population density of nine counties affected by the Lawrange from rural to urban. The more rural areas do not have the same transit, congestion,or pollution problems as the more urban areas, and therefore question why they mustcomply with the same law. In addition, rural areas do not have the same level of transitinfrastructure to accommodate commuters who chose not to drive to work. This makesthe task of reducing SOV/VMT difficult because alternatives to automobile travel do notalways exist. The State is dealing with this by creating zones in each county, based on1992 population, transit, air quality and other data, and creating goals which areappropriate for each zone.
All employers with over 100 full time employees must participate in CTRprograms, however much concern has been voiced about smaller firms in close proximityto one another who are not affected by the CTR Law (e.g., a number of firms whoseindividual work forces are below the threshold, but whose combined, concentrated workforce is well over 100). A number of institutional barriers are associated with requiringsmall employers to implement CTR programs. Studies found that implementing the CTRprogram at smaller employers would lead to increased administrative costs which, inmany cases, would offset any benefits.
V. PUBLIC EDUCATION , OUTREACH AND MARKETING STRATEGIES
The 22-member task force played an important role in the development andimplementation of the program. They held meetings with City Chambers of Commerceand employer groups, set up focus groups for citizens and employers and held forumswhere the issues associated with the Law could be discussed with affected parties. Theinput collected from these meetings was used to formulate guidelines for a model localordinance from which local governments could mold individual programs. The focusgroups and meetings were so successful in soliciting and incorporating feedback thatalmost every local government adopted the model ordinance with only minor changes. The Task force is currently working in a review capacity, making recommendations to theState legislature of changes which should be made.
There has not been any broad, statewide public outreach or acceptance programassociated with the CTR Law. The State DOT is in the process of developing a statewidepublic outreach and education program to try to increase awareness and participation. Due to budgetary constraints, however, they cannot implement anything at this point. Theprogram developers never experienced any major opposition to the program, its goals, orits content. Employers liked the fact that they were given the guidance of the State, andlocal governments but had the flexibility to model a CTR plan to fit the needs of theirworkplace.
VI. E FFECTS AND BENEFITS

Telephone interview with T.J. Johnson, November 5, 1996.73
Appendix A - Case Studies126
So far, the CTR law has been very successful. Approximately 900 employersparticipate in the program, with 325,000 employees who are directly affected by the CRTprogram. To date, only one work site out of the 900 who participate in the program hasrefused to cooperate. The jurisdiction fined the employer approximately $6,000, butinstead of collecting the funds, required the firm to use the monies to develop andimplement a work place CTR plan. The aim of the program is not to raise revenues, butto reduce SOV/VMT.
In 1995, a number of reductions were realized:
C 80 million VMT were eliminated;C 12,000 vehicles were removed from the roads during commute times;C CO emissions were reduced by 33,000 tons per year; and2
C gasoline consumption was reduced by 4.5 million gallons.73
These numbers do not show drastic reductions or changes in commuter behavior, but theydo show that the program is in the process of achieving its goals.
The task force is responsible for performing a cost-benefit analyses of theprogram. They have collected information from work sites and used State data todetermine that the CTR program costs, on average, $9 per year, per employee. In thefuture, they hope to be able to compare the CTR program to other, more traditionaltransportation policies, in order to gauge its effectiveness and success.

127

Appendix A - Case StudiesAppendix B - List of Acronyms 128
APPENDIX BList of Acronyms
ATC automated toll collectionAVI advanced vehicle identification Caltrans California Department of Transportation CARB California Air Resources Board CBDs central business districtsCMAQ Congestion Mitigation and Air Quality Improvement Program COALESCE Coalition for Local Environmental Solutions CPTC California Private Transportation Corporation CTR Commute Trip Reduction DOT Department of Transportation EDF Environmental Defense FundEPACT Energy Policy Act of 1992ETC employee transportation coordinatorFAHP Federal-Aid Highway Program FHWA Federal Highway Administration FTA Federal Transit Administration HOV high-occupancy vehicle ISTEA Intermodal Surface Transportation Efficiency Act of 1991ITS intelligent transportation systems MCTS Milwaukee County Transit System MNDOT Minnesota Department of TransportationMPO metropolitan planning organization NAAQS national ambient air quality standardsPATP pay-at-the-pumpREACH Reduce Emissions and Congestion on HighwaysSANDAG San Diego Association of Governments SCAG Southern California Association of Governments SCAQMD South Coast Air Quality Management District SIP state implementation plan SOV single-occupancy vehicle STP surface transportation program TCM transportation control measureTMA transportation management area VHT vehicle hours traveledVMT vehicle miles traveled

129

Appendix C - List of References130
APPENDIX CList of References
American Lung Association web site. http://www.lungusa.org.
Apogee Research, Inc. Costs and Effectiveness of Transportation Control Measures (TCMs): AReview and Analysis of the Literature. Report Prepared for National Association ofRegional Councils. January, 1994.
Blythe, Philip T., and Hills, Peter J. “Electronic Road-Use Pricing and Toll Collection: TheResults of the ADEPT Project.” Proceedings of the International Conference onAdvanced Technologies in Transportation and Traffic Management. Centre forTransportation Studies, Nanyang Technologicial University, Singapore. May 1994. p.309-318.
California Environmental Protection Agency, Air Resources Board. “California’s Parking Cash-Out Program.”
California Environmental Protection Agency, Air Resources Board Research Division. Transportation Pricing Strategies for California: An Assessment of Congestion,Emissions, Energy and Equity Impacts.
Caltrans. California Department of Transportation: Vehicle Count for Peak Hour, Daily Average,and Annual Total for all California Freeways, 1993.
Carlin, Alan. The United States Experience With Economic Incentives to Control EnvironmentalPollution. July, 1992.
Cameron, Michael. Efficiency and Fairness on the Road: Strategies for Unsnarling Traffic inSouthern California. Environmental Defense Fund. Oakland, CA. 1994.
Coleman, Steven B.; Rothblatt, Donald N. An Appraisal of Institutional and Technical IssuesRelated to Congestion Management Agencies in California. Transportation ResearchBoard. 74th Annual Meeting. Washington, D.C. January 22-28, 1995.
COMSIS Corporation. Implementing Effective Travel Demand Management Measures.September, 1993.
COMSIS Corporation. The Use of Market Mechanisms to Reduce Urban Emissions. DraftReport to U.S. EPA. June, 1994.
Deakin, Elizabeth and Greig, Harvey. Transportation Pricing Strategies for California: AnAssessment of Congestion, Emission, Energy and Equity Impacts. Technical Reportprepared for the California Air Resources Board. June, 1995.

Appendix C - List of References 131
Dittmar, Hank; Frick, Karen; Tannehill, David. Institutional and Political Challenges inImplementing Congestion Pricing: Case Study of the San Francisco Bay Area. CurbingGridlock: Peak Period Fees to Relieve Traffic Congestion. National Academy Press. Washington D.C. Special Report 242. 1994. 2, p. 300-317.
Downs, Anthony. Stuck in Traffic: Coping with Peak-Hour Traffic Congestion. BrookingsInstitute/Lincoln Institute of Land Policy, 1992.
Eisinger, Douglas S., et al. Transportation Control Measures: State Implementation PlanGuidance. Final Report. December, 1989.
Federal Reserve Bank of Minneapolis. Primer on Congestion Pricing. Federal Reserve Bank ofMinneapolis web sit: http://woodrow.mpls.frb.fed.us.
FHWA Midwestern Region Congestion Pricing Workshop. Congestion Pricing WorkshopProceedings. Chicago, IL. Spring, 1995.
FHWA. The Congestion Pricing Pilot Program: Overview and Status Report. Washington, DC: Government Printing Office, 1996.
FHWA. Papers Presented at the Congestion Pricing Symposium, June 10-12, 1992. FHWA-PL-93-003. December 1992.
Fong, Peter K.W. “An Evaluative Analysis of the Electronic Road Pricing System in HongKong.” Hong Kong Economic Papers. 1986. vol 17, p. 75-90.
Fowkes, A.S., et al. The Distributional Impact of Various Road Charging Schemes for London. Institute for Transport Studies Working Paper 400. University of Leeds. June 1993.
Gomez-Ibañez and Small. Road Pricing for Congestion Management: The Transition fromTheory to Policy. September 6, 1994.
Ho, L.-S. “On Electronic Road Pricing and Traffic Management in Hong Kong,” Hong KongEconomic Papers. 1986. vol 17, p. 64-74.
Hubert H. Humphrey Institute of Public Affairs. Boulder, CO--Congestion Relief Study Update. 1995 Listserv Discussions. www.hhh.umn.edu/Centers/SLP/Conpric/1995.htm.
Hubert H. Humphrey Institute of Public Affairs. Congestion Pricing Pilot Program: FHWAOverview and Status Report; January 1996.
Hubert H. Humphrey Institute of Public Affairs, State and Local Policy Program, Buying Time: Symposium; Research and Policy Symposium on the Land Use and Equity Impacts ofCongestion Pricing. 1996.

Appendix C - List of References132
Hubert H. Humphrey Institute of Public Affairs web site:http://www.hhh.umd.edu/Centers/SLP/Conpric/conpric.htm
Johansson, Börje, and Mattsson, Lars-Göran. “From Theory and Policy Analysis to theImplementation of Road Pricing: The Stockholm Region in the 1990s.” Road Pricing: Theory, Empirical Assessment and Policy. Kluwer Academic Publishers. Boston, MA. 1994. p. 181-204.
Kessler, Jon and Schroeer, William. Meeting Mobility and Air Quality Goals: Strategies thatWork. U.S. EPA, Office of Policy Analysis. January 7, 1993.
Ketcham, Brian and Komanoff, Charles. Win-Win Transportation: A No-Losers Approach toFinancing Transport in New York City and the Region. KEA. New York, NY. Draft. July, 1992.
Konheim and Ketcham. Price It Right! and End Roadway Entitlement. Paper given at HofstraUniversity. December 4, 1992.
King County, Washington’s Response to Federal Tax Code. (power-point presentation slides)
Lampe, Andrew J.; Scott, John. Electronic Toll Collection and Air Quality. p. 707-719.
Larsen, Odd I. “The Toll Ring in Bergen, Norway - The First Year of Operation.” TrafficEngineering and Control. 1988. vol. 29, no. 4, p. 216-222.
Litman, Todd. Transportation Cost Survey. Olympia WA. February 2, 1992.
Litman, Todd. Transportation Cost Analysis: Techniques, Estimates, and Implications. VictoriaTransportation Policy Institute. Victoria, BC, Canada. April 6, 1995.
Local Government Parking Management Handbook. Using Demand-Based Parking Strategies toMeet Community Goals.
MacKenzie, James J., Roger C. Dower, and Donald D. T. Chen. The Going Rate: What It ReallyCosts to Drive. World Resources Institute. Washington, DC. 1992.
Menon, A.P. Gopinath, et al, “Singapore's Road Pricing System: Its Past, Present and Future.” ITE Journal, December, 1993. p. 44-48.
Midwestern Region Congestion Pricing Workshop: Summary of Proceedings. DevelopingPolitical and Public Support. Chicago, Il. May, 1996. Hubert H. Humphrey Institute ofPublic Affairs web site: http://www.hhh.umd.edu/Centers/SLP/Conpric/chicago.htm
Milwaukee County Transit System Brochure of Commuter Check Program

Appendix C - List of References 133
Minnesota Department of Transportation web site: http://www.hhh.umn.edu/Centers/SLP/Conpric/mndot.htm#Definitions. “MinnesotaCongestion Pricing Study.”
Moffet, John. The Price of Mobility. Natural Resources Defense Council. San Francisco CA. Draft. November 6, 1991.
Munnich, Lee, et al. Institutional and Political Issues in Congestion Pricing: New Models forFederal, State and Local Cooperation in Infrastructure Investment. Hubert HumphreyInstitute of Public Affairs. University of Minnesota. Minneapolis, Minnesota. p. 6.
Munnich, Lee. Summary of proceedings: FHWA Midwestern Region Congestion PricingWorkshop. Chicago, IL. 1995.
National Research Council, Committee for Study on Urban Transportation Congestion Pricing,Curbing Gridlock: Peak-Period Fees to Relieve Traffic Congestion. Vol.1: CommitteeReport and Recommendations; Vol.2: Commissioned Papers. Transportation ResearchBoard Special Report 242. National Academy Press. 1994.
National Transportation Library. Evaluating Congestion Pricing Alternatives for the Puget SoundRegional Council. MTP-17a. August 1994. National Transportation Library web site:http://www.bts.gov/smart/cat/ecp.html.
Oldridge, Brian, “Congestion Metering in Cambridge City, United Kingdom.” Road Pricing: Theory, Empirical Assessment and Policy. Kluwer Academic Publishers. Boston. 1994. p. 131-140.
Pol, H.D.P. Road Pricing: The Investigation of the Dutch Rekening Rijden System. NetherlandsMinistry of Transport and Public Works. February 1991.
Puget Sound Regional Council. 1995 Update of the Metropolitan Transportation Plan for theCentral Puget Sound Region: Evaluating Congestion Pricing Alternatives for the PugetSound Regional Council. Technical Paper MTP17a. August, 1994.
Ramjerdi, Farideh. “The Norwegian Experience with Electronic Toll Rings.” Proceedings of theInternational Conference on Advanced Technologies in Transportation and TrafficManagement. Centre for Transportation Studies, Nanyang Technological University. Singapore. May, 1994. p.135-142.
Research Library web site. Bay Bridge Congestion Pricing Demonstration Program.http://www.webd.alink.net/bats/baybridge.html.
Sharpe, J. Michael. Demand Management: The Cambridge Approach. Transportation Studies,Cambridgeshire County Council, Cambridge, U.K. May 1993.
Appendix C - List of References134
Shoup, Donald, “Cashing Out Free Parking.” Transportation Quarterly. vol. 36, p. 351-364.
Shoup, Donald, “An Opportunity to Reduce Minimum Parking Requirements.” Journal of theAmerican Planning Association. Winter 1995.
Sierra Research, Inc. Feasibility and Cost-Effectiveness Study of New Air Pollution ControlMeasures Pertaining to Mobile Sources. Prepared for Maricopa Association ofGovernments. Report No. SR93-06-02. June, 1993.
Social Democratic Party, Moderate Party, and Liberal Party. The Greater Stockholm Negotiationon Traffic and Environment: The Dennis Agreement. Signed by O. Lindkvist et al.,transmitted by Bengt Dennis to The Minister of Transportation and Communication,Stockholm, Sweden. January 23, 1991.
South Coast Air Quality Management District (SCAQMD). ARB Mobile Source ControlStrategy. App IV-E. April 1994.
Stoelhorst, H.J., and Zandbergen, A.J. “The Development of a Road Pricing System in TheNetherlands.” Traffic Engineering and Control. February, 1990. vol 31, p. 66-71.
Surber, Monica; Shoup, Donald; and Wachs, Martin. “Effects of Ending Employer Paid Parkingfor Solo Drivers.” Transportation Research Record 957. 1994.
Toh, Rex S. “Experimental Measures to Curb Road Congestion in Singapore: Pricing andQuotas.” Logisitics and Transportation Review. 1992. vol 28, p. 289-317.
Traffic Engineering & Control. “Bergen Introduces Cordon Pricing.” Traffic Engineering &Control. February, 1986. p. 83.
Traffic Engineering & Control. “Automatic Toll Billing Evaluation.” Traffic Engineering &Control. December, 1985. p. 595.
Transportation Research Board, Committee for Study on Urban Transportation CongestionPricing. Curbing Gridlock, Peak-Period Fees to Relieve Traffic Congestion, Vol 1 and 2,Special Report 242. National Academy Press. 1994.
Transpotech, Ltd. Electronic Road Pricing Pilot Scheme: Main Report. Report prepared for theHong Kong Government. May, 1985.
Tretvik, Terje. The Trondheim Toll Ring: Applied Technology and Public Opinion. SINTEFTransport Engineering, Trondheim, Norway. Presented at the jointOECD/EDMT/GVF/NFP Congerence on The Use of Economic Instruments in UrbanTravel Management, Basel, Switzerland, June, 1992.
U.S. Bureau of the Census. Statistical Abstract of the United States: 1993. 1993.

Appendix C - List of References 135
U.S. Department of Energy. Annual Energy Outlook 1997. Energy Information Administration. DOE/EIA-0383(97), December 1996.
U.S. Department of Transportation. Public Involvement Techniques for Transportation DecisionMaking. USDOT. Federal Highway Administration; Federal Transit Authority. September 1996. (Pub.#FHWA-PD-96-31; HEP-30/9-96(4M)QE)
U.S. Department of Transportation, Bureau of Transportation Statistics. Transportation StatisticsAnnual Report, 1996. Washington, D.C. 1996.
U.S. Department of Transportation, Federal Highway Administration. Congestion Pricing Notes. Various from 1996.
U.S. Department of Transportation and U. S. Environmental Protection Agency. Clean AirThrough Transportation: Challenges in Meeting National Air Quality Standards. JointReport to Congress. August, 1993.
U.S. EPA. National Air Quality and Emissions Trends Report, 1995.
U.S. EPA, Office of Policy, Planning, and Evaluation, Transportation Group. Guidance on theUse of Market Mechanisms to Reduce Transportation Emissions. Almost Final Draft. May 30, 1996.
Van Hattum, David; Sether, Laura. Citizen Jury on Traffic Congestion Pricing, Saint Paul,Minnesota June 6-10, 1996. Context. Hubert H. Humphrey Institute for Public Affairsweb site. http://www.hhh.umn.edu/Centers/SLP/Conpric/citjur.htm.
Victoria Transport Policy Institute. Defining and Quantifying Public Transit Benefits. web site:http://www.islandnet.com/ litman/transit.htm. (This document, as well as other links~
within the VTPI web site.)
Vorhees, Michael. The True Costs of the Automobile to Society. Boulder, CO. January, 1992.
Waersted, K. Automatic Toll Ring No Stop Electronic Payment Systems in Norway -- SystemsLayout and Full Scale Experiences. Directorate of Public Roads, Norway. Paperpresented to the Sixth Institution of Electrical Engineers International Conference onRoad Traffic Monitoring and Control, London. April, 1992.
Washington State Transportation Commission Innovations Unit. Congestion Pricing: ATransportation Demand Management Strategy. Washington State TransportationCommission. Olympia, WA. March, 1994.
Williams, Michael E. and Petrait, Kathleen. U-Pass: A Model for Transportation Managementthat Works. Presented at Transportation Research Board Annual Meeting. January, 1993.

Appendix C - List of References136
Wyman, Robert; Zbur, Rick. “COALESCE: A proposal by the Coalition for LocalEnvironmental Solutions and a Competitive Economy.” Draft. May 31, 1995.