Embed Size (px)
Citation preview
SPECIAL REPORT 303: EQUITY OF EVOLVING TRANSPORTATION FINANCE MECHANISMS
Equity, Pricing, and Surface Transportation Politics
Alan Altshuler John F. Kennedy School of Government, Harvard University
Paper prepared for the Committee on the Equity Implications of
Evolving Transportation Finance Mechanisms Transportation Research Board
2010

1
Equity, Pricing, and Surface Transportation Politics1
ALAN ALTSHULER John F. Kennedy School of Government, Harvard University
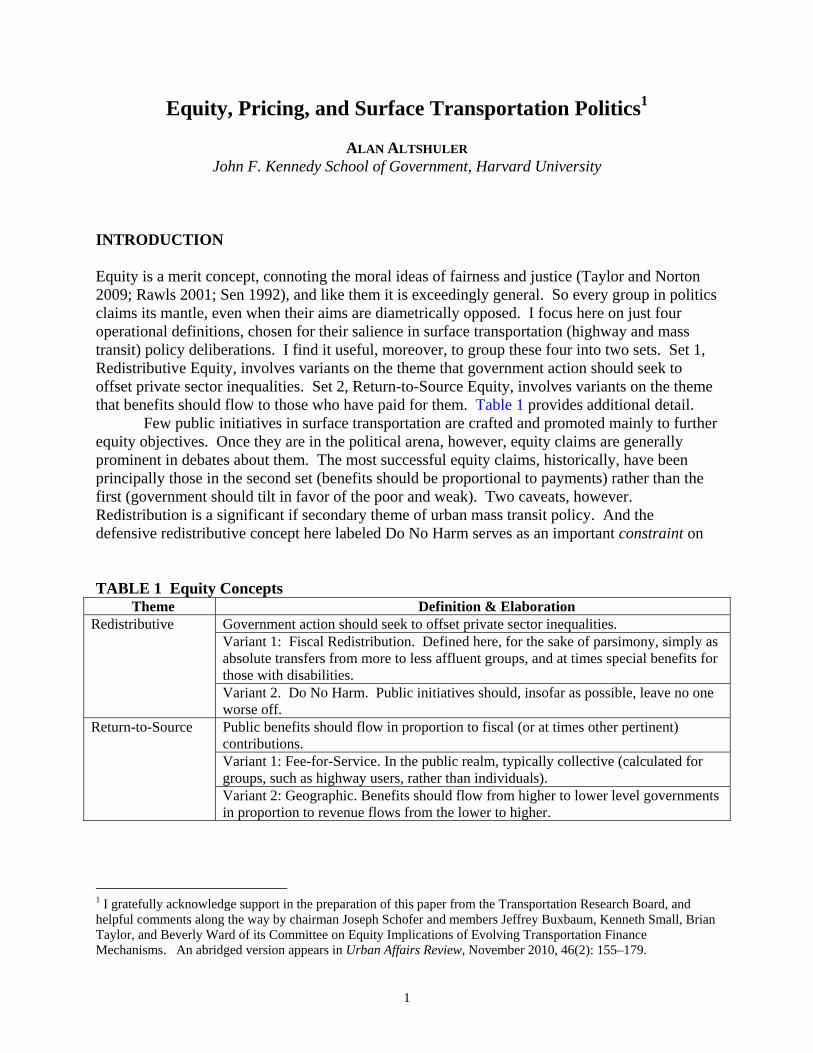
INTRODUCTION Equity is a merit concept, connoting the moral ideas of fairness and justice (Taylor and Norton 2009; Rawls 2001; Sen 1992), and like them it is exceedingly general. So every group in politics claims its mantle, even when their aims are diametrically opposed. I focus here on just four operational definitions, chosen for their salience in surface transportation (highway and mass transit) policy deliberations. I find it useful, moreover, to group these four into two sets. Set 1, Redistributive Equity, involves variants on the theme that government action should seek to offset private sector inequalities. Set 2, Return-to-Source Equity, involves variants on the theme that benefits should flow to those who have paid for them. Table 1 provides additional detail.
Few public initiatives in surface transportation are crafted and promoted mainly to further equity objectives. Once they are in the political arena, however, equity claims are generally prominent in debates about them. The most successful equity claims, historically, have been principally those in the second set (benefits should be proportional to payments) rather than the first (government should tilt in favor of the poor and weak). Two caveats, however. Redistribution is a significant if secondary theme of urban mass transit policy. And the defensive redistributive concept here labeled Do No Harm serves as an important constraint on
TABLE 1 Equity Concepts
Theme Definition & Elaboration Redistributive Government action should seek to offset private sector inequalities.
Variant 1: Fiscal Redistribution. Defined here, for the sake of parsimony, simply as absolute transfers from more to less affluent groups, and at times special benefits for those with disabilities. Variant 2. Do No Harm. Public initiatives should, insofar as possible, leave no one worse off.
Return-to-Source Public benefits should flow in proportion to fiscal (or at times other pertinent) contributions. Variant 1: Fee-for-Service. In the public realm, typically collective (calculated for groups, such as highway users, rather than individuals). Variant 2: Geographic. Benefits should flow from higher to lower level governments in proportion to revenue flows from the lower to higher.
1 I gratefully acknowledge support in the preparation of this paper from the Transportation Research Board, and helpful comments along the way by chairman Joseph Schofer and members Jeffrey Buxbaum, Kenneth Small, Brian Taylor, and Beverly Ward of its Committee on Equity Implications of Evolving Transportation Finance Mechanisms. An abridged version appears in Urban Affairs Review, November 2010, 46(2): 155–179.
2 Equity, Pricing, and Surface Transportation Politics
initiatives in the overall surface transportation arena, ranging from construction proposals entailing displacement of residents to fiscal proposals that would accentuate current disparities between advantaged and disadvantaged groups.
These patterns are apparent not just in the historic record, but also in today’s leading proposals for reform. The next four sections elaborate on these assertions. Those that follow ask how they have played out to date in relation to the variants of congestion pricing that have so far found some traction—central area charge schemes and high occupancy toll (HOT) lanes. EQUALITY: HOW CENTRAL A CRITERION OF EQUITY? Most Americans harbor very different attitudes toward equality when thinking about the private and public sectors. In the former, they are deeply suspicious of calls for equality, accepting that even the remarkable extremes of inequality characteristic of the U.S. private sector are socially beneficial because they provide the incentives on which prosperity depends. In the public sector, by contrast, they are highly suspicious of privilege (as witness the politics of salary determination for senior public officials), and believe that services should be provided to the residents of any jurisdiction either equally (garbage collection, water supply) or on the basis of need (compensatory education, safety nets for the poor). (Altshuler 1999; Friedland and Alford 1991)
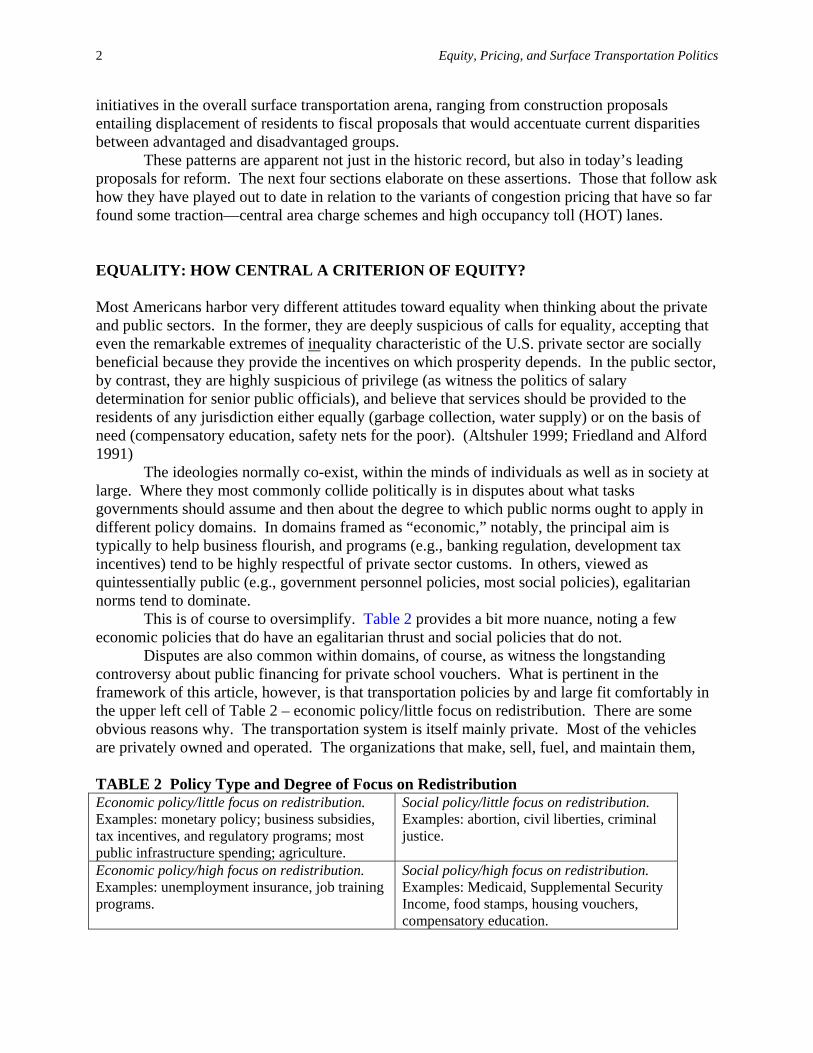
The ideologies normally co-exist, within the minds of individuals as well as in society at large. Where they most commonly collide politically is in disputes about what tasks governments should assume and then about the degree to which public norms ought to apply in different policy domains. In domains framed as “economic,” notably, the principal aim is typically to help business flourish, and programs (e.g., banking regulation, development tax incentives) tend to be highly respectful of private sector customs. In others, viewed as quintessentially public (e.g., government personnel policies, most social policies), egalitarian norms tend to dominate. This is of course to oversimplify. Table 2 provides a bit more nuance, noting a few economic policies that do have an egalitarian thrust and social policies that do not.
Disputes are also common within domains, of course, as witness the longstanding controversy about public financing for private school vouchers. What is pertinent in the framework of this article, however, is that transportation policies by and large fit comfortably in the upper left cell of Table 2 – economic policy/little focus on redistribution. There are some obvious reasons why. The transportation system is itself mainly private. Most of the vehicles are privately owned and operated. The organizations that make, sell, fuel, and maintain them, TABLE 2 Policy Type and Degree of Focus on Redistribution Economic policy/little focus on redistribution. Examples: monetary policy; business subsidies, tax incentives, and regulatory programs; most public infrastructure spending; agriculture.
Social policy/little focus on redistribution. Examples: abortion, civil liberties, criminal justice.
Economic policy/high focus on redistribution. Examples: unemployment insurance, job training programs.
Social policy/high focus on redistribution. Examples: Medicaid, Supplemental Security Income, food stamps, housing vouchers, compensatory education.
Altshuler 3
and that use some of them for shipping, are almost all private. And this pattern carries over into politics. The dominant interest groups have long been companies and their trade associations, who have framed the government role as primarily to facilitate private travel and investor-driven economic development.
Public officials often play leading roles in the development of transportation policy and project proposals. They typically do so in close concert with transportation business interests, however, judging that little can be achieved without their support and nothing in the face of their opposition. They routinely emphasize as well that their proposals are equitable, but overwhelmingly with a focus on geographic and/or user group rather than redistributive equity.
This is not the entire story. Mass transit is today almost entirely public, including vehicle ownership and operation. It is roughly four-fifths taxpayer financed, with the tax revenue drawn from sources unrelated to transit use.2 And one of its core functions is to serve those without easy access to cars. So issues of redistributive equity are far more salient in mass transit than other sectors of transportation policy (which include not just highways but also aviation, rail, trucking, and inland waterways). Even in the transit sector, though, services that sharply target the poor and disabled have found traction mainly in the context of campaigns to broaden the coalition for conventional highway and transit expenditures. They are marginal within the overall framework of surface transportation finance, or even of mass transit finance viewed alone.3 And they are almost invisible in the current debates about surface transportation reform. REFORM IS IN THE AIR: WHAT PLACE EQUITY? The national role in surface transportation policy was extremely modest until enactment of the Interstate Highway Program in 1956, and the rationale for a large federal role has seriously frayed since effective completion of that program in the 1980s.4 Federal expenditures have continued to rise, because a wide range of influential constituencies intensely support them, but it has become increasingly unclear what national purposes are being served. In this context, the most salient recent debates have been about the explosive growth of Congressional project earmarks (from eleven in the Surface Transportation Act of 1982 to 5,700 in the SAFETEA-LU Act of 2005), and about state shares of the federal aid pie.5 The latter is an equity debate, to be sure, but it reflects a view that the federal role should be mainly to raise money, then send it back where it came from. When pressed on why the federal government should provide this revenue collection service, program supporters most commonly respond that
2 In 2003 fare revenue covered 22 percent of U.S. transit expenditures. TRB 2006. 3As of 2001, even members of the least affluent urban households (under $20,000) made 75.9% of their trips by auto and just 4.6% by transit. (Pucher and Rennie 2003). While low-income transit users rely mainly on buses, moreover, transit subsidies have historically been skewed heavily toward rail systems. (Pucher 1981; Garcia 2003; Garrett and Taylor 1999). 4 By 1991, when ISTEA was making its way through Congress, only one Interstate Project remained on the drawing boards, Boston’s Central Artery/Tunnel (the so-called Big Dig), a late addition authorized by Congress in 1987 following a great legislative battle. Several other Interstate projects, most notably the Century Freeway in Los Angeles, were incomplete but well along in construction. (Altshuler and Luberoff 2003). 5 The earmark count is from TRB 2006, Table 2-8. The U.S. Department of Transportation reports a slightly lower figure for SAFETEA-LU of 5091 earmarks. http://flh.fhwa.dot.gov/policy/safetea-lu/earmarks.htm, updated January 5, 2009 Ronald D. Utt surveyed appropriations from FY1985 to FY1999 across numerous domestic policy domains and found rapid earmark growth in nearly all – the main exceptions being military construction and the Post Office. (Utt 1999).
4 Equity, Pricing, and Surface Transportation Politics
the federal government has ongoing flows of revenue that most states would find it impossible (for political reasons) to replace and also a unique capacity to run persistent deficits. There is, moreover, widespread agreement that the U.S. is under-investing in surface transportation, so the focus should be on finding new revenue sources rather than abandoning any of those that currently exist. The most frequently cited indicator is that the federal gas tax has not been increased since 1993. It has lost about one-third of its value since then to inflation, and since FY2001 expenditures from the Highway Trust Fund (HTF) account have consistently exceeded revenues. (National Surface Transportation Infrastructure Financing Commission 2009: 41,43) The HTF finally ran dry near the end of FY2008 and received an infusion of $8 billion from the General Fund. It received another $7 billion in FY2009. These sums are in addition to General Fund revenues that are being utilized by states and localities for surface transportation under the federal stimulus package. The stimulus legislation, enacted in February 2009, included $27.5 billion for highways and $8.4 billion for mass transit, to be expended over the following 2-3 years. (Orski 2009; Grabell and Weaver 2009. For stimulus package details, cf. http://www,propublica.org/special/the-stimulus-plan-a-detailed-list) State highway user taxes have likewise stagnated or declined in recent years.6 And the federal government is experiencing its largest deficits in relation to GDP (12 percent in FY 2009) since World War II. So the pressures are building rapidly for either large spending cutbacks in surface transportation or very significant new revenue sources.
The question of what to do has recently been addressed by a variety of national commissions and committees. Their analyses and recommendations are by and large very similar. I examine here just three, with particular attention to their treatment of equity. The National Surface Transportation Infrastructure Financing Commission (NSTIF) was mandated by Congress in the surface transportation act of 2005 (Public Law 109-59 of 2005: The Safe, Accountable, Flexible, Efficient, Transportation Equity Act: A Legacy for Users, better known as SAFETEA-LU). Seven of its 15 members were appointed by the U.S. Secretary of Transportation, eight by the chairs and ranking minority members of four Congressional committees with surface transport jurisdiction. Its final report, issued in February 2009, was unanimous. (NSTIF 2009).
The report touched only briefly on equity, as one set of criteria among many to consider in evaluating transportation finance options. It noted three specific definitions of equity pertinent to the Commission’s charge: that users should pay for benefits received, that this principle should apply to geographic jurisdictions as well as to user groups, and that funding structures should be avoided that place a disproportionate burden on low-income groups. Note that the last is a negative statement: a pitfall to avoid rather than an aim to be sought. The Commission did not articulate any positive aims with respect to redistributive equity. The one specific example it offered of a service that might occasionally merit subsidy was lightly traveled rural roads. Elsewhere, it explained that it weighed 14 factors in evaluating revenue alternatives. The weight
6 The Surface Transportation Policy Project reported in 2002 that state motor fuel taxes were on average, in real terms, 35 percent lower per gallon than they had been in 1957. The average 2002 level was 20.3 cents per gallon. To equal the 1957 level they would have had to be 30.0 cents per gallon. (Surface Transportation Policy Project 2003.) TRB’s Committee for the Study of the Long-Term Viability of Fuel Taxes for Transportation Finance reported that state gas tax rates per gallon, in real terms, were essentially unchanged from 1986 to 2004, but declined by nearly one-fifth from 1991 to 2004. It reported as well that state highway user tax receipts rose by about 8 percent a year during the 1980s but only 4 percent a year during the 1990s. (TRB 2006)
Altshuler 5
assigned “equity across income groups” was 3.5 percent (NSTIF 2009, Exhibit 3-1). In practice none of its specific recommendations promised any redistribution across income groups.
The Commission’s principal recommendation was that the nation should move gradually from the current system of highway finance, based primarily on fuel taxation, toward a distance-based fee system. It admitted that road user charges tend to be regressive, in that they absorb a greater share of the income of the poor than of affluent people, though the affluent pay more in absolute terms (because they drive much more). Illustratively, it cited a Brookings study which found that if charges were imposed on congested freeways, households with annual incomes in excess of $100,000 would pay three times more than those with incomes of $10,000-15,000, but only about one-third as much in proportional terms. “The gas tax,” the Commission observed, “is regressive in much the same way.” (NSTIF 2009, 147)
The Commission estimated that its proposed distance-based fee system would have essentially the same income equity characteristics as the current fuel tax system if total revenue were unchanged. It was recommending, however, use of the new system to generate increased revenue and also to incorporate charges for emissions. If these recommendations were adopted, it acknowledged, the poor would be more negatively impacted than they are at present. (The emission charges would be particularly regressive, because the poor drive older, more polluting vehicles.) Governments could in theory, it observed, offset these regressive effects by making lump sum payments to low-income users. It chose not to explore this option, however, commenting only (and without explanation) that it would “be complex to design and administer and could only be implemented at the state and local government levels,” (NSTIF 2009, 147-48)
SAFETEA-LU itself, incidentally, devotes one of its many sections to equity. The focus of this section is exclusively on geographic equity, however. It specifies that every state, each year, will receive a percentage of federal highway aid apportionments no less than 90 percent of the share it would receive if apportionments precisely tracked payments into the Highway Trust Fund. This standard was to rise, and did, to 92 percent by fiscal year 2008. (Public Law 109-59 of 2005, Section 1104). It has been deemed applicable as well, moreover, to the massive General Fund appropriations for highway spending since 2008. I turn next to the final report of the National Transportation Policy Project (NTPP) released in June 2009, entitled Performance Driven: A New Vision for U.S. Transportation Policy. (NTPP 2009). The NTPP is a “project” within the Bi-Partisan Policy Center, a nonprofit founded in 2007 by four former majority leaders of the U.S. Senate (two Democrat, two Republican) to develop bi-partisan proposals for addressing major national problems. Its “projects,” of which the NTPP was one, are in fact studies carried out by well-staffed committees, each chaired by a bi-partisan group of former elected officials. I happen to have been a member of this committee – enabling me to say a few words about its deliberations as well as its report. The other 24 members were former senior public officials (appointed as well as elected), business people, and nonprofit representatives. Its final report was also unanimous.
This committee identified six national transportation goals: economic growth, national connectivity, metropolitan accessibility, environmental sustainability, energy security, and safety. At an early meeting several commission members, including the present author, expressed concern about the absence of equity from this list. A very lively discussion ensued. The arguments against including equity were as follows. First, there are so many conceptions of equity that consensus on a definition would be impossible to achieve. Second, the equity claims with greatest force in the real world of national transportation politics involve geographic and interest group claims for allocations based on inputs (e.g., taxes and fees paid) or historic shares
6 Equity, Pricing, and Surface Transportation Politics
rather than by advocates for any larger vision of the public interest. Any effort, finally, to include redistributive equity as a program goal would severely divide the committee itself. And that would be fatal to its mission. If it could not achieve internal consensus, how could it hope that the forces in real world contention would take its report seriously? Within a few minutes it was clear that the great majority of members found these arguments compelling, so the committee moved on. It did return to equity, however, when laying out its specific recommendations. Here it urged a small “Essential Access Program” providing formula aid to the states “to ensure that transportation remains accessible for the underserved and disadvantaged.” (NTPP 2009, 74, 81-82) It urged that two percent of federal funding be allocated for this program.
In 2006, finally, a committee of the Transportation Research Board issued a Special Report on “The Long-Term Viability of Fuel Taxes for Transportation Finance” (TRB 2006). Its report, referred to hereafter as SR 285 (TRB Special Report 285), provides a list of “all the relevant considerations” that commonly appear on lists of criteria for the evaluation of funding alternatives, noting that it has been difficult to define or apply some of these, most notably fairness and efficiency (italics mine). To illustrate, it cites a single set of cases: federal highway cost allocation studies. These have, it notes, all been guided by statutory language that each vehicle class should contribute highway fee revenue in proportion to its use, and that principle has proven extremely difficult to apply in practice. The point of interest here is that SR285 acknowledges just one principle of equity, collective fee-for-service. The idea of redistributive (income-based) equity is simply absent from its analysis.7 Finally, consider recent works by two individual scholars, both among the most respected in this field. In other contexts, both have written with great sensitivity on themes of redistributive equity. It is instructive, therefore, to consider what they highlight when writing on surface transport policy and finance. Martin Wachs, to whose work I most frequently turn for profound thought about ethical issues in planning, was a member of the committee that produced TRB 285, and he subsequently published an article entitled: “Improving Efficiency and Equity in Transportation Finance.” In preparing this paper I turned to Wachs’ article with great interest, to see whether he would conceptualize equity more broadly than the TRB committee. The answer: not in this context. Rather, like the committee, he treats equity and efficiency as near-identical twins, under the rubric of “aligning charges with costs imposed by different users.” He does have one sentence to the effect that a good revenue system should, in addition to providing needed revenue and promoting system efficiency, also “promote economic activity, provide improved access for people of all ages and income groups, and discourage environmental damage.” (p. 94) That is it, however, for conceptions of equity beyond fee-for-service. (Wachs 2005: quotations from pp. 50,94) Anthony Downs’ Stuck in Traffic appeared in 1992. Authoritative and written with Downs’ inimitable verve, it instantly became the standard U.S. reference on urban transportation. In 2004 he renewed his franchise with a second edition, entitled Still Stuck in Traffic (Downs 2004). Still Stuck in Traffic is a terrific book. The terms equity and fairness are absent from its index, however, and they are mentioned in the text only as arguments used by opponents of
7 Its recommendations are to maintain and reinforce the existing user fee finance system, while expanding the use of tolls, gradually transitioning from the existing user charge system toward mileage charges, and providing some new dedicated sources of funding for mass transit.

Altshuler 7
congestion pricing (which Downs favors). Downs does have a chapter on jobs-housing imbalances, but its focus is almost entirely on congestion effects. He concludes that efforts to improve jobs-housing balance would be a diversion from the standpoint of transportation policy, in that even if successful they would yield minimal if any congestion benefits. It is clear, in short, that redistributive equity is at most a very minor theme in transport policy deliberations. Even scholars like Wachs and Downs, who have vigorously argued for redistributive action in other policy contexts, do not seem to view it as high priority in this one. THE PRINCIPLE OF DO NO HARM Though redistribution is clearly not a central aim of surface transportation policy, the interests of low-income and otherwise disadvantaged people often loom large as constraints on policy and project initiatives.
American government is for good reason commonly described as a veto-group system. In order to succeed, the champions of new policies or spending commitments must typically prevail at many decision points, often at multiple levels of government, and at times with requirements for super-majorities (as in the U.S. Senate). Opponents, by contrast, need only prevail at one. This structure empowers any group seeking to block new policy initiatives or negotiate for their modification, and such groups in the overall political system are most frequently rich and powerful. It also empowers representatives of the disadvantaged, however, when they feel threatened. It is an even more unique resource for them, moreover, because – weak in resources and organizational capacity – they almost never have the capacity to pursue more pro-active agendas. To be sure, the force of these propositions varies with time and circumstance. The following eight paragraphs are drawn in summary from my co-authored book with David Luberoff entitled Mega-Projects (2003). American governments have been active in infrastructure development since the earliest days of the Republic. Until the mid-20th century, however, such projects occurred within a framework of minimalist government (low taxation, very weak regulation, little federal aid except for land grants and then work relief during the Great Depression). The projects, therefore, tended to be modest, and rarely involved significant displacement of existing residences or places of employment. The U.S. came out of the Great Depression and World War II much changed. The nation was prosperous in the first postwar decade, but fearful of sliding back toward the economic conditions of the 1930s. While the suburbs were thriving, moreover, most central cities were in decline. Their leaders, both public and business, came widely to believe that only massive federal intervention could save them—to retrofit them for the auto age, to provide them with modern new airports, and to redevelop their slums. More generally, the idea that government activism could strengthen the private economy enjoyed unprecedented support, and faith in government competence was higher than ever before or since. Against this backdrop a variety of business-led coalitions mobilized to bring about ambitious public investment programs, mainly to be financed by the federal government. These were not primarily urban coalitions, but the cities achieved prominent places within them. These coalitions had to contend with intense pressures for postwar tax cuts, a desire in some quarters to revert to prewar patterns of governance, and then the costs of the Korean and Cold wars. But
8 Equity, Pricing, and Surface Transportation Politics
several did succeed in a big way, most notably those pressing for large-scale housing and redevelopment, highway, and to a lesser extent airport investment. So the momentum for action was extraordinarily strong. Additionally, there was no organized resistance at the local level. Urban residents had no experience of large-scale, government-sponsored displacement, and the great majority of those to be affected were poor. So the programs appeared unstoppable, and indeed they were for a time. That time, however, was brief. Within a decade or so of hitting the ground with actual demolition and construction activity, each of these programs was a focal point of political turmoil. And soon thereafter – by the late 1960s for urban redevelopment, by the early 1970s for highways and airports – new public projects involving substantial displacement were again, as prior to 1950, extremely rare.8 The main social and political developments that produced this change were numerous, and are familiar, so I merely list them here: social learning from on-the-ground experience that within a few years reached virtually all threatened neighborhoods, the numerous social movements of the 1960s (civil rights, citizen participation, environmental), the urban riots of the mid-1960s (significantly provoked by repeated experience with mega-project displacement), and new laws requiring citizen participation, establishing strong environmental standards and review procedures, protecting public open space and historic sites, and expanding opportunities for judicial review. Politicians became skittish about championing such projects once it became clear that they would be highly controversial, and business leaders gradually backed off as well. Neither group abandoned support for government activism to promote economic development, but they shifted tactics – toward financial and regulatory measures attractive to potential investors, and toward investment projects that could be carried out with little or no displacement. Mass transit investment took off in this period, and attention shifted from building new highways and airports to improving old ones. (There was also a shift from clearance-based downtown renewal to building new sports facilities, convention centers, and downtown shopping malls on sites that could be assembled without significant displacement). Across all these eras, the driving forces for government activism in pursuit of urban economic development have consistently been business interests in alliance with local public officials. Since the 1970s, however, they have been tightly constrained by the need to avoid neighborhood disruption and net negative environmental impacts. It has not been sufficient (as it usually was in the Great Mega-Project Era) to claim that projects are for the overall common good, so those left worse off should accept their pain with modest compensation and good grace. Rather, it has been necessary to “do no harm” or very close to it. This has generally meant little or no displacement of residents, minimization of environmental impacts, aggressive mitigation to offset those that cannot be avoided, and at times the provision of additional benefits to placate potential opponents. “The great mega-project era,” Luberoff and I conclude, “was an anomaly… The far more common pattern, both before and since… is more nuanced… While business has a near-monopoly in organizing support for development proposals, the potential to derail proposals is
8 The most graphic portrayal that I know of the rise and fall of new highway construction covers just the state of California, but is doubtless reflective of national experience more generally. The number of centerline miles of freeway completed in California rose from zero in 1948 to 200 or more in every year but one from 1961 to 1970 (reaching a peak of 350 in 1966), and then declined to 30 or fewer in every year starting 1978. (Taylor 2000). As well, just one major commercial passenger airport has gone into construction since the late 1960s, and that one on a greenfield site well beyond the edge of urban settlement. (Altshuler and Luberoff 2003)
Altshuler 9
far more diffused… We call this pattern ‘negative pluralism.’ It is unrealistic to expect ordinary citizens, preoccupied with their private lives and lacking access to institutional resources for mobilization, to initiate or frequently mobilize in support of development policy proposals. The more interesting question is whether they can protect their ‘use value’ interests in the face of threats emanating from the public and business sectors (Altshuler and Luberoff 2003).9
Do No Harm is first and foremost a sub-category of historic equity. It protects rich, healthy potential victims no less than the disadvantaged, and arguably more so, in that they are better equipped to mobilize and litigate. But it also has a major redistributive component. Development initiatives have been far more likely to harm the poor than the rich. Their neighborhoods are frequently viewed as blights rather than assets. They are weakly represented in the corridors of power. And they are less well-equipped, by and large, to cope when their lives are disrupted.
Do No Harm does not necessarily involve resource transfers. In many cases it simply leads policy makers to reject proposals that would leave some groups notably worse off. Even in these cases, however, it involves a sacrifice of prospective gains by the potential beneficiaries so as to leave the potential victims unharmed. Insofar as the former are more advantaged than the latter, the effect is redistributive. ROAD PRICING: WHY SO DIFFICULT? When commissions and scholars turn to the subjects of surface transportation policy and finance reform today, one of their invariable recommendations is greater use of road pricing, not just to raise revenue but also to induce motorists to “internalize” the costs of negative externalities that they impose on others, such as congestion and pollution. The simplest of these proposals, at least conceptually, is pricing to alleviate congestion in zones or corridors where it is already severe and where significant capacity expansion is deemed infeasible.
Congestion pricing proposals have made some headway abroad, but so far little in the U.S. The principal obstacles have been path dependency, equity arguments from groups opposed to “rationing by price” in the public sector, more general anti-tax sentiment, and the amplitude of opportunities for minority veto discussed above. I elaborate here on just the first two, which are tightly linked in that the equity arguments hinge on a path dependent understanding of roads as quintessentially public. Most ordinary Americans, though, are uneasy about pricing in the public sector, where they think benefits should be allocated on principles of equality or need rather than ability to pay. And they are particularly uneasy about levies intended to shape personal behavior (social engineering), as opposed merely to financing services. History looms large, moreover. If the nation were just now starting to build expressways, the system would likely be developed on the utility model – similar to electric power and telecommunications – rather than as fully public and almost entirely toll-free. This is the pattern in many other countries that have come late to motorization, and even in the U.S. mass transit developed initially as a privately owned utility. Its business model failed with the rise of motor
9 The idea that property has both exchange (market) value and value-in-use (as a place to live, for example, or simply enjoy) originated with Karl Marx. It has been a significant theme in analyses of urban politics since the publication of Logan and Molotch 1988.
10 Equity, Pricing, and Surface Transportation Politics
vehicle competition, but its shift to public ownership and operation was a product of desperation rather than ideology.
Expressways evolved from local streets, however, and even on limited-access roads tolling was highly intrusive, space-consuming, expensive, and a source of significant traffic delays until the late 20th century. Further, as the US federal government commenced highway aid in 1916, its principal objective was to “get the farmers out of the mud,” and the lightly traveled roads it helped improve for this purpose were particularly unlikely candidates for toll financing. As Gary T. Schwartz wrote 60 years later, “the very first paragraph of the 1916 Act… required that all federally funded roads be ‘free from tolls of all kinds,’ [and this provision was] continued forward in all subsequent highway legislation.”10 (Schwartz 1976)
So Americans have been conditioned to think of roads as thoroughly public, more akin to parks than telecommunications or power networks, and thus properly organized around egalitarian rather than market norms. In this context, the idea of rationing street and highway use by ability – or, as economists prefer to say, willingness – to pay invites the critique that it would privilege the affluent in use of a public resource. This has not precluded the use of toll financing to construct freeways, bridges, and tunnels in some instances where tax resources have been unavailable, but the rationale (often violated, to be sure, in subsequent years) has invariably been for the tolls to be collected only so long as needed to pay off the bonds. It has never been that tolls should be utilized to manage demand. Meanwhile, even as intellectual momentum has been building for more price-like systems of highway user finance, politicians and voters have been moving in precisely the opposite direction – toward reliance on revenue sources that have no relation to use at all. As Martin Wachs has written, “Legislators appear to be willing to do almost anything but raise motor fuel taxes.” And they have been turning in particular to sales taxation. The principal reason, he judges, is that small sales tax rate increases can raise as much money as far larger, therefore more visible, increases in fuel taxes. To illustrate, he cites a county in California that estimated a one percentage point increase in the sales tax would generate revenue equal to a 16 cent increase in motor fuel taxes. (Wachs 2005. See also STPP 2003 and TRB 2006.) Three other reasons, not mentioned by Wachs, may be as follows. First, sales tax increases can be structured to support multiple services, and thus attract constituencies beyond transportation. Second, the trend in at least some states is toward devolution of responsibility for surface transportation finance toward local governments. Localities have traditionally relied most heavily on property and sales taxes (in addition to grants from higher levels of government), and they typically lack authority to impose fuel taxes. (TRB 2006) Even if they were so empowered, revenue from a local fuel tax would be particularly sensitive to competition from surrounding jurisdictions. Third, ever since the oil shock of 1973-74, oil (and gasoline) price changes have frequently been large, both up and down, and they are followed very closely by the media. When they are on the upswing, as in early 2008, large numbers of voters tend to be angry. Virtually all politicians are eager to express solidarity with their constituents, emphasizing that the increases have nothing to do any actions of theirs.
There have been a series of exceptional cases, however, both in the U.S. and abroad, in which political leaders, taking the intellectual case for pricing seriously, have sought in recent years to implement congestion pricing. These initiatives have so far taken two forms: charge schemes for street use in large-city downtown areas, and high occupancy toll (HOT) lanes in
10 Several limited exceptions to this rule, most notably for high occupancy toll lanes, have been authorized since 1991. (Orski 2010)
Altshuler 11
congested freeway corridors. The first is an international phenomenon, while the second is so far purely American. I focus in the remainder of this paper on a series of congestion pricing case studies – three international, eleven domestic; four of central area charge schemes, ten of U.S. HOT lanes. These are not full-scale case histories. My aim in each case is simply to sketch the politics, with particular attention to the salience, or lack thereof, of equity issues.11 CASE STUDIES: INTERNATIONAL Singapore, London, and Stockholm are the three major world cities to have thus far adopted central area congestion pricing.12 The Singapore case is certainly familiar to most readers of this paper, but it is rarely examined from the perspectives of politics and equity. The following account is based primarily on work by Paul Barter and on personal interviews that I conducted over six months in Singapore (three visits) over the period 2008-2010. (Barter 2008. See also FHWA 2008a; Neo and Chen 2007; Leong 2003). The key enabling factors appear to have been as follows. A small, very crowded island, Singapore was still a Third World country in the 1970s, just beginning to motorize. It was also a one-party state with an extremely strong government, a weak domestic private sector, negligible opportunities for citizen participation, and an intense commitment to comprehensive planning -- aimed above all at economic development.
Its 1971 Concept Plan called for highly compact development, and judged that to realize this vision it would be necessary to impose strict restraints on motorization. The Area Licensing Scheme (ALS), which followed in 1975, was part of a broader auto-restraint package including import duties, a very high sales tax (which at one point reached 175 percent of the base import price), high annual taxes on vehicle ownership, and high taxes on motor vehicle fuel.13 The other elements of this package suppressed demand throughout Singapore, while the ALS provided a further layer of constraint in the center. By way of explanation, the Singapore government argued that maintaining free traffic flow was an essential strategy of economic development and that it was only equitable for those who imposed social costs on others to pay for them. It also committed to upgrading public transit, but this was not presented as a quid pro quo, nor were any of the auto policy revenues sequestered for transit use. (Today Singapore has
11 It would be useful as well to examine the distance-based charges for heavy trucks that have been adopted by Austria, Germany, and Switzerland, but I do not know enough about the circumstance of their adoption. What is clear, however, is that the impetus arose from concern – among both public officials and domestic truckers -- that truckers registered elsewhere in Europe were making extensive use of their national highways while avoiding most user taxes. Germany, for example, estimated that up to 35 percent of truck vehicle miles within its borders were by foreign vehicles, and that the proportion was growing fairly rapidly. (Taylor 2010; Richards 2006). 12 Additionally, a number of Norwegian cities including Oslo have placed toll rings around their central areas, but Norwegian law specifies that these must be only for purposes of revenue collection to finance transportation improvements, not traffic regulation. The scheme in Trondheim clearly skirts that prohibition – in that it requires daily payment and the charge is higher for entry during the morning peak than other times – but it is not a major city and I have not come across any account of its politics. Oslo, by contrast, offers an annual pass and other bulk purchase discounts. (Richards 2006; FHWA 2008a.) 13 In 1990 the government imposed a Vehicle Quota System in lieu of the sales tax, under which a limited number of permits to import motor vehicles are auctioned off by the government each year. (Neo and Chen 2007)
12 Equity, Pricing, and Surface Transportation Politics
a superb mass transit system, including extensive rapid transit.) They were simply both aspects of a single comprehensive plan.
Singapore has greatly prospered in the years since 1975, to the point of rough per capita income equivalence with Western Europe and the United States. (World Bank 2009) Its urban transportation policies have remained consistent, however, with numerous upgrades including evolution of the congestion fee system in the 1990s from flat-fee area licensing to electronic, variable tolling. A third generation toll system based on global positioning is in design. Singapore’s rate of passenger car ownership remains by far the lowest in the world for a “rich” country – roughly one-quarter that of the U.S. and one-third that of Japan.14 Its transit and taxi systems are superb. And though it is a very dense, high-rise city its congestion remains minimal in comparison with other world cities.
Its transportation system also has a very obvious class bias. The affluent drive everywhere, much like Americans, while most other Singaporeans rely overwhelmingly on transit. What do Singaporeans think about this? No poll results are available, and both public speech and the local media are tightly regulated. People speak very freely in private, though, and many do gripe about the expanding range of congestion fee coverage and about rate increases when they occur. I have never heard anyone maintain, however, that Singapore would be better off without its congestion fee system (or, for that matter, its other auto restraint policies). I have raised this subject frequently in formal interviews, conversations, and classes at the National University. My interlocutors have invariably accepted the government rationale for congestion pricing as compelling. When asked about the system’s pattern of class segregation by transportation mode, moreover, their standard reaction has been that – at least in Singapore’s land-scarce circumstances, and bearing in mind its excellent transit system -- car ownership and usage are properly viewed as luxuries no different in principle from upscale housing and restaurants. The London and Stockholm cases are more pertinent to current American debates, in that both these cities are in western democracies and have adopted congestion pricing within the past decade. The following discussion of London draws primarily on Richards 2006 (see also Gomez-Ibanez 2005), secondarily on interviews by the author in May 2009. The Stockholm account is based on Taylor 2010 and FHWA 2008a. As early as 1988 an official London Planning Advisory Committee called for the adoption of congestion pricing in central London, with net revenue reserved for transit improvements serving the affected zone. More detailed investigations followed, and a 1995 recommendation of congestion pricing by the same committee was endorsed by all 33 London boroughs. The Labor Party assumed control of the national government in 1997, and soon thereafter issued a White Paper on London, arguing that “radical” measures were necessary to address the problems of congestion and pollution, and highlighting road user pricing among them. In subsequent legislation it authorized congestion pricing as a local option throughout the United Kingdom and also a new Greater London government with transport, including management of the road system, as its most significant responsibility. Additionally, it set in motion a group of experts to work through the details of establishing a congestion pricing system for London. This group, known as ROCOL (ROad Charging Options for London), had a detailed proposal ready in time for the first election of new Greater London officials in 2000.
14 Their respective car ownership rates per thousand population as of 2007 were: Singapore, 113; United States, 451; Japan, 325. (World Bank 2010.)
Altshuler 13
The Greater London Authority (GLA) legislation placed almost sole responsibility for any decision on congestion pricing in the hands of the Authority’s mayor, who turned out to be Ken Livingstone. Livingstone had been leader of the old Greater London Council (GLC) in its final years, and had managed along his way to infuriate not just Margaret Thatcher—whose government abolished the GLC in 1986—but also Tony Blair. Blair ensured that someone else was selected as the official Labor Party candidate in the London mayoral election of 2000, and said publicly that Livingstone’s election would be a “disaster.” Livingstone, running as an independent, prevailed nonetheless, and did so with congestion pricing as one of his key promises. (Both major party candidates opposed it.)
Livingstone’s unilateral authority to implement this promise proved critical. He did have to solicit public comments, and they came in thoroughly divided. The broader London public, in polls, was about evenly split, as was The London Assembly (its elected legislature). The national Labor government, which had no disposition to help Livingstone, refused to indicate whether it supported his specific plan (the devil is in the details) and placed some technical impediments for awhile in its way. The press was mainly skeptical or hostile, with critics receiving far more play than the supporters of congestion pricing, and even the latter frequently emphasizing doubts about the details of Livingstone’s plan. Livingstone himself proclaimed in every possible forum that congestion was London’s most serious disadvantage in attracting business. He routinely added that his plan would benefit transit users (who already included 85% of all commuters to central London), both by reducing congestion and by generating net revenue for additional transport improvements in central London. This too was presented as an economic rather than equity argument, however.
The main critics were Conservative-dominated boroughs and politicians, concerned about traffic increases just beyond the proposed congestion charge zone; truckers seeking an exemption from the charges; and the Federation of Small Businesses, which contended that significant numbers of shoppers would be diverted from central London. The press highlighted doubts as well in some quarters that the technology would work. A few advocates for the poor sought charge exemptions for low-income workers who might need to drive in central London, but this argument never gained traction. One reason may have been that Livingstone, from the outset, headed off criticism on behalf of the disabled by exempting vehicles registered to carry them. He also provided a 90% discount for residents of the congestion charge zone. In revising his initial plan, finally, he cut the charge for heavy trucks by two-thirds (from £15 per day to £5, the same as for cars).
The license fee became operational in February 2003; it soon became clear that its technology worked (with minor glitches); and for a time buses did move both faster and more reliably.15 There were also more of them, to accommodate the additional demand. In this context, both press coverage and the balance of local opinion tipped favorably. A respected July 2003 poll of London residents reported 63 percent viewing the system favorably overall and 66 percent viewing it as “fair” (i.e., equitable).
This did not translate, however, into easy expansion or replication. Within London, Livingstone soon moved to add a Western Extension, nearly doubling the congestion charge area. This proved highly controversial, with local officials and most residents of the expansion zone in opposition, even though the latter would now benefit from the 90 percent daily discount available to zone residents. When Livingstone solicited written comments, moreover, he was
15 More recently central London traffic speeds have again deteriorated, apparently because of an increase in street and lane closings due to construction.
14 Equity, Pricing, and Surface Transportation Politics
flooded with 100,000, of which about 70 percent were negative. He won reelection by a large majority in 2004, though, and moved promptly to implement the Western Extension.
It revived as an issue in the 2008 mayoral campaign, however, when Livingstone ran for a third term, this time with Conservative Boris Johnson as his principal opponent. Johnson promised in his campaign to consult again on the Western Extension – and abide by the results. After winning the election, Johnson quickly initiated an informal consultation with residents and businesses in the Western Extension area, the comments again came in overwhelmingly negative, and he announced that he would roll back the congestion charge area to its original boundaries upon completion of the required formal consultative process. That process commenced in May 2010, on a mayoral proposal to terminate road pricing in the Western Extension area just before Christmas 2010.16 Meanwhile, other UK efforts to adopt road pricing have also stalled. In 2002 the national government announced its intent to follow Austria, Germany, and Switzerland in adopting an electronic, distance-based, pricing system for heavy trucks to replace a variety of existing highway user taxes. It projected that the new system would become effective in fiscal year 2008. Further, the Labor Party included this proposal in its manifesto for the 2005 general election, in which it was again victorious. Very soon after the election, however, the Minister of Transport announced cancellation of this plan, pending the development of “a single, comprehensive, cost-effective system,” hopefully by 2020. (Richards 2006) Edinburgh was also moving toward adoption of a congestion pricing scheme in the early years of the new century. Following the loss of a council seat in a local election, however, which some thought might be related to the controversy over congestion charges, its city council decided to hold a referendum before proceeding. The referendum question covered the Council’s entire proposed transport strategy, but the main issue was its congestion charge element. The vote, in February 2005, was decisively negative, and the scheme was shelved. (Richards 2006) Manchester, finally, having taken note of the Edinburgh experience, secured a central government commitment of £1.5 billion for transit projects to occur in a five-year run-up to the inauguration of congestion charges, which would not occur until 2013. It also promised discounts for low-income drivers and exemptions for residents in portions of the city that would not see transit improvements by 2013. Manchester leaders argued that, with new road construction infeasible, this program was essential to relieve congestion, improve public transport, and improve local air quality. Critics responded that it was best understood, rather, as a new tax on motorists, which would cost some of them as much as £1200 per year. Following several years of planning and debate, the package was put to the voters in a December 2008 referendum. The turnout was unusually high, 53% of eligible voters. The vote was 4-1 negative. The Guardian, a strong supporter in its editorials of congestion pricing, headlined the next day that “the government’s plans for road pricing across the UK [are] in disarray.” (The Guardian, December 13, 2008, page 1). Stockholm, however, did adopt congestion pricing in the middle of this decade. Bhatt and Higgins report that “cordon pricing has been under consideration in Stockholm for over three decades…with the goal[s] of reducing congestion, improving the environment and generating revenues for transportation improvements.” (FHWA 2008a: 2-20) In 2002 a coalition of the
16 Author interviews in May 2009 with Sir Simon Milton (see above) and with Managing Director Michele Dix of Transport for London; and personal communication in March 2010 from Camilla Ween, Principal Planner-Master Plans, Transport for London.
Altshuler 15
Green and Social Democratic parties came to power in Stockholm. Encouraged by the Swedish national government, in 2003 it proposed an experimental approach to congestion pricing – a several month trial, to be followed by a referendum. The Swedish Parliament adopted enabling legislation in 2004. Extensive transit improvements were implemented prior to the trial, and the public was assured that all net congestion charge revenue would be utilized as well for transit improvements. The trial period ran for seven months, January through July 2006. The congestion charge zone covered the entire downtown, a much larger area proportionally than the London zone. The referendum on whether to make the system permanent was held in September 2006. Taylor reports that public sentiment during the run-up to the trial, as measured in polls, ran 2-1 negative. Once the trial was underway, however, a strong positive shift occurred and in the subsequent referendum Stockholm voters chose 51-46 percent to make the system permanent. Support was strongest from central area residents (an affluent group overall), who experienced the greatest increases in car travel costs (31%) but also the greatest benefits (reduced congestion and pollution, better transit). Opposition was most intense from outer suburban residents, who experienced very modest average cost increases (5 percent) but who also saw fewer benefits. Their opposition might have counted more heavily except that only citizens of Stockholm itself were eligible to vote. Several of the suburban localities did hold advisory referendums, in which majorities voted against making congestion pricing permanent. (Taylor 2010; FHWA 2008a)
In the same election as that in which the referendum was held, Taylor writes, “the Green Party, whose leaders had originally introduced the congestion fee, lost. However, a new governing alliance of center-right parties collectively decided to reinstate the congestion tax, honoring the Stockholm residents’ vote.” They decided as well to make the net revenue available for highway as well as transit improvements, including a $3 billion underground expressway through the western suburbs. This shift seemed likely to benefit some of the most affluent residents of the Stockholm region. It was very popular, though, and Taylor observes that with it “overall support for the policy increased from 52 to 67 percent – a complete reversal of the two-thirds who had… opposed the program prior to the trial.” (Taylor 2010)
Despite Sweden’s strong egalitarian and social welfare traditions, distributional effects by income group do not appear to have been an issue. There have been no efforts, apparently, to assess equity effects of the London or Stockholm programs. (FHWA 2008a) CASE STUDIES: UNITED STATES Michael Bloomberg is an extremely strong and articulate mayor of New York City, as Ken Livingstone was of London, and in most respects his legal authority (within the bounds of New York City, if not the New York region) is considerably greater. Unlike Livingstone, however, Bloomberg needed numerous approvals in order, as he proposed during 2007-2008, to implement congestion pricing. And there was the rub. As in Stockholm, Bloomberg proposed a pilot program, in this case for three years, after which the city and state would jointly determine its future. His original plan defined the congestion fee zone as Manhattan south of 86th street. The limited access roads surrounding this zone (e.g., the FDR Drive and the West Side Highway) were exempted. Transit, taxi, emergency, other for-hire vehicles, and vehicles with handicapped plates, were to be exempt,
16 Equity, Pricing, and Surface Transportation Politics
though taxi passengers were to pay a $1 per trip surcharge. In the face of criticism, the northern boundary of the congestion fee zone was subsequently cut back from 86th to 60th street, and vehicles traveling only within the zone on any given day were exempted from paying the charge. All net revenue was to be earmarked for New York City transit, over and above funds previously anticipated. The mayor and Metropolitan Transit Authority announced an accelerated transit capital plan to be partially financed with this revenue. The plan was fiercely controversial, with the critics focusing on equity, but of the geographic rather than redistributive variety. The principal objectors were representatives of non-poor communities in Brooklyn, Queens, and Westchester, where many commuters lived. Bloomberg had prepared the ground well, however, and his case was extremely strong. The Manhattan core, notably, has five times the worker density of London’s17. His plan attracted considerably more support than had Livingstone’s in the run-up to congestion pricing in London. The Campaign for New York’s Future, a coalition of more than 150 business and civic organizations, was particularly active. And he had the national government firmly on his side – including a pledged $354 million grant for start-up costs and related mass transit improvements.
At the height of the controversy, in March 2008, a respected independent poll (Quinnipiac) found that New York City residents favored congestion pricing by a margin of 67-27 percent so long as the revenue was to be dedicated for mass transit (as it was).18 The New York City Council approved the mayor’s plan by a vote of 30-20, though with most Brooklyn and Queens members voting against. New York’s own Congressional delegation maintained a discreet silence, but Bloomberg obtained enthusiastic public endorsements from former President Bill Clinton (who maintains his post-Presidential office in New York City) and – during the 2008 Presidential primary campaign -- candidate Barack Obama.
Bloomberg’s fatal problem, however, was that he needed too many approvals, and he fell one short. His final hurdle was to secure authorizing state legislation. The Governor was favorable. So was the state Senate. But the state Assembly was divided and its Speaker, who generally ruled with an iron hand, was a skeptic. Eventually he claimed to have found that a majority of the members of his own (Democratic) party in the Assembly were opposed, and that consequently he would not bring it up for a vote. With this, Bloomberg’s plan was, in the headline lingo of the New York Post, “kaput.” (April 7, 2008; see also NY1.com, April 7, 2008)
HOT LANES The variant on congestion pricing that has begun to sink roots in American soil is that of High Occupancy Toll (HOT) lanes. It is a weak variant, in that HOT lanes are invariably in freeway corridors where most of the lanes remain free, and even most of the vehicles in the HOT lanes travel free. It is clearly a significant step toward road use pricing in the U.S., however, and it appears to be gaining momentum.
The HOT lane idea first began to attract serious professional attention in the late 1980s, and became eligible for federal financing in 1991, when ISTEA established a federal pilot grant program for congestion pricing. During the next thirteen years, through 2004, just four projects
17 The specific figures are 15,000 workers per square mile in central London, 74,000 in the Manhattan core. Resident density in the Manhattan core is three times that of Inner London. (Paaswell and Zupan, 2007) 18 On the other hand, without the transit proviso they opposed the congestion pricing proposal by 53-40 percent. (Quinnipiac University Polling Institute 2008)
Altshuler 17
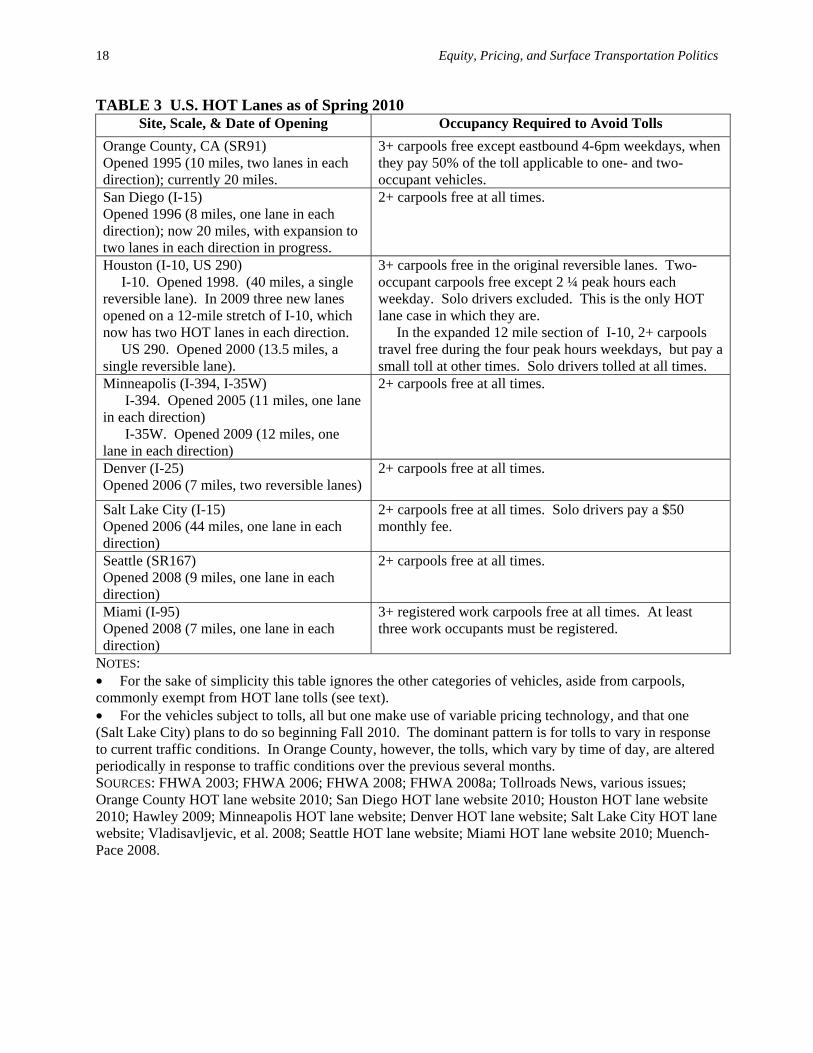
came into operation, all in Southern California or in Houston, Texas. More recently, however, three of these four early projects have been expanded, six more projects have commenced service, and numerous others are planned. Table 3 shows the ten sets of HOT lanes in operation as of spring 2010, their opening dates, and their rules about the number of occupants required for private cars to avoid toll charges. The great majority are free to carpools with two or more occupants as well as transit buses, vanpools, emergency vehicles, motorcycles, vehicles with handicapped and often veteran’s license plates, and in some cases clean fuel vehicles. The others are free to carpools with three or more occupants (with one minor exception, where tolls are levied on 3+ carpools for two peak hours each weekday afternoon in one direction only).
The remainder of this section highlights common themes emerging from a review of this history. (Sources, except as specifically noted below, are listed with Table 3.)
It is useful to begin with the precursors of HOT lanes: bus lanes and high occupancy vehicle (HOV) lanes, significant innovations of the 1960s and 1970s. The original idea, as it became clear that new freeway construction could not keep pace with rising traffic demand, was to dedicate lanes within existing roads for buses only, as a means of encouraging transit usage (by enhancing bus speeds and reliability). It soon became apparent, though, that only a few corridors in the United States carried enough bus traffic to utilize most of the capacity of a freeway lane, so the next idea was to admit carpools with three or more occupants, and bus lanes became high occupancy vehicle (HOV) lanes . (Altshuler et al. 1979; Meyer and Gomez-Ibanez 1981). In most cases, however, these proved to have very conspicuous spare capacity as well, to the considerable irritation of motorists in the adjacent, congested general purpose lanes. So beginning in the 1980s most were opened to two-person carpools as well. (Fuhs and Obenberger 2002) Even this did not solve the problem of apparent “wasted capacity,” however, leading to a revival of controversy about the merits of dedicating lanes to HOVs. Several HOV lanes were actually converted back to general-purpose use during the 1990s. (Cervero 1999; TR News 2001) The HOT lane idea, though, provided an alternative strategy – to allocate the remaining “spare” capacity by price.19
There were high hopes at the outset that HOT lanes could also expand the pot of money available for highway improvements by attracting private investors. And the first HOT lane facility was in fact developed in this manner. The state of California, desperately short of public money for highway expansion, enacted legislation in 1989 authorizing private participation in the development and operation of new toll facilities. The developer received a 35 year franchise to build four new lanes within the right-of-way of SR91 in Orange County, California, one of the nation’s most congested freeways. Following an extensive public outreach campaign, the developer built four new lanes within the existing right-of-way, two in each direction, in a ten mile stretch -- since extended to twenty. The initial ten miles opened in 1995, and remain the only HOT lanes so far developed with private capital. Only vehicles with fewer than three occupants were tolled. In addition to 3+ carpools and buses, motorcycles, vehicles with disability or veteran license plates, and
19 The most stringent definition of capacity is maximum throughput per unit of time (most commonly, per hour). In high-volume urban settings, on modern freeways, this generally means evenly flowing traffic at about 35 miles per hour. Where higher speed standards are set, as they often are, defined capacity is lower. (TRB 2000)
18 Equity, Pricing, and Surface Transportation Politics
TABLE 3 U.S. HOT Lanes as of Spring 2010 Site, Scale, & Date of Opening Occupancy Required to Avoid Tolls
Orange County, CA (SR91) Opened 1995 (10 miles, two lanes in each direction); currently 20 miles.
3+ carpools free except eastbound 4-6pm weekdays, when they pay 50% of the toll applicable to one- and two-occupant vehicles.
San Diego (I-15) Opened 1996 (8 miles, one lane in each direction); now 20 miles, with expansion to two lanes in each direction in progress.
2+ carpools free at all times.
Houston (I-10, US 290) I-10. Opened 1998. (40 miles, a single reversible lane). In 2009 three new lanes opened on a 12-mile stretch of I-10, which now has two HOT lanes in each direction. US 290. Opened 2000 (13.5 miles, a single reversible lane).
3+ carpools free in the original reversible lanes. Two-occupant carpools free except 2 ¼ peak hours each weekday. Solo drivers excluded. This is the only HOT lane case in which they are. In the expanded 12 mile section of I-10, 2+ carpools travel free during the four peak hours weekdays, but pay a small toll at other times. Solo drivers tolled at all times.
Minneapolis (I-394, I-35W) I-394. Opened 2005 (11 miles, one lane in each direction) I-35W. Opened 2009 (12 miles, one lane in each direction)
2+ carpools free at all times.
Denver (I-25) Opened 2006 (7 miles, two reversible lanes)
2+ carpools free at all times.
Salt Lake City (I-15) Opened 2006 (44 miles, one lane in each direction)
2+ carpools free at all times. Solo drivers pay a $50 monthly fee.
Seattle (SR167) Opened 2008 (9 miles, one lane in each direction)
2+ carpools free at all times.
Miami (I-95) Opened 2008 (7 miles, one lane in each direction)
3+ registered work carpools free at all times. At least three work occupants must be registered.
NOTES: • For the sake of simplicity this table ignores the other categories of vehicles, aside from carpools, commonly exempt from HOT lane tolls (see text). • For the vehicles subject to tolls, all but one make use of variable pricing technology, and that one (Salt Lake City) plans to do so beginning Fall 2010. The dominant pattern is for tolls to vary in response to current traffic conditions. In Orange County, however, the tolls, which vary by time of day, are altered periodically in response to traffic conditions over the previous several months. SOURCES: FHWA 2003; FHWA 2006; FHWA 2008; FHWA 2008a; Tollroads News, various issues; Orange County HOT lane website 2010; San Diego HOT lane website 2010; Houston HOT lane website 2010; Hawley 2009; Minneapolis HOT lane website; Denver HOT lane website; Salt Lake City HOT lane website; Vladisavljevic, et al. 2008; Seattle HOT lane website; Miami HOT lane website 2010; Muench-Pace 2008.
Altshuler 19
emergency vehicles traveled free.20 No net revenue was anticipated – after the costs of debt service, operations, and the developer’s profit -- to finance other transportation improvements.
Three years following the project’s opening a fierce dispute broke out between the developer and public authorities over a state-county plan to improve SR91’s general-purpose lanes. The developer insisted that a previously confidential non-compete clause in its contract precluded any such public investment, highlighting a point that should have been obvious to all from the beginning (and certainly was to the private investors), that the HOT lane project’s viability as a private investment required the continuance of severe congestion on the parallel free lanes. This did strike many as an equity issue. Following several years of litigation the result was a buyout of the developer’s interest by the Orange County Transportation Authority (OCTA), for $207.5 million (FHWA 2003). All subsequent HOT lane projects have been purely public from the outset.
A further obstacle to private financing is that HOT lanes rarely generate significant net revenue. Even in the case of SR-91, designed from the start to earn a profit, the developer found revenue insufficient within three years and began to charge 3+ carpools 50% of the toll prevailing at any time. This was another source of intense public grievance against the private developer, and OCTA restored the original toll exemption for 3+ carpools as soon as it assumed ownership of the SR-91 HOT lanes – though it subsequently imposed a 50% toll on such vehicles in one direction only from 4-6pm weekdays as a congestion avoidance measure. In the more typical HOT lane case, congestion on the general purpose lanes is only intermittent, and the only vehicles tolled on the HOT lanes are driver-only private passenger cars (even then excluding vehicles with handicapped and in some cases veteran license plates). In consequence, there is rarely net revenue even to contribute to the cost associated with new construction.
Minneapolis and Seattle exemplify the limits of the HOT lane idea in corridors with only intermittent congestion. As of 2007 Minneapolis HOT lane users were saving an average of just one-half minute during the six peak hours each weekday by comparison with travelers in the free lanes, and HOT lane revenues were just one-third the level that had been forecast. (Tollroads News 2007) In Seattle as of 2008 only seven percent of vehicles using the HOT lanes per day were paying tolls. (Washington State Department of Transportation 2009)
All of the HOT lanes built to date are within the rights-of-way of pre-existing freeways, though with occasional spot widening; and none have involved any reduction in the number of un-tolled general purpose lanes. Of the ten existing projects, five involved the addition of one or more additional lanes from the outset, while five were simple conversions of HOV lanes. Three of the latter have since been expanded, so today eight of the ten include at least one purpose-built lane. I-15 in San Diego, the second HOT lane project, commenced service in 1996. San Diego converted an eight mile, two-lane, reversible HOV facility – which had for some time been free to 2+ person vehicles but still had spare capacity. Now cars with just a driver were admitted for a fee. With considerable outreach to explain this decision, there was minimal controversy. A 2001 survey of both users and non-users found that “equity was not considered a major issue” and that “support is high across all income groups, with the lowest income group expressing stronger support than the highest income group (80% vs. 70%).” (Federal Highway Administration 2006; the poll was conducted by the San Diego Association of Governments) 20 This pattern of toll exemptions for vehicles based on other factors than vehicle occupancy has become standard, with minor variations, and thus is not tracked project by project below. Trucks weighing more than 10,000 pounds have been banned entirely from the SR91 HOT lanes.
20 Equity, Pricing, and Surface Transportation Politics
The original eight mile reversible facility has since been expanded to 20 miles, and is currently being expanded to four lanes. Reflecting particularly on this case, Robert Poole suggests that it is useful to differentiate between two HOT Lane types. (Poole 2006) Model 1 HOT Lanes are mainly HOV lanes. They ration access first by vehicle occupancy -- along with special categories such as motorcycles, emergency vehicles, vehicles for the handicapped, clean fuel vehicles, and so on. As they open occupancy to vehicles with fewer occupants, however, each added category invites far more usage than the one before. That is, there are many more two-occupant than three-occupant vehicles, and vastly more single-occupant than two-occupant vehicles.21 So they eventually find themselves with a bit of capacity left over, but not nearly enough to permit opening another notch (if the lanes are to remain free-flow at all times). It is only to fill this gap that they turn to pricing. Model 2 HOT Lanes, by contrast, would -- if we had them – rely mainly or entirely on price to ration access, regardless of vehicle occupancy, and if they attracted sufficient traffic they would generate substantial net revenue. No Model 2 HOT lanes have come into being thus far, however. The third HOT lane was on a 40 mile stretch of I-10 in Houston, one of the most congested highway corridors in Texas. This single reversible lane was intended only for buses and vanpools when it opened in 1984. As its excess capacity became obvious, it was opened first to 4+ carpools, then 3+, and finally 2+. This was a rapid growth corridor, however, and as traffic volumes grew the managed lanes became congested during the hours of highest demand. So in 1998 a charge was imposed on two-person carpools from 6:45-8:00am and 5:00-6:00pm weekdays. Houston subsequently extended the same set of arrangements to a 13.5 mile stretch of its Northwest Freeway, US 290 (also a single reversible lane). In April 2009 Houston commenced a new phase in its HOT lane policy, opening three newly constructed lanes on a 12 mile section of I-10. In this stretch there are now two “managed lanes” in each direction at all times. These lanes are free to 2+ carpools as well as motorcycles during HOV hours (6-10am eastbound, 4-8pm westbound), though surprisingly even carpools have to pay a small toll during off-peak hours.
Including the two in Houston, just four HOT lane facilities opened in the 13 years (through 2004) following enactment of ISTEA, with its grant program to encourage value pricing. Even as two of these have been (or are being) significantly expanded in recent years, however, six more have opened: in Minneapolis (2), Denver, Salt Lake City, Seattle, and Miami.
The first Minneapolis HOT lanes, which opened in May 2005, extend for eleven miles west from downtown on I-394. Their opening was preceded by more than a decade of political controversy, and of intense civic activism that eventually generated wide bi-partisan support. (Buckeye and Munnich 2004, 2006; Taylor 2010). Carpools with two or more occupants travel free. A poll of Minneapolis consumers in spring 2006 found broad support across all income levels, including 64 percent of low-income respondents. (FHWA 2008) This may in part have reflected a reduction in congestion that occurred in the general purpose lanes – which, as a by-product, greatly depressed HOT lane benefits and revenues. As of late 2007 HOT lane users during the six peak hours each weekday were on average saving just one-half minute by comparison with travelers in the free lanes, and HOT lane revenues were just one-third of what had been anticipated. (Tollroads News 2007) A second Minneapolis HOT lane project, on I-35W, opened in September 2009. 21 Poole does not make this point explicitly, but it is clearly implicit in his argument.
Altshuler 21
The Denver HOT lanes, which opened in June 2006, extend for seven miles south from downtown on I-25. These too were preceded by years of controversy, but were successfully marketed as involving the sale of excess capacity that would otherwise go to waste. There are two reversible lanes. One remains a pure HOV lane. The other is open to both HOV and toll-paying single-occupant vehicle users. As of mid-2007 about one-quarter of peak period users of these two lanes were paying tolls.22
The Salt Lake City HOT lanes, on I-15, opened to single-occupant, toll-paying vehicles in September 2006. Originally 38 miles in length, they have since been extended to 44, on a north-south axis through the city and south. This was an extremely low-tech HOV conversion, with single-occupant vehicles simply charged a $50 monthly fee. As of 2009 the Utah Department of Transportation plans to equip the lanes for variable electronic pricing and to convert additional HOV lane mileage as funding permits. (Utah Department of Transportation website, http://www.udot.utah.gov/main; Vladisavljevic, et al. 2008).
Seattle’s HOT lanes, which commenced operation in May 2008, run north-south on SR167 in south King County for nine miles. As of late 2008 about seven percent of vehicles using the HOT lanes per day, and one percent of those using SR167 on this segment overall, were paying any toll.23
Miami opened seven miles of HOT lane, northbound only, in the median of I-95, in December 2008. It consists of a former HOV lane plus a newly constructed lane. Southbound lanes are expected to open in late 2009. An additional phase of this project is planned but not yet funded. The Miami HOT lanes are free to registered 3+ carpools and vanpools, with the unique wrinkle that all occupants must be registered commuters. (Muench-Pace 2008)
Concerns about income-based equity have frequently arisen in connection with HOT lane proposals, and reportedly were a major factor in the failure of a 1997 effort to implement HOT lanes on I-394 in Minneapolis. They have declined in significance over time, however, and been scarcely visible during the reinvigoration of HOT lane progress since 2004, largely because advocates have perfected their brief, emphasizing that HOT lane users include representatives of all income groups and that users of the parallel general purpose lanes benefit as well (if less) than those who pay the tolls. This seems to have been true even as the I-394 HOT lane plan was revived and implemented in 2005. (FHWA 2008).
Opinion poll data are both scarce and poorly documented, but those available indicate little difference by income class in attitudes toward HOT lanes. A 2001 survey of both HOT lane users and non-users in San Diego, for example, conducted by its regional council of governments, found that “support is high across all income groups, with the lowest income group expressing stronger support than the highest (80% vs. 70%),” while a poll of Minneapolis consumers in spring 2006 found broad support across all income levels, including 64 percent of low-income respondents. (FHWA 2006, 2008) Interest in converting HOV lanes to HOV/HOT lanes appears to be growing. A 2009 Federal Highway Administration study found sixty projects, in addition to the ten already in operation, at various stages of planning, environmental review, or design (FHWA 2009), and its
22 Colorado Department of Transportation, “I-25 HOV/Tolled Express Lanes,” “About the I-25 HOV/Tolled Express Lanes,” and “Monthly Progress Report, May 2009.” Available at http://www.dot.state.co.us/cte/expresslanes . See also Polhill 2002. 23 “Eight Month Performance Summary of SR167 High Occupancy Toll Lanes Pilot Project,” Washington State Department of Transportation, Urban Corridors Office, January 2009. Table entitled: “Average Daily Trips on SR167, 2008 – by month, lane and peak hour.” http://www.wsdot.wa.gov/projects/SR167/HOTLanes.
22 Equity, Pricing, and Surface Transportation Politics
team leader for highway pricing and system analysis estimated in May 2010 that eleven of these were likely to be in operation within 3-5 years. (Personal communication.) Houston’s Metropolitan Transit Authority announced in 2009 that it would use most of its federal surface transportation stimulus money to convert 83 of its HOV lane miles into HOT lanes by 2011. (Hawley 2009) And the San Francisco Bay Area Metropolitan Transportation Commission – citing a 2008 poll finding that 62 percent of Bay Area voters favor the idea – plans to develop 800 HOT lane miles by 2035, 500 of these via conversion of existing HOV lanes and 300 to be purpose-built. (Bay Area Metropolitan Transportation Commission 2009) Like most of the existing HOT lanes (and all but one of those opened since 2005), these projects will involve tolls only for single-occupant vehicles. And, like all of the existing HOT lanes, they are to be developed within existing highway rights-of-way. CONCLUSION Strong congestion pricing – of most vehicles entering a downtown area or utilizing a major highway – remains but a dream in the United States. The HOT lane concept is but a baby step in its direction -- since the users who pay are a minority even in the HOT lanes, let alone the entire freeway. The great question, though, is whether HOT lanes will prove, in retrospect, to have been an important step along the path toward more general acceptance in the U.S. of congestion (and perhaps broader social cost) pricing. One can imagine that they may, particularly if traffic demand continues to grow and public resistance remains intense both to new taxes and highway construction in new corridors.
All that can be said with confidence right now, however, is that HOT lanes are gaining favor primarily for four reasons. They have helped to reinvigorate a traffic engineering concept, HOV lanes, that had become increasingly controversial for “wasting” valuable road capacity. They are very low cost relative to other means of expanding expressway capacity. They benefit a subset of motorists. And they are unique among the options for ameliorating congestion in satisfying the Do No Harm criterion of equity. They leave no one worse off. REFERENCES Altshuler, Alan and David Luberoff. 2003. Mega-Projects: The Changing Politics of Urban Public
Investment (Brookings Institution Press). Altshuler, Alan, with James P. Womack and John R. Pucher. 1979. The Urban Transportation System:
Politics and Policy Innovation (MIT Press) Altshuler, Alan. 1999. “The Ideo-logics of Urban Land Use Politics,” in Martha Dertick, ed., Dilemmas
of Scale in America’s Federal Democracy. (Cambridge University Press). Barter, Paul. 2008. “Singapore’s Urban Transport: Sustainability by Design or Necessity,” in T.C.
Wong, et al, eds., Spatial Planning for a Sustainable Singapore (Springer, 2008). 95-112. Bay Area Metropolitan Transportation Commission (MTC), Transactions Online. 2009. “HOT Lanes
Aim to Zap Traffic, Cool the Planet.” Buckeye, Kenneth R. and Lee W. Munnich, Jr. 2004. “Value Pricing Outreach and Education: Key Steps
in Reaching High-Occupancy Toll Lane Consensus in Minnesota,” Transportation Research Record, 1864, 16-21.
Buckeye, Kenneth R. and Lee W. Munnich, Jr. 2006. “A Value Pricing Education and Outreach Model: The I-394 MnPASS Community Task Force,” TRB Paper 06-2250.

Altshuler 23
Cervero, Robert. 1999. “Reviving HOV Lanes.” Transportation Quarterly. Fall. 67-81. Denver (Colorado Department of Transportation) HOT lane website. 2009. “I-25 HOV/Tolled Express
Lanes,” “About the I-25 HOV/Tolled Express Lanes,” and “May Monthly Progress Report.” http://www.dot.state.co.us/cte/expresslanes .
Downs, Anthony. 2004. Still Stuck in Traffic (Brookings Institution Press). Federal Highway Administration (FHWA), Highway Community Exchange. July 2006. Press release:
“Priced New Lanes–California: Extension of I-15 HOT Lanes in San Diego.” Federal Highway Administration (FHWA). 2009. Current Toll Road Activity in the U.S.: A Survey and
Analysis (prepared by PB: authors, Benjamin Perez and Steve Lockwood). Federal Highway Administration (FHWA). 2003. A Guide for HOT Lane Development. FHWA-OP-03-
009. Federal Highway Administration (FHWA). 2008. Income-Based Equity Impacts of Congestion Pricing: a
Primer. FHWA-HOP-08-040. Federal Highway Administration (FHWA). 2008a. Lessons Learned From International Experience in
Congestion Pricing (prepared by K.T. Analytics: lead authors Kiran Bhatt and Thomas Higgins). Friedland, Roger and Robert R. Alford. 1991. “Bringing Society Back In: Symbols, Practices and
Institutional Contradictions,” in Walter W. Powell and Paul J. Dimaggio, eds., The New Institutionalism in Organizational Analysis. (University of Chicago Press.)
Fuhs, Chuck and Jon Ohrenberger. 2002. “HOV Facility Development: A Review of National Trends.” 2002. Transportation Research Record. No. 1781. 1-9.
Garcia, Robert. 2003. “Transportation Equity in Los Angeles: The MTA and Beyond.” (Environmental Defense Fund) http://www.edf.org/article.cfm?contentII)=1238
Garrett, Mark and Brian Taylor, “Reconsidering Social Equity in Public Transit.” Berkeley Planning Journal 13 (1999): 6-27.
Gomez-Ibanez, Jose A. 2005. “Congestion Charging in London (A): The Western Extension,” Harvard Kennedy School Case Program CR14-05-1787.0.
Grabell, Michael and Christopher Weaver. 2009. “The Stimulus Plan: A Detailed List of Spending,” Pro Publica, February 13.
Hawley, Steve, 2009. “Stimulus Money Likely to Fund HOT Lanes After All,” Houston Tomorrow, April 24. http://www.houstontomorrow.org/topic/tag/hot-lanes/
Houston (Harris County Toll Road Authority) HOT lane website. 2010. https://www.hctra.org/katymanagedlanes/faq.html
Leong, Ho Khai. 2003. Shared Responsibilities, Unshared Power: The Politics of Policy-Making in Singapore (Eastern Universities Press).
Logan, John R. and Harvey L. Molotch. Urban Fortunes: The Political Economy of Place (University of California Press, 1988).
Meyer, John R., and Jose A. Gomez-Ibanez. 1981. Autos Transit and Cities (Harvard University Press). Miami (Florida Department of Transportation) HOT lane website. 2010. www.95express.com Minneapolis (Minnesota Department of Transportation) HOT lane website. 2010.
www.dot.state.mn.us/upa/ Muench-Pace, Dawn. 2008. “I-95 Express Toll Lanes,” About.com Miami Travel.
www.gomiami.about.com National Surface Transportation Infrastructure Financing Commission. Final Report: Paying Our Way: A
New Framework for Transportation Finance (U.S. Department of Transportation, February 2009).
National Transportation Policy Project. Final Report: Performance Driven: A New Vision for U.S. Transportation Policy. 2009. (Bi-Partisan Policy Center, June).
Neo, Boong Siong and Geraldine Chen. 2007. Dynamic Culture: Embedding Culture, Capabilities and Change in Singapore (World Scientific Publishing Company).
NY1.com, “Congestion Pricing Plan Dies in Albany.” April 7, 2008. http://www.ny1.com/Default.aspx?SecID=1000&ArID=80238
24 Equity, Pricing, and Surface Transportation Politics
Orange County, California (SR 91) HOT lane website. 2010, www.91expresslanes.com Orski, Ken. 2009. “The Surface Transportation Bill – Closing the Gap Between Rhetoric and Reality,”
Innovation News Briefs. June 11. Orski, Ken. 2010. “Two Bold Predictions,” Innovation News Briefs. May 3. Paaswell, R. and J. Zupan, 2007. “Transportation Infrastructure Investments: New York and Its Global
Peers,” Working Paper, City College of New York, October. Polhill, Dennis. “Don’t Miss the HOV to HOT Lanes Conversion Opportunity,” (Issue Backgrounder,
Independence Institute, April 2002. Poole, Robert. “Competing Models for HOT Lanes,” Reason Foundation brief, July 1, 2006.
http://reason.org/news/show/122700.html Pucher, John and John L. Rennie. 2003. “Socioeconomics of Urban Travel: Evidence from the 2001
NHTS,” Transportation Quarterly, Summer, 49-77. Pucher, John. 1981. “Equity in Transit Finance: Distribution of Transit Subsidy Benefits and Costs
Among Income Classes”Journal of the American Planning Association 47, # 4: 387-407. Quinnipiac University Polling Institute. 2008. Release March 24 (poll on New York City congestion
pricing proposal). www.quinnipiac.edu/x1318.xml?ReleaseID)=1162 Rawls, John. 2001. Justice as Fairness: a Restatement. Harvard University Press. Richards, Martin D. Congestion Pricing in London: The Policy and the Politics (Palgrave Macmillan,
2006). Salt Lake City (Utah Department of Transportation) HOT lane website. 2010.
http://www.udot.utah.gov/main San Diego (SANDAG) HOT lane website: www.sandag.org/services/fastrac Schwartz, Gary T. 1976. “Urban Freeways and the Interstate System,” Southern California Law Review.
March: 406-513. Seattle (Washington State Department of Transportation) HOT lane website. 2010.
http://www.wsdot.wa.gov/projects/SR167/HOTLanes Sen, Amartya. 1992. Inequality Reexamined. Harvard University Press. Surface Transportation Policy Project, “Measuring Up: The Trend Toward Voter-Approved
Transportation Funding,” 2003. http://www.transact.org/report.asp?id=201 Taylor, Brian D. 2010. “How Fair is Road Pricing? Evaluating Equity in Transportation Pricing and
Finance,” National Transportation Policy Project, Bipartisan Policy Center, Washington, D.C., September 29.
Taylor, Brian D. 2000. “When Finance Leads Planning: Urban Planning, Highway Planning, and Metropolitan Freeways in California.” Journal of Planning, Education, and Research 20: pp. 196-214.
Taylor, Brian D., and Norton, Alexandra T. 2009. “Paying for Transportation: What’s a Fair Price?” Journal of Planning Literature. 24: 22-36, August.
Tollroads News. 2007. “Minnesota To Do Second Toll Express Lanes,” December 9. http://www.tollroadsnews.com/node/3296
TR News. 2001. Special Issue: “High-Occupancy Vehicle Lanes.” Number 214. May-June. Transportation Research Board (TRB). 2000. Highway Capacity Manual 2000. Transportation Research Board (TRB). 2006. Committee for the Study of the Long-Term Viability of
Fuel Taxes for Transportation Finance, The Fuel Tax and Alternatives for Transportation Funding, TRB Special Report 285.
Utt, Ronald D. 1999. “How Congressional Earmarks and Pork-Barrel Spending Undermine State and Local Decision-Making,” Backgrounder #1266, Heritage Foundation, April 2.
Vladisavljevic, Ivana, Peter T. Martin, Dejan Jovanovic, and Aleksandar Stevanovic. 2008. “High Occupancy-Toll Experiment on I-15 in Salt Lake City Metropolitan Region: Traffic Flow Evaluation,” conference paper, Transportation Research Board.
Altshuler 25
Wachs, Martin. 2005. “Improving Efficiency and Equity in Transportation Finance,” in Bruce Katz and Robert Puentes, eds., Taking the High Road: A Metropolitan Agenda for Transportation Reform, (Brookings Institution Press), 77-100.
Washington State Department of Transportation, Urban Corridors Office. January 2009. “Eight Month Performance Summary of SR167 High Occupancy Toll Lanes Pilot Project,” http://www.wsdot.wa.gov/projects/SR167/HOTLanes
World Bank. 2009. “Gross National Income, International Comparisons.” http://web.worldbank.org/WBSITE/EXTERNAL/DATASTATISTICS/0,,contentMDK:20399244~menuPK:1504474~pagePK:64133150~piPK:64133175~theSitePK:239419,00.html
World Bank. 2010. “Passenger Cars (per 1,000 people).” http://data.worldbank.org/indicator/IS.VEH.PCAR.P3


![[JP Morgan] Abritrage Pricing of Equity Correlation Swaps](https://img.dokumen.tips/doc/110x75/577d2ebc1a28ab4e1eafd675/jp-morgan-abritrage-pricing-of-equity-correlation-swaps.jpg)


