Embed Size (px)
Citation preview

OUR ENERGYOUR PLANET
Opportunities for Energy Efficiency How to Identify the Best Measures in Emerging Markets

Opportunities for Energy Efficiency
How to Identify the Best Measures in Emerging MarketsMarch 2017
This report was developed under USAID's Energy Efficiency for Clean Development Program (EECDP), as implemented by ICF Chief of Party: Aleisha Khan, ICFAOR: Monica Bansal, USAID

The Energy Efficiency Opportunity Study, a project conducted under USAID’s Energy Efficiency for Clean Development Program (EECDP) – a Leader with Associates Award cooperative agreement with ICF, found that regardless of the level of market maturity, the opportunity to improve energy productivity by reducing electricity consumption is tremendous, from 9 percent of total electricity consumption in Mozambique and 22 percent in El Salvador, to 42 percent in the Indian state Telangana. The study proved that a strategic analysis of efficiency opportunities can best enable countries and subnational jurisdictions to achieve energy efficiency at a large scale.
To conduct the study ICF developed a model using basic data and assessment techniques to evaluate technical and economic potential for a host of energy efficiency interventions in each of six countries, as well as to consider the likelihood of bringing programs to scale based on political and administrative feasibility and distributional concerns (i.e., equity). As seen in the Study locations, programs identified as cost-effective are not always feasible to implement and may not be able to deliver the market transforming results that are desired. The results of the Opportunity Study highlight quantitatively which programs can deliver the greatest energy savings as well as the cost per unit of energy reduced, and these findings suggest considerable savings opportunities (see Table 1).
TABLE 1. ENERGY AND GHG EMISSION POTENTIAL IMPACT SUMMARY
E X E C U T I V E S U M M A R Y
Two additional findings stand out from the Study:1. Simple programs offer opportunities for success. Lighting, across all sectors, and industrial motor programsshowed up consistently as investment opportunities that had a strong likelihood of success to deliver energy savings.These programs have returns on investment that are straightforward and easy to measure regardless of theeconomy, unlike building envelope retrofits, for example. Lighting and motors also involve simple productpurchasing programs with low-complexity in terms of technology, installation, and maintenance. Likelihood forsuccess was viewed as essential for the top recommendations to enable program implementers to build on positiveachievements through future programs.
2. Market conditions matter. Across the Study locations, two or more of the top four cost-effective opportunitiesdid not match up with the top four “best” opportunities for energy efficiency investments. Location-specificindicators of success (e.g., program complexity) and the scale of potential market share had significant impacts onwhether or not a program represented a strong initial investment to scale up energy efficiency.
Opportunities for Energy Efficiency, March 2018

5BACKGROUND
C O N T E N T S
7 USAID ENERGY EFFICIENCY OPPORTUNITY STUDY
20 CONCLUSION
12 STRATEGIC INVESTMENTS IN ENERGY EFFICIENCY
8 THE IMPORTANCE OF MARKET READINESS

BACKGROUND – SCALING UP ENERGY EFFICIENCY
Clean energy resource strategies provide emerging markets with near term solutions for energy access and economic development. Energy efficiency, by supporting achievement of these goals while reducing the requirement for overall and peak energy generation, is a cornerstone for any energy resource strategy. In many advanced markets including the U.S., China, and the European Union, energy efficiency is also recognized as a tool for achieving greenhouse gas (GHG) emission reduction goals. However, despite its multiple benefits, energy efficiency remains underutilized in most developing markets.
GLOBAL ACTIVITY Energy efficiency, when understood as improved productivity, has the potential to satisfy almost 30 percent of the estimated global demand for energy in the year 2030.1 Energy intensity, measured as the amount of energy needed to produce one unit of output (Joules/$ gross domestic product), is often used as an indicator for energy efficiency2 in OECD countries. According to the World Bank3, the energy intensity of the global economy fell dramatically during the period 1990-2010 from 10.2 to 7.9 MJ per 2005 U.S. dollar gross domestic product (GDP) which was attributed primarily to cumulative improvements in energy efficiency offset by economic growth. Energy savings during this period were estimated to be over 2,000 EJ4. In 2015, the International Energy Agency (IEA) estimates that energy intensity improvements were responsible for meeting the equivalent of approximately 70 percent of new energy demand; equivalent to avoiding 257 Mtoe5 in consumed energy.6
Common activities in countries with high levels of energy efficiency, using the American Council for an Energy Efficient Economy (ACEEE)’s International Energy Efficiency Scorecard Report (2016)7 as a guide, include a growing or robust energy service company (ESCO) industry, tax credits and loan programs for energy efficiency, and significant efficiency investments by government and utilities (including research and development. These activities are enabled by governments that set clear goals to back up their commitments to energy efficiency. Successful strategies mix consumer education with regulations that target buildings and appliances, paving the way for energy efficiency business models and financing mechanisms to develop.
1 Resource Productivity Opportunity, McKinsey Global Institute, 2011. 2 Measuring energy efficiency is challenging due to data requirements for individual technologies and processes. Therefore, energy intensity is used as a proxy when comparing energy efficiency across countries. 3 Progress Towards Sustainable Energy 2015: Global Tracking Framework Report, World Bank, 2015. 4 EJ (exajoule) is equal to 1018 joules 5 Mtoe = million ton of oil equivalent 6 Energy Efficiency Market Report 2016, IEA, 2016. 7 International Energy Efficiency Scorecard, ACEEE, 2016. http://aceee.org/sites/default/files/publications/researchreports/e1602.pdf
As the world transitions to clean energy, efficiency can make the transition cheaper, faster and more affordable. Indeed, there is no realistic, or affordable, energy development strategy that is not led by energy efficiency. Dr. Fatih Birol, IEA Executive Director [Energy Efficiency Market Report 2016, Foreword]
5
Opportunities for Energy Efficiency, March 2018

ENERGY EFFICIENCY IMPLEMENTATION Energy efficiency is inherently diverse across end-use technologies and markets. This variability presents both advantages and challenges in planning and pursuing successful implementation. Efficiency can occur through simple equipment replacement, such as motors or air conditioners with models that use less energy. Energy efficiency is also realized through building technologies such as windows or roofing materials that do not directly consume energy but impact energy use. The design details of buildings, motor vehicles, and other energy-consuming products and equipment can also lead to energy efficiency without introducing new technology. Finally, human behavior or “energy management”, in the operation of buildings, systems, and equipment, impacts energy consumption and should be an underlying component of all energy efficiency strategies. This can include cleaning and maintaining equipment to ensure optimal function and scheduling equipment to avoid inefficient or costly operation.
Increased energy efficiency offers the following benefits:
➢ Low-cost and rapid implementation: Compared to the time and cost associated with financing andconstructing new power generation and related transmission and distribution facilities, energyefficiency can be a dramatically cheaper and faster option to make better use of existing generationcapacity as well as temper growth in electricity demand. AES, a utility operating in El Salvador,successfully bid on and completed municipal energy efficiency retrofit projects demonstrating thatthere are viable opportunities for private sector investment in energy efficiency strategies. While thegrowing need for energy in the developing world will require some new generation, pursuing energyefficiency can reduce total power sector costs by managing demand growth as a component of a least-cost solution, and can also help current generation to meet demand while new capacity is brought online.
➢ Direct impact on jobs and businesses: Energy efficiency generates investment in local businessesand jobs by stimulating demand for local products, materials, and services. Efficiency programs ofteninclude trainings and skill development, financing for new technologies by businesses and homeowners,and the creation of new services. Implementation of energy-efficient technology and practices requiresa diverse skilled workforce to install, maintain, and manage equipment and energy use. Efficiency opensup opportunities for new jobs and businesses to support the residential, commercial, public, andindustrial sectors in procuring and installing technology, constructing buildings, and applying energymanagement practices. In many of the Study countries, residential lighting and other product programsshowed the strongest signs of high savings at low costs of just a few cents per kWh saved. In AndhraPradesh, India, savings in 2020 are expected to be upwards of 9,000 GWh at the residential level asconsumers adopt higher efficiency appliances and transform the market through heightened demandfor efficient products. Such an outcome is economically advantageous for local distributors andmanufacturers.
➢ Zero-emission solution to meeting energy needs: Clean energy solutions are designed to meetenergy needs and support economic growth with low-emission energy sources. Energy efficiencysubstitutes for power generation to enable equipment and buildings to operate with zero emissions,making efficiency the “cleanest fuel” in the clean energy arsenal. When used to minimize peak demand,energy efficiency and demand response (i.e. curtailing or shifting periods of energy consumption) arereferred to as demand-side management (DSM) resources because they reduce the need for
6
Opportunities for Energy Efficiency, March 2018

generation capacity as well as energy production. DSM strategies can lower total emissions while at the same time reduce customer bills, reduce total system costs and retail rates over time, and improve system reliability and resiliency.
Despite these well-documented benefits, many countries face challenges in identifying and selecting the most impactful and cost-effective energy efficiency interventions. The significant variability between countries in terms of energy tariffs, subsidies, energy intensity levels, issues related to seasonal shortages, and general market readiness, means that energy efficiency measures which work well in one setting may not work well in others. Optimal energy efficiency strategies also differ by climate. For instance, academic institutions working on building efficiency in El Salvador report that buildings in Central American tropical climates employ passive cooling design rather than fully-sealed envelopes favored in colder climates. As a result, it is also challenging to model building efficiency using established programs and data libraries which rely on assumptions relevant to the United States. The uncertainty over which efficiency interventions are most likely to generate significant impacts can cause efficiency to be deprioritized in favor of alternative policy and program solutions that are better understood. To ensure that countries are properly equipped to realize energy efficiency’s resource potential, it is thus necessary to increase the level of certainty around savings, costs, and the key factors affecting market readiness.
USAID ENERGY EFFICIENCY OPPORTUNITY STUDY
Key differences between local end-use markets make it challenging to determine which energy efficiency activities will be good investments to achieve success at a large scale. Factors, such as the cost of technology, the availability of energy performance information for customers, and the presence of a skilled workforce to install and maintain equipment influence whether a particular program will save energy, be cost-effective, and shift the market toward more energy efficient practices.
The Energy Efficiency Opportunity Study was designed under the USAID Energy Efficiency for Clean Development Program (EECDP) to position USAID and its partners to quickly and effectively scale up energy efficiency around the world through a framework for: (1) assessing the “readiness” of a particular market to support programs (e.g., through policies), and (2) identifying near-term programs with a strong chance of cost-effectively advancing efficiency technology and practices.
A market’s level of readiness is determined by assessing the status of six building blocks, which represent critical areas (such as regulatory mechanisms) needed to support widespread energy efficiency. The building block assessment in the Study highlights where programmatic activity should be focused to sustain efficiency activities over time—particularly those that are cost effective, but not likely to succeed in implementation due to unavailable financing, absence of technology, or other factors.
Scaling energy efficiency activity requires (1) strengthening market readiness, and (2) making cost-effective investments in technologies and programs that can have
the greatest impact on the market.
7
Opportunities for Energy Efficiency, March 2018

To identify energy efficiency programs that offer smart near term investments, meaning they will cost-effectively decrease demand for energy under current market conditions, the Study framework analyzes cost, energy savings impact, and likelihood to succeed for a range of energy efficiency measures. This results in a “top 10” set of programs and policies. USAID and local program implementers can use this customized set of efficiency measures to secure buy-in from utilities and government ministries on specific activities and develop program plans.
The Opportunity Study demonstrated the framework for assessing the Building Blocks and identifying near term investments in seven locations, spanning geography and past level of experience implementing energy efficiency programs. Study locations were: (1) South Africa, (2) Mozambique, (3) El Salvador, (4) Mexico, (5) Kazakhstan, (6) Andhra Pradesh, India and (7) Telangana, India. Each national-level study (locations 1through 5) focused on urban centers as representative of the greatest opportunities to scale up energyefficiency. The India sub-national studies (locations 6 and 7) also focused on urban centers to identify thebest opportunities within each respective state, and considered both national and state-level policies aswell as other market readiness characteristics. The Study also encoded the analytical framework in asoftware tool: the USAID Opportunity Assessment Tool8, which uses Microsoft Excel to easily record dataand enable locations to be updated over time, and new locations to be added. The Tool, user guide,additional resources, and all location results are freely available at www.icf.com/EECDP.
THE IMPORTANCE OF MARKET READINESS
In locations where energy efficiency has permeated the market, there are supports in place that enable programs to continue making progress. The California, U.S. market provides a clear example of how broad public awareness of efficiency, incentives for new technology, and a highly skilled workforce have achieved strong levels of efficiency across all sectors. Efficiency is encouraged by readily-available technology, supporting state and local regulation, and targeted financing for home owners and businesses. Although California is dramatically different than most emerging markets, the same types of supports are effective at promoting energy efficiency, even if the design of mechanisms providing support vary.
To promote increased market readiness for scaling up energy efficiency in developing countries, energy end-use markets were categorized into six building blocks (Figure 1). Each building block represents an area that enables and supports the expansion of energy efficiency. The building blocks encompass recognized drivers and barriers9, as well as market characteristics associated with a strong environment for energy efficiency, including effective policies, easily accessible information, and technical expertise10. While there may be additional factors that lead to strong country-level support, the Study proposed these building blocks as the most relevant to long-term implementation of energy efficiency.
8 The USAID Energy Efficiency Assessment Tool, User Guide, and related resources are freely available at www.icf.com/eecdp 9 “Energy Efficiency Governance Handbook” Second Edition, International Energy Agency/European Bank for Reconstruction and Development (EBRD); 2010. 10 “Arab Future Energy Index/AFEX 2015, Energy Efficiency,” Regional Center for Renewable Energy and Energy Efficiency (RCREEE); 2015.
8
Opportunities for Energy Efficiency, March 2018

The Opportunity Study piloted the building blocks using customized sets of questions that identify the presence or absence of each building block’s associated policies, services, and capabilities within a specific national or local market. Building blocks that are not well developed are recommended as focus areas for future activity so they can be strengthened over time to improve market readiness and support better cost-effectiveness and greater impact for new energy efficiency activities in the future.
Individual building block assessments are location-specific. Building blocks are rated on their perceived potential based on what the market can bear, as judged by local stakeholders and evaluators who can modify questions to ensure they are appropriate and specifically related to each location. This approach avoids the pitfall of judging the potential of financing in India, for example, against that in Mozambique, and allows for “market readiness” to be defined in unique country-specific terms. The building blocks provide a universal structure to evaluate opportunities to strengthen the market, transform efficiency into business-as-usual practice, and scale up energy efficiency by reducing the most significant barriers.
Building Block: Skilled Workforce Scaling up adoption of energy efficiency technologies and practices requires an effective network of trained professionals to perform energy assessments and other analyses for residential, commercial, and industrial buildings and infrastructure, as well as technicians to install and service energy-efficient equipment and building components (e.g. energy management systems, lighting, windows, and insulation). Skills training is a core element of many efficiency programs. For example, under EECDP’s work in Indonesia to develop a building benchmarking tool, building managers from 90 hotels were trained on low to no-cost energy-savings opportunities. The participants reduced energy consumption, in aggregate, by 10 percent over one year. A workforce can be developed through partnerships with universities and professional trade organizations, and should include mechanisms to provide skills training (e.g., credentialed energy auditor) and certifications (e.g., Certified Energy Manager) that help the service and professional industries keep pace with technical and strategic advances in energy efficiency.
Building Block: Financing Support Capital projects that improve energy efficiency provide opportunities for significant return on investment. Businesses often see immediate reductions in energy costs that can be used to repay loans, making efficiency a relatively reliable investment for banks and other lenders. However, when not well understood, efficiency projects can seem risky compared to conventional projects and many businesses encounter difficulties in securing financing despite the resulting direct increase to the borrower’s bottom
FIGURE 1. ENERGY EFFICIENCY BUILDING BLOCKS
9
Opportunities for Energy Efficiency, March 2018

line. Additionally, most energy efficiency improvements are not secured debts and the lender cannot easily repossess improvements made to buildings or facilities, causing lenders to overlook these opportunities.
Under EECDP’s work in Bangladesh, the industrial sector faced significant barriers to financing energy efficiency improvement projects. The banking sector did not offer suitable financing products due to barriers of their own, preventing projects with positive returns on investment and continued revenue benefits from moving forward. Since large-scale efficiency investments typically require financing, solutions are needed (and exist) to overcome the capital-cost barrier associated with higher upfront cost of energy efficiency investments. In Bangladesh, the project team worked with manufacturers to bundle energy efficiency investments that had near-term lower paybacks with those that had long-term higher paybacks to create larger investment opportunities more familiar to banks. Changing public policies and lending practices that enable energy efficiency project finance can also be key to increasing initial consumer investment in efficiency, and thus delivering the many associated economic and environmental benefits. The Bureau of Energy Efficiency (BEE) in India successfully demonstrated a partial risk guarantee fund for public lighting, including street lighting.
Building Block: Public Awareness Due to the diverse ways in which energy efficiency is implemented in the market, public acceptance of the associated costs and benefits is fundamental to scaling up efficiency programs across most end-use markets. Consumers must not only be aware of the economic and environmental benefits that efficiency provides, but also of the best strategies to make improvements and maximize the co-benefits provided by energy-efficient products (e.g., improved comfort, usable space, improved acoustics). One of the most high-profile successes is the ENERGY STAR label in the U.S. The program’s label and consumer education activities enable the public to make informed buying decisions based on energy performance. In 2015, U.S. EPA counted over 300 million ENERGY STAR products purchased in more than 70 product categories. Public recognition of the ENERGY STAR label is estimated at 85 percent. Awareness campaigns can be incorporated into incentive and technical assistance programs to increase participation and successful adoption of efficiency technologies and practices.
Building Block: Regulatory Mechanisms Regulation and policy can support large-scale implementation of energy efficiency in the form of building energy codes, product and appliance standards, energy audit requirements, utility regulatory reform to encourage utility investment in efficiency, and national energy efficiency targets. Standards set a baseline that establishes a reliable market for efficient products, encouraging manufacturers to reduce costs. These are effective at influencing the market to adopt efficiency technologies, building designs, and operating practices.
Although codes and standards, such as building energy codes, require their own set of market supports that may include local adoption, enforcement, and training, codes have the potential to achieve significant energy savings. India’s Energy Conservation Building Code (ECBC) was issued in 2007. The code required technologies and practices to be implemented as a part of building construction and operation, with
10
Opportunities for Energy Efficiency, March 2018

resulting savings estimated to reduce energy use by 25-40 percent.11 Once regulations like codes are in place, programs can focus on improving compliance to reach the savings potential.
Building Block: Smart Incentives Incentives, such as rebates, tax credits, or appliance trade-in programs, can be offered to encourage the purchase and installation of energy-efficient products or the purchase of a service to promote efficiency, such as a building audit. Incentives are particularly effective when promoting new or unfamiliar technologies and related services. Since energy-efficient products may have higher capital costs, smart incentives can influence skeptical customers to try out products and services, and then be phased out as those technologies and strategies become more accepted and consumers have a greater understanding of their value. Ghana’s Energy Commission, in partnership with UNDP and GEF, demonstrated a refrigerator trade-in program where operational, but inefficient appliances could be traded in for rebates on new efficient models.12 Governments that provide large energy subsidies can also look to smart incentives as an alternative strategy to lowering their energy costs. Converting some of those subsidy payments into energy efficiency smart incentives could facilitate a decrease in the monthly subsidy resulting from decreased energy demand.
Building Block: Technology Development In order for energy-efficient products to be widely purchased, they must be affordable, easily identifiable, deliver consistent energy performance, and readily accessible. Infrastructure for producing, testing, and labeling quality products needs to be in place for this to be ensured. This can include in-country or regional testing and labeling protocols and programs. Promoting the resulting energy-efficient technologies and labels, and showcasing country-specific application of technologies, are also important. The development of a testing laboratory and process for enforcement of minimum energy performance standards (MEPS) is a crucial step in ensuring energy efficiency program success. The ENERGY STAR program, discussed above, is fundamentally a labeling program. By recognizing the top energy performing appliances and equipment, the program drives the market toward increasing efficiency choices for customers. This is demonstrated through the periodic revisions to standards associated with the label. Standards need to be strengthened in order to identify the top performers once a large percentage of the market achieves the current requirements.
Key Findings and Observations The Study locations had varying levels of past activity and success implementing energy efficiency programs. The expectation and finding was that markets where little success had been achieved would show the lowest overall levels of market readiness for efficiency and vice versa. Across all seven locations, there were two clear patterns:
➢ Locations which had the lowest levels of energy efficiency market penetration and program activity to-date,had low development across all Building Block areas. Mozambique and El Salvador are both markets thathave struggled to sustain success in adopting energy efficiency practices, and had building blocksassessed at the lowest levels. In Mozambique, for example, efforts to build a skilled workforce had
11 “Building Energy Efficiency in India: Compliance Evaluation of Energy Conservation Building Code,” S. Yu, M. Evans, and A. Delgado, Pacific Northwest National Laboratory, 2014. http://www.pnnl.gov/main/publications/external/technical_reports/PNNL-23217.pdf 12 https://www.youtube.com/watch?v=vVTACdpqizw
11
Opportunities for Energy Efficiency, March 2018

been successful; however, once funding was cut, the programs could not continue. In El Salvador, expanded accessibility to energy efficiency financing is needed, along with stronger awareness of how higher initial costs for energy efficient technology result in long term savings benefits. The Banco de Desarrollo de El Salvador offers some financing opportunities for commercial and industrial purposes; however, the high interest rates and the barriers to entry on the residential level limit the opportunity for nationwide participation.
➢ As markets become stronger in their support for efficiency programs, there is no common order of progressionamong Building Blocks. In other words, markets develop different strengths as they mature, opening updifferent opportunities for building support for energy efficiency. For example, Kazakhstan hasprimarily advanced on energy efficiency through improved Regulatory Mechanisms, despite little to noactivity under Smart Incentives, Technology Development, and Public Awareness. South Africa and AndhraPradesh, India have had significant successful energy efficiency activity; however, Public Awareness inSouth Africa was assessed as very low, and Smart Incentives was assessed relatively low in AndhraPradesh.
These preliminary findings are encouraging for emerging markets that are trying to achieve greater levels of energy efficiency. Since no specific Building Block is required for success, it appears that programs can leverage opportunities to advance on any of the Building Blocks in order to make progress.
STRATEGIC INVESTMENTS IN ENERGY EFFICIENCY
Energy efficiency programs encompass a diverse set of measures that range widely by cost, complexity, savings potential, and suitability across countries. Selecting the specific programs that offer cost-effective savings can be challenging. A cost-effectiveness analysis is typically completed before investing in energy efficiency measures; however, the Opportunity Study goes a step further than traditional technical and economic potential studies by evaluating the likelihood of political, social, and administrative adoption for energy efficiency interventions.
The Opportunity Study defined successful investments in energy efficiency as programs and policies deemed to be cost effective, expected to achieve a significant amount of demand savings (i.e., scale), and with a high chance of success in achieving the expected impact. Understanding how activity options compare across these areas can not only avoid costly missteps, but can achieve early successes that strengthen acceptance of energy efficiency as a winning strategy that contributes to power sector reform.
The analytical framework and open-source Excel-based Opportunity Assessment Tool were created as a part of this project to enable energy planners to make successful investments in energy efficiency. The Tool also enables energy efficiency to be considered in sector-wide planning efforts, such as integrated resource and resilience planning (IRRP). The results can serve as inputs into IRRP models, enabling planners to consider energy efficiency as a resource alongside more traditional supply-side resources. This gives utilities and countries a truer picture of what an optimized, least-cost energy portfolio would look like. The use of the Tool in IRRPs was not within the scope of this study; however, it is being used in USAID and ICF’s IRRP projects in Tanzania and Ghana. More information is available here: www.icf.com/EECDP.
12
Opportunities for Energy Efficiency, March 2018

COST-EFFECTIVENESS AND MARKET IMPACT Country-specific costs and energy savings data is required to calculate the potential impact of energy efficiency measures and programs and rank them against one another. To facilitate this, a database of costs specific to each location was developed using literature review, regional pricing information, discussions with key stakeholders, results from past pilot projects, case studies, and energy audits. Research into energy consumption at the sector- and end-use levels (e.g., industrial motors, residential lighting) was also conducted using international data sources. This process was followed to ensure that the savings in the database associated with individual measures were properly allocated and could be compared against total consumption. Programs were designed to promote individual measures, such as commercial air conditioning, or bundles of related measures, such as various residential appliances. A table in the Tool lists all of the programs selected and evaluated for a specific location, and the technologies bundled within each one. Costs are defined in terms of costs per kWh saved.
Reading the “Waterfall Graph” for Cost-Effectiveness: The Tool generates a ranking of energy efficiency programs by cost and energy savings. The distribution in the graph (see Figure 2) shows which programs have the lowest cost and the largest impact, thus being the most cost-effective if no barriers were present in the market. Measures with the potential to deliver large energy savings for little investment are shown as low, long bars, close to the horizontal axis. Impact is based on energy savings estimates, as well as sector-level and end use consumption to determine the potential for savings. Tariff lines in the graphs help in comparing the cost of saving energy against the cost of buying the same amount of energy. Programs for a sector represented by bars underneath their tariff lines represent opportunities to save energy at a lower cost than the current price of electricity paid by consumers.
FIGURE 2. WATERFALL GRAPH EXAMPLE – TELANGANA, INDIA
Key Findings and Observations ➢ Despite having the lowest energy tariffs among Study locations, many cost-effective energy efficiency programs
were identified in Mozambique. Rates in Mozambique at the time of the assessment were at 0.04USD/kWh for residential, and 0.02 USD/kWh for both commercial and industrial customers. Theserates made some energy efficiency programs, including residential appliances, not cost-effective.However many programs were still good investments and had the potential for significant impact.Notable programs with costs less than the cost of buying electricity include industrial sector lighting,motors, compressed air, residential lighting, and water heating.
13
Opportunities for Energy Efficiency, March 2018

➢ Among the group of energy efficiency programs with the lowest associated cost across all Study locations, onlytwo programs were found to not be cost-effective in every location. The Residential Appliances programassessed in South Africa was not cost-effective. South Africans have already adopted a number ofenergy-efficient products for their homes due to favorable efficiency policies, and the use of energyperformance product labeling. However, adoption of more efficient products would allow for evenfurther energy savings. Rebates could be used to buy-down the first cost, and future retail costs wouldlikely come down as demand increased. The Agricultural Pumps program in India (in Telangana andAndhra Pradesh) was also not found to be cost-effective. The agriculture tariff in both states in Indiais very low (0.01 USD/kWh), making it difficult to incentivize customers to improve efficiency basedon saving money. A program aimed at promoting energy-efficient pumps would be a cost-effectivestrategy to support this sector if the government was to reduce the current agriculture tariff subsidyexposes consumers to the true cost of inefficient operation and maintenance.
INDICATORS OF SUCCESS The extent to which key factors contribute to the feasibility and impact of individual energy efficiency programs vary on a country-by-country basis. These factors include the relative price and accessibility of technologies, the expertise of the service industry to install and maintain equipment, and the willingness of energy users to invest in efficiency. Similar to rating general market readiness for energy efficiency through the building blocks, indicators rate the likelihood of success for programs in a specific location based on political, social, and administrative factors. These indicators are different from the building blocks, which provide a framework for assessing current enabling conditions for energy efficiency in the market, because they assess specific programs on the basis of their market transformation potential, political feasibility, program complexity, environmental impacts, economic impacts, and equity.
Program indicators are based on commonly used/best practice program evaluation methodologies used in emerging economies, combined with ICF’s extensive experience designing and implementing energy efficiency programs in the U.S. and developed nations (see Table 2). Indicators are scored using a scale of one (1) to five (5), with five (5) representing the highest probability of achieving positive outcomes for that indicator (notable success has been seen before); and one (1) representing the lowest or no probability of achieving positive outcomes within a given indicator. These are subjective scores and are intended to be sensitive to shifts and changes in the marketplace. Programs were scored based on information gathered through direct conversations with key stakeholders in addition to literature reviews.
14
Opportunities for Energy Efficiency, March 2018

Table 2. Program Indicator Descriptions
Indicator Description
Market Transformation Potential
The potential for programs to influence their relevant market channels over the long run (e.g., the extent to which the program may change retailer stocking practices over time) and the likelihood of changing purchasing decisions (e.g., the probability that consumers would select energy-efficient products once a financial incentive is no longer available).
Political Feasibility
How likely local utility and government stakeholders are to accept and support the program. Without buy-in from key stakeholders, a program is likely to never make it out of the planning stage. This may be affected by key stakeholders having backed a similar program in the past that did not have positive results.
Program Complexity
Marketing, administration, and evaluation burdens all add to the complexity of implementing programs. This indicator is evaluated based on available resources, experience, and expertise in these areas. The score could be high if a particular country has implemented similar programs recently that can be leveraged when implementing a new activity.
Environmental Aspects The lifecycle impact of the program on waste, water use, and emissions. For example, if facilities and infrastructure for recycling CFL lamps are not present in the country, a CFL lighting program may score poorly in that country.
Economic Aspects The potential to increase jobs and development of local manufacturing. If, as a part of the program, manufacturing demand is increased or jobs are created as people are needed for energy audits or installations, this score will be high.
Equity / Affordability
How a program would perform in providing DSM options to customers within each of its target sectors. The score relates to the relative benefit to one particular market segment over another and if the cost associated with the program to the end user is affordable given their income level.
While not an exact science, the scores should represent the best available information and understanding of potential program success at a particular point in time. Scoring of indicators should be modified as more information becomes available and as markets mature and change through growth in technology availability, technical capacity, and in other areas that enable new program opportunities. Once the Assessment Tool has identified energy efficiency programs that are cost-effective for a specific country, the indicator scores shift the focus onto cost-effective programs that also have a high chance for success in scaling up energy efficiency.
Key Findings and Observations ➢ Stakeholders found this component of the Study to add value, despite its subjective nature. Adding indicators
of success to the identification of the best energy efficiency investments relies heavily on stakeholderopinion, along with a thorough evaluation of policies and understanding of program implementation.
15
Opportunities for Energy Efficiency, March 2018

Nevertheless, this step causes program implementers to stop and carefully consider key questions about their local market, and potentially avoid attempts to implement a program not well-suited to current conditions.
➢ Local workshops were essential to scoring. The Study included workshops in each of the locations toreview and discuss preliminary indicator scores. The technical team developed initial scoring based onresearch and early stakeholder input. In most cases, stakeholders were able to use these workshopsto apply a deeper understanding of the factors potentially affecting program success, and adjust scoresto align better with their evolved understanding of program potential.
ENERGY EFFICIENCY OPPORTUNITIES As discussed earlier, energy efficiency programs are often considered for implementation based on the success they have achieved in a different location, under a different set of market characteristics and level of readiness. However, the scale and likelihood of success of an energy efficiency measure are location-specific—a lighting program that worked tremendously well may not have the same impact in another market where baseline conditions, prices, awareness levels, etc. differ. The Opportunity Study provides an understanding of how each option is likely to perform in a specific type of developing country market. Early program success builds positive public and political opinion around energy efficiency, and improves the market environment for programs that may be more difficult to implement but offer significant savings potential.
Reading the “Bubble Chart” for Best Opportunities: The Tool produces a bubble chart that shows cost- effectiveness on the y-axis, calculated using location-specific data on product costs and energy savings potential. The higher the score, the higher the cost-effectiveness of the individual opportunity. Likelihood of success is shown on the x-axis and is based on an assessment of six indicators (market transformation potential, political feasibility, program complexity, environmental aspects, economic aspects, and equity). The higher the score, the higher the likelihood of success of the individual energy efficiency opportunity. The size of each bubble indicates the energy savings potential of the individual energy efficiency opportunity (see Figure 3).
FIGURE 3. BUBBLE CHART EXAMPLE – MEXICO
16
Opportunities for Energy Efficiency, March 2018

Key Findings and Observations ➢ Energy efficiency has the potential to offset the need for substantial levels of electricity capacity and generation.
Program impact estimates can be highly persuasive in efforts to incorporate energy efficiency intocomprehensive power sector planning. To illustrate, the table below summarizes the potential impactof implementing the “Top 10” energy efficiency opportunities identified in each of the countries in theStudy. These opportunities represent programs that have been assessed to be cost-effective and likelyto successfully scale up energy efficiency. In these seven locations, the study identified a total of139,326,000 MWh of achievable energy savings (see Table 3). Additional savings will be realizedthrough reductions in needed electricity capacity, based on the relevant peak energy savings associatedwith these programs.
Table 3. Energy and GHG Emission Potential Impact Summary
Study Location Results for the Identified “Top 10” Energy Efficiency Opportunities
Energy Savings (MWh)Percent of Total Electricity Consumption
Greenhouse Gas (GHG) Emissions Reduction (million tons)
El Salvador 1,783,000 22 0.94 Mozambique 244,000 9 0.19 Kazakhstan 28,881,000 29 25.43 Andhra Pradesh, India 30,932,000 41 28 Telangana, India 33,257,000 42 30 South Africa 14,693,000 8 15 Mexico 29,536,000 12 17.5
➢ While there are clear trends among cost-effective programs and the top overall recommendations, differencesexist and should be assessed to determine how countries should approach energy efficiency strategies. Table4 shows the top programs across locations based on cost-effectiveness and, separately, the “best”opportunities which factor in indicators for success, and the size of the opportunity. In some locations,these opportunities are closely matched. The Study emphasizes the subjective nature of the finalselection of “best” opportunities for each location, and encourages stakeholders to consider all of thetop 10 programs as implementation opportunities.
• Industrial Lighting is consistently cost-effective in all Study locations; however, it does not make itinto the top four “best” opportunities in South Africa and Mozambique due to lower indicatorscoring, notably for political feasibility, environmental aspects, and equity. Industrial lighting is,nevertheless, in the top ten for South Africa and Mozambique.
17
Opportunities for Energy Efficiency, March 2018

• Industrial Motors, Commercial Lighting, and Residential Lighting show up in the top ten in all Studylocations. Like Industrial Lighting, above, these programs have returns on investment that arestraightforward and easy to measure regardless of the economy, unlike building enveloperetrofits. Lighting and motors also involve simple product purchasing programs with low-complexity in terms of technology, installation, and maintenance.
• Industrial Compressed Air programs also show up in the top ten opportunities across Studylocations, and are some of the most cost-effective programs. These programs rank lower amongthe indicators of success, causing them to not be one of the “best” opportunities, except inMozambique.
➢ Sub-national level assessments may not add significant guidance. Prior to the assessment, Andhra Pradeshand Telangana had recently divided into two states in India. The Study was implemented in both statesto assess how the established state government (Andhra Pradesh) and the newly established stategovernment (Telangana) would affect energy efficiency opportunities. However, the results werealmost identical across all areas. This may also be, in part, due to the strong efficiency support at thenational level.
18
Opportunities for Energy Efficiency, March 2018

Table 4. Comparison of 4 Most Cost-Effective ($) and 4 Overall “Best” Investment Opportunities (√) for Energy Efficiency
Mozambique El Salvador Kazakhstan AP, India
Telangana, India
South Africa
Mexico
Industrial Motors √ $ √ √ √ $
Commercial Lighting √ $ √ $ √ $
Industrial Compressed Air √ $ $ $ $
Residential Water Heating √ √
Residential Lighting √ √ $ √ $ √ √
Industrial Lighting $ √ $ √ $ √ $ √ $ $ √ $
Street Lighting √ √ $
Home Retrofit $ $
Commercial District Heating √ $
Residential District Heating √
Residential Fans √ √
Residential Refrigerators √ √
Commercial Water Heating $
Commercial Heating/ Cooling $ $
Commercial Custom/ Prescriptive Heating
$
19
Opportunities for Energy Efficiency, March 2018
CONCLUSION
The Energy Efficiency Opportunity Study was designed to (1) identify locally-appropriate policy and program actions to scale up energy efficiency, (2) highlight the significant energy reduction potential associated with these opportunities, and (3) promote stronger market readiness and increased energy efficiency over time. Participation of local stakeholders proved essential in gathering data, assessing the status of building blocks, and rating potential success indicators for possible program opportunities.
To encourage continued local engagement and to support constantly shifting marketplaces, the Study included the development of a user-friendly tool that incorporates new data and evaluations of market conditions. The Assessment Tool can be used to evolve findings in the Study locations over time, and to add and assess new locations.13 At the completion of the Study, the Tool was populated with data for the seven study locations, as well as for Uganda and Tajikistan, which were similar USAID projects occurring simultaneous to the Study but outside of the EECDP implementation scope.
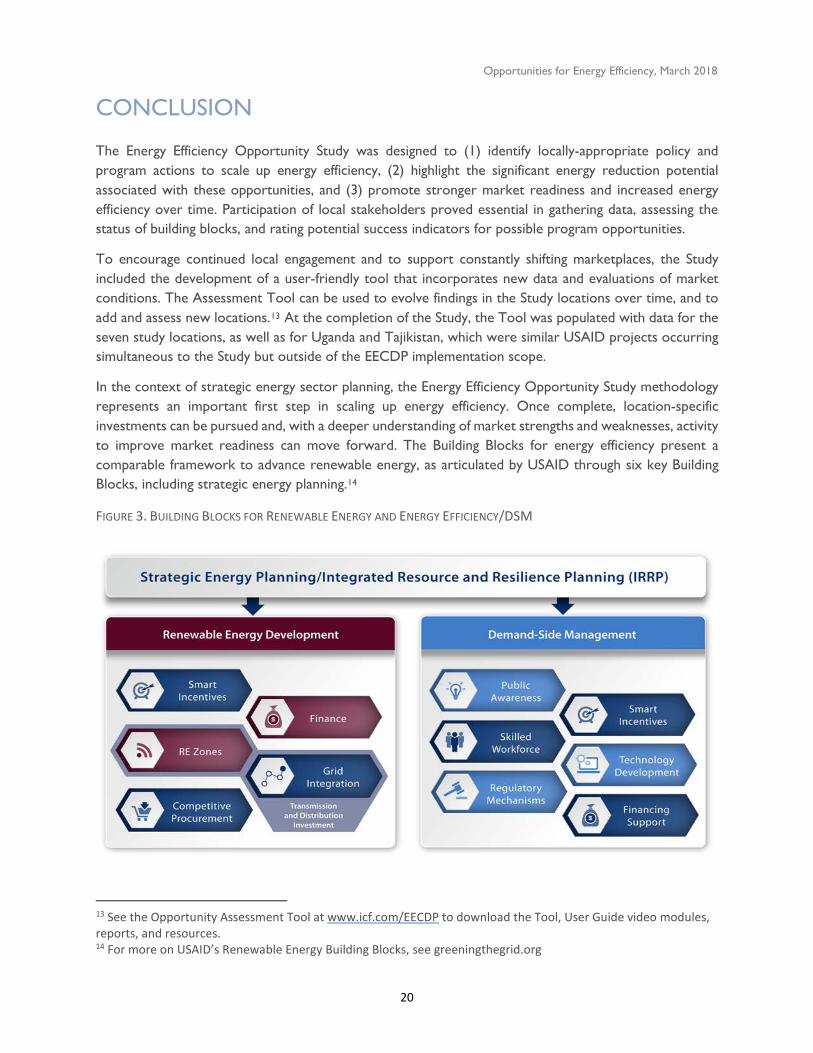
In the context of strategic energy sector planning, the Energy Efficiency Opportunity Study methodology represents an important first step in scaling up energy efficiency. Once complete, location-specific investments can be pursued and, with a deeper understanding of market strengths and weaknesses, activity to improve market readiness can move forward. The Building Blocks for energy efficiency present a comparable framework to advance renewable energy, as articulated by USAID through six key Building Blocks, including strategic energy planning.14
FIGURE 3. BUILDING BLOCKS FOR RENEWABLE ENERGY AND ENERGY EFFICIENCY/DSM
13 See the Opportunity Assessment Tool at www.icf.com/EECDP to download the Tool, User Guide video modules, reports, and resources. 14 For more on USAID’s Renewable Energy Building Blocks, see greeningthegrid.org
20
Opportunities for Energy Efficiency, March 2018

The Energy Efficiency Opportunity Study methodology is also being used to incorporate demand-side management (DSM) into broader power sector planning, such as Integrated Resource and Resilience Planning (IRRP), which identifies least cost, least risk, and long-term energy portfolios (see Figure 3). The IRRP process allows DSM to be considered alongside traditional and renewable supply-side resources, which is essential for identifying a true least cost/risk optimized portfolio. This type of comprehensive planning leads to greater sector affordability and sustainability, and is an effective approach to strengthen the viability and capacity of the power sector in emerging markets. Cost-effective energy efficiency solutions support economic growth and expanded energy access and should be considered with strategies that include improved efficiencies in transmission and distribution, and climate risk management.
21