Embed Size (px)
Citation preview

On the EconomicDimensions of CorporateSocial ResponsibilityExploring Fortune Global 250 ReportsFabienne FortanierAns KolkUniversity of Amsterdam Business School
The macro-level debate on the economic impact of multinational enterprises(MNEs) is still unsettled. This article explores micro-level evidence byexamining what Fortune Global 250 firms themselves report about theireconomic impact. Such reporting embodies corporate attempts to account fortheir economic implications, in addition to the environmental and socialaspects of their activities that have traditionally received more attention in thecontext of corporate responsibility. Firms’ reports turn out to provide a richillustration of the mechanisms through which MNEs (can) affect economicdevelopment (including sheer size, technology transfer, and backwardlinkages) and of how such impacts are being operationalized and measured.The authors test which MNEs are most likely to disclose information on thevarious mechanisms and find that it is influenced by region, sector, and sizebut not by profitability. Implications of this exploratory study for researchand practice are discussed.
Keywords: corporate social responsibility; economic impact; foreign directinvestment; multinationals; reporting
T he economic impact of multinational enterprises (MNEs) on hostcountries is receiving growing attention from academics and policy
makers alike. There is a long-standing, predominantly macro-economic debateon the role of foreign direct investment (FDI) in host-country growth,
Business & SocietyVolume XX Number X
Month XXXX xx-xx© Sage Publications
10.1177/0007650306296088http://bas.sagepub.com
hosted athttp://online.sagepub.com
1
Authors’ Note: This article follows from a research project at the University of Amsterdam,of which some results have been published in the KPMG International Survey of CorporateResponsibility Reporting 2005. This survey was carried out by the University of AmsterdamBusiness School and KPMG’s Global Sustainability Services.
Business Society OnlineFirst, published on September 18, 2007 as doi:10.1177/0007650306296088
Copyright 2007 by SAGE Publications.

especially in relation to developing countries. Although important insightsabout the various mechanisms through which FDI can affect economicgrowth have emerged, the empirical evidence on its exact consequences forhost countries’ economies is still far from conclusive, as noted, for example,by Caves (1996), Rodrik (1999), and Meyer (2004). On the one hand, therise in worldwide FDI since the 1980s has been hailed by many as animportant means to complement domestic savings; transfer skills, knowl-edge, and technology; improve competition; and increase the quantity andquality of employment and, thus, furthering economic growth and socialdevelopment. On the other hand, however, MNEs have been accused ofcrowding out local firms, using technology that is not always appropriatefor local circumstances, creating merely low-wage jobs, contributing to so-called McDonaldization of lifestyles, manipulating transfer prices (and,thus, reducing the tax base), and (ab)using their powerful political and eco-nomic position in host countries (Kolk, Van Tulder, & Westdijk, 2006).
As input into this unresolved debate, calls have been made recently toconcentrate less on the macro level of analysis and more on micro-level,firm-specific behaviors to yield insights into “the role of MNEs in society”broadly defined, particularly using the expertise from the field of interna-tional business (Meyer, 2004, p. 261). Such a focus on the impact of firmsfalls in line with recent policy attention to MNEs’ potential contribution toalleviating poverty (e.g., in realizing the Millennium Development Goals).It also links to attempts by firms themselves, particularly in the past decade,to account for their implications for society and the environment throughcorporate reporting. Such disclosure practices have traditionally focusedmore on the environmental and social aspects (see, e.g., Chapple & Moon,2005; Kolk, 2005; Line, Hawley, & Krut, 2002; Maignan & Ralston, 2002);only very recently are the economic dimensions receiving more attention aspart of a trend toward corporate social responsibility (CSR) or so-calledtriple bottom line reporting (people, planet, profit) both by firms and acad-emics. How firms report on these economic dimensions of CSR is very rel-evant because it sheds light on not only their perceptions regarding impactbut also how such impacts are being operationalized and measured and dif-fer across types of firms. Such information should be helpful for furtherresearch regarding the economic impact of MNEs, also at the macro level(and not limited to developing countries only), and for managers and policy makers interested in assessing and guiding MNE behavior.
This article, thus, aims to make a contribution to the debate on the role of FDI in development (and host economies in general) by exploringhow MNEs currently report on economic impact. The tendency that firms
2 Business & Society
increasingly publish triple bottom line reports (usually with titles such as corporate social responsibility or sustainability report; see, e.g., KPMG,2005) offers the opportunity to assess this information as disclosed by firmsthemselves. Through an analysis of the reports published by the FortuneGlobal 250, we document the current situation regarding these firms’ self-reported economic impact and the mechanisms through which they con-tribute to host economies, illustrated with noteworthy examples. In addition,an assessment is made subsequently of which firms are most likely to reporton the various aspects, looking at sector of activity and country of origin, aswell as firm size and profitability. The implications of these findings arediscussed in the final section of this article, accompanied by recommenda-tions for further fine-tuning and application. Before moving to the empiri-cal sections, however, we first briefly discuss the main impacts of MNEs oneconomic development as identified by the literature.
Literature Review: MNEs’ Impactson Economic Development
Considerable academic attention has been paid to the impact of FDI andMNEs on economic development and economic growth. Much of this hasfocused on developing countries (or the smaller subset of so-called emerg-ing economies in which most FDI takes place). In this section, we firstbriefly discuss the divergent evidence that has been found thus far (for moreextensive overviews, see, e.g. Meyer, 2004). Consequently, we focus on themain mechanisms through which MNEs can affect host countries, such astechnology transfer or the creation of linkages with local firms. As theseoccur at the individual firm level and can, to a certain extent, also be influ-enced by the MNEs themselves, these mechanisms are most likely to bereferred to in corporate reporting on the economic dimensions of their CSRstrategies.
If one should draw just a single conclusion from the large number of exist-ing studies on the effect of FDI on economic development, it would be thatthe empirical evidence on this issue is extremely mixed. On the one hand, DeMello (1999), Sjöholm (1997b), and Xu (2000) found that foreign investorsincrease growth in host countries. Baldwin, Braconier, and Forslid (1999)showed that domestic technological progress was aided by foreign techno-logical progress, and studies by Borensztein, De Gregorio, and Lee (1998)and the Organization for Economic Cooperation and Development (1998)also come to the conclusion that FDI had a larger impact on economic growth
Fortanier, Kolk / Corporate Social Responsibility 3

than domestic firms’ investments. On the other hand, a study by Kawai(1994), using a set of Asian and Latin American countries, indicates that anincrease in FDI generally had a negative effect on growth (with the excep-tion of Singapore, Taiwan, Indonesia, the Philippines, and Peru). In CentralEastern European countries, the impact of FDI on growth proved to be neg-ative as well (cf. Djankov & Hoekman, 1999; Konings, 2000; Mencinger,2003; United Nations Economic Commission for Europe, 2001). Finally,in their study on 72 countries, Carkovic and Levine (2000) found a nega-tive impact of FDI on income and productivity growth.
Studies that use industry-level rather than macro-economic data (oftenfocusing on productivity growth as equivalent of economic growth) do notyield consistent results either. Some authors indeed found positive resultsof FDI on productivity in a diverse range of countries. This included themanufacturing industry in Indonesia (Anderson, 2001; Sjöholm, 1997a),Mexico (Blomström & Wolff, 1994; Kokko, 1994; Ramírez, 2000), Uruguay(Kokko, Tansini, & Zejan, 1996), and China (Liu, Parker, Vaidya, & Wei,2001). Others found negative effects of FDI on the productivity of localfirms. Using Venezuelan data, Aitken and Harrison (1999) concluded thatproductivity in local firms decreased, whereas productivity in foreign firmsand firms with significant foreign participation increased. Haddad andHarrison (1993) and Aitken, Harrison, and Lipsey (1996) did not find pos-itive productivity spillovers in Morocco, Venezuela, or Mexico.
A good understanding of the impact of FDI on development seems tonecessitate attention to the underlying processes (such as technology trans-fer and linkage creation) that shape this relationship, especially from a policy perspective (Chung, Mitchell, & Yeung, 2003). However, althoughempirical studies cited above indicate that there are several ways in whichlocal firms may be affected by foreign subsidiaries, they fail to give explicitempirical attention to the specific mechanisms through which FDI mayaffect development (Alfaro & Rodríguez-Clare, 2004). In this study, wefocus exactly on those mechanisms and on the roles that MNEs (try to) playin enhancing their potential positive effects.
The different ways through which these (either positive or negative)effects of MNEs and FDI for economic development can occur can essen-tially be grouped into three main groups of mechanisms: size effects, struc-tural effects, and skills and technology effects. Size effects refer to the mostdirect or static contribution of FDI to host countries and encompass the netcontribution that a foreign subsidiary makes to, for example, capital forma-tion or employment. By adding to the host country’s savings and invest-ments, FDI enlarges the production base at a higher growth rate than would
4 Business & Society

have been possible if a host country had to rely on domestic sources of sav-ings alone. In addition, an investment by a multinational firm may increaseemployment by hiring workers.
Yet most of the anticipated gains of foreign capital are usually attributedto the more indirect effects of FDI (also named spillovers). These mecha-nisms include either structural change in markets (competition), multi-plier effects (backward linkages with suppliers), or the transfer of skills andtechnologies.
Structural effects brought about by the entry of an MNE might occurboth horizontally (competition) and vertically (linkages with buyers andsuppliers). An investment of an MNE in a local economy can stimulatecompetition and improve the allocation of resources, especially in thoseindustries where high-entry barriers reduced the degree of domestic com-petition (e.g., utilities). However, fears are often expressed that MNEs, withtheir superior technology, greater possibilities for using economies of scale,and access to larger financial resources, may outcompete local, often muchsmaller firms (“crowding out”). In a strict economic sense, crowding outdoes not have to be problematic, as long as local firms are replaced by com-peting, more efficient firms. Yet if crowding out leads to increased marketconcentration, the risk of monopoly rents and deterioration of resource allocation (and, thus, reduced economic growth) increases. These potentialeffects can also extend to, for example, capital markets. If FDI is financedby local borrowing, credit constraints for local firms may very well increase(Harrison & McMillan, 2003).
The linkages of the MNE affiliate with local buyers and suppliers form themain channel through which interindustry spillovers can occur. Backwardlinkages are sourcing relations with suppliers and are created when MNEaffiliates buy their inputs from local firms (Alfaro & Rodríguez-Clare, 2004;Rasiah, 1994). This might raise not only the overall output of local supplierfirms but also their productivity and product quality, as MNEs provide technical and managerial assistance (McIntyre, Narula, & Trevino, 1996).Forward linkages refer to relations with buyers—either consumers or otherfirms using the MNE’s intermediate products as part of their own productionprocess (Aitken & Harrison, 1999). Buyers of MNE products could benefitfrom products with lower prices or better quality and from the marketingknowledge of the MNE.
Transfer of knowledge and skills may also take place in other areas.Because MNEs are frequently key actors in creating and controlling tech-nology (Markusen, 1995; Smarzynska, 1999), their affiliates can be impor-tant sources for spreading managerial skills and expertise on products or
Fortanier, Kolk / Corporate Social Responsibility 5

production processes—either intentionally or unintentionally—to host-country firms (Blomström, Globerman, & Kokko, 1999). This may inducelocal firms to update their own production methods. Technology transferand spillover effects can also result from labor migration of MNE-trainedworkers to local firms. However, if technological upgrading becomes toodependent on decisions by foreign MNEs, this might impair the develop-ment of a local innovative basis. Moreover, MNEs’ (capital-intensive) technolo-gies may not always be appropriate for developing country (labor-intensive)contexts (Caves, 1996), with local firms facing difficulty in absorbing foreigntechnologies and skills.
This overview of the literature illustrates that at the macro level, there isconsiderable understanding of the mechanisms through which MNEs andFDI affect host countries. Conclusive evidence on the outcomes of theseprocesses is lacking, however. Partly, this is because of the relative novelty ofexplicitly including MNEs and firm-specific behavior in such analyses aswell as persistent data availability problems at the macro but particularly themicro level. In this article, we venture to make a contribution to both aspectsby examining what MNEs themselves report about their economic impactand the underlying mechanisms through which that impact occurs and howthese reporting practices differ across firms. By doing so, this study providesinformation on not only how economic impacts and mechanisms couldpotentially be “measured” at the firm level but also the current extent ofMNEs’ “awareness” and the factors that influence this level of self-reporting.
Sample and Data Collection
The emergence of corporate nonfinancial (sustainability, CSR) reportinghas incited disclosure of not only social and environmental impacts but alsoa firm’s economic impacts. We therefore collected and analyzed the con-tents of these nonfinancial reports. The set of firms targeted was the FortuneGlobal 250—the first half of the Fortune Global 500 list as published onJuly 26, 2004. In the period from September 2004 to January 2005, all 250firms were scrutinized for their most recent corporate report dealing withenvironmental, social responsibility, and/or sustainability issues. This couldbe either a separate report or if not available, the annual financial report ifit contained this kind of information. Web sites were visited to activelysearch for reports, and if this did not yield results, the firms were contacted,several times if necessary, by letter, mail, and/or phone to have certainty
6 Business & Society

about reporting by the whole set of 250 firms. Of the 250 firms, 161 pub-lished nonfinancial reports, whereas the remainder confirmed not to report(and, hence, were counted as nonreporters in consequent analysis).
The contents of the 161 reports thus collected were subsequently care-fully analyzed to see to what extent MNEs reported on or referred to theireconomic impacts. We included four key variables in this respect, based onthe mechanisms that were identified above. First, whether firms mentionand report on their economic impact at all (impact); and then, whether theypay attention to each of the three main mechanisms distinguished in the literature: the overall size of their presence (size), the structural changesbrought about by their affiliates—focusing specifically on linkages with localfirms (link)—and finally, activities related to transferring technology tolocal firms (tech).
Firms were scored on each of these variables in two ways: first, by indi-cating the absence or presence of this information (resulting in binary vari-ables) and second, by collecting explicit statements and “best practices”from the reports. Because of the exploratory nature of the study and thenovelty of examining firms’ information by these means, we felt that docu-menting and presenting interesting examples could be useful for a betterunderstanding of the specifics of the impacts as well as potentially helpfulfor managers and policy makers interested in pursuing the issue.
In the analysis of the reports, we considered MNEs’ impacts on compe-tition because in addition to linkages, this is the other key part of the struc-tural effects outlined in the literature review. However, this issue turned outto receive very little attention in the MNEs’ nonfinancial reports. Less than10% of the reports included statements on firms’ approaches to competi-tion, and even if so, usually in rather general terms. One of the most explicitstatements originated from ABB Group (2004), which noted that it
is committed to fair and open competition in markets around the world andwould take immediate steps under its “zero tolerance” ruling to address anyincidents of non-compliance among its employees or other actions whichrestrict or distort competition in violation of applicable anti-trust laws. (p. 22)
In addition, particularly for Japanese MNEs, “fair competition” does notrefer to their own behavior but rather, to fair competition among their suppliers (those that compete for an order with the MNE in question).Competition, therefore, will not be further included in the subsequentexamination.
Fortanier, Kolk / Corporate Social Responsibility 7

MNE Reporting on Economic Impacts
Table 1 gives a general overview of the economic issues that MNEsinclude in their reports. It shows that about one quarter of the firms thatpublish a nonfinancial report address the topic of the impact of their activ-ities on host economies, which corresponds to slightly more than 16% ofthe total Fortune Global 250. As discussed more extensively below, firmsthat report on their economic impact most often do so by referring to sizeeffects, followed by linkage creation. Technology transfer is mentionedconsiderably less.
Size Effects
A good example of an MNE reporting on size effects is Alcoa (2004),which mentioned strengthening “local and national economies through well-paying jobs, taxes paid, and local purchases” (p. 48), for example, throughits subsidiary Suriname Aluminum Company (Suralco), which in 2002,“accounted for roughly 15% of Suriname’s gross domestic product—moreif multiplier effects are taken into account” (p. 48). Other firms also relatetheir business to the size of local economies. RWE (2004) described itself as the “world’s third-largest water supplier” (p. 32) and “the largest privatewater company in both Indonesia and Thailand, for example” (p. 68). BT(2004) calculated its direct and indirect contribution to British employmentand GDP and concluded that it supported “almost 1.7% of all employmentin the UK” (p. 22). In a similar manner, Telefónica (2004, p. 83) reported itsrevenues to account for 1% of GDP in Argentina and up to 2.36% in Peru.
8 Business & Society
Table 1Economic Issues Included in Fortune Global 250 Reports, 2004
Percentage of Percentage of Reportsa Sampleb
Impact 25.5 16.4Size 18.6 12.0Link 14.3 9.2Tech 6.8 4.4
a. Refers to the percentage of reports that include a reference to one of the economic issues(i.e., n = 161).b. Refers to the percentage of all Global Fortune 250 firms that refer to a selected economicissue.

MNEs frequently refer to size effects by including numbers of jobs cre-ated. Examples include Vivendi Universal’s (2004) subsidiary in sub-SaharanAfrica (“600 direct jobs,” p. 14) or Coca-Cola (2004), which claimed that“the Coca-Cola system” is “Africa’s largest private sector employer” with“nearly 60,000 employees” (p. 16). ExxonMobil (2004, p. 20) is the only firmout of the entire Global Fortune 250 that related its activities most directly toeconomic growth by stating that in its Chad-Cameroon project,
the annual growth rate of Chad’s GDP has soared to nearly 11 per cent sinceconstruction began, compared to a rate of just 1 percent in prior years. Economicgrowth is projected to rise even higher as project revenues begin flowing to thetwo governments. (p. 20)
A notable element of corporate reporting on size impacts is that partic-ularly European and Japanese MNEs have started to report on their “addedvalue” to society and stakeholders and include figures on (cash) valueadded to different (stakeholder) groups or on how expenses are distributed.A wide variety of ways to do this can be found, in the categories mentioned,in calculation methods, and in the presentation of figures or percentagesduring just one or more years. Although the range of approaches hamperscomparisons, the trend toward specification of contributions offers insightinto different means of reporting about economic impacts on society or asBASF (2004) put it, “Unlike the statement of income, the value added state-ment is not from the shareholder’s perspective, but explains BASF’s contri-bution to private and public income” (p. 57).
In its report, BASF (2004) explained that the value added created (6.3%lower in 2003 than in 2002) results from the business performance minuscosts of materials, depreciation and amortization, and other expenses. It wasdistributed in 2003 versus 2002, respectively, over employees (68.1% vs.64.8%), creditors (4.2% vs. 4.2%), dividends to shareholders (9.0% vs.8.6%), state (16.4% vs. 13.8%), the firm itself (1.5% vs. 7.6%), and minorityinterests (0.8% vs. 1.0%). Another example is Unilever (2004, p. 3), whichincluded a section titled “Creating Value, Sharing Wealth” in which it pic-tured the development of total shareholder return (1999 to 2003) and gave thedistribution of cash value added over employees (46.5%), invested in busi-ness for future growth (20.8%), providers of capital (21.6%), governments(only direct corporate taxation, 10.6%), and local communities (only volun-tary contributions to charities and nongovernmental organizations, 0.5%).
The notion of CSR accounting (“CSR Accounting: Creation and Allocationof Added Value”) was introduced by Ito-Yokado (2004, p. 3). This very clearly outlines that 84% of the firm’s revenues go to the business
Fortanier, Kolk / Corporate Social Responsibility 9

associates (for costs of goods sold, sales expense, etc.) and the other 16%consists of added value produced through Ito-Yokado’s business activities.The report subsequently gives the division of the different categories andhas a separate table in which the components are explained. BP (2004,p. 9) included, in addition to quantified distribution over the differentgroups, a graph in its sustainability report with “stakeholder and benefits”and mentioned, for example, that it provides employment for 103,700people and works with communities located near more than 100 major sitesand with nearly 135,000 suppliers and contractors.
Tax issues are sometimes mentioned as part of this distribution of valueadded, but often addressed separately as well, as one of the size effects ofMNEs. Our analysis shows that about one in six reports analyzed tax issuesto some extent, most often to just highlight the amount of taxes paid or atbest, with a geographical breakdown of taxes such as in the reports ofNorsk Hydro and BT. Alcoa (2004, p. 49) mentioned its effective tax rate(33.5%), whereas ExxonMobil (2004, p. 18) calculated that its operationsgenerated US$200 million in taxes per day. Pemex (2004) made a particu-larly interesting observation regarding its taxes, stating that “in spite ofPemex’s efforts in 2003, the net return after taxes showed a deficit of 41.7billion pesos, which reveals the need to modify the current fiscal regime topromote the company’s health and growth” (p. 7).
Overall, MNEs do not differentiate between their impact on home andhost countries, let alone developing countries specifically, thus, hamperingan assessment of the impact of FDI. In a few cases, however, some of thisinformation is presented. Dow Chemical (2004) gave figures for salaries,taxes, and purchasing per region (North America, Europe, Latin America,Pacific). Telefónica (2004) indicated, for six countries in South America,how it contributes to the economies and their development by listing eco-nomic data (percentage of revenue, in relation to GNP; number of employ-ees; and local suppliers). Shell (2004) also paid attention to economicbenefits to society, listing amounts paid on sales taxes and excise duties,corporate taxes, royalties, expenses on goods and services from locallyowned firms in developing countries, and investments in social programs.
Linkage Creation
Another dimension that we studied in the reports is linkage creation.Although linkages can be both vertical and horizontal (the latter represent-ing, for example, joint ventures), the vast majority of firms report on verti-cal linkages when discussing their ties with local firms. Exceptions include
10 Business & Society

RWE (2004), which reported on its 20-year-old Egyptian joint venture, andPepsiCo (2004) which highlighted that through its 40 Chinese joint ven-tures, it employs “more than 10,000 Chinese people directly and an esti-mated 150,000 indirectly” (p. 27). In most cases, however, firms mentionvertical linkage creation, in particular with suppliers. Several firms reportedon the precise number of goods and services bought from suppliers, thus,indicating their impact on local firms. Procter & Gamble (2004), for example,“purchased more than $25 billion in materials and services to manufactureand market [their] products. [They] employ locally and purchase the major-ity of [their] raw materials within those regions where [they] manufacture[their] products” (p. 50). In a similar manner, HBOS (2004) reported tohave “20,000 suppliers” and to have spent “over £2 billion each year onprocurement” (p. 6). Telefónica (2004, p. 84) not only splits out its amountof purchases by the countries in which it operates but also details the percentage of local suppliers in relation to their total purchases, whichexceeded “90% on average” both by value and number of contracts.However, because in their list of top 10 suppliers large MNEs such asEricsson, IBM, Alcatel, and Nokia dominate, these local suppliers maylikely be foreign owned as well.
Technology Transfer
Firms are least likely to report on the final aspect, which concerns activ-ities related to technology transfer. In fact, of the total sample, only 11referred to technology transfer, and this included some rather general state-ments. The few firms that reported in more detail on their activities usuallydiscussed involvement in training of either their own employees or those oflocal suppliers. ExxonMobil (2004), for example, stated it “recognize[s] itsresponsibility to support the development of local economic capacity by providing training and development opportunities for local business”(p. 20). More concretely, BP (2004) “has been active in programmesdesigned to strengthen small and medium enterprise (SME) sectors”(p. 35), for example, in Azerbaijan, where “300 training courses” were runand “100 companies” were helped “by providing consultancy and businessadvice” (p. 35). PepsiCo (2004) found that because of its agriculturaldevelopment programs, crop yields have significantly improved. In China,for example, “PepsiCo funded a $20 million, comprehensive agro-technol-ogy program that introduced state-of-the-art seed development techniquesand farming practices to China,” thereby “benefiting 1,100 farmingfamilies” (PepsiCo, 2004, p. 27). Finally, Unilever (2004, p. 12) reported
Fortanier, Kolk / Corporate Social Responsibility 11

that its Vietnamese subsidiary “consciously sought to develop a range ofsourcing and distribution partnerships with local companies that require thetransfer of technology capabilities” (p. 12).
Exploring Drivers of MNE Impact Reporting
The preceding analysis shows that MNEs have started to report on eco-nomic impacts, particularly size effects, and that interesting and explicitexamples and “best cases” exist. Although this is instructive to firms, pol-icy makers, and other stakeholders (including researchers) for different rea-sons, it is also notable that the overall percentage that currently providesinformation is still rather limited. This raises the question of which firmsare most likely to report in general on economic impacts and the variousmechanisms. A better insight into the factors that play a role in this respectcan also be helpful for those who, for example, want to encourage invest-ment of particular firms (e.g., the ones that are most explicit about impactsor seem to contribute most to one or more dimensions) and devise appro-priate regulation and/or incentives or aim to improve transparency of thenondisclosing firms. Below we examine to what extent reporting on thefour key variables differs across firms originating from particular regions(countries) and sectors and with different size and profitability characteris-tics. These are aspects that have often been included in existing studies oncorporate nonfinancial (environmental and social) disclosure, that drawfrom institutional or legitimacy theory, or that use stakeholder approaches(e.g., Adams, Hill, & Roberts, 1998; Berthelot, Cormier, & Magnan, 2003;Kolk, 2005; Sharfman, Shaft, & Tihanyi, 2004).
First, differences in regulatory pressure (Davidson & Worrell, 2001;Sharfman et al., 2004) as well as public pressure more generally (Kolk,2005) across countries have been shown to significantly influence theextent to which firms engage in social or environmental activities. Althoughthere is less strict regulation on firms regarding their economic contribu-tions (e.g., on the extent of technology transfer), we expect that firms thatare highly pressured to be transparent on the social and environmentaldimensions of their CSR activities will experience similar pressures regard-ing the economic dimensions. Given our somewhat limited sample size,we clustered the countries together in four main regional groups (NorthAmerica, Europe, Asia, and developing countries). Although there is stillnoticeable variance in regulatory pressure within each group, differencesacross groups have shown to be significantly larger (Kolk, 2005).
12 Business & Society

In addition to variation in regulatory pressures, differences have been estab-lished in corporate CSR reporting across sectors because of, for example,industry levels of diversification, global integration, or local responsiveness(see Sharfman et al., 2004). Because the main mechanisms through whichMNEs economically affect the countries in which they operate differ in impor-tance across industries (e.g., technology transfer is likely more central in tech-nology-intensive industries, whereas local linkages are more often created inlocally responsive industries), we expect that firm reporting on these issueswill differ across industries. We classified the 250 firms in our sample in eightdifferent industry groupings by aggregating Fortune sector classifications.
Studies on environmental disclosure also show that the size of firms isimportant for environmental accountability (Adams et al., 1998; Gray,Kouhy, & Lavers, 1995; Neu, Warsame, & Pedwell, 1998). The logicbehind these findings is that with increasing size, firms become more visi-ble and so do their environmental impacts, thus, exposing them to increasedpublic pressure to report more extensively. We measure the variablelogsales as the logarithm of a firm’s total sales.
Finally, it is often suggested that higher levels of environmental disclo-sure contribute to economic performance and profitability (Al-Tuwaijri,Christensen, & Hughes, 2004). Although the causal relation may also runthe other way round, in our cross-section data, we expect a positive rela-tionship between economic performance and environmental disclosure.Profitability (ROS) is measured as return on sales; both variables are takenfrom the Fortune Global list.
Given that the number of firms that actually reported on their economicimpact is relatively low, we first discuss the relationship between the depen-dent and independent variables based on simple correlation coefficients andanalysis of variance before testing the significance of each in a regressionanalysis. Table 2 explores to what extent reporting differs across firms fromdifferent sectors and countries of origin using ANOVA. Both the totalnumber of firms and the percentage share in the sample that report on a par-ticular dimension are reported (e.g., 41 of the 250 Fortune Global Firmsreport on their economic impact, which equals 16%). Table 2 indicates thatboth sector-level pressures and regional (institutional) differences signifi-cantly influence the extent of reporting on economic impact. In particular,the attention for technology transfer seems to differ across sectors, whereasthis effect is not significant for the creation of linkages and for size effects.Companies in the oil industry are most prone to report on their economicimpact, followed by chemical and pharmaceutical companies and othermanufacturing. In contrast, firms active in finance, trade and retail, and
Fortanier, Kolk / Corporate Social Responsibility 13

electronics are least likely to discuss activities related to their economicimpact. Although sector effects can significantly explain the variation inreporting on technology transfer, region of origin influences the extent towhich firms report on the size of their impact and the extent of linkage cre-ation. The descriptive statistics indicate that impact reporting predomi-nantly occurs in Europe.
Table 3 gives descriptive statistics and correlation coefficients for thecontinuous variables in the models. Correlation coefficients between thefour dependent variables—impact, size, link, and tech—are all significant,as expected, although not all values are extremely high, indicating that eachstill measures a different dimension of MNE impact. This is further illus-trated by the correlations with logsales, which is correlated with technologytransfer and linkage creation but not with size effects.
Combining each of the four dependent variables (impact, size, link, andtech) with all four independent variables (sector, region, ROS, logsales)
14 Business & Society
Table 2Reporting on Economic Issues by Sector and Region, Total Number
of Firms, and Percentage Share of Sample
Number Percentage of sample
Impact Size Link Tech Impact Size Link Tech
Total 41 30 23 11 16 12 9 4By sector
Automotive 4 3 2 0 20 15 10 0Chemicals &
pharmaceuticals 4 3 1 1 31 23 8 8Electronics 3 2 2 0 13 9 9 0Oil 7 4 4 4 35 20 20 20Other manufacturing 7 5 5 4 25 18 18 14Finance 4 3 3 0 6 5 5 0Trade & retail 3 2 1 0 8 6 3 0Other services 9 8 5 2 19 17 11 4F 2.29** 1.40 1.25 3.83***
By regionAsia 5 4 2 1 11 9 5 2Europe 26 17 14 7 28 18 15 8North America 10 9 7 3 10 9 7 3Developing 0 0 0 0 0 0 0 0F 5.36*** 2.14* 2.29* 1.22
*p < .10. **p < .05. ***p < .01.
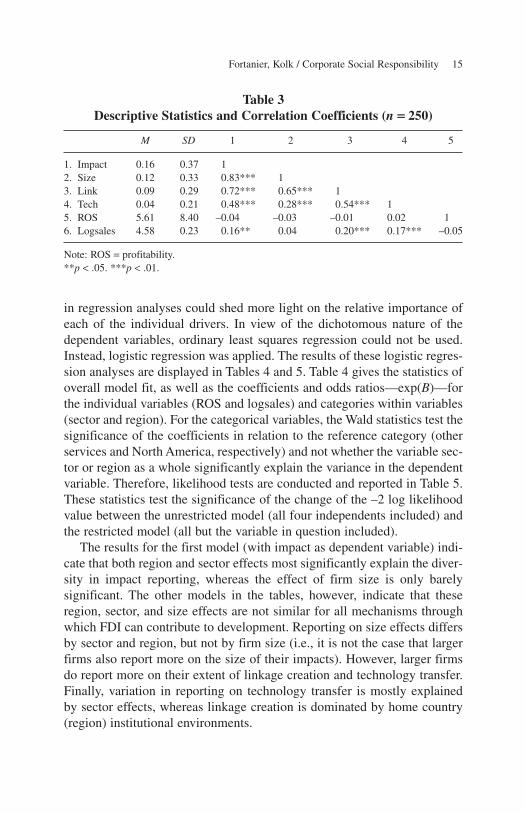
in regression analyses could shed more light on the relative importance ofeach of the individual drivers. In view of the dichotomous nature of thedependent variables, ordinary least squares regression could not be used.Instead, logistic regression was applied. The results of these logistic regres-sion analyses are displayed in Tables 4 and 5. Table 4 gives the statistics ofoverall model fit, as well as the coefficients and odds ratios—exp(B)—forthe individual variables (ROS and logsales) and categories within variables(sector and region). For the categorical variables, the Wald statistics test thesignificance of the coefficients in relation to the reference category (otherservices and North America, respectively) and not whether the variable sec-tor or region as a whole significantly explain the variance in the dependentvariable. Therefore, likelihood tests are conducted and reported in Table 5.These statistics test the significance of the change of the –2 log likelihoodvalue between the unrestricted model (all four independents included) andthe restricted model (all but the variable in question included).
The results for the first model (with impact as dependent variable) indi-cate that both region and sector effects most significantly explain the diver-sity in impact reporting, whereas the effect of firm size is only barelysignificant. The other models in the tables, however, indicate that theseregion, sector, and size effects are not similar for all mechanisms throughwhich FDI can contribute to development. Reporting on size effects differsby sector and region, but not by firm size (i.e., it is not the case that largerfirms also report more on the size of their impacts). However, larger firmsdo report more on their extent of linkage creation and technology transfer.Finally, variation in reporting on technology transfer is mostly explained by sector effects, whereas linkage creation is dominated by home country(region) institutional environments.
Fortanier, Kolk / Corporate Social Responsibility 15
Table 3Descriptive Statistics and Correlation Coefficients (n == 250)
M SD 1 2 3 4 5
1. Impact 0.16 0.37 12. Size 0.12 0.33 0.83*** 13. Link 0.09 0.29 0.72*** 0.65*** 14. Tech 0.04 0.21 0.48*** 0.28*** 0.54*** 15. ROS 5.61 8.40 –0.04 –0.03 –0.01 0.02 16. Logsales 4.58 0.23 0.16** 0.04 0.20*** 0.17*** –0.05
Note: ROS = profitability.**p < .05. ***p < .01.

16 Business & Society
Table 4Logistic Regressions (n = 250)
Impact **Size Link Tech
b Exp(B) b Exp(B) b Exp(B) b Exp(B)
Constant –9.31** 0.00 –2.56 0.08 –14.98*** 0.00 –20.37** 0.00(4.96) (0.32) (8.71) (6.32)
ROS 0.66 1.93 –0.22 0.80 1.16 3.18 2.99 19.83(0.07) (0.01) (0.16) (0.64)
Logsales 1.56* 4.77 0.13 1.14 2.72** 15.13 3.56** 35.15(2.98) (0.02) (6.2) (4.27)
Automotive –0.39 0.67 –0.27 0.76 –0.77 0.46 –10.16 0.00(0.27) (0.12) (0.60) (0.01)
Chemicals & pharmaceuticals 0.65 1.92 0.32 1.37 –0.37 0.69 0.80 2.23
(0.72) (0.16) (0.10) (0.36)Trade & retail –0.99 0.37 –1.25 0.29 –1.64 0.19 –9.15 0.00
(1.80) (2.21) (2.00) (0.02)Other
manufacturing 0.56 1.76 0.09 1.09 0.84 2.31 1.75* 5.78(0.84) (0.02) (1.35) (3.27)
Electronics –0.42 0.66 –0.68 0.51 –0.16 0.85 –9.46 0.00(0.28) (0.58) (0.03) (0.01)
Finance –1.60** 0.20 –1.52** 0.22 –1.29 0.28 –9.54 0.00(5.69) (4.37) (2.63) (0.03)
Oil 1.13 3.10 0.64 1.90 0.23 1.26 1.03 2.80(2.13) (0.62) (0.06) (0.76)
Asia 0.46 1.59 0.15 1.16 –0.23 0.79 1.18 3.26(0.49) (0.04) (0.06) (0.80)
Developing countries –6.72 0.00 –6.51 0.00 –5.74 0.00 –8.98 0.00
(0.17) (0.15) (0.12) (0.01)Europe 1.48*** 4.40 0.89* 2.44 0.98* 2.67 1.32 3.72
(10.57) (3.57) (3.28) (2.52)χ2(12) 41.40*** 19.83* 25.54** 35.92***–2 Log
likelihood 181.36 163.38 127.83 54.22Pseudo R2
(Nagelkerke) 0.26 0.15 0.21 0.44
Note: Wald statistics in parenthesis below the coefficients. ROS = profitability.*p < .10. **p < .05. ***p < .01.

Discussion and Conclusion
This article set out to explore how MNEs themselves account for theireconomic impact, thus, linking the still unresolved macro debates on theeconomic (and other) consequences of FDI for host countries to micro-level, firm-specific behaviors, following recent suggestions in this direction(Meyer, 2004). Partly driven by institutional and stakeholder pressures,firms are increasingly disclosing information about the social, environmen-tal, and very recently, economic implications of their activities in nonfi-nancial triple bottom line reports. Focusing on the three main mechanismsthrough which MNEs can affect host countries—size effects, structural(linkages) effects, and skill and technology transfer—we examined in detailwhat the 250 largest firms worldwide report on their economic impact. Wealso explored potential drivers of such reporting activities.
The detailed description of the contents of the reports shows that this isa new area not only for researchers but also for firms. Although more thana quarter of the Fortune Global 250 firms that disclosed nonfinancial infor-mation reported in some way on their economic impact, the variety of theissues discussed and the methods of measurement differed enormouslyacross firms. Still, some interesting results have been found.
First, quotes from firms’ reports provide a rich illustration of the sheersize of the impact on host (but also home) economies of even one singlefirm. Examples such as BT (2004), with direct and indirect employmenteffects of almost 2% of the workforce of a nation as large as the UnitedKingdom, or Alcoa (2004) accounting for 15% of a host country’s GDPillustrate how much an individual firm—and, hence, firm strategy—canshape macro-economic outcomes. Second, the detailed description ofprojects aimed at technology transfer or the creation of linkages with
Fortanier, Kolk / Corporate Social Responsibility 17
Table 5Likelihood Tests for Logistic Regressions: χχ2 Statistics
Variable (df) Impact Size Link Tech
ROS (1) 0.07 0.01 0.14 0.49Logsales (1) 2.95* 0.02 6.30** 4.56**Sector (7) 20.80*** 12.12* 10.91 26.45***Region (3) 19.42*** 8.77** 7.22* 4.59
Note: ROS = profitability.*p < .10. **p < .05. ***p < .01.

suppliers—and sometimes both at the same time—gives insight into not onlyhow such often rather abstract processes take place in practice but also howfirms themselves (can) benefit from these activities.
In addition, the analysis shows that firms tend to highlight individualexamples and projects rather than giving an overall insight into their impact(although some exceptions exist, such as Telefónica, 2004). This applies tonot only size effects but also activities related to technology transfer andlinkage creation. This may be because of the relative novelty of the subjectand the absence of information systems within firms to obtain and conse-quently disclose such data. Yet it also raises questions about the intentionsof firms for including such information in their nonfinancial reports, whichrelate to suspicions about such reports as merely “greenwashing” or “blue-washing” (cf. Ramus & Montiel, 2005). It is noteworthy, for example, thatthe oil industry is most active in impact reporting, whereas its practices areoften considered to be harmful for host-country development. In addition,it is likely that the examples presented in the reports are the best practicesor indeed “showcases” and that the consequences of MNE behavior are notalways so beneficial in other circumstances. The entire lack of informationon potentially negative impacts supports such concerns.
Finally, the exploration of drivers of reporting indicates that firms’domestic (regional) institutional context as well as sector dynamics explainreporting on impacts. Especially European firms seem active in reportingon their economic impact, from which firms in other regions can learn. Thelargest firms in the sample are also the ones most likely to give more spe-cific information on the individual mechanisms that we distinguished (inparticular technology transfer and linkage creation). Moreover, technologytransfer is mentioned particularly by manufacturing firms, whereas varia-tion in linkage creation is explained by region of origin rather than sector.If reporting is a reflection of actual impacts, then it might be suggested thatpolicy makers in host countries should try to attract large European firms,which are more likely to create linkages with local firms. And along thesesame lines, if policy makers are interested particularly in technology trans-fer, it seems better to focus on attracting firms to particular sectors, withmanufacturing firms being more important potential sources of knowledgethan, for example, service firms. However, because it is obviously doubtfulwhether self-reporting reflects actual behavior, what can be said at least isthat European firms are more open and transparent about their economicimpact, which shows a greater awareness. It also gives policy makers andother stakeholders better opportunities to approach these firms to discuss themechanisms through which they can contribute to economic development
18 Business & Society

and growth. As part of this dialogue, firms can also be requested to explic-itly report on particular aspects to show and reflect on impacts on hostcountries (e.g., when policy makers want to involve MNEs in policy alle-viation and other activities to further development).
Our findings show that a number of firms are reporting about economicimpact and the various mechanisms, and we have given some interestingexamples of how this is being done. This might inspire managers who wantto increase their accountability on these aspects and adapt their measure-ment and reporting systems accordingly. For researchers, such increased levels of reporting will be interesting as well. This study points to ways of assessing impacts at the micro level, although the data are still sparse and have several limitations, including the fact that they are self-reported.However, in view of the increasing pressure on firms to report, also exem-plified by the rise of reporting guidelines, it can be expected that more infor-mation will become available in the years to come. External verification ofreported data, which is increasing, especially on the part of European andalso Japanese firms (Kolk, 2005), may also mean that the reliability willimprove. If so, there will be ample opportunities for interesting furtherresearch into the impact of MNEs on host countries, with larger data sets thatalso allow for investigations of determinants and patterns over time.
References
ABB Group. (2004). ABB Group annual report 2003: Sustainability review. Zurich,Switzerland: Author.
Adams, C. A., Hill, W.-Y., & Roberts, C. B. (1998). Corporate social reporting practices inWestern Europe: Legitimating corporate behavior? British Accounting Review, 30, 1-21.
Aitken, B., & Harrison, A. (1999). Do domestic firms benefit from direct foreign investment?Evidence from Venezuela. American Economic Review, 89, 605-618.
Aitken, B., Harrison, A., & Lipsey, R. (1996). Wages and foreign ownership: A comparativestudy of Mexico, Venezuela and the United States. Journal of International Economics,40(3/4), 345-371.
Alcoa. (2004). 2003 Sustainability report. Pittsburgh, PA: Author.Alfaro, L., & Rodríguez-Clare, A. (2004). Multinationals and linkages: Evidence from Latin
America. Economia, 4(2), 113-170.Al-Tuwaijri, S., Christensen, T. E., & Hughes, K. E., II (2004). The relations among environ-
mental disclosure, environmental performance, and economic performance: A simultane-ous equations approach. Accounting, Organizations and Society, 29, 447-471.
Anderson, G. (2001, September). Spillovers from FDI and economic reform. Paper presentedat the Northeast Universities Development Consortium Conference, Boston.
Baldwin, R., Braconier, H., & Forslid, R. (1999). Multinationals, endogenous growth andtechnological spillovers: Theory and evidence (CEPR Discussion Paper No. 2155). London:Centre for Economic Policy Research.
Fortanier, Kolk / Corporate Social Responsibility 19

BASF Group. (2004). Corporate report 2003. Ludwigshafen, Germany: Author.Berthelot, S., Cormier, D., & Magnan, M. (2003). Environmental disclosure research: Review
and synthesis. Journal of Accounting Literature, 22, 1-44.Blomström, M., Globerman, S., & Kokko, A. (1999). The determinants of host country
spillovers from FDI: Review and synthesis of the literature (SSE/EFI Economics andFinance Working Paper No. 239). Stockholm: Stockholm School of Economics.
Blomström, M., & Wolff, E. (1994). Multinational corporations and productivity convergencein Mexico. In W. Baumol, R. Nelson, & E. Wolff (Eds.), Convergence of productivity:Cross-national studies and historical evidence (pp. 263-284). Oxford, UK: OxfordUniversity Press.
Borensztein, E., De Gregorio, J., & Lee, J.-W. (1998). How does FDI affect economic growth?Journal of International Economics, 45, 115-135.
BP. (2004). Sustainability report 2003: Defining our path. London: Author.BT. (2004). Social and environmental report. London: Author.Carkovic, M., & Levine, R. (2000). Does FDI accelerate economic growth? (Working Paper).
Minneapolis/St. Paul: University of Minnesota.Caves, R. (1996). Multinational enterprise and economic analysis. Cambridge, UK:
Cambridge University Press.Chapple, W., & Moon, J. (2005). Corporate social responsibility (CSR) in Asia: A seven-
country study of CSR web site reporting. Business & Society, 44(4), 415-441.Chung, W., Mitchell, W., & Yeung, B. (2003). Foreign direct investment and host country pro-
ductivity: The American automotive component industry in the 1980s. Journal ofInternational Business Studies, 34, 199-218.
Coca-Cola. (2004). Towards sustainability: Coca Cola citizenship report. Atlanta, GA: Author.Davidson, W., III, & Worrell, D. (2001). Regulatory pressure and environmental management
infrastructure and practices. Business & Society, 40(3), 315-342.De Mello, L. R. (1999). FDI-led growth: Evidence from time series and panel data. Oxford
Economic Papers, 51, 133-151.Djankov, S., & Hoekman, B. (1999). Foreign investment and productivity growth in Czech
enterprises. World Bank Economic Review, 14, 49-64.Dow Chemical. (2004). The Dow global public report 2003. Midland, MI: Author.ExxonMobil. (2004). Corporate citizenship report. Irving, TX: Author.Gray, R., Kouhy, R., & Lavers, S. (1995). Corporate social and environmental reporting: A
review of the literature and a longitudinal study of UK disclosure. Accounting, Auditingand Accountability Journal, 8(2), 47-77.
Haddad, M., & Harrison, A. (1993). Are there positive spillovers from direct foreign invest-ment? Evidence from panel data for Morocco. Journal of Development Economics, 42,51-74.
Harrison, A., & McMillan, M. (2003). Does direct foreign investment affect domestic creditconstraints? Journal of International Economics, 61(1), 73-100.
HBOS. (2004). Taking care of tomorrow: The HBOS corporate responsibility report 2004.Edinburgh, UK: Author.
Ito-Yokado (2004). Corporate social responsibility annual report 2003: We wish to remain atrusted company known for our integrity. Tokyo: Author.
Kawai, H. (1994). International comparative analysis of economic growth: Trade liberalisationand productivity. The Developing Economies, 17(4), 373-397.
Kokko, A. (1994). Technology, market characteristics and spillovers. Journal of DevelopmentEconomics, 43, 279-293.
20 Business & Society

Kokko, A., Tansini, R., & Zejan, M. (1996). Local technological capability and spillovers fromFDI in the Uruguayan manufacturing sector. Journal of Development Studies, 34, 602-611.
Kolk, A. (2005). Environmental reporting by multinationals from the triad: Convergence ordivergence? Management International Review, 45(1), 145-166.
Kolk, A., Van Tulder, R., & Westdijk, B. (2006). Poverty alleviation as business strategy?Evaluating commitments of frontrunner multinational corporations. World Development,34(5), 789-801.
Konings, J. (2000). The effect of direct foreign investment on domestic firms: Evidence fromfirm level panel data in emerging economies (CEPR Discussion Paper No. 2586). London:Centre for Economic Policy Research.
KPMG. (2005). KPMG international survey of corporate responsibility reporting 2005.Amsterdam: KPMG Global Sustainability Services.
Line, M., Hawley, H., & Krut, R. (2002). The development of global environmental and socialreporting. Corporate Environmental Strategy, 9(1), 69-78.
Liu, X., Parker, D., Vaidya, K., & Wei, Y. (2001). The impact of foreign direct investment onlabour productivity in the Chinese electronics industry. International Business Review, 10,421-439.
Maignan, I., & Ralston, D. A. (2002). Corporate social responsibility in Europe and the US:Insights from business self-representations. Journal of International Business Studies,33(3), 497-514.
Markusen, J. (1995). The boundaries of multinational enterprises and the theory of interna-tional trade. Journal of Economic Perspectives, 9, 169-189.
McIntyre, J., Narula, R., & Trevino, L. (1996). The role of export processing zones for hostcountries and multinationals: A mutually beneficial relationship? The International TradeJournal, 10(4), 435-466.
Mencinger, J. (2003). Does foreign direct investment always enhance economic growth?Kyklos, 56(4), 491-508.
Meyer, K. E. (2004). Perspectives on multinational enterprises in emerging economies.Journal of International Business Studies, 35, 259-276.
Neu, D., Warsame, H., & Pedwell, K. (1998). Managing public impressions: Environmentaldisclosures in annual reports. Accounting, Organizations and Society, 23(3), 265-282.
Organization for Economic Cooperation and Development. (1998). Open markets matter: Thebenefits of trade and investment liberalisation. Paris: Author.
Pemex. (2004). Report on sustainable development 2003. Mexico City, Mexico: Author.PepsiCo. (2004). Growth & trust: PepsiCo 2003. Purchase, NY: Author.Procter & Gamble. (2004). Linking opportunity with responsibility: Sustainability report
2004. Cincinnati, OH: Author.Ramírez, M. (2000). Foreign direct investment in Mexico, a cointegration analysis. Journal of
Development Studies, 37(1), 138-162.Ramus, C. A., & Montiel, I. (2005). When are corporate environmental policies a form of
greenwashing? Business & Society, 44(4), 377-414.Rasiah, R. (1994). Flexible production systems and local machine-tool subcontracting:
Electronics components transnationals in Malaysia. Cambridge Journal of Economics, 18,279-298.
Rodrik, D. (1999). Trade policy and economic growth: A skeptic’s guide to cross-national evi-dence (CEPR Discussion Paper No. 2143). London: Center for Economic Policy Research.
RWE. (2004). Corporate responsibility: Report 2003. Essen, Germany: Author.
Fortanier, Kolk / Corporate Social Responsibility 21
Sharfman, M., Shaft, T., & Tihanyi, L. (2004). A model of the global and institutionalantecedents of high-level corporate environmental performance. Business & Society, 43(1),6-36.
Shell. (2004). The Shell report 2003: Meeting the energy challenge—Our progress in con-tributing to sustainable development. The Hague, Netherlands/London: Author.
Sjöholm, F. (1997a). Technology gap, competition and spillovers from direct foreign invest-ment: Evidence from establishment data (SSE Working Paper Series in Economics andFinance No. 211). Stockholm: Stockholm School of Economics.
Sjöholm, F. (1997b). Productivity growth in Indonesia: The role of regional characteristics anddirect foreign investment. Economic Development and Cultural Changes, 47, 559-584.
Smarzynska, B. (1999). Technological leadership and foreign investors’ choice of entry mode(World Bank Policy Research Working Paper No. 2314). Washington, DC: World Bank.
Telefónica (2004). Corporate responsibility annual report 2003. Madrid, Spain: Author.Unilever. (2004). Summary social review: 2003: Listening, learning, update on progress.
Rotterdam, Germany/London: Author.United Nations Economic Commission for Europe. (2001). Economic survey of Europe,
No. 1. Geneva, Switzerland: Author.Vivendi Universal. (2004). Sustainable development report 2003: Our economic, social and
environmental responsibility. Paris: Author.Xu, B. (2000). Multinational enterprises, technology diffusion, and host country productivity
growth. Journal of Development Economics, 62, 477-493.
Fabienne Fortanier is a PhD candidate at the University of Amsterdam Business School,Netherlands. Her research interests focus on the interaction between multinational enterprisesand host governments in developing countries and the impact of business-government inter-actions on economic growth and sustainable development (e-mail: [email protected];http://www.abs.uva.nl/pp/ffortanier).
Ans Kolk is professor of sustainable management and research director of the University of Amsterdam Business School, Netherlands. Her areas of research and publications are incorporate social responsibility and environmental management, especially in relation to thestrategy, organization, and disclosure of international business firms, and international policy(e-mail: [email protected]; http://www.abs.uva.nl/pp/akolk).
22 Business & Society