Embed Size (px)
Citation preview
On-line Performance Monitoring and Diagnostics for Large Combined Cycle Power Plant
B. Chudnovsky, Israel Electric Corporation (IEC) Engineering Division, POB 10, Haifa, Israel, 31000, Phone 97248182749,
A. Talanker, Israel Electric Corporation (IEC) Engineering Division, POB 10, Haifa, Israel, 31000, Phone 97248182768, [email protected]
L. Levin, Israel Electric Corporation (IEC) Engineering Division, POB 10, Haifa, Israel, 31000, Phone 97248182767, [email protected]
V. Mankovsky, Israel Electric Corporation (IEC) Engineering Division, POB 10, Haifa, Israel, 31000, Phone 97248182788, [email protected]
A. Kunin, Israel Electric Corporation (IEC) Engineering Division, POB 10, Haifa, Israel, 31000, Phone 97248182718, [email protected]
ABSRACT
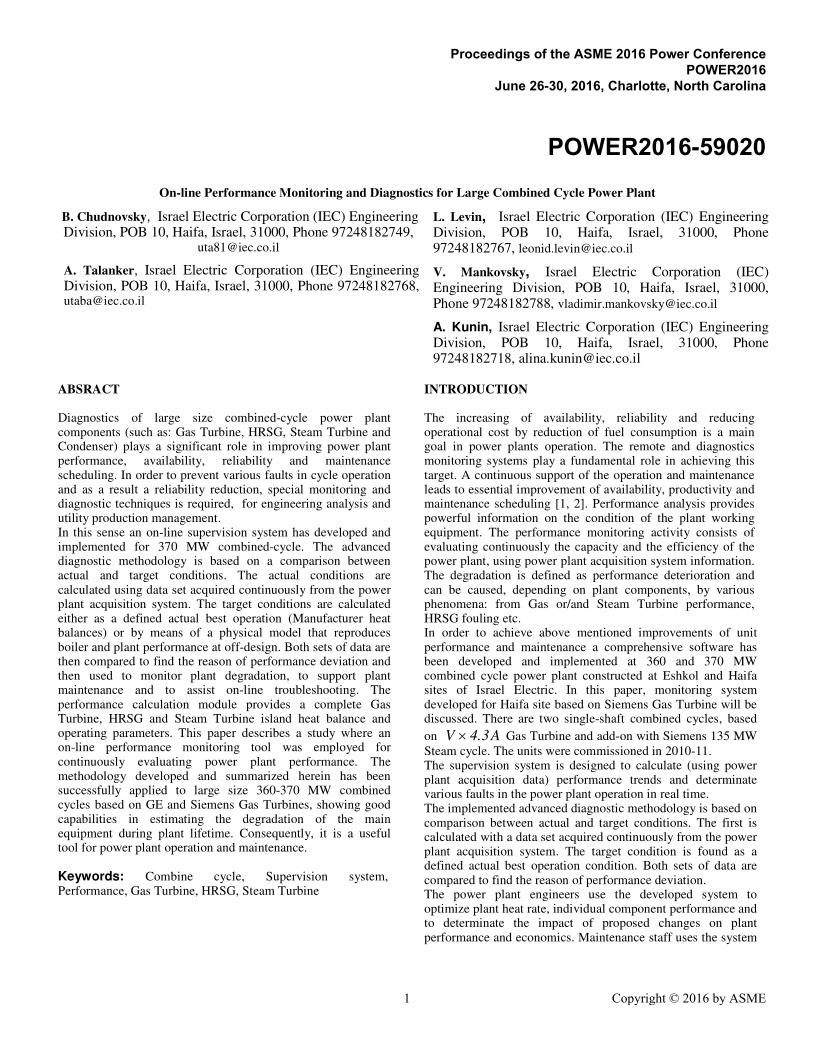
Diagnostics of large size combined-cycle power plant components (such as: Gas Turbine, HRSG, Steam Turbine and Condenser) plays a significant role in improving power plant performance, availability, reliability and maintenance scheduling. In order to prevent various faults in cycle operation and as a result a reliability reduction, special monitoring and diagnostic techniques is required, for engineering analysis and utility production management. In this sense an on-line supervision system has developed and implemented for 370 MW combined-cycle. The advanced diagnostic methodology is based on a comparison between actual and target conditions. The actual conditions are calculated using data set acquired continuously from the power plant acquisition system. The target conditions are calculated either as a defined actual best operation (Manufacturer heat balances) or by means of a physical model that reproduces boiler and plant performance at off-design. Both sets of data are then compared to find the reason of performance deviation and then used to monitor plant degradation, to support plant maintenance and to assist on-line troubleshooting. The performance calculation module provides a complete Gas Turbine, HRSG and Steam Turbine island heat balance and operating parameters. This paper describes a study where an on-line performance monitoring tool was employed for continuously evaluating power plant performance. The methodology developed and summarized herein has been successfully applied to large size 360-370 MW combined cycles based on GE and Siemens Gas Turbines, showing good capabilities in estimating the degradation of the main equipment during plant lifetime. Consequently, it is a useful tool for power plant operation and maintenance. Keywords: Combine cycle, Supervision system, Performance, Gas Turbine, HRSG, Steam Turbine
INTRODUCTION
The increasing of availability, reliability and reducing operational cost by reduction of fuel consumption is a main goal in power plants operation. The remote and diagnostics monitoring systems play a fundamental role in achieving this target. A continuous support of the operation and maintenance leads to essential improvement of availability, productivity and maintenance scheduling [1, 2]. Performance analysis provides powerful information on the condition of the plant working equipment. The performance monitoring activity consists of evaluating continuously the capacity and the efficiency of the power plant, using power plant acquisition system information. The degradation is defined as performance deterioration and can be caused, depending on plant components, by various phenomena: from Gas or/and Steam Turbine performance, HRSG fouling etc. In order to achieve above mentioned improvements of unit performance and maintenance a comprehensive software has been developed and implemented at 360 and 370 MW combined cycle power plant constructed at Eshkol and Haifa sites of Israel Electric. In this paper, monitoring system developed for Haifa site based on Siemens Gas Turbine will be discussed. There are two single-shaft combined cycles, based
on A3.4V × Gas Turbine and add-on with Siemens 135 MW
Steam cycle. The units were commissioned in 2010-11. The supervision system is designed to calculate (using power plant acquisition data) performance trends and determinate various faults in the power plant operation in real time. The implemented advanced diagnostic methodology is based on comparison between actual and target conditions. The first is calculated with a data set acquired continuously from the power plant acquisition system. The target condition is found as a defined actual best operation condition. Both sets of data are compared to find the reason of performance deviation. The power plant engineers use the developed system to optimize plant heat rate, individual component performance and to determinate the impact of proposed changes on plant performance and economics. Maintenance staff uses the system
Proceedings of the ASME 2016 Power Conference POWER2016
June 26-30, 2016, Charlotte, North Carolina
POWER2016-59020
1 Copyright © 2016 by ASME

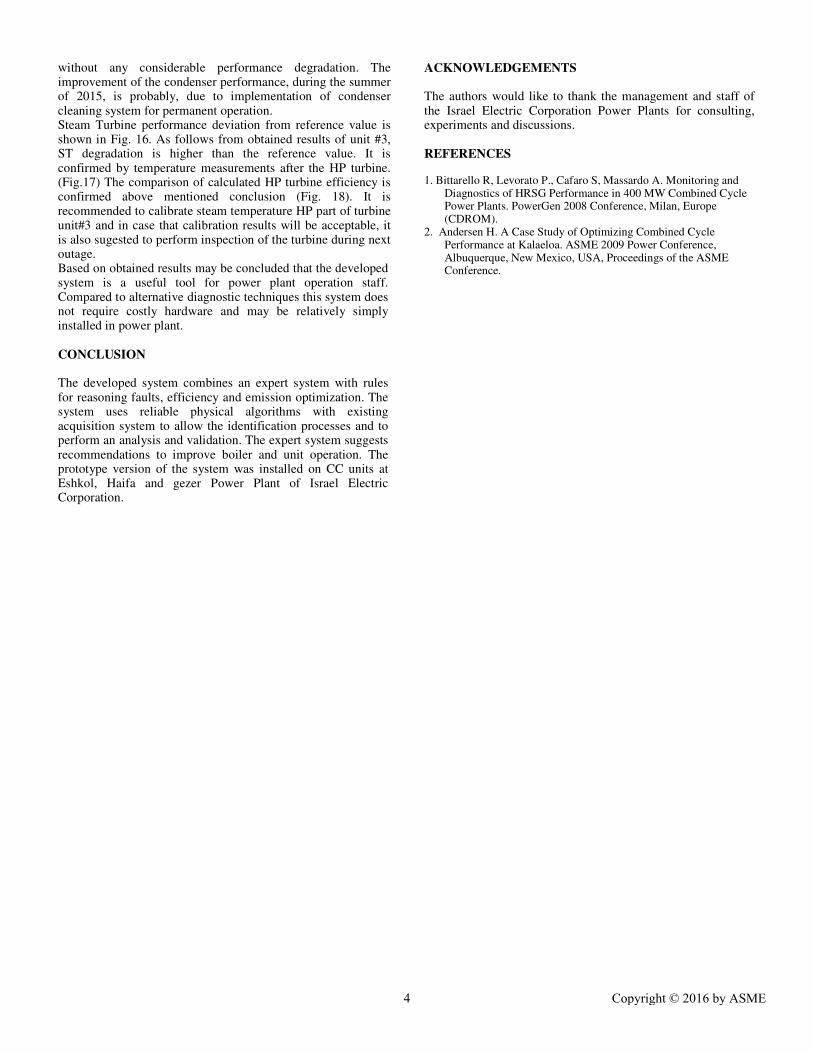
to determinate maintenance objects and to verify the effectiveness of maintenance actions. Operational staff uses the proposed system to monitor deviations of key parameters from target values and predict unit response to proposed operation changes. REFERENCE COMBINED CYCLE The type of the discussed power plant is a single shaft combined cycle, producing around 373 MW (net), based on Siemens Gas Turbine, a three level HRSG, a Steam Turbine with 3 pressure expansion and water cooled condenser as shown in Fig.1. It should be indicated that the unit operated after commissioning on LFO (light few oil), however currently (more than two years) it is operated on Natural Gas. Gas Turbine The Gas Turbine is a heavy duty, axial gas turbine, operating at 50 Hz. The gas turbine designed for Natural Gas firing (light oil#2 is back-up fuel) and its nominal power at 26° C ambient temperature and NG firing is approximately 238 MW.
HRSG The HRSG produces superheated steam at 3 pressure levels: 125 bara, 32 bara, 4.4 bara. Being the cycle reheated, there is also a reheater between the first and second high pressure superheaters.
Steam Turbine The Steam generated in HRSG is sent to a Steam Turbine, composed by two groups: high pressure steam turbine and middle-low pressure steam turbine. It is coupled with 50 Hz generator and the rotating speed is 3000 rpm; the nominal power is approximately 135 MW, while the main steam admission to HP turbine with following parameters: pressure 125 bara and temperature 566 °C.
Condenser The exhaust steam from the steam turbine directed to sea water once through cooled condenser. UNIT OPERATION REFERENCE DATA
DEVELOPMENT AND METHODOLOGY EMPLOYED With respect to the purpose of reference data calculation, the following methodology is employed:
• GT reference conditions are defined based on correction curves
• HRSG reference condition corresponds to operation with clean pressure parts and maximum allowable capacity of current GT exhaust temperature and flue gas flow
• Steam cycle reference condition corresponds to HRSG designed steam capacity and designed pressure in water cooled condenser at current cooling water temperature; The obtained reference data represent available equipment performance and referred as “standard equipment
characteristics” therefore, capacity calculated using standard characteristic is referred as “standard capacity”. The calculation procedure of unit standard capacity and losses is described herein: 1. The Gas Turbine performance data transferred from the
plant DCS, with the Turbine in steady state condition and corrected by ambient condition to calculate reference capacity and efficiency.
2. There are significant difficulties to carry out the steam
turbine island performance calculation. It is unfeasible; to apply the standard efficiency definition since fuel is not fired in steam cycle. Therefore, Gas Turbine efficiency decreasing will lead to Steam Turbine load increasing and it will partially compensate the Gas Turbine load decreasing. Due to this reason, the Steam Turbine Gross output is selected as reference value for steam cycle performance evaluation. It should be noted, that the proposed system is supervision system that uses continuously power plant acquisition system, and not integrated in the combined cycle DCS system. The evaluation is performed as comparison of the following steam cycle operation condition:
Stage 0
ST reference load
a) Actual Fuel consumption – measured
b) Corresponding to fuel consumption reference
Unit load (Heat Balance) c) Ambient temperature Measured reference unit
based load d) Derivation unit load/base load + Ambient temperature
O2% content reference (HB)
Clean HRSG Model Reference Steam flows PEPSE MODEL N1 ST_load_N0 GT Reference load = Unit power reference - ST_load_N0
Stage 1
ST load for actual GT and Clean HRSG
a) Actual fuel consumption – measured b) Actual O2% content
Clean HRSG Model Steam flows PEPSE MODEL N1 ST_load_N1 (Actual sea water temperature)
Stage 2
ST load for actual GT and actual HRSG
a) Actual Steam parameters and flows (from measurement)
PEPSE MODEL N1 ST_load_N2 (Actual sea water temperature)
2 Copyright © 2016 by ASME
∆HRSG LOAD = ST_load_N1 - ST_load_N2
Stage 3
ST load for actual GT, actual HRSG and real
condenser
a) Actual Steam parameters and flows (from measurement)
PEPSE MODEL N2 ST_load_N3 (Actual pressure in condenser)
∆Condenser LOAD = ST_load_N2 - ST_load_N3 Stage 4
Actual ST
a) Actual Steam parameters and flows (from measurement)
PEPSE MODEL N3 ST_load_N4
∆STEAM TURBINE LOAD = ST_load_N3 - ST_load_N4 DESCRIPTION OF THE SYSTEM The basic functional aim of the system is to quantify the performance of the process (of all unit and its elements) in real time, reporting continuously on the controlled parameters deviations from their reference values. As typical real time system, also the proposed herein consists of data acquisition module, data validation module, on-line interfaces system, calculation modules and data storage module. Three most important and relatively independent calculations modules comprise the system:
• GT Turbine performance calculation;
• HRSG performance calculation;
• Steam Turbine island performance calculation.
The information submitted by system is as follows:
• GT characteristics (load, efficiency, heat rate, exhaust gas flow rate, GT inlet temperature, emissions, exhaust temperature).
• HRSG characteristics (performance of each pressure part section including steam and flue gas temperature, cleanliness factors, flue gas pressure drop).
• ST island characteristics (load, steam and feed water flows, temperature, unit heat rate, condenser performance data).
• Emission data obtained from existing emission monitoring and from developed model.
The developed system uses power plant PI data base, as data acquisition system. The GT module is intended for turbine
efficiency and heat rate calculation. The exhaust flue gas flow calculation based on the measured oxygen content, fuel flow rate and its composition. The HRSG module is based on developed in house algorithm, which provides on-line heat duty and cleanliness factor for each monitoring stage. The computational code is developed based on the continuity and the energy equation at steady state. Once all the temperature values of the gas and steam along the HRSG are known, the "actual" effectiveness of each heat exchanger can be derived. The effectiveness of a generic pressure part is defined as a ratio between the real heat duty and theoretical maximum in the ideal heat transfer condition (without fouling).
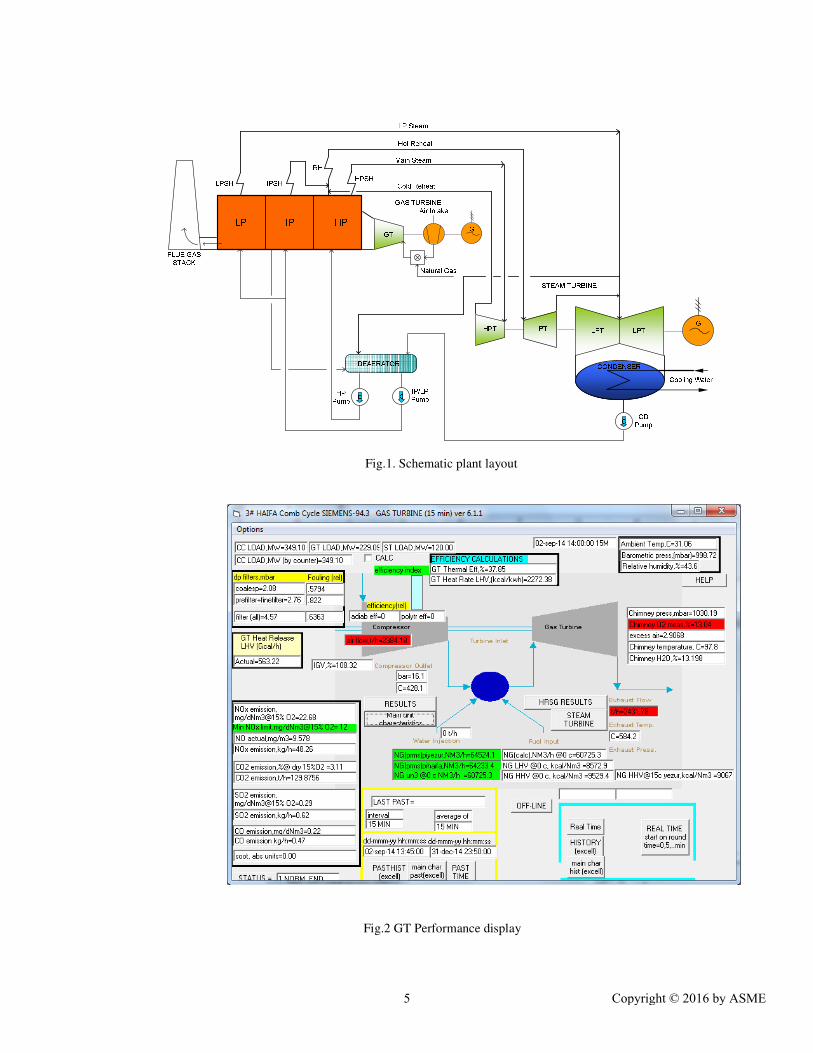
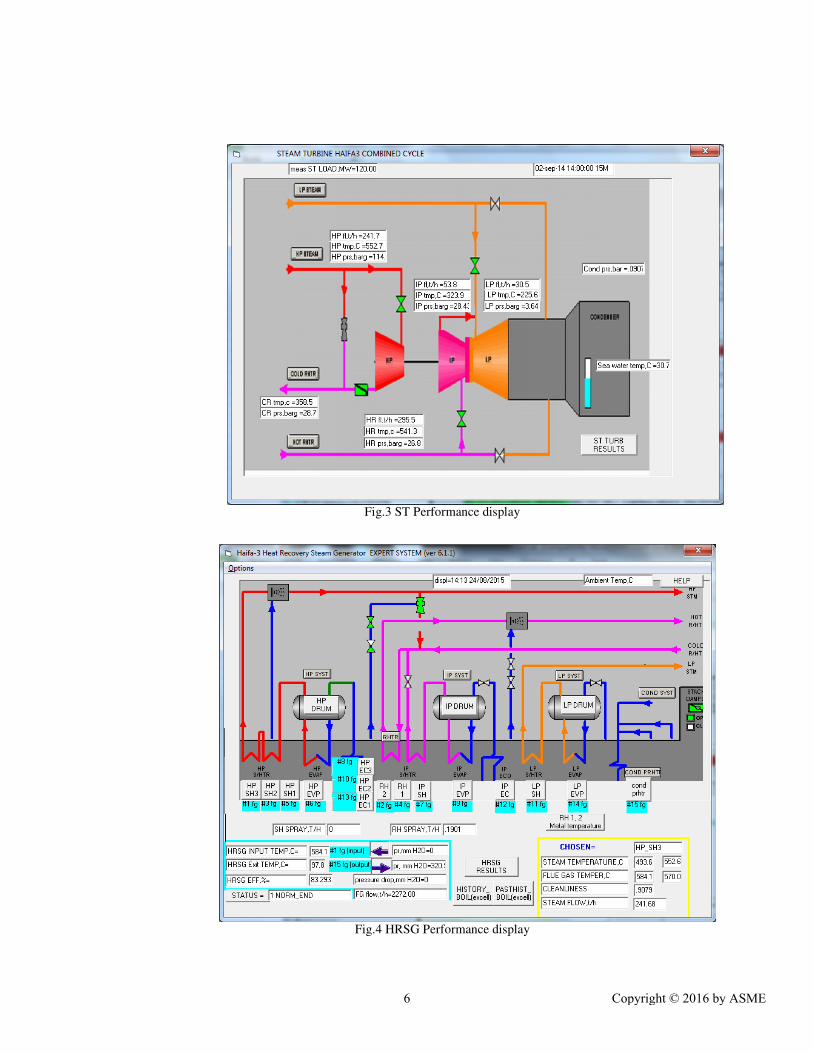
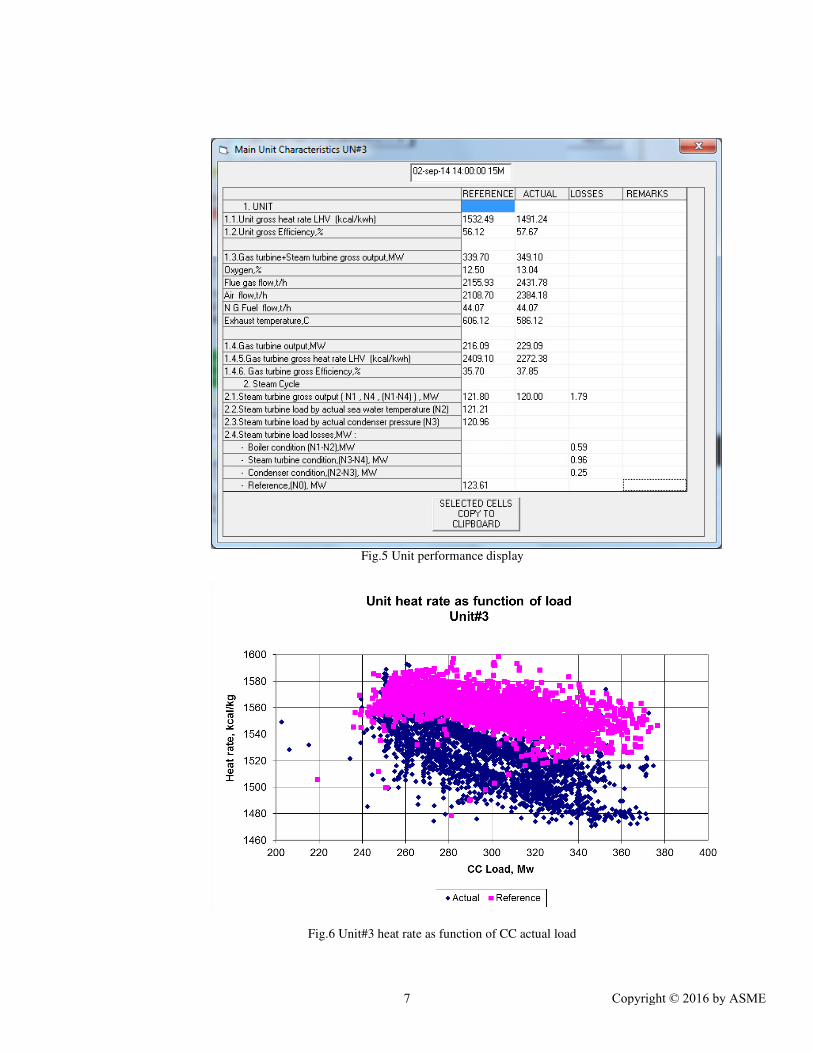
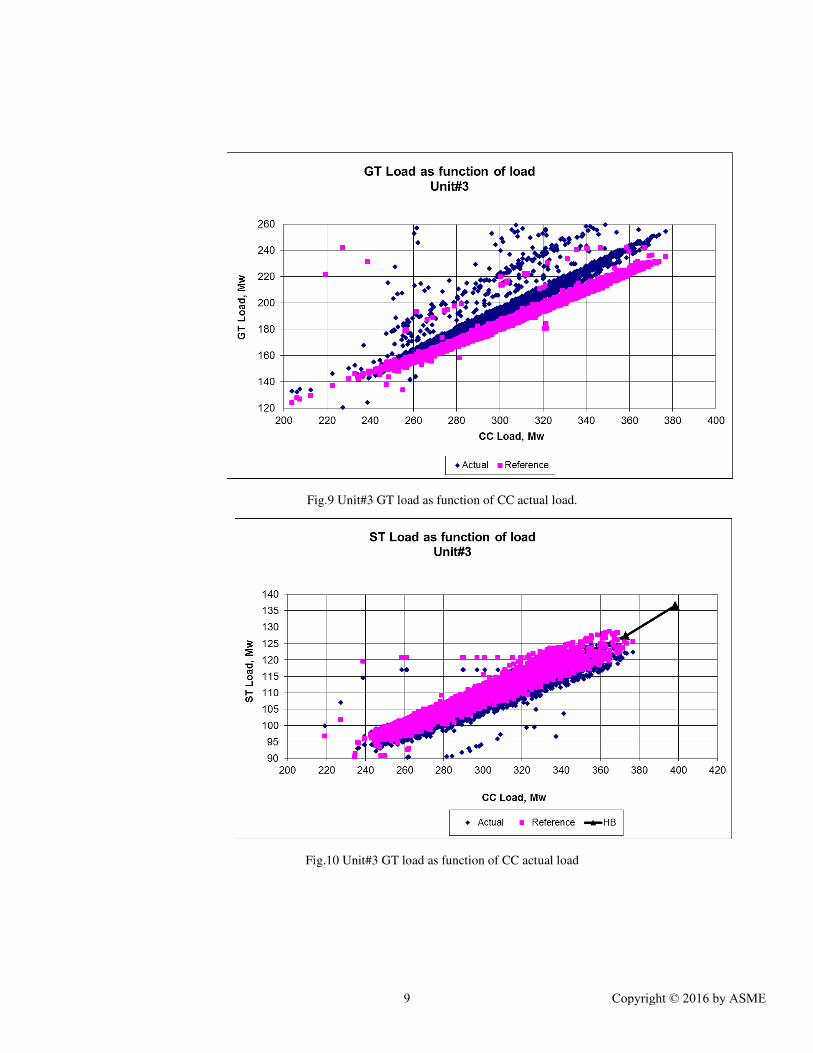
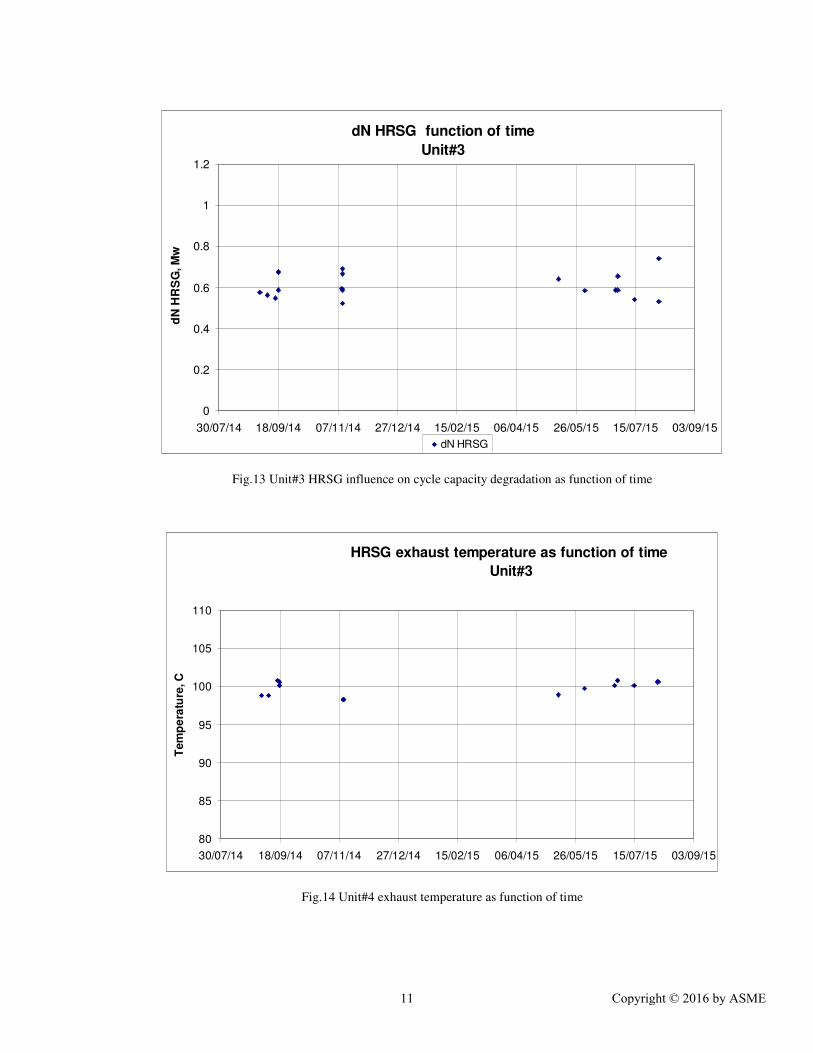
THE SYSTEM APPLICATION RESULTS On-line supervision system is able to determine Gas and Steam Turbine capacity deviation and the reason of this deviation, HRSG heat losses, pressure parts cleanliness and heat duty in real time. All the data both measured and calculated are saved and can be represented on suitable displays. The displays depict GT, HRSG and ST performance are presented in Fig. 2-5. On GT display (Fig.2) shown main Gas Turbine parameters, including efficiency, heat rate and emissions characteristics. ST main performance data is shown in Fig.3. HRSG performance data are presented in Fig. 4. Unit performance data are presented in display Fig.5. The generalization of the obtained data during CC continuous operation is presented in Fig. 6-8. The comparison of reference and actual heat rate is shown in Fig. 6. As can be seen from the presented data actual heat rate is exceeded reference value for both units. It should be noted that GT actual performance very different from design (reference) data. The comparison of GT exhaust temperature and flue gas flow for both units is shown in Fig. 7, 8. As can be seen from presented data the actual exhaust temperature considerably lower than design value, however flue gas flow much higher (It should be indicated here, that further reduction of GT exhaust temperature may cause to unstable GT operation at DLN mode). As result GT actual capacity is higher than design value (Fig. 9). At the same time ST actual capacity is slightly less than design (Fig.10). However, total CC actual capacity is higher than design (Fig.11) and as result actual heat rate is lower than the design. Below is presented comparison of actual and reference data at base load at steady state conditions. The performed analysis shows that unit#4 compressor efficiency is lower than unit#3. Besides that it is found degradation of compressor efficiency at both units during the analyzed period. However, unit#3 efficiency after repair was improved. Compressor efficiency trends are shown in Fig.12. Analysis of HRSG performance degradation/improvement is shown in Fig. 13. As can be seen from presented data, there isn't any HRSG performance degradation during analyzed period. The constant difference is, probably, result of calculation model accuracy. The obtained results are confirmed by pressure parts fouling data (the fouling does not change during the year and HRSG exhaust temperature trends (Fig. 14). The condenser performance impact on cycle capacity versus time is presented in Fig. 15. As can be seen from the presented data condenser operation during the year was acceptable
3 Copyright © 2016 by ASME
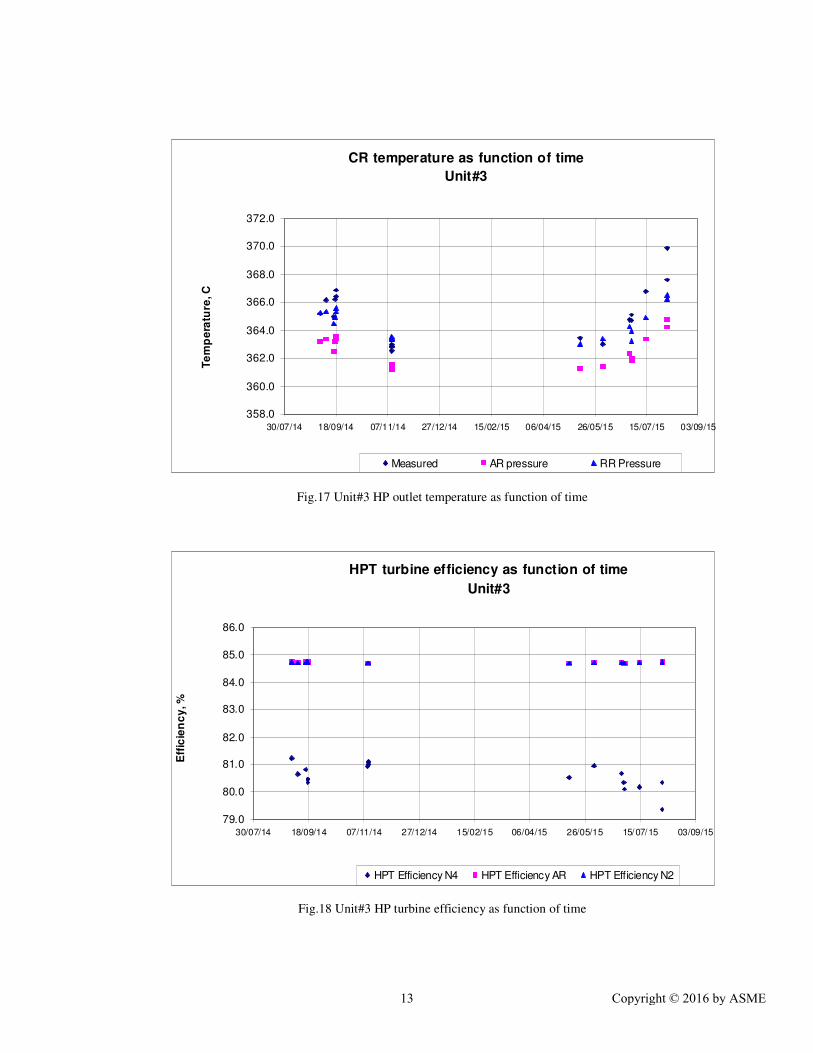
without any considerable performance degradation. The improvement of the condenser performance, during the summer of 2015, is probably, due to implementation of condenser cleaning system for permanent operation. Steam Turbine performance deviation from reference value is shown in Fig. 16. As follows from obtained results of unit #3, ST degradation is higher than the reference value. It is confirmed by temperature measurements after the HP turbine. (Fig.17) The comparison of calculated HP turbine efficiency is confirmed above mentioned conclusion (Fig. 18). It is recommended to calibrate steam temperature HP part of turbine unit#3 and in case that calibration results will be acceptable, it is also sugested to perform inspection of the turbine during next outage. Based on obtained results may be concluded that the developed system is a useful tool for power plant operation staff. Compared to alternative diagnostic techniques this system does not require costly hardware and may be relatively simply installed in power plant.
CONCLUSION
The developed system combines an expert system with rules for reasoning faults, efficiency and emission optimization. The system uses reliable physical algorithms with existing acquisition system to allow the identification processes and to perform an analysis and validation. The expert system suggests recommendations to improve boiler and unit operation. The prototype version of the system was installed on CC units at Eshkol, Haifa and gezer Power Plant of Israel Electric Corporation.
ACKNOWLEDGEMENTS
The authors would like to thank the management and staff of the Israel Electric Corporation Power Plants for consulting, experiments and discussions.
REFERENCES 1. Bittarello R, Levorato P., Cafaro S, Massardo A. Monitoring and Diagnostics of HRSG Performance in 400 MW Combined Cycle Power Plants. PowerGen 2008 Conference, Milan, Europe (CDROM). 2. Andersen H. A Case Study of Optimizing Combined Cycle Performance at Kalaeloa. ASME 2009 Power Conference, Albuquerque, New Mexico, USA, Proceedings of the ASME Conference.
4 Copyright © 2016 by ASME
ME
Fig.1. Schematic plant layout
Fig.2 GT Performance display
5 Copyright © 2016 by ASME
ME
Fig.3 ST Performance display
Fig.4 HRSG Performance display
6 Copyright © 2016 by ASME
ME
Fig.5 Unit performance display
Fig.6 Unit#3 heat rate as function of CC actual load
7 Copyright © 2016 by ASME

ME
Fig.7 Unit#3 exhaust temperature as function of CC actual load.
Fig.8 Unit#3 exhaust flue gas flow as function of CC actual load.
8 Copyright © 2016 by ASME
ME
Fig.9 Unit#3 GT load as function of CC actual load.
Fig.10 Unit#3 GT load as function of CC actual load
9 Copyright © 2016 by ASME

ME
Unit load as function of time
Unit#3
320
325
330
335
340
345
350
355
360
365
370
375
380
10/6/14 30/7/14 18/9/14 7/11/14 27/12/14 15/2/15 6/4/15 26/5/15 15/7/15 3/9/15Time
Lo
ad
, M
w
Actual
Reference
Fig.11 Unit#3 CC load as function of time
Comparison of compressor polytropic relative efficiency as
function of time
Unit#3&4
0.96
0.97
0.98
0.99
1.00
10/06/14 30/07/14 18/09/14 07/11/14 27/12/14 15/02/15 06/04/15 26/05/15 15/07/15 03/09/15
Eff
icie
nc
y, %
Unit#4 Unit#4 Unit#3 Unit#3
Fig.12 Unit#3, 4 compressor efficiency as function of time
10 Copyright © 2016 by ASME
ME
dN HRSG function of time
Unit#3
0
0.2
0.4
0.6
0.8
1
1.2
30/07/14 18/09/14 07/11/14 27/12/14 15/02/15 06/04/15 26/05/15 15/07/15 03/09/15
dN
HR
SG
, M
w
dN HRSG
Fig.13 Unit#3 HRSG influence on cycle capacity degradation as function of time
HRSG exhaust temperature as function of time
Unit#3
80
85
90
95
100
105
110
30/07/14 18/09/14 07/11/14 27/12/14 15/02/15 06/04/15 26/05/15 15/07/15 03/09/15
Te
mp
era
ture
, C
Fig.14 Unit#4 exhaust temperature as function of time
11 Copyright © 2016 by ASME

ME
dN Condenser function of time Unit# 3
-0.4
-0.2
0
0.2
0.4
0.6
0.8
1
1.2
30/07/14 18/09/14 07/11/14 27/12/14 15/02/15 06/04/15 26/05/15 15/07/15 03/09/15
dN
Co
nd
en
se
r, M
w
dN Condenser
Fig.15 Unit#3 condenser performance influence on cycle capacity degradation as
function of time
dN ST function of time
Unit#3
-2
-1.5
-1
-0.5
0
0.5
1
1.5
2
30/07/14 18/09/14 07/11/14 27/12/14 15/02/15 06/04/15 26/05/15 15/07/15 03/09/15dN
ST
Mw
dN ST
Fig.16 Unit#3 ST performance influence on cycle capacity degradation as
function of time
12 Copyright © 2016 by ASME
ME
CR temperature as function of time
Unit#3
358.0
360.0
362.0
364.0
366.0
368.0
370.0
372.0
30/07/14 18/09/14 07/11/14 27/12/14 15/02/15 06/04/15 26/05/15 15/07/15 03/09/15
Te
mp
era
ture
, C
Measured AR pressure RR Pressure
Fig.17 Unit#3 HP outlet temperature as function of time
HPT turbine efficiency as function of time
Unit#3
79.0
80.0
81.0
82.0
83.0
84.0
85.0
86.0
30/07/14 18/09/14 07/11/14 27/12/14 15/02/15 06/04/15 26/05/15 15/07/15 03/09/15
Eff
icie
nc
y, %
HPT Efficiency N4 HPT Efficiency AR HPT Efficiency N2
Fig.18 Unit#3 HP turbine efficiency as function of time
13 Copyright © 2016 by ASME