Embed Size (px)
Citation preview

GENETIC ANALYSIS OF A POPULATION OF TRIBOLIUM. VI. POLYMORPHISM AND DEMOGRAPHIC EQUILIBRIUM
A. M. MOFFAl AND R. F. COSTANTINO
Department of Zoology, University of Rhode Island, Kingston, Rhode Island 02881
Manuscript received April 19, 1977 Revised copy received August 2, 1977
ABSTRACT
Demographic and genetic data of continuously growing populations of Tribolium casianeum initiated with identical age structures but with different frequencies of the unsaturated fatty acid-sensitive allele were collected for 68 weeks.-The life history data provided the following insights: Genotypic dif- ferences for total number of offspring were due primarily to larval viability. The total lifetime offspring production of the genotypes predicted a stable polymorphic genetic equilibrium. The genotypic reproductive functions fore- cast that a stable age structure was not a prerequisite for genetic equilibrium.- Those cultures initially segregating for the unsaturated fatty acid-sensitive allele converged to an equilibrium allele frequency of 0.25 and a genotypic array composed of equal numbers of +/+ and +/cos individuals.-The num- bers of larvae, pupae and adults during the first six weeks were quadratic functions of the initial frequency of the sensitive allele. Qualitative age struc- ture changes that followed were similar in all cultures and demographic equilibrium was realized at week 50. The overall demographic pattern during the 68-week study was interpreted in terms of the interactions among the numbers of small larvae, large larvae plus pupae, and adults.
ELECTION in an age-structured population with overlapping generations has been examined in a number of recent theoretical papers ( CHARLESWORTH
1970, 1972, 1973, 1974; CHARLESWORTH and CHARLESWORTH 1973; CHARLES- WORTH and GIESEL 1972a, 1972b; ANDERSON and KING 1970; KING and ANDER- SON 1971 and DEMETRIUS 1974, 1975a,b, 1977). These investigations provide a framework for the interpretation of empirical studies; an example is the projec- tion by CHARLESWORTH (1972) that a stable age structure is, in general, a pre- requisite for the existence of a polymorphic genetic equilibrium.
The present paper is focused on the relationship between the demographic and genetic structure of continuously growing populations using the Tribolium population model (NEYMAN, PARK and SCOTT 1956; BELL 1969; MERTZ 1972; KING and DAWSON 1972; COSTANTINO 1974). The design of the experiment cen- ters on cultures initiated with identical age structures but with different fre- quencies of the unsaturated fatty acid-sensitive allele ( COSTANTINO, BELL and ROGLER 1967, 1968; COSTANTINO, MUMMA and BRUSZEWSKI 1970; COSTANTINO
Present address. Department of Biology, West Virginia University, Morgantown, West Virginia 26506.
Genetics 87: 785-805 December, 1977.
786 A. M . MOFFA A N D K. F. C O S T A N T I N O
and ROWE 1972; SCULLY and COSTANTINO 1975). We are concerned with (i) population projections (e.g., genetic equilibrium, rate of convergence to the stable age distribution, etc.) based on the analyses of life history data, (ii) the nature of the genetic equilibrium at the unsaturated fatty-acid-sensitive locus, (iii) the impact of the different initial allele frequencies on the numbers of larvae, pupae and adults, and (iv) the approach to and properties of the demog- raphic equilibrium.
MATERIALS A N D METHODS
Two genetically related strains of the flour beetle Tribolium castaneum Herbst were used: one strain was a genetically heterogenous wild type (Purdue Foundation) and the other, derived from the first by laboratory selection (YAMADA and BELL 1969), was homozygous for the corn- oil-sensitive (cos) mutation (COSTANTINO, BELL and ROGLER 1967). Throughout this paper we refer to these strains as +/+ and cos/cos; +/cos is used to designate interstrain crosses. Experi- mental lines were labelled using allele frequency at the cos locus. Other loci are likely to be segregating in these lines, so that we can not attribute all observed effects to this one locus. All animals were cultured in chambers maintained at 33 +- 1 ', 42 & 6% relative humidity and grown on standard medium (pexentage composition: 95% wheat flour and 5% dried brewers yeast) or on corn oil medium (percentage composition: 90% wheat flour, 5% dried brewers yeast and 5% liquid corn oil) using standard Tribolium techniques.
Life history data Adult mortality schedules for each genotype were obtained by culturing 200 newly emerged adults on 50 grams of corn oil medium. The cultures were changed every 2 weeks for a period of 18 weeks and the number of live and dead adults recorded.
Egg production for thirty single-pair matings of each genotype was recorded at the end of one week and thereafter every 2 weeks for 14 weeks by setting each pair on fresh corn oil medium and collecting the eggs produced during a 24 hr interval.
Time to pupation and time to the adult stage were measured for the +/+, +/cos and cos/cos genotypes by placing 25 eggs of each genotype into 30 creamers containing corn oil media and counting two creamers daily from 15 to 30 days after egg laying. The total number of animals present for a given lifestage was recorded.
The 68-week study. Genetic and demographic relationships were examined in 11 experi- mental treatments in which the initial cos allele frequency ranged from 0 to 1 in increments of 0.1. Five replicates were maintained for each of the initial allele frequencies 1, 0.9, 0.8, 0.7, 0 6, 0.5; three replicates were maintained for each of the allele frequencies 0.4, 0.3, 0 2, 0.1, 0.0. The initial genotypic arrays were constructed from combinations of the +/+ and COS/COS
homozygotes; the initial demographic array consisted of 10 newly emerged adult females and 10 newly emerged adult males. Each population was grown on 20 g of corn oil medium, which was changed every two weeks. The numbers of small and large larvae, pupae, and adults were counted every two weeks for 68 weeks. In addition, at week 52 and at week 68 both the fre- quency of the sensitive allele and the genotypic array were estimated in the 0.9, 0.7, 0.5, 0.3 and 0.1 ccltures.
Genetic polymorphism. In a separate experiment, conducted identically to the above "68- week" study, allele frequency and the genotypic array were estimated in 12 replicates for each initial allele frequency of 0 9, 0.7, 0.5, 0.3, and 0.1. To assure independence of samples, three replicates from each initial frequency were sampled at 2, 6 , I2 and 16 weeks. At these four times, 50 larvae were removed from each culture, placed on standard medium in 75 i- 3% 1 elative humidity, allowed to pupate, then sexed, and backcrossed to cos homozygotes. Eggs collected from these matings were set on corn oil medium in 42 & 6% relative humidity and the number of subsequent pupae and adults were counted. The ratio of animals recovered to eggs introduced was calculated. A value of approximately 0.85 indicated that the backcross larva was of the +/+ genotype; a value of 0.45 indicated that the unknown individual was of the + / c o s genotype and a value of 0.10 pointed to the larva as of the cos/cos genotype. Five percent of the

GENETICS A N D DEMOGRAPHY OF TRIBOLIUM 78 7
Crosses resulted in no animals being recovered and were discarded. Allele frequencies and the genotypic arrays were estimated based on the results of three replicates of 50 individuals each.
RESULTS
Life history data The life history information (Table 1) indicates that for the cos/cos genotype,
compared to the +J+ and +/cos genotypes (see Table 2 for statistical analyses), larval viability is reduced, days to pupation and adulthood are extended and egg production in a 24 hr interval is lower. A comparison of these criteria for the +/I- and +/cos genotypes reveals meaningful differences in egg production, and days to pupation and adulthood. No differences in the number of adults surviving to 8 weeks were observed.
To further analyze and integrate these data with the theoretical literature we note that
1:exp ( - r x ) t ( x ) m ( x ) d z = 1
where r is the intrinsic rate of increase Z(x) is the probability of an individual living to week x from week 0, and n ( x ) is the number of offspring produced per unit time at age x. The Z(x) and m ( x ) schedules were computed for each of the genotypes and these data are sketched in Figure 1 as V ( x ) = Z(x)m(s) .
TABLE 1
Life history information
Number of Number animals sumving of surviving
Eggs produced in Daysto Days to to pupation adults at 8 weeks Genotype 24 hr interval pupabon adulthood (25 maximum) (200 maximum)
.cos/cos 14.30 t 0.94 23.61 -+ 0.50 26.67 t 0.40 2.10 * 0.43 157.5 -C 6.5 +/cos 19.83 * 0.68 19.77 -t- 0.33 22.68 f 0.43 19.80 3- 0.56 156.5 k 11.5 +/+ 18.60 * 0.78 21.28 -t- 0.11 24.23 f 0.11 17.20 -t 1.22 165.0 & 0.0
~~~ ~~
TABLE 2
Analyses of uariance of life history data
Egg production
Source of Degrees Mean variation freedom squares
'Genotype 2 288.8a* +/+,+/cos vs. cos/cos 1 523.60* +/+ vs. +/cos 1 54.16'
Residual 87 19.61
Days Days to pupation to adulthood
Degrees Mean Degrees Mean freedom squares freedom squares
Survival to pupation - ___-
Degrees Mean freedom squares
Number of surviving
adults at 8 weeks
Degrees Mean freedom sauares
2 88.50* 2 141.38*
1 101.80* 1 269.85' 1 76.20* 1 12.90*
349 2.67 169 1.06
2 985.45;
1 1904.07* 1 12.80*
27 70.10
2 43.17
I 14.08 1 72.25 3 116.33
~ ~- ~~~
* Significant at the 0.05 level of probability.

788 A. M. MOFFA .4ND R. F. COSTANTINO
7.0
6.0
5.0
3.0
20
1.0
0.0
a \
1 1 1 I I I I I I I 2 4 6 8 IO 12 14 16 18
4 L
W E E K FIGURE 1.-Observed V(x)-functions for three genotypes of 1'. castaneum.
The total lifetime offspring production, S, of females of each of the genotypes was examined using ( LEWONTIN 1965)
s = J:v(z)dz = V ( T ) ( L - A ) / 2
where V ( s ) = ~S(L-X)/(L-A)~ is a triangular reproductive function, A is the age of first reproduction which, in these data, is identical to T the age of peak reproduction, and L is the age of last reproduction (Figure 1). The associa- tion among A, L, Sand r was obtained from
JI exp (-rx> v (z) dz = 1
as [exp(--rA)/r]f[exp(-rL)-exp(-rA)]/(L-A)r2 = (L-A)/2S which is similar to LEWONTIN (1965, eq. 4) with A = T.

GENETICS AND DEMOGRAPHY O F TRIBOLIUM 789
For the cos/cos, +/cos and +/+ genotypes, respectively, we list estimates of the total numbers of offspring, S : 3.97, 54.32 and 46.53; and the intrinsic rates of increase, r : 0.18, 0.70, 0.63. The values for the +/cos genotype have only a conceptual interpretation, since a pure culture of heterozygotes can not be main- tained. Differences in the values of r are due almost entirely to the areas under the V , (x) curves, i.e., to the genotypic I , (x) functions.
Estimates of fitness values, based on the total lifetime offspring production of females. of the +/+ and cos/cos homozygotes relative to the heterozygote fitness of 1 were 0.86 and 0.07, respectively. The predicted stable equilibrium frequency of the sensitive allele for the case of discrete generations (CROW and KIMURA 1970) was P* = 0.13. This estimate agrees reasonably well with that of 0.09 given by SCULLY and COSTANTINO (1975), based solely on larval viability.
CHARLESWORTH ( 1972) demonstrated that a polymorphic genetic equilibrium cannot occur before the population has attained a stable age structure, except when the genotypic differences are such that V , (5) = a,V(x) , where V ( x ) is a common reproductive function. As an approximation (Figure l ) , for genotype i, we allowed V , (x) = 2S, (L-x) / ( L - A ) z. The observed reproductive functions appear to satisfy the above criterion (eq. 2.11 or eq. 2.20 in CHARLESWORTH 1972) with a, = 0.08, az = 1, a3 = 0.88 for the cos/cos, +/cos, and +/+ geno- types, respectively, where the common reproductive function is that of the +/cos genotype. Consequently. it is possible that the polymorphic genetic equilibrium may be reached before the stable age structure is attained. We shall discuss some other details of the CHARLESWORTH formulation and the Tribolium model in a later section.
Genetic poly morphism At weeks 52 and 68 of the "68-week" study, the cos allele frequency was
estimated in those cultures with an initial allele frequency of 0.9, 0.7, 0.5, 0.3, and 0.1. Of the 10 cultures examined, the estimated mean allele frequency was 0.25 * 0.03 and the genotypic array composed of approximately equal numbers of +/+ and +/cos individuals. No cos/cos individuals were observed. With this information, we established the working hypothesis that cultures initially segre- gzting for the cos allele (or cos chromosome region) have converged to a stable polymorphic genetic equilibrium.
To evaluate this hypothesis, allele frequencies and the genotypic arrays were estimated in a separate experiment at 2, 6, 12 and 16 weeks for cultures with initial cos allele frequencies OI 0.1, 0.3, 0.5. 0.7 and 0.9. The results (Table 3) support the hypothesis of a stable polymorphic genetic equilibrium. Of the 60 cultures examined, only one culture, where P = 0.1, lacked traces of the COS
allele. The largest magnitude of change in the allele frequencies and the geno- typic arrays occurred in the first two weeks. This is consistent with the life history observation that differences among genotypes for total number of off - spring were due primarily to larval viability. The genotypic arrays showed an immediate reduction in the frequency of the cos/cos genotype and an increase in the frequency of +/cos individuals. At week 16 the +/+ and +/cos genotypes

790 A. M. MOFFA A N D R. F. COSTANTINO
U2 h
d cu" P 4
C D W l c 03-m "a 3 - a 0 0 0 0 0 0 0 0 0 0 0 0 0 0 0
tl $1 +I $1 +I $1 tI $1 tI tI $1 ti +I tI tI
d o 0 0 0 0 0 0 0 0 0 0
8 8 8 994 999 999 9 9 9
$ 3 2 8 $ $ 8 $ $ 3 9 % a%%,
4
Ii
1 g g z ! 3 2 8 6 8 % qe3 8 3 g 0 0 0 0 0 0 0 0 0 0 0 0 0 0 0
$1 $1 $1 tl $1 $1 $1 +I tI ti $1 +I tI +I $1
8 a a U! z 8 8 0 3 d $1 $1 $1 +I +I 0 m 0 CO rc)
o! '1 2 2 2 0 0
8 8 8 8 8 % 8 S B 3 8 8 53%
e'4q s q a Z F q ssie 0 0 0 0 0 0 0 0 0 0 0 0 0 0 0
$1 $1 $1 tl +I $1 tl t I $1 $1 $1 +I $1 $1 tl
0 0 0 0 0 0 0 0 0 0 0 0 0 0 0
m a t .
ro
8 0 5 8 ro 2 8
2 0 0
U!
$1 tI tI $1 +I W h CO W 0
2 2 CO c?
G E N E T I C S AhTD DEMOGRAPHY O F T R I B O L I U M 791
were nearly equivalent with only a small fraction of cos/cos individuals. The cos allele frequency declined in the test populations started above the projected P* value of 0.13 and increased in the population with an initial frequency of 0.1, which suggested that the equilibrium was globally stable. At week 16 the allele frequencies ranged from 0.29 to 0.19, which is higher than the projected P* value. We shall comment later on this discrepancy.
The 68-week study The population size data in this experiment consist of the numbers of small
and large larvae, pupae and adults recorded at bi-weekly intervals for 68 weeks. Our objective now is to associate these data with the empirical observation of a stable genetic polymorphism at the cos locus.
For a moment let us consider the classical population genetic model for a single autosomal locus with the usual assumptions of panmixia, nonoverlapping gen- erations and constant fitnesses for all genotypes. The last assumption narrows our comments to the interval of population sizes where density dependent factors are minimal, i.e., weeks 2,4 and 6. In the context OF this model, our data support the existence of a unique equilibrium allele frequency, P*. A population at P* with an initial size N ( 0 ) will grow exponentially according to N ( t ) = N ( 0 ) exp ( W * t ) , where W* is the equilibrium Malthusian parameter of population growth. A non-equilibrium population P with the same initial number will tend to P*, and the value W will tend to W*. Non-equilibrium populations should have smaller numbers of animals based on the inequality W ( P ) I W*. In partic- ular, the initial growth of the test populations based on the genotypic fitness value estimates of 0.86, 1.0 and 0.07 should be reflected in the quadratic function
W ( P ) 0.86 -k 0.28 P - 1.07 P2 . The least squares quadratic equation for the number cd small larvae at week 2 is
$L2 = 559.6 - 161.0 P - 278.4 P2;
for the number of large larvae at week 4 is
LL, = 160.5 + 56.2 P - 188.6 P 2 ;
and fo r the number of adults at week 6 is
A, = 252.3 + 294.7 P - 485.9 P2 . The regression equations (Figure 2A) had coefficients of determination of 0.92 for small larvae, 0.91 for the large larvae and 0.86 for the adults; the overall fit of the data was significant at the 0.01 level of probability in all cases. The sizes of the test populations are indeed functions of the initial frequency of the cos allele. Furthermore, the fitted curves for large larvae at week 4 and adult num- bers at week 6 are maximum at about the equilibrium allele frequency obtained empirically.
Since all cultures initiated with 0 < P < 1 apparently converged to P* = 0.25,

792 A. M. MOFFA A N D B. F. COSTANTINO
A: INITIAL NON-EQUILIBRIUM CULTURES E: INITIATED FROM EQUlLlBRlUh4 CULTUXES 650
600
500
400 m 1 a I Z 4
300
LI 0
200 (L W m 5 3 Z
I O 0
m a l l larvae Neek 2
w e e k 6
0
large larvae week 4
\ \
\\. 5ma11 larvae \\ week 2 A
\\
\ \ \ \ A A \ \ A
A A \ \
\ 8
A \, 8 . A
.--- \ I \ '
' adults
\ \ week 6
* * * e '2, '7 &\
large larvae week 4
L 0 2 4 6 8 1 .
p * = 0.25 2
IN IT IAL CAS ALLELE FREQUENCY
FIGURE 2A,B.-Number of small larvae (W) at week 2, large larvae ( 0 ) at week 4, and adults (A) at week 6. (A) Observations of the initial cultures not at genetic equilibrium together with the least squares quadratic equations. (B) Observations of the cultures at genetic equilibrium.
new cultures started with 20 randomly chosen sexed adults from the week 68 cultures should now have initial demographic patterns unlike those observed at the beginning of this experiment (see Figure 2A) but similar to one another. This hypothesis was tested. The mean number of small larvae at week 2, and the mean number of large larvae at week 4 and the mean number of adults at week 6 are given in Figure 2B. The initial age structure patterns of these cultures are different from those noted at the beginning of the L'68-~eek'' study. However, the control cultures of P = 0.0 and 1.0 displayed demographic patterns similar to those observed at the outset of this study, which was expected because no change in cos allele frequency had occurred in these populations. These data then, reinforce the idea that the genetically segregating cultures have indeed converged to an equilibrium allele frequency and an equilibrium genotypic array.
The demographic pattern of the first 6 weeks, as discussed above, was depen- dent on the initial frequency of the cos allele. We now direct our attention to the

GENETICS AND DEMOGRAPHY O F TRIBOL.IUM 793
overall demographic pattern and begin by considering the observed mean num- ber of adults (Table 4). As a general observation five reasonably distinct phases of adult numbers can be identified: phase A from week 2 through week 6 is a growth interval; the decline initiated at week 8 marks phase B, which continues through week 24; another small growth interval from week 26 through week 38 is labelled phase C ; phase D from week 40 through 48 is characterized by a reduction in adults to numbers quite comparable to those of week 24; the num- ber of adults at week 50 was, on the average, twice the number of adults at week
TABLE 4
Mean number o f adults
Initial cos allele frequency Phase Weeks 1.0 0.9 0.8 0.7 0.6 0.5 0.4 0.3 0.2 0.1 0.0
A
B
C
D
E
2 4 6
8 10 12 14 16 18 20 22 24
26 28 30 32 34 36 38
40 42 44 46 48
50 52 54 56 58 60 62 64 66 68
19.0 19.8 23.8
32.0 37.4 44.6 37.0 28.6 22.4 14.8 12.4 20.0
21.2 23.0 45.2 35.8 28.4 32.2 46.4
44.4 47.4 36.8 28.8 25.0
49.6 48.4 38.4 36.8 37.8 42.6 49.6 48.6 43.6 42.0
19.6 18.4 64.4 93.6
138.8 211.4
114.3 164.0 119.5 156.0 100.5 142.3 76.3 118.3 66.0 92.7 51.7 66.3 38.0 43.0 34.0 38.6 36.5 27.5
37.0 33.2 44.6 41.8 36.7 31.3 38.3 36.7 37.3 35.3 43.3 51.7 56.7 60.7
54.3 73.0 39.0 67.0 35.3 59.3 30.3 57.7 29.0 48.0
48.3 59.7 55.3 58.0 54.0 66.7 33.7 72.7 43.0 66.7 38.7 55.0 48.7 79.0 45.7 71.0 56.3 63.7 57.7 64.7
19.0 18.8 84.6 98.8
231.0 237.8
191.0 229.0 191.6 201.0 175.6 177.6 153.8 155.2 123.0 119.6 100.8 83.2 70.0 47.2 52.4 30.8 25.8 28.0
34.4 24.0 35.8 28.8 35.8 27.4 41.8 27.0 34.8 31.2 46.2 40.2 48.0 42.2
36.8 47.8 31.0 41.2 34.2 30.2 31.4 25.0 25.0 20.4
55.4 51.2 54.0 47.8 48.2 46.4 52.0 43.8 44.0 46.2 47.0 49.2 51.2 58.8 55.8 57.2 53.4 50.6 57.8 56.8
18.8 18.0 85.6 111.3
278.2 310.7
253.2 293.0 199.4 307.3 166.8 286.3 134.8 260.0 98.8 211.7 68.0 155.3 52.6 91.7 46.8 51.3 31.4 39.3
41.4 37.3 55.0 32.0 46.4 46.7 51.6 62.3 50.6 68.7 65.5 58.7 71.6 64.3
63.0 68.0 51.6 61.0 41.4 50.0 36.5 48.0 30.4 58.7
68.2 70.0 67.0 68.7 60.4 60.3 64.6 58.7 66.6 65.0 67.2 64.0 75.6 73.0 71.8 77.7 71.2 75.7 80.0 83.7
18.3 17.7 93.3 82.3
303.7 264.7
302.0 257.3 271.3 244.7 244.0 224.3 189.0 196.7 147.0 155.7 103.3 117.0 67.7 92.0 41.7 67.7 30.0 56.0
38.3 43.3 36.3 26.7 39.0 23.3 42.7 31.3 41.0 24.7 65.0 41.7 72.3 78.7
76.3 63.3 54.0 49.7 41.0 35.0 31.7 37.7 27.3 23.3
46.3 70.0 61.3 69.3 56.7 65.7 55.7 59.3 57.7 71.3 50.7 75.7 61.0 83.0 58.3 82.0 71.7 81.7 73.0 74.3
17.6 19.3 89.7 98.3
222.3 308.0
237.0 269.0 203.3 237.7 178.3 221.7 147.0 216.7 113.7 184.0 89.7 157.7 63.3 61.5 45.7 111.0 35.0 93.7
39.0 63.3 33.7 68.0 52.7 74.7 34.3 74.0 43.0 64.7 65.7 63.7 69.3 74.7
63.0 67.3 52.7 57.3 51.0 46.7 39.0 39.3 35.0 36.3
86.0 74.0 72.3 82.3 68.7 78.7 70.3 68.0 62.7 64.0 61.7 76.3 68.7 80.0 63.3 75.0 59.7 66.7 71.7 64.7

794 A. M. M O F P A AND R. F. COSTANTINO
48, i.e., A,, = (2.0 f 0.55) A,* and phase E through week 68 is an interval of apparent stability.
Another perspective on the overall adult demographic pattern is obtained by plotting the change in the number of adults (AA) against the number of adults ( A ) . This graph for the culture homozygous for the 4- allele (Figure 3 ) assumes a ‘‘~ircle-like~~ configuration with the diameter tending to decrease as the culture matured. The magnitude of the oscillations was smaller with time, and the population appears to be approaching an equilibrium in the neighborhood of 73 +- 6 adults. One informative exception to the regular pattern occurred in phase D, and it is noted in Figure 3 as a large swing to the left followed by a return to the former pattern. The departure and return to an apparent equilib- rium state suggested that the observed demographic equilibrium was stable.
40
30
--
-- :I_ \
+ 220
t 180
+ 140
+ 100
t 60
t 20 0
- 20 - 6 0 -100 4 \ I
-20 + YUMBER O F ADULTS
FIGURE 3.-Change in the number of adults versus number of adults for the culture homo- zygous for the + allele. The small circled number indicates the week.

GENETICS .4ND DEMOGRAPHY O F TRIBOLIUM 795
Similar graphs were observed for the other cultures and can be constructed from the data in Table 4.
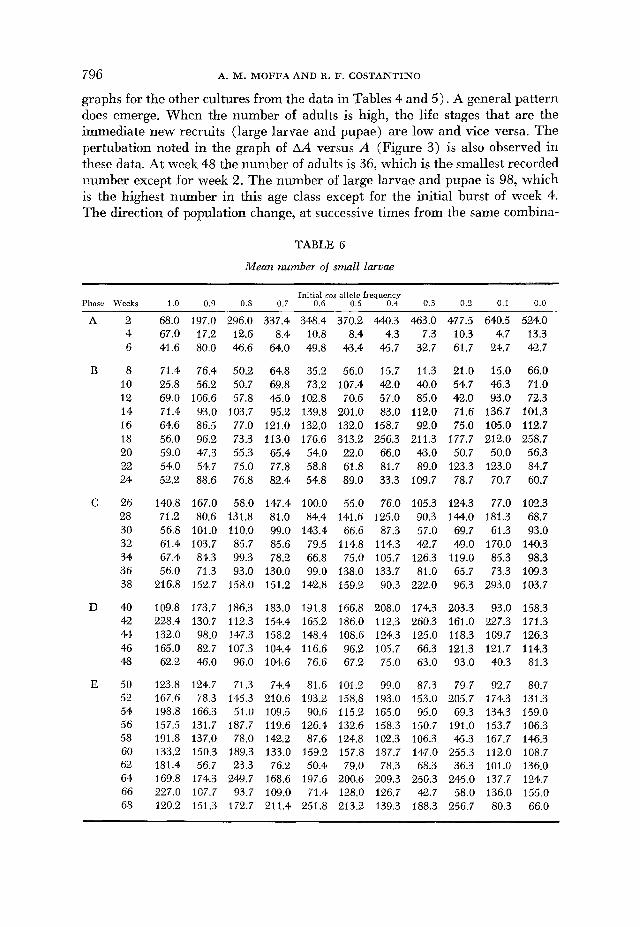
To consider age structure we need to evaluate all life stages. The sum of the mean number of large larvae and pupae is thus presented in Table 5, and the mean number of small larvae is given in Table 6. In particular, are the numbers of animals in the different life stages associated? To probe this question we sketched the number of large larvae and pupae against the number of adults for the +/+ culture (Figure 4). (Again, interested readers can construct these
TABLE 5
Sum of the mean number of large larvae and the mean number of pupae
Initial cos allele frequency Phase Weeks 1.0 0.9 0.8 0.7 0.6 0.5 0.4 0.3 0.2 0.1 0.0
A 2 0.0 0.0 0.0 0.0 0.0 0.0 0.0 0.0 0.0 0.0 0.0 4 20.6 155.8 202.2 248.1 272.0 225.6 400.0 411.3 351.0 324.0 457.7 6 14.6 15.0 25.6 22.8 33.2 37.8 35.3 22.4 22.0 23.3 21.6
B 8 22.2 55.8 31.6 16.7 22.4 19.4 9.0 12.3 19.7 15.3 16.8 10 51.2 29.2 29.3 15.6 6.6 17.0 8.0 5.4 25.3 25.4 16.9 12 15.2 61.2 63.4 76.8 55.4 27.8 23.0 50.3 30.0 23.0 25.0 14 15.6 42.0 24.5 36.0 26.4 39.6 10.4 23.3 46.4 34.3 42.7 16 23.8 40.2 41.0 47.8 43.4 10.6 26.7 12.7 35.4 39.0 71.0 18 7.8 21.8 29.1 33.2 9.0 12.4 16.0 18.7 33.7 27.3 22.7 20 7.4 26.1 26.7 20.2 9.0 44.4 9.7 29.0 4Q.4 2.2.6 48.3 22 22.0 20.0 33.0 27.0 17.2 6.2 7.3 12.0 25.6 21.7 31.0 24 23.2 33.2 31.2 28.6 13.4 39.8 20.4 30.3 21.3 37.0 22.6
C 26 24.2 42.5 31.0 29.2 26.6 37.6 16.0 30.0 21.3 18.7 21.7 28 39.4 27.2 17.6 29.2 17.0 28.5 31.0 23.3 11.6 37.7 56.3 30 23.4 46.1 36.1 37.2 29.6 46.6 41.3 26.0 33.0 40.0 33.3 32 16.8 24.3 19.0 20.4 24.4 18.6 39.4 13.7 12.0 11.7 27.0 34 25.4 41.7 45.0 48.8 27.6 53.0 27.0 68.0 25.0 70.4 47.0 36 39.4 60.0 47.6 36.0 33.6 36.2 32.3 56.3 83.7 38.7 53.3 38 21.8 43.0 48.4 15.8 31.2 44.6 43.6 27.4 37.0 31.6 42.0
D 40 43.0 39.0 48.3 28.8 21.0 44.4 26.3 11.3 23.0 32.0 26.3 42 15.2 30.0 19.7 16.4 17.0 17.2 21.4 18.3 21.3 13.4 14.7 44 19.6 49.3 79.4 50.6 43.8 53.0 59.7 33.6 84.0 51.0 71.0 46 6.4 26.7 13.6 8.6 7.6 7.4 7.4 8.7 5.4 5.6 10.0 48 68.0 43.0 38.0 71.2 60.4 76.2 71.0 33.4 73.3 78.4 97.7
E 50 19.8 47.0 21.6 21.2 17.4 29.0 32.0 39.7 26.0 25.7 47.3 52 7.2 14.7 13.0 10.0 8.2 9.0 15.0 11.6 13.3 10.3 5.4 54 14.0 13.3 46.3 33.2 22.2 37.8 26.7 22.3 22.0 30.0 22.4 56 20.8 34.6 17.7 13.8 22.4 20.0 29.7 17.3 25.3 21.4 24.0 58 19.3 16.0 16.7 23.6 19.0 19.8 18.0 11.0 31.0 29.3 21.7 60 30.0 24.0 27.0 18.4 17.0 24.2 24.3 24.7 14.0 33.6 38.6 62 38.4 27.7 32.6 45.8 28.6 4 . 8 32.0 26.0 35.4 33.4 38.3 64 8.2 28.0 19.4 16.4 10.2 26.4 24.4 14.7 20.3 17.3 15.0 66 9.8 33.0 26.4 21.4 23.0 24.0 23.0 18.6 17.0 19.7 21.0 68 28.2 10.0 10.0 14.6 13.6 24.0 12.4 15.7 12.3 22.0 39.0
796 A. M. MOFFA A N D B. F. COSTANTINO
graphs for the other cultures from the data in Tables 4 and 5 ) . A general pattern does emerge. When the number of adults is high, the life stages that are the immediate new recruits (large larvae and pupae) are low and vice versa. The pertubation noted in the graph of AA versus A (Figure 3) is also observed in these data. At week 48 the number of adults is 36, which is the smallest recorded itumber except for week 2. The number of large larvae and pupae is 98, which is the highest number in this age class except for the initial burst of week 4. The direction of population change, at successive times from the same combina-
TABLE 6
Mean number of small larvae
Initial cos allele frequency Phase Weeks 1.0 0.9 0.8 0.7 0.6 0.5 0.4 0.3 0.2 0.1 0.0
A
B
C
D
E
2 4 6
8 10 12 14 16 18 20 22 24
26 28 30 32 34 36 38
40 42 44 46 48
50 52 54 56 58 60 62 64 66 68
68.0 197.0 67.0 17.2 41.6 80.0
71.4 76.4 25.8 56.2 69.0 106.6 71.4 93.0 64.6 86.5 56.0 96.2 59.0 47.3 54.0 54.7 52.2 88.6
140.8 167.0 71.2 80.6 56.8 101.0 61.4 103.7 67.4 84.3 56.0 71.3
216.8 152.7
109.8 173.7 228.4 130.7 1320 98.0 165.0 82.7 62.2 46.0
123.8 124.7 167.6 78.3 198.8 166.3 157.5 131.7 191.8 137.0 133.2 150.3 181.4 56.7 169.8 174.3 227.0 107.7 120.2 151.3
296.0 337.4 12.6 8.4 46.6 64.0
50.2 64.8 50.7 69.8 57.8 45.0
103.7 95.2 77.0 121.0 73.3 113.0 55.3 65.4 75.0 77.8 76.8 82.4
58.0 147.4 131.8 81.0 110.0 99.0 85.7 85.6 99.3 78.2 93.0 130.0
158.0 151.2
186.3 183.0 112.3 154.4 147.3 158.2 107.3 104.4 96.0 104.6
71.3 74.4 145.3 210.6 51.0 109.5
187.7 119.6 78.0 142.2
189.3 133.0 23.3 76.2
249.7 168.6 93.7 1w.o
172.7 211.4
348.4 10.8 49.8
35.2 73.2
102.8 139.8 132.0 176.6 54.0 58.8 54.8
100.0 84.4
143.4 79.5 66.8 99.0
142.8
131.8 165.2 148.4 116.6 76.6
81.6 193.2 90.6
126.4 87.6
153.2 50.4
197.6 71.4
251.8
370.2 440.3 8.4 4.3
43.4 45.7
56.0 15.7 107.4 42.0 70.6 57.0
201.0 83.0 132.0 158.7 313.2 256.3 22.0 66.0 61.8 81.7 89.0 33.3
55.0 76.0 141.6 125.0 66.6 87.3
114.8 114.3 75.0 105.7
138.0 133.7 159.2 90.3
166.8 208.0 186.0 112.3 108.6 124.3 96.2 105.7 67.2 75.0
101.2 99.0 158.8 193.0 115.2 165.0 132.6 158.3 124.8 102.3 157.8 187.7 79.0 78.3
200.6 209.3 128.0 126.7 213.2 139.3
463.0 477.5 7.3 10.3
32.7 61.7
11.3 21.0 40.0 54.7 85.0 4.2.0
112.0 71.6 92.0 75.0
211.3 177.7 43.0 50.7 89.0 123.3
109.7 78.7
105.3 124.3 90.3 144.0 57.0 69.7 42.7 49.0
126.3 119.0 81.0 65.7
222.0 96.3
174.3 203.3 260.3 161.0 125.0 118.3 66.3 121.3 63.0 93.0
87.3 79.7 153.0 205.7 95.0 69.3
150.7 191.0 106.3 46.3 147.0 255.3 68.3 36.3
250.3 245.0 42.7 58.0
188.3 256.7
640.5 524.0 4.7 13.3
24.7 42.7
15.0 66.0 46.3 71.0 93.0 72.3
136.7 101.3 105.0 112.7 212.0 258.7 50.0 56.3
123.0 84.7 70.7 60.7
77.0 102.3 181.3 68.7 61.3 93.0
170.0 140.3 85.3 98.3 73.3 109.3
293.0 103.7
93.0 158.3 227.3 171.3 109.7 126.3 121.7 114.3 40.3 81.3
92.7 80.7 174.3 131.3 134.3 159.0 153.7 1M.3 167.7 146.3 112.0 108.7 101.0 136.0 137.7 124.7 136.0 155.0 80.3 66.0

GENETICS AKD DEMOGRAPHY O F TRIBOLIUM 797
90
w 5 75 n v)
3
3 60 n
W
a a
w 45
a
-1
(3 lY
_1
LL
O 30 lY w 5 3 z
m
I2
3
\ \
\ \ \ \
a
30 50 70 80 100
NUMBER OF ADULTS
FIGURE 4.-Sketch of the number of large larvae pupae against the number of adults for the +/+ culture. The small circled number indicates the week.
tion of these two age classes, is remarkably similar. Indeed, a rectangle con- structed around the majority of these age structure changes has a width from 64 to 82 adults and a height from 15 to 56 large larvae and pupae.
The mean number of small larvae and the mean number of adults for the +/+ culture are presented in Figure 5. The direction of age structure change was clockwise for large larvae and adults; however, for small larvae and adults the direction of change is counter-clockwise. The pattern in phase D is again obvious as a large swing to the left with both the number of small larvae and adults decreasing. There is a two-fold increase in the number of adults at week 50 and then the numbers return to changes within a rectangle of width 64 to 82 adults and a height from 66 to 159 small larvae. In other words, for every unit change in the number of adults there is a corresponding five-fold change in the number of small larvae.
A third graph of the number of small larvae and number of large larvae plus pupae can also be sketched from these data. When the small larvae are numerous the number of large larvae plus pupae are few and vice: versa.
We now focus attention on the change in age structure during the 68 weeks of this experiment. The age structure of any population with frequencies of small larvae ( L ) , large larvae plus pupae ( P ) , and adults ( A ) may be repre- sented by a point in an equilateral triangle with unit altitude (Figure 6). A

798
165
150
135 W
[L U 1
s 1 120 1 U r v,
& 105
[L W m I
90
75
60
A. M. MOFFA A N D R. F. COSTANTINO
--
--
--
--
--
--
--
-- I I I
35 50 6 5 80 95 I IO
NUMBER OF ADULTS
FIGURE 5.-Graph of the number of small larvae and the number of adults for the +/+ culture. The small circled number indicates the week.
population may then be represented by a point T inside the triangle such that the perpendiculars from the point T to the three sides are equal to (L, P, A ) . (This technique is often used by population geneticists to display a genotypic array.) In Figure 6, the point sixteen represents the population (L=O.31, P = 0.19, A = 0.50) at week 16 for the culture homozygous for the 4- allele. Examination of this figure reveals an interesting pattern: initially the population was 100% adults, at week 2 was 96% small larvae, at week 4 was 80% large larvae plus pupae and then at week 6 was 83% adults completing one cycle, or what we called phase A earlier. The pattern of change can be traced on the figure as a movement from the vertex A toward the vertex L then toward the vertex P and then toward the vertex A . For convenience we shall call this the

GENETICS A N D DEMOGRAPHY O F TRIBOLIUM 799
A
ADULTS
FIGURE 6.-Triangular coordinate representation of the frequencies of small larvae, large larvae plus pupae and adults for the +/+ culture. The small circled number indicates the week.
A-LPA pattern. From week 6 to 16, the adult component decreased 33% with a corresponding increase in large larvae phs pupae and small larvae. At week 16 another A-LPA cycle, of smaller magnitude than the first, was initiated and terminated at week 24. During phase C, two small A-LPA patterns can b'e traced. Numerically, these were most obvious in the change in the mean number of small larvae (see Table 6) from week 24 to 26 and from week 30 to 32. The reduction in adult number in phase D from week 40 through 48 noted in Figures 3, 4 and 5 is displayed as an other A-LPA pattern. Phase E through week 68 was an interval of apparent stability and only small changes in age structure were noted.
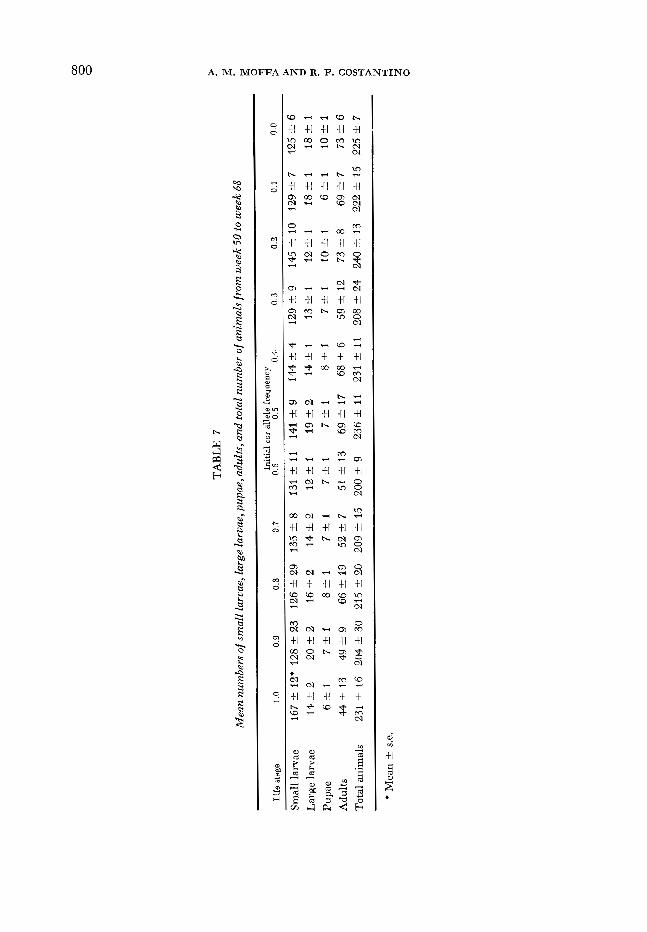
Due to the apparent pertubation at week 48, we chose to evaluate the mean number oi animals during the final 20 weeks (50-68) for demographic equilib- rium (Table 7 ) . Statistical analyses of these data indicate that the mean total number of animals among cultures was similar; however, the distribution of the beetles in the 4 age classes differed for the numbers of adults, large larvae and
800 A. M. M O F F A A N D R. F. C O S T A N T I N O

GENETIC5 AhTD DEMOGRAPHY OF TRIBOLIUM 801
small larvae. The individual treatment comparison of the P = 1, co~/cos and P = 0, +/+ lines indicated the same total number of animals but the cos/cos line had fewer adults and pupae, an equivalent number of large larvae and more small larvae. This age structure comparison is consistent with the phenotypic effect of the cos/cos genotype (Table 1). Among the lines that apparently con- verged to P* = 0.25, the numbers of adults and pupae were the same, but differ- ences in the numbers of large and small larvae existed.
DISCUSSION
Two kinds of equilibria were observed in these data: one genetic and the other demographic. The polymorphic genetic equilibrium at the unsaturated fatty acid-sensitive locus (or region) was stable with an equilibrium allele frequency of approximately 0.25 and a genotypic array composed of nearly equal numbers O€ +/+ and +/cos individuals. The deviation from the predicted value of P* = 0.13 can be interpreted in several ways: (1) Allele frequency was still changing but at a much reduced rate so that many more generations would be needed to obtain equilibrium values in the vicinity of 0.13. (2) The heterozygous genotype had a greater relative fitness value in continuously growing cultures than that estimated in pure culture. Cannibalism of larvae and adults on eggs, pupae and callows has been well documented. During the A phase of population growth, cos/cos individuals did not appear to survive in detectable numbers, leaving the +/+ and +/cos genotypes. Because of differences in developmental time, +/cos individuals pupated at a time when individuals of the +/+ geno- type were quiescent as large larvae; however, +/+ individuals would still be in the pupal stage when +/cos individuals eclosed and became predatory adults. The rapidly developing heterozygous class would then have a distinct advantage in continuous culture where population interactions must be considered. (3) Genotypic fitness is dependent on the rate of population growth of the equilib- rium population in the definition wz = z exp(-rx)V, (x) (after CHARLESWORTH 1970 and CHARLESWORTH and GIESEL 1972). If r = 0, the fitness values are equal to the S-values given earlier and the equilibrium cos allele frequency is 0.13. When the equilibrium population growth rate is 0.67, for example, the equilib- rium allele frequency is 0.21. An cxplanation of the shifts of allele frequency in terms of the equation for wi is presented in CHARLESWORTH and GIESEL (1972). I t is important for us to note that in these data as the equilibrium population growth rate increases so also does the expected equilibrium frequency of the cos allele.
Genetic equilibrium was approximated at week 6. On the other hand, the corresponding stable age structure was not realized until week 50. A stable age structure was therefore not a prerequisite for the existence of the genetic poly- morphism. This result is consistent with the CHARLESWORTH (1972) model since the experimental data satisfied the condition that Vi (x) = aiV(x) ; however, there are differences between the CHARLESWORTH formulation and the Tribolium model. CHARLESWORTH assumes that mating is random between ages and geno-
802 A. M. M O F F A A N D R. F. COSTANTINO
types. We have no experimental data on this point. The initial sizes of our populations were small (20 adults) and we have no measure of the effect of genetic drift in age-structured populations. These two factors suggest the need for both caution and additional study.
During weeks 2-6, two characteristics of T. cnstrrneum cultures started with young adults only were observed: First, the age structure change was like a wave moving from small larvae to large larvae to pupae and theE to adults. Secondly, the number of adults “overshot” (except for the cos/cos culture) the equilibrium number. What is unique in these data is that these two properties were func- tions of the initial frequency of the cos allele. PARK, LESLIE and MERTZ (1 964) have shown demographic differences among genetic strains initiated with young adults. Similar patterns were reported by LLOYD (1 968) and MERTZ (1 969) by varying the initial density of adults. KING and ANDERSON (1971), using mathe- matical models of Mendelian populations with discrete breeding intervals and overlapping generatiovs, provided a numerical example of the effect of initial allele frequency on population growth.
In a recent paper, GINZBURG (1977) proposed an equation relating selective delay (an entity directly measurable from the week 2, 4 and 6 population size data in Table 4)) the average fitness of the population at equilibrium and the entropy distance between the initial and equilibrium states of the population. The results of the experimental evaluation reported by COSTANTINO, GINZBURG and MOFFA (1977) showed a good correspondence to the theory.
At week 6, the 10 cultures that possessed the f allele had an average of 76% adults and 24% larvae. These proportions are nearly exactly opposite to the 29% adults and 68% larvae noted for the stable age structure from week 50 to week 68. Consequently, the different initial cos allele frequencies resulted in an age structure far from equilibrium. Recall, however, that the genetic equilib- rium was approximated at week 6, so that subsequently there was no marked change in either allele frequency nor the genotypic array. Therefore, from a demographic perspective the cultures at week 6 were homogeneous and with identical sequences of fertility and mortality, eventually, the same age com- position was expected (NORTON 1926; COALE 1957; LOPEZ 1967). At equilibrium, the cultures were similar and had between 24-31 % adults, 3-4% pupae. 5-10% large larvae, and 58-66% small larvae.
The cos/cos culture converged most rapidly to the stable age distribution. The percentage of adults never exceeded the percentage of larvae and throughout the 68 week experiment varied only slightly from its mean demographic array of 19% adults, 3% pupae, 6% large larvae and 72% small larvae.
What nechanism (s) control population size at equilibrium? Tribolium CUI- tures are complex genetic-ecological systems; nevertheless, cannibalism of larvae and adults on eggs, pupae, and callows has been studied extensively and pro- posed as a means of population control by CHAPMAN and WHANG (1 934) ; LLOYD (1968) ; PARK, MERTZ and NATHANSON (1968) ; SOKAL and SONLEITNER (1968) ; MERTZ and DAVIES (1968) and MERTZ (1969) to mention a few. A model for

GENETICS A N D DEMOGRAPHY O F TRIBOLIUM 803
the equilibrium number of adults in a Tribolium population dominated by canni- balism of adults on pupae was introduced by LLOYD (1968) as
A* D=R(l -C)A*
where A* is the equilibrium number of adults, D is the death rate of adults, R is the rate at which recruits (large larvae and pupae) are produced, and C is the probability of cannibalism. The point emphasized by LLOYD is that of the three parameters in the model, it is C that has the most profound effect on A*.
In the context of our experiment, the genetic equilibria P* = 0, 0.25 and 1 yielded mean A* values of 73, 62 and 44, respectively. As the equilibrium cos allele frequency increased, it was the rate at which new recruits were produced that decreased as a result of the reduced larval viability and extended develop- mental time of the cos/cos genotype.
Another aspect of these data for which this simpIe model is instructive was the two-fold increase in number of adults that occurred at week 48. We interpret this “outbreak” as a reduction in C caused by the age distribution of adults. LLOYD (1968) and MERTZ (1969) both suggested this as a way of generating cycles in adult numbers. In a stochastic model for cannibalism, MERTZ and DAVIES (1968) list high variability in pupal production and adult “satiation” as conditions for an outbreak. Although the satiation model appears appropriate for their data, our experimental populations did not show high variability in pupal numbers and the insatiable predator model of LLOYD seems more reason- able. Our continuing efforts to understand the dynamics of these cultures will more directly address the question of equilibrium.
We want to thank BRIAN CHARLESWORTH, ANDREW DEWEES, DAVID JILLSON, DAVID MERTZ and MICHAEL WADE for their critical reading of the manuscript. This study was supported in part by a Sigma Xi research grant to A.M.M. and by a grant from the Research Committee of the University of Rhode Island to R.F.C.
LITERATURE CITED
ANDERSON, W. W. and C. E. KING, 1970 66: 780-786.
BELL, A. E., 1969 CHAPMAN, R. N. and W. Y. WHANG, 1934
fluctuations. Science 80: 297-298. CHARLESWORTH, B., 1970
Age-specific selection. Proc. Natl. Acad. Sci., U.S.
The nature of selection responses in Tribolium. Japan. J. Genet. a: 299-309. An experimental analysis of the cause of population
Selection in populations with overlapping generations. I. The use of Malthusian parameters in population genetics. Theor. Pop. Biol. 1 : 35%370. 1972 Selection in populations with overlapping generations. 111. Conditions for genetic equilib- rium. Theor. Pop. Biol. 3: 377-395. --, 1973 Selection in populations with over- lapping generations, V. Natural selection in life histories. Amer. Naturalist 107: 303-31 1. - , Selection in populations with overlapping generations. VI. Rates of change in gene frequency and population growth rate. Theor. Pop. Biol. 6: 108-133.
The measurement of fitness and mutation rate in human populations. Ann. Hum. Genet. 37: 175-187.
Selection in populations with overlapping genera- tions. 11. The relations between gene frequency and demographic variables. Amer. Natur.
-,
1974
CHARLESWORTH, B. and D. CH~LESWORTH, 1973
CHARLESWORTH, B. and J. T. GIESEL, 1972a

804 A. M. MOFFA A N D R. F. COSTANTINO
106: 388-401. -, 1972b Selection in populations with overlapping generations. IV. Fluctuations in gene frequency with density dependent selection. Amer. Naturalist 106 : 4-2-411.
COALE, A. J., 1957 How the age distribution of a human population is determined. Cold Spring
Population biology, the Tribolium model and animal breeding. 1st
Genetic analysis of a population of
Harbor Symp. Quant. Biol. 22: 83-89.
World Congress of Genetics Applied to Livestock Production, Proceedings I: 451-457.
Tribolium. I. Corn oil sensitivity and selection response. Heredity 22 : 529-539. Genetic analysis of a population of
Tribolium. 11. Metabolic pattern of corn oil sensitive anomaly. Heredity 23: 477-483. Genetic analysis of a popula-
tion of Tribolium. 111. Fatty acid composition of unsaturated fatty arid sensitive mutant. Heredity 25: 411-418.
Genetic analysis of a population of Tribolium. IV. Gene expression modified by corn oil and relative humidity. Heredity 29: 247-252.
An experimental check of fitness entropy versus selective delay. J. Theor. Biol. (in press).
An Introduction to Population Genetics Theory. Harper and Row.
Demographic parameters and natural selection. Proc. Natl. Acad. Sci. U S . 71 : 4645-4647. -, 1975a Reproductive strategies and natural selection. Amer. Naturalist 109: 243-249. __ , 1975b Natural selection and age-structured populations. Genetics 79: 535-54.t. -, 1977 Measures of fitness and demographic stability. Proc. Natl. Acad. Sci. U.S. 74: 384-386.
COSTANTINO, R. F., 1974
COSTANTINO, R. F., A. E. BELL and J. C. ROGLER. 1967
COSTANTINO, R. F., J. C. ROCLER and A. E. BELL, 1968
COSTANTINO, R. F., R. 0. MUMMA and T. E. BRUSZEWSKI, 1970
COSTANTINO, R. F. and P. M. ROWE, 1972
COSTANTINO, R. F., L. R. GINZBURC and A. M. MOFFA, 1977
CROW, J. F. and M. KIMURA, 1970
DEMETRIUS, L., 1974
GINZXJRG, L. R., 1977
KING, C. E. and W. W. ANDERSON, 1971
A macro-equation of natural selection. J. Theor. Biol. (in press).
Age-specific selection. 11. The interaction between r
Population biology and the Tribolium model. EToI. Biol.
Selection for colonizing ability. pp. 77-91. In: The Genetics of Col- onizing Species; Proceedings. Edited by H. G. BAKER and G. L. STEBBINS. Academic Press, New York.
Self regulation of adult numbers by cannibalism in two laboratory strains of flour beetles (Tribolium castaneum) . Ecology 49 : 245-259.
Asymptotic properties of a human age distribution under a continuous net fertility function. Demography 4: 680-687.
Age distribution and abundance in populations of flour beetles. I. Experi- mental studies. Ecol. Monogr. 39: 1-31. -- , 1972 The Tribolium model and the mathematics of population growth. Ann. Rev. Ecol. Syst. 3: 51-78.
Cannibalism of the pupal stage by adult flour beetles: An experiment and a stochastic model. Biometrics 24: 247-275.
Struggle for existence, the Tribolium model: Biological and statistical aspects. pp. 41-79. In: Third Symp. on Math. Stat. and Probability. Univ. California Press.
Natural selection and Mendelian variation. Proc. London Math. Soc.
and K during population growth. Amer. Naturalist 105: 137-156.
KING, C. E. and P. S. DAWSON, 1972
LEWONTIN, R. C., 1965
5: 133-227.
LLOYD, M., 1968
LOPEZ, A., 1967
MERTZ, D. B., 1969
MERTZ, D. B. and R. B. DAVIES, 1968
NEYMAN, J., T. PARK and E. L. SCOTT, 1956
NORTON, H. T. J., 1926 28: 1 4 5 .
GENETICS AlYD DEMOGRAPHY O F TRIBOLIUM 805
PARK, T., P. H. LESLIE and D. B. MERTZ, 1964
PARK, T., D. B. MERTZ and M. NATHANSON, 1968
SCULLY, A. M. M. and R. F. COSTANTINO, 1975
SOKAL, R. R. and F. J. SONLEITNER, 1968
YAMADA, Y. and A. E. BELL, 1969
Genetic strains and competition in populations of Tribolium. Physiol. Zool. 27: 177-238.
The cannibalism of pupae by adult flour beetles. Physiol. Zool. 41 : 228-253.
Genetic analysis of a population of Tribolium. V. Viability of the unsaturated fatty acid sensitive mutant. Can. J. Gen. Cyt. 17: 585-590.
The ecology of selection in hybrid populations of Tribolium castscneum. Ecol. Monogr. 38: 345-379.
Selection for larval growth in Tribolium under two levels of nutrition. Genet. Res. 13: 175-195.
Corresponding editor: J. F. KIDWELL