Embed Size (px)
Citation preview

Passaic County ENERGY MANAGEMENT MARKET
TRANSFORMATION STRATEGYStrategies to Achieve Energy Savings and Economic
Development in Commercial and Industrial Buildings
October 2013 | Massachusetts Institute of Technology | Community Innovators Lab | Green Economic Development Initiative
A project developed in partnership between The Massachusetts Institute of Technology Community Innovators Lab Green Economic Development Initiative & Passaic County Planning and Economic Development Department

Passaic county EnErgy ManagEMEnt MarkEt
Community Innovators LabDepartment of Urban Studies and Planning
School of Architecture + PlanningMassachusetts Institute of Technology
Building/Room 9-41977 Massachusetts Avenue
Cambridge, MA 02139
E-mail: [email protected]: web.mit.edu/colab
Blog: colabradio.mit.edu

Passaic county EnErgy ManagEMEnt MarkEt
About this ProjectThe Massachusetts Institute of Technology’s Community Innovator’s Lab Green Economic Development Initiative (MIT GEDI), Passaic County’s Department of Planning and Economic Development, and the Passaic County Improvement Authority partnered in Spring 2013 on an “action research” project to develop an Energy Efficiency Market Transformation Strategy for commercial and industrial buildings in the County. This report documents the findings of our research, and suggests strategies to grow energy efficiency in the region. This work is intended to support Passaic County’s ongoing economic development and environmental initiatives.
About the MIT CoLab Green Economic Development InitiativeMIT GEDI is a project of the Community Innovators Lab, a center for planning and development within the MIT Department of Urban Studies and Planning (DUSP), which focuses on advancing a socially just and environmentally sustainable economy. MIT GEDI conducts applied research; develops tools and resources for practitioners; disseminates knowledge; and partners with economic development organizations to design strategic planning initiatives intended to transform economic development practice. GEDI is generously supported by a grant from the Rockefeller Brothers Fund.

iPassaic county EnErgy ManagEMEnt MarkEt
Executive Summary
Fostering stronger energy management – e.g., strategies to minimize buildings’ energy costs and meet other energy-related goals – in commercial and industrial buildings in Passaic County can contribute to a more prosperous local economy. The documented economic development benefits of supporting energy management include:
■■ Greater business profitability.■■ Increased real estate values.■■ Job growth, both from a growing energy
services sector, as well as energy savings being reinvested in the local economy.
■■ Healthier buildings, with increased occupant productivity.
Conditions in Passaic CountyThe potential for energy savings in Passaic County building stock is substantial. By one estimate, New Jersey commercial buildings’ electricity use could be reduced 27 percent over baseline projections by 2024 via profitable investments in energy efficiency, and natural gas 16 percent. The financial impact of such savings could be significant; while we did not attempt a detailed analysis, based on rough, conservative calculations, commercial and industrial properties in Passaic County likely spend more than $175 million on energy each year.
However, a variety of barriers exist to growing stronger energy management. Our research documented the following barriers to growing markets for energy efficiency effecting buildings in Passaic County:
■■ Informational barriers – Building owners and tenants do not understand the energy savings possible in their buildings, nor the programs
and services available to their properties.
■■ Limited trust in programs and services – Some interviewees noted skepticism of energy service providers and programs amongst building owners and facility managers.
■■ Split-incentives between owners and tenants – Many properties use triple net leases whereby lessening owners’ incentive to invest in energy improvements to the property when tenants pay utility bills.
■■ Lack of financing mechanisms – Access to project financing for building energy efficiency upgrades is limited or non-existent for many buildings.
■■ Limited of demand for workforce training – Workforce development opportunities to provide skills to new and existing employees in the energy management space have been under-subscribed. Greater demand for skilled energy management is needed to sustain existing training programs.
There are a number of opportunities to growing energy management in the region:
■■ Facilitating greater knowledge and referrals for energy upgrade services – Our research suggests that referrals from previous customers are the most important means of generating new business for energy management firms. Facilitating opportunities for referrals can help grow energy management in the region. Likewise, broader understanding of energy opportunities amongst property owners and managers can increase participation.
■■ Facilitating more project financing options – Financing energy efficiency investments and addressing split incentives are key barriers

iiPassaic county EnErgy ManagEMEnt MarkEt
to energy efficiency investments. New Jersey legislation has enabled Property Assessed Clean Energy (PACE), which provides a promising means of addressing these barriers. PACE financing is potentially a potent tool to realize deeper energy management in participating commercial properties.
■■ Supporting greater participation in workforce training programs – Notwithstanding low participation, increased participation in energy management trainings for building manager and operators can enhance their ability to control energy costs in buildings.
RecommendationsPassaic County staffs are highly constrained in the resources they can devote to energy management market transformation. The follow represent simple, but potentially impactful steps the County can take to growing energy management in the region:
Promote Passaic County’s Energy Savings Improvement Plan (ESIP) to foster greater knowledge of and interest in energy management opportunities. Passaic County is currently in the process of implementing an Energy Savings Improvement Plan (ESIP) through the New Jersey Clean Energy Program. Passaic County should document its experience undertaking these energy management projects, and seek forums to share their experiences and promote energy management amongst the private, non-profit and government sectors.
Expand the County’s energy outreach and marketing – The County currently promotes the rate-payer funded New Jersey Clean Energy Program to area businesses at its annual Green Building Design Conference, and in its Business Expansion and Relocation Packet. The County should seek opportunities to deepen and broaden the range of promotions it undertakes for energy programs. With little commitment of staff time, the County can:
■■ Encourage area businesses to participate in existing “Energy Challenges” and technical assistance opportunities, including:
The New Jersey Building Owners and Managers Association (BOMA) annual Kilowatt Crackdown program, providing friendly competition between their membership to reduce energy use through awards and seminars.
International Facility Management Association (IFMA) energy awards.
■■ Catalogue and promote energy management training programs for facility managers and building operators – Passaic County Planning and Economic Development staff should liaise with Workforce Investment Board of Passaic County to identify energy management programs appropriate for facility managers and building owners. They can then provide information and any testimonials to other organizations, as part of their business liaison.
■■ Revise the Business Expansion and Relocation Packet –The Pamphlet should be updated to include information on facility manager and building operator training opportunities; all financing opportunities applicable to local businesses; as well as information on NJCEP and PSE&G programs.
■■ Provide additional information and direct links to Energy Efficiency on Passaic County’s website – In the economy today a business owner may want quick information on how to reduce the cost of energy use. By having simple summaries and direct links to various programs on the County website, the information becomes more accessible, in turn more marketable to the region.
■■ Facilitate training for County and municipal staff who regularly liaise with businesses in appropriate energy management programs to which they can guide businesses – These programs

iiiPassaic county EnErgy ManagEMEnt MarkEt
include NJCEP, PSE&G, the BOMA Kilowatt Crackdown, workforce training opportunities, and the various financing programs offered in the County.
Promote awareness and understanding of PACE as an energy financing tool – This recommendation is likely the most impactful means for Passaic County and its municipalities to support markets for energy management. The County should:
■■ Consider leading an evaluation process potential PACE program administrators, including the non-profit NJ PACE, on behalf of Passaic municipalities – NJ PACE has been actively promoted PACE in New Jersey, and is offering revenue-neutral program administration services to local government. The County can help evaluate municipal, County, and potential third party
administrators’ capacity and value proposition in delivering a PACE program. This vetting will assist municipalities in their decision of whether to adopt PACE districts.
■■ Educate municipalities and building owners about PACE financing options by facilitating dialogue between real estate representatives and municipalities – Typically, the most important advocates for PACE financing programs are large real estate owners who recognize the value of PACE to improving the energy performance of their properties. Passaic County should facilitate conversations between these stakeholders and municipal policy decision-makers.

Passaic county EnErgy ManagEMEnt MarkEt
Table of ContentsABOUT THIS PROJECT . . . . . . . . . . . . . . . . . . . . . . . . . . . . . . . . . . . . . . . . . . . . . . . . . . . . . . . . . . . . . . . . . . . . . . 3
ABOUT THE MIT COLAB GREEN ECONOMIC DEVELOPMENT INITIATIVE . . . . . . . . . . . . . . . . . . . . . . . . . . 3
EXECUTIVE SUMMARY . . . . . . . . . . . . . . . . . . . . . . . . . . . . . . . . . . . . . . . . . . . . . . . . . . . . . . . . . . . . . . . . . . . . . . . . . . .I
CONDITIONS IN PASSAIC COUNTY . . . . . . . . . . . . . . . . . . . . . . . . . . . . . . . . . . . . . . . . . . . . . . . . . . . . . . . . . . . . .I
RECOMMENDATIONS . . . . . . . . . . . . . . . . . . . . . . . . . . . . . . . . . . . . . . . . . . . . . . . . . . . . . . . . . . . . . . . . . . . . . . . II
I . INTRODUCTION . . . . . . . . . . . . . . . . . . . . . . . . . . . . . . . . . . . . . . . . . . . . . . . . . . . . . . . . . . . . . . . . . . . . . . . . . . . . . . 1
A . PURPOSE OF THIS REPORT . . . . . . . . . . . . . . . . . . . . . . . . . . . . . . . . . . . . . . . . . . . . . . . . . . . . . . . . . . . . . . . . 1
B . WHAT IS “ENERGY MANAGEMENT”? . . . . . . . . . . . . . . . . . . . . . . . . . . . . . . . . . . . . . . . . . . . . . . . . . . . . . . . 1
Adopting an energy management plan / policy . . . . . . . . . . . . . . . . . . . . . . . . . . . . . . . . . . . . . . . . . . . . . . . . . 2
Tracking Performance – Energy dashboards, reporting and benchmarking . . . . . . . . . . . . . . . . . . . . . . . . . . 2
Operational improvements & commissioning . . . . . . . . . . . . . . . . . . . . . . . . . . . . . . . . . . . . . . . . . . . . . . . . . . . 2
Capital upgrades . . . . . . . . . . . . . . . . . . . . . . . . . . . . . . . . . . . . . . . . . . . . . . . . . . . . . . . . . . . . . . . . . . . . . . . . . 2
Occupant/tenant engagement – Green Leases . . . . . . . . . . . . . . . . . . . . . . . . . . . . . . . . . . . . . . . . . . . . . . . . . . 3
C . ENERGY EFFICIENCY POTENTIAL OF NJ COMMERCIAL BUILDINGS . . . . . . . . . . . . . . . . . . . . . . . . . . . . 4
D . ECONOMIC BENEFITS OF ENERGY SAVINGS . . . . . . . . . . . . . . . . . . . . . . . . . . . . . . . . . . . . . . . . . . . . . . . . 6
Enhanced Business Profitability . . . . . . . . . . . . . . . . . . . . . . . . . . . . . . . . . . . . . . . . . . . . . . . . . . . . . . . . . . . . . 6
Enhanced Value of Real Estate . . . . . . . . . . . . . . . . . . . . . . . . . . . . . . . . . . . . . . . . . . . . . . . . . . . . . . . . . . . . . . 7
Job Creation . . . . . . . . . . . . . . . . . . . . . . . . . . . . . . . . . . . . . . . . . . . . . . . . . . . . . . . . . . . . . . . . . . . . . . . . . . . . . 7
Health and Productivity Improvements Associated with Building Design and Energy Management . . . . . . 8
Reducing Environmental Impacts . . . . . . . . . . . . . . . . . . . . . . . . . . . . . . . . . . . . . . . . . . . . . . . . . . . . . . . . . . . 10
E . WHAT IS REQUIRED TO ACHIEVE GOOD ENERGY MANAGEMENT? . . . . . . . . . . . . . . . . . . . . . . . . . . . . 10
The Need for Market Transformation . . . . . . . . . . . . . . . . . . . . . . . . . . . . . . . . . . . . . . . . . . . . . . . . . . . . . . . . 11
II . MARKET CONDITIONS IN PASSAIC COUNTY AND THE STATE OF NEW JERSEY . . . . . . . . . . . . . . . . . . . . 12
A . REAL ESTATE MARKET ANALYSIS . . . . . . . . . . . . . . . . . . . . . . . . . . . . . . . . . . . . . . . . . . . . . . . . . . . . . . . . . 12
B . ENERGY SERVICES SECTOR . . . . . . . . . . . . . . . . . . . . . . . . . . . . . . . . . . . . . . . . . . . . . . . . . . . . . . . . . . . . . . . 13
C . RATEPAYER FUNDED ENERGY EFFICIENCY PROGRAMS . . . . . . . . . . . . . . . . . . . . . . . . . . . . . . . . . . . . . . 14
D . PROJECT FINANCING MECHANISMS . . . . . . . . . . . . . . . . . . . . . . . . . . . . . . . . . . . . . . . . . . . . . . . . . . . . . . 16
Existing financing mechanisms used in Passaic . . . . . . . . . . . . . . . . . . . . . . . . . . . . . . . . . . . . . . . . . . . . . . . . 16
PACE Financing . . . . . . . . . . . . . . . . . . . . . . . . . . . . . . . . . . . . . . . . . . . . . . . . . . . . . . . . . . . . . . . . . . . . . . . . . 17
The Benefits of PACE . . . . . . . . . . . . . . . . . . . . . . . . . . . . . . . . . . . . . . . . . . . . . . . . . . . . . . . . . . . . . . . . . . . . . 17
Program administration options . . . . . . . . . . . . . . . . . . . . . . . . . . . . . . . . . . . . . . . . . . . . . . . . . . . . . . . . . . . . 17
PACE Financing in New Jersey . . . . . . . . . . . . . . . . . . . . . . . . . . . . . . . . . . . . . . . . . . . . . . . . . . . . . . . . . . . . . 18
Interest in PACE amongst municipalities is unclear . . . . . . . . . . . . . . . . . . . . . . . . . . . . . . . . . . . . . . . . . . . . 18
E . WORKFORCE DEVELOPMENT INITIATIVES . . . . . . . . . . . . . . . . . . . . . . . . . . . . . . . . . . . . . . . . . . . . . . . . . 18
What types of jobs are associated with investments in energy management? . . . . . . . . . . . . . . . . . . . . . . . 18
New Jersey’s workforce development system . . . . . . . . . . . . . . . . . . . . . . . . . . . . . . . . . . . . . . . . . . . . . . . . . 19
Recent Energy Management-related Workforce Development Initiatives . . . . . . . . . . . . . . . . . . . . . . . . . . . 19
III . MARKET TRANSFORMATION PLAN . . . . . . . . . . . . . . . . . . . . . . . . . . . . . . . . . . . . . . . . . . . . . . . . . . . . . . . . . . 21
A . PROMOTE PASSAIC COUNTY’S ENERGY SAVINGS IMPROVEMENT PLAN (ESIP) TO FOSTER GREATER
INTEREST IN ENERGY MANAGEMENT . . . . . . . . . . . . . . . . . . . . . . . . . . . . . . . . . . . . . . . . . . . . . . . . . . . . . . . 22
B . EXPAND THE COUNTY’S ENERGY OUTREACH AND MARKETING . . . . . . . . . . . . . . . . . . . . . . . . . . . . . . 22
C . SUPPORT MUNICIPALITIES’ ADOPTION OF PACE DISTRICTS & PROGRAMS . . . . . . . . . . . . . . . . . . . . . . 23

Passaic county EnErgy ManagEMEnt MarkEt
IV . CONCLUSION . . . . . . . . . . . . . . . . . . . . . . . . . . . . . . . . . . . . . . . . . . . . . . . . . . . . . . . . . . . . . . . . . . . . . . . . . . . . . . 25
APPENDIX I: LITERATURE REVIEW - ECONOMIC IMPACTS OF ENERGY EFFICIENCY INVESTMENTS . . . 26
APPENDIX II: LITERATURE REVIEW OF HEALTH IMPACTS ASSOCIATED WITH GREEN BUILDING
INVESTMENTS . . . . . . . . . . . . . . . . . . . . . . . . . . . . . . . . . . . . . . . . . . . . . . . . . . . . . . . . . . . . . . . . . . . . . . . . . . . . . . . . 29
APPENDIX III: ENERGY SERVICE PROVIDER FIRMS SURVEY - SUMMARY . . . . . . . . . . . . . . . . . . . . . . . . . . . 31
RESPONDING FIRMS . . . . . . . . . . . . . . . . . . . . . . . . . . . . . . . . . . . . . . . . . . . . . . . . . . . . . . . . . . . . . . . . . . . . . . . 31
APPENDIX IV: ENERGY MANAGEMENT RELATED CREDENTIALS . . . . . . . . . . . . . . . . . . . . . . . . . . . . . . . . . . . 40
APPENDIX V: CONSIDERATIONS FOR A REQUEST FOR EXPRESSIONS OF INTEREST FOR POTENTIAL
PACE PROGRAM ADMINISTRATORS . . . . . . . . . . . . . . . . . . . . . . . . . . . . . . . . . . . . . . . . . . . . . . . . . . . . . . . . . . . . . 43
WORKS CITED . . . . . . . . . . . . . . . . . . . . . . . . . . . . . . . . . . . . . . . . . . . . . . . . . . . . . . . . . . . . . . . . . . . . . . . . . . . . . . . . 44

1Passaic county EnErgy ManagEMEnt MarkEt
I . Introduction
A . Purpose of this ReportThis document reports the findings of a collaborative action research project between the Massachusetts Institute of Technology’s CoLab Green Economic Development Initiative (MIT GEDI), and staff at Passaic County’s Department of Planning and Economic Development. The goal of this collaboration is to identify strategies that can grow good energy management practices in commercial buildings Passaic County, and thereby realize a stronger economy.
Chapter I of this report describes what we mean by “energy management”; reviews literature of the potential for energy savings in Northern New Jersey’s building stock; and describes the potential economic benefits of improving energy management.
Chapter III summarizes our research findings on the market for energy services, and programs that more broadly support energy management in Passaic County and Northern New Jersey.
Chapter IV suggests roles that Passaic County and the County’s partners can play to grow markets for energy services and promote good energy management in private-sector commercial buildings.
B . What is “Energy Management”?“Energy Management” refers to efforts to minimize buildings’ energy costs and meet other energy-
related goals, such as environmental performance and healthy indoor conditions. Comprehensive energy management requires action by multiple stakeholders in buildings – building owners; property managers; building operators; tenants; energy efficiency program administrators; third-party consultants and energy service providers; financiers; and others. Energy management can entail a whole host of initiatives by these stakeholders. Below, we note some important energy management practices used in commercial buildings, which are summarized in Figure 1.
Figure 1: Energy management practices in commercial
buildings.
ADOPT/REVISIT ENERGY MANAGEMENT POLICY
PERFORMANCE TRACKING
CAPITAL UPGRADES
OPERATIONAL IMPROVEMENTS & COMMISSIONING
TENANT ENGAGEMENT

2Passaic county EnErgy ManagEMEnt MarkEt
Adopting an energy management plan / policy
Building owners are increasingly adopting energy management policies to guide efforts to improve energy management in their portfolios, including energy savings targets and responsible managers. Adopting such a high level commitment is a good early step in the energy management process.
Tracking Performance – Energy dashboards, reporting and benchmarking
You cannot manage what you do not measure and track. Increasingly, building owners, managers, operators, and tenants are making use of “energy dashboards”. Such dashboards synthesize energy data from multiple sources (utility bill, equipment readings, and so on) and provide key information to the appropriate stakeholders involved in energy management (owners, managers, operators, and so on). Many firms also “benchmark” their buildings energy use to its historic use and that of peer buildings. The US EPA’s Energy Star Portfolio Manager is the de facto national benchmarking platform, with 40 percent of commercial building space in the USA tracked in this system.
Operational improvements & commissioning
How buildings are operated profoundly influences their energy use. By some estimates, half of all cost-effective energy efficiency opportunities can be achieved just by no- or low-cost improvements to existing systems (EON, 2013). Ensuring building operators are properly trained is critical. Likewise, many real estate firms are incorporating energy performance criteria into building operators’ and managers’ job description, to incent improved performance. Additionally, building operations can be aided by the assistance of a professional commissioning agent.
BUILDING COMMISSIONING OR “TUNE-UPS”
Commissioning services (or “tune-ups”) involve a detailed assessment of building systems to ensure that all systems are functioning optimally in accordance with their original design intent, and correct any deficiencies. This service is typically provided by a specialist third-party commissioning agent. Commissioning encompasses a variety of techniques, including testing that equipment is in working order; calibrating sensors; reviewing building scheduling, and adjusting building air heating and conditioning set points accordingly; re-programming building controls; and other techniques.
Commissioning has traditionally been offered as a short-term service (perhaps lasting a few months), ideally repeated every two to five years to ensure the building remains in working order. However, novel “on-going commissioning” are increasingly becoming available. These services use data from building systems controls and meters, streaming this data through computer applications to identify energy saving opportunities in real-time.
Commissioning has tremendous potential to reduce energy use. The most comprehensive national survey of building commissioning projects reveals a median 22% savings in energy costs for office buildings (16% for all building types), with a payback time of 1 .1 years . Yet, perhaps only five percent of the market potential of commissioning has been realized; the vast majority of appropriate buildings do not undertake regular comprehensive retro-commissioning (Mills, 2011).
Capital upgrades
In addition to operational improvements, many energy efficiency opportunities involve the “upgrading” building equipment and systems with more efficient systems. Often, upgrades to systems occur only when systems reach the end of their life; however, savvy building owners and managers will pro-actively replace systems when doing so lowers net costs. Upgrades can be classified into two types: Standard and Deep Upgrades.

3Passaic county EnErgy ManagEMEnt MarkEt
STANDARD UPGRADES
A variety of upgrades entail relatively prescriptive equipment replacements, which necessitate minimal interruptions to building users and thus can be implemented at most times in a buildings’ life cycle. These standard upgrade measures involve lighting and simpler HVAC equipment replacements. Such standard upgrades typically yield 15-25 percent energy savings, with energy savings paying back the cost of upgrades in two to five years. These are the most common types of upgrades; Zhai et al (2012) report that a little over two percent of all commercial buildings in the USA receive some type of standard upgrade each year.
DEEP ENERGY UPGRADES
“Deep energy upgrades” are defined as those that aim to achieve greater than 40% energy savings. Deep energy upgrades include major HVAC systems redesign and improvements to the building envelope, in addition to the measures included in standard upgrades. Deep energy upgrades are best realized through an “integrated design process”, involving the building owner; architect and engineering design teams; financial decision-makers and advisers; and building operations staff. These stakeholders engage in an iterative design process involving: identifying the optimal technical potential of the building; key constraints that necessitate scaling back elements of the technical optimum; and finally arriving at a technical and financial plan to upgrade the building (RMI, 2013).
Frequently, deep upgrades can realize even greater financial performance that standard upgrades in terms of the projects’ net present value, though deep upgrades may entail longer payback periods. However, unlike standard upgrades that can be deployed at most times in a buildings’ lifecycle, deep upgrades often only make sense at certain milestones in a building’s life, including:
■■ Renovation / redevelopment / adaptive reuse of an existing building.
■■ Near the end-of-life of roof, windows, siding, HVAC, or major lighting systems.
■■ New acquisition or refinancing.■■ Major new tenants.
At these times, disruptions from major renovations are less of a concern, the deep energy retrofit may be coupled with other building improvements, and the building owner may have greater access to affordable financing.
Currently, there is low uptake of deep energy retrofits in American commercial buildings, although there is growing interest in such services.
Occupant/tenant engagement – Green Leases
Building occupants’ behavior has a profound effect on buildings energy use. Many energy management efforts include occupant engagement, aimed at changing behaviors that effect energy use.
“Green leases” are an important strategy to engage tenants. Green leases include provisions that encourage both tenants and owners to pursue cost-effective energy management strategies, and align their interests in pursuing good energy management. Important provisions include:
■■ “Pass through” provisions, whereby owners can pass the costs of energy management projects that save tenants on their utility bills through to tenants. Otherwise, buildings will face a “split-incentive” in energy use, whereby they are expected to invest in energy upgrades but tenants reap the financial benefits.
■■ Allowing the owners’ energy service providers and/or building engineers to review tenants’ space design during tenant improvements, to suggest better choices.
■■ Specifying tenants energy consumption targets and/or equipment that will not be included in the building (incandescent light bulbs, non-Energy STAR appliances, and so on).
A number of organizations, such as the national Building Owners and Managers Association or the Natural Resources Defense Council, have developed green lease language (BOMA, 2011 and NRDC, 2011). The adoption of green lease terms is growing rapidly in the commercial real estate market;

4Passaic county EnErgy ManagEMEnt MarkEt
nevertheless, in MIT GEDI’s experience, the majority of building owners and property managers are not well versed in these tools, and require guidance and encouragement in their adoption.
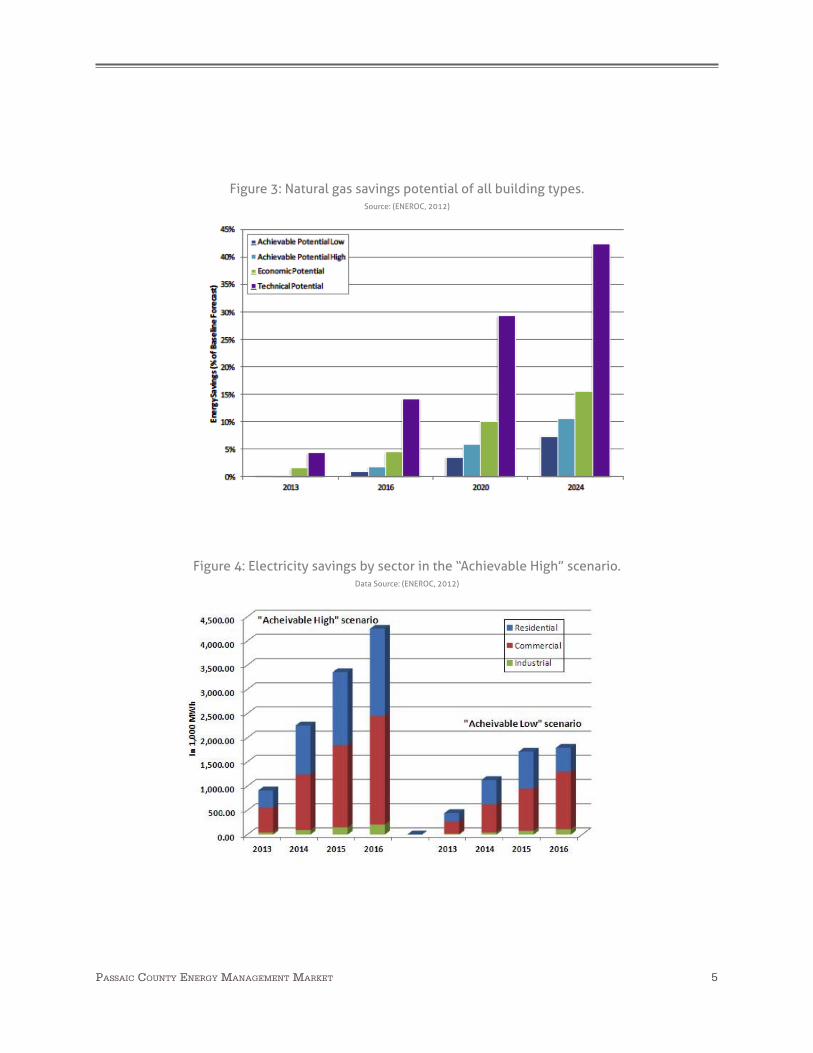
C . Energy Efficiency Potential of NJ Commercial BuildingsThe energy savings potential of New Jersey buildings is substantial. Recent analysis by Eneroc Utility Solutions evaluated the potential for energy savings in New Jersey buildings. Their analysis, presented in Figures 2 and 3, suggest that by 2024 the commercial sector in New Jersey could cost-effectively reduce electricity use 27 percent below baseline values, and natural gas use 16 percent. Figures 2 and 3 also present the “Technical Potential” for energy savings (what is technologically possible), and estimates of the range of “Achievable” savings that the New Jersey Clean Energy Program can actually achieve over this time period. These
scenarios reflect different assumptions about people’s behaviors, the rate of uptake of energy efficiency in New Jersey, and the performance of other energy efficiency programs around the country. By implementing appropriate policies and programs, the County can assist commercial buildings realize a greater amount of this cost-effective energy efficiency potential; Chapter 3 describes our policy recommendations.
As illustrated in Figures 4 and 5, the lion’s share of New Jersey’s energy savings potential is found in commercial buildings. Thus, it makes sense for Passaic County to focus its efforts on this sector to realize greater energy savings.
Realizing greater energy savings can have a substantial economic impact in the County. In 2011, the New Jersey commercial building sector spent about $5.3 billion on electricity and $1.8 billion on natural gas (US EIA, 2012). While specific energy spending data for Passaic County buildings is unavailable, it is likely roughly proportionate to Passaic County’s share of commercial floor space.
Figure 2: Electricity savings potential of all building types.Source: (ENEROC, 2012)
5Passaic county EnErgy ManagEMEnt MarkEt
Figure 3: Natural gas savings potential of all building types.Source: (ENEROC, 2012)
Figure 4: Electricity savings by sector in the “Achievable High” scenario.Data Source: (ENEROC, 2012)

6Passaic county EnErgy ManagEMEnt MarkEt
D . Economic Benefits of Energy Savings Section C above notes the substantial savings that better energy management can realize. Achieving this potential for energy savings in Passaic County can result in a wide variety of local economic benefits. Some of these benefits are detailed below.
Enhanced Business Profitability
Reducing operating costs by lowering energy spending realizes greater profits for businesses. Energy and other utilities comprise the largest non-labor operating costs for buildings in most regions of the USA. For example, energy and water account for 22 percent of office owners’ operating expenses, equating to about $2.25 per square foot (RMI, 2013).
The effect on businesses’ net profits can be especially profound for businesses with low profit
margins, and for whom energy costs make up a large percentage of their operating costs. Analysis by the National Trust for Historic Preservation provides a useful illustration of these dynamics: As restaurants and groceries have low profit margins and high energy costs, they can realize significant increases in their net operating income by reducing energy spending; the percentage increase in office property profits are not as great, though they can still result in large savings in aggregate and significant enhancements to the value of the property (see Figure 6).
Interviews with real estate organizations in Passaic County shed light on the fact that if there is financial benefit property owners are willing to make energy efficiency changes to keep their buildings appealing to lessees. It was also recognized that property managers are becoming more aware of tactics to keep costs down, and energy efficiency is one of them. This evidence suggests that Passaic County could aid businesses’ profitability particularly that of small business with low profit margins, by facilitating adoption of cost-effective investments in energy efficiency.
Figure 5: Natural gas savings by sector in the “Achievable High” scenario.Data Source: (ENEROC, 2012)

7Passaic county EnErgy ManagEMEnt MarkEt
Enhanced Value of Real Estate
Lower operating costs, healthier buildings, and a “green” brand can add to building values and rents, as occupants are willing to pay more to locate in such buildings. The Institute for Market Transformation’s meta-analysis of national studies investigating the impact of LEED and ENERGY STAR rating on real estate performance has found consistently positive premiums on rents, sales price, and occupancy (see Figure 7).
Job Creation
Energy management can meaningfully increase the amount of employment opportunities available in local economies. Energy efficiency engenders economic activity and a net increase in jobs in one of two ways:
1) Jobs are created due to investments in energy management (“investment related jobs”): Short-term spending on energy projects leads to direct, indirect, and induced jobs. Job creation begins when an energy efficiency project is undertaken and workers are needed,
thus leading to the creation of direct jobs. Indirect jobs are created when suppliers of energy management products (HVAC systems, insulation, and so on) employ more workers to produce goods. Finally, all these workers spend their earnings in the local economy, realizing further economic activity and job impacts.
2) Jobs are created due to the reinvestment of energy savings (“savings related jobs”): As energy savings are shifted away from spending on utilities and towards more labor-intensive sectors of the economy, increased jobs and economic productivity are realized.* Thus, investments in energy efficiency entail an “import substitution” strategy, as less energy per unit of economic product will be need to be imported to the region. These import substitution effects are likely stronger in metropolitan regions, as most metropolitan regional economies do not have a large number of jobs in fossil fuel supply sectors.
* Nationally, the energy generation and distribution sectors have a job intensity
of 10 jobs per $1 million spent in these industries. In comparison, the economy as a
whole has 17 jobs per $1 million spent (Bell, 2012). Thus, shifting utilities spending
to other economic sectors realizes job growth.
Figure 6: Increase in percent of profit associated with energy savings, using national average business energy costs and profit margins.
Source: (NTHP PGL, 2013) Data from the IRS.

8Passaic county EnErgy ManagEMEnt MarkEt
Appendix I summarizes a number of studies that estimate the increase in net job associated with policies that encourage investments in energy efficiency. This net increase in employment is about 1-2% in most of the regions studied, and all studies suggest that energy savings policies will realize net positive economic outcomes.* However, the impacts suggested by these studies differ substantially, ranging from about 0.2% in some locales, to about 8% in the Northeast states. These differences in employment projections are the result of a number of factors: Each study estimates regions’ energy efficiency potential differently, and conducts the analysis over different time horizons. Additionally, regions differ in the structure of their economy, and the price of energy; these differences profoundly influence the macroeconomic impacts of investments in efficiency. Finally, these studies differed in their economic modeling methodology.
To get a strong understanding of these dynamics
* MIT GEDI estimated these net impacts by using Bureau of Labor Statistics State
and Local employment data, and projecting out the total level of future employment
by applying a simple 1.5 per annum job growth estimate. This methodology is highly
simplistic, and is intended only to illustrate the approximate scale of impact that
investments in energy efficiency can realize.
in Passaic County would necessitate a detailed econometric study of the region. However, it is safe to conclude from the literature that while not representing a silver bullet, investments in energy management can contribute meaningfully to a healthier and more job-intensive economy in Passaic County .
Health and Productivity Improvements Associated with Building Design and Energy Management
Building energy upgrades can also realize health and productivity improvements for employees working in these buildings. Appendix II summarizes MIT GEDI’s literature review of studies evaluating the link between energy management initiatives and improved occupant health. While more study is needed, the balance of evidence suggests that:
Energy-efficient building design and good energy management practices can improve worker performance . A number of studies have shown that measures such as temperature control, improved indoor air quality, lighting system quality, and access to the natural environment can both
Figure 7: Premium associated with green rated commercial real estate - results from mul-tiple national-scale studies. Asterisk indicates that studies tracked only two of the three
indicators of real estate performance.Source: Institute for Market Transformation.

9Passaic county EnErgy ManagEMEnt MarkEt
reduce buildings’ energy use and improve the individual performance of employees working in those buildings. Workers accomplish their objectives in shorter amounts of time and in general demonstrate individual productivity gains. Some studies suggest that investments in efficiency and healthy buildings are also associated with decreased churn costs, or the costs associated with employees leaving a company and necessitating replacement.
Energy-efficient building design and good energy management practices can improve worker health . The balance of evidence suggests that investments in energy efficiency and improved building performance can realize positive impacts on workers’ health and well-being. In particular, upgrades have been shown to address indoor air quality and reduce “sick building” syndrome.
The health and productivity benefits result in an even more compelling financial case for energy management . Employee and labor costs typically
exceed the costs of space for firms by well over an order of magnitude (see Figure 8); therefore, small incremental improvement to occupants’ health and productivity associated with energy management initiatives can realize substantial lifecycle savings for building occupants. Thus, local governments have an interest in fostering such energy management initiatives, to build a healthier and more productive community. The challenge is creating market demand for such outcomes amongst owners and tenants, especially when research in this area is still relatively new and conditions in each building will differ.
These effects will likely be most pronounced when owners, design teams, operators and managers explicitly aim to improve indoor health and conditions as part of their energy management practices. Thus, improved health and well-being should be a key focus of energy management initiatives.
Figure 8: Costs associated with an office building.Source: National Institute of Building Sciences, 2010

10Passaic county EnErgy ManagEMEnt MarkEt
Reducing Environmental Impacts
Buildings’ energy use results in a range of environmental impacts, including air and water pollution and climate change. Indeed, more than 30 percent of New Jersey’s climate change emissions are attributed to commercial and industrial facilities.
Passaic County’s economy and its residents will suffer if such environmental impacts go unmitigated. For example, recent evidence suggests that the recurrence of storm surges like that experienced during Hurricane Sandy will be much more frequent under future sea level rise regimes; by 2050, storm surges of the height experienced during Sandy could occur every 1-2 years in Atlantic City, under a “High” warming and sea level rise-sensitivity scenario (see Figure 9) (Sweet, Zervas, Gill, & Park, 2013). The Christie Administration estimates that the damage from Hurricane Sandy will cost the New Jersey roughly $37 billion (Christie, 2012).
The emissions from Passaic County alone will have an inconsequential impact on global climate change. However, by taking leadership on promoting good energy management, Passaic County can
innovate good practices that can be adopted by other governments and businesses across the nation and around the world. The combined impact of such innovative practice can collectively help reduce negative environmental outcomes, and the associated economic and social costs.
E . What is required to achieve good energy management?Based on studies and experiences in multiple markets, achieving the full potential of energy management means that:
Owners and financial decision-makers must understand and prioritize energy management . Firms’ ownership and senior management must recognize the opportunity that energy management represents, direct their staff to pursue these opportunities, and be willing to invest some time in considering energy projects. Too often, owners
Figure 9: “Sandy level” storm surge recurrence frequency under different sea level rise projections, in 2050 and 2100.

11Passaic county EnErgy ManagEMEnt MarkEt
and chief financial officers are too busy to prioritize energy management.
Building management and operations staff must have strong understanding of energy management opportunities and financial analysis . These staff must possess proper training and experience, and sufficient time to develop and implement projects. They must also possess the experience, understanding and skill to manage services by third parties.
Building owners and managers must have connections to highly skilled service providers . Many energy management projects require the assistance of expert third party advisors and project managers. In some nascent markets (both regions and building types), there are not a sufficient number of skilled service providers. Additionally, it is often not cost-effective for service providers to market their services to smaller clients with less capacity, for whom transaction costs will be higher; in these cases, firms need assistance in originating clients.
Building owners must have access to financing for energy management projects at attractive terms . Building owners have limited access to cash reserves and traditional financing; they typically prefer to spend their resources on their core business. Moreover, many properties are highly leveraged, and cannot accommodate further debt. Additionally, owners require project financing mechanisms that they can pass through payments to tenants, and that can be readily assumed by future owners. Historically, such efficiency financing mechanisms meeting these criteria have not been available. This situation is changing, however; as documented in MIT GEDI’s forthcoming Energy Project Financing Whitepaper, a number of innovative project financing that can overcome the various barriers to efficiency finance are increasingly available.
Owners must not face “hold” barriers . Many building owners only intend to hold ownership of their property for a limited time. Thus, they will only be interested in energy management projects that pay back in a short period of time; that future owners will recognize the value of and pay for; or
that that they can pass the financing and contract terms to the next owner. Again, this has traditionally severely hindered deeper energy management projects, though a variety of innovative services and financial mechanisms that can address these barriers are emerging in different parts of the USA.* MIT’s forthcoming guidance document on energy project financing profiles many such financing mechanisms.
Incentives must be aligned between owners and tenants . Frequently, owners are expected pay for building upgrades, while tenants may reap the benefits of lower utility bills. To overcome this split-incentive, owners’ require a means to pass the cost of the project on to tenants, or to recoup their spending with higher rent. Different financing mechanisms, green leases, or educated tenants that recognize the value of reduced energy use in their buildings, can all serve to ameliorate this barrier.
The Need for Market Transformation
In practically all real estate markets, these conditions are far from being realized. Thus, there is a strong movement to foster market transformation. Market transformation refers to efforts to reduce barriers to energy management, and realize more perfectly functioning markets by providing better quality information; reducing transaction costs; facilitating access to capital; and aligning structural incentives so that building owners, managers and tenants all have an interest in pursuing cost-effective energy management. A myriad of different strategies are used to effect market transformation, and government, utilities, the private sector, and non-profit organizations all play important roles in these efforts.
In the following chapter, we examine market conditions in Passaic County, and the broader northern New Jersey region. Chapter III outlines opportunities for Passaic County and its partners to engage in market transformation
* Such mechanisms include the variety of commercial Property Assessed Clean En-
ergy financing mechanisms being adopted around the country; so-called “Efficiency
Service Agreements”, especially when repaid via on-utility bill payments, such as
has been implemented in the district energy utility Seattle Steam’s service area; and
many other promising mechanisms.

12Passaic county EnErgy ManagEMEnt MarkEt
II . Market Conditions in Passaic County and the State of New JerseyAs documented above, energy efficiency is associated with a range of economic benefits. However, markets for energy efficiency services are frequently impacted by a variety of barriers and imperfections, which limits the adoption of efficiency below what is economically optimal.
In order to better understand what conditions may be impacting markets for energy services in commercial buildings, MIT GEDI and Passaic County engaged in an analysis of the energy service industry in Passaic County. This characterization of the local industry was informed by:
■■ A review of existing publications on Energy efficiency policy and initiatives in New Jersey, and the barriers to growing efficiency in New Jersey; the local real estate market; and New Jersey’s workforce development system.
■■ Review of existing regional energy efficiency programs; energy efficiency financing programs; economic development initiatives; and workforce development initiatives.
■■ Interviews with numerous local market participants, including energy service providers; building owners and property managers; efficiency program administrators; real estate organizations; members of the workforce development system, and other stakeholders.
■■ A survey of energy service firms serving Northern New Jersey. Twenty-seven firms responded to the our survey. A detailed summary of responses is located in Appendix III.
A . Real Estate Market AnalysisTable 1 on the following page presents real estate market conditions for commercial and industrial real estate in Passaic County and northern New Jersey, and suggests a number of conclusions important to energy efficiency markets in the region.
Firstly, Passaic County represents a small percentage of Northern New Jersey’s total floor-space. However, energy spending in the County is still significant; conservatively estimating that energy costs amount to $2 per square foot,* it is safe to assume that commercial and industrial buildings in Passaic County spend more than $175 million on energy annually.
Vacancy rates for office space are high at 15-16 percent in Passaic County; this significant level of vacancy may make property owners hesitant to invest due to lack of lessees. Without occupants to reap the benefits of energy efficiency savings, the financial time horizons over which energy upgrades and retro-commissioning secure benefits is extended. While vacancy is typically higher in Class B and C office space, according to CoStar (CoStar Office Report, 2013) at the end of the first quarter 2013, Class C had the lowest vacancy (11.6%) with Class B at 15.4% and Class A with the highest vacancy rate of 16.5%. These statistics convey that the current state of the economy is pushing for more cost-effective business management, making now
* Costs for Passaic County buildings are likely at least this much. $2/SF is a little
less that in most commercial building types, nationally (US DOE EERE, 2012). New
Jersey has higher average commercial and industrial energy prices than the national
average (US EIA, 2013).

13Passaic county EnErgy ManagEMEnt MarkEt
an appropriate time to implement cost-effective energy efficiency measures. Conversely, building owners face uncertainty as to whether their spaces will be occupied, and likely are hesitant to invest in energy improvements when leasing the space is not assured.
Real estate leases’ treatment of energy payments also profoundly impacts the likelihood of buildings investing in energy efficiency. In Passaic Count triple net leases are most common (CoStar Office Report, 2013). In those lease situations the lessees are in charge of all real estate taxes, building insurance, and maintenance. Such triple net leases are subject to split-incentives between building owners and tenants, whereby owners are responsible for capital improvements, but tenants pay energy bills. Various ‘Green leasing’ terms, or financing structures, can ameliorate these difficulties.
B . Energy Services SectorMIT GEDI conducted a survey of energy service firms in the state of New Jersey, to which 27 firms responded (summary in Appendix III). Likewise, Passaic County staff engaged in more intensive in-person interviews with these stakeholders. These sources reveal a few important conclusions about firms serving this space:
Referrals drive most business for energy service firms – Companies most commonly cited referrals as their primary source of clients. The second most commonly cited source was repeat customers. This suggests that efforts to grow opportunities for referrals may support growth in the efficiency services sector.
Customers’ trust is critical for energy services firms to expand markets – Most companies cited a lack of customer commitment and customers’ past poor experiences with energy management firms as important impediments to growing their markets.
Transaction Cost – While there are certainly benefits for energy efficiency, with the vacancy rates being so high for leased properties the potential that no lessees will fill the space is a risk. By implementing new and upgraded facilities the rents would in turn be raised potentially making the property less appealing for those solely looking at the cost of a space. Property owners will often need to front the capital of energy upgrades in hope that a leaser will accept the rent increase and recognize the quality invested into the building.
On the job training is the most important workforce development strategy - Companies recognized on-the-job training as the most important training resource to develop skills in energy efficiency services. There is less recognition of energy management credentials, in part because of the diversity of credentials in the energy management space.
Table 1: Real Estate Market Conditions in Passaic County and northern New JerseySource: CoStar Office Report, 2013
Industrial Industrial Office Office Retail Retail
Northern NJ Passaic County
Northern NJ
Northern NJ
Passaic County
Number of buildings 17,306 1,394 15,907 705 32,252 1,933
Total Rentable Building Area (RBA) (in sq. ft.)
808,875,437 54,911,632 354,435,444 13,038,163 352,044,812 21,631,645
Vacanacy rate 9.10% 8.00% 15.00% 15.00% 6.60% 6%
Direct Triple Rent $5.78/sf $5.53/sf $22.94/sf $20.47/sf $19.37/sf $22.7/sf
Sales Price $61.60/sf $58/sf $176.47/sf $159/sf $122.41/sf $133/sf

14Passaic county EnErgy ManagEMEnt MarkEt
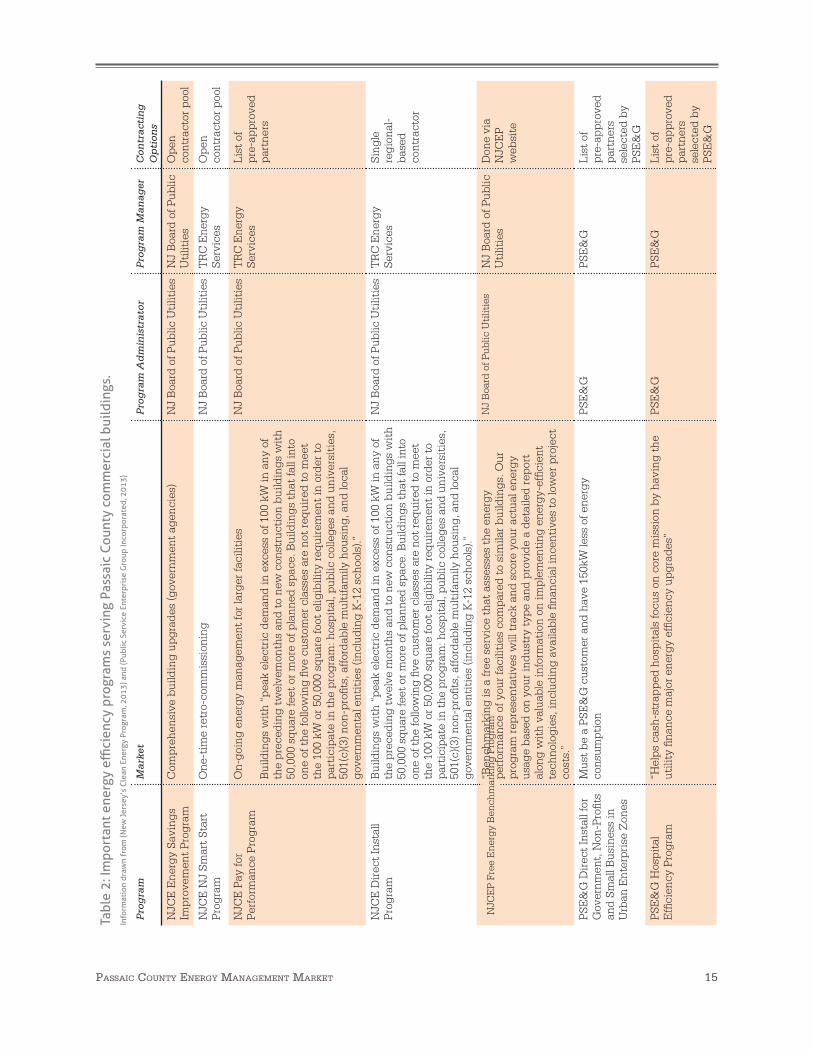
C . Ratepayer Funded Energy Efficiency ProgramsThe ratepayer-funded New Jersey Clean Energy Program (NJCEP) provides a wide array of energy efficiency programs, with an offering for most building types found in Passaic County. Likewise, the Public Service Electric and Gas Company (PSE&G) has efficiency programs for certain customer types, and also features an interest-free on-bill financing program for commercial buildings. Both the PSE&G and NJCEP programs are summarized on the following page in Table 2.
While these programs provide a valuable resource to Passaic County, most applicable buildings in our region have not taken advantage of these programs. There are numerous explanations as to why programs are not being carried through to their full potential. The paragraphs below highlight key issues identified in reviews of NJCEP’s programs, and in interviews of industry participants and energy program personnel.
Limited understanding amongst program clients of energy saving opportunities - Interviews with program administrators and evidence in the AEG Evaluation suggest that potential customers for NJCEP programs are frequently unaware of the energy savings opportunities in their buildings. Interviewees noted the need for clear, concise, compelling, and actionable information to be relayed to potential clients. Messaging should focus on the program improvements in the NJCEP; while in the past the NJCEP process was confusing, it has become easier to navigate.
Need for greater long-term stability - The New Jersey Office of Clean Energy’s Evaluation of New Jersey’s Clean Energy Programs notes that “the NJCEP has been hindered by a lack of long-term planning and stability in the marketplace… budget uncertainty and program rule changes create confusion and paralysis from both customers and the program market partners. Creating an efficient program market requires multi-year plans with
committed resources” (AEG, 2012). The County may join with other local governments, non-profits, and private sector stakeholders in advocating for greater financial stability for the NJCEP.
Capital Barriers – Despite the presence of financial support for energy efficiency projects, often times upfront capital is still needed to get a project off the ground. Investing to improve a building with lease terms often being in much shorter time-frames than in the past, can make building owners wary about investing in a project that would imply an increase in rental costs. While the opportunity for financing and rebates is a pertinent factor to the implementation of energy efficiency there are still capital barriers that businesses face.
Networks and references drive participation in programs – NJCEP conducts outreach via a variety of civil society networks, such as small business associations, chambers of commerce, and Rotarian groups. Similar to our survey of energy service providers, interviews with energy program managers and contractors suggested that informal references were the most important source of new participants.
Opportunity to partner with local government to market programs – A review of the NJCEP concluded that government should engage in greater marketing to lend the programs greater legitimacy and recognition (AEG, 2012). Likewise, PSE&G staff noted that they see an opportunity to partner with local government in promoting their programs. Additionally, various interviewees noted that local government must lead by example, pursuing deep energy management in their own buildings, and publicly relating their experiences with these efforts.
Passaic County currently promotes energy programs, and there is an opportunity to expand on these efforts - The Passaic County Planning and Economic Development Department currently promote NJCEP’s programs to a limited extent. The Business Expansion and Relocation packet has materials that address these programs. Likewise, the Economic Development Division hosts an annual conference on Green Building Design, which typically includes presentations from the NJCEP. Lastly, programs are listed in the County’s annual business directory.
15Passaic county EnErgy ManagEMEnt MarkEt
Tabl
e 2:
Impo
rtan
t ene
rgy
effici
ency
pro
gram
s se
rvin
g Pa
ssai
c Co
unty
com
mer
cial
bui
ldin
gs.
Info
rmat
ion
draw
n fr
om (N
ew J
erse
y’s
Cle
an E
nerg
y Pr
ogra
m, 2
013)
and
(Pub
lic S
ervi
ce E
nter
pris
e G
roup
Inco
rpor
ated
, 201
3)
Pro
gra
mM
arke
tP
rog
ram
Ad
min
istr
ator
Pro
gra
m M
anag
erC
ontr
acti
ng
O
pti
ons
NJC
E E
nerg
y Sa
ving
s Im
prov
emen
t Pr
ogra
mC
ompr
ehen
sive
bui
ldin
g up
grad
es (g
over
nmen
t ag
enci
es)
NJ
Boa
rd o
f Pub
lic U
tilit
ies
NJ
Boa
rd o
f Pub
lic
Uti
litie
sO
pen
cont
ract
or p
ool
NJC
E N
J Sm
art
Star
t Pr
ogra
mO
ne-t
ime
retr
o-co
mm
issi
onin
gN
J B
oard
of P
ublic
Uti
litie
sT
RC
Ene
rgy
Serv
ices
Ope
n co
ntra
ctor
poo
l
NJC
E P
ay fo
r Pe
rfor
man
ce P
rogr
amO
n-go
ing
ener
gy m
anag
emen
t fo
r la
rger
faci
litie
s
Bui
ldin
gs w
ith
“pea
k el
ectr
ic d
eman
d in
exc
ess
of 1
00 k
W in
any
of
the
prec
edin
g tw
elve
mon
ths
and
to n
ew c
onst
ruct
ion
build
ings
wit
h 50
,000
squ
are
feet
or
mor
e of
pla
nned
spa
ce. B
uild
ings
tha
t fa
ll in
to
one
of t
he fo
llow
ing
five
cust
omer
cla
sses
are
not
req
uire
d to
mee
t th
e 10
0 kW
or
50,0
00 s
quar
e fo
ot e
ligib
ility
req
uire
men
t in
ord
er t
o pa
rtic
ipat
e in
the
pro
gram
: hos
pita
l, pu
blic
col
lege
s an
d un
iver
siti
es,
501(
c)(3
) non
-pro
fits,
affo
rdab
le m
ulti
fam
ily h
ousi
ng, a
nd lo
cal
gove
rnm
enta
l ent
itie
s (in
clud
ing
K-1
2 sc
hool
s).”
NJ
Boa
rd o
f Pub
lic U
tilit
ies
TR
C E
nerg
y Se
rvic
esLi
st o
f pr
e-ap
prov
ed
part
ners
NJC
E D
irec
t In
stal
l Pr
ogra
mB
uild
ings
wit
h “p
eak
elec
tric
dem
and
in e
xces
s of
100
kW
in a
ny o
f th
e pr
eced
ing
twel
ve m
onth
s an
d to
new
con
stru
ctio
n bu
ildin
gs w
ith
50,0
00 s
quar
e fe
et o
r m
ore
of p
lann
ed s
pace
. Bui
ldin
gs t
hat
fall
into
on
e of
the
follo
win
g fiv
e cu
stom
er c
lass
es a
re n
ot r
equi
red
to m
eet
the
100
kW o
r 50
,000
squ
are
foot
elig
ibili
ty r
equi
rem
ent
in o
rder
to
part
icip
ate
in t
he p
rogr
am: h
ospi
tal,
publ
ic c
olle
ges
and
univ
ersi
ties
, 50
1(c)
(3) n
on-p
rofit
s, a
fford
able
mul
tifa
mily
hou
sing
, and
loca
l go
vern
men
tal e
ntit
ies
(incl
udin
g K
-12
scho
ols)
.”
NJ
Boa
rd o
f Pub
lic U
tilit
ies
TR
C E
nerg
y Se
rvic
esSi
ngle
re
gion
al-
base
d co
ntra
ctor
NJC
EP
Free
Ene
rgy
Ben
chm
arki
ng P
rogr
am“B
ench
mar
king
is a
free
ser
vice
tha
t as
sess
es t
he e
nerg
y pe
rfor
man
ce o
f you
r fa
cilit
ies
com
pare
d to
sim
ilar
build
ings
. Our
pr
ogra
m r
epre
sent
ativ
es w
ill t
rack
and
sco
re y
our
actu
al e
nerg
y us
age
base
d on
you
r in
dust
ry t
ype
and
prov
ide
a de
taile
d re
port
al
ong
wit
h va
luab
le in
form
atio
n on
impl
emen
ting
ene
rgy-
effic
ient
te
chno
logi
es, i
nclu
ding
ava
ilabl
e fin
anci
al in
cent
ives
to
low
er p
roje
ct
cost
s.”
NJ
Boa
rd o
f Pub
lic U
tilit
ies
NJ
Boa
rd o
f Pub
lic
Uti
litie
sD
one
via
NJC
EP
web
site
PSE
&G
Dir
ect
Inst
all f
or
Gov
ernm
ent,
Non
-Pro
fits
and
Smal
l Bus
ines
s in
U
rban
Ent
erpr
ise
Zon
es
Mus
t be
a P
SE&
G c
usto
mer
and
hav
e 15
0kW
less
of e
nerg
y co
nsum
ptio
nPS
E&
GPS
E&
GLi
st o
f pr
e-ap
prov
ed
part
ners
se
lect
ed b
y PS
E&
G
PSE
&G
Hos
pita
l E
ffici
ency
Pro
gram
“Hel
ps c
ash-
stra
pped
hos
pita
ls fo
cus
on c
ore
mis
sion
by
havi
ng t
he
utili
ty fi
nanc
e m
ajor
ene
rgy
effic
ienc
y up
grad
es”
PSE
&G
PSE
&G
List
of
pre-
appr
oved
pa
rtne
rs
sele
cted
by
PSE
&G

16Passaic county EnErgy ManagEMEnt MarkEt
D . Project Financing Mechanisms NJCEP offers cash incentives and rebates for energy upgrades. However, building owners may not be able to cover costs from their reserves, and may require additional sources of project financing. MIT GEDI’s research of energy project financing mechanisms and interviews with market participants suggest that commercial building owners can best realize energy efficiency by using project financing mechanisms that:
■■ Feature relatively low interest rates payable over a long time period, allowing projects to be “cash flow positive” with energy savings outweighing financing payments. This likely requires that outside security features or credit enhancements are provided for financing mechanisms.
■■ Cover 100 percent of projects’ costs.
■■ Are “off-balance sheet”, meaning financing is structured so as not add debt to the property and re-payments can be treated as an operating expense.
■■ Are structured so that financing re-payments can be passed through to tenants under existing lease terms, to overcome “split-incentives” being owners and tenants.
■■ Be readily transferred to future property owners, overcoming “hold” barriers.
■■ Can cover all potential energy upgrade measures, including both energy efficiency and distributed energy generation.
Various innovative project financing mechanisms have been introduced around the country, with varying ability to realize these criteria. Some mechanisms require some sort of intervention by government or utilities, for instance to enable re-payment via property taxes or the utility bill. Other mechanism can be implemented by the private sector independently; however, government can support greater adoption of these mechanisms
by facilitating education, participating in pilots of financing products, and providing capital or credit enhancements to support their deployment. Table 3 reviews how some prominent energy financing mechanisms perform relative to criteria listed above. This list is not intended to be a comprehensive list of energy project financing mechanisms; rather, it serves to compare prominent financing tools.
Existing financing mechanisms used in Passaic
A few different financing mechanisms are currently available to support energy management projects in New Jersey. These mechanisms include:
■■ The Passaic County Improvement Authority Banc Program – A $15 million loan fund which can finance energy efficiency, among other facility improvements.
■■ PSE&G On-bill Financing – PS&G has a $300 million fund available for smaller properties (<150kW) and hospitals.
■■ Private sector funding options, notably Power Purchase Agreements (PPAs) and Energy Performance Contracts (EPCs) – It is important to note that PPAs are used to install distributed generation technologies, and cannot finance efficiency improvements, which present the most cost-effective opportunities. EPCs are rarely used in commercial real estate, and are used more in the MUSH (municipalities, universities, schools and hospitals) sector.
Knowledge of these mechanisms among the business community is highly limited. Greater promotions of these mechanisms and documentation of businesses’ experiences using these mechanisms can help facilitate their uptake. However, the current suite of available mechanisms still leaves extensive financing gaps; many commercial building types do not have access to attractive and appropriate financing mechanisms. PACE financing, explored in the section below, is a promising means to provide more financing options for commercial buildings in Passaic County.

17Passaic county EnErgy ManagEMEnt MarkEt
PACE Financing
MIT GEDI believes that Property Assessed Clean Energy (PACE) offers a particularly strong tool to enable energy upgrades in commercial buildings, since it addresses most of the issues that can otherwise hinder energy management projects. PACE financing involves a building owner voluntarily taking on financing, which is repaid via an assessment payment collected on their property tax bill; buildings owners who do not participate pay no assessment and see no change in their property tax bill. To facilitate PACE financing, local governments will establish a PACE financing district and a program to coordinate the implementation of that financing. Broadly, there are two models for how PACE programs can provide project financing:
■■ Open Market – Increasingly, PACE programs are structured to be “Open Market”, allowing multiple private financiers to compete in providing financing; under such Open Market models, municipalities are responsible for collecting PACE assessment payments, and remitting these funds to the financier. Neither the municipalities, nor the County Improvement Authority, would be required to finance projects, or be an intermediary for issues of debt backed by PACE; however, government bonding authorities could provide such services if they so desired. When using an Open Market program structure, a program administrator will typically provide additional oversight and/or baseline criteria of the projects’ financial and technical underwriting, to provide quality control and consumer protections.
■■ Closed Market – Alternatively, “closed” programs involve the program either securing a line of credit or using public funds to provide project financing. Municipalities may then issue a non-recourse revenue bond against the PACE repayments as “takeout” financing. Some programs offer hybrid models, allowing open market lending, while also offering revenue bond financing for projects meeting certain criteria.
Approximately forty PACE programs have been established across the USA, and more are in development. As of June 2013, these programs had collectively catalyzed $100 million in project financing activity, and the scale of financing activity is expected to increase rapidly (PACENow, 2013).
The Benefits of PACE
PACE is a transformative tool for energy project financing in commercial buildings because it:
■■ Allows for lenders to offer better interest rates and longer repayment terms (up to 20 years) than is otherwise available. This enables deeper energy efficiency and greater savings for projects.
■■ Offers strong security, senior to other debts, due to its being repaid on the property tax bill. This helps raise the capital needed to fund energy efficiency improvements. May be structured to be “off-balance sheet”. Recent analysis indicates that PACE repayments would likely not be considered debt under future FASB (Federal Accounting Standards Board) rules.
■■ Overcomes the split-incentive problem between building owners and tenants. PACE allows financing repayments to be passed through to tenants under most triple-net leases and modified gross leases, so that tenants share in the costs of energy improvements as well as the savings.
■■ Significantly reduces hold barriers, as the PACE assessment passes with the property to future owners.
Program administration options
Typically, local governments that offer PACE financing will institute a program to manage how buildings can use PACE. Administrators of these programs will typically perform the following duties:
■■ Design of the program, coordinating with local

18Passaic county EnErgy ManagEMEnt MarkEt
governments and state authorities.■■ Liaise with customers, financiers and
contractors, providing program guidelines for participating financiers and contractors.
■■ Provide oversight of technical and financial underwriting.
■■ Facilitate obtaining mortgage lender consent for energy upgrades.
■■ Provide outreach and marketing to property owners.
Programs can be administered in a variety of different ways:
■■ Each local government can administer their own program.
■■ The State can designate a program administrator, typically either a government agency or their contractor. The State of New Jersey has not appointed such an administrator.
■■ Local governments can partner to form a public body via a voluntary inter-local government agreement. The Florida Green Finance Authority is one such body, which administers programs in select local governments.
■■ A non-governmental organization can administer the program on behalf of local governments.
PACE Financing in New Jersey
Enabling state legislation was passed as amended in January 2012, allowing municipalities in New Jersey to adopt PACE financing districts, and establish PACE financing programs. Programs must be approved by the Local Government Services Division of the Department of Community Affairs.
The non-profit “NJ PACE” is seeking to administer programs on local governments’ behalf. NJ PACE intends to operate an “Open Market” PACE program, which would require the New Jersey State Legislature to amend existing legislation.
Interest in PACE amongst municipalities is unclear
This research was unable to determine the extent of interest in establishing PACE programs amongst area municipalities. MIT GEDI sought to interview municipal Business Administrators in Passaic County regarding municipalities’ interest in establishing PACE districts, and adopting a PACE program. However these inquiries were not answered.
Local stakeholders, as well as experiences with other programs across the country, suggest that municipalities will be most likely to actively consider establishing PACE programs when local real estate stakeholders request its adoption.
E . Workforce Development Initiatives
What types of jobs are associated with investments in energy management?
There are a wide variety of jobs associated with energy management, including positions in design, engineering, trades, construction, property management, operations and maintenance, financial services, and other sectors. However, there are a few positions that are particularly important to delivering strong energy management. These positions include:
■■ Professional service positionsCommercial Building Energy Auditor (a professional who provides energy assessments)Commissioning/Retro-commissioning Authority (a professional who provides commissioning services)
■■ Positions in the property management and operations sector
Energy/Facility ManagerOperating Engineer/Building Technician

19Passaic county EnErgy ManagEMEnt MarkEt
Currently, a varied range of credentials exist that designate competency in these different job categories (see Appendix IV). Following requests from national real estate firms interested in ensuring more standardize energy management credentials, the U.S. Department of Energy’s Building Technologies Office initiated efforts to define energy management competencies for different jobs (DOE BTO, 2012). In the future, credentialing organizations will be encouraged to certify to the DOE’s competency criteria.
New Jersey’s workforce development system
Efforts to support workforce development in the energy management space are influenced by New Jersey’s workforce development system. New Jersey’s Unified Workforce Investment Plan (State of New Jersey, 2012) describes the state workforce development system. The State Employment and Training Commission (SETC) coordinates with regional Workforce Investment Boards and Talent Advisory Councils representing different key sectors. Passaic County is identified as one of eight Local Workforce Areas in the state, and the Workforce Investment Board of Passaic County coordinates workforce resources for employers and job-seekers. The Board oversees the Passaic County Workforce Development Center, which serves as a “one-stop shop”, directing both local job-seekers and employers to training opportunities, on the job training support, and other resources.
Recent Energy Management-related Workforce Development Initiatives
In 2010, the Department of Labor’s State Energy Sector Partnership Program awarded the SETC a $6 million grant to develop trainings in energy efficiency and renewable energy sectors. The SETC coordinated with community colleges and other training providers to develop trainings in a number of skills, some relating to energy management in commercial buildings. The programs largely focused on training incumbent workers seeking new skills, though some trainees were new to these industries.
In another effort, the New Jersey Department of Labor and Workforce Development (supported in part by the Conserve to Preserve Foundation of the New Jersey Resources Corporation) created the Green Job Training Partnership Program. The program manager with whom we spoke had regional focus within northern New Jersey, which was one of four locales that this program funded. It focused on preparing entry-level workers for new jobs in support of the State’s Energy Master Plan, which resulted in the planning of energy-efficiency projects that were being readied for implementation by the NJBPU. The Labor and Workforce Development Department offered “on-the-job training” funds to reimburse employers for up to 50% of the minimum $15/hour wage paid during an initial three to six-month internship. The program ran for approximately a year and a half, but is no longer active.
Based on interviews with participants in the workforce development system about these experiences, a couple of conclusions can be drawn about the labor market for green energy:
Demand for trainings was limited – Interviewees noted that employers were not actively hiring out of many of the programs established. Investments in workforce development were not sufficiently coupled with policies that would grow demand for energy services. Likewise, liaising with the relatively disaggregated energy efficiency and renewable energy sectors proved challenging.
Industry recognizes that enhancing skills of existing employees will be necessary to improve energy management – Interviewees and survey respondents recognized the need to support a more skilled workforce in all positions noted above. However, recruiting participants to these programs proves challenging for many of the programs offered.
The greatest opportunity to enhance energy management capacity in the workforce is likely to support training amongst existing facility managers and building operators – A few energy management programs for facility managers and building operators are offered in New Jersey, and many more in neighboring states. Interviews suggested that only a small percentage of existing workers in these positions had attended

20Passaic county EnErgy ManagEMEnt MarkEt
such trainings; however, evidence from around the country suggests that more formalized trainings in energy management results in rapid return on investment for real estate, and could help regional performance in aggregate.

21Passaic county EnErgy ManagEMEnt MarkEt
Chapter II’s review of market conditions in Passaic County uncovered a number of key barriers that hinder good energy management in Passaic County, including:
■■ A need for information and education – Many building owners and property managers would benefit by better understanding the energy savings potential in their facilities, nor the programs, financing mechanisms, and service providers that are available to help them make energy improvements. They require information and education. As referrals drive most new energy management projects, providing more opportunities for businesses to hear about others’ experience can support stronger energy management.
■■ Lack of skills among the energy management skills of existing and future building managers and operators – Existing building managers and operators often do not possess up-to-date training and experience to implement sound energy management projects. Available training programs have been undersubscribed. There is an opportunity to increase participation.
■■ Financing gaps – Existing financing mechanisms available in the market do not adequately serve most commercial and industrial property types. Leasehold loans that allow tenants to fund improvement are hard to obtain since tenants cannot property the property as collateral. Property owners also face challenges securing long term loans when there existing mortgage loans or when they do not plan to hold their property for an extended period. Many properties face split-incentives and hold barriers, and need off-balance
sheet financing at attractive terms; financing meeting these criteria are not prevalent in the local market. These properties require a financing mechanism that ameliorates these conditions.
This section outlines actions that Passaic County can take to stimulate stronger energy management amongst its commercial and industrial building sector. Passaic County is limited in the extent of staff time it can devote to new efforts to promote energy management. The following recommendations can be undertaken by existing staff, with limited time commitment. These recommendations are intended for review and discussion by senior county administrators and freeholders before final decisions on their adoption are made.
We recommend that the County:
■■ Lead by example, by documenting and promoting the County’s experiences implementing the Energy Savings Improvement Plan, to execute energy management projects in County buildings.
■■ Promote building owners and managers’ understanding of existing energy programs and trainings via existing County services . Take simple steps to contribute to promotions and marketing of energy efficiency programs available to commercial and industrial properties, such as engaging chambers of commerce members on the availability of energy programs.
■■ Promote understanding of PACE financing options amongst municipalities and property owners . Facilitating PACE is the single highest impact step local governments
III . Market Transformation Plan

22Passaic county EnErgy ManagEMEnt MarkEt
can take to enable good energy management without requiring significant public resources.
A . Promote Passaic County’s Energy Savings Improvement Plan (ESIP) to Foster Greater Interest in Energy ManagementPassaic County is currently in the process of implementing an Energy Savings Improvement Plan (ESIP) through the New Jersey Clean Energy Program. As previously discussed in the strategy, the ESIP programs sparked from state legislation allowing entities to pay for the costs of energy upgrades using the value of energy savings that result from the improvements.
The County of Passaic has selected to do what the NJCEP views as a hybrid version. In this scenario, the County will select an energy and engineering services firm to assist with the writing of a Request for Proposal (RFP) and choose an energy services company to do the professional work. (The Flemington Raritan Regional School District utilized this option and reached a high level of success in revitalizing six of their buildings.) The scope of work proposal for the procurement of professional consulting services had a submission deadline of May 3, 2013. On July 9, 2013, the Energy and Sustainability Committee of Passaic County heard three presentations from separate firms.
On September 18, 2013 Concord Engineering was selected at Passaic County’s energy and sustainability committee meeting. Concord will conduct full energy audits of six county buildings. Once the audits are complete, the firm will draft a Request for Proposal on behalf of the County, and once approved, energy service companies will be able to submit their proposals.
Passaic County should document its experience
undertaking these energy management projects, and seek forums to share their experiences and promote energy management amongst the private, non-profit and government sectors.
B . Expand the County’s energy outreach and marketingAs noted in Chapter II, the County currently promotes NJCEP programs at its annual Green Building Design Conference, and in its Business Expansion and Relocation Packet. The County should seek opportunities to deepen and broaden the range of promotions it undertakes for energy programs. With little commitment of staff time, the County can:
Encourage area businesses to participate in existing “Energy Challenges” and technical assistance opportunities, above and beyond the NJCEP – The New Jersey Building Owners and Managers Association (BOMA) holds an annual Kilowatt Crackdown program, providing friendly competition between their membership to reduce energy use, through awards and seminars. Likewise, New Jersey’s chapter of International Facility Management Association (IFMA) also distributes energy awards each year. County staff should liaise with these organizations to identify how best to promote these programs, both to BOMA and IFMA’s membership as well as buildings who are not active members. County Freeholders or municipalities’ mayors could be encouraged to endorse participation in these programs, and attend awards ceremonies; experience from other jurisdictions suggests that political leadership is important to driving greater participation. Likewise, these events can be promoted via inserts in existing regular County/municipal mailings (e.g. municipal utility mailings, tax bill inserts, and so on).
Catalogue and promote energy management training programs for facility managers and building operators – Experiences from other regions around the country suggest that increasing facility manager and building operator participation

23Passaic county EnErgy ManagEMEnt MarkEt
in continuing education related to energy management is an exceptionally cost-effective means of increasing the level of energy savings achieved in buildings. However, many building owners, managers and operators are unaware such training opportunities exist, and/or are unconvinced of its value to their organization or career. Passaic County Planning and Economic Development staff should liaise with Workforce Investment Board of Passaic County to identify energy management programs appropriate for facility managers and building owners. They should explore whether participants in these trainings can be interviewed, and document their experiences. They can then provide information and any testimonials to other organizations, as part of their business liaison.
Revise the Business Expansion and Relocation Packet – The Business Expansion and Relocation Packet’s information on the NJCEP includes the information over multiple sheets, which could easily be misplaced or overlooked. A plan to reproduce the sheets of paper into an easy-to-read pamphlet, with clear bullet-points and contact information will ensure the information is clear and concise, with easily understood steps to follow. The pamphlet should be updated to include information on facility manager and building operator training opportunities; all financing opportunities applicable to local businesses; as well as information on NJCEP and PSE&G programs.
Update the County website with useful links to Energy Efficiency information – While updating handouts and fliers for the community is beneficial, more and more community members (both businesses and residents) turn to the internet for answers. By creating noticeable and useful links on Passaic County’s website it will assist those looking for answer to be easily directed.
Request that NJCEP and PSE&G, and any future PACE or other energy-related program, provide training in programs for County and municipal staff – It is important that County and municipal staff who have regular contact businesses (potentially staff employed in economic development and business liaison, development approvals, housing, recycling and conservation) be versed in
the benefits of energy efficiency and the programs offered by NJCEP and PSE&G. The County should liaise with NJCEP and PSE&G to provide training and outreach materials noting how buildings may participate in energy programs, which programs are appropriate for different building types, and so on.
C . Support Municipalities’ Adoption of PACE Districts & ProgramsAs described in Chapter II, many commercial and industrial properties in Passaic County do not have access to financing mechanisms that can adequately enable them to pursue energy management. Property owners require a mechanism that provides lower interest rates over longer time periods; can be passed through to tenants under existing lease terms; can be passed to future owners; and is off-balance sheet.
PACE financing meets these criteria, providing a useful option for owners seeking to improvement energy management in their property. Facilitating municipalities’ adoption of PACE financing districts is a powerful strategy for enabling deeper energy management. Passaic County’s Department of Planning and Economic Development and the Passaic County Improvement Authority can take the following actions to support establishment of PACE Districts:
Expand municipalities awareness of PACE financing and the benefits it provides relative to other financing tools - Passaic County can help its municipalities understand the potential benefits of PACE, the process for establishing such programs, and the extent of the risks and rewards their adopting a PACE district can realize. In MIT GEDI’s experience, the most important advocates for PACE financing programs are large real estate owners who recognize the value of PACE to improving the energy performance of their properties. Passaic County

24Passaic county EnErgy ManagEMEnt MarkEt
should work with NJ PACE (and/or other prospective program administrators), contractors, and real estate organizations to identify building owners who are interested in PACE financing. They should then help coordinate meetings with these parties and municipalities’ Business Administrators and elected officials.
Consider vetting different potential program administrators’ capacity to manage PACE programs on behalf of Passaic County municipalities – NJ PACE has been actively promoting PACE at the state level, and positioning themselves to administer PACE programs established in the State. Alternately, municipalities could operate their own programs, or they could select a different third party program administrator.
There is considerable potential value in having only one PACE program administrator in the state; it provides greater consistency across municipalities, reduces market confusion, minimize transaction costs, and achieve economies of scale.
Nevertheless, municipalities may wish to vet the technical and managerial capacity and financial sustainability of NJ PACE and/or any other program administrator options. A municipalities’ choice of a PACE program administrator will ultimately reflect on that municipality and municipalities will face reputational and political risk should programs fail.
Passaic County can assist its municipalities by leading the process of collectively vetting prospective PACE administrators. The County, perhaps lead by the Passaic County Improvement Authority, could issue a short Request for Expression of Interest (RFEI) to NJ PACE, and any other prospective PACE program administrators, asking for a more detailed description of their administrative competence. Appendix 5 provides guidance on considerations that should be included in the RFEI.
The formal RFEI could be followed by additional meetings and dialogue, to clarify any outstanding issues. The Passaic County Improvement Authority could then communicate the competencies of prospective program administrators to municipalities in the County.
25Passaic county EnErgy ManagEMEnt MarkEt
IV . Conclusion
As noted in Chatper I of this report, there is a compelling economic case to support stronger energy management practices in existing commercial and industrial buildings. Such efforts will stimulate job growth, enhance businesses’ profitability, realize healthier buildings, and reduce buildings’ environmental impacts. Our analysis suggests that a variety of barriers hinder markets for energy services in Passaic County, and New Jersey more broadly. With limited devotion of staff time, Passaic County can do its part to help reduce these market barriers, by:
■■ Leading by example in County buildings.
■■ Promoting energy management opportunities via existing initiatives where the County interacts with businesses.
■■ Facilitating the cognizance and adoption of PACE financing options amongst its member municipalities.
These actions can realize meaningful progress towards a more prosperous and green Passaic County.

26Passaic county EnErgy ManagEMEnt MarkEt
Appendix I: Literature Review - Economic Impacts of Energy Efficiency Investments
Citation (author, date, title) Region Key FindingsACEEE, 2012, Energy Efficiency and Economic Opportunity
USA In 2010, the ACEEE estimated at least 830,000 jobs related to resource and energy efficiency in the U.S. The direct jobs created as a result of pursuing energy efficiency projects are local becausethey often involve installing or maintaining equipment locally. Meanwhile jobs in the energy utility sector are often related to transporting or procuring fuel out of state.
Andrew C. Burr, Cliff Majersik, Sarah Stellberg, Institute for Market Transformation, Heidi Garrett-Peltier, Political Economy Research Institute, 2012, Analysis of Job Creation and Energy Cost Savings From Building Energy Rating and Disclosure Policy
USA In 2012, the Institute for Market Transformation (IMT) analyzed the impact a national benchmarking and disclosure policy would have on job creation. Their study predicted that such a policy would create 59,620 net new jobs across the country by the year 2020. The estimated total energy savings reached over $18 billion in 12 years.
Charles Goldman, Merrian C. Fuller and Elizabeth Stuart, Jane S. Peters, Marjorie McRae, Nathaniel Albers, Susan Lutzenhiser and Mersiha Spahic, 2010, Energy Efficiency Services Sector: Workforce Size and Expectations for Growth
USA The Lawrence Berkeley National Laboratory’s 2010 study evaluated the size of the “energy efficiency services sector” (e.g., investment related jobs). It estimates the sector comprised of 114,000 Person-Years-of-Employment (PYE) in 2008, which they translate to being approximately equal to 380,000 individuals.
Heidi Garrett-Peltier, 2011, Employment Estimates for Energy Efficiency Retrofits of Commercial Buildings
USA A study of the effects of a national program promoting building retrofits to increase their energy performance found that for every $1 million saved by USA real estate, 6.5 direct PYEs and 4.0 induced PYEs.
Mark Muro, Jonathan Rothwell, and Devashree Saha with Battelle Technology Partnership Practice, 2011, Sizing the Clean Economy: A National and Regional Green Jobs Assessment
USA – metropolitan focus
The majority of the U.S.’s clean economy jobs and the most growth in this sector have historically been concentrated in large metropolitan areas. From 2003 to 2010, 75 percent of clean economy jobs and 64 percent of all jobs in 2011 were located in the 100 largest metropolitan areas in the United States. The clean economy is estimated to employ 2.7 million workers with jobs spread across industries in manufacturing, transit, renewable resources, and more.
Hendricks, Bracken and Jorge Madrid. 2011. A Star Turn for Energy Efficiency Jobs. Center for American Progress.
USA – regional focus
Energy efficiency improvements have the benefits of import substitution in regional economies. The majority of energy efficiency products are over 90% U.S. made, including components for heating, ventilation, and air conditioning (HVAC) systems. Comparatively, the domestic share of production for other products in the U.S. is around 76 percent.

27Passaic county EnErgy ManagEMEnt MarkEt
Citation (author, date, title) Region Key FindingsEnvironment Northeast, 2012, Energy Efficiency: Engine of Economic Growth in Eastern Canada
Eastern Canada A study of the macroeconomic effects of energy efficiency in the provinces of Québec, New Brunswick, Nova Scotia, and Prince Edward Island. Even in the more conservative investment scenario, it was found that, over 15 years, energy benefits would exceed participant and efficiency programs costs by $40 billion, in terms of net present value. This would then drive job creation.
Jamie Howland & Derek Murrow, ENE Lisa Petraglia & Tyler Comings, Economic Development Research Group, Inc., 2009, Energy Efficiency: Engine of Economic Growth
New England A study of energy efficiency investments in New England found that efficiency investments pay for themselves over a fairly short period of time in terms of increased economic activity and job creation. Over 15 years, the increase in employment due to spending on electricity efficiency investments would equal 767,011 PYEs. Annually, this would equal a maximum increase of 43,193 PYEs.
Richard Sedano, Catherine Murray, Economic and Environmental Impact Modeling by Synapse Energy Economics, Inc., William R. Steinhurst, Ph.D., 2005, Electric Energy Efficiency and Renewable Energy in New England
New England An early study done in 2005 examined the impact of energy efficiency programs in New England and found that for every $1 million spent on energy efficiency, 1.77 direct PYEs would be created, and 2.61 induced PYEs would be created. Over ten years, these programs were expected to create a total of 15,533 direct, indirect, and induced jobs.
Claudio Martinez, Jeff Deyette, Sandra Sattler, Anee McKibbin, 2011, A Bright Future for the Heartland: Powering the Midwest Economy with Clean Energy
Midwest When the Midwest Governors Association passed policies promoting energy efficiency and renewable energy, the Union of Concerned Scientists completed a 2011 study estimating that 85,000 net jobs would be created by 2030 over baseline projections.
Hewlett Foundation Energy Series, 2002, The New Mother Lode: The Potential for More Efficient Electricity Use in the Southwest
Southwest In the Southwest, the electric utility industry only supports 4 to 5 jobs per $1 million spent, while sectors like the construction, services, and retail sectors support between 11 and 33 jobs per $1 million spent. This study evaluated the impact of adopting a range of energy efficiency policies in the region. It found that 58,000 net jobs would be added to the region as a result of these policies.
Lisa Petraglia, Tyler Comings, and Glen Weisbrod, Economic Development Research Group, Inc., 2010, State of Wisconsin Public Service Commission of Wisconsin, Focus on Energy Evaluation, Economic Development Benefits: CY09 Economic Benefits
Wisconsin This study evaluated the impacts of Wisconsin’s Focus on Energy Conservation Program. It calculated the program annually engendered 5100 job-years,.
Rick Hornby, David White, Tommy Vitolo, Tyler Comings, and Kenji Takahashi, 2012, Potential Impacts of a Renewable and Energy Efficiency Portfolio Standard in Kentucky
Kentucky A study of the impact of energy efficiency and renewable energy programs on Kentucky’s economy projected a net increase of 28,000 job-years by 2022. This is due to the increase in the cost of electricity when there is the added cost of complying with a carbon regulation.
David Roland-Holst, 2008, Energy Efficiency, Innovation, and Job Creation in California
California Energy efficiency measures implemented in California from 1976 to 2006 have resulted in creating 1.5 million savings-related jobs while future policies have the potential to create 403,000 more direct (investment-related) jobs up through 2020.

28Passaic county EnErgy ManagEMEnt MarkEt
Citation (author, date, title) Region Key FindingsEDR Group, 2012, Economic Impact of PG&E Proposed Generation, Distribution & Related Infrastructure Investments
California An analysis of PG&E’s proposed energy efficiency initiatives in California found that impacts would include the creation of 30,000 jobs annually in the PG&E service area and 39,000 jobs annually across the entire state.
EcoNorthwest, 2012, Economic Impacts From Energy Trust of Oregon 2011 Program Activities
Oregon A study by ECONorthwest estimated that in Oregon, 1,235 jobs were sustained by energy efficiency activities in the year 2011.
ACEEE, 2013, Louisiana’s 2030 Energy Efficiency Roadmap: Saving Energy, Lowering Bills, and Creating Jobs
Louisiana This study estimates that implementing residential and commercial efficiency programs will result by 2030 in the creation of net 27,100 PYEs (in that year) and $1 billion additional dollars in wages.
Economic Development Research Group, Inc., 2005, Economic Impacts of Cost-Effective Energy Efficiency: Final Report on Proposed CPS Programs
San Antonio, Texas This study of the impacts of establishing proposed energy efficiency programs in San Antonio would realize 1700 investment-related jobs each year, by the programs’ tenth year.
ACEEE, 2013, New Orleans’ Efficient Path to 2030: Leadership to Save Energy, Lower Bills, and Create Jobs
New Orleans, Louisiana
By 2030, implementing residential and commercial efficiency programs in New Orleans will result in the creation of 1,500 PYEs and $62 million additional dollars in wages.

29Passaic county EnErgy ManagEMEnt MarkEt
Appendix II:Literature Review of Health Impacts Associated with Green Building Investments
Citation (author, date, title) Key findingsVivian Loftness, Volker Hartkopf, Beran Gurtekin, David Hansen, Robert Hitchcock, 2003, Linking Energy to Health and Productivity in the Built Environment: Evaluating the Cost-Benefits of High Performance Building and Community Design for Sustainability, Health and Productivity
Improvements in indoor air quality, temperature control, lighting system quality, and access to the natural environment are linked to increased individual productivity. A range of design strategies, including increasing outdoor air ventilation rates, improving ventilation effectiveness through improved HVAC systems, and decoupling ventilation and thermal conditioning can lead to these productivity improvements. However, in order to achieve both health and energy savings it is important to pursue high performance technology that improves the IEQ of buildings without resulting in energy costs.
Olli A. Seppänen, William Fisk, 2006, Some Quantitative Relations between Indoor Environmental Air Quality and Work Performance or Health
This study looked at the change in performance per increase of 10L/s (liters per second) per person in ventilation rate. The result was a clear trend of increasing performance with increased ventilation rate up to levels of 16 L/s per person.
Romm and Browning, 1994, Greening the Building and the Bottom Line
After a building undergoes a lighting retrofit with parabolic louver fixtures and high-efficiency fluorescent lights, this study shows a 13.2% increase in productivity, a 25% reduction in absences, and a 69% energy savings in the lighting sector.
W. J. Fisk, D. Black, G. Brunner, 2011, Benefits and costs of improved IEQ in U.S. offices
The economic benefits of improving indoor environmental quality (IEQ) in the U.S. building stock is estimated at $20 billion per year. The majority of these IEQ improvements can be achieved while also achieving energy savings, although a few are associated with small increases in energy costs.
Robert J. Rose, Jack Dozier, 1997, EPA Program Impacts Office Zoning
Temperature control is clearly linked to energy savings. On average, HVAC systems with independent controls for each room save 43% more energy than large-zone HVAC systems. Temperature control is further linked to worker productivity and comfort.
Amanjeet Singh, Matt Syal, Sue C. Grady, and Sinem Korkmaz, 2010, Effects of Green Buildings on Employee Health and Productivity
This study observed the effect on health and productivity for workers moving from conventional office buildings to those with green building ratings according to LEED. In two different case studies it was found that the improved IEQ in the green buildings led to reduced absences, lower reports of asthma and depression, and self-reported productivity improvements.
McGraw-Hill Construction, 2009, Green Building Retrofit & Renovation
A 2009 survey showed that 50% of tenants who moved into a green space did so partly because they anticipated productivity gains.
S. Abbaszadeh et al., 2006, Occupant Satisfaction with Indoor Environmental Quality in Green Buildings
Workers in green buildings self-report that they are more satisfied with the thermal comfort and air quality than occupants on non-green buildings.
Thayer, 1995, Daylighting and Productivity at Lockheed
This case study suggested that a building designed around daylighting, which integrates layout, window placement, type of glazing, and ceilings, results in 50% energy savings in lighting, ventilation, and cooling energy, and reduced absences 15% compared to the company’s previous office building.
Figueiro, et al., 2002, Daylight and Productivity - A Field Study
During the winter, workers in windowed offices with access to daylight spend 15% more of their time doing work-related tasks in the office and use 35% less electric lighting than workers without windowed offices.
Milam, 1992, Underfloor Air Distribution HVAC Analysis
Floor-based ventilation is linked to both first cost and energy savings. Underfloor air distribution systems saved 1.55 kWh per square foot more than ceiling-based air ventilation system. Increased ventilation is one of the most basic ways to improve building IEQ and worker health and productivity.

30Passaic county EnErgy ManagEMEnt MarkEt
Citation (author, date, title) Key findingsNational Lighting Bureau, 1989, Lighting and Human Performance: A Summary Report
The NLB identified a 6% increase in worker productivity, accompanied by a 65% decrease in lighting energy consumption when a building was retrofitted with high-efficiency fixtures and full-spectrum fluorescent lights.
Jones Lang Lasalle, 2012, Connected City Cities that invest in smart grid technology improve the effectiveness of energy production and distribution and implement programs that encourage energy efficiency at a corporate level. This, in turn, leads to productivity improvements within corporations and for the entire city.
U. Haverinen-Shaughnessy, D. J. Moschandreas, R. J. Shaughnessy, 2010, Association between substandard classroom ventilation rates and students’ academic achievement
Improved student and teacher health, decreased absences, increased productivity, and reduced operational costs are all benefits of improving IEQs within the classroom. The most basic step to improving IEQ is providing good ventilation, which this study shows is linked to improved academic achievement in fifth graders.
Nicklas and Bailey, 1996, Energy Performance of Daylit Schools
Students in daylit classrooms perform 3% above the average performance of all students in the county, and daylit schools use 60% less energy than non-daylit schools.
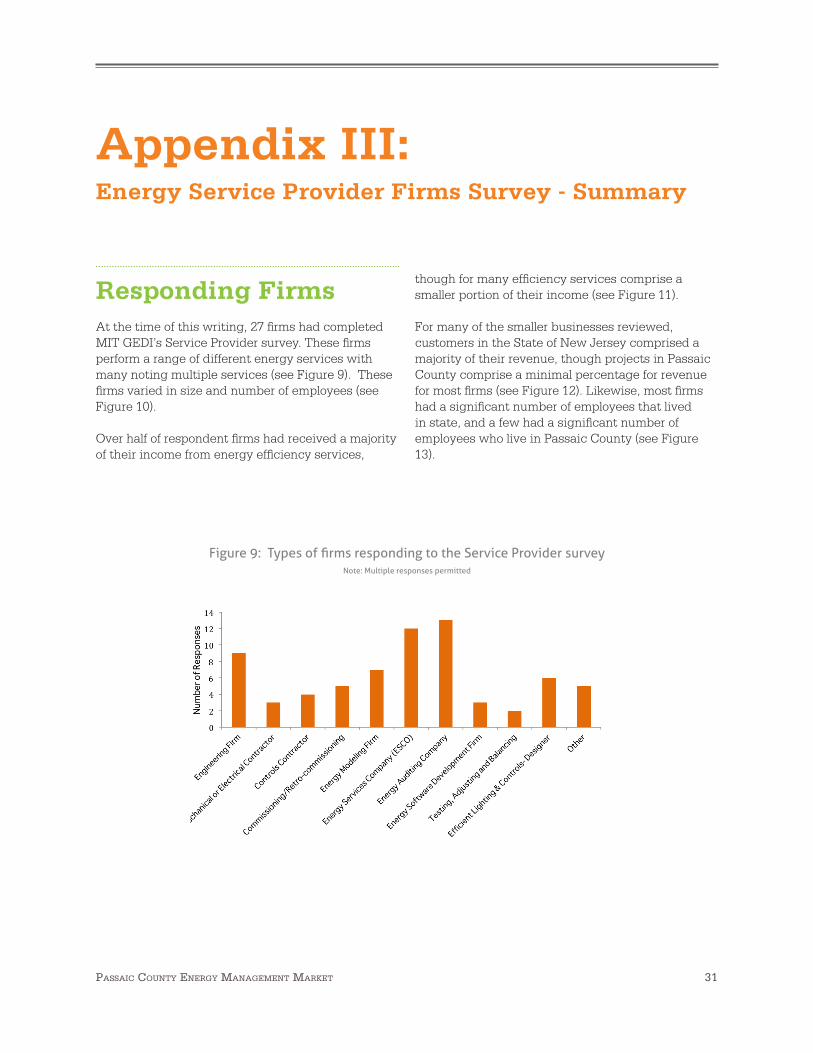
31Passaic county EnErgy ManagEMEnt MarkEt
Appendix III:Energy Service Provider Firms Survey - Summary
Responding FirmsAt the time of this writing, 27 firms had completed MIT GEDI’s Service Provider survey. These firms perform a range of different energy services with many noting multiple services (see Figure 9). These firms varied in size and number of employees (see Figure 10).
Over half of respondent firms had received a majority of their income from energy efficiency services,
though for many efficiency services comprise a smaller portion of their income (see Figure 11).
For many of the smaller businesses reviewed, customers in the State of New Jersey comprised a majority of their revenue, though projects in Passaic County comprise a minimal percentage for revenue for most firms (see Figure 12). Likewise, most firms had a significant number of employees that lived in state, and a few had a significant number of employees who live in Passaic County (see Figure 13).
Figure 9: Types of firms responding to the Service Provider surveyNote: Multiple responses permitted

32Passaic county EnErgy ManagEMEnt MarkEt
Figure 10: Number of employees.
Figure 11: Percentage of firm’s revenue from energy efficiency services.

33Passaic county EnErgy ManagEMEnt MarkEt
Figure 13: Percentage of employees from the Passaic County and State of New Jersey.
Passaic County (19 projects reported)State of New Jersy (647 projects reported)
Passaic County (19 projects reported)State of New Jersy (647 projects reported)
Figure 12: Percent of firms’ revenue from the Passaic County and within the State of New Jersey.

34Passaic county EnErgy ManagEMEnt MarkEt
CLIENTS AND MARKETING
A disproportionate percentage of surveyed firms’ revenue came from institutional buildings, notably hospitals, government buildings, universities and schools (see Figure 14). This finding is consistent with those from national surveys of energy service companies, which indicate that markets for energy services in commercial office space are under-developed (Satchwell, Goldman, Larsen, Gilligan, &
Figure 16: Most important sources of clients, by weighted rank score.
Singer, 2010). Amongst office buildings, a number of firms derived a substantial proportion of their revenue from Class A office space, while class B and C buildings are largely unserved by these firms (see Figure 15). Energy service firms indicate that their most important source of work stems from relationships with past clients, referrals, and relationships with partner businesses (see Figure 16). Obstacles to market development are addressed in the next section.
Figure 14: Revenue from different building types.

35Passaic county EnErgy ManagEMEnt MarkEt
Figure 15: Revenue from different office market classes.
OBSTACLES TO MARKET DEVELOPMENT
Firms indicated that they face a number of obstacles to securing work providing energy-efficiency services to existing buildings. Responses within affirm that brokering relationships and referrals can be an important means of growing markets for energy-efficiency services.
These obstacles can be grouped into the following categories:
■■ Access to project financing capital – Firms noted that potential clients are concerned about the cost of energy-efficiency services. Many firms noted that utility incentives provided insufficient incentives. One firm commented that clients are reluctant to take on additional debt to cover the costs of energy upgrades. Given the extent of cost-effective efficiency opportunities in the market, this suggests that many firms do not have cash on-hand, nor access to appropriate financing vehicles, in order to engage in better energy management practices.
■■ Split incentives between owners and tenants – Firms note that the “split-incentive” whereby tenants pay utility bills but owners must invest capital prevents building owners from investing in energy efficiency. Different financing mechanism or the adoption of “green” or “energy-aligned” leasing terms can mitigate these problems.
■■ Utility programs are difficult to navigate – Many service providers suggested that utility and state incentive programs are cumbersome for participating businessesto navigate, with some firms noting this in comments.
■■ Client’s limited capacity and knowledge of energy opportunities – Firms feel that many clients’ staffs possess insufficient time and capacity to procure energy services and implement projects. Additionally, owners, property managers and building operators’ lack of understanding of energy saving opportunities are barriers. One firm noted that in the past, some energy service companies have acted unethically in New Jersey, which makes potential clients wary of engaging their services.

36Passaic county EnErgy ManagEMEnt MarkEt
WORKFORCE
Despite the information drawn from interviews referenced in Chapter II, firms noted some difficulty recruiting candidates with sufficient skills and credentials to serve in the energy-services industry and, to a lesser extent, facilitating the on-the-job training and retaining qualified personnel (see Figure 18). These statistics are interrelated with the idea behind a liaison (discussed in Chapter II) who would assist with the flow of information pertaining to what type of training the firms are looking for when recruiting new candidates. Firms estimate they spend a longer period of time searching for senior-level project managers than entry-level staff, perhaps suggesting the need for ongoing professional development (see Figure 19).
Firms noted a wide array of credentials held by their employees. Associations of Energy Engineers credentials were dominant for Energy Managers, Energy Auditor, and Commissioning Authority positions; however, multiple other credentials prevailed for these positions as well. LEED Operations & Maintenance Accredited Professionals were the most-cited credential for Operating Engineers/Building Technician positions, though again, firms cited multiple credentials. These various credentials have different curricula and testing standards, and levels of rigor in the professional competencies they confer. As noted in section, the US Department of Energy is in the process of standardizing job task competencies associated with these different position types; credentialing organizations (like AEE) will then have to be certified by an accreditation body to ensure their credentials meet these standards.
Figure 17: Percentage of firms rating the severity of different obstacles to performing energy services.

37Passaic county EnErgy ManagEMEnt MarkEt
Figure 19: Amount of time estimated firms must search to hire senior and entry level staff.
Figure 18: Percentage of firms rating the severity of different challenges to employing a skilled workforce.

38Passaic county EnErgy ManagEMEnt MarkEt
Table 5: Credentials held by energy service professionals serving Passaic County.
Name of Credential Number of Responses
COMMISSIONING/RETRO-COMMISSIONING AUTHORITY
ACG: Certified Commissioning Authority 2
ACG: Certified Commissioning Technician 3
AEE: Certified Building Commissioning Firm 3
AEE: Certified Building Commissioning Professional 10
AEE: Existing Building Commissioning Professional 5
AEE: Master’s Level Certified Building Commissioning Professional 1
ASHRAE: Commissioning Process Management Professional Certification 4
BCA: Associate Commissioning Professional 1
BCA: Certified Commissioning Professional 2
NEBB: Retro-commissioning 2
TABB: Certified Comissioning Supervisor 1
TABB: Certified Commissioning Contractor 1
University of Wisconsin: Commissioning Process Authority Professional 2
University of Wisconsin: Commissioning Process Manager 1
University of Wisconsin: Commissioning Process Provider 0
University of Wisconsin: Commissioning Process Technical Service Provider 0
University of Wisconsin: Qualified Commissioning Process Provider 1
COMMISSIONING/RETRO-COMMISSIONING AUTHORITY; OPERATING ENGINEER/BUILDING TECHNICIAN
NEBB: Building Systems Commissioning 11
ENERGY AUDITOR
AEE: Certified Energy Auditor 13
AEE: Energy Auditor in Training 4
Energy Audit Institute: Commercial Energy Audit Certification 1
ENERGY AUDITOR; ENERGY MANAGER
ASHRAE: Building Energy Assessment Professional Certification 5
ENERGY MANAGER
ACG: Energy Management Professional 3
AEE: Certified Energy Manager 20
AEE: Energy Manager in Training 3
NEEI: Energy Management Certification 2
University of CA, DAVIS: Certificate Program in Energy Resource Management 0
ENERGY MANAGER; OPERATING ENGINEER/BUILDING TECHNICIAN
AEE: Building Energy Sustainability Technician 2
AEE: Certified Measurement and Verification Professional 10

39Passaic county EnErgy ManagEMEnt MarkEt
Name of Credential Number of ResponsesOPERATING ENGINEER/BUILDING TECHNICIAN
AEE: Government Operator of High Performance Buildings 0
ASHRAE: Operations and Performance Management Professional Certification 3
BOC: Level II 2
BOC: Level I 2
BOMI: Building Systems Maintenance Certificate 1
BOMI: Systems Maintenance Administrator 0
BOMI: Systems Maintenance Technician 1
GBCI: LEED AP Operations and Maintenance 10
IFMA: Facility Management Professional 2
IFMA: Sustainability Facility Professional 1
NATE: HVAC Efficiency Analyst 1
State Licensed Professional Engineer 11

40Passaic county EnErgy ManagEMEnt MarkEt
Appendix IV:Energy Management Related Credentials
Name of Program Applicable Job Categories
ASSOCIATION OF ENERGY ENGINEERS (AEE)
Certified Energy Auditor (CEATM) Energy Auditor
Certified Energy Manager (CEM®) Energy Manager
Certified Building Commissioning Professional (CBCP®) Commissioning/Retro-Commissioning Authority
Existing Building Commissioning Professional (EBCPTM) Commissioning/Retro-Commissioning Authority
Certified Measurement & Verification Professional (CMVP®) (also administered by Efficiency Valuation Organization
Energy ManagerOperating Engineer/Building Technician
Building Energy & Sustainability Technician (BESTTM) Energy ManagerOperating Engineer/Building Technician
Government Operator of High Performance Buildings (GOHPTM) Operating Engineer/Building Technician
Energy Manager in Training (EMITTM) Energy Manager
Energy Auditor in Training (CEAITTM) Energy Auditor
Master’s Level Certified Building Commissioning Professional (MCBCP)
Commissioning/Retro-Commissioning Authority
Certified Building Commissioning Firm (CBCFTM) Commissioning/Retro-Commissioning Authority
NORTH AMERICAN TECHNICIAN EXCELLENCE (NATE)
HVAC Efficiency Analyst Operating Engineer/Building Technician
BUILDING OPERATORS CERTIFICATION
Building Operator Certification (BOC)- Level I Operating Engineer/Building Technician
Building Operator Certification (BOC)- Level II Operating Engineer/Building Technician
GREEN BUILDING CERTIFICATION INSTITUTE
LEED Accredited Professional (LEED AP) Operations and Maintenance (O+M)
Operating Engineer/Building Technician
AABC COMMISSIONING GROUP (ACG)
Certified Commissioning Authority (CxA) Commissioning/Retro-Commissioning Authority
Certified Commissioning Technician (CxT) Commissioning/Retro-Commissioning Authority
Energy Management Professional (EMP) Energy Manager

41Passaic county EnErgy ManagEMEnt MarkEt
Name of Program Applicable Job Categories
BUILDING COMMISSIONING ASSOCIATION (BCA)
Certified Commissioning Professional (CCP) Commissioning/Retro-Commissioning Authority
Associate Commissioning Professional (ACP) Commissioning/Retro-Commissioning Authority
AMERICAN SOCIETY OF HEATING, REFRIGERATING AND AIR-CONDITIONING ENGINEERS (ASHRAE)
Building Energy Assessment Professional Certification (BEAP) Energy AuditorEnergy Manager
Commissioning Process Management Professional Certification (CPMP)
Commissioning/Retro-Commissioning Authority
Operations and Performance Management Professional Certification (OPMP)
Operating Engineer/Building Technician
UNIVERSITY OF WISCONSIN-MADISON, DEPARTMENT OF ENGINEERING AND PROFESSIONAL DEVELOPMENT
Commissioning Process Authority Professional (CxAP) Commissioning/Retro-Commissioning Authority
Commissioning Process Manager (CxM) Commissioning/Retro-Commissioning Authority
Commissioning Process Technical Service Provide (CxTS) Commissioning/Retro-Commissioning Authority
Green Commissioning Process Provider (GCxP) Commissioning/Retro-Commissioning Authority
Qualified Commissioning Process Provide (QCxP) Commissioning/Retro-Commissioning Authority
BOMI INTERNATIONAL
Systems Maintenance Technician (SMT®) Designation Program Operating Engineer/Building Technician
Systems Maintenance Administrator (SMA®) Designation Program
Operating Engineer/Building Technician
Building Systems Maintenance Certificate (SMC) Operating Engineer/Building Technician
NATIONAL ENVIRONMENTAL BALANCING BUREAU
Building Systems Commissioning (BSC) Commissioning/Retro-Commissioning AuthorityOperating Engineer/Building Technician
Retro-Commissioning (RCx) Commissioning/Retro-Commissioning Authority
INTERNATIONAL FACILITY MANAGEMENT ASSOCIATION
Sustainability Facility ProfessionalTM (SFP ®) Operating Engineer/Building Technician
Facility Management Professional (FMP®) Operating Engineer/Building Technician
NORTHWEST ENERGY EDUCATION INSTITUTE (NEEI)
Energy Management Certification Energy Manager
UNIVERSITY OF CALIFORNIA, DAVIS
Certificate Program in Energy Resource Management Energy Manager

42Passaic county EnErgy ManagEMEnt MarkEt
Name of Program Applicable Job Categories
ENERGY AUDIT INSTITUTE
Commercial Energy Audit Certification Energy Audtior
NATIONAL ENERGY AND SUSTAINABILITY INSTITUTE (NEASI)
Commercial Energy Audit Certification Energy Auditor
TESTING ADJUSTING AND BALANCING BUREAU (TABB)
Certified Commissioning Supervisor (CCS) Commissioning/Retro-Commissioning Authority
Certified Commissioning Contractor (CCC) Commissioning/Retro-Commissioning Authority
43Passaic county EnErgy ManagEMEnt MarkEt
Appendix V:Considerations for a Request for Expressions of Interest for Potential PACE Program Administrators
Passaic County can assist municipalities in evaluating potential PACE program administrators by issuing a Request for Expressions of Interest (RFEI) to prospective administrators. Important considerations that the RFEI should ask prospective to document include:
■■ A viable business plan to conduct administration of the program. The responders should note:
Positions that will be involved in program administration, and anticipated staff people with background and competencies in program management, technical and financial underwriting.
A description of how different sources of revenue will sustain the program. This should include estimates of deal flow required to sustain the program; confirmed and anticipated sources of grant and in-kind revenue; and so on.
■■ A detailed description of municipalities’ duties, amount of staff time, and how municipalities may be reimbursed via fees, to:
Establish PACE districts.
Process PACE repayments.
■■ A description of how participating financiers and contractors will be reviewed and approved for participation.
■■ A description of financial and technical underwriting criteria, which will help ensure quality control of PACE financed projects.
■■ A description of how participating buildings will proceed through the PACE program.
This should include assurances that deals financed by firms not associated with the prospective Program Administrator will not be disadvantaged in any way.

44Passaic county EnErgy ManagEMEnt MarkEt
Works Cited
AEG. (2012). Evaluation of New Jersey’s Clean Energy Programs. New Jersey Office of Clean Energy.
Belzer, D. (2009). Energy Efficiency Potential in Existing Commercial Buildings: A Review of Select Recent Studies. Pacific Northwest National Laboratory.
BOMA. (2011). Commercial Lease: Guide to Sustainable and Energy Efficient Leasing for High-Performance Buildings. Retrieved 08 25, 2013, from BOMA International: http://store.boma.org/products/commercial-lease-guide-to-sustainable-and-energy-efficent-leasing-for-high-performance-buildings
CoStar Office Report. (2013). The CoStar Office Report First Quarter 2013. CoStar Group Real Estate Information.
DOE BTO. (2012, 08 29). Draft Job and Task Analysis. Retrieved 09 1, 2013, from Department of Energy - Energy Efficiency and Renewable Energy: http://www1.eere.energy.gov/buildings/commercial/workforce_jta.html
ENEROC. (2012). New Jersey Energy Efficiency Market Potential Assessment. Walnut Creek, CA: EnerNOC Utility Solutions Consulting. Vol 2.
EON. (2013, 2 13). Operational Improvements Can Double Energy Efficiency Savings in Commercial Buildings: Data from FirstFuel Software Shows Half of Energy Savings Reside in Low/No-Cost Operational Changes; Represents $17 Billion Savings Opportunity. Retrieved from Enhanced Online News: http://eon.businesswire.com/news/eon/20130206005560/en/FirstFuel/Energy-Efficiency/Operational-Improvements
Finger, G. (2013, May 13). New Jersey Board of Public Utilities Ombudsman. (A. Slavin, Interviewer)
McGill, C. (2013, May). William Patterson University, Director of Grants and Funded Programs - once director of Workforce Development. (A. Slavin, Interviewer)
McKinsey & Co. (2009). Unlocking energ efficiency in the US economy.
Mills, E. (2011). Commissioning: Capturing the Potential. ASHRAE Journal.
Murphy, M. O. (2013, May). Project Manager, State Energy Sector Partnership Initative, State Employment and Training Comission. (A. Slavin, Interviewer)
National Institute of Building Sciences. (2010, 06 28). Life-Cycle Cost Analysis. Retrieved 09 1, 2013, from National Institute of Building Sciences Whole Building Design Guide: http://www.wbdg.org/resources/lcca.php
New Jersey’s Clean Energy Program. (2013, July). Retrieved July 2013, from New Jersey Office of Clean Energy: http://www.njcleanenergy.com/commercial-industrial/home/home
NRDC. (2011). Energy Efficiency Lease Guidance. Natural Resource Defense Council Center for Market Innovation.
NTHP PGL. (2013). Realizing the Energy Efficiency Potential of Small Buildings. Seattle: National Trust for Historic Preservation - Preservation Green Lab.
PACENow. (2012, June). About Us. Retrieved August 2013, from The New Jersey PACE Program: http://

45Passaic county EnErgy ManagEMEnt MarkEt
njp-org.conservationtechnologies.net/about-us/
PACENow. (2013). Annual Report. PACENow.
PACENow. (2012). What is Pace? Retrieved August 2013, from PACENow Financing Energy Efficiency: http://pacenow.org/about-pace/what-is-pace/
Public Service Enterprise Group Incorporated. (2013). PSE&G Energy Efficiency. Retrieved July 2013, from PSEG: http://www.pseg.com/family/pseandg/energyefficiency/index.jsp
Ringhof, S. (2013, Aprl 26). PSE&G Market Strategy and Development. (A. Slavin, Interviewer)
RMI. (2013). Category expenses by building type for commercial sector. Retrieved 09 3, 2013, from Rocky Mountain Institute: http://www.rmi.org/RFGraph-commercial_building_category_expenses
RMI. (2013). Rocky Mountain Institute. Retrieved 08 25, 2013, from Retrofit Depot: http://www.rmi.org/retrofit_depot
Satchwell, A., Goldman, C., Larsen, P., Gilligan, D., & Singer, T. (2010). A Survey of the U.S. ESCO Industry: Market Growth and Development from 2008 to 2011. Berkeley: Lawrence Berkeley National Labortatory, Environmental Energy Technologies Division.
State of New Jersey. (2012). New Jersey’s Unified Workforce Investment Plan: New Jersey’s Talent Connection. State of New Jersey.
US Department of Energy. (2012, August). Building Techonlogies Office - Commercial Buildings. Retrieved July 2013, from U.S. Department of Energy - Energy Efficiency and Renwable Energy: http://www1.eere.energy.gov/buildings/commercial/workforce_jta.html
US DOE BTO. (2013). Draft Job and Task Analysis. (US Department of Energy, Energy Efficiency and Renewable Energy, Building Technologies Office) Retrieved June 4, 2013, from http://www1.eere.energy.gov/buildings/commercial/workforce_jta.html
US DOE EERE. (2012). Energy Expenditures per Square Foot of Commercial Floorspace and per Building, by Building Type. Retrieved 09 4, 2013, from Buildings Energy Data Book: http://buildingsdatabook.eren.doe.gov/TableView.aspx?table=3.3.9
US EIA. (2012). Commercial Sector Energy Expenditure Estimates, 2011. Retrieved from US Energy Information Administration: http://www.eia.gov/state/seds/data.cfm?incfile=/state/seds/sep_sum/html/sum_ex_com.html&sid=US
US EIA. (2013, 8 8). New Jersey - State Profile and Energy Estimates. Retrieved 9 4, 2013, from USA Energy Information Administration: http://www.eia.gov/state/data.cfm?sid=NJ#Prices