Embed Size (px)
Citation preview

Ocean Thermal Energy Conversion (OTEC) :
Electricity and Desalinated Water Production
Luis A. Vega, Ph.D.Technical Director
Offshore Infrastructure Associates, Inc.May 2007

OTEC-Vega 2
Puerto Rico Ocean Thermal Resource: Truisms
• OTEC plants could supply all the electricity and potable water consumed in Puerto Rico, {but at what cost?}
• Only indigenous renewable energy resourcethat can provide a high degree of energy security to the State and in addition minimize green house gas emissions;

OTEC-Vega 3
Generalities

OTEC-Vega 4
Visionary Perspective:Don Quijote de la Mancha
On annual basis:• Solar energy absorbed by oceans
is ≈ 4000 x human consumption;
• < 1 % Extraction would satisfy all.[OTEC: thermal → electric conversion ≈ 3 %]

OTEC-Vega 5
Engineering Perspective:Sancho Panza
• Ocean’s vertical temperature distribution ?heat source and heat sinkrequired to operate heat engine
i.e., two layers with ∆T ≈ 22 °C in equatorial waters…

OTEC-Vega 6

OTEC-Vega 7
The Concept

OTEC-Vega 8
OTEC Concept
Ocean Thermal Resource (fuel) ?
• Cold Water: @1000 m depth 4 °C to 5 °C
• Warm Water: Tropical seas at “surface”24 °C to 30 °C

OTEC-Vega 9
Open Cycle OTECSurface seawater is flash-evaporated in a vacuum chamber. The resulting low-pressure steam is used to drive a turbine-generator. Cold seawater is used to condense the steam after it has passed through the turbine. The open-cycle can, therefore, be configured to also produce fresh water:

OTEC-Vega 10

OTEC-Vega 11
Closed Cycle OTEC
Warm surface seawater and cold deep seawater are used to vaporize and condense a working fluid, such as ammonia, which drives a turbine-generator in a closed loop producing electricity:

OTEC-Vega 12

OTEC-Vega 13
Thermal Resource
Temperature Difference between Surface Water and 1,000 m Water (want > 20 °C) :
Yellow 18 to 20 °COrange 20 to 22 °CRed 22 to 24 °C

OTEC-Vega 14

OTEC-Vega 15
Table of Contents• Technology & Lessons Learned
• Economics & COE ($/kWh)
• Commercialization
• AC/Energy Carriers/Externalities
• Conclusions
• Annex: Small Plants

OTEC-Vega 16
What is known about OTEC Technology?
• Continuous production of electricity and desalinated water has been demonstrated with experimental plants:

OTEC-Vega 17
MiniOTEC (1979)
50 kW CC-OTEC

OTEC-Vega 18
Nauru (1982)
100 kW CC-OTEC

OTEC-Vega 19
50 kW CC-OTEC (NH3) Test Apparatus
(Vega: 1999)

OTEC-Vega 20
210 kW OC-OTEC Experimental Plant
(Vega: 1993-1998)

OTEC-Vega 21
Desalinated Water
Production
(Vega:’94-’98)

OTEC-Vega 22
OTEC Power Output as Function of Control Parameters• Open Cycle Control Parameters:
Seawater Mass Flow Rates; Seawater Temperatures & Vacuum Compressor Inlet Pressure
• Closed Cycle Control Parameters: Seawater Mass Flow Rates; Seawater Temperatures ; NH3 Mass Flow Rate & Recirculation/Feed Flow Ratio

OTEC-Vega 23
Power Output as a Function of Cold Water Temperature
5.90
5.95
6.00
6.05
6.10
6.15
6.20
14:32
14:35
14:38 14:
4114:
4414:
4714:
5014:
5314:
5614:
5915:
0215:
0515:
08 15:11
15:14
15:17
Time (September 8, 1993)
Seaw
ater
Tem
pera
ture
(67
0 m),
deg
C
251
252
253
254
255
256
257
258
OC-
OTE
C Gr
oss
Powe
r Out
put,
kW
OTEC-Vega 24
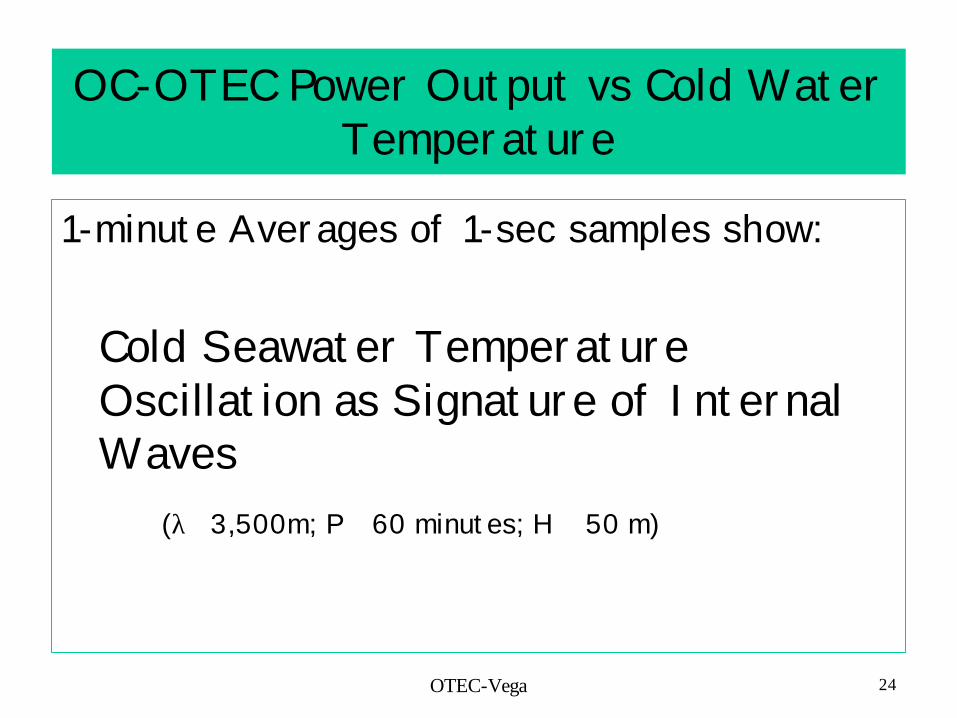
OC-OTEC Power Output vs Cold Water Temperature
1-minute Averages of 1-sec samples show:
Cold Seawater Temperature Oscillation as Signature of Internal Waves
(λ ∼3,500m; P ∼ 60 minutes; H ∼ 50 m)

OTEC-Vega 25
OC-OTEC Power Output as a Function of Warm Water Temperature
25.00
25.50
26.00
26.50
27.00
27.50
13:30
13:39
13:48
13:57
14:06 14:
1514:2
414:
3314:4
214:
5115:
0015:
09 15:18
15:27
15:36
15:45
15:54
16:03 16:
1216:
2116:3
016:
3916:
4816:5
7
Time (July 21, 1993)
Sawa
ter
Tem
pera
ture
(20
m),
de
g C
185.0
190.0
195.0
200.0
205.0
210.0
215.0
220.0
225.0
230.0
235.0
Gros
s Po
wer
Out
put,
kW

OTEC-Vega 26
OC-OTEC Power Output vs Warm Water Temperature
1-minute Averages of 1-sec samples show:
Surface Seawater Temperature Variation as Signature of Warmer Water Intrusion driven by Ocean Gyre shed from Alenuihaha Channel between Maui and Hawaii (Big Island)
OTEC-Vega 27
5 MW Pre-Commercial Plant

OTEC-Vega 28

OTEC-Vega 29
OTEC Plant Crew
• 20-people Staff for 24/7 Operations:
Minimal:Technicians: 12 (covers all shifts)
Engineering & Admin: 5
? Independent of Plant Size

OTEC-Vega 30
Lessons Learned
• Life-Cycle Design
• Constructability
• System Integration

OTEC-Vega 31
Lessons Learned
Life-Cycle Design
e.g., locating a component in the water column might yield higher efficiencies but result in elaborate maintenance requirements and higher operational costs

OTEC-Vega 32
Lessons Learned
Constructability
Can equipment be manufactured using commercially available practices and in existing factories?

OTEC-Vega 33
Lessons Learned
System IntegrationIn addition to power block (HXs & T-G),
OTEC includes seawater subsystems; dynamic positioning subsystems; and, submarine power cable

OTEC-Vega 34
What is known about OTEC Economics ?
• Economically competitive under certain “scenarios” (defined by fuel-and-water-costs) :

OTEC-Vega 35
Cost of Electricity ProductionCOE ($/kWh) = CC + OMR&R + Profit
+ Fuel (for OTEC zero)- Environmental Credit
CC = Capital Cost Amortization(N.B. much higher for OTEC)
OMR&R = Operations + Maintenance + Repair + Replacement
Tariff = COE - Subsidy

OTEC-Vega 36
02000400060008000
100001200014000160001800020000220002400026000
0 10 20 30 40 50 60 70 80 90 100
MW-net
$/kW
Land-Based Upper LimitLand-Based Lower LimitPlantship
Fossil-fueled Plant
1990 $OTEC Capital Cost
Estimates

OTEC-Vega 37
Please Beware!!Economy of Scale 10 vs. 100 MW ?• Power Block Cost of 100 MW plant is
∼ 10 x 10 MW• Seawater Subsystems & At-Sea
Deployment of 100 MW is < 10 x 10 MW
• Staffing requirements constant 100 MW = 10 MW

OTEC-Vega 38
OTEC Capital Cost: Plant Size Dependency
0%5%
10%15%20%25%30%35%40%45%
Structure Seawater HXs T-G Other
10 MW
100 MW

Nominal Size, MW
TYPE(After Eng. Dev.)
Scenario (by ∼ 10th Plant)
Potential Sites
1 Land-Based OC-OTEC with 2nd Stage for Additional Water Production.
Diesel: $45/barrelWater: $1.6/m3
Present Situation in Some Small Island States.
10 Same as Above. Fuel Oil: $30/barrelWater: $0.9/ m3
U.S. Pacific Insular Areas and other Island Nations.
50 Land-Based HybridCC-OTEC with 2nd Stage.
$50/barrel$0.4/ m3
or
$30/barrel$0.8/ m3
Hawaii, Puerto RicoIf fuel or water cost doubles.
50 Land-Based CC-OTEC$40/barrel
Same as Above.
100 CC-OTEC Plantship$20/barrel
Numerous sites
Fuel and Water Costs Required for Competitiveness (1990)

OTEC-Vega 40
Cost of Electricity Production
Offshore Distance, km
Capital Cost, $/kW 10th Plant
COE, $/kWh 10%/20-years
10 4,200 0.07 50 5,000 0.08 100 6,000 0.10 200 8,100 0.13 300 10,200 0.17 400 12,300 0.22
2nd Generation 100 MW CC-OTEC (1992 Analysis/Projection)

OTEC-Vega 41
Updated Assessment (’07)• For example, Avoided Energy Cost in
Hawaii ∼ 0.20 $/kWh [was < 0.06 $/kWh in 90’s]
• Petroleum resources (IEA, API, USGS) available to meet world demand for the next 30-50 years; however, diminishing resources ? price increases
• This situation justifies re-evaluating OTEC for the production of electricity

OTEC-Vega 42
Global Oil Resources• Consumption (IEA, API): ∼ 80 MBPD (million barrels
per day)
By 2030 ∼ 1.5 X;
• Resource (IEA, USGS, API):∼ 1.4 Trillion BBLs (others say 1 to 3)
e.g., Saudi Arabia “claimed and claims”265 Billion BBLs (presently produces 11 MBPD)
• 70% of Barrel used transporting people and goods

OTEC-Vega 43
Global Oil Resources• Consensus:
- 30 to 50 years until oil gone- Diminishing resources ? Price Increases
• Presently, H2 produced with OTEC electricity is equivalent to ∼ 8 x price of oil
? Would it be wise to begin to consider H2production onboard OTEC plantshipsdeployed along Equator?

OTEC-Vega 44
OTEC Commercialization?Pro:• Less environmental impact than
conventional power plants; • As long as the sun heats the oceans,
the fuel for OTEC is unlimited and free.
Con:• No operational record with large size
plant

OTEC-Vega 45
What Next for OTEC?
Realistic Financing
Based on detailed cost estimates not wishful dreaming
OTEC-Vega 46

OTEC-Vega 47
Punta Tunas
• 1,000 m Depth 3,000 m Offshore
• Surface Water Temperature: 27.7 ± 1.7 °C
• Deep Ocean (1,000 m) Water: 5.4 ± 0.3 °C
• Design for ∆T : 22 °C (27.5/5.5)

kWh(12) CWout
GNH3 m (6) (7) Moist GNH3 (8)
m(1) WWin LNH3 (9)
(6) (11) CWin
1.33mGNH3 Gas/Liquid
(2) WWoutBoiler
m (4)
(3) WWout
1.33mSubcooled LNH3
Recirc. Pump
LNH3 Buffer
m (10)
Feed Pumpm: mass flowrate of NH3, kg/s
( ): state points
OTEC Process Flow Diagram
TurbineGenerator
Condenser
LNH3
Reservoir & Separator
LNH3
(5) Boiler / Preheater

49
OTEC Capital Cost: 75 to 100 MW
7%Install Mech/Electr8%All Controls (electrical/NH3/Cl2)
24%Heat Exchangers8%Turbine-Generator17%Seawater Pipes & Pumps
7% (10 km)Submarine Power Cable4%Mooring
25%Floating Vessel

OTEC-Vega 50
75 MW OTEC (10 km offshore)
0%
5%
10%
15%
20%
25%
30%
35%
Power BlockInstallation
SubmarinePower Cable
Controls Turbine-Generator
SeawaterPipes/Pumps
HXs Moored Vessel
Perc
enta
ge C
apital C
ost

51
Electricity Cost ($/kWh): 75 MWLater
Generations1st
Generation1st
Generation
42 $/bbl 55 $/bbl 70 $/bbl [accounting for capital cost but no tax credit]
“Avoided” Cost Equivalent:
0.1230.1360.166Total:
0.0230.0240.023OMR&R:(3% Annual Inflation)
0.1010.1120.144CC:
idem/
10-yearsidem/
15-years7.75%/10-years
Financing:

OTEC-Vega 52
Commercialization (Puerto Rico)
• Puerto Rico could use OTEC to Generate 100% of Electricity Presently Consumed;
• Commercial-size ≈ 75-100 MW floater - C.O.E competitive with ~ $60 per barrel Oil fired Generators. Later units competitive with ~$40 barrel

OTEC-Vega 53
Development Barriers(Puerto Rico)
Cost Issues: Cost Effective for Size ≈ 75 - 100 MW Tech. Issues: Would be 1st Generation Commercial Size PlantEnviro. Issues: Relatively MinimalPolitical Issues: Need broad based bi-partisan support

OTEC-Vega 54
Other Applications: ACCold deep water as the chiller fluid in air conditioning (AC) systems: load can be met using 1/10 of the energy required for conventional systems and with an investment payback period estimated at 3 to 4 years.
OTEC-Vega 55
Energy Carriers
OTEC energy could be transported via electrical, chemical, thermal and electrochemical carriers:
Presently, all yield costs higher than those estimated for the submarine power cable (< 400 km offshore).

OTEC-Vega 56
EXTERNALITIES
• What are external costs of energy production and consumption?
• In USA equivalent to adding $85 to $327 to oil barrel
• USA to safeguard overseas oil supplies → add ~ $23 to barrel (before Iraq)

OTEC-Vega 57
Final Thoughts:Accounting for externalities will facilitate development and expand applicability of OTEC;
? Presently, can use OTEC plantships to transmit the electricity (and water) to land via submarine power cables (and flexible pipelines).

OTEC-Vega 58
Annex

OTEC-Vega 59
US Navy Small Island Installations
• Kwajalein Atoll (Marshall Islands)Current (May’05-June’06)
∼ 10 MW Capacity (diesel gensets)COE ($/kWh) : [0.16 + 0.05] = 0.21
[fuel + OMR&R]
10 MW OTECLevelized COE ∼ 0.30 $/kWh

OTEC-Vega 60
US Navy Small Island Installations
• Situation similar in Diego Garcia (Indian Ocean Island)
• USN willing to issue Power-Purchase-Agreement if COE reduced by at least 10% (∼ 0.9 x 0.21 = 0.19 $/kWh)
• Can not do with ∼ 10 MW OTEC