Embed Size (px)
Citation preview

8/7/2019 OCBC - S'pore Strategy-20101215
http://slidepdf.com/reader/full/ocbc-spore-strategy-20101215 1/82
Please refer to the important disclosures at the back of this document.
More upside ahead
Strategy
SINGAPORE Company Update Results MITA No. 010/06/2009
15 December 2010
SINGAPORE Strategy Update MITA No. 007/06/2010
Several positives for the Singapore market. We remainpositive on the Singapore market supported by severalfavourable indicators including good inflow of funds, currentlow interest rate environment which will continue to favourequities, undemanding valuations, quality earnings for the bluechips of at least 10% in 2011, and the possibility of moremergers and acquisitions ahead.
Corporate earnings growth of at least 10% in 2011 . Forthe near to medium term, the market focus is still likely toconcentrate on Europe's sovereign debt situation, but we believethat Singapore's healthy outlook will attract buying interest in2011. The STI is one of the better performing indices in 2010,and we expect the momentum to continue into 2011, buoyedby healthy fundamentals and good economic growth, which islikely to hit the high end of the government's official forecast of4-6%. In addition, the recent property cooling measures havealready taken roots, and we believe that a modest and gradualincrease in residential property prices is more sustainableand healthy for the local property market.
Stocks are cheap. 3Q corporate earnings were good, followingthe positive strength in 2Q. Together with the projected 10%rise in 2011 earnings, valuations for the market are notexpensive. The STI is currently trading at 15.5x this year'searnings and 14.1x next year's earnings. We expect some ofthe "laggards" in 2010 to be re-rated in 2011, and this is likelyto include some of the property and banking stocks.
Eurozone concerns linger on. However, risks remain, eventhough risk appetite has recovered significantly from the lowsin 2008. Still, the geopolitical tensions between North andSouth Korea, China's tightening measures and the debt crisisin the Eurozone area will continue to rein in optimism. Inaddition, there is persistent worry of another recession in theUS. In this environment, interest rate is likely to remain low,and this could be another positive factor that will favour equitiesover other asset classes.
Stock picks for 2011. We continue to have an OVERWEIGHTon the Oil & Gas and Commodities sectors. This year, wehave also placed a maiden OVERWEIGHT on the Healthcaresector, but have downgraded our long-standing OVERWEIGHTon the Telecommunications sector to a NEUTRAL. Our 2010stock picks have done well, ending the year with an averagegain of 21.1% compared to the STI's average gain of 13.8%for the same period. As such, we are maintaining most of ourstock picks in 2010 into 2011. Our picks for 2011 are Ascott Residence Trust (ART), Biosensors International Group,CapitaLand Ltd, DBS Group Holdings Ltd, Ezra Holdings Ltd, Genting Singapore, Hyflux Ltd, Pacific Andes Resources Development, Keppel Corporation Ltd (KepCorp), Mapletree Logistics Trust (MLT), Noble Group Ltd, Olam International Ltd, Sembcorp Marine Ltd
(SembMarine), StarHub Ltd, United Overseas Bank Ltd (UOB), United Overseas Land Ltd (UOL) and Venture Corp
Ltd.
Research Team
Carmen LEE, Head of Research
6531 9802
Carey WONG, Research Manager
[email protected] 9808
LEE Wen Ching, Investment Analyst
[email protected] 9806
LOW Pei Han, Investment Analyst
6531 9813
ONG Kian Lin, Investment Analyst
6531 9810
Kevin TAN, Investment Analyst
[email protected] 9809
Philip TEO, Investment Analyst
[email protected] 9807
Andy WONG, Investment Analyst
6531 9817

8/7/2019 OCBC - S'pore Strategy-20101215
http://slidepdf.com/reader/full/ocbc-spore-strategy-20101215 2/82
Page 2 15 December 2010
Strategy Update
Table of Contents
Section A Investment Summary & Stock Picks 2011 3
Section B Investment Highlights 5
Section C Singapore Economy 21
Section D Banking Sector 26
Section E Sector Outlook & Comments 35
Section F Stock Picks & Company Profiles 39
Ascott Residence Trust (ART)
Biosensors International Group
CapitaLand Ltd
DBS Group Holdings Ltd
Ezra Holdings Ltd
Genting Singapore
Hyflux Ltd
Keppel Corporation Ltd (KepCorp)
Mapletree Logistics Trust (MLT)
Noble Group LtdOlam International Ltd
Pacific Andes Resources Development
Sembcorp Marine Ltd (SembMarine)
StarHub Ltd
United Overseas Bank Ltd (UOB)
United Overseas Land Ltd (UOL)
Venture Corp Ltd
Section G Disclaimer 82

8/7/2019 OCBC - S'pore Strategy-20101215
http://slidepdf.com/reader/full/ocbc-spore-strategy-20101215 3/82
Page 3 15 December 2010
Strategy Update
SECTION A: INVESTMENT SUMMARY & STOCK PICKS 2011
Singapore remains an interesting proposition… Despite the gains in
2010, we remain positive on the outlook for the Singapore market in 2011.
We believe that the momentum going into 2011 will remain healthy,
supported by several positive indicators including good inflow of funds,
current low interest rate environment which will continue to favour equities,
undemanding valuations, quality earnings for the blue chips of at least
10% in 2011, and the possibility of more mergers and acquisitions ahead.
The drivers in 2011 will come from good economic fundamentals as
Singapore's economic growth is likely to hit the high end of the government's
official forecast of 4-6%. In addition, the recent property cooling measures
have already taken roots, and we believe that a modest and gradual increase
is more sustainable and healthy for the local residential property market.
With a projected 10% rise in 2011 corporate earnings, valuations for the
market are not expensive. The STI is currently trading at 15.5x this year's
earnings and 14.1x next year's earnings. We expect some of the "laggards"
in 2010 to be re-rated in 2011, and this is likely to include some of the
property and banking stocks.
But several regional and global issues remain. Uncertainty, and in
turn market volatility, is likely to remain for a while even though risk appetite
has recovered significantly from the lows in 2008. This includes the
geopolitical tensions between North and South Korea, China's tightening
measures and the debt crisis in the Eurozone area, and these will continue
to rein in optimism. In addition, there is persistent worry of another recession
in the US.
Stock picks for 2011. Our 2010 stock picks have done well, ending the
year with an average gain of 21.1% compared to the STI's average gain of
13.8% for the same period (from 15 Dec 2009 to 10 Dec 2010). As such,
we are maintaining most of our stock picks in 2010 into 2011. Our picks for
2011 are Ascott Residence Trust (ART), Biosensors International Group,
CapitaLand Ltd, DBS Group Holdings Ltd, Ezra Holdings Ltd, Genting
Singapore, Hyflux Ltd, Pacific Andes Resources Development, Keppel
Corporation Ltd (KepCorp), Mapletree Logistics Trust (MLT), Noble
Group Ltd, Olam International Ltd, Sembcorp Marine Ltd
(SembMarine), StarHub Ltd, United Overseas Bank Ltd (UOB), United
Overseas Land Ltd (UOL) and Venture Corp Ltd.

8/7/2019 OCBC - S'pore Strategy-20101215
http://slidepdf.com/reader/full/ocbc-spore-strategy-20101215 4/82
Page 4 15 December 2010
Strategy Update
Exhibit 1: Stock Picks 2011
Source: OIR
Price Fair Net10-Dec Value Upside PER 1 PER 2 Yield Rating
(S$) (S$) (x) (x) (%)
Ascott Residence Trust SGD 1.220 1.380 13% 19.7 16.9 5.9 BUY
Biosensors Int'l Group SGD 1.200 1.350 13% 23.3 13.6 0.0 BUY
CapitaLand SGD 3.670 4.540 24% 13.3 22.3 1.5 BUY
DBS Group Hldgs SGD 14.020 16.000 14% 20.2 11.2 4.0 BUY
Ezra Hldgs SGD 1.660 2.270 37% 10.4 9.6 1.5 BUY
Genting Spore PLC SGD 2.170 2.530 17% 24.5 13.8 0.0 BUY
Hyflux SGD 3.270 3.660 12% 24.8 21.4 1.8 BUY
Keppel Corp SGD 10.860 12.500 15% 12.7 14.2 3.6 BUY
Mapletree Logistics Trust SGD 0.925 1.000 8% 14.7 14.7 6.7 BUY
Noble Group SGD 2.120 2.590 22% 21.6 13.9 1.3 BUY
Olam Int'l SGD 3.100 3.530 14% 21.2 17.8 1.2 BUY
Pacific Andes Resources Devpt SGD 0.340 0.400 18% 6.6 5.0 4.1 BUY
Sembcorp Marine SGD 5.120 5.700 11% 13.2 16.3 2.1 BUY
StarHub SGD 2.680 3.020 13% 17.0 13.4 7.5 BUY
United Overseas Bank SGD 18.140 19.700 9% 10.6 10.1 3.3 BUY
UOL Group SGD 4.680 5.420 16% 7.5 9.6 2.1 BUY
Venture Corp SGD 9.160 12.100 32% 13.4 11.4 5.5 BUY

8/7/2019 OCBC - S'pore Strategy-20101215
http://slidepdf.com/reader/full/ocbc-spore-strategy-20101215 5/82
Page 5 15 December 2010
Strategy Update
SECTION B: INVESTMENT HIGHLIGHTS
An eventful year. Global equities have had an interesting ride this year,
falling in Feb and May and recovering strongly in Nov after the US government
announced another round of Quantitative Easing (QE II), and the latest
round involved an amount of US$600 billion. This buoyed Asian equities,
which were largely deemed to be beneficiaries of the increase in fund flow
into the region.
Despite the potential flow of funds into the region, the underlying tone
remained cautious as the Eurozone sovereign debt situation continues to
rein in optimism. The most recent being Ireland, which asked for a 85
billion euro rescue package to bail out its banks, and market fears are that
this will spread to Spain and Portugal.
Volatility in the market remains. As seen from the trading patterns in
2010, markets were generally very volatile. For example, Singapore's Straits
Times Index (STI) traded within the band from 2648 in May 2010 to 3314 in
Nov, or a differential of 665 points or 25% (year-to-date till 10 Dec 2010).
For the S&P 500, the range was from 1011 to 1227 or a difference of 216
points or 21%. This was similarly seen for China stocks, which were among
the worst performers in the region. The CSI 300 Index, traded within a wide
band from a high of 3598 to as low as 2462, or a difference of 1136 points
or 46%. The top performing markets in Asia this year were Thailand and
Indonesia.
Medium-term outlook is good. Based on economic growth projections,
the medium to longer term outlook for the region and the rest of the world
looks healthy (see Exhibit 2). This has fuelled the buying momentum in
equities as most indices are up for the year, with several at near the year's
highs.

8/7/2019 OCBC - S'pore Strategy-20101215
http://slidepdf.com/reader/full/ocbc-spore-strategy-20101215 6/82
Page 6 15 December 2010
Strategy Update
Date of Reports: In Oct 2010 In Oct 2010 In Oct 2010 In Oct 2010 Diff fr Jul10 Diff fr Jul10
2008 2009 2010 2011 2010 2011
World Output 2.8 -0.6 4.8 4.2 0.2 -0.1
Advanced economies 0.2 -3.2 2.7 2.2 0.1 -0.2
- United States 0.0 -2.6 2.6 2.3 -0.7 -0.6
- Euro area 0.5 -4.1 1.7 1.5 0.7 0.2
Japan -1.2 -5.2 2.8 1.5 0.4 -0.3
UK -0.1 -4.9 1.7 2.0 0.5 -0.1
Other Advanced economies 1.7 -1.2 5.4 3.7 0.8 0.0
Newly Industrialised Asian economies 1.8 -0.9 7.8 4.5 1.1 -0.2
Emerging & developing economies 6.0 2.5 7.1 6.4 0.3 0.0
Developing Asia 7.7 6.9 9.4 8.4 0.2 -0.1
- China 9.6 9.1 10.5 9.6 0.0 0.0
- India 6.4 5.7 9.7 8.4 0.3 0.0
ASEAN-5 4.7 1.7 6.6 5.4 0.2 -0.1
Exhibit 2: IMF Economic Projections (Oct 2010)
Source: IMF, Oct 2010
Exhibit 3: Performance of Key Indices
Source: Bloomberg (Last as of 10 Dec 2010)
Last YTD (%) End 2009
Straits Times Index 3,185.42 9.93 2,897.62
Dow Jones Index 11,410.32 9.42 10,428.05
S&P 500 Index 1,240.40 11.24 1,115.10
Nasdaq Composite 2,637.54 16.23 2,269.15CSI 300 3,161.98 -11.57 3,575.68
Hang Seng 23,162.91 5.90 21,872.50
KLCI 1,507.28 18.42 1,272.78
Nikkei 10,206.98 -3.22 10,546.44
TAIEX 8,718.83 6.48 8,188.11
KOSPI 1,986.14 18.03 1,682.77

8/7/2019 OCBC - S'pore Strategy-20101215
http://slidepdf.com/reader/full/ocbc-spore-strategy-20101215 7/82
Page 7 15 December 2010
Strategy Update
While the economic numbers look good, the International Monetary Fund
(IMF) has also moderated its projections for 2011 for world output, down
from 4.3% in its Jul 2010 forecast to 4.2% in its Oct 2010 forecast. Foradvanced economies, the growth forecast was reduced from 2.4% to 2.2%;
even Developing Asia was also shaded down from 8.5% to 8.4%. Fortunately,
there was no change to its projections for China and India, which are still
key economies in the region, and growth rates are projected at 9.6% and
8.4%, respectively. Despite market concern of asset bubbles, growth rates
are projected to remain fairly healthy, albeit slower than in 2010.
Exhibit 4: Consensus GDP Growth Projections for the Region
Source: Consensus Economics Inc, November 8, 2010
Consensus GDP growth projections for the region
GDP 2005 2006 2007 2008 2009 2010 2011
Australia 2.8% 2.6% 4.8% 2.2% 1.2% 3.3% 3.5%
China 10.4% 11.6% 13.0% 9.0% 9.1% 10.1% 9.1%
HongKong 7.1% 7.0% 6.4% 2.2% -2.8% 6.0% 4.6%
India 9.5% 9.7% 9.0% 6.7% 7.4% 8.4% 8.5%
Indonesia 5.7% 5.5% 6.3% 6.0% 4.5% 6.0% 6.1%
Japan 1.9% 2.0% 2.3% -1.2% -5.2% 3.0% 1.2%
Malaysia 5.3% 5.8% 6.5% 4.7% -1.7% 7.1% 5.0%
New Zealand 2.8% 1.0% 2.8% -0.2% -1.7% 2.1% 3.2%
Singapore 7.3% 8.6% 8.5% 1.8% -1.3% 14.4% 4.7%
South Korea 4.0% 5.2% 5.1% 2.3% 0.2% 6.0% 4.2%Taiwan 4.2% 5.4% 6.0% 0.7% -1.9% 8.4% 4.1%
Thailand 4.6% 5.1% 4.9% 2.5% -2.2% 7.5% 4.3%

8/7/2019 OCBC - S'pore Strategy-20101215
http://slidepdf.com/reader/full/ocbc-spore-strategy-20101215 8/82
Page 8 15 December 2010
Strategy Update
Official growth for Singapore in 2011 is 4-6%. In Singapore, the official
growth projection for 2011 is within 4-6%. However, we have seen an increase
from economists, with some projecting GDP growth of as high as 7%.
Recent measures to curb property prices have moderated property price
spikes and this gradual and progressive increase in property prices is a
more well-suited strategy for the Singapore economy. For the coming year,
services will be a key component, especially with the higher contributions
from the two integrated resorts. For more on the Singapore Economy, refer
to Section C.
Policy makers continue to dictate trends and affect trading activities .
Of key concern this year is the policies and decisions of the key policy
makers. For example, China raised interest rates several times in 2010 to
curb inflation and also introduced measures to rein in runaway property
prices. This dampened market sentiment, and it was one of the worst
performers in the region in 2010. The CSI Index fell 11.6% YTD.
The Chinese government announced the increase in bank reserve
requirements several times in 2010 in an effort to drain liquidity from the
system. In Oct, it also raised lending and deposit rates for the first time
since 2007. These moves have restricted loans growth and also led to the
underperformance of China stocks.
Euro remains a concern, especially Irish debts. Despite a generally
optimistic global outlook for 2011, lingering concerns over the Eurozone
area remain, especially worries that Spain and Portugal will go the way of
Ireland. Although a mega crisis has been averted with the recent IMF
financing, the market is still generally concerned about the affected Eurozone
countries' ability to pay off debts. As long as structural issues remain,
there will always be the possibility of defaults and this could rein in optimism
and also tempered expectations of better global economic growth projections.
In Asia, the geopolitical tension between North and South Korea is another
worrying factor. While this tension has since subsided, there are on-going
worries that it may re-emerge again as this is a long-standing issue.
QE2, QE3, QE4? The US Federal Reserve announced in early Nov 2010
plans to buy US$600 billion of Treasuries through June 2011. This forms
part of its Quantitative Easing (QE) program, and is widely seen as an
effort to pump more cash into the economy, and it gave equities a short-
lived rally.
A recent FOMC statement cited that " the pace of recovery in output and
employment continues to be slow", "longer-term inflation expectations have
remained stable, but measures of underlying inflation have trended lower in
recent quarters", and "progress toward its objectives has been
disappointingly slow".
8/7/2019 OCBC - S'pore Strategy-20101215
http://slidepdf.com/reader/full/ocbc-spore-strategy-20101215 9/82
Page 9 15 December 2010
Strategy Update
Therefore, the FOMC decided "to expand its holdings of securities" and
purchase a further $600 billion of LT Treasury securities, while keeping its
Fed Funds Target rate at 0-0.25%.
In addition, the FOMC will "regularly review the pace of its securities
purchases and the overall size of the asset-purchase program in light of
incoming information and will adjust the program as needed to best foster
maximum employment and price stability".
This seems to indicate that the FOMC is concerned with increasing
unemployment level and the market read it as a possible sign of further QE
measures if this number does not improve.
Better US economic numbers. Based on Bloomberg estimates (as of 7Dec 2010), economists are expecting the US economy to grow 2.7% in
2010 and 2.5% in 2011, this after the 2.6% decline in 2009. (Note: The
National Bureau of Economic Research (NBER) said the recent US
recession ended in June 2009.) This trend is very much in line with the IMF
forecasts, which is projecting growth of 2.6% for 2010 and 2.3% for 2011 in
its Oct 2010 report.
With the improving economic numbers in 2010 and 2011, this has translated
into better corporate earnings. Based on the numbers from Bloomberg,
S&P 500 companies are slated to report earnings of $85.26 in 2010 and
$96.63 in 2011 (as of 7 Dec 2010). This is an increase of 7% and 13%,respectively.
Sentiment is improving. Overall, market sentiment has improved and
risk aversion has also declined. This is effectively captured in both business
and consumer sentiment. First, businesses are generally more optimistic
about business prospects. Corporate earnings have shown good growth
momentum in the past few quarters. Secondly, confidence among US CEOs
has also improved. The index was at 86.3 in Aug, 87.4 in Sep, but rose
sharply to 102.1 in Oct. Finally, US consumer sentiment is also improving,
albeit slowly, as seen from the chart below with a slight uptick in the most
recent month.

8/7/2019 OCBC - S'pore Strategy-20101215
http://slidepdf.com/reader/full/ocbc-spore-strategy-20101215 10/82
Page 10 15 December 2010
Strategy Update
Exhibit 5: US Consumer Sentiment
20.0
40.0
60.0
80.0
100.0
120.0
140.0
160.0
J a n - 9 0
J a n - 9 1
J a n - 9 2
J a n - 9 3
J a n - 9 4
J a n - 9 5
J a n - 9 6
J a n - 9 7
J a n - 9 8
J a n - 9 9
J a n - 0 0
J a n - 0 1
J a n - 0 2
J a n - 0 3
J a n - 0 4
J a n - 0 5
J a n - 0 6
J a n - 0 7
J a n - 0 8
J a n - 0 9
J a n - 1 0
Consumer Confidence Consumer Exp 6-mth ahead
Source: Bloomberg
Exhibit 6: US CEO Confidence
30.0
50.0
70.0
90.0
110.0
130.0
150.0
170.0
190.0
210.0
O c t - 0 2
J a n - 0 3
A p r - 0 3
J u l - 0 3
O c t - 0 3
J a n - 0 4
A p r - 0 4
J u l - 0 4
O c t - 0 4
J a n - 0 5
A p r - 0 5
J u l - 0 5
O c t - 0 5
J a n - 0 6
A p r - 0 6
J u l - 0 6
O c t - 0 6
J a n - 0 7
A p r - 0 7
J u l - 0 7
O c t - 0 7
J a n - 0 8
A p r - 0 8
J u l - 0 8
O c t - 0 8
J a n - 0 9
A p r - 0 9
J u l - 0 9
O c t - 0 9
J a n - 1 0
A p r - 1 0
J u l - 1 0
O c t - 1 0
CEO Confidence
Source: Bloomberg

8/7/2019 OCBC - S'pore Strategy-20101215
http://slidepdf.com/reader/full/ocbc-spore-strategy-20101215 11/82
Page 11 15 December 2010
Strategy Update
US corporate earnings. According to Bloomberg estimates, earnings for
S&P 500 companies for 2011 profit is likely to grow 13% to $96.63 in 2011
and record growth of 14% to $109.69 in 2012. This project is culled frommore than 8,500 analyst forecasts. At current level, this reflects still healthy
earnings growth of 13-14%, albeit down from an earnings growth of as high
as 20% in Mar 2010, partly to reflect the slowing global growth, high
unemployment in US and the issues in Europe.
Still, at this level, this means that the S&P 500 is only trading at 12.7
times projected 2011 income - the cheapest level since 1988, excluding
the period of the Lehman's bankruptcy (Oct 2008 to Mar 2009). In addition,
it is noteworthy that the recent last two quarters saw companies bettering
market estimates - pointing to a likelihood of companies delivering better-
than-expected results in the final quarter of 2010.
Better Singapore corporate earnings. Over in the US, 2Q and 3Q
earnings came in better than expected and US companies raised their
profit outlook. Most are expecting to benefit from the Fed's effort aimed at
reducing unemployment as well as the potential boost from the US$600
billion Treasury purchase. In Singapore, it was similarly the case with several
companies reporting better-than-expected 2Q and 3Q results. This was
especially the case for the banking stocks, with most banks delivering
higher-than-expected earnings.
Singapore business sentiment. The manufacturing business sentimentshas moderated in the Q4 survey - only a net 3% expect improved business
conditions for the next six months, compared to 18% in the Q3 survey. Of
the respondents, the most upbeat is the transport engineering cluster (net
22%), in anticipation of more repair and off-shore conversion activities in
the marine and offshore engineering segment and higher export orders in
the aerospace and land segments in the months ahead, followed by the
general manufacturing industry cluster (net 9%), in anticipation of higher
festive demand (e.g. Christmas and Chinese New Year) over the next six
months.
The majority of firms in the biomedical manufacturing and chemicals clustersexpect business conditions in the next six months to remain similar to a
quarter ago. A net 7% of the electronics firms foresee a less favourable
business situation in the next six months, reflecting expectations of lower
orders, resulting from seasonal factors and uncertainties in overseas
markets such as US and Europe. The precision engineering cluster is also
concerned about machinery orders for the next six months.

8/7/2019 OCBC - S'pore Strategy-20101215
http://slidepdf.com/reader/full/ocbc-spore-strategy-20101215 12/82
Page 12 15 December 2010
Strategy Update
Exhibit 7: Singapore Business Sentiment
-80
-60
-40
-20
0
20
40
60
J u n
8 1
M
a r
D
e c
S e p
J u n
8 8
M
a r
D
e c
S e p
J u n
9 5
M
a r
D
e c
S e p
J u n
0 2
M
a r
D
e c
S e p
J u n
0 9
Source: CEIC
Labour market has tightened in Singapore . According to MAS'
Macroeconomic Review, it highlighted that the "labour market has tightened
significantly, especially in the services sectors, where job vacancy rates
are at near-record highs" and "although external sources of price inflation
have been benign, domestic inflationary pressures have increased in the
first three quarters of this year, particularly the prices of non-traded items,
such as accommodation and services".
As a result of this, Q3 unemployment rate dipped from a revised 2.2% in
Q2 to 2.1%, the lowest in 2.5 years, as employers boosted 24.1k jobs in
Q3 (Q2: 24.9k), with the bulk of employment creation primarily from services
(+24.1k), while construction employment rose marginally (+100 jobs) due
to the completion of major building projects earlier in the year, whereas the
manufacturing industry cut 400 jobs.
OCBC Treasury Research is expecting the unemployment rate to hold at
around 2% for the rest of 2010.
Banking to see slower loan growth. Loans growth was strong throughout
most of 2010, supported by housing and construction loans. However, with
the introduction of property measures in late Aug, this led to a subsequent
slowdown in property transactions. Sep bank loans growth has already
reflected the lower housing loans growth, +22.7% YoY (but lower than
+23.4% in Aug), and this continued into Oct with growth of 22.5% YoY.
Still, the overall loan growth was a good growth of 13.8% YoY in Oct (versus
only 10.4% in Aug), and this was driven by business loans (+10.1% YoY)
and consumer loans (+18.1% YoY).

8/7/2019 OCBC - S'pore Strategy-20101215
http://slidepdf.com/reader/full/ocbc-spore-strategy-20101215 13/82
Page 13 15 December 2010
Strategy Update
With the implementation of the most recent round of property curbs, we
believe this will result in more moderate loan growth going forward. For
more on the banking sector, refer to Section D.
STI is one of the better performing indices. Despite the roller-coaster
ride, the STI still managed to post gains for the year - making it one of the
better performing markets in the region. Japan's Nikkei and China's CSI
Index are both down so far this year. In the region, Thailand and Indonesian
stocks shone brightly this year, greatly outperforming most of the other
bourses.
An in-depth look at the STI revealed that only several sectors and stocks
have outperformed. As such, gains were not broad-based and were confined
to the Jardine Group of companies, Oil & Gas stocks, F&N, Genting, NOL,etc. In particular, several stocks have underperformed the STI's year-to-
date (YTD) gains of 9.9%. These included CapitaLand (-11.5%), CapitaMalls
Asia (-22.4%), DBS (-9.0%), Noble (+0.8%), Singapore Exchange (+1.7%),
ST Engineering (+2.9%), SingTel (+1.0%), SMRT (+5.2%), UOB (-7.9%)
and Wilmar (-7.5%).
A re-rating is likely for laggard stocks, as the underperformance is not
warranted in our views. For example, DBS is down 9.0% YTD and UOB is
down 7.9% YTD. DBS has to-date posted 9-mth earnings of S$1972m, up
27% (excluding goodwill impairment charge in 2Q 2010). UOB has delivered
9-mth earnings of S$1990m, up 44% (as a comparison, OCBC also didwell with 9-mth earnings of S$1749m, +20%). While global concerns over
banking stocks' performances and the stricter regime under Basel III remain,
local banks are more prudent and have continued to deliver good earnings
with strong asset backing, good ROEs and decent dividend yields. As
such, the discounts appear to be unwarranted at current price levels.

8/7/2019 OCBC - S'pore Strategy-20101215
http://slidepdf.com/reader/full/ocbc-spore-strategy-20101215 14/82
Page 14 15 December 2010
Strategy Update
Exhibit 8: STI Chart
1000
1500
2000
2500
3000
3500
J a n -
0 9
F e b -
0 9
M
a r -
0 9
A p r -
0 9
M
a y -
0 9
J u n -
0 9
J u l - 0 9
A u g -
0 9
S e p -
0 9
O c t - 0 9
N o v -
0 9
D e c -
0 9
J a n -
1 0
F e b -
1 0
M
a r -
1 0
A p r -
1 0
M
a y -
1 0
J u n -
1 0
J u l - 1 0
A u g -
1 0
S e p -
1 0
O c t - 1 0
N o v -
1 0
D e c -
1 0
Source: Bloomberg

8/7/2019 OCBC - S'pore Strategy-20101215
http://slidepdf.com/reader/full/ocbc-spore-strategy-20101215 15/82
Page 15 15 December 2010
Strategy Update
Exhibit 9: STI - Top Gainers and Losers
Source: Bloomberg
31-Dec-09 10-Dec-10
%Change
CapitaLand Ltd SGD 4.146 3.670 -11.5CapitaMall Trust SGD 1.800 1.940 7.8CapitaMalls Asia Ltd SGD 2.540 1.970 -22.4City Developments Ltd SGD 11.560 12.800 10.7ComfortDelGro Corp Ltd SGD 1.640 1.540 -6.1DBS Group Holdings Ltd SGD 15.400 14.020 -9.0Fraser and Neave Ltd SGD 4.200 6.260 49.0Genting Singapore PLC SGD 1.300 2.170 66.9Golden Agri-Resources Ltd USD 0.510 0.770 51.0Hongkong Land Holdings Ltd USD 4.950 7.050 42.4Jardine Cycle & Carriage Ltd USD 27.000 37.140 37.6Jardine Matheson Holdings Ltd USD 30.180 44.500 47.4Jardine Strategic Holdings Ltd USD 17.600 26.660 51.5Keppel Corp Ltd SGD 8.011 10.860 35.6Neptune Orient Lines Ltd/Singapore USD 1.650 2.200 33.3Noble Group Ltd USD 2.103 2.120 0.8Olam International Ltd SGD 2.660 3.100 16.5Oversea-Chinese Banking Corp Ltd SGD 9.100 9.850 8.2SembCorp Industries Ltd SGD 3.700 5.010 35.4SembCorp Marine Ltd SGD 3.666 5.120 39.7SIA Engineering Co Ltd SGD 3.340 4.270 27.8Singapore Airlines Ltd SGD 14.940 15.700 5.1Singapore Exchange Ltd SGD 8.330 8.470 1.7Singapore Press Holdings Ltd SGD 3.573 3.990 11.7Singapore Technologies Engineering Ltd SGD 3.188 3.280 2.9Singapore Telecommunications Ltd SGD 3.110 3.140 1.0SMRT Corp Ltd SGD 1.910 2.010 5.2StarHub Ltd SGD 2.150 2.680 24.7United Overseas Bank Ltd SGD 19.700 18.140 -7.9Wilmar International Ltd USD 6.430 5.950 -7.5

8/7/2019 OCBC - S'pore Strategy-20101215
http://slidepdf.com/reader/full/ocbc-spore-strategy-20101215 16/82
Page 16 15 December 2010
Strategy Update
Average Daily Traded Volume on the SGX (million units)
-
500
1,000
1,500
2,000
2,500
3,000
3,500
4,000
4,500
5,000
Jan
07
M M J S N Jan
08
M M J S N Jan
09
M M J S N Jan
10
M M J S N
Exhibit 10: Volume on the SGX
Source: Bloomberg

8/7/2019 OCBC - S'pore Strategy-20101215
http://slidepdf.com/reader/full/ocbc-spore-strategy-20101215 17/82
Page 17 15 December 2010
Strategy Update
Dividend stocks remain attractive. 2011 could remain another attractive
year for dividend stocks. In 2010, high dividend stocks did well (including
StarHub, and M1), and we believe this trend will continue into 2011. Apartfrom the more conservative investors who prefer defensive stocks, we believe
that good yielding stocks also offer investors the potential to participate in
potential capital upside (for example, StarHub gained +22% from Jan to
Nov 2010 and M1 appreciated 17%). In addition, in the current extremely
low interest rate environment and together with low bond yields, this makes
for a compelling investment case in good dividend yielding stocks.
Market is still flushed with liquidity; equities will benefit. With the
increase in fund flow, there is huge amount of liquidity in the market, which
has been buoying asset prices in Asia (essentially property prices in all
the key cities in Asia including Singapore) and also spilling over to equitiesin 2010. This liquidity will need to look for good yielding assets and apart
from high dividend stocks, it will also look for stocks offering potential
capital appreciations. We believe that this will favour companies that will
continue to deliver good revenue and profit growth as output rises. In this
space, Singapore's blue chips will continue to dominate as most have
emerged from the 2008 crisis relatively unscathed and are poised to deliver
good growth in 2011. Based on consensus estimates from Bloomberg, STI
component stocks are projected to grow 10% per year in 2011 and 2012.
Coupled with a Price/Book (P/B) of 1.8x, STI stocks are not expensive.
Possible headwinds - The US. There are still uncertainties in the marketand while the current focus is on Europe, the other big concern in the
market is the possibility of yet another US recession. The US economy is
projected to grow at a 2.5% pace (according to the consensus forecast
from Bloomberg). However, there is now worry that the world's largest
economy will slip into recession again. On the other hand, the optimist
sees this as being positive as it will then ensure that interest rates stay
low, averting another crisis. In addition, the US unemployment rate remains
near the highest level in 27 years at close to 10% (9.8% in Nov 2010). At
this level, there is the possibility that the US government will need to continue
to pump funds into the economy to improve the unemployment rate and to
stoke the economic recovery. Already US Federal Reserve Chairman BenBernanke has indicated that the Fed may expand bond purchases beyond
the US$600 billion announced in Nov.
Possible headwinds - China. Singapore is still dependent on the key
economies. According to a Fitch report, Asia accounted for 58% of China's
imports in 2009. As such, any slowdown in China would impact Asian's
trade volume growth and GDP growth. In the Fitch report, it identified China's
key trading partners as Hong Kong SAR, Taiwan, Singapore, Korea, Malaysia
and Australia. These countries are heavily reliance on China as an export
destination. With China still mulling more measures to tighten excess
liquidity, this could spill over to Asian economies.

8/7/2019 OCBC - S'pore Strategy-20101215
http://slidepdf.com/reader/full/ocbc-spore-strategy-20101215 18/82
Page 18 15 December 2010
Strategy Update
Low interest rate environment remains a plus for equities. With the
present low interest rate environment, it has underpinned demand for
residential properties in Singapore. In addition, equities also benefited. Withthe 9.9% YTD gain for the STI, equities offer a good total return (potential
capital gains + a more than 3% dividend yield from the STI component
stocks). Based on indications from the US, interest rates are likely to stay
low, at least for the medium term.
Back to the fundamentals, valuations are not excessive. While the
economic issues (in the US and Eurozone) will weigh on investment
decisions despite the Quantitative Easing measures, we believe if we
exclude these issues, Asia's fundamentals remain sound, especially in
Singapore. The re-inventing of Singapore has taken place successfully and
the government is likely to dish out more measures and incentives to growits population and develop hubs for key activities to attract visitors and
more migrants.
One of the key barometers will be valuation. At current levels, valuations
are not excessive in Singapore (refer to exhibit below). Singapore's STI is
among the lowest in the region and this level is also low vis-à-vis the historical
average. In terms of Price/Earning (P/E) ratio, it is below the historical
average of close to 18x (stripping out abnormal years) and yet supported
by 2-year forward earnings growth of 10% per annum.
Singapore is still enjoying good growth; M&As likely to continue. Inyet another sign that it will be a good year for Singapore, despite the uncertain
outlook, hiring is set to continue in 1Q 2011. According to the US-based
recruitment firm Manpower's Employment Outlook poll, most employers
indicated that they would increase staff numbers. About one-third of the
686 employers polled said they would increase staff numbers, up 5
percentage points from 4Q 2010. This is indicative of the still healthy growth
environment here.
2010 was a good year for M&A and we saw some high-profile deals including
the privatisation of Parkway Holdings as well as the change of ownership at
Thomson Medical. With current valuations at undemanding levels andtogether with the availability of funding at low cost, we expect M&A to
remain a dominant theme in 2011.

8/7/2019 OCBC - S'pore Strategy-20101215
http://slidepdf.com/reader/full/ocbc-spore-strategy-20101215 19/82
Page 19 15 December 2010
Strategy Update
Exhibit 11: Global Indices - P/B and PER
Source: Bloomberg as of 10 Dec 2010
2010 stock picks have done well. A review of our stock picks in our
Strategy 2010 showed that most stocks have done well. On average, these
stocks are up 21.1% compared to 13.8% for the STI for the same period.
We affirmed our belief and stayed in these quality companies throughout
most of the year, largely supported by good orders, earnings and still healthy
valuations.
Exhibit 12: Stock Picks 2010
Source: OIR
Indices Price/Book (x) PER (x) PER 1 (x) PER 2 (x)
Dow Jones 2.6 13.9 13.4 12.0
S&P500 2.2 15.5 14.5 12.8
Nasdaq 2.9 34.5 19.5 15.8
Nikkei 1.3 19.8 17.9 15.7
TAIEX 2.0 15.4 14.7 13.1
KOSPI 1.4 14.1 11.3 10.0
CSI 300 2.8 18.7 17.4 14.2
Hang Seng 1.9 14.3 14.6 12.6
KLCI 2.4 17.2 16.0 14.3
STI 1.8 12.6 15.5 14.1
Price Price
15-Dec-09 10-Dec-10 % Gain
(S$) (S$)
Ezra Holdings SGD 2.081 1.660 -20.2
Genting Singapore PLC SGD 1.090 2.170 99.1
Hyflux SGD 3.250 3.270 0.6
Keppel Corp SGD 8.001 10.860 35.7
Keppel Land SGD 3.300 4.710 42.7
Midas Holdings SGD 0.870 0.935 7.5
M1 Ltd/Singapore SGD 1.840 2.310 25.5Noble Group SGD 2.006 2.120 5.7
Olam International SGD 2.630 3.100 17.9
SembCorp Marine SGD 3.606 5.120 42.0
Singapore Telecoms SGD 3.020 3.140 4.0
SMRT Corp * SGD 1.830 2.010 9.8
StarHub SGD 2.060 2.680 30.1
UOL Group SGD 3.830 4.680 22.2
Wilmar International SGD 6.340 5.950 -6.2
Average % Gain 21.1
* SMRT: Price as at 16-Dec-2009

8/7/2019 OCBC - S'pore Strategy-20101215
http://slidepdf.com/reader/full/ocbc-spore-strategy-20101215 20/82
Page 20 15 December 2010
Strategy Update
Laggard plays likely to see a re-rating. While the STI posted gains this
year, the gains were not broad-based. This implies that gains were generated
by a handful of stocks including the Jardine group of companies, the oil &
gas stocks and Genting. We see a possible re-rating for some of the
underperformers including certain property and banking stocks.
Although equities were generally up in 2010, we believe that the uptrend is
likely to continue into 2011, partly brought on by a re-rating for the laggards.
These are laggards in terms of share price performances and not in terms
of earnings. In addition, valuations for stocks are not excessive at current
levels.
We are OVERWEIGHT Oil & Gas, Commodities & Banks. In terms of
sectors, we continue have an OVERWEIGHT on the Oil & Gas and
Commodities sectors. However, we have downgraded Telecomminications,
which has been a consistent Overweight to NEUTRAL for next year, largely
as we see little positive price catalysts. With the increasing and aging
population; rising affluence; booming medical tourism business; and ongoing
initiatives to consolidate Singapore's reputation as a leading medical hub,
we see several positive catalysts to drive the Singapore healthcare sector
for the coming year. While we stay NEUTRAL for most other sectors, we
are upgrading the Singapore banks to OVERWEIGHT, largely as their
underperformance is not warranted for the quality of earnings and assets.
Please refer to Section D for more information and details.
Stock picks 2011. We remain positive on the Singapore market supported
by several favourable indicators including good flow of funds, current low
interest rate environment which will continue to favour equities, undemanding
valuations, earnings for blue chips of at least 10% in 2011, and more mergers
and acquisitions. For the near to medium term, market focus is still likely
to concentrate on Europe's sovereign debt situation. We expect some of
the "laggards" in 2010 to be re-rated in 2011, and this is likely to include
some of the property and banking stocks. Our picks for 2011 are Ascott
Residence Trust (ART), Biosensors International Group, CapitaLand
Ltd, DBS Group Holdings Ltd, Ezra Holdings Ltd, Genting Singapore,
Hyflux Ltd, Pacific Andes Resources Development, Keppel Corporation
Ltd (KepCorp), Mapletree Logistics Trust (MLT), Noble Group Ltd, Olam
International Ltd, Sembcorp Marine Ltd (SembMarine), Starhub Ltd,
United Overseas Bank Ltd (UOB), United Overseas Land Ltd (UOL) and
Venture Corp Ltd (VMS). See Section F for more details.

8/7/2019 OCBC - S'pore Strategy-20101215
http://slidepdf.com/reader/full/ocbc-spore-strategy-20101215 21/82
Page 21 15 December 2010
Strategy Update
SECTION C: SINGAPORE ECONOMY
What a year! What a year it has been for the Singapore economy. 2Q10
saw record on-year growth of 19.5%, which will likely propel 2010 real
GDP expansion to as high as 15%, based on the official Ministry of Trade
and Industry (MTI) forecast. Given Singapore's small and open economy, it
was one of the worst hit in Asia during the financial crisis, and the low base
effect contributed to the significant growth we saw in the past year. Of
course, factors such as 1) robust expansion in the biomedical manufacturing
and electronics clusters, 2) opening of the two Integrated Resorts and 3)
recovery in the financial services sector were essential to the rebound as
well.
-15
-10
-5
0
5
10
15
20
25
0 1 / 0 3 / 9 2
0 1 / 0 3 / 9 3
0 1 / 0 3 / 9 4
0 1 / 0 3 / 9 5
0 1 / 0 3 / 9 6
0 1 / 0 3 / 9 7
0 1 / 0 3 / 9 8
0 1 / 0 3 / 9 9
0 1 / 0 3 / 0 0
0 1 / 0 3 / 0 1
0 1 / 0 3 / 0 2
0 1 / 0 3 / 0 3
0 1 / 0 3 / 0 4
0 1 / 0 3 / 0 5
0 1 / 0 3 / 0 6
0 1 / 0 3 / 0 7
0 1 / 0 3 / 0 8
0 1 / 0 3 / 0 9
0 1 / 0 3 / 1 0
%
CLI YoY
Real GDP YoY
Record 19.5% YoY
growth in 2Q10
Exhibit 13: Singapore's Real GDP Growth and Composite Leading Index
Source: Bloomberg, OIR

8/7/2019 OCBC - S'pore Strategy-20101215
http://slidepdf.com/reader/full/ocbc-spore-strategy-20101215 22/82
Page 22 15 December 2010
Strategy Update
Drivers in 2011. Given such a strong rebound from 2009's 1.3% contraction,
it is reasonable to expect an easing in the growth momentum in 2011 - the
MTI estimates it to be 4-6% while OCBC Treasury Research & Strategy is
looking at a narrower range of 4-5%. External macroeconomic conditions
are likely to remain supportive of growth next year, driven by 1) a gradual
recovery in the advanced economies, bolstered by expansionary monetary
policies and 2) strong domestic consumption in Asia due to wage increases
and healthy fundamentals. As a major trading hub, Singapore is likely to
benefit from more intra-regional trade flows. Meanwhile, new capacity
additions in the manufacturing sector and progressive openings of
recreational facilities in the tourism-related services industries should
contribute to growth as well, according to the MTI.
Exhibit 14: Singapore's GDP Projection and Key Statistics
Source: OCBC
2008 2009 2010F 2011F
Real GDP growth 1.8% -1.3% 14.0% 4.5%
- Manufacturing -4.2% -4.1% 27.4% 5.6%
- Construction 20.1% 16.2% 8.6% 4.4%
- Services 4.8% -1.4% 10.6% 4.6%
CPI Inflation 6.5% 0.6% 3.0% 2.6%
Unemployment rate 2.3% 2.1% 2.1% 2.0%
USD SGD 1.41 1.45 1.29 1.27
Inflationary risks and potential impact. Though final demand in advanced
economies should eventually increase as a result of expansionary policies,
capital leakage to certain emerging nations and Asian countries mean that
coupled with a low interest rate environment, inflationary risks could be a
key feature in 2011, fueling higher asset prices (Exhibit 15). As such, likely
beneficiaries include property-related stocks. Higher wage growth also means
that discretionary spending should continue to stay strong1 , which is positive
for hospitality and consumer-related stocks. However, the impact on these
two sectors may not be substantial since core inflation (which excludes
accommodation and private road transport) is expected to be stable around2-3% in 2011, comparable to about 2% in 20102 . Possible losers include
companies that are unable to pass on higher costs to consumers due to
low pricing power.
1 OCBC Treasury & Research believes that the domestic labour market is likely to remain
tight in the near term, especially for selected services industries like financial services. In
particular, the overall unemployment rate should remain anchored around 2% in 2011.
2 MAS monetary policy statement. 14 Oct 2010.

8/7/2019 OCBC - S'pore Strategy-20101215
http://slidepdf.com/reader/full/ocbc-spore-strategy-20101215 23/82
Page 23 15 December 2010
Strategy Update
Exhibit 15: Future Key Drivers of Inflation include Housing and Transport
Source: OCBC Treasury & Research, Nov 2010.
Lower interest rates with stronger SGD. To pre-empt imported inflation,
the MAS re-centered the SGD NEER upwards and shifted to a policy of
modest and gradual appreciation in Apr. The slope of the policy band was
also subsequently increased in Oct. Due to the trilemma that any economy
can only control two out of the three variables (exchange rate, interest
rates and openness of capital account), the 3-month SIBOR has trended
down after both monetary statements were released at different times this
year (Exhibit 16)3 . Hence going forward, should the SGD NEER continue
to stay strong and the Fed continue with its low interest rate policy, the
upside for the 3-month SIBOR should be capped, assuming MAS'
sterilization operations are not substantial. Along with a backdrop of flush
liquidity, we could be in a prolonged period of easy financing for property
buyers, hence supporting property sales (barring additional tightening
measures from the government). This is a positive factor for property-related
stocks.
3 Such that total returns (currency and carry) would remain the same to the investor, other
things being equal.

8/7/2019 OCBC - S'pore Strategy-20101215
http://slidepdf.com/reader/full/ocbc-spore-strategy-20101215 24/82
Page 24 15 December 2010
Strategy Update
0
0.5
1
1.5
2
2.5
3
3.5
4
0 3 / 0
1 / 0 0
0 3 / 0
7 / 0 0
0 3 / 0
1 / 0 1
0 3 / 0
7 / 0 1
0 3 / 0
1 / 0 2
0 3 / 0
7 / 0 2
0 3 / 0
1 / 0 3
0 3 / 0
7 / 0 3
0 3 / 0
1 / 0 4
0 3 / 0
7 / 0 4
0 3 / 0
1 / 0 5
0 3 / 0
7 / 0 5
0 3 / 0
1 / 0 6
0 3 / 0
7 / 0 6
0 3 / 0
1 / 0 7
0 3 / 0
7 / 0 7
0 3 / 0
1 / 0 8
0 3 / 0
7 / 0 8
0 3 / 0
1 / 0 9
0 3 / 0
7 / 0 9
0 3 / 0
1 / 1 0
0 3 / 0
7 / 1 0
%
3mth SIBOR
Falls after release of monetary policy statem ents
Exhibit 16: 3mth SIBOR at Historical Lows
Source: Bloomberg, OIR
Exhibit 17: Business Loans Growth Recover as Companies Return to
Expansion Mode
-10
-5
0
5
10
15
20
25
30
35
40
0 1 / 0 1 / 0 6
0 1 / 0 4 / 0 6
0 1 / 0 7 / 0 6
0 1 / 1 0 / 0 6
0 1 / 0 1 / 0 7
0 1 / 0 4 / 0 7
0 1 / 0 7 / 0 7
0 1 / 1 0 / 0 7
0 1 / 0 1 / 0 8
0 1 / 0 4 / 0 8
0 1 / 0 7 / 0 8
0 1 / 1 0 / 0 8
0 1 / 0 1 / 0 9
0 1 / 0 4 / 0 9
0 1 / 0 7 / 0 9
0 1 / 1 0 / 0 9
0 1 / 0 1 / 1 0
0 1 / 0 4 / 1 0
0 1 / 0 7 / 1 0
% Y
o Y
Loans to businesses
Loans to consumers
Source: Bloomberg, OIR

8/7/2019 OCBC - S'pore Strategy-20101215
http://slidepdf.com/reader/full/ocbc-spore-strategy-20101215 25/82
Page 25 15 December 2010
Strategy Update
Beneficiaries of buoyant tourism industry. Visitor arrivals to Singapore
registered 18.4% growth in Sep this year, marking the 10 th consecutive
month of record visitor arrivals. The country saw a new record in Jul (Exhibit
18), which was the first time that visitor arrivals have exceeded 1m in a
single month. This can be largely attributed to improved consumer sentiment,
the draw of the Integrated Resorts, the Great Singapore Sale, and initiatives
by the Singapore Tourism Board and retailers. As more recreational facilities
and tourist attractions roll out, the services sector is likely to remain supported
by buoyant tourist arrivals, provided the global macroeconomic environment
continues to be stable. Direct beneficiaries should include companies in
the hospitality sector and the retail industry.
Exhibit 18: Tourist arrivals hit a new record in July
Source: Bloomberg, OIR
Growth in 2011, but fraught with risks. As a small and open economy,
Singapore has always strived to ride on global economic recoveries whilst
using policies to cushion the debilitating effects of global recessions. Asusual, we expect the country to reap the benefits of improving global
consumer sentiment and trade, and at the same time keep a watchful eye
on capital flows throughout the region. With the experience of the 1997
Asian Financial Crisis and healthier balance sheets compared to more
than 10 years ago, Asian countries should stand more ready to handle
impending waves of liquidity.
-80%
-60%
-40%
-20%
0%
20%
40%
0 1 / 0 1 / 0 5
0 1 / 0 4 / 0 5
0 1 / 0 7 / 0 5
0 1 / 1 0 / 0 5
0 1 / 0 1 / 0 6
0 1 / 0 4 / 0 6
0 1 / 0 7 / 0 6
0 1 / 1 0 / 0 6
0 1 / 0 1 / 0 7
0 1 / 0 4 / 0 7
0 1 / 0 7 / 0 7
0 1 / 1 0 / 0 7
0 1 / 0 1 / 0 8
0 1 / 0 4 / 0 8
0 1 / 0 7 / 0 8
0 1 / 1 0 / 0 8
0 1 / 0 1 / 0 9
0 1 / 0 4 / 0 9
0 1 / 0 7 / 0 9
0 1 / 1 0 / 0 9
0 1 / 0 1 / 1 0
0 1 / 0 4 / 1 0
0 1 / 0 7 / 1 0
G r o w t h
0
200,000
400,000
600,000
800,000
1,000,000
1,200,000
V i s i t o r s
Total arrivals to SG% YoY% MoM
Hit new record in July

8/7/2019 OCBC - S'pore Strategy-20101215
http://slidepdf.com/reader/full/ocbc-spore-strategy-20101215 26/82
Page 26 15 December 2010
Strategy Update
SECTION D: SINGAPORE BANKING SECTOR
Banks have surprised on the upside. The local banks delivered another
quarter of good earnings in 3Q 2010, following the better-than-expected
performance in 2Q - making it two quarters in a row that the banks have
exceeded street estimates. The key highlights included still healthy loan
growth, albeit lower than the rates seen in 2Q, and as expectations of
future moderating rates have already been built-in by the market, especially
following recent property cooling measures.
Net Interest Margin (NIM) also eased off, as the banks saw YoY and QoQ
declines in margin (except OCBC, which saw a slight QoQ increase in NIM
in 3Q). While Net Interest Income (NII) saw a slight QoQ improvement formost, the key driver came from Non-interest Income (NI), which accounted
on average for about 42% of total combined earnings - and this trend has
been gradually rising in the past few years.
Exhibit 19: Comparison of Net Profits (S$m)
Source: Banks' financial statements/results
0
200
400
600
800
1000
1200
1400
1600
1800
2000
4QFY08 1QFY09 2QFY09 3QFY09 4QFY09 1QFY10 2QFY10 3QFY10
DBS OCBC UOB

8/7/2019 OCBC - S'pore Strategy-20101215
http://slidepdf.com/reader/full/ocbc-spore-strategy-20101215 27/82
Page 27 15 December 2010
Strategy Update
Margins will continue to be under pressure. In recent quarters, we
have seen margins coming under pressure. In general, rates have been
coming off since 4Q 2008. As an indication, the average NIM for the three
banks has eased from slightly above 2.3% in 4Q 2008 to about 1.95% by
3Q FY10, making it seven quarters of QoQ decline. Going forward, with the
present rock-bottom interest rate environment, this is likely to squeeze
margins for the banks, as the gap narrows between borrowing and lending
rates. In addition, rates look set to stay low for a long while, especially with
the recent US government move to buy US$600 billion worth of bonds.
Exhibit 20: Comparison of Net Interest Margin (%)
Source: Banks' financial statements/results
1.60%
1.70%
1.80%
1.90%
2.00%
2.10%
2.20%
2.30%
2.40%
2.50%
2.60%
4QFY08 1QFY09 2QFY09 3QFY09 4QFY09 1QFY10 2QFY10 3QFY10
DBS OCBC UOB

8/7/2019 OCBC - S'pore Strategy-20101215
http://slidepdf.com/reader/full/ocbc-spore-strategy-20101215 28/82
Page 28 15 December 2010
Strategy Update
Headwinds remain. While we are generally positive on the outlook for the
local banks, buoyed by domestic 2011 economic growth of 4-6% and
Developing Asia's growth of 8.4% in 2011 (according to International
Monetary Fund), there remains key risks in the market. These include the
Eurozone debt issue, a slowdown for the US economy; China's tightening
measures and other geopolitical factors that will hurt the growth in Asia.
This will translate into slower loans growth as well as a tougher operating
environment and could impact both Net Interest Income (NII) and Non-
interest Income (NI). If a US recession takes place, this will also result in
deterioration in asset quality, and could also lead to higher impairments
and provisions.
Higher Non-interest Income. From earlier indications, the pipeline for
the capital markets looks good for 1H 2011 and we expect more deals and
IPOs to come into the market. In addition, with the present low interest
rate environment, this provides the impetus for more mergers and
acquisitions (M&A). As valuations are not excessive, it is an opportune
time for corporates to embark on growth via acquisitions and we expect
Non-interest Income to continue to lead operating income growth.
2010 was a good year for funding raising exercises and there were several
high-profile takeovers (including Parkway Holdings). We expect this trend
to remain very much in play in 2011 and this could buoy earnings.
Exhibit 21: Net Interest Income (S$m)
Source: Banks' financial statements/results
600
700
800
900
1,000
1,100
1,200
4Q07 1Q08 2Q08 3Q08 4Q08 1Q09 2Q09 3Q09 4Q09 1Q10 2Q10 3Q10
OCBC DBS UOB

8/7/2019 OCBC - S'pore Strategy-20101215
http://slidepdf.com/reader/full/ocbc-spore-strategy-20101215 29/82
Page 29 15 December 2010
Strategy Update
Exhibit 22: Non-interest Income (S$m)
Source: Banks' financial statements/results
Good demand for loans in 2010. Based on data from the Monetary
Authority of Singapore (MAS), Oct's banking sector loan growth remained
strong at +13.8% YoY, up from +12.1% YoY in Sep and +10.4% YoY in
Aug. This was largely driven by business loans which accelerated 10.1%
in Oct, up from +7.4% in Sep, as well as consumer loans, which grew
18.1% in Oct. Business loans accounted for about 53% of total loans and
the balance came from consumer loans. The key segments are housing
and bridging loans, which accounted for about 35% of loans, and building
and construction which accounted for another 16%.
Reflective of the recent property cooling measures and the government's
land sales program, housing loans eased off and this came as no surprise.
Growth of housing/bridging loans eased off to +22.5% YoY in Oct, down
from Aug's +23.4% (before the measures were introduced). With the recent
round of property measures, we expect the strong growth rate for the housing/
bridging loan segment to moderate in the coming months, but the slack
could be taken up by growth in other segments such as the business
sector. However, we do not expect the double-digit growth seen in 2010 to
be repeated in 2011 and are projecting a mid single-digit growth for 2011.
250
350
450
550
650
750
850
4Q07 1Q08 2Q08 3Q08 4Q08 1Q09 2Q09 3Q09 4Q09 1Q10 2Q10 3Q10
OCBC DBS UOB

8/7/2019 OCBC - S'pore Strategy-20101215
http://slidepdf.com/reader/full/ocbc-spore-strategy-20101215 30/82
Page 30 15 December 2010
Strategy Update
Exhibit 23: Loans and Advances (S$m)
Source: MAS
Sep 2010 Oct 2010
Total loans and advances 309,371 313,264
- YoY (%) 12.1% 13.8%
Total loans to business 164,653 165,985
- YoY (%) 7.4% 10.1%
Agriculture, mining & quarrying 521 408
Manufacturing 11,356 11,246
Building and construction 51,054 51,507
General commerce 28,106 28,566
Transport, storage and communication 8,855 9,006
Business services 6,006 4,877
Financial institutions 36,044 35,842
Professional and private individuals - business 3,036 3,183
Others 19,674 21,351
Total consumer loans 144,718 147,279
- YoY (%) 18.0% 18.1%
Housing and bridging loans 106,874 109,127
- YoY (%) 22.7% 22.5%
Professional & private individuals - Car loans 11,725 11,700
Professional & private individuals - Credit cards 6,306 6,355
Professional & private individuals - Share financing 1,134 1,217
Professional & private individuals - Others 18,679 18,880

8/7/2019 OCBC - S'pore Strategy-20101215
http://slidepdf.com/reader/full/ocbc-spore-strategy-20101215 31/82
Page 31 15 December 2010
Strategy Update
Exhibit 24: Comparison of Loans Growth (%)
Source: Banks' financial statements/results
Lower allowances in 2010, and downtrend likely to continue into
2011. Allowances for credit and other loans tapered off in 2Q and 3Q in
2010, and as long as global market conditions do not deteriorate too
drastically, we expect this to ease off further in 2011. As a re-cap,
allowances fell about 56% on average for the three banks from a combined
S$2598m in 9-month FY09 to S$1134m in 9-month FY10. DBS reported
total allowances of S$754m for the 9-month ended Sep 2010, down 35%.UOB saw a decline of 73% to S$294m. For 2011, we are projecting lower
levels for both DBS and UOB in 2011 at S$433m and S$250m, respectively.
Cost is kept within reasonable levels. Despite the volatility seen
throughout 2010, the banks reported earnings that were fairly healthy.
This was in part due to good cost management. Overall, all three banks
saw cost-to-income ratios of between 39% and 41% for the first nine
months of 2010, marginally higher than 37-38% for the same period in
2009, due to the lower job credits. However, going forward, we expect the
cost ratios to stay close to the 40% level as employment remains tight in
the financial sector and banks have to compete to retain and recruitemployees. In addition, we expect technology to remain a key investment,
especially with growing regional operations and the integration and cross-
selling within these businesses.
Banks remain good investment ideas. Besides economic headwinds,
there are also concerns about regulators' policies and the potential impact
on the global banking business, not helped by the failure of several smaller
banks in Europe. This will result in fluctuations in the share prices of
banking stocks. For the Singapore banks, we do not expect this to translate
into higher non-performing loans or in deterioration in asset quality as we
believe that the local banks remain prudent in their business activities.
-4.0%
-2.0%
0.0%
2.0%
4.0%
6.0%
8.0%
10.0%
12.0%
Dec 08 Mar 09 Jun 09 Sep 09 Dec 09 Mar 10 Jun 10 Sep 10
DBS OCBC UOB

8/7/2019 OCBC - S'pore Strategy-20101215
http://slidepdf.com/reader/full/ocbc-spore-strategy-20101215 32/82
Page 32 15 December 2010
Strategy Update
While the outlook is still muted, largely due to uncertainties in the region
and globally, we believe that valuations are attractive. Banks have beenlaggards in 2010, underperforming the broader STI as well as the FTSE
Financial Index (see exhibit). However, earnings remain healthy with 9-
month earnings of S$1972m for DBS (+27%, excluding goodwill impairment
charge), S$1749m for OCBC (+20%) and S$1990m for UOB (+44%). This
means a combined profit improvement of 30%.
Exhibit 25: Share Price Performance
Source: Bloomberg
Exhibit 26: FTSE Financial Index
Source: Bloomberg
200
300
400500
600
700
800
900
J a n - 0 9
F e b - 0 9
M a r - 0 9
A p r - 0 9
M a y - 0 9
J u n - 0 9
J u l - 0 9
A u g - 0 9
S e p - 0 9
O c t - 0 9
N o v - 0 9
D e c - 0 9
J a n - 1 0
F e b - 1 0
M a r - 1 0
A p r - 1 0
M a y - 1 0
J u n - 1 0
J u l - 1 0
A u g - 1 0
S e p - 1 0
O c t - 1 0
N o v - 1 0
D e c - 1 0
Share price on
10 Dec 2010 YTD Mkt Cap (S$ bn) P/B (x)
DBS 14.06 -8.7% 32.46 1.23
OCBC 9.87 8.5% 32.98 1.61
UOB 18.16 -7.8% 28.33 1.34
Average -2.7% 1.39

8/7/2019 OCBC - S'pore Strategy-20101215
http://slidepdf.com/reader/full/ocbc-spore-strategy-20101215 33/82
Page 33 15 December 2010
Strategy Update
Exhibit 27: Tier-1 Capital
Source: Banks' financial statements/results
Exhibit 28: ROE (%)
-
2.0
4.0
6.0
8.0
10.0
12.0
14.0
16.0
18.0
4Q07 1Q08 2Q08 3Q08 4Q08 1Q09 2Q09 3Q09 4Q09 1Q10 2Q10 3Q10
OCBC DBS UOB
Source: Banks' financial statements/results
7.0%
8.0%
9.0%
10.0%
11.0%
12.0%
13.0%
14.0%
15.0%
16.0%
17.0%
1 Q0 8 2 Q0 8 3 Q0 8 4 Q0 8 1 Q0 9 2 Q0 9 3 Q0 9 4 Q0 9 1 Q1 0 2 Q1 0 3 Q1 0
OCBC DBS UOB

8/7/2019 OCBC - S'pore Strategy-20101215
http://slidepdf.com/reader/full/ocbc-spore-strategy-20101215 34/82
Page 34 15 December 2010
Strategy Update
Overweight the banking sector. We are increasing our rating for the
banking sector from Neutral to OVERWEIGHT. While the broader STI
components have appreciated in 2010, the banks have underperformed.
The FTSE Financial Index is up 1.5% YTD versus +9.9% for the STI. In
addition, the three banks on average fell 2.9%. OCBC outperformed with a
gain of 8.2% (from Jan to 10 Dec 2010), while DBS and UOB saw declines
of 9.0% and 7.9%, respectively. We are of the view that banking stocks are
likely to be re-rated in 2011 as investors look for value. We have a BUY for
both DBS [fair value of S$16.00] and UOB [fair value of S$19.60].
Exhibit 29: Comparison of Key Information
Source: OIR, Bloomberg
Share price on 10
Dec 2010 (S$)
PER1
(x)
PER2
(x)P/Book (x)
Div Yield
(%)Rating
Fair Value
(S$)
Upside
DBS 14.06 20.2 11.2 1.2 4.0 BUY 16.00 13.8%
OCBC 9.87 14.7 13.9 1.9 3.0 NR 10.66 8.0%
UOB 18.16 10.6 10.1 1.5 3.3 BUY 19.40 6.8%
Note: OCBC is NR (Not-Rated); and the figures for OCBC are taken from Bloomberg

8/7/2019 OCBC - S'pore Strategy-20101215
http://slidepdf.com/reader/full/ocbc-spore-strategy-20101215 35/82
Page 35 15 December 2010
Strategy Update
SECTION E: SECTOR OUTLOOK AND COMMENTS
Telecommunications Sector - NEUTRAL
The Singapore mobile services market is still expected to perform reasonably
well in 2011; but any boost from the NBN (Next Generation National
Broadband Network) is likely to be low, given the slow roll-out as well as
the low take-up rate of NBN packages; the Pay TV arena is also expected
to see some big changes, namely with the implementation of the cross-
carriage mandate for "exclusive content" from 1H11, making it another mixed
bag for the telcos. As such, we see very little positive catalysts going for
them in 2011, besides just attractive dividend yields (M1 and StarHub), and
hence we downgrade the sector to NEUTRAL from Overweight. Please
refer to our report titled "Telecom: Yields still good" dated 29 Nov 2010
for more details
Oil & Gas - OVERWEIGHT
The FTSE Oil and Gas index is now back in positive territory after a divergence
with the STI emerged in late Apr, mainly due to the Gulf of Mexico oil spill.
The sector has outperformed the broader market in the past few months,
helped by improving sentiment on the rigbuilders, which have outperformed
the rest of the oil and gas stocks under our coverage YTD. Both rigbuilders
are likely to see more orders for high-spec jackups. The push for even
more technical assets is also likely to continue, benefiting companies that
do not scrimp on R&D. The outlook for the smaller and lower-spec offshore
support vessels remains dim. Going into 2011, we maintain our
OVERWEIGHT rating on the sector though different stages of the value
chain experience different demand and supply dynamics. As the global
economy continues its recovery, oil prices are likely to remain high enough
to sustain capital expenditure. Our preferred picks are Keppel Corporation
[BUY, FV: S$12.50] and SembCorp Marine [BUY, FV: S$5.70] as likely
beneficiaries based on underlying trends. Please refer to our report titled
"Oil & Gas: Diverse growth trajectories" dated 2 Dec 2010 for more
details.

8/7/2019 OCBC - S'pore Strategy-20101215
http://slidepdf.com/reader/full/ocbc-spore-strategy-20101215 36/82
Page 36 15 December 2010
Strategy Update
Healthcare - OVERWEIGHT
The FTSE ST Health Care Index has recorded an impressive 67.8% return
YTD and this has far surpassed the 9.5% gain on the broader market. This
has been partly ignited by the acquisition buzz surrounding Parkway
Holdings and Thomson Medical Centre at relatively high valuations. We are
positive about the outlook of the healthcare sector moving forward. This is
driven by an increasing and aging population; rising affluence; booming
medical tourism business; and ongoing initiatives to consolidate Singapore's
reputation as a leading medical hub. The medical device industry also has
growth potential because of increasing demand for technologically advanced
and efficient equipment. Within this space, the drug-eluting stent (DES)
market looks bright, given its potential in the treatment of coronary artery
diseases. We are sanguine about the prospects of the healthcare sector
given its robust fundamentals. We also like the sector as it is generally
defensive in nature and hence have an OVERWEIGHT rating on it. Under
our coverage, we have a BUY rating and S$1.35 fair value estimate on
Biosensors International Group and a HOLD rating and S$2.35 fair value
estimate on Raffles Medical Group. Please refer to our report titled
"Healthcare: Strong fundamentals to drive growth ahead " dated 6 Dec
2010 for more details.
Technology - NEUTRAL
2010 is turning out to be an exceptional year for the technology sector. The
semiconductor industry, in particular, has staged a steady recovery in sales
since the lows in Jan-Feb 2009. Going into 2011, we hold our view that
normal seasonal pattern would resume and growth would continue, albeit
at a more modest pace. The overall economic picture for the IT space,
however, is not likely to be as vibrant as that of the semiconductor industry,
due to disproportionate performances in different geographical regions and
business sectors. As such, we maintain our NEUTRAL view on the broader
technology sector. Nonetheless, we expect Asia-Pacific IT services and
solutions providers to outperform, due to still healthy growth in the region.
We are more optimistic on the prospects of the EMS/ODM segment as we
anticipate EMS/ODM players to directly gain from increased purchases of
electronic products by both consumers and corporations amid improvements
in the global economy and business sentiment. Hence, we should see
EMS/ODM companies rake up meaningful growth in 2011 sales. Our
preferred picks are Valuetronics [BUY, S$0.44 FV] and Venture
Corporation [BUY, S$12.10 FV] as both companies present good growth
opportunities, boast healthy financial position and excellent management,
and provide attractive dividend yields. Please refer to our report titled
"Technology: Entering into phase of moderate growth " dated 7 Dec
2010 for more details.
8/7/2019 OCBC - S'pore Strategy-20101215
http://slidepdf.com/reader/full/ocbc-spore-strategy-20101215 37/82
Page 37 15 December 2010
Strategy Update
Residential Property - NEUTRAL
The Singapore residential property sector is being pulled in opposing
directions by broader macro-economic forces. Positive drivers include a
high liquidity environment; strong capital flows into Asia; the availability of
cheap housing loans; and strong long-term fundamentals. But policymakers
may soon take the punchbowl away from the market. In our view, further
policy measures are likely to be implemented in 1H2011, particularly to
address the risk that borrowers overextend themselves due to the availability
of cheap debt. The market may choose to "dance until the music stops",
but in our opinion, it is time to recognize the risks of direct investment in
residential property. As such, we advocate a cautious and nimble approach
to investing in the sector and stay NEUTRAL on Singapore residential
property developers. Still, we do see value in select property developers at
current price levels. We prefer developers with strong balance sheets and
those with balanced exposure to the property sector, which should buttress
earnings and performance in a year of fairly high uncertainty for residential
property. Keeping these factors in mind, our top pick for the property sector
in 2011 is UOL Group. Please refer to our report titled "Residential Property:
A year of opposing forces " dated 8 Dec 2010 for more details.
S-REIT - OVERWEIGHT
Going into 2011, we upgrade our rating for the S-REITs from Neutral to
OVERWEIGHT. The persistently low interest rate environment is expected
to stimulate the property market and continue to drive prices higher. Together
with "hot capital inflows" pouring into Asia, it is likely that spot rental rates
and asset prices will continue to be inflated. At the same time, many REITs
managers are capitalizing on the recovery cycle for further asset
enhancements initiatives and acquisitions. Being an inflation hedge, we
think investors' interest in S-REITs is likely to remain piqued in 2011. However,
we noted that different sectors may experience different rates of recovery.
In our opinion, the recovery is likely to be more pronounced for the office
sector, followed by the industrial sector as the catch-up potential is greatest
for these two sectors. The retail sector is likely to remain subdued next
year in view of new retail supply (additional 612k sq ft of lease-able retail
space in 2011), moderate rental escalation as well as lesser spending power
from foreign visitors affected by the appreciating SGD. Within our coverage
universe, our preferred picks are MLT [BUY, FV: S$1.00], ART [BUY, FV:
S$1.38] for large-caps and FCOT [BUY, FV: S$0.18], Starhill Global [BUY,
FV: S$0.66] for small-caps. Please refer to our report titled "S-REITs:
Different strokes for different sectors" dated 10 Dec 2010 for more details.

8/7/2019 OCBC - S'pore Strategy-20101215
http://slidepdf.com/reader/full/ocbc-spore-strategy-20101215 38/82
Page 38 15 December 2010
Strategy Update
Commodity & Plantations - OVERWEIGHT
Global economic recovery in 2010 has boosted the operating landscape
for commodity-related companies under our coverage universe, which
delivered an average 12% gain year-to-date. We expect continued
outperformance in 2011 to be driven by organic and inorganic growth as
recent investments approach maturity. Industry consolidation has been a
recurring theme in 2010 and will continue in 2011. In addition, commodity
price inflation and volatility are likely to persist. As such, strong balance
sheets, ready access to capital and agility in seizing opportunistic
investments will be key differentiating factors that enable larger players to
extend their dominance against this landscape. We remain OVERWEIGHT
on commodities, with a preference for Noble Group [BUY, fair value
S$2.59] and Olam International [BUY, fair value S$3.53]. Please refer
to our report titled "Commodity: Seizing opportunities amid industry
consolidation" dated 14 Dec 2010 for more details.
Singapore banks have delivered good earnings in the last two quarters,
and while headwinds remain globally, we believe that local banks' prudent
business approach and good asset quality are just some of the key
differentiating factors. Margins will come under pressure due to present
low interest rate environment, but we expect Non-interest Income to become
more significant in the coming years. Cost-to-income ratios are at
manageable level, and we expect impairment allowances to come off in
2011. The banking sector has underperformed the broader STI, and the
discount is not warranted as banks have delivered good earnings in 2010.
We expect this gap to narrow in 2011 and banks are likely to be re-rated.
Overall, we are raising our rating from Neutral to OVERWEIGHT and have
a BUY for both DBS and UOB.
Banking - OVERWEIGHT

8/7/2019 OCBC - S'pore Strategy-20101215
http://slidepdf.com/reader/full/ocbc-spore-strategy-20101215 39/82
Page 39 15 December 2010
Strategy Update
SECTION F: STOCK PICKS & COMPANY PROFILES
Ascott Residence Trust (ART): Big is beautiful
We reiterate our BUY rating on ART with a fair value estimate of S$1.38.
With the acquisition of 28 properties from its sponsor, The Ascott Limited
(ART) will transform from a Pan-Asian to an International REIT, doubling its
total asset size to almost S$2.85b. It will also move from 12th to the 6th
largest S-REIT in terms of total asset value. Its enlarged portfolio now
constitutes 55% Pan-Asian and 45% European assets. We view ART's
massive scale-up positively, but have some lingering concerns over its
existing foreign-exchange management given the forthcoming influx of
European currencies into the portfolio. Nonetheless, we are positive on the
outlook for the tourism and hospitality sector and believe that the demand
should spill over to the service apartments. Our investment thesis on ART
is intact and we believe the manager will continue to work hard to extract
value from ART's expanded portfolio for unitholders.
Biosensors International Group: Growth momentum expected to
continue
Biosensors International Group (BIG) has shown that it has put its past
losses behind it and looks set to continue its turnaround story moving
forward. It has demonstrated its resilience by increasing its drug-eluting
stent (DES) market share in addressable markets to close to 15%, which
has exceeded its 10% target. Traditionally, BIG's product revenues for 2H
have been stronger and we do not expect FY11 to be any different. This
would be driven largely by its BioMatrix DES, which engages cutting-edge
technology. BIG has also highlighted that it will enlarge its product portfolio
and we are sanguine about the increased capabilities that could possibly
arise. Part of this has come from inorganic growth, with the acquisitions of
CardioMind and Devax recently. Internally, BioFreedom represents BIG's
next generation DES and initial First-in-Man trial results have been positive.
We continue to like BIG for its technological superiority to its peers and
execution capabilities. Hence we reiterate our BUY rating and DCF-based
fair value estimate of S$1.35. Key risks include the roll-out of disruptive
innovative products by competitors; failure to gain license approval in key
markets; and clinical trial results that turn out to be unsatisfactory.

8/7/2019 OCBC - S'pore Strategy-20101215
http://slidepdf.com/reader/full/ocbc-spore-strategy-20101215 40/82
Page 40 15 December 2010
Strategy Update
CapitaLand Ltd: Valuation seems attractive
CapitaLand (CapLand) launched the 1715-unit d'Leedon (formerly Farrer
Court ) at Farrer Road late last month. As of 06 Dec, some 82% of the 250
units released for the initial launch have been sold. CapLand announced
earlier this month that it will sell 163 units at The Adelphi for a total
S$218.1m, with an expected after-tax profit of about S$15.7m on the
transaction. CapLand said the sale was in line with its "strategy to unlock
the value of non-core assets and recycle assets". With sustained conditions
of high liquidity and cheap debt, we believe it is very likely that policymakers
will implement further measures to regulate the Singapore residential market
in 1H2011. We prefer developers with strong balance sheets and those
with balanced exposure to the property sector, which should buttressearnings and performance in a year of fairly high uncertainty for residential
property. While UOL Group is our top pick for the sector, we think CapLand's
valuations are attractive at the current price level. We maintain our BUY
call on the stock with an unchanged S$4.54 fair value estimate, at parity to
RNAV.
DBS: Looking attractive at current level
DBS has posted two quarters of better-than-market estimates earnings.
Moving forward, the outlook for interest income is likely to be softer due tocurrent low interest rates and recent measures to cool the Singapore property
market. We expect this situation to persist for a few more quarters. However,
we expect Non-interest Income to remain healthy as DBS is a leading
player in the capital market and the IPO pipeline for the 1H of 2011 looks
healthy and this will benefit DBS which has a lion share of the local IPO
market. DBS has underperformed in 2010 and is down 9.0% YTD (till 10
Dec 2010). We view this discount as being excessive and unwarranted. It
is likely to end the year with good earnings of about S$2622m (based on
our estimates) and grow 10.6% in FY11 to S$2899m. We are reiterating
our BUY rating for DBS and our fair value estimate of S$16.00.

8/7/2019 OCBC - S'pore Strategy-20101215
http://slidepdf.com/reader/full/ocbc-spore-strategy-20101215 41/82
Page 41 15 December 2010
Strategy Update
Genting Singapore: Bountiful 4Q10 Likely
Genting Singapore (GS) is likely to perform well in the final quarter of 2010,
the traditional holiday period. RWS has the correct offering to do well, given
that it is pitched towards the family and vacation crowd. A positive
development is that the Casino Regulatory Authority (CRA) has received
licence applications from junket operators endorsed by Resorts World
Sentosa (RWS), where industry watchers believe that some of these
operators could get their licences by early next year. As before, we estimate
that the Singapore gaming market should stabilize around S$7b in 2011,
with RWS maintaining a slightly more dominant share of around 55%.
Depending on how many licenses are issued, we do see room to revise up
our gaming market estimates. We are maintaining our FY10 and FY11
estimates. Our DCF-based fair value also remains at S$2.53, offering a
potential upside of 16.6% from here. Maintain BUY.
Ezra Holdings: Focusing on the integration of AMC
Demand for specialised construction vessels such as multi-purpose support
vessels and high-spec pipelay barges in the region continues to be strong,
and we are positive on the outlook of the marine construction market.
Meanwhile, though AHTS charter rates have been facing downward pressure
for the most of last year as newbuilds continue to be delivered, we are not
expecting a significant decline in rates for Ezra's young and generally higher-
spec vessels. We understand that Aker Marine Contractors is bidding for
about US$1.5b worth of work in the Gulf of Mexico and the North Sea, and
the clinching of deals should improve the performance of the group
subsequently, but it is unclear when this will take place. However, we remain
positive about the group's execution and long-term growth strategy. Wemaintain our BUY rating and S$2.27 fair value estimate.

8/7/2019 OCBC - S'pore Strategy-20101215
http://slidepdf.com/reader/full/ocbc-spore-strategy-20101215 42/82
Page 42 15 December 2010
Strategy Update
Hyflux Ltd: Good Prospects for Further Growth
The shortage of water around the globe is getting worse, as climate change
disrupts rainfall patterns and result in more severe droughts; the issue is
further compounded by a growing world population and rapid urbanization.
The lack of water will also put pressure on food prices, restrict developing
countries' efforts to reduce poverty and also hamper economic growth.
However, it will create opportunities in the water and wastewater industry.
We believe Hyflux Ltd is in a sweet spot to capture these opportunities,
given its substantial presence in both China and MENA. The company is
also sitting on a sizable order book of S$1715m (estimated), and could
see it tagging on another S$1.3-1.5b if it finally inks the deal for two mega
desalination projects in Libya (essentially a mid-2011 story). In between,we also expect Hyflux to announce smaller contract wins, mostly from
China. Maintain BUY with an unchanged fair value of S$3.66 (25x FY11F
EPS), or S$2.44 (adjusted for bonus issue).
Keppel Corporation: New order flow gaining momentum
Demand for premium jack-up rigs has returned, illustrated by recent new
orders. Keppel's O&M arm has also secured about S$2.6b worth of new
orders YTD vs. our full year estimate of S$2.5b. Order flows are gaining
momentum and we should see additional new orders that will benefit the
entire sector with renewed capex rollouts. The results of Petrobras' 28-rig
tender may also be out by the end of the year, though we conservatively
expect the final outcome by 1Q11 to factor in administrative issues and
possible delays. Currently we still see good value in Keppel Corp's stock,
and should the group secure its fair share of orders in the coming quarter,
there is further room for better stock performance. As such, we maintain
our BUY rating and fair value estimate of S$12.50.

8/7/2019 OCBC - S'pore Strategy-20101215
http://slidepdf.com/reader/full/ocbc-spore-strategy-20101215 43/82
Page 43 15 December 2010
Strategy Update
Mapletree Logistics Trust (MLT): Most prolific Industrial REIT
acquirer
In 2010, Mapletree Logistics Trust (MLT) has been the most prolific acquirer
among the Industrial S-REITs. Given the pick-up in industrial space demand
and the strengthening of industrial rents, we think MLT looks set to capitalize
on the recovery cycle in Asia. The full effect of the recently-announced
acquisitions should also improve its top-line and DPU contributions by
2011. We are positive on MLT's track record in undertaking accretive
acquisitions that boost distributable income. Sponsor, Mapletree
Investments, and Itochu also plan to develop logistics built-to-suit (BTS)
projects of approximately US$300-500m over the next 3-5 years, which
will be offered to MLT on a right-of-first refusal basis. This further provides
MLT with a pipeline of potential assets for future acquisitions. Reiterate
BUY with a RNAV-derived fair value of S$1.00 (14.9% estimated total return).
Noble Group Ltd: Earnings to take flight in 2011
We reiterate our BUY rating on Noble Group (Noble) with S$2.59 fair value
estimate in anticipation of earnings acceleration in FY11, as the group
begins to reap the fruits of its recent pipeline investments. To recap, Noble's
3Q10 results exceeded expectations, reversing sharply from its weak 2Q10,
with revenue of US$14.9b (+78.7% YoY; +15.6% QoQ) and core net profit
of US$131.1m (flat YoY; +178% QoQ). Going forward, we expect earnings
to be buoyed by strong underlying fundamentals for commodities such as
energy and agriculture. Several of the group's pipeline investments are
nearing maturity and these should lend a further boost to earnings from
4Q10. Management targets to achieve US$1b in earnings over the next
three years, implying a 24% CAGR between FY09 and FY13. With its
robust balance sheet, the group is well-positioned to capture investment
opportunities that may arise.

8/7/2019 OCBC - S'pore Strategy-20101215
http://slidepdf.com/reader/full/ocbc-spore-strategy-20101215 44/82
Page 44 15 December 2010
Strategy Update
Olam International: Strategically positioned amid industry
consolidation
Olam International (Olam) kicked off its FY11 on a strong note and remains
poised for sustained medium-term growth, driven by robust underlying
fundamentals for agricultural commodities, coupled with volume and margin
growth on the back of the group's ongoing expansion initiatives. The group
recently delivered a 30.6% YoY growth in 1Q11 revenue to S$2.5b, while
net profit jumped 56.2% YoY to S$29.7m. Volumes grew 21.1% as it gained
market share amid industry consolidation, while improved margins further
boosted profits. Going forward, further margin expansion will be supported
by the provision of value-added services. In addition, we view Olam's ready
access to capital as a strategic advantage that will allow it to extend its
dominance amid industry consolidation. We maintain our BUY rating on
Olam. Our fair value estimate remains at S$3.53.
Pacific Andes: A consistent performer
Pacific Andes Resources Development (PARD) has been a consistent
performer in the past few years. Profits have grown a strong 43% CAGR
from FY04 to FY10, while revenue grew 20% for the same period. Going
forward, we are projecting profit growth per year of 21.8% and revenue growth
of 16.7% for FY11-FY12. Recently, it announced the acquisition of a 19.76%
stake in ASX-listed Tassal Group Limited for A$51.7m. We view this deal
positively as it offers a complementary fit into PARD's current operations.
The stock is currently trading at only 0.8x NAV and undemanding PERs of
6.6x FY11F earnings and 5.0x FY12F earnings besides a dividend yield of
4.1%. We are retaining our BUY rating and fair value estimate of S$0.40.

8/7/2019 OCBC - S'pore Strategy-20101215
http://slidepdf.com/reader/full/ocbc-spore-strategy-20101215 45/82
Page 45 15 December 2010
Strategy Update
SembCorp Marine Ltd: Securing its fair share of orders
Demand for premium high-spec jack-up rigs has returned, illustrated by the
recent orders secured by the SembCorp Marine (SMM) and Keppel Corp.
And should the options for these recently secured rig deals be exercised,
the construction of repeated units may result in higher productivity, leading
to better margins. The results of Petrobras' 28-rig tender may also be out
by the end of the year, though we conservatively expect the final outcome
by 1Q11 to factor in administrative issues and possible delays. Order flows
are gaining momentum and we should see additional new orders in the
next quarter that will benefit the entire sector with renewed capex rollouts.
After securing about S$2.5b worth of new orders YTD, SMM has already
met its new order target for this year. We maintain our BUY rating with fairvalue estimate of S$5.70.
StarHub Ltd: Maintain BUY with S$3.02 Fair Value
StarHub Ltd recently posted a much better-than-expected set of 3Q10
results, with the biggest surprising coming from a sooner- and stronger-
than-expected recovery in margin. Although we do expect to see slightly
more margin improvements, we note that it will only come from its Pay TV
business; this as we expect the service EBITDA margins for both its mobile
and broadband businesses to remain flat. In any case, we have taken thesedevelopments into our recent revision and hence we maintain our DCF-
based S$3.02 fair value. As we also expect StarHub to continue paying out
S$0.05/share quarterly dividend in 2011, which translates to an attractive
7.4% annual yield, we maintain our BUY rating.
8/7/2019 OCBC - S'pore Strategy-20101215
http://slidepdf.com/reader/full/ocbc-spore-strategy-20101215 46/82
Page 46 15 December 2010
Strategy Update
UOL Group Ltd: Top pick for 2011
UOL Group launched its freehold Spottiswoode Residences project last
month. According to the Business Times , some 252 units have already
been sold (72% project take-up). The Spottiswoode site was the last
remaining site in UOL's outstanding Singapore land-bank. The GLS 1H2011
sites present UOL with an opportunity to carefully pick and choose future
projects. With sustained conditions of high liquidity and cheap debt, webelieve it is very likely that policymakers will implement further measures
to regulate the residential market in 1H2011. We prefer developers with
strong balance sheets and those with balanced exposure to the property
sector, which should buttress earnings and performance in a year of fairly
high uncertainty for residential property. Keeping these factors in mind,
UOL is our top pick for the property sector in 2011. Maintain BUY with
unchanged S$5.42 fair value estimate, at a 10% discount to RNAV.
UOB: Upgrade to BUY
UOB has been a consistent performer even during the recent 2008 financial
crisis, reflecting its prudent risk taking policy and its good asset quality.
However, the stock was dragged down by weak sentiment and has
underperformed both the STI and the FTSE Financial Index. We view this
discount as not sustainable as UOB is still delivering good profits (+44%
to S$1990m for the 9-month ended Sep 2010 and with good cost control
translating into a sub-40% cost-to-income ratio of 38.7%). UOB's Net Interest
Margin (NIM) is likely to trend down reflecting the current low interest rate
environment and the recent property cooling measures. However, we expect
a 9.5% increase in Non-interest Income in FY11 to buoy earnings for FY11.
At current level, valuations are looking more attractive and yield is at a
decent 3.3%. We are upgrading UOB to BUY.

8/7/2019 OCBC - S'pore Strategy-20101215
http://slidepdf.com/reader/full/ocbc-spore-strategy-20101215 47/82
Page 47 15 December 2010
Strategy Update
Venture Corp: Transforming into a solutions provider
Venture Corp (VMS) says it remains driven to achieving profitable growth,
where it will continue to make a push for higher-margin ODM (Original Design
Manufacturer) business; This as part of a revamp to reduce its traditional
heavy reliance on the Printing & Imaging OEM business. It also intends to
build up its solutions/enterprise segment with its own IPs (Intellectual
Properties). Besides being encouraged by the group's business
transformation into an ODM player, which we believe should herald a new
era for the group, we also have confidence in its ability to execute and
deliver on its "blue ocean strategy". As we are rolling forward our 15x
valuation from blended FY10F/FY11F EPS to FY11F EPS, our fair value
increases from S$10.73 to S$12.10. Maintain BUY. Key risks include
currency fluctuations (exposure to US$) and continued component shortages.

8/7/2019 OCBC - S'pore Strategy-20101215
http://slidepdf.com/reader/full/ocbc-spore-strategy-20101215 48/82
Page 48 15 December 2010
Strategy Update
Big is beautiful
Big is beautiful. With the acquisition of 28 properties from
its sponsor, The Ascott Limited (TAL), Ascott Residence Trust(ART) will transform from a Pan-Asian to an International REIT,doubling its total asset size to almost S$2.85b. It will alsomove from 12th to the 6th largest S-REIT in terms of totalasset value. Its enlarged portfolio now constitutes 55% Pan-Asian and 45% European assets. This coupled with theenlarged free-float post-EFR (equity fund raising), ART has
not only improved its diversification geographically but alsomake its shares available to a wider pool of internationalinvestors. In addition, most of the European acquisitions areon master leases which offer less cash flows volatility to theREIT. The ensuing income stability helps to improvemanagement's debt capacity.
Good divestment and renewal strategy. We also like ART'sstance towards divestment of assets that have reached theoptimal stage of its life cycle (Ascott Beijing, Country WoodsJakarta etc.) and use these proceeds to fund furtheracquisitions or repay debt. We view ART's massive scale-uppositively, but have some lingering concerns over its existing
foreign-exchange management given the forthcoming influx ofEuropean currencies into the portfolio. Without an ongoingactive currency-hedging strategy, ART may be vulnerable tothe long-standing contest between the East-West currenciespairs, especially with the ongoing monetization of debt by theUS, the debt-crisis and fiscal-austerity measures in Europeand the push for Renminbi appreciation in Asia.
Portfolio Performance. ART's RevPAU increased 7% YoYin 3Q10, mainly led by RevPAU growth of 37% in Singapore.The better performance in Singapore is mainly due to thesuccessful launch of the refurbished apartment units ofSomerset Grand Cairnhill and Somerset Liang Court. RevPAUfor Australia, China, Indonesia and The Philippines also
increased in 3Q10. We are also seeing better performance inShanghai arising from World Expo. However, Tianjin'sperformance declined due to increased competition andreduction in corporate accommodation budget. Japan is alsofacing weak market demand and lower profits due to higherrepair, maintenance and advertising expenses.
Maintain BUY. Our investment thesis on ART is intact andwe look forward to the performance results and revenuecontribution of the 28 newly acquired properties in 4Q10.Management has also stated its confidence in delivering theforecasted 4Q DPU of 1.84 S cents as disclosed in the Offer-Information-Statement (13-Sep). Maintain BUY with an
unchanged fair-value of S$1.38.
Ascott Residence Trust15 December 2010
Maintain
BUYPrevious Rating: BUY
Closing price (10 Dec): S$1.22Fair Value : S$1.38
Reuters Code ASRT.SI
ISIN Code A68U
Bloomberg Code ART SP
Issued Capital (m) 1,108
Mkt Cap (S$m/US$m) 1,352 /975
Major Shareholders
CapitaLand 47.5%
Free Float (%) 52.5%
Daily Vol 3-mth (‘000) 2,751
52 Wk Range 0.987 - 1.377
Ong Kian Lin(65) 6531 9810e-mail: [email protected]
1000
1500
2000
2500
3000
3500
4000
J a n - 0 8
M a y - 0 8
S e p - 0 8
J a n - 0 9
M a y - 0 9
S e p - 0 9
J a n - 1 0
M a y - 1 0
S e p - 1 0
0.2
0.4
0.6
0.8
1.0
1.2
1.4
1.6
Ascott
Residence
Trust
STI
(S$ m) FY08 FY09 FY10F FY11F
Revenue 192.4 175.5 205.4 295.1
Gross profit 95.5 84.6 94.7 156.1
Distr income 53.7 45.2 54.1 80.1
DPU yield (%) 7.2 6.0 5.9 5.9
P/NAV (x) 0.8 0.9 0.9 0.9

8/7/2019 OCBC - S'pore Strategy-20101215
http://slidepdf.com/reader/full/ocbc-spore-strategy-20101215 49/82
Page 49 15 December 2010
Strategy Update
Ascott Residence Trust's Key Financial Data
EARNINGS FORECAST BALANCE SHEET
Year Ended 31 Dec (S$m) FY08 FY09 FY10F FY11F As at 31 Dec (S$m) FY08 FY09 FY10F FY11F
Revenue 192.4 175.5 205.4 295.1 Investment properties 1565.3 1528.3 2607.9 2653.0
Direct expenses -96.9 -91.0 -110.7 -139.0 Cash 56.1 63.2 61.4 57.0
Gross profit 95.5 84.6 94.7 156.1 Other current assets 32.1 28.1 28.3 34.3
Finance costs -20.8 -23.7 -23.8 -41.1 Total assets 1687.6 1652.0 2736.1 2782.7
Manager's management fees -8.1 -7.5 -8.5 -12.4 Current liabilities ex debt 79.0 77.9 90.5 91.7
Net profit bef. unrealized gains 64.3 51.5 59.3 101.4 Debt 624.4 651.1 1116.0 1142.6
Change in property values -94.0 -49.4 35.5 0.0 Total liabilities 722.6 755.2 1220.1 1247.8
Total return after tax -37.9 -15.5 76.5 90.8 Minority interests 65.9 71.7 72.5 80.9
Return attributable to unitholders -42.2 -21.1 68.5 80.1 Unitholders' funds 899.0 825.1 1443.5 1454.0
Total distributable amount 53.7 45.2 54.1 80.1 Total equity and liabilities 1687.6 1652.0 2736.1 2782.7
CASH FLOW
Year Ended 31 Dec (S$m) FY08 FY09 FY10F FY11F KEY RATES & RATIOS FY08 FY09 FY10F FY11F
Operating cash flows 70.4 74.8 89.6 142.9 Units outstanding 610.8 617.2 1107.1 1112.2
Acquisitions -30.7 -21.8 -1239.3 0.0 DPU (S cents) 8.8 7.3 7.2 7.2
Investing cash flows -42.5 -30.6 -982.2 -50.2 CFPS (S cents) 11.5 12.1 10.5 12.8
Distributions to unitholders -52.4 -48.0 -45.1 -77.2 NAV (S$) 1.5 1.3 1.3 1.3
Interest paid -19.6 -24.6 -25.6 -41.1 DPU yield (%) 7.2 6.0 5.9 5.9
Financing cash flows -39.6 -36.8 891.2 -97.2 P/CF (x) 10.6 10.1 11.7 9.5Net change in cash -11.7 7.3 -1.4 -4.5 P/NAV (x) 0.8 0.9 0.9 0.9
Cash at beg of period 64.5 56.1 63.2 61.4 Gross profit margin (%) 49.6 48.2 46.1 52.9
Translation effects 3.3 -0.2 -0.4 0.0 Distr to revenue (%) 27.9 25.8 26.4 27.1
Cash at end of period 56.1 63.2 61.4 57.0 Total debt/Total assets (x) 0.4 0.4 0.4 0.4
Source: Company data, OIR estimates

8/7/2019 OCBC - S'pore Strategy-20101215
http://slidepdf.com/reader/full/ocbc-spore-strategy-20101215 50/82
Page 50 15 December 2010
Strategy Update
Biosensors Int’l Group
15 December 2010
Closing price (10 Dec): S$1.20Fair Value : S$1.35
Reuters Code BIOS.SI
ISIN Code B20
Bloomberg Code BIG SP
Issued Capital (m) 1,095
Mkt Cap (S$m / US$m) 1,315 / 948
Major Shareholders
Autumn Eagle Ltd 29.5%
Free Float (%) 45.2%
Daily Vol 3-mth (‘000) 18,588
52 Wk Range 0.690 - 1.260
Growth momentum expected to continue
Outlook looks bright. Biosensors International Group (BIG)has shown that it has put its past losses behind it and looksset to continue its turnaround story moving forward. It hasdemonstrated its resilience by making headway in the drug-eluting stent (DES) market despite increasing competitiveness.BIG's DES market share in addressable markets stands atclose to 15% and this has exceeded its 10% target. As a
recap, BIG reported a good set of 2Q11 results recently, whererevenue grew 33.9% YoY to US$36.5m, whereas net profitincreased 31.6% to US$8.5m. This was due largely to itsBioMatrix DES, which engages cutting-edge technology.Traditionally, BIG's product revenues for 2H have been stronger(Exhibit 1) and we do not expect FY11 to be any different.This is due to the recent Transcatheter CardiovascularTherapeutics (TCT) 2010 Conference which allowed BIG toshowcase its positive clinical trial results. Hence it has helpedto increase awareness on the safety and efficacy of BIG'sDES products to physicians. We expect BIG's strong growthmomentum to continue, driven largely by increased sales ofBioMatrix DES as well as higher licensing revenues fromTerumo Corp.
Enlarged portfolio necessary for growth. BIG hashighlighted that it will enlarge its product portfolio and we aresanguine about the increased capabilities that could possiblyarise. Part of this has come from inorganic growth, with theacquisitions of CardioMind and Devax recently. CardioMindhas led to the introduction of the Sparrow DES, which couldpossibly address neurological and peripheral parts of the bodyin the future. The Devax AXXESS stent is a specialty bifurcatedDES and the technology transfer is already taking place.Internally, BioFreedom represents BIG's next generation DESand initial First-In-Man trial results have been positive. Currentdiscussions are ongoing with regulatory bodies on developing
the protocol of a global study. The greatest strength ofBioFreedom, in our opinion, is its prevention of the use of dualanti-platelet therapy, which carries bleeding implications.
Maintain BUY. Since we resumed coverage on BIG on 15Oct 10, its share price has risen 15.4%. We believe there isstill potential for further upside and continue to like BIG for itstechnological superiority to its peers and executioncapabilities. Hence we reiterate our BUY rating and DCF-basedfair value estimate of S$1.35. Key risks include the roll-out ofdisruptive innovative products by competitors; failure to gainlicense approval in key markets; and clinical trial results thatturn out to be unsatisfactory.
Wong Teck Ching (Andy)(65) 6531 9817e-mail: [email protected]
Maintain
BUYPrevious Rating: BUY
10001500
2000
2500
3000
3500
4000
J a n - 0 8
A p r - 0 8
J u l - 0 8
O c t - 0 8
J a n - 0 9
A p r - 0 9
J u l - 0 9
O c t - 0 9
J a n - 1 0
A p r - 1 0
J u l - 1 0
O c t - 1 0
0.2
0.4
0.6
0.8
1.0
1.2
Biosensors
STI
(US$ m) FY09 FY10 FY11F FY12F
Revenue 119.0 116.2 158.2 210.6
EBIT 16.2 22.0 40.1 55.8
P/NTA (x) 10.0 7.0 5.5 3.9
EPS (cts) -0.1 3.0 3.7 6.4
PER (x) n.m. 28.7 23.3 13.6

8/7/2019 OCBC - S'pore Strategy-20101215
http://slidepdf.com/reader/full/ocbc-spore-strategy-20101215 51/82
Page 51 15 December 2010
Strategy Update
Biosensors International Group's Key Financial Data
EARNINGS FORECAST BALANCE SHEET
Year Ended 31 Mar (US$m) FY09 FY10 FY11F FY12F As at 31 Mar (US$m) FY09 FY10 FY11F FY12F
Revenue 119.0 116.2 158.2 210.6 Bank and cash balances 60.1 60.1 75.3 105.0
EBITDA 19.1 24.6 42.9 58.5 Other current assets 37.7 51.1 59.8 77.8
Depreciation and amortisation 2.9 2.7 2.8 2.7 Property, plant, and equipment 9.9 9.7 9.5 9.3
EBIT 16.2 22.0 40.1 55.8 Total assets 198.5 227.8 272.2 345.8
Net interests -2.8 -3.8 -4.7 -4.8 Debt 46.8 29.1 31.3 33.4
Share of results of JVs, net 7.3 14.9 20.7 26.2 Current liabilities excluding debt 45.4 51.0 53.3 56.4
Profit before tax 8.9 33.7 46.7 77.2 Total liabilities 94.6 83.1 87.6 92.7
Income tax expense -10.0 -1.6 -6.7 -8.7 Shareholders equity 103.9 144.7 184.6 253.1
Minority interests 0.0 0.0 0.0 0.0 Minority interests 0.0 0.0 0.0 0.0
Profit attributable to shareholders -1.1 32.1 40.0 68.5 Total equity and liabilities 198.5 227.8 272.2 345.8
CASH FLOW
Year Ended 31 Mar (US$m) FY09 FY10 FY11F FY12F KEY RATES & RATIOS FY09 FY10 FY11F FY12F
Op profit before working cap. chg. 29.0 34.9 33.5 58.5 EPS (US cents) -0.1 3.0 3.7 6.4
Working cap, taxes and int -18.0 -22.1 -18.0 -28.4 NTA per share (US cents) 8.7 12.3 15.9 22.2
Net cash from operations 11.0 12.8 15.6 30.1 EBIT margin (%) 13.6 18.9 25.4 26.5
Purchase of PP&E -5.1 -2.1 -2.5 -2.5 Net profit margin (%) -0.9 27.6 25.3 32.5
Other investing flows -0.4 0.0 0.0 0.0 PER (x) n.m. 28.7 23.3 13.6
Investing cash flow -5.5 -2.2 -2.5 -2.5 Price/NTA (x) 10.0 7.0 5.5 3.9
Financing cash flow 0.3 -10.7 2.2 2.1 EV/EBITDA (x) 48.3 36.8 20.8 14.8
Net cash flow 5.8 0.0 15.2 29.6 Dividend yield (%) 0.0 0.0 0.0 0.0
Cash at beginning of year 54.3 60.1 60.1 75.3 ROE (%) -1.1 25.8 24.3 31.3
Cash at end of year 60.1 60.1 75.3 105.0 Net gearing (%) net cash net cash net cash net cash
Source: Company data, OIR estimates

8/7/2019 OCBC - S'pore Strategy-20101215
http://slidepdf.com/reader/full/ocbc-spore-strategy-20101215 52/82
Page 52 15 December 2010
Strategy Update
Valuation seems attractive
CapitaLand Limited15 December 2010
Reuters Code CATL.SI
ISIN Code C31
Bloomberg Code CAPL SP
Issued Capital (m) 4,262
Mkt Cap (S$m/US$m) 15,643 / 11,279
Major Shareholders
Temasek 39.7%
Free Float (%) 52.2%
Daily Vol 3-mth (‘000) 15,148
52 Wk Range 3.460 - 4.383
Meenal Kumar(65) 6531 9112e-mail: [email protected]
New launch in Singapore. CapitaLand (CapLand) launched
the 1715-unit d'Leedon (formerly Farrer Court ) at Farrer Road
late last month. The 99-year leasehold project is being
developed by a CapLand-led consortium. As of 06 Dec, some
82% of the 250 units released for the initial launch have been
sold at an average S$1680 per square foot (Channel News
Asia). Of these ~205 units, 52 units were purchased by former
Farrer Court owners. Meanwhile, CapLand said at 3Q10 results
that 55-unit The Nassim should be launch-ready by 4Q.
Sells Adelphi units. CapLand announced earlier this month
that it will sell 163 units at The Adelphi , consisting of 86 office
units and 77 retail units, for a total S$218.1m. It expects to
earn an after-tax profit of about S$15.7m on the transaction,
which is expected to be completed by 28 Jan 2011. CapLand
said the sale was in line with its "strategy to unlock the value
of non-core assets and recycle assets". Other recent capital
recycling initiatives include the planned divestment of 28
serviced residence properties to its 47.74%-owned hospitality
REIT. CapLand noted at 3Q10 results that it plans "to maintain
significant financial flexibility to protect the downside, yet takeadvantage of any relevant opportunities that may arise." It had
a net gearing of 0.21x debt-to-equity as of 30 Sep.
More policy measures likely. We note that the property
market has continued to perform well even after the Aug 30
property measures. With sustained conditions of high liquidity
and cheap debt, we believe it is very likely that policymakers
will implement further measures in 1H2011. We believe that
the issues of changed buyer risk appetite (hinged on cheap
debt) and housing affordability, and their impact on mass-
market households, are likely to be the central concern for
policymakers. Further policy measures could potentially impact
prices and volumes of property transactions (particularly forthe mass-market segment). We also note that while the high-
end segment still has room to move upwards, this segment is
also more vulnerable to external shocks.
Valuation seems attractive. We prefer developers with strong
balance sheets and those with balanced exposure to the
property sector, which should buttress earnings and
performance in a year of fairly high uncertainty for residential
property. While UOL Group is our top pick for the sector, we
think CapLand's valuations are attractive at the current price
level. We maintain our BUY call on the stock with an unchanged
S$4.54 fair value estimate, at parity to RNAV.
Maintain
BUYPrevious Rating: BUY
Closing price (10 Dec): S$3.67Fair Value : S$4.54
1000
1500
2000
2500
3000
3500
4000
J a n - 0 8
M a y - 0 8
S e p - 0 8
J a n - 0 9
M a y - 0 9
S e p - 0 9
J a n - 1 0
M a y - 1 0
S e p - 1 0
1.0
2.0
3.0
4.0
5.0
6.0
CapitaLand
STI
(S$m) FY08 FY09 FY10F FY11F
Revenue 2,752.3 2,957.4 3,129.0 3,306.5
Shareholders' profit 1,260.1 1,053.0 1,175.8 699.1
NAV per share (S-cents) 378.3 315.6 329.0 335.1P/NAV (x) 1.3 1.2 1.1 1.1
PER (x) 10.9 14.0 13.3 22.3

8/7/2019 OCBC - S'pore Strategy-20101215
http://slidepdf.com/reader/full/ocbc-spore-strategy-20101215 53/82
Page 53 15 December 2010
Strategy Update
CapitaLand's Key Financial Data
EARNINGS FORECAST BALANCE SHEET
Year Ended 31 Dec (S$m) FY08 FY09 FY10F FY11F As at 31 Dec (S$m) FY08 FY09 FY10F FY11F
Revenue 2,752.3 2,957.4 3,129.0 3,306.5 Cash 4,228.4 8,729.7 5,278.0 5,426.8
Cost of sales -1,680.2 -1,931.2 -1,774.7 -2,087.0 Development properties for sale 3,347.2 3,590.2 3,949.3 3,751.8
Gross profit 1,072.2 1,026.2 1,354.3 1,219.5 Investment properties 4,254.8 4,406.2 4,626.5 4,857.8
Other operating income 1,330.7 1,238.4 571.6 130.1 Interests in assoc & JV 7,864.6 8,684.2 9,118.4 9,574.4
Profit from operations 1,838.4 1,279.8 1,447.9 842.6 Total assets 25,083.6 30,166.0 31,831.6 32,923.7
Finance costs -516.3 -453.9 -450.0 -480.0 Borrowings 9,789.9 10,275.0 10,186.1 10,864.8
Share of results of assoc & JV 375.1 269.2 375.1 497.9 Total liabilities 13,095.8 13,286.3 14,326.0 15,081.3
Profit before taxation 1,697.2 1,095.1 1,373.0 860.6 Shareholders' equity 10,681.7 13,408.3 13,974.1 14,235.5
Profit after taxation 1,461.4 1,008.6 1,235.7 774.5 Total equity 11,987.8 16,879.8 17,505.6 17,842.4
Profit attributable to shareholders 1,260.1 1,053.0 1,175.8 699.1 Total equity and liabilities 25,083.6 30,166.0 31,831.6 32,923.7
CASH FLOW
Year Ended 31 Dec (S$m) FY08 FY09 FY10F FY11F KEY RATES & RATIOS FY08 FY09 FY10F FY11F
Op profit before working cap.chges 909.0 1,011.1 1,334.2 840.6 EPS (S-cents) 44.7 26.2 27.7 16.5
Working cap, taxes and int 261.0 -135.1 -1,373.3 -113.6 NAV per share (S-cents) 378.3 315.6 329.0 335.1
Net cash from operations 1,170.0 876.1 -39.1 727.1 PER (x) 10.9 14.0 13.3 22.3
Acquisition of properties -1,366.8 -269.8 -400.0 -400.0 P/NAV (x) 1.3 1.2 1.1 1.1
Other investing flows 430.4 2,650.6 -2,038.6 -543.9 Gross profit margin (%) 39.0 34.7 43.3 36.9
Investing cash flow -936.4 2,380.7 -2,438.6 -943.9 Net profit margin (%) 53.1 34.1 39.5 23.4
Financing cash flow -387.5 1,272.3 -922.7 365.7 Net gearing (x) 0.5 0.1 0.3 0.3
Net cash flow -127.6 4,501.3 -3,451.8 148.8 Dividend yield (%) 1.4 2.9 1.5 1.5
Cash at beginning of year 4,356.0 4,228.4 8,729.7 5,278.0 ROE (%) 12.2 6.0 7.1 4.3
Cash at end of year 4,228.4 8,729.7 5,278.0 5,426.8 ROA (%) 5.8 3.3 3.9 2.4
Source: Company data, OIR estimates
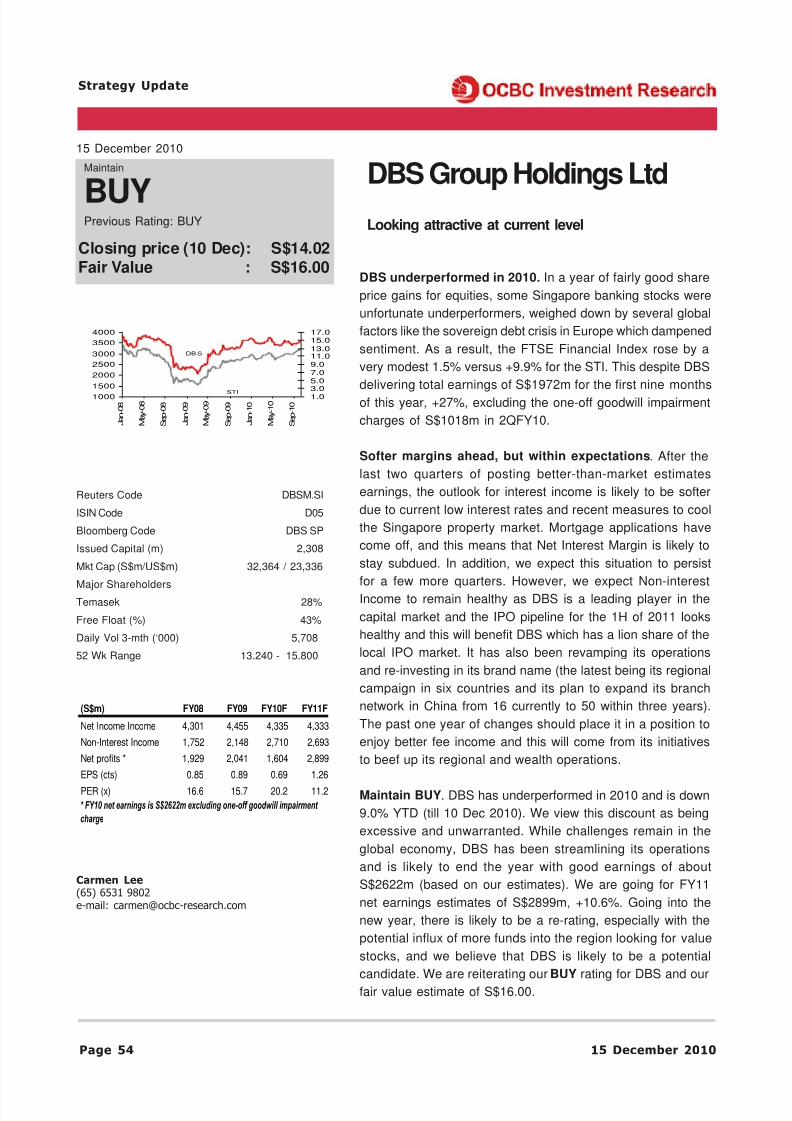
8/7/2019 OCBC - S'pore Strategy-20101215
http://slidepdf.com/reader/full/ocbc-spore-strategy-20101215 54/82
Page 54 15 December 2010
Strategy Update
DBS underperformed in 2010. In a year of fairly good share
price gains for equities, some Singapore banking stocks were
unfortunate underperformers, weighed down by several global
factors like the sovereign debt crisis in Europe which dampened
sentiment. As a result, the FTSE Financial Index rose by a
very modest 1.5% versus +9.9% for the STI. This despite DBS
delivering total earnings of S$1972m for the first nine months
of this year, +27%, excluding the one-off goodwill impairment
charges of S$1018m in 2QFY10.
Softer margins ahead, but within expectations. After the
last two quarters of posting better-than-market estimates
earnings, the outlook for interest income is likely to be softer
due to current low interest rates and recent measures to cool
the Singapore property market. Mortgage applications have
come off, and this means that Net Interest Margin is likely to
stay subdued. In addition, we expect this situation to persist
for a few more quarters. However, we expect Non-interest
Income to remain healthy as DBS is a leading player in the
capital market and the IPO pipeline for the 1H of 2011 looks
healthy and this will benefit DBS which has a lion share of the
local IPO market. It has also been revamping its operations
and re-investing in its brand name (the latest being its regional
campaign in six countries and its plan to expand its branch
network in China from 16 currently to 50 within three years).
The past one year of changes should place it in a position to
enjoy better fee income and this will come from its initiatives
to beef up its regional and wealth operations.
Maintain BUY. DBS has underperformed in 2010 and is down
9.0% YTD (till 10 Dec 2010). We view this discount as being
excessive and unwarranted. While challenges remain in the
global economy, DBS has been streamlining its operations
and is likely to end the year with good earnings of about
S$2622m (based on our estimates). We are going for FY11
net earnings estimates of S$2899m, +10.6%. Going into the
new year, there is likely to be a re-rating, especially with the
potential influx of more funds into the region looking for value
stocks, and we believe that DBS is likely to be a potential
candidate. We are reiterating our BUY rating for DBS and our
fair value estimate of S$16.00.
Looking attractive at current level
DBS Group Holdings Ltd15 December 2010
Maintain
BUYPrevious Rating: BUY
Closing price (10 Dec): S$14.02Fair Value : S$16.00
Reuters Code DBSM.SI
ISIN Code D05
Bloomberg Code DBS SP
Issued Capital (m) 2,308
Mkt Cap (S$m/US$m) 32,364 / 23,336
Major ShareholdersTemasek 28%
Free Float (%) 43%
Daily Vol 3-mth (‘000) 5,708
52 Wk Range 13.240 - 15.800
Carmen Lee(65) 6531 9802e-mail: [email protected]
1000
1500
2000
2500
3000
3500
4000
J a n - 0 8
M a y - 0 8
S e p - 0 8
J a n - 0 9
M a y - 0 9
S e p - 0 9
J a n - 1 0
M a y - 1 0
S e p - 1 0
1.03.05.07.09.011.013.015.017.0
DB S
STI
(S$m) FY08 FY09 FY10F FY11F
Net Income Income 4,301 4,455 4,335 4,333
Non-Interest Income 1,752 2,148 2,710 2,693
Net profits * 1,929 2,041 1,604 2,899
EPS (cts) 0.85 0.89 0.69 1.26
PER (x) 16.6 15.7 20.2 11.2
* FY10 net earnings is S$2622m excluding one-off goodwill impairment
charge

8/7/2019 OCBC - S'pore Strategy-20101215
http://slidepdf.com/reader/full/ocbc-spore-strategy-20101215 55/82
Page 55 15 December 2010
Strategy Update
DBS' Key Financial Data
EARNINGS FORECASTYear Ended 31 Dec (S$m) FY08 FY09 FY10F FY11F BALANCE SHEETAs at 31 Dec (S$m) FY08 FY09 FY10F FY11F
Interest Income 8,122 6,114 5,725 5,854 Share capital 4,215 8,435 8,775 8,775
Interest Expense 3,821 1,659 1,390 1,521 Revenue & other reserves 19,788 21,064 23,980 26,126
Net Interest Income 4,301 4,455 4,335 4,333 Shareholders' fund 24,003 29,499 32,755 34,901
Fee & commision income 1,274 1,394 1,365 1,451 Deposits and other accounts 163,359 178,448 184,694 188,388
Non-Interest Income 1,752 2,148 2,710 2,693 Other liabilities 60,335 41,589 47,079 46,321
Total Income 6,053 6,603 7,045 7,026 Total liabilities 232,715 229,145 251,389 255,109
Staff and operating expenses -2655 -2604 -2877 -2949 Cash and balances 15,790 22,515 23,924 22,440
Impairment charges -888 -1552 -915 -433 Loans & advances 125,841 129,973 147,139 153,025
Pretax profit 2,585 2,513 2,333 3,723 Other assets 79,823 67,993 75,738 75,980
Reported net profit 1,929 2,041 1,604 2,899 Total assets 256,718 258,644 284,144 290,010
CASH FLOW
Year Ended 31 Dec (S$m)FY08 FY09 FY10F FY11F KEY RATES & RATIOS FY08 FY09 FY10F FY11F
Pretax profits 2,139 2,228 2,333 3,723 EPS (S cents) 0.85 0.89 0.69 1.26
Depreciation 149 195 195 195 NAV per share (S cents) 10.25 10.85 11.55 12.34
Others 865 1504 2015 553 Net interest income growth (%) 4.7 3.6 -2.7 -0.1
Changes in working capital -8615 1163 4062 -2018 Non-interest income growth (%) -14.7 22.6 26.2 -0.6
Net cash from operating activities -5462 5090 8605 2453 Interest Inc / Total Inc (%) 71.1 67.5 61.5 61.7
Net cash in investing activities 2174 -81 15 13 Cost-to-income (%) 43.9 39.4 40.8 42.0Cash flow from financing activities 64 1557 -2171 -1492 PER (x) 16.6 15.7 20.2 11.2
Change in cash -3275 6603 6449 974 Price/NAV (x) 1.4 1.3 1.2 1.1
Beg cash 15,953 12,678 19,281 25,730 Dividend yield (%) 4.6 4.0 4.0 4.0
Cash at end of year 12,678 19,281 25,730 26,703 ROE (%) 9.6 9.0 6.0 10.1
Source: Company data, OIR estimates
* FY10 net earnings is S$2622m excluding one-off goodwill impairment charge

8/7/2019 OCBC - S'pore Strategy-20101215
http://slidepdf.com/reader/full/ocbc-spore-strategy-20101215 56/82
Page 56 15 December 2010
Strategy Update
Focusing on the integration of AMC
Ezra Holdings Ltd15 December 2010
Maintain
BUYPrevious Rating: BUY
Closing price (10 Dec): S$1.66Fair Value : S$2.27
Reuters Code EZRA.SI
ISIN Code 5DN
Bloomberg Code EZRA SP
Issued Capital (m) 795
Mkt Cap (S$m/US$m) 1,320 / 952
Major Shareholders
Lionel Lee 23.1%
Free Float (%) 62.8%
Daily Vol 3-mth (‘000) 5,933
52 Wk Range 1.504 - 2.487
Low Pei Han(65) 6531 9813e-mail: [email protected]
Demand for specialised vessels to hold up. From our talks
with industry players, demand for specialised construction
vessels such as multi-purpose support vessels and high-spec
pipelay barges in the region continues to be strong. We are
positive on the outlook of the marine construction market. In
particular, there should be long-term growth in the demand for
subsea construction vessels, driven by the push for more
pipeline and subsea equipment installation projects as well
as maintenance of present infrastructure. All of this means
more work for Ezra's specialised vessels in the long term.
AHTS charter rates to remain pressured. Consistent with
our expectations, AHTS charter rates have been facing
downward pressure for the most of this year as newbuilds
continue to be delivered. It is encouraging, however, that Ezra
recently announced that it had secured letters of intent/award
for about US$51m worth of new contracts which will charter
five AHTS vessels and a PSV; the average period for the
charters exceeds two years. We note that more than 75% of
Ezra's vessels is deepwater capable and the fleet is youngwith an average age of about three years. Most are also locked
into long-term contracts, hence we are not expecting a
significant decline in rates for the group's vessels. Meanwhile,
Ezra will also add four high-end multi-purpose PSVs to its
fleet in light of the positive outlook for the sector.
AMC acquisition to propel group, but need time for
results. The proposed acquisition of Aker Marine Contractors
(AMC) will allow Ezra to provide more comprehensive
Engineering, Procurement, Installation and Construction
(EPIC) and Subsea, Umbilicals, Risers and Flowlines (SURF)
solutions, and the group will be able to bid for larger and morecomplex subsea projects. There is also little overlap of existing
operations and the combined entity will have an enlarged
customer base. However, Ezra has to integrate AMC (which
saw negative EBITDA from Sep 2009 to Aug 2010), and we
estimate this process may take at least half a year. We
understand that AMC is bidding for about US$1.5b worth of
work in the Gulf of Mexico and the North Sea, and the clinching
of deals should improve the performance of the group
subsequently, but it is unclear when this will take place.
However, we remain positive about the group's execution and
long-term growth strategy. We maintain our BUY rating and
S$2.27 fair value estimate.
1000
1500
2000
2500
3000
3500
4000
J a n - 0 8
M a y - 0 8
S e p - 0 8
J a n - 0 9
M a y - 0 9
S e p - 0 9
J a n - 1 0
M a y - 1 0
S e p - 1 0
0.1
0.6
1.1
1.6
2.1
2.6
3.1
3.6
Ezra
STI
(US$ m) FY09 FY10 FY11F FY12F
Revenue 329.4 353.6 473.4 569.7
EBIT 63.0 78.1 102.0 117.9P/NTA (x) 1.4 1.6 1.5 1.3
EPS (cts) 11.7 9.6 12.2 13.2
PER (x) 10.1 13.2 10.4 9.6

8/7/2019 OCBC - S'pore Strategy-20101215
http://slidepdf.com/reader/full/ocbc-spore-strategy-20101215 57/82
Page 57 15 December 2010
Strategy Update
Ezra's Key Financial Data
EARNINGS FORECAST BALANCE SHEET
Year Ended 31 Aug (US$m) FY09 FY10 FY11F FY12F As at 31 Aug (US$m) FY09 FY10 FY11F FY12F
Revenue 329.4 353.6 473.4 569.7 Cash and cash equivalents 161.3 187.3 159.5 127.9
Gross profit 101.2 103.8 145.3 170.9 Other current assets 238.6 328.4 334.9 394.5
Other income -6.2 23.6 4.0 4.0 Fixed assets 298.9 611.5 634.0 693.6
Admin expenses -32.0 -49.3 -47.3 -57.0 Other long term assets 252.9 302.9 311.4 320.7
Operating profit 63.0 78.1 102.0 117.9 Total assets 951.8 1,430.1 1,439.7 1,536.8
Operating profit (ex-EI) 73.7 56.9 102.0 117.9 Debt 309.0 548.0 548.0 548.0
EBIT 63.0 78.1 102.0 117.9 Total liabilities 417.7 836.7 769.2 793.3
Profit before tax 79.2 78.9 110.3 119.0 Shareholders equity 534.1 592.9 670.1 743.0
Profit for the year 70.1 75.9 97.0 104.7 Total equity 534.1 593.4 670.5 743.5
Profit attributable to shareholders 70.1 76.1 97.0 104.7 Total equity and liabilities 951.8 1,430.1 1,439.7 1,536.8
CASH FLOW
Year Ended 31 Aug (US$m) FY09 FY10 FY11F FY12F KEY RATES & RATIOS FY09 FY10 FY11F FY12F
Op profit before working cap. chang 81.7 77.4 116.9 135.3 EPS (US cents) 11.7 9.6 12.2 13.2
Working cap, taxes and int -108.0 -26.9 -35.8 -67.0 NTA per share (US cents) 86.1 72.0 81.7 90.9
Net cash from operations -26.2 50.4 81.1 68.3 Net profit margin (%) 21.3 21.5 20.5 18.4
Purchase of PP&E -176.7 -295.3 -100.0 -80.0 PER (x) 10.1 13.2 10.4 9.6
Investing cash flow -135.8 -359.1 -100.0 -80.0 Price/NTA (x) 1.4 1.6 1.5 1.3
Financing cash flow 177.0 338.3 -11.9 -19.9 Price/Book (x) 1.3 1.6 1.4 1.3
Net cash flow 15.1 29.6 -30.8 -31.6 Dividend yield (%) 0.9 0.9 1.5 2.4Cash at beginning of year 153.1 161.3 190.4 159.5 ROE (%) 13.1 12.8 14.5 14.1
FDs and cash pledged -6.7 -3.0 0.0 0.0 ROA (%) 7.4 5.3 6.7 6.8
Cash at end of year 161.3 187.3 159.5 127.9 Net gearing (%) 27.6 60.8 58.0 56.5
Source: Company data, OIR estimates

8/7/2019 OCBC - S'pore Strategy-20101215
http://slidepdf.com/reader/full/ocbc-spore-strategy-20101215 58/82
Page 58 15 December 2010
Strategy Update
Bountiful 4Q10 Likely
Genting Singapore15 December 2010
Closing price (10 Dec): S$2.17Fair Value : S$2.53
Carey Wong(65) 6531 9808e-mail: [email protected]
Reuters Code GNTG.SI
ISIN Code G13
Bloomberg Code GENS SP
Issued Capital (m) 12,180
Mkt Cap (S$m / US$m) 26,431 / 19,058Major Shareholders
Genting Berhad 51.7%
Free Float (%) 48.3%
Daily Vol 3-mth (‘000) 141,785
52 Wk Range 0.835 - 2.350
Maintain
BUYPrevious Rating: BUY
1000
1500
2000
2500
3000
3500
M a y - 0 8
A u g - 0 8
N o v - 0 8
F e b - 0 9
M a y - 0 9
A u g - 0 9
N o v - 0 9
F e b - 1 0
M a y - 1 0
A u g - 1 0 0.2
0.7
1.2
1.7
2.2
Genting
Spore
STI
(S$ m) FY08 FY09 FY10F FY11F
Revenue 630.7 491.2 2830.6 4547.2
EBITDA 26.7 -52.3 1288.2 2103.4P/NTA (x) 12.3 5.1 5.1 3.8
EPS (cts) -1.3 -2.9 8.9 15.7
PER (x) na na 24.5 13.8
Bountiful 4Q10 likely. Genting Singapore (GS) is likely to
perform well in the final quarter of 2010, the traditional holiday
period. According to management, RWS has the correct
offering to do well, given that it is pitched towards the family
and vacation crowd. As such, it expects the fourth quarter to
perform better than the third, which was also affected by the
"Ghost Month", making it "inauspicious" for some to visit the
casino. Nevertheless, management was also pleased with its
3Q10 showing, noting that its hotel occupancy was 71% withan average room rate of S$250, as it continued to receive
some 3m visitors to the integrated resort (IR). It adds that
Universal Studios Singapore (USS) has also turned cash
positive, and will gradually increase the current daily capacity
from 8k visitors to 18k by next year. GS acknowledged that
the visitors so far were "low-hanging" fruits plucked from areas
around the region; but with its enlarged marketing program,
management is confident that it can attract visitors from further
afield.
Junkets possible from early 2011. And also likely to boost
gaming revenue for GS in the coming years, news that theCasino Regulatory Authority (CRA) has received licence
applications from junket operators endorsed by Resorts World
Sentosa (RWS), where industry watchers believe that some
of these operators could get their licences by early next year.
During the recent 3Q10 briefing, management concurs with
market watchers that these licenses could be issued in early
2011. Junkets typically have their own base of "high rollers"
and continuously source for more of these players; they also
provide credit facilities for their clients, which help to reduce
the credit risk of the casinos; although casinos typically have
to pay them commission, which is then shared with their
clients. As before, we estimate that the Singapore gaming
market should stabilize around S$7b in 2011, with RWS
maintaining a slightly more dominant share of around 55%.
Depending on how many licenses are subsequently issued,
we do see room to revise up our gaming market estimates.
Maintain BUY with S$2.53 fair value. Last but not least,
we understand that management is keen to look at developed
countries - namely Japan, Taiwan or Korea - for overseas
expansion; but how far it can get into these places would
depend on legislation. For now, we are maintaining our FY10
and FY11 estimates. Our DCF-based fair value also remains
at S$2.53, offering a potential upside of 16.6% from here.
Maintain BUY.

8/7/2019 OCBC - S'pore Strategy-20101215
http://slidepdf.com/reader/full/ocbc-spore-strategy-20101215 59/82
Page 59 15 December 2010
Strategy Update
Genting's Key Financial Data
EARNINGS FORECAST BALANCE SHEET
Year Ended 31 Dec (S$m) FY08 FY09 FY10F FY11F Year Ended 31 Dec (S$m) FY08 FY09 FY10F FY11F
Revenue 630.7 491.2 2,830.6 4,547.2 Cash 1,008.0 2,767.7 4,497.5 6,346.8
EBITDA 26.7 -52.3 1,288.2 2,103.4 Other Current Assets 259.0 296.5 724.5 1,097.3
Operating Profit -15.8 -89.9 1,174.7 1,955.3 Fixed Assets 2,103.6 4,538.2 5,339.7 5,191.6
Fair Value Adj (Net) 33.2 -110.6 0.0 0.0 Intangible Assets 1,286.5 1,400.7 1,400.7 1,400.7
Impairment of Intangibles -100.8 0.0 0.0 0.0 Total Assets 4,718.8 9,057.6 12,046.9 14,120.9
Finance Expenses -64.2 -56.2 -123.3 -122.1 Current Liabilities less Debt 250.8 714.1 1,289.9 1,938.5
Associates -0.9 -8.9 -8.9 -8.9 Debt 1,309.1 3,750.8 4,933.1 4,884.8
Exceptionals 0.0 0.0 0.0 0.0 Other Long Term Liabilities 421.1 458.5 343.3 343.3
Pre-tax Profit -148.5 -265.7 1,042.4 1,824.2 Shareholders Equity 2,737.7 4,134.2 5,480.6 6,954.4
Net Profit -124.8 -277.6 886.1 1,568.8 Total Equity and Liabilities 4,718.8 9,057.6 12,046.9 14,120.9
CASH FLOW
Year Ended 31 Dec (S$m) FY08 FY09 FY10F FY11F KEY RATES & RATIOS FY08 FY09 FY10F FY11F
Operating Profit 47.4 -32.7 1,258.5 1,890.4 EPS (S cents) -1.3 -2.9 8.9 15.7
Working Capital Changes -34.7 -31.9 74.8 475.7 Core EPS (S cents) -0.6 -1.7 8.9 15.7
Net Cash from Operations 29.7 -69.4 1,156.0 2,109.7 Core PER (x) na na 24.5 13.8
Capex -748.6 -1,994.0 -1,500.0 -450.0 Price/NTA (x) 12.3 5.1 5.1 3.8
Investing Cash flow -920.0 -1,998.8 -806.2 -89.9 EV/EBITDA (x) 795.9 -419.3 14.7 9.7
Change in Equity 0.2 1,510.3 321.0 0.0 Dividend Yield (%) 0.0 0.0 0.0 0.0Net Debt Change 278.0 2,419.1 1,182.2 -48.3 ROIC (%) -3.1 -3.5 9.8 12.4
Financing Cash Flow 243.1 3,825.6 1,379.9 -170.4 ROE (%) -4.6 -6.7 18.7 21.2
Net Cash flow -674.2 1,759.7 1,729.7 1,849.3 Net Gearing (%) 11.0 23.8 7.9 Net Cash
Ending Cash Balance 1,008.0 2,767.7 4,497.5 6,346.8 PE to Growth (x) 2.2 -0.6 0.0 0.3
Source: Company data, OIR estimates
Note FY08 and FY09 include discontinued operations

8/7/2019 OCBC - S'pore Strategy-20101215
http://slidepdf.com/reader/full/ocbc-spore-strategy-20101215 60/82
Page 60 15 December 2010
Strategy Update
Good Prospects for Further Growth
Hyflux Ltd15 December 2010
Maintain
BUYPrevious Rating: BUY
Closing price (10 Dec): S$3.27Fair Value : S$3.66
Reuters Code HYFL.SI
ISIN Code 600
Bloomberg Code HYF SP
Issued Capital (m) 572
Mkt Cap (S$m / US$m) 1,871 / 1,349
Major ShareholdersOlivia Lum 31.8%
Free Float (%) 52.5%
Daily Vol 3-mth (‘000) 924
52 Wk Range 2.680 - 3.770
Carey Wong(65) 6531 9808e-mail: [email protected]
1000
1500
2000
2500
3000
3500
M a y - 0 8
A u g - 0 8
N o v - 0 8
F e b - 0 9
M a y - 0 9
A u g - 0 9
N o v - 0 9
F e b - 1 0
M a y - 1 0
A u g - 1 0
N o v - 1 0
1.0
1.5
2.0
2.5
3.0
3.5
4.0
Hyf lux
STI
1 http://english.peopledaily.com.cn/90001/90776/90882/7225347.html
2 http://www.utilities-me.com/article-897-oapec-report-highlights-growing-
water-scarcity/
(S$ m) FY08 FY09 FY10F FY11F
Revenue 554.2 524.8 557.9 643.6
EBITDA 87.2 101.3 108.5 121.7EPS (cts) 11.3 14.3 13.2 15.3
PER (x) 29.0 22.9 24.8 21.4
P/NTA (x) 7.4 6.2 5.4 4.7
Good prospects for water treatment plays. The shortageof water around the globe is getting worse, according to Britain'schief scientist John Beddington, as climate change disruptsrainfall patterns and result in more severe droughts; the issueis further compounded by a growing world population and rapidurbanization. Separately, a recent report by EuromonitorInternational adds that the lack of water will put pressure onfood prices, restrict developing countries' efforts to reducepoverty and also hamper economic growth. However, it notes
that this will create opportunities in the water and wastewaterindustry.
Hyflux is in a sweet spot. Hyflux Ltd, as Singapore's largestlisted membrane-based water treatment company, is in asweet spot to capture these opportunities in both the waterand wastewater industry. Already sitting on an estimated orderbook of S$1715m, Hyflux intends to focus its efforts in Chinaand MENA, both regions identified by global agencies as thosemost likely to suffer chronic water shortages. According tothe World Bank, China may have a supply shortfall of 201bm3 by 2030; the PRC government has previously acknowledgedthat the water problem is severe1 . Separately, a recent report2
by the Organisation of Arab Petroleum Exporting Countries(OAPEC) warns that population growth will worsen the watershortage in the Arab world by 2025 unless there is furtherinvestment in desalination and water treatment capacity.Meanwhile, we understand that Hyflux is also actively lookingtowards the Indian subcontinent - another region expected tosee severe water shortages over the next decade.
Bonus issue an added sweetener. Seperately, Hyflux hasgotten in-principal approval from the SGX-ST for its 1-for-2 bonusissue, which management had earlier proposed during its 3Q10results to both reward shareholders and increase the liquidityof its shares. As the company has fixed the book closure dateas 22 Dec 2010, the stock will trade ex-bonus on 17 Dec. As
a recap, Hyflux had previously done a 1-for-4 bonus issue inJun 2002, another 1-for-4 in Dec 2003 and a 1-for-2 in Jul 2005.
Maintain BUY with S$3.66 fair value. In the longer term,the next catalyst will come from the signing of the two megadesalination projects in Libya (worth an estimated S$1.3-1.5b),which management notes is still in the technical discussionstage, essentially making it a mid-2011 story. In between, wealso expect Hyflux to announce smaller contract wins, mostlyfrom China. Maintain BUY with an unchanged fair value ofS$3.66 (25x FY11F EPS), or S$2.44 (adjusted for bonus issue).

8/7/2019 OCBC - S'pore Strategy-20101215
http://slidepdf.com/reader/full/ocbc-spore-strategy-20101215 61/82
Page 61 15 December 2010
Strategy Update
Hyflux's Key Financial Data
EARNINGS FORECAST BALANCE SHEET
Year Ended 31 Dec (S$m) FY08 FY09 FY10F FY11F As of 31 Dec (S$m) FY08 FY09 FY10F FY11F
Revenue 554.2 524.8 557.9 643.6 Cash 90.7 166.7 114.2 124.8
EBITDA 87.2 101.3 108.5 121.7 Other Current Assets 293.4 382.4 371.7 405.7
Depreciation & amortisation -9.7 -16.5 -19.3 -18.7 Fixed Assets 56.9 134.9 130.7 127.0
Operating Profit 77.5 84.8 89.3 103.0 Other long term assets 405.5 388.5 423.7 418.2
Net interest -5.5 -6.0 -7.8 -8.0 Total Assets 846.6 1,072.6 1,040.4 1,075.6
Associates -1.4 2.6 2.2 2.0 Current Liabilities less Debt 274.3 272.6 240.2 277.1
Exceptionals 0.0 -1.4 0.0 0.0 Debt 258.1 400.3 359.5 307.6
Pre-tax profit 70.4 83.0 83.6 97.0 Other Long Term Liabilities 6.3 6.3 6.3 6.3
Tax -8.2 -8.7 -8.4 -9.7 Shareholders Equity 297.5 365.2 406.3 456.5
Net Profit 59.0 75.0 75.3 87.3 Total Equity and Liabilities 846.6 1,072.6 1,040.4 1,075.6
CASH FLOW
Year Ended 31 Dec (S$m) FY08 FY09 FY10F FY11F KEY RATES & RATIOS FY08 FY09 FY10F FY11F
Profit Before Tax 70.4 83.0 83.6 97.0 EPS (S cents) 11.3 14.3 13.2 15.3
Working Capital Changes -67.3 -44.9 -34.6 -3.6 Fully Diluted EPS (S cents) 11.0 14.0 12.6 14.7
Net Cash from Operations 22.5 54.8 34.6 112.4 PER (x) 29.0 22.9 24.8 21.4
Capex -18.8 -8.6 -15.0 -15.0 Price/NTA (x) 7.4 6.2 5.4 4.7
Investing Cash flow -96.6 -95.8 -20.0 -15.7 EV/EBITDA (x) 21.6 19.2 18.1 15.6
Change in Equity 3.3 4.7 0.0 0.0 Dividend Yield (%) 1.0 1.5 1.8 2.0Net Debt Change 50.7 134.6 -40.8 -52.0 ROIC (%) 10.6 10.0 9.8 11.4
Financing Cash Flow 43.3 121.3 -67.1 -86.2 ROE (%) 19.9 20.9 18.5 19.1
Net Cash flow -29.6 75.3 -52.5 10.5 Net Gearing (%) 56.2 64.0 60.4 40.0
Ending Cash Balance 90.7 166.7 114.2 124.8 PE to Growth (x) 0.4 0.9 -3.3 1.3
Source: Company data, OIR estimates

8/7/2019 OCBC - S'pore Strategy-20101215
http://slidepdf.com/reader/full/ocbc-spore-strategy-20101215 62/82
Page 62 15 December 2010
Strategy Update
New order flow gaining momentum
Demand for high spec jack-ups has returned. BothSembcorp Marine (SMM) and Keppel Corp have collectivelyannounced seven new rig orders with options for nine moresince Oct, with the bulk of these contracts secured by theformer. Demand for premium jack-up rigs (independent leg unitswith water depth greater than 300ft, and higher hook loadcapacity) has returned, illustrated by the recent orders. Thisreaffirms the confidence in the jack-up rig market, in particularfor high-spec rigs. Indeed, ODS-Petrodata predicts that thepremium jack-up market will see a potential shortage of unitsby 20151 .
New order flow gaining momentum. Order flows are gainingmomentum and we should see additional new orders that willbenefit the entire sector with renewed capex rollouts. MaerskDrilling, for instance, aims to order a new rig every six monthsas rental rates rise and consolidation takes place in theindustry2 . According to Upstream, FloaTec (a JV of Keppel) isone of five contenders for a major engineering contract forAustralia's Browse gas project3 . Keppel's Brasfels yard alsolooks set to secure work4 for the topside integration of two
FPSOs to be used in Brazil's Santos Basin.
Petrobras results to be out by next few months. Thoughthere is talk that results of the Petrobras 28 rig tender may beknown by the end of this year, we conservatively expect thefinal outcome by 1Q11 to factor in administrative issues andpossible delays. We continue to believe that Keppel is well-positioned to secure orders from the tender, althoughnewswires have reported the possibility of Petrobras cancellingthe chartered units segment of the rig tender. Should thismaterialise, we think Petrobras may allocate more units tothe first segment (owned drillships) since it had wanted moredrillships originally. Hence this increases the chances of Keppeland SMM securing a batch of drillships each in the first section
of the tender.
Maintain BUY. Keppel's O&M arm has secured about S$2.6bworth of new orders YTD vs. our full year estimate of S$2.5b.Currently we still see good value in Keppel Corp's stock, andshould the group secure its fair share of orders in the comingquarter, there is further room for better stock performance. Itsproperty arm has also done well in the past year and wecontinue to expect healthy sales contribution from it. As such,we maintain our BUY rating and fair value estimate of S$12.50.
Keppel Corporation
15 December 2010
Maintain
BUYPrevious Rating: BUY
Closing price (10 Dec): S$10.86Fair Value : S$12.50
Reuters Code KPLM.SI
ISIN Code BN4
Bloomberg Code KEP SP
Issued Capital (m) 1,603
Mkt Cap (S$m/US$m) 17,413 / 12,555Major Shareholders
Temasek Holdings 21.5%
Free Float (%) 77.7%
Daily Vol 3-mth (‘000) 5,343
52 Wk Range 7.865 - 11.060
Low Pei Han(65) 6531 9813e-mail: [email protected]
1000
1500
2000
2500
3000
3500
4000
J a n - 0 8
M a y - 0 8
S e p - 0 8
J a n - 0 9
M a y - 0 9
S e p - 0 9
J a n - 1 0
M a y - 1 0
S e p - 1 0
2.0
4.0
6.0
8.0
10.0
12.0
14.0
Keppel
Corp
STI
1 "Jackup rig market report 2010- 2018". ODS-Petrodata. Nov 2010.2 "Maersk Drilling plans to order rig every six months, Chief Hemmingsen
says". Bloomberg. 16 Nov 2010.3 "Woodside closing in on Browse picks". Upstream. 19 Nov 2010. 4 "Brasfels in line for Petrobras floater double". Upstream. 10 Nov 2010.
(S$ m) FY08 FY09 FY10F FY11F
Revenue 11,805.4 12,247.1 9,968.2 10,922.1
EBITDA 1,377.6 1,679.1 1,943.8 1,856.8
P/NTA (x) 3.8 2.9 2.6 2.4
EPS (cts) 69.0 102.0 85.2 76.3
PER (x) 15.7 10.7 12.7 14.2

8/7/2019 OCBC - S'pore Strategy-20101215
http://slidepdf.com/reader/full/ocbc-spore-strategy-20101215 63/82
Page 63 15 December 2010
Strategy Update
Keppel Corp's Key Financial Data
EARNINGS FORECAST BALANCE SHEET
Year Ended 31 Dec (S$m) FY08 FY09 FY10F FY11F As at 31 Dec (S$m) FY08 FY09 FY10F FY11F
Revenue 11,805.4 12,247.1 9,968.2 10,922.1 Cash and cash equivalents 2,244.9 2,935.8 2,934.5 2,583.6
Operating profit 1,238.5 1,504.8 1,738.9 1,574.9 Other current assets 5,845.6 5,649.7 6,220.2 6,771.7
EBITDA 1,377.6 1,679.1 1,943.8 1,856.8 Property, plant, and equipment 1,872.6 2,157.2 2,202.2 2,320.4
Finance costs & invt income 4.4 29.1 3.2 -11.1 Total assets 16,746.4 17,306.9 18,402.5 18,871.1
Associates and JV 354.0 321.7 200.4 210.4 Debt 1,970.2 1,759.2 2,300.0 2,300.0
Exceptionals 12.6 322.1 0.0 0.0 Current liabilities excluding debt 7,646.5 6,423.4 6,001.3 5,658.7
Pre-tax profit (excl. EI) 1,596.8 1,855.6 1,942.4 1,774.2 Total liabilities 9,997.9 8,594.3 8,713.1 8,370.5
Profit before tax 1,609.4 2,177.7 1,942.4 1,774.2 Shareholders equity 4,596.2 5,985.3 6,762.1 7,374.5
Minority interests -223.4 -204.7 -200.1 -198.7 Total equity 6,748.5 8,712.6 9,689.4 10,500.6
Profit attributable to shareholders 1,098.0 1,625.1 1,363.5 1,220.6 Total equity and liabilities 16,746.4 17,306.9 18,402.5 18,871.1
CASH FLOW
Year Ended 31 Dec (S$m) FY08 FY09 FY10F FY11F KEY RATES & RATIOS FY08 FY09 FY10F FY11F
Op profit before working cap. chang 1,395.7 1,708.6 1,968.7 1,882.9 Core EPS (S cents) 69.0 79.3 85.2 76.3
Working cap, taxes and int 651.1 -1,038.4 -1,443.0 -1,300.4 EPS (S cents) 69.0 102.0 85.2 76.3
Net cash from operations 2,046.8 670.1 525.7 582.5 NTA per share (S$) 2.8 3.7 4.2 4.6
Purchase of PP&E -399.6 -475.8 -500.0 -400.0 Net profit margin (%) 9.3 13.3 13.7 11.2
Other investing flows 228.4 899.3 56.6 74.8 PER (x) 15.7 10.7 12.7 14.2
Investing cash flow -171.2 423.5 -443.4 -325.2 Price/NTA (x) 3.8 2.9 2.6 2.4
Financing cash flow -1,255.6 -376.7 -81.8 -608.2 EV/EBITDA (x) 12.3 9.6 8.6 9.2
Net cash flow 620.0 717.0 0.4 -350.9 Dividend yield (%) 3.2 5.6 3.6 3.5
Cash at beginning of year 1,597.1 2,244.9 2,935.8 2,934.5 ROE (%) 23.9 27.2 20.2 16.6
Cash at end of year (incl ODs) 2,244.9 2,935.8 2,934.5 2,583.6 Net gearing (%) Net cash Net cash Net cash Net cash
Source: Company data, OIR estimates

8/7/2019 OCBC - S'pore Strategy-20101215
http://slidepdf.com/reader/full/ocbc-spore-strategy-20101215 64/82
Page 64 15 December 2010
Strategy Update
Most prolific Industrial REIT acquirer
15 December 2010
Maintain
BUYPrevious Rating: BUY
Closing price (10 Dec): S$0.925Fair Value : S$1.00
Reuters Code MAPL.SI
ISIN Code M44U
Bloomberg Code MLT SP
Issued Capital (m) 2,426
Mkt Cap (S$m/US$m) 2,244 / 1,618
Major Shareholders
Temasek Holdings 40.8%
Free Float (%) 59.3%
Daily Vol 3-mth (‘000) 5,396
52 Wk Range 0.716 - 0.945
Mapletree Logistics Trust
Riding on Asia's Acquisition Wave. Mapletree Logistics
Trust (MLT) has been focusing on inorganic growth for the
most part of 2010. The latest acquisition was the Toki Logistics
Centre for S$16.2m. Year-to-date, MLT has completed the
acquisitions of 12 properties at NPI yields of 7%-9% in Asia
after raising S$305m via equity in Sep 10. This was in stark
contrast to 2009, where it only completed one acquisition. Itnow has 94 properties, comprising 52 properties in Singapore,
eight in Hong Kong, six in China, 11 in Malaysia, 14 in Japan,
two in South Korea and one in Vietnam. Going forward, MLT
has stated that it will continue its pipeline of accretive third-
party acquisition opportunities in markets such as Japan &
Singapore, which offer attractive NPI yields.
Favorable Industrial Outlook. According to DTZ, there is a
total of 398m sf of industrial space in Singapore as at 1Q10,
with 26.9m sf of new supply expected over the next three
years (majority pre-committed). The 3Q10 price and rental
indices of industrial space also continued to improve by 8.3%
and 4.8% QoQ, respectively. With improved rail connectivity
to the suburban regions, we also expect further upside to the
industrial buildings situated near the upcoming MRT lines.
MLT has some 51% of its net property income (NPI) derived in
Singapore. In line with our OVERWEIGHT rating for the
Industrial REITs subsector, we think MLT will likewise benefit
from positive rental reversions in FY11-FY12. Asia is also
expected to lead the industrial recovery due to increasing trade
flows and domestic consumption in China (+Hong Kong) and
Vietnam, which constitute 25% of MLT's NPI.
Valuations. Given the continued pick-up in industrial space
demand and the strengthening of industrial rents, we thinkMLT looks set to capitalize on the recovery cycle in Asia. The
full effect of its announced acquisitions should also improve
its top-line and DPU contributions by 2011. We are positive
on MLT's track record in undertaking accretive acquisitions
that boost distributable income. Sponsor, Mapletree
Investments, and Itochu also plan to develop logistics built-to-
suit projects of approx US$300-500m over the next 3-5 years,
which will be offered to MLT on a right-of-first refusal basis,
further providing MLT with a pipeline of potential assets for
future acquisitions. Maintain BUY with a RNAV-derived fair value
of S$1.00 (14.9% estimated total return).
1000
1500
2000
2500
3000
3500
4000
J a n - 0 8
M a y - 0 8
S e p - 0 8
J a n - 0 9
M a y - 0 9
S e p - 0 9
J a n - 1 0
M a y - 1 0
S e p - 1 0
0.10.20.3
0.40.50.60.70.80.91.0
Mapletree
Logistics
STI
Ong Kian Lin(65) 6531 9810e-mail: [email protected]
(S$ m) FY08 FY09 FY10F FY11F
Revenue 184.9 206.8 227.9 258.6
NPI 161.0 180.8 199.9 225.0
Distributable inc 97.4 117.9 133.4 151.4
DPU yield (%) 7.8 6.5 6.7 6.7
P/NAV (x) 1.0 1.1 1.1 1.1

8/7/2019 OCBC - S'pore Strategy-20101215
http://slidepdf.com/reader/full/ocbc-spore-strategy-20101215 65/82
Page 65 15 December 2010
Strategy Update
Mapletree Logistics Trust's Key Financial Data
EARNINGS FORECAST BALANCE SHEET
Year Ended 31 Dec (S$m) FY08 FY09 FY10F FY11F As at 31 Dec (S$m) FY08 FY09 FY10F FY11F
Gross revenue 184.9 206.8 227.9 258.6 Cash and cash equivalents 81.9 67.4 88.6 98.3
Property expenses -23.9 -25.9 -28.0 -33.6 Total current assets 102.9 83.5 111.2 122.7
Net property income 161.0 180.8 199.9 225.0 Investment properties 2943.4 2916.7 3451.7 3451.7
Manager's management fees -19.0 -21.9 -22.3 -26.6 Total assets 3046.3 3000.2 3562.9 3574.4
Borrowing costs -36.9 -33.2 -30.7 -37.7 Current liabilities ex borrowings 136.0 121.9 126.7 137.1
Net investment income 99.6 117.2 145.1 156.4 Total borrowings 1159.4 1092.6 1321.9 1321.9
Chg in value of invt properties 94.1 -16.5 13.1 0.0 Other long term liabilities 28.8 32.4 33.0 33.0
Total return 160.1 94.7 152.3 152.4 Total liabilities 1324.2 1246.8 1481.6 1492.0
Adjustment -62.7 23.2 -18.9 -1.0 Total equity 1722.0 1753.3 2081.3 2082.3
Amt distributable to unitholders 97.4 117.9 133.4 151.4 Total liabilities and equity 3046.3 3000.2 3562.9 3574.4
CASH FLOW
Year Ended 31 Dec (S$m) FY08 FY09 FY10F FY11F KEY RATES & RATIOS FY08 FY09 FY10F FY11F
Operating cashflows 152.9 149.9 158.9 198.5 Units outstanding 1939.3 2054.3 2426.7 2426.7
Purchase of invt properties -355.3 -48.0 -540.6 0.0 DPU (S cents) 7.2 6.0 6.2 6.2
Investing cash flows -355.0 -47.7 -540.8 0.4 CFPU (S cents) 7.9 7.3 6.5 8.2
Proceeds from new units 606.7 79.4 305.0 0.0 NAV (S$) 0.9 0.9 0.9 0.9
Proceeds from borrowings 544.7 338.8 616.2 0.0 DPU yield (%) 7.8 6.5 6.7 6.7
Financing cash flows 232.8 -115.0 403.8 -189.1 P/CF (x) 11.7 12.7 14.1 11.3
Net change in cash 30.6 -12.8 21.9 9.7 P/NAV (x) 1.0 1.1 1.1 1.1Cash at beg of period 45.7 81.9 67.4 88.6 NPI margin (%) 87.1 87.5 87.7 87.0
Exchange rate effects 5.6 -1.7 -0.7 0.0 Distr to revenue (%) 52.7 57.0 58.5 58.5
Cash at end of period 81.9 67.4 88.6 98.3 Total debt/Total assets (x) 0.4 0.4 0.4 0.4
Source: Company data, OIR estimates

8/7/2019 OCBC - S'pore Strategy-20101215
http://slidepdf.com/reader/full/ocbc-spore-strategy-20101215 66/82
Page 66 15 December 2010
Strategy Update
Earnings to take flight in 2011
Strong 3Q10; earnings to accelerate in FY11. Noble Group(Noble) recently reported a strong set of 3Q10 results. Weare positive on the stock in anticipation of earnings accelerationin FY11, as the group begins to reap the fruits of its recentpipeline investments. As a recap, Noble beat expectations bydelivering a 78.7% YoY jump in 3Q10 revenue to US$14.9band a 40.6% YoY increase in gross profit to US$442.3m.Recurring net profit was flat YoY at US$131.1m. Sequentially,these represented a 15.6% improvement in revenue, and more
significantly, a 178% jump in recurring net profit, demonstratingits sharp reversal from a lacklustre 2Q10. We expect Noble'searnings to continue to be buoyed by strong underlyingfundamentals for commodities such as energy and agriculture.The group has spent US$2.8b expanding its pipeline since2007 and several of these investments are nearing maturity,adding a further boost to earnings from 4Q10 onwards.
Performance buoyed by Agriculture and Energy. Noble'srobust 3Q10 performance was driven by its Agriculture andEnergy segments, which benefitted from stronger volumes andhigher prices amid stabilising economic conditions. Overallgross profit margin contracted by 0.8ppt YoY (but expanded
0.6ppt QoQ) due to higher revenue contribution from the Energysegment which entails lower margins. Core net profit margineased 0.7ppt (but gained 0.5ppt QoQ) to 0.9%. Agriculture,whose 2Q10 margins were hurt by challenging soybeanmarkets, surprised pleasantly with a record high gross profitof US$237.5m in 3Q10 as gross profit margin rebounded by2.3ppt YoY and 4.0ppt QoQ to 6.7%. Management expressedconfidence in this segment's FY11 performance as it has lockedin improved soy crushing margins.
Preferred pick within commodities sector. Noble hasreaffirmed its target of achieving US$1b in earnings over thenext three years, implying a 24% CAGR between FY09 andFY13. With its strong balance sheet, the group remains well-
positioned to capture any investment opportunities that mayarise. While China's price controls may imply volatileagricultural margins in the near term, Noble's well-diversifiedbusiness model means that continued growth from othersegments and geographies will offset underperformance fromany single business unit. With earnings expected to bepropelled by pipeline investments coming on stream in 2011,Noble is among our preferred picks within the commoditiessector. We reiterate our BUY rating with S$2.59 fair valueestimate. Key risks that may impede the group's performanceinclude longer-than-expected gestation periods for itsinvestments, as well as continued USD/SGD weakness, which
could lead to translation losses.
Noble Group15 December 2010
Maintain
BUYPrevious Rating: BUY
Closing price (10 Dec): S$2.12Fair Value: S$2.59
Reuters Code NOBG.SI
ISIN Code N21
Bloomberg Code NOBL SP
Issued Capital (m) 6,027
Mkt Cap (S$m/US$m) 12,776 / 9,212
Major Shareholders
Fleet Overseas (NZ) 23.5%
Free Float (%) 48.6%
Daily Vol 3-mth (‘000) 28,011
52 Wk Range 1.540 - 2.232
Lee Wen Ching(65) 6531 9806e-mail: [email protected]
1000
1500
2000
2500
3000
3500
4000
J a n - 0 8
A p r - 0 8
J u l - 0 8
O c t - 0 8
J a n - 0 9
A p r - 0 9
J u l - 0 9
O c t - 0 9
J a n - 1 0
A p r - 1 0
J u l - 1 0
O c t - 1 0 0.2
0.7
1.2
1.7
2.2
2.7
3.2
3.7
Noble Grp
STI
(US$ m) FY08 FY09 FY10F FY11F
Revenue 36,090.2 31,183.1 50,282.0 60,798.8
Gross Profit 1,347.6 1,105.0 1,357.6 1,702.4
P/NAV (x) 2.8 2.1 2.9 2.5
EPS (cts) 17.5 14.5 8.6 11.7
PER (x) 12.0 14.6 21.6 13.9

8/7/2019 OCBC - S'pore Strategy-20101215
http://slidepdf.com/reader/full/ocbc-spore-strategy-20101215 67/82
Page 67 15 December 2010
Strategy Update
Noble Group's Key Financial Data
EARNINGS FORECAST BALANCE SHEET
Year Ended 31 Dec (US$m) FY08 FY09 FY10F FY11F As at 31 Dec (US$m) FY08 FY09 FY10F FY11F
Revenue 36,090.2 31,183.1 50,282.0 60,798.8 Cash and cash equivalents 1,318.2 937.3 2,700.7 2,451.2
Gross Profit 1,347.6 1,105.0 1,357.6 1,702.4 Inventories 1,757.0 3,414.6 3,519.7 3,951.9
Other income 103.9 125.5 70.4 60.8 Property, plant, equipment 1,003.8 1,522.7 2,016.5 2,295.7
Operating expenses -567.6 -422.9 -597.4 -715.0 Total assets 8,152.6 10,655.0 13,831.5 15,211.4
EBIT 883.9 807.6 830.7 1,048.2 Debt 2,556.1 3,541.1 5,833.7 5,833.7
Associates & JV -15.8 -24.8 -6.8 -6.8 Current liabilities excluding debt 3,600.4 3,937.0 4,596.2 5,435.8
PBT 676.0 620.2 584.0 793.1 Total liabilities 6,291.8 7,616.8 10,480.2 11,330.4
PAT 579.7 555.1 519.7 705.9 Shareholders equity 1,851.1 2,955.4 3,344.3 3,872.6
Reported net profit 577.3 556.0 518.5 704.4 Total equity 1,860.9 3,038.2 3,351.2 3,881.1
Recurring net profit 437.8 429.7 453.7 704.4 Total equity and liabilities 8,152.6 10,655.0 13,831.5 15,211.4
CASH FLOW
Year Ended 31 Dec (US$m) FY08 FY09 FY10F FY11F KEY RATES & RATIOS FY08 FY09 FY10F FY11F
Op profit before working cap. 958.1 877.5 940.6 1,174.0 EPS (US cents) 17.5 14.5 8.6 11.7
Working cap, taxes and interest 512.3 -1,687.1 -828.0 -847.5 NAV per share (US cents) 57.6 79.0 55.7 64.5
Net cash from operations 1,470.4 -809.6 112.5 326.5 PBT margin (%) 1.9% 2.0% 1.2% 1.3%
Purchase of PP&E -506.2 -626.9 -600.0 -400.0 Net profit margin (%) 1.6% 1.8% 1.0% 1.2%
Investing cash flow -584.4 -1,136.9 -512.1 -400.0 PER (x) 12.0 14.6 21.6 13.9
Financing cash flow -176.9 1,399.0 2,163.0 -176.1 Price/NAV (x) 2.8 2.1 2.9 2.5
Net cash flow 709.1 -547.5 1,763.4 -249.5 EV/EBITDA (x) 11.4 13.0 13.6 11.2
Cash at beginning of year 471.1 1,175.8 619.8 2,383.2 Dividend yield (%) 2.7% 2.2% 1.3% 1.8%
Cash at end of year 1,175.8 619.8 2,383.2 2,133.6 ROE (%) 31.2% 18.8% 15.5% 18.2%
Cash and cash equivalents 1,318.2 937.3 2,700.7 2,451.2 Net gearing (%) 66.9 88.1 93.7 87.3
Source: Company data, OIR estimates
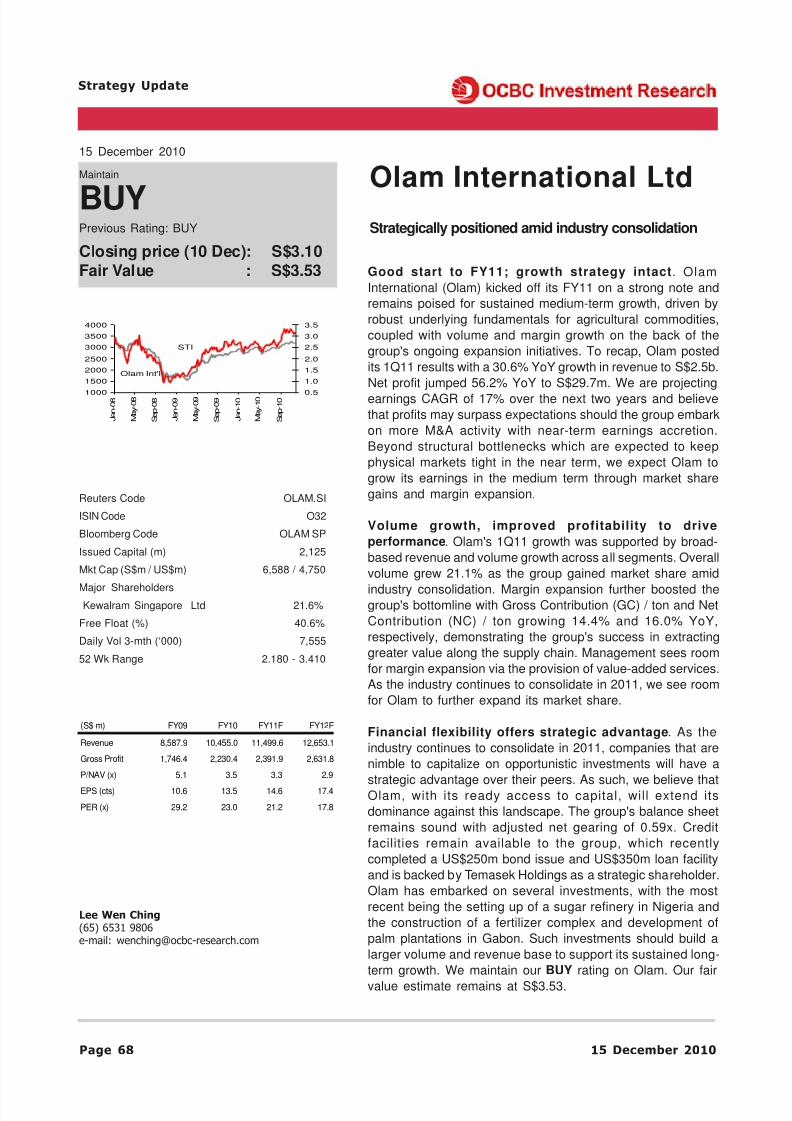
8/7/2019 OCBC - S'pore Strategy-20101215
http://slidepdf.com/reader/full/ocbc-spore-strategy-20101215 68/82
Page 68 15 December 2010
Strategy Update
Good start to FY11; growth strategy intact . Olam
International (Olam) kicked off its FY11 on a strong note and
remains poised for sustained medium-term growth, driven by
robust underlying fundamentals for agricultural commodities,
coupled with volume and margin growth on the back of the
group's ongoing expansion initiatives. To recap, Olam posted
its 1Q11 results with a 30.6% YoY growth in revenue to S$2.5b.
Net profit jumped 56.2% YoY to S$29.7m. We are projecting
earnings CAGR of 17% over the next two years and believe
that profits may surpass expectations should the group embark
on more M&A activity with near-term earnings accretion.
Beyond structural bottlenecks which are expected to keep
physical markets tight in the near term, we expect Olam to
grow its earnings in the medium term through market share
gains and margin expansion.
Volume growth, improved profitability to drive
performance. Olam's 1Q11 growth was supported by broad-
based revenue and volume growth across all segments. Overall
volume grew 21.1% as the group gained market share amid
industry consolidation. Margin expansion further boosted thegroup's bottomline with Gross Contribution (GC) / ton and Net
Contribution (NC) / ton growing 14.4% and 16.0% YoY,
respectively, demonstrating the group's success in extracting
greater value along the supply chain. Management sees room
for margin expansion via the provision of value-added services.
As the industry continues to consolidate in 2011, we see room
for Olam to further expand its market share.
Financial flexibility offers strategic advantage. As the
industry continues to consolidate in 2011, companies that are
nimble to capitalize on opportunistic investments will have a
strategic advantage over their peers. As such, we believe thatOlam, with its ready access to capital, will extend its
dominance against this landscape. The group's balance sheet
remains sound with adjusted net gearing of 0.59x. Credit
facilities remain available to the group, which recently
completed a US$250m bond issue and US$350m loan facility
and is backed by Temasek Holdings as a strategic shareholder.
Olam has embarked on several investments, with the most
recent being the setting up of a sugar refinery in Nigeria and
the construction of a fertilizer complex and development of
palm plantations in Gabon. Such investments should build a
larger volume and revenue base to support its sustained long-
term growth. We maintain our BUY rating on Olam. Our fair
value estimate remains at S$3.53.
Strategically positioned amid industry consolidation
Olam International Ltd15 December 2010
Maintain
BUYPrevious Rating: BUY
Closing price (10 Dec): S$3.10Fair Value : S$3.53
Reuters Code OLAM.SI
ISIN Code O32
Bloomberg Code OLAM SP
Issued Capital (m) 2,125
Mkt Cap (S$m / US$m) 6,588 / 4,750
Major ShareholdersKewalram Singapore Ltd 21.6%
Free Float (%) 40.6%
Daily Vol 3-mth (‘000) 7,555
52 Wk Range 2.180 - 3.410
Lee Wen Ching(65) 6531 9806e-mail: [email protected]
1000
1500
2000
2500
3000
3500
4000
J a n - 0 8
M a y - 0 8
S e p - 0 8
J a n - 0 9
M a y - 0 9
S e p - 0 9
J a n - 1 0
M a y - 1 0
S e p - 1 0
0.5
1.0
1.5
2.0
2.5
3.0
3.5
Olam Int'l
STI
(S$ m) FY09 FY10 FY11F FY12F
Revenue 8,587.9 10,455.0 11,499.6 12,653.1
Gross Profit 1,746.4 2,230.4 2,391.9 2,631.8
P/NAV (x) 5.1 3.5 3.3 2.9
EPS (cts) 10.6 13.5 14.6 17.4
PER (x) 29.2 23.0 21.2 17.8

8/7/2019 OCBC - S'pore Strategy-20101215
http://slidepdf.com/reader/full/ocbc-spore-strategy-20101215 69/82
Page 69 15 December 2010
Strategy Update
Olam's Key Financial Data
EARNINGS FORECAST BALANCE SHEET
Year Ended 30 Jun (S$m) FY09 FY10 FY11F FY12F As at 30 Jun (S$m) FY09 FY10 FY11F FY12F
Sale of goods 8,587.9 10,455.0 11,499.6 12,653.1 Cash and cash equivalents 533.8 671.5 600.0 466.6
Other income 138.5 241.2 0.0 0.0 Inventories 1,966.4 2,537.9 2,759.9 3,036.7
Gross profit 1,746.4 2,230.4 2,391.9 2,631.8 Property, plant, equipment 517.4 1,054.2 1,061.3 1,067.7
Operating expenses -1,290.3 -1,595.6 -1,766.3 -1,938.9 Total assets 5,415.4 7,799.5 7,997.0 8,330.1
EBIT 456.1 634.7 625.6 693.0 Debt 3,174.2 4,503.0 4,478.1 4,455.7
Finance costs -239.2 -227.5 -268.7 -267.3 Current liabilities excluding debt 1,132.5 1,396.0 1,385.6 1,463.4
PBT 258.0 420.2 356.9 425.6 Total liabilities 4,369.5 6,028.8 5,993.5 6,048.8
PAT 252.0 359.7 310.5 370.3 Shareholders equity 1,045.8 1,771.9 2,004.7 2,282.5
Reported net profit 252.0 359.5 310.5 370.3 Total equity 1,045.9 1,770.7 2,003.6 2,281.3
Recurring net profit 182.2 271.8 310.5 370.3 Total equity and liabilities 5,415.4 7,799.5 7,997.0 8,330.1
CASH FLOW
Year Ended 30 Jun (S$m) FY09 FY10 FY11F FY12F KEY RATES & RATIOS FY09 FY10 FY11F FY12F
Op profit before working cap. 331.0 531.3 678.5 746.5 EPS (S cents) 10.6 13.5 14.6 17.4
Working cap, taxes and interest 96.6 -1,588.2 -587.5 -704.9 NAV per share (S cents) 61.0 87.6 94.4 107.4
Net cash from operations 427.6 -1,056.9 91.0 41.6 PBT margin (%) 3.0 4.0 3.1 3.4
Purchase of PP&E -208.1 -65.4 -60.0 -60.0 Net profit margin (%) 2.9 3.4 2.7 2.9
Investing cash flow -544.1 -750.2 -60.0 -60.0 PER (x) 29.2 23.0 21.2 17.8
Financing cash flow 198.8 1,984.2 -102.5 -115.0 Price/NAV (x) 5.1 3.5 3.3 2.9
Net cash flow (Incl forex) 104.4 235.3 -71.6 -133.4 EV/EBITDA (x) 17.9 14.4 14.9 13.7 Cash at beginning of year 164.3 268.7 503.9 432.4 Dividend yield (%) 1.1 1.5 1.2 1.4
Cash at end of year 268.7 503.9 432.4 299.0 ROE (%) 24.1 20.3 15.5 16.2
Cash and cash equivalents 533.8 671.5 600.0 466.6 Net gearing (%) 252.5 216.2 193.4 174.8
Source: Company data, OIR estimates

8/7/2019 OCBC - S'pore Strategy-20101215
http://slidepdf.com/reader/full/ocbc-spore-strategy-20101215 70/82
Page 70 15 December 2010
Strategy Update
A steady consistent performer. Pacific Andes Resources
Development (PARD) has been a consistent performer in the
past few years. In terms of profits, this trend has been rising
from only HK$90m in FY04 to HK$773m in the recent financial
year end. This implied a compounded average growth rate
(CAGR) of 43% during this period. Revenue growth is also
strong at a CAGR of 20% for the same period, reachingHK$7432m recently. Despite going through the high-growth
phase in the past few years, management is not sitting on its
laurels as we see potential for the group to further develop its
operations via acquisitions and better utilisation of its assets
and we are projecting growth of 16.7% and 21.8% respectively
for revenue and profits in the coming two years. This will be
buoyed by the expansion of its fishing and fishing-related
businesses.
Going into the salmon business. Recently, it announced
the acquisition of a 19.76% stake in ASX-listed Tassal Group
Limited (Tassal) for A$51.7m (or S$67m). Tassal is a vertically
integrated salmon grower, processor, seller and marketer.
According to management, Tassal is also Australia's largest
producer and marketer of salmon with brand names such as
Tassal Pure Tasmania, Tasmanian Smokehouse, twiceaweek
and Superior Gold. It employs over 650 people and harvests
over 12,000 tonnes of salmon per annum. Tassal's 5-year
EBITDA CAGR growth rate is 34% and this reached A$50.3m
in FY2010. The acquisition of Tassal is priced at A$1.79 per
share. PARD will be financing this transaction from its own
internal sources. We view this deal positively as it offers a
complementary fit into PARD's current operations.
Still a BUY. In addition, we reiterate our view that consumptionof seafood is still on an uptrend and the above transaction,
together with its existing operations, will aid in its positioning
to tap on still growing demand for fish and related products. It
is currently trading at only 0.8x NAV and undemanding PERs
of 6.6x FY11F earnings and 5.0x FY12F earnings besides a
dividend yield of 4.1%. It has also reduced its total borrowings
from HK$6513m as at 28 Jun 2010 to HK$5959m by 28 Sep
2010. This brings its net debt to equity ratio down to 61%, of
which a significant 56% is short term debt and are largely
trading debts for its SCM operation. We are retaining our BUY
rating and fair value estimate of S$0.40.
A consistent performer
Pacific Andes Resources
Development
15 December 2010
Maintain
BUYPrevious Rating: BUY
Closing price (10 Dec): S$0.34Fair Value : S$0.40
Reuters Code PACF.SI
ISIN Code P11
Bloomberg Code PAH SP
Issued Capital (m) 2,841
Mkt Cap (S$m/US$m) 966 / 697
Major ShareholdersPAIH 58%
Free Float (%) 28%
Daily Vol 3-mth (‘000) 4,334
52 Wk Range 0.265 - 0.415
Carmen Lee(65) 6531 9802e-mail: [email protected]
1000
1500
2000
2500
3000
3500
M a y - 0 8
A u g - 0 8
N o v - 0 8
F e b - 0 9
M a y - 0 9
A u g - 0 9
N o v - 0 9
F e b - 1 0
M a y - 1 0
A u g - 1 0
0.0
0.1
0.2
0.2
0.3
0.4
0.5Pacific Andes
Resources
STI
(HK$m) FY9/09A FY10A FY11F FY12F
Revenue 7,610 7,432 8,532 10,127Gross Profits 1,550 1,830 2,068 2,575
Net Profits 733 773 864 1,147
EPS (HK cts) 26.3 27.2 30.4 40.4
PER (x) 3.8 7.4 6.6 5.0

8/7/2019 OCBC - S'pore Strategy-20101215
http://slidepdf.com/reader/full/ocbc-spore-strategy-20101215 71/82
Page 71 15 December 2010
Strategy Update
PARD's Key Financial Data
EARNINGS FORECAST
Year Ended 28 Sep (HK$m)FY09A FY10A FY11F FY12F
BALANCE SHEET
As at 28 Sep (HK$m)FY09A FY10A FY11F FY12F
Revenue 7,610 7,432 8,532 10,127 Share capital 705 721 721 721
Gross Profit 1,550 1,830 2,068 2,575 Reserves 5,143 6,254 6,882 7,792
Other Income 158 166 90 65 Minority interest 1,166 2,265 1,176 951
Operating expenses -370 -503 -513 -462 Total equity 7,014 9,240 8,779 9,464
EBIT 1337 1493 1645 2178 Fixed assets 7,622 9,664 9,856 10,094
Finance costs -376 -370 -328 -423 Current assets 5,237 6,518 5,134 5,422
Joint ventures / associates 1 2 1 1 - Inventory and receivables 4,801 5,993 4,236 4,839
Pretax profit 962 1124 1318 1756 Current liabilities 2,874 3,778 3,135 2,882
Net profit 733 773 864 1147 Long-term liabilities 2,972 3,164 3,075 3,170
Net profit - before exceptionals 733 773 864 1147 Total assets 7,014 9,240 8,779 9,464
CASH FLOW
Year Ended 28 Sep (HK$m)FY09A FY10A FY11F FY12F Key RATES & RATIOS FY09A FY10A FY11F FY12F
Op profit 401.6 1,124.4 1,318.4 1,755.8 EPS (HK cents) 26.3 27.2 30.4 40.4
Non-cash items 326.2 902.3 670.4 767.8 NAV per share (HK$) 2.1 2.5 2.7 3.0
Changes in working capital -587 -1018 1581 -467 Gross margin (%) 20.4 24.6 24.2 25.4
Operating cash flow 141 1008 3570 2057 EBIT margin (%) 17.6 20.1 19.3 21.5
Net cash from operating activities -31 658 3179 1546 Net profit margin (%) 9.6 10.4 10.1 11.3
Net cash used in investing activities -1065 -2298 -1999 -1589 PER (x) 3.8 7.4 6.6 5.0
Cash flow from financing activities 1,094.0 1,719.1 -781 -281 Price/NAV (x) 1.0 0.8 0.8 0.7Net cash flow -3 78.8 398 -324 Dividend yield (%) 1.8 4.1 4.1 4.1
Cash at beginning of year 171.1 168.5 247.3 645.7 ROE (%) 15.0 13.5 11.9 14.2
Cash at end of year 168.5 247.3 645.7 321.5 Net gearing (%) 72.8 61.8 56.3 52.8
Source: Company data, OIR estimates
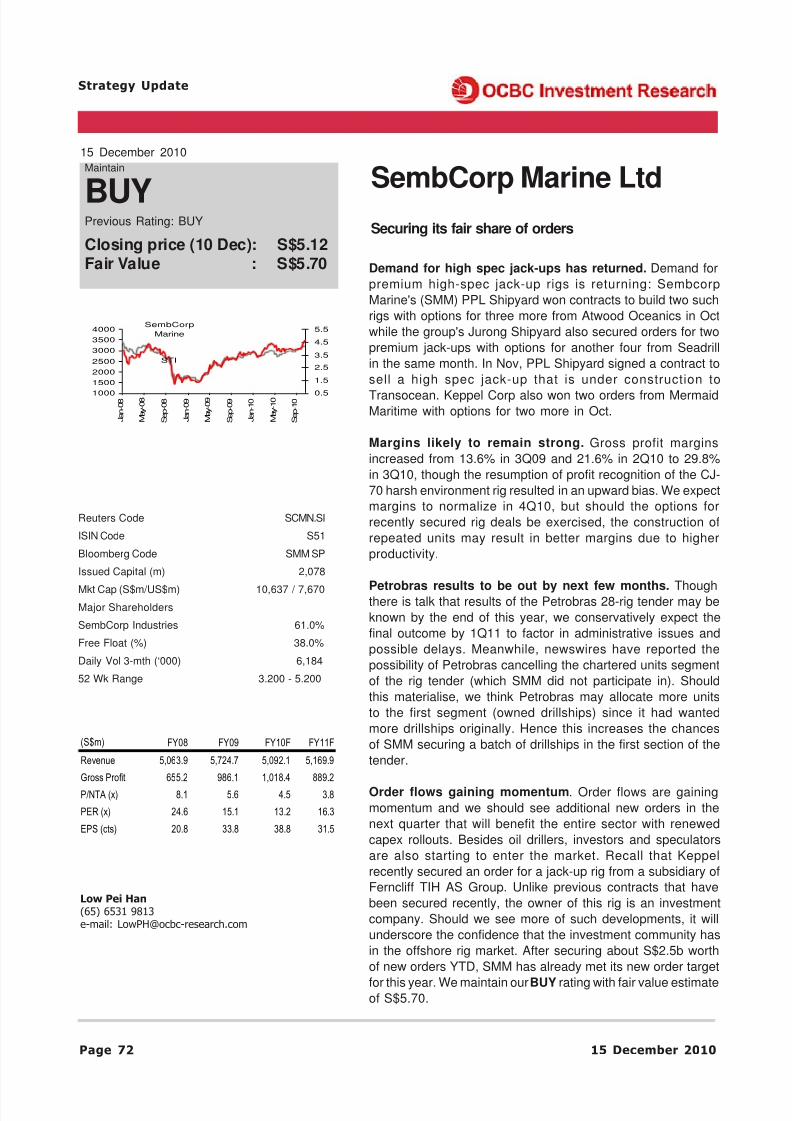
8/7/2019 OCBC - S'pore Strategy-20101215
http://slidepdf.com/reader/full/ocbc-spore-strategy-20101215 72/82
Page 72 15 December 2010
Strategy Update
Securing its fair share of orders
SembCorp Marine Ltd15 December 2010
Reuters Code SCMN.SI
ISIN Code S51
Bloomberg Code SMM SP
Issued Capital (m) 2,078
Mkt Cap (S$m/US$m) 10,637 / 7,670
Major Shareholders
SembCorp Industries 61.0%
Free Float (%) 38.0%
Daily Vol 3-mth (‘000) 6,184
52 Wk Range 3.200 - 5.200
Low Pei Han(65) 6531 9813e-mail: [email protected]
Demand for high spec jack-ups has returned. Demand for
premium high-spec jack-up rigs is returning: Sembcorp
Marine's (SMM) PPL Shipyard won contracts to build two such
rigs with options for three more from Atwood Oceanics in Oct
while the group's Jurong Shipyard also secured orders for two
premium jack-ups with options for another four from Seadrill
in the same month. In Nov, PPL Shipyard signed a contract to
sell a high spec jack-up that is under construction to
Transocean. Keppel Corp also won two orders from MermaidMaritime with options for two more in Oct.
Margins likely to remain strong. Gross profit margins
increased from 13.6% in 3Q09 and 21.6% in 2Q10 to 29.8%
in 3Q10, though the resumption of profit recognition of the CJ-
70 harsh environment rig resulted in an upward bias. We expect
margins to normalize in 4Q10, but should the options for
recently secured rig deals be exercised, the construction of
repeated units may result in better margins due to higher
productivity.
Petrobras results to be out by next few months. Thoughthere is talk that results of the Petrobras 28-rig tender may be
known by the end of this year, we conservatively expect the
final outcome by 1Q11 to factor in administrative issues and
possible delays. Meanwhile, newswires have reported the
possibility of Petrobras cancelling the chartered units segment
of the rig tender (which SMM did not participate in). Should
this materialise, we think Petrobras may allocate more units
to the first segment (owned drillships) since it had wanted
more drillships originally. Hence this increases the chances
of SMM securing a batch of drillships in the first section of the
tender.
Order flows gaining momentum. Order flows are gaining
momentum and we should see additional new orders in the
next quarter that will benefit the entire sector with renewed
capex rollouts. Besides oil drillers, investors and speculators
are also starting to enter the market. Recall that Keppel
recently secured an order for a jack-up rig from a subsidiary of
Ferncliff TIH AS Group. Unlike previous contracts that have
been secured recently, the owner of this rig is an investment
company. Should we see more of such developments, it will
underscore the confidence that the investment community has
in the offshore rig market. After securing about S$2.5b worth
of new orders YTD, SMM has already met its new order target
for this year. We maintain our BUY rating with fair value estimateof S$5.70.
1000
1500
2000
2500
3000
3500
4000
J a n - 0 8
M a y - 0 8
S e p - 0 8
J a n - 0 9
M a y - 0 9
S e p - 0 9
J a n - 1 0
M a y - 1 0
S e p - 1 0
0.5
1.5
2.5
3.5
4.5
5.5
STI
SembCorp
Marine
Maintain
BUYPrevious Rating: BUY
Closing price (10 Dec): S$5.12Fair Value : S$5.70
(S$m) FY08 FY09 FY10F FY11F
Revenue 5,063.9 5,724.7 5,092.1 5,169.9
Gross Profit 655.2 986.1 1,018.4 889.2
P/NTA (x) 8.1 5.6 4.5 3.8
PER (x) 24.6 15.1 13.2 16.3
EPS (cts) 20.8 33.8 38.8 31.5

8/7/2019 OCBC - S'pore Strategy-20101215
http://slidepdf.com/reader/full/ocbc-spore-strategy-20101215 73/82
Page 73 15 December 2010
Strategy Update
Sembcorp Marine's Key Financial Data
EARNINGS FORECAST BALANCE SHEET
Year Ended 31 Dec (S$m) FY08 FY09 FY10F FY11F As at 31 Dec (S$m) FY08 FY09 FY10F FY11F
Revenue 5,063.9 5,724.7 5,092.1 5,169.9 Cash and cash equivalents 2,054.0 1,978.5 2,175.6 2,429.8
Gross profit 655.2 986.1 1,018.4 889.2 Other current assets 1,381.5 1,539.3 1,593.8 1,721.6
Operating and admin expenses -153.3 -123.7 -152.9 -133.9 Property, plant, and equipment 697.7 678.4 900.9 941.1
EBITDA 572.5 937.6 938.7 841.7 Total assets 4,611.8 4,687.5 5,311.4 5,898.3
Operating profit 501.8 862.4 865.5 755.3 Debt 272.0 30.9 350.0 450.0
Other expenses/income -22.2 19.9 83.5 53.6 Current liabilities excluding debt 2,909.4 2,623.3 2,407.3 2,419.2
Associates 65.3 25.4 52.3 56.9 Total liabilities 3,251.9 2,727.1 2,830.6 2,936.1
Pre-tax profit 545.0 907.6 1,001.3 865.8 Shareholders equity 1,318.0 1,884.1 2,379.4 2,804.3
Profit for the year 451.2 756.8 831.1 710.0 Total equity 1,360.0 1,960.4 2,480.8 2,962.3
Profit attributable to shareholders 429.9 700.1 806.1 653.3 Total equity and liabilities 4,611.8 4,687.5 5,311.4 5,898.3
CASH FLOW
Year Ended 31 Dec (S$m) FY08 FY09 FY10F FY11F KEY RATES & RATIOS FY08 FY09 FY10F FY11F
Op profit before working cap. chang 634.7 960.5 938.7 975.7 Earnings per share (S cents) 20.8 33.8 38.8 31.5
Working cap, taxes and int 1,375.7 -546.7 -499.2 -391.7 NTA per share (S cents) 63.6 90.7 114.3 134.7
Net cash from operations 1,916.9 413.7 439.5 583.9 Gross profit margin (%) 12.9 17.2 20.0 17.2
Purchase of PP&E -96.9 -67.0 -200.0 -200.0 Net profit margin (%) 8.9 13.2 16.3 13.7
Other investing flows 11.9 6.4 3.4 5.0 PER (x) 24.6 15.1 13.2 16.3
Investing cash flow -85.0 -60.6 -196.6 -195.0 Price/NTA (x) 8.1 5.6 4.5 3.8
Financing cash flow -518.4 -428.7 -45.8 -134.7 EV/EBITDA (x) 18.6 11.3 11.3 12.6Net cash flow 1,313.6 -75.5 197.1 254.2 Dividend yield (%) 2.1 2.9 2.1 2.1
Cash at beginning of year 740.5 2,054.0 1,978.5 2,175.6 ROE (%) 34.2 40.2 34.9 25.3
Cash at end of year 2,054.0 1,978.5 2,175.6 2,429.8 Net gearing (%) Net cash Net cash Net cash Net cash
Source: Company data, OIR estimates

8/7/2019 OCBC - S'pore Strategy-20101215
http://slidepdf.com/reader/full/ocbc-spore-strategy-20101215 74/82
Page 74 15 December 2010
Strategy Update
Maintain BUY with S$3.02 Fair Value
Earlier-than-expected recovery in margins. StarHub Ltd
recently posted a much better-than-expected set of 3Q10
results, with the biggest surprise coming from a sooner- and
stronger-than-expected recovery in margin; service EBITDA
margin recovered to around 32.3% for the quarter, compared
to 25.9% in 2Q10, and was almost back to the 33.4% level
seen in 3Q09, largely thanks to the absence of the BPL
(Barclays Premier League) broadcast cost and other premium
sports content. For 9M10, its service EBITDA margin is back
to around 26.9%, though off 9M09's 32.6%, StarHub is
confident it can achieve 28% for the full year.
Margin improvement likely to come from Pay TV. While
we expect StarHub to benefit from the modest growth in the
mobile market in 2011, buoyed by the expected increase in
tourist arrivals, more outbound travellers, and still-robust
economic growth in Singapore, we do not see much room for
further EBITDA margin improvements, as acquisition costs
may remain high (due to bigger subsidies for the increasingly
popular smartphones), while ARPUs may stay flat; this as
higher data usage may replace voice traffic. Instead, we expect
its Pay TV margins to improve further, as it will continue toenjoy lower content costs (at least in 1H11) with the absence
of the pricey BPL and other premium sports content; but Pay
TV revenues may stagnate. However, the new cross-carriage
mandate (expected to take effect in 1H11) may work in
StarHub's favour as it has more content to offer and "cross
sell" onto SingTel's mio TV network. In any case, we still see
content as being king and expect operators to continue bidding
for content albeit not as aggressively.
No significant NBN impact. Due to the slow rollout of NBN
(National Broadband Network) and the low take-up rate, we
do not expect to see any significant impact - benefits orincreased competition - on StarHub's broadband business.
However, declining ARPUs may continue to be a concern,
which suggests that margins may remain compressed. We
also see some uncertainty for Nucleus Connect (NC) - though
it is the official NBN OpCo, both SingTel and M1 are looking
to set up their own OpCos, which could complicate the
operational dynamics.
Maintain BUY with S$3.02 fair value. In any case, we have
taken these developments into our recent revision and hence
we maintain our DCF-based S$3.02 fair value. As we also
expect StarHub to continue paying out S$0.05/share quarterly
dividend in 2011, which translates to an attractive 7.4% annual
yield, we maintain our BUY rating.
StarHub Limited15 December 2010
Reuters Code STAR.SI
ISIN Code CC3
Bloomberg Code STH SP
Issued Capital (m) 1,715
Mkt Cap (S$m/US$m) 4,597 / 3,315
Major ShareholdersTemasek Hldg 57.2%
Free Float (%) 32.3%
Daily Vol 3-mth (‘000) 1,974
52 Wk Range 2.010 - 2.820
Carey Wong(65) 6531 9808e-mail: [email protected]
1000
1500
2000
2500
3000
3500
M a y - 0 8
A u g - 0 8
N o v - 0 8
F e b - 0 9
M a y - 0 9
A u g - 0 9
N o v - 0 9
F e b - 1 0
M a y - 1 0
A u g - 1 0 1.0
1.5
2.0
2.5
3.0
StarHub
STI
Maintain
BUYPrevious Rating: BUY
Closing price (10 Dec): S$2.68Fair Value : S$3.02
(S$ m) FY08 FY09 FY10F FY11F
Revenue 2,127.6 2,150.0 2,221.1 2343.3
EBITDA 644.4 653.5 598.8 697.5
P/NTA (x) -16.8 -15.9 -15.3 -21.6
EPS (cts) 18.3 18.7 15.8 20.0
PER (x) 14.7 14.4 17.0 13.4

8/7/2019 OCBC - S'pore Strategy-20101215
http://slidepdf.com/reader/full/ocbc-spore-strategy-20101215 75/82
Page 75 15 December 2010
Strategy Update
StarHub's Key Financial Data
EARNINGS FORECAST BALANCE SHEET
Year Ended 31 Dec (S$m) FY08 FY09 FY10F FY11F As of 31 Dec (S$m) FY08 FY09 FY10F FY11F
Revenue 2,127.6 2,150.0 2,221.1 2,343.3 Cash 128.3 234.2 241.9 266.3
EBITDA 644.4 653.5 598.8 697.5 Other Current Assets 281.2 292.3 327.3 340.5
Depreciation & amortisation -235.1 -245.1 -251.5 -264.3 Fixed Assets 845.7 785.1 830.4 870.7
Operating Profit 409.2 408.4 347.4 433.1 Other long term assets 406.1 421.0 452.7 452.7
Net interest -26.5 -23.3 -21.0 -20.5 Total Assets 1,661.2 1,732.6 1,852.3 1,930.2
Associates 0.0 0.0 0.0 0.0 Current Liabilities less Debt 577.6 635.1 734.8 745.1
Exceptionals 0.0 0.0 0.0 0.0 Debt 953.8 937.9 890.0 880.0
Pre-tax profit 382.7 385.1 326.4 412.6 Other Long Term Liabilities 61.9 75.9 140.0 130.1
Tax -71.5 -65.5 -55.5 -70.1 Shareholders Equity 108.0 125.8 137.5 224.9
Net Profit 311.3 319.6 270.9 342.4 Total Equity and Liabilities 1,661.2 1,732.6 1,852.3 1,930.2
CASH FLOW
Year Ended 31 Dec (S$m) FY08 FY09 FY10F FY11F KEY RATES & RATIOS FY08 FY09 FY10F FY11F
Operating Profit 382.8 385.1 326.4 412.6 EPS (S cents) 18.3 18.7 15.8 20.0
Working Capital Changes -55.7 32.6 24.2 51.7 Fully Diluted EPS (S cents) 18.2 18.6 15.7 19.9
Net Cash from Operations 569.9 668.8 611.8 664.8 PER (x) 14.7 14.4 17.0 13.4
Capex -219.8 -231.4 -318.7 -304.6 Price/NTA (x) -16.8 -15.9 -15.3 -21.6
Investing Cash flow -219.7 -230.7 -243.2 -374.7 EV/EBITDA (x) 8.4 8.0 8.7 7.4
Change in Equity 7.9 2.4 0.0 0.0 Dividend Yield (%) 6.7 7.1 7.5 7.5Net Debt Change -54.3 -17.9 -55.8 -10.0 ROIC (%) 30.5 31.3 27.7 32.5
Financing Cash Flow -359.9 -332.2 -360.8 -265.6 ROE (%) 288.1 254.1 197.1 152.2
Net Cash flow -9.7 105.9 7.7 24.5 Debt/EBITDA (x) 1.2 1.0 1.0 0.8
Ending Cash Balance 128.3 234.2 241.9 266.3 PE to Growth (x) -6.2 6.6 -1.1 0.5
Source: Company data, OIR estimates
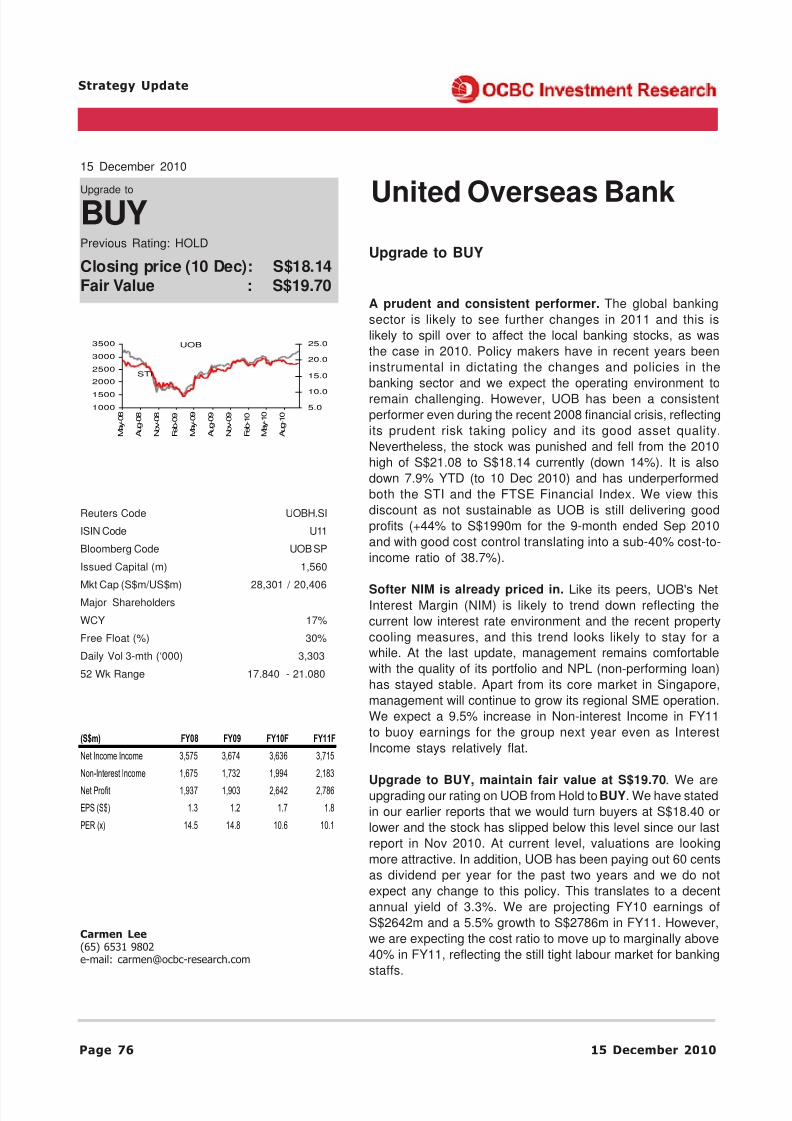
8/7/2019 OCBC - S'pore Strategy-20101215
http://slidepdf.com/reader/full/ocbc-spore-strategy-20101215 76/82
Page 76 15 December 2010
Strategy Update
Upgrade to BUY
A prudent and consistent performer. The global banking
sector is likely to see further changes in 2011 and this is
likely to spill over to affect the local banking stocks, as was
the case in 2010. Policy makers have in recent years been
instrumental in dictating the changes and policies in the
banking sector and we expect the operating environment to
remain challenging. However, UOB has been a consistent
performer even during the recent 2008 financial crisis, reflecting
its prudent risk taking policy and its good asset quality.
Nevertheless, the stock was punished and fell from the 2010
high of S$21.08 to S$18.14 currently (down 14%). It is also
down 7.9% YTD (to 10 Dec 2010) and has underperformed
both the STI and the FTSE Financial Index. We view this
discount as not sustainable as UOB is still delivering good
profits (+44% to S$1990m for the 9-month ended Sep 2010
and with good cost control translating into a sub-40% cost-to-
income ratio of 38.7%).
Softer NIM is already priced in. Like its peers, UOB's NetInterest Margin (NIM) is likely to trend down reflecting the
current low interest rate environment and the recent property
cooling measures, and this trend looks likely to stay for a
while. At the last update, management remains comfortable
with the quality of its portfolio and NPL (non-performing loan)
has stayed stable. Apart from its core market in Singapore,
management will continue to grow its regional SME operation.
We expect a 9.5% increase in Non-interest Income in FY11
to buoy earnings for the group next year even as Interest
Income stays relatively flat.
Upgrade to BUY, maintain fair value at S$19.70. We areupgrading our rating on UOB from Hold to BUY. We have stated
in our earlier reports that we would turn buyers at S$18.40 or
lower and the stock has slipped below this level since our last
report in Nov 2010. At current level, valuations are looking
more attractive. In addition, UOB has been paying out 60 cents
as dividend per year for the past two years and we do not
expect any change to this policy. This translates to a decent
annual yield of 3.3%. We are projecting FY10 earnings of
S$2642m and a 5.5% growth to S$2786m in FY11. However,
we are expecting the cost ratio to move up to marginally above
40% in FY11, reflecting the still tight labour market for banking
staffs.
United Overseas Bank
15 December 2010
Upgrade to
BUYPrevious Rating: HOLD
Closing price (10 Dec): S$18.14Fair Value : S$19.70
Reuters Code UOBH.SI
ISIN Code U11
Bloomberg Code UOB SP
Issued Capital (m) 1,560
Mkt Cap (S$m/US$m) 28,301 / 20,406Major Shareholders
WCY 17%
Free Float (%) 30%
Daily Vol 3-mth (‘000) 3,303
52 Wk Range 17.840 - 21.080
Carmen Lee(65) 6531 9802e-mail: [email protected]
1000
1500
2000
2500
3000
3500
M a y - 0 8
A u g - 0 8
N o v - 0 8
F e b - 0 9
M a y - 0 9
A u g - 0 9
N o v - 0 9
F e b - 1 0
M a y - 1 0
A u g - 1 0
5.0
10.0
15.0
20.0
25.0UOB
STI
(S$m) FY08 FY09 FY10F FY11F
Net Income Income 3,575 3,674 3,636 3,715
Non-Interest Income 1,675 1,732 1,994 2,183
Net Profit 1,937 1,903 2,642 2,786
EPS (S$) 1.3 1.2 1.7 1.8
PER (x) 14.5 14.8 10.6 10.1

8/7/2019 OCBC - S'pore Strategy-20101215
http://slidepdf.com/reader/full/ocbc-spore-strategy-20101215 77/82
Page 77 15 December 2010
Strategy Update
UOB's Key Financial Data
EARNINGS FORECASTYear Ended 31 Dec (S$m) FY08 FY09 FY10F FY11F BALANCE SHEETAs at 31 Dec (S$m) FY08 FY09 FY10F
Interest Income 6,855 5,159 5,038 5,167 Share capital 4,045 4,051 4,468
Interest Expense 3,280 1,485 1,402 1,452 Revenue & other reserves 11,528 14,935 16,648
Net Interest Income 3,575 3,674 3,636 3,715 Shareholders' fund 15,719 19,155 21,348
Non-interest Income 1675 1732 1994 2183 Deposits and other accounts 146,623 149,253 163,657
Fee & Com Income 1095 976 1142 1269 Other liabilities 12,805 9,688 10,366
Staff Costs -1082 -1116 -1237 -1345 Total liabilities 167,222 166,423 182,061
Other Operating Expenses -968 -959 -1000 -1050 Cash and balances 20,290 18,865 22,544
Impairment -807 -1121 -345 -250 Loans & advances 99,840 99,201 108,129
Pretax profits 2485 2307 3164 3374 Other assets 13,091 8,994 9,309
Net profits 1937 1903 2642 2786 Total assets 182,941 185,578 203,409
CASH FLOW
Year Ended 31 Dec (S$m)FY08 FY09 FY10F FY11F Key RATES & RATIOS FY08 FY09 FY10F
Pretax profits 3200 3331 3392 3502 EPS (S$) 1.3 1.2 1.7
Depreciation 134 138 138 138 NAV per share (S$) 8.8 11.0 11.9
Others -163 -32 -58 -58 Net interest income growth (%) 20.0 2.8 -1.0
Changes in working capital 2512 7609 6099 4103 Non-interest income growth (%) -11.5 3.4 15.1
Net cash from operating activities 1597 7186 5599 3539 Interest Inc / Total Inc (%) 68.1 68.0 64.6
Net cash in investing activities 411 1665 -652 -985 Cost-to-income (%) 39.0 38.4 39.7Cash flow from financing activities -275 -1217 -482 -1038 PER (x) 14.5 14.8 10.6
Change in cash 1,317 7,757 4,364 1,417 Price/NAV (x) 2.1 1.7 1.5
Beg cash 30,283 31,600 39,357 43,721 Dividend yield (%) 3.3 3.3 3.3
Cash at end of year 31,600 39,357 43,721 45,138 ROE (%) 11.8 11.0 13.2
Source: Company data, OIR estimates

8/7/2019 OCBC - S'pore Strategy-20101215
http://slidepdf.com/reader/full/ocbc-spore-strategy-20101215 78/82
Page 78 15 December 2010
Strategy Update
New launch does well. UOL Group launched its freeholdSpottiswoode Residences project last month. The 351-unitsin the 36-storey development comprise primarily of one- tothree-bedrooms of between 592 square feet to 1421 sf.According to the Business Times , some 252 units have alreadybeen sold (72% project take-up) at prices ranging from S$1,720per sf to S$2,270 psf.
GLS an opportunity. The Spottiswoode site was the lastremaining site in UOL's outstanding Singapore land-bank, butUOL has had the financial flexibility (in our opinion) to wait outthe market and replenish its land bank at disciplined pricelevels. This strategy has proven true with recent tendersseeing less "frothy" bids as developers keep policy risks inmind - which have already manifested to some extent throughthe significant new supply being released in the market. TheGLS 1H2011 sites, which will yield ~14,300 new homes, thuspresent UOL with an opportunity to carefully pick and choosefuture projects. At the same time, UOL has been expandingits presence abroad through a recent land parcel purchase in
China.
Further policy measures likely. We note that the propertymarket has continued to perform well even after the Aug 30property measures. With sustained conditions of high liquidityand cheap debt, we believe it is very likely that policymakerswill implement further measures to regulate the residentialmarket in 1H2011. We think increasing policy risk is offset byUOL's strong financials, while UOL's commercial andhospitality portfolio should provide a counterweight to anyweakness in the residential segment. We also note that UOL'srevenue should be supported in future quarters by previoussuccessful launches, including the 616-unit Waterbank at
Dakota and the 172-unit Terrene at Bukit Timah (50% stake)launched earlier this year.
UOL top pick for 2011. We prefer developers with strongbalance sheets and those with balanced exposure to theproperty sector, which should buttress earnings andperformance in a year of fairly high uncertainty for residentialproperty. Keeping these factors in mind, UOL is our top pickfor the property sector in 2011. UOL is firing on all cylindersand earnings should be underpinned, in our view, by: 1)progressive revenue recognition on various residential projects;2) the continued strength of the tourism sector; and 3) the stillvibrant retail sector and an improving Singapore office sector.
Maintain BUY with unchanged S$5.42 fair value estimate, ata 10% discount to RNAV.
Top pick for 2011
UOL Group Limited15 December 2010
Reuters Code UTOS.SI
ISIN Code U14
Bloomberg Code UOL SP
Issued Capital (m) 778
Mkt Cap (S$m / US$m) 3,639 / 2,624
Major ShareholdersWee Cho Yaw 29.1%
Free Float (%) 51.0%
Daily Vol 3-mth (‘000) 922
52 Wk Range 3.410 - 4.840
Meenal Kumar(65) 6531 9112e-mail: [email protected]
Maintain
BUYPrevious Rating: BUY
Closing price (10 Dec): S$4.68Fair Value : S$5.42
1000
1500
2000
2500
3000
3500
4000
J a n - 0 8
A p r - 0 8
J u l - 0 8
O c t - 0 8
J a n - 0 9
A p r - 0 9
J u l - 0 9
O c t - 0 9
J a n - 1 0
A p r - 1 0
J u l - 1 0
O c t - 1 0
0.51.0
1.52.02.5
3.03.54.0
4.55.0
UOL
STI
(S$m) FY08 FY09 FY10F FY11F
Revenue 899.2 1,007.1 1,164.2 1,169.4
Shareholders' profit 147.2 424.2 490.2 383.6
NAV per share (S-cents) 426.4 529.4 553.0 603.3
P/NAV (x) 1.1 0.9 0.8 0.8PER (x) 25.3 8.7 7.5 9.6

8/7/2019 OCBC - S'pore Strategy-20101215
http://slidepdf.com/reader/full/ocbc-spore-strategy-20101215 79/82
Page 79 15 December 2010
Strategy Update
UOL's Key Financial Data
EARNINGS FORECAST BALANCE SHEET
Year Ended 31 Dec (S$m) FY08 FY09 FY10F FY11F As at 31 Dec (S$m) FY08 FY09 FY10F FY11F
Revenue 899.2 1,007.1 1,164.2 1,169.4 Cash and bank balances 263.9 281.5 304.7 341.7
Cost of sales -447.1 -554.6 -635.6 -638.2 Investment properties 2,202.3 2,027.5 2,067.5 2,107.5
Gross profit 452.0 452.5 528.5 531.2 Development properties 1,274.7 1,562.7 1,437.3 1,433.0
Operating expenses -177.3 -190.4 -167.7 -160.9 Total assets 6,093.6 7,328.0 7,319.5 7,569.0
Share of profit of assoc 64.6 88.3 203.8 87.7 Debt 1,555.5 1,936.5 1,617.1 1,396.8
Profit before other gains and tax 354.2 363.8 574.4 467.9 Current liabilities excluding debt 187.7 219.8 305.1 308.7
Fair value gain on properties -106.8 -147.6 24.8 0.0 Total liabilities 2,278.4 2,720.1 2,473.4 2,281.5
Profit before tax 210.4 493.5 604.4 467.9 Shareholders equity 3,394.7 4,148.2 4,332.7 4,727.3
Profit for the period 164.2 461.5 544.0 430.4 Total equity 3,815.2 4,607.9 4,846.1 5,287.6
Shareholders' profit 147.2 424.2 490.2 383.6 Total equity and liabilities 6,093.6 7,328.0 7,319.5 7,569.0
CASH FLOW
Year Ended 31 Dec (S$m) FY08 FY09 FY10F FY11F KEY RATES & RATIOS FY08 FY09 FY10F FY11F
Net profit 164.2 461.5 544.0 430.4 EPS (S-cents) 18.5 53.7 62.6 49.0
Adjustments 102.0 -117.4 -92.8 8.4 NAV per share (S-cents) 426.4 529.4 553.0 603.3
Change in Working Capital -272.4 -465.0 -246.9 20.6 PER (x) 25.3 8.7 7.5 9.6
Operating cash flow -270.3 68.6 411.4 396.1 P/NAV (x) 1.1 0.9 0.8 0.8
Investing cash flow -270.9 -257.9 26.0 -40.0 Gross profit margin (%) 50.3 44.9 45.4 45.4
Dividends paid -119.4 -59.7 -78.4 -78.4 Net profit margin (%) 18.3 45.8 46.7 36.8
Financing cash flow 399.4 206.9 -414.1 -319.2 Net gearing (%) 40.4 41.3 32.2 24.7Net change in cash -141.8 17.6 23.2 37.0 Dividend yield (%) 1.6 2.1 2.1 2.1
Cash at beginning of period 405.7 263.9 281.5 304.7 ROE (%) 4.3 10.2 11.3 8.1
Cash at end of period 263.9 281.5 304.7 341.7 ROA (%) 2.7 6.3 7.4 5.7
Source: Company data, OIR estimates

8/7/2019 OCBC - S'pore Strategy-20101215
http://slidepdf.com/reader/full/ocbc-spore-strategy-20101215 80/82
Page 80 15 December 2010
Strategy Update
Transforming into a solutions provider
Near-term outlook remains cautiously upbeat. After
recently posting a fairly decent set of 3Q10 results, Venture
Corp (VMS) expects to see sequential revenue growth going
into its seasonally strong quarter, noting most of its customers
have maintained their positive sentiment; although a few have
exercised caution in their demand commitments, probably still
due to continued shortage for certain components (mainly for
interface I/Cs, capacitors and switchers). On its part, VMS
has stocked up some excess inventory with the blessing fromcustomers, which we believe accounts for its slightly more
upbeat outlook.
Medium-term outlook looks good. In the medium term, VMS
says it remains driven to achieving profitable growth, where
VMS will continue to make a push for higher-margin ODM
(Original Design Manufacturer) business as it reduces its
traditional heavy reliance on the Printing & Imaging OEM
(Original Equipment Manufacturer) business. VMS also intends
to build up its solutions/enterprise segment with its own IPs
(Intellectual Properties). VMS reveals that it is making good
progress and has new projects/products in the pipeline. In
fact, some of its new products have started to see growingcommercial success.
MineTracer is just the start. One particular product which
we think is worth highlighting is the MineTracer - an integrated
wireless communication and tracking system for use in coal
mines. We believe that regulators and mine owners will place
a greater emphasis on safety, especially after a series of high-
profile mining incidents in Chile and New Zealand recently.
The product - approved by US Mine Safety & Health
Administration (MSHA) - is already installed in mines in West
Virginia, Kentucky, Pennsylvania, Illinois and Alabama; and
by working with experienced installers to market the product,we understand that VMS is looking to expand the use of this
safety system into non-coal mines like gold etc in the US,
South Africa and Australia.
Maintain BUY with new S$12.10 fair value. Besides being
encouraged by the group's business transformation into an
ODM player, which we believe should herald a new era for the
group, we also have confidence in its ability to execute and
deliver on its "blue ocean strategy". As we are rolling forward
our 15x valuation from blended FY10F/FY11F EPS to FY11F
EPS, our fair value increases from S$10.73 to S$12.10.
Maintain BUY. Key risks include currency fluctuations
(exposure to US$) and continued component shortages.
Venture Corp
15 December 2010
Maintain
BUYPrevious Rating: BUY
Closing price (10 Dec): S$9.16Fair Value : S$12.10
Reuters Code VENM.SI
ISIN Code V03
Bloomberg Code VMS SP
Issued Capital (m) 274
Mkt Cap (S$m/US$m) 2,526 / 1,821
Major Shareholders
Aberdeen Asset Mgmt 15.1%
Free Float (%) 68.0%
Daily Vol 3-mth (‘000) 451
52 Wk Range 8.310 - 9.970
Carey Wong(65) 6531 9808e-mail: [email protected]
1000
1500
2000
2500
3000
3500
M a y - 0 8
A u g - 0 8
N o v - 0 8
F e b - 0 9
M a y - 0 9
A u g - 0 9
N o v - 0 9
F e b - 1 0
M a y - 1 0
A u g - 1 0
2.0
5.0
8.0
11.0
Venture
Corp
STI
(S$ m) FY08 FY09 FY10F FY11F
Revenue 3,784.1 3,412.5 2,770.9 2,968.7
EBITDA 341.1 215.9 243.8 267.2
EPS (cts) 60.8 52.3 68.5 80.6
PER (x) 14.9 17.4 13.3 11.3
P/NTA (x) 1.4 1.4 1.4 1.3
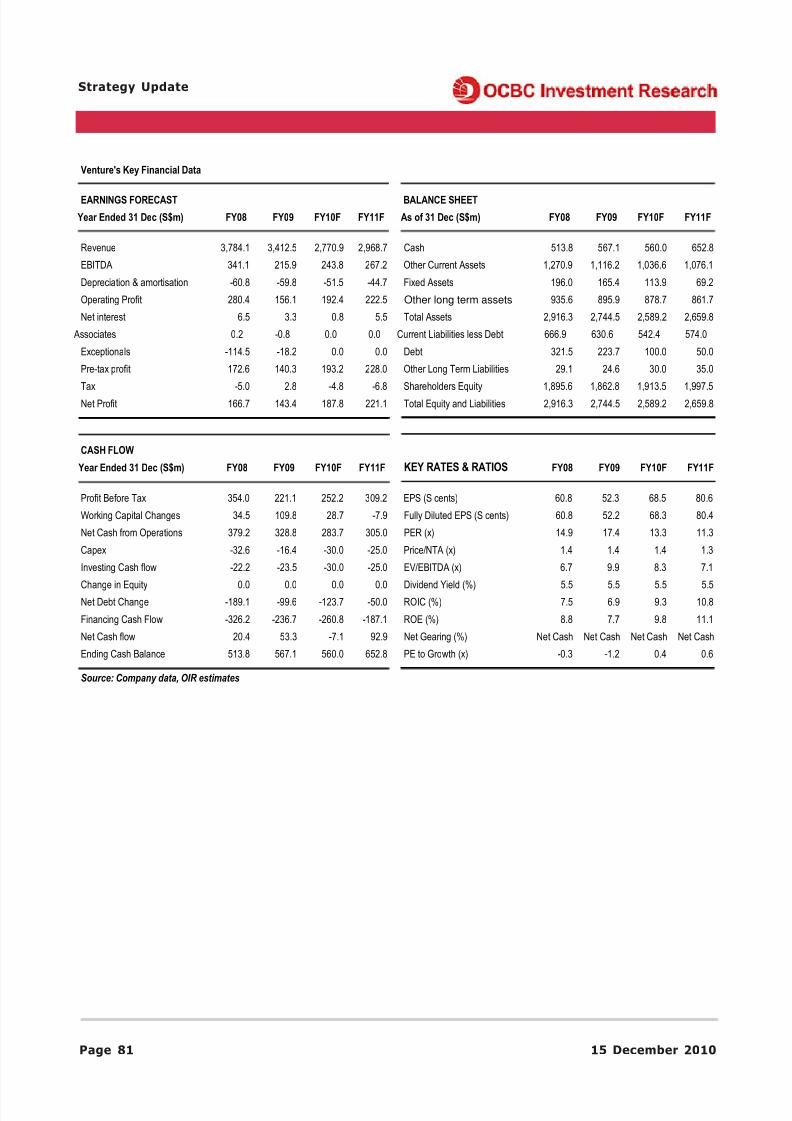
8/7/2019 OCBC - S'pore Strategy-20101215
http://slidepdf.com/reader/full/ocbc-spore-strategy-20101215 81/82
Page 81 15 December 2010
Strategy Update
Venture's Key Financial Data
EARNINGS FORECAST BALANCE SHEET
Year Ended 31 Dec (S$m) FY08 FY09 FY10F FY11F As of 31 Dec (S$m) FY08 FY09 FY10F FY11F
Revenue 3,784.1 3,412.5 2,770.9 2,968.7 Cash 513.8 567.1 560.0 652.8
EBITDA 341.1 215.9 243.8 267.2 Other Current Assets 1,270.9 1,116.2 1,036.6 1,076.1
Depreciation & amortisation -60.8 -59.8 -51.5 -44.7 Fixed Assets 196.0 165.4 113.9 69.2
Operating Profit 280.4 156.1 192.4 222.5 Other long term assets 935.6 895.9 878.7 861.7
Net interest 6.5 3.3 0.8 5.5 Total Assets 2,916.3 2,744.5 2,589.2 2,659.8
Associates 0.2 -0.8 0.0 0.0 Current Liabilities less Debt 666.9 630.6 542.4 574.0
Exceptionals -114.5 -18.2 0.0 0.0 Debt 321.5 223.7 100.0 50.0
Pre-tax profit 172.6 140.3 193.2 228.0 Other Long Term Liabilities 29.1 24.6 30.0 35.0
Tax -5.0 2.8 -4.8 -6.8 Shareholders Equity 1,895.6 1,862.8 1,913.5 1,997.5
Net Profit 166.7 143.4 187.8 221.1 Total Equity and Liabilities 2,916.3 2,744.5 2,589.2 2,659.8
CASH FLOW
Year Ended 31 Dec (S$m) FY08 FY09 FY10F FY11F KEY RATES & RATIOS FY08 FY09 FY10F FY11F
Profit Before Tax 354.0 221.1 252.2 309.2 EPS (S cents) 60.8 52.3 68.5 80.6
Working Capital Changes 34.5 109.8 28.7 -7.9 Fully Diluted EPS (S cents) 60.8 52.2 68.3 80.4
Net Cash from Operations 379.2 328.8 283.7 305.0 PER (x) 14.9 17.4 13.3 11.3
Capex -32.6 -16.4 -30.0 -25.0 Price/NTA (x) 1.4 1.4 1.4 1.3
Investing Cash flow -22.2 -23.5 -30.0 -25.0 EV/EBITDA (x) 6.7 9.9 8.3 7.1
Change in Equity 0.0 0.0 0.0 0.0 Dividend Yield (%) 5.5 5.5 5.5 5.5Net Debt Change -189.1 -99.6 -123.7 -50.0 ROIC (%) 7.5 6.9 9.3 10.8
Financing Cash Flow -326.2 -236.7 -260.8 -187.1 ROE (%) 8.8 7.7 9.8 11.1
Net Cash flow 20.4 53.3 -7.1 92.9 Net Gearing (%) Net Cash Net Cash Net Cash Net Cash
Ending Cash Balance 513.8 567.1 560.0 652.8 PE to Growth (x) -0.3 -1.2 0.4 0.6
Source: Company data, OIR estimates

8/7/2019 OCBC - S'pore Strategy-20101215
http://slidepdf.com/reader/full/ocbc-spore-strategy-20101215 82/82
Strategy Update
SHAREHOLDING DECLARATION: The analyst/analysts who wrote this report holds NIL shares in the above securities, except:
- Carey Wong holds shares in Hyflux Ltd.- Low Pei Han’s immediate family holds shares in Keppel Corporation Ltd and SembCorp Marine Ltd
RATINGS AND RECOMMENDATIONS: OCBC Investment Research’s (OIR) technical comments and recommendations are short-term and trading oriented.- However, OIR’s fundamental views and ratings (Buy, Hold, Sell) are medium-term calls within a 12-month investment horizon. OIR’s Buy = More than 10% upside from the current price; Hold = Trade within +/-10% from the current price; Sell = More than 10% downside from the current price.- For companies with less than S$150m market capitalization, OIR’s Buy = More than 30% upside from the current price; Hold = Trade within +/- 30% from the current price; Sell = More than 30% downside from the current price.
DISCLAIMER FOR RESEARCH REPORT This report is solely for information and general circulation only and may not be published, circulated,reproduced or distributed in whole or in part to any other person without our written consent. This report should not be construed as an offer or solicitation for the subscription, purchase or sale of the securities mentioned herein. Whilst we have taken all reasonable care to ensure that the information contained in this
publication is not untrue or misleading at the time of publication, we cannot guarantee its accuracy or completeness, and you should not act on it without first independently verifying its contents. Any opinion or estimate contained in this report is subject to change without notice. We have not given any consideration to and we have not made any investigation of the investment objectives, financial situation or particular needs of the recipient or any class of persons, and accordingly, no warranty whatsoever is given and no liability whatsoever is accepted for any loss arising whether directly or indirectly as a result of the recipient or any class of persons acting on such information or opinion or estimate. You may wish to seek advice from a financial adviser regarding the suitability of the securities mentioned herein, taking into consideration your investment objectives, financial situation or particular needs, before making a commitment to invest in the securities. OCBC Investment Research Pte Ltd, OCBC Securities Pte Ltd and their respective connected and associated corporations together with their respective directors and officers may have or take positions in the securities mentioned in this report and may also perform or seek to perform broking and other investment or securities related services for the corporations whose securities are mentioned in this report as well as other parties generally.
Privileged/Confidential information may be contained in this message. If you are not the addressee indicated
in this message (or responsible for delivery of this message to such person), you may not copy or deliver this message to anyone. Opinions, conclusions and other information in this message that do not relate to the official business of my company shall not be understood as neither given nor endorsed by it.