Embed Size (px)
Citation preview

J. Fluid Mech. (1989), vol. 206, pp. 579--627
Printed in Great Britain
Oblique and parallel modes of vortex shedding in the wake of a circular cylinder at
low Reynolds numbers
By C. H. K. WILLIAMSONt Graduate Aeronautical Laboratories, California Institue of Technology,
Pasadena, CA 91125, USA
(Received 30 September 1988 and in revised form 19 February 1989)
579
Two fundamental characteristics of the low-Reynolds-number cylinder wake, which have involved considerable debate, are first the existence of discontinuities in the Strouhal-Reynolds number relationship, and secondly the phenomenon of oblique vortex shedding. The present paper shows that both of these characteristics of the wake are directly related to each other, and that both are influenced by the boundary conditions at the ends of the cylinder, even for spans of hundreds of diameters in length. It is found that a Strouhal discontinuity exists, which is not due to any of the previously proposed mechanisms, but instead is caused by a transition from one oblique shedding mode to another oblique mode. This transition is explained by a change from one mode where the central flow over the span matches the end boundary conditions to one where the central flow is unable to match the end conditions. In the latter case, quasi-periodic spectra of the velocity fluctuations appear; these are due to the presence of span wise cells of different frequency. During periods when vortices in neighbouring cells move out of phase with each other, 'vortex dislocations' are observed, and are associated with rather complex vortex linking between the cells. However, by manipulating the end boundary conditions, parallel shedding can be induced, which then results in a completely continuous Strouhal curve. It is also universal in the sense that the oblique-shedding Strouhal data (S11) can be collapsed onto the parallel-shedding Strouhal curve (S0) by the transformation, S0 = S 11 jcos (), where () is the angle of oblique shedding. Close agreement between measurements in two distinctly different facilities confirms the continuous and universal nature of this Strouhal curve. It is believed that the case of parallel shedding represents truly two-dimensional shedding, and a comparison of Strouhal frequency data is made with several two-dimensional numerical simulations, yielding a large disparity which is not clearly understood. The oblique and parallel modes of vortex shedding are both intrinsic to the flow over a cylinder, and are simply solutions to different problems, because the boundary conditions are different in each case.
1. Introduction The problem of the wake formation behind bluff bodies has received a great deal
of attention, both from an experimental standpoint and more recently from a theoretical/numerical standpoint. Nevertheless, even at low Reynolds numbers
t Address from December 1989: Dept. of Mechanical and Aerospace Engineering, Cornell University, Ithaca, NY 14853, USA.

580 C. H. K. Williamson
when the shed vortices remain laminar, there are some rather basic questions that are not understood.
Since the first extensive measurements of vortex shedding frequencies by Roshko (1954), there has been remarkably little agreement between the many published curves of Strouhal number (S) versus Reynolds numbers (Re) for the laminar shedding regime (between Reynolds numbers of 49 to 178 in the present study). Indeed published results have been found to differ by almost 20%. It is clear that, even though the measurement of the wake frequencies is a simple matter, the frequency itself is highly sensitive to the experimental arrangement and, as will be found here, it is particularly sensitive to three"dimensional effects. A further characteristic of the low-Reynolds-number flow around cylinders, which is not well understood, is the presence of oblique vortex shedding, whereby the axes of the vortices are shed at some angle to the cylinder axis. Although this oblique shedding phenomenon has been noted by several authors, no investigation has been carried out to understand its origin. In the present paper, both of the above features of the flow around a circular cylinder are investigated.
The measurement of vortex shedding frequency has been the subject of considerable debate since the observation by Tritton (1959) that his Strouhal curve (i.e. his plot of Strouhal number versus Reynolds number) was discontinuous. He found two Strouhal curves, one of them corresponding to a 'high-speed' mode above Re = 100, with a jump to a curve corresponding to a 'low-speed' mode below Re = 100. Tritton suggested that this 'Strouhal discontinuity' was caused by a transition from an instability originating in the wake to an instability originating in the immediate vicinity of the cylinder, as the Reynolds numbers are increased. His discovery of a discontinuity in the Strouhal curve has led to a number of different explanations since that time, and to much discussion over whether the discontinuity is an intrinsic, 'fluid-mechanic' phenomenon, irrespective of the experimental set-up.
A further explanation was put forward by Gaster (1969). He observed irregular modulations of the velocity signal in the wakes of slender cones, which were caused by the presence of spanwise cells of different frequency. Based on the similarity with Tritton's velocity signals, Gaster suggested that Tritton's breakdown of regular shedding could possibly be caused by the existence of some non-uniformity of the flow. Tritton (1971) then repeated his experiments in a different wind tunnel and again observed a Strouhal discontinuity (in this case near Re :::::::: 110). Still further experiments by Gaster ( 1971) provided stronger support for his original suggestion that the Strouhal discontinuity was caused by free-stream non-uniformities. By forcing the flow to be non-uniform across the cylinder span, he induced spanwise cells of different frequency to occur. Measurements of shedding frequency versus tunnel speed at a single point demonstrated a discontinuity under these conditions, because the frequency cells were found to move along the span as the speed was varied. However, the discontinuity was made to disappear when small end-plate disks were placed 70 diameters apart along the span, and it was suggested that these endplates limited the span wise movement of the frequency cells. In recent support of Gaster's suggestions, Mathis, Provansal & Boyer (1984) also proposed that the Strouhal discontinuity is caused by flow non-uniformity.
Berger & Wille (1972), on the other hand, believed that two intrinsic modes of shedding exist, as put forward by Tritton, and that the choice of which mode occurs at a given Reynolds number could be dictated by the level of turbulence in the free stream. Further discontinuities were observed by Kohan & Schwarz (1973) and Friehe (1980), who found Strouhal discontinuities within the range of Re from 70 to 110 for several different cylinders. These investigations confirmed that a Strouhal

Vortex shedding in the wake of a circular cylinder 581
discontinuity (much like Tritton's result) can exist in other experimental set-ups, although its cause remained a question.
An alternative view was taken by Gerrard (1978) who suggested that his Strouhal discontinuity at Re ~ 100 was in some way related to the end of a regime of Reynolds number in which diffusion of vorticity plays a primary role in the vortex shedding.
More recently, Sreenivasan (1985) interpreted his several Strouhal discontinuities as being involved in the 'route to chaos' in the cylinder wake. Upon investigating velocity spectra as Reynolds numbers were increased in the laminar regime, he found narrow ranges of Re in which 'chaos' was observed, and these were sandwiched between regions of 'order', (with both of these states characterised by the velocity spectra). These were interpreted as the initial stages in the transition to turbulence. These results are further briefly discussed, in the light of the present work, in § 7.
Subsequently, Van Atta & Gharib (1987) showed convincingly how some discontinuities, which might be observed in a plot of Strouhal number versus Reynolds number, can be related to vibrations of the cylinder itself. To show this clearly they monitored cylinder vibrations using a photodetector, and also demonstrated, by damping the cylinder supports, that several Strouhal discontinuities (which occurred at multiples of a fundamental frequency) could be smoothed out. They suggested that 'if there were absolutely no vibration, a Strouhal-Reynolds number plot would have absolutely no discontinuities'. A particularly significant aspect of their work was this suggestion that indeed there might exist a continuous S-Re relationship.
In a further paper, VanAtta, Gharib & Hammache (1988) investigated the wake of a vibrating wire, and found that the wake velocity spectra were influenced by the interaction between the vibrating wire frequency (near the antinodes) and the natural shedding frequency (near the nodes). This interaction was found to cause both quasi-periodic spectra, and also spectra with a 'chaotic' appearance, dependent on the spanwise position, and these results demonstrate further the importance of body vibration in determining the character of the wake.
Following the result of Van Atta & Gharib (1987), some two-dimensional numerical simulations by Karniadakis & Triantafyllou (1989) also have relevance to the present question. They demonstrated that their Strouhal number varies continuously with Reynolds number over a range of Re from 40 to 250, and they found no evidence of chaotic behaviour of the velocity fluctuations in the wake (as had been described by Sreenivasan). In this respect, it was supposed that their simulations supported the conclusions of Van Atta & Gharib that the asymptotic state in unforced laminar wakes (for example, the cylinder not vibrating) is periodic. Their conclusion seems reasonable provided that the flow is, in fact, two-dimensional. However, in an experiment a cylinder must be of finite length and therefore will always encounter certain end conditions. As will be seen later, it is for this reason that the flow can be three-dimensional even in a uniform free stream, and it may then be possible for the laminar wake fluctuations to be quasi-periodic, without the presence of external forcing.
Out of the several explanations for the existence of discontinuities, the suggestions that flow non-uniformity (or shear) and flow-induced vibration can cause jumps in the frequency curve are consistent with the results of several other studies. Jfor example, the work ofMaull & Young (1973) demonstrated the presence ofspanwise cells of different frequency when a cylinder is placed in a shear flow. Some spanwise movement of these cell boundaries, as the overall flow speed is varied, would result in discontinuous changes in measured frequency at a point. Also, it is well established that cylinder vibrations can 'lock-in' (synchronize) with the shedding frequency (to

582 C. H. K. Williamson
one or more of its natural frequencies) and cause jump changes in the shedding frequency as the flow speed is varied, (see for example the review by Bearman 1984). However, an important question that remains is whether a discontinuity in the frequency curve can still occur even if cylinder vibrations or flow non-uniformity are not involved. This is one of the central questions in the present paper.
A further feature of laminar vortex shedding that is relevant to the question of Strouhal discontinuities is the observation that vortices can shed at oblique angles to the cylinder. No systematic measurements of oblique shedding angles have previously been made, although typical angles of 10° to 20° have been quoted. From a theoretical standpoint, linear stability analysis of wake-type profiles (with in viscid parallel flow) can be used to show that two-dimensional disturbances have a greater temporal growth rate than oblique disturbances. This can be demonstrated in a simple manner using Squire's transformation (Squire 1933). Also, a recent study by Monkewitz (1988) of the 'absolute' instability of a limited number of wake-type profiles has shown, in all the investigated cases, that the two-dimensional disturbances were the most unstable, i.e. that we should expect to see twodimensional or parallel shedding, 'yielding no clue as to why oblique vortex shedding is often observed'.
In the case of experiment, there are some conflicting results for the oblique angles at which vortices are shed. The observation of parallel shedding, in a towing tank, by Hama (1957) contrasts with observations of oblique shedding, made in a wind tunnel, by Berger (1964). Berger & Wille (1972) later suggested that the low turbulence level in a towing tank enables parallel shedding to occur, whereas the higher turbulence levels expected in a wind tunnel somehow causes the oblique shedding. They also pointed out that end effects could be important.
With relevance to this question, a detailed investigation by Ramberg (1983) on the wake of a yawed cylinder (a cylinder whose axis is not perpendicular to the free stream), indicated that the flow was sensitive to the end conditions. He showed that changing the angle of the endplates of his yawed cylinder could influence the shedding angle and base pressure near the ends. He further observed an interdependence between the shedding frequency and the shedding angle. The results to be shown in the present study are in accordance with both of the above conclusions.
It was found in further studies by Gerich & Eckelmann (1983) and Gerich (1986), using a wind tunnel, that cells of low frequency exist near the ends of a cylinder, extending over spans of around 10 diameters. For large length-to-diameter ratios (L/D), the flow in the central region of the span (outside of the end cells) was assumed to be 'unaffected' by the ends, but when L / D was reduced to around 30, the end cells merged, causing a single low frequency of shedding over the whole span. An earlier investigation in a towing tank, by Slaouti & Gerrard (1981), showed that the wake structure could be influenced by the end conditions, and they concluded that slantwise (oblique) shedding was only observed when conditions at one end were more 'dominant' than the other. However, their results were from observations using a cylinder with LjD ~ 25-30, which is within the range where Gerich & Eckelmann showed that the end cells cover the whole span. The question therefore remains as to whether the flow outside of the end cells, for larger LjD, is indeed 'unaffected' by the end conditions.
It is clear that there are differences in the measurements of frequency and discontinuities between one experiment and another, and it is also evident that there are differences in the shedding angles between experiments. It might then be

Vortex shedding in the wake of a circular cylinder 583
suggested that these characteristics of the flow are related to each other. The present paper will show that there is a direct relation between the frequency measurements and the phenomenon of oblique vortex shedding, and also that both are influenced by the conditions at the ends of the cylinder. One of the fundamental results of the present work is that, even for large spans, the end boundary conditions (or end cells) are able to affect the flow over the whole span, even outside of the end cells. It is also found that the presence of oblique shedding does not require a difference in the two end conditions.
The present paper originated from some other .work for which a simple and rapid measurement of the Strouhal frequencies in the laminar regime was anticipated. It was very soon found that the flow around the cylinder was sensitive to a number of features of the experimental arrangement. A great deal of care was taken to dampen (and monitor) any cylinder vibration, and to check the flow uniformity and turbulence level of a small wind tunnel in which the cylinder was placed. Despite these efforts, it became apparent that a Strouhal discontinuity near Re = 64 remained. Not only was this discontinuity repeatable on several occasions (even after an earthquake had broken the original cylinder and hot wire), but three cylinders of different diameters all produced a similar discontinuity at the same Reynolds number. It was because of these observations that the present study was carried out.
In a recent letter (Williamson 1988a), some preliminary results from the present study were outlined. In particular, a link between the Strouhal discontinuity and a transition between two oblique vortex shedding modes was made. It was further shown that, by manipulating the end conditions to cause parallel shedding, a single continuous Strouhal curve could be found. In the present paper, the preliminary results mentioned above are included with many further results in detail, to present a comprehensive picture of the laminar vortex shedding modes behind a cylinder at low Reynolds numbers.
During the course of the present research, it was learned that H. Eisenlohr and H. Eckelmann (1988, private communication) were undertaking a similar line of research, which has since appeared (Eisenlohr & Eckelman 1989). They recognized, as found in the present paper, that the phenomenon of oblique shedding was influenced by the end conditions for long cylinders. They also showed that parallel shedding could be induced by a suitable change of end conditions. Their results are referred to further in this paper, and it is found that there is substantial agreement between their results and some of the present work (and also with Williamson 1988a).
In § 3.1 evidence is presented to show that the Strouhal discontinuity is not caused by cylinder vibrations. Further investigation shows that the discontinuity is not due to any of the many previously proposed mechanisms. Instead, measurements and observations discussed in §3.2 show the cause of the discontinuity as being a transition from one mode of oblique vortex shedding to another oblique mode. One of the modes (at the lower Reynolds numbers) corresponds with the presence of spanwise cells of different frequency. These cells should not be confused with the small low-frequency cells found close to the ends of the cylinder that were investigated by Gerich & Eckelmann, and which were also found in the present study at all values of the Reynolds number where vortex shedding occurred. The physical mechanisms for the oblique modes of shedding, and also for an induced parallel mode, are discussed in § 3.3. Each mode is caused by a 'matching' of the flow over the whole span with the end boundary conditions, and it is by adjusting the end conditions that parallel shedding can be induced to occur. In §4 a new parallel-

584 C. H. K. Williamson
shedding Strouhal curve is defined which is completely continuous. It is also possible to transform the oblique-shedding Strouhal curves onto the continuous parallelshedding curve, using the measured oblique angles of shedding. In §5 it is shown that Tritton's Strouhal discontinuity is consistent with the one found here, and also an explanation for the cause of the discontinuity is put forward. It is in essence, a breakdown in the 'matching' between the end boundary conditions and the flow over the rest of the span. In the case of the oblique vortex shedding, it is found that 'vortex dislocations' occur between the span wise cells (at a beating frequency) when the vortices of each cell are periodically out of phase; and these are described in §6. A discussion and conclusions are given in §§ 7 and 8 respectively.
2. Experimental details Measurements of velocity fluctuations were made with a miniature hot wire
situated in the wake ofthree different cylinders (of diameters 0.051, 0.061, 0.104 em.) in a 6 in. diameter circular test section of an open-jet wind tunnel. (Downstream of the 2 ft long test section, the air is expelled into the atmosphere.) The test cylinders (actually wires) were placed across a diameter at a position about 16 in. upstream of the end of the test section. The turbulence level was close to 0.1 %, with flow uniformity better than 0.3 %. A good deal of effort was taken to isolate the cylinders from the tunnel, and to damp out any cylinder vibrations. Each cylinder was passed through small holes in the test section, and clamped between felt pads to a tensioning structure outside of, and mechanically separate from, the test section. In addition, each cylinder was encased in fine-grained polystyrene foam blocks outside the test section (but again not in contact with the test section). Also, the platform, which held the wind tunnel fan, was isolated from any mechanical contact with the settling chamber and test section. In order to monitor any possible cylinder vibration an inexpensive photodiode arrangement was set up, which had a high sensitivity of 0.3 m V output per 10-6 in. displacement of the cylinder.
The oblique angles of vortex shedding (0) were measured with use of two hot wires, one of which could be traversed the whole span of the wake, while the other could be traversed upstream-downstream. In order to measure fJ, both wires were displaced at measured distances from each other, whilst keeping the phase relation between the two signals constant (by retaining a particular 'Lissajou' shape on a Nicolet oscilloscope), and the oblique angle was then deduced from simple geometry. Measurements of frequency and oblique angle were made from 10 diameters (and more) downstream of the cylinder axis.
The outputs from the hot wires and the 'vibration detector' were fed into a HP-3582A two-channel spectrum analyser. Besides being used to measure the Strouhal frequencies, the analyser could compare the signals from the two hot wires when they were placed at different spanwise positions. At other times, the spectrum of the vibration detector could be compared with that of the wake velocity fluctuations.
Flow visualization and further frequency measurements were conducted in our new X-Y Towing Tank at the Graduate Aeronautical Laboratories. This towing tank operates much like a computer X- Y plotter, and can impart arbitrary unsteady trajectories to bodies which are towed within the fluid in the glass tank (of length 16ft. and cross-section 3.5 ft. by 3.5 ft.). Cylinders of diameter 0.328 em and 0.657 em were towed horizontally along the length of the tank, and the shed vorticity was visualized using laser light which excited fluorescein dye washed off the surface of the cylinders. Frequency measurements were undertaken with the use of a video system that had an incorporated timer unit.

Vortex shedding in the wake of a circular cylinder 585
3. Experimental results 3.1 Proof that the present Strouhal discontinuity is not caused by cylinder vibrations
In the present measurements it was clear that, for the required accuracy, reliable temperature and pressure readings in the laboratory were necessary, but also the Pitot tube (used to measure free-stream velocity) had to be checked often. On top of such basic considerations it was found that two features of the experimental set-up needed specific attention.
First, it was found that without the use of end plates to 'shield' the span of the cylinder from the boundary layer along the test-section walls, the Strouhal frequency measurements were somewhat unrepeatable, and under some conditions there appeared spectra with peaks at more than one frequency. It was felt that this could possibly have been related to spanwise cells of different frequency (similar to those described by Gaster 1971) that were somehow influenced by the end conditions of the wall boundary layers. Therefore, endplates (circular disks) were placed at two points along the cylinder span. Length-to-diameter ratios (L/D) of between 90 and 240 were generally used, while disk diameter to cylinder diameter ratios of between 10 to 30 were used. The use of endplates dramatically improved the repeatability of the Strouhal measurements, and served as an early demonstration of the importance of the end conditions on the flow across even large spans.
Secondly, it is clear that there exists the possibility that flow-induced cylinder vibration could interfere with the wake formation and the frequency of vortex shedding. To eliminate such interference, pains were taken to dampen the clamped ends of the cylinders, and also to monitor possible vibration using the vibration detector that was described earlier. With such care over the set-up it was possible to measure frequencies with high repeatability; the resulting data are shown in figure 1 (a). It should first be pointed out that the Strouhal curve has a discontinuity at Re ~ 180, which has been shown (Williamson 1988b) to be caused by a transition to three-dimensionality in the wake, involving the appearance of vortex loops and also stream wise vortices. This marks the end of the laminar regime, and the beginning of a transition to what Roshko (1954) described as the 'irregular' regime starting at around Re ~ 300.
The Strouhal discontinuity that is of central relevance in the present study can be seen in figure 1 (a) at Re = 64, where the curve denoted by fL becomes overlapped by another curve denoted fu, as Re is reduced. Note that (in the region of overlap), subscript L refers to the lower frequency curve, and subscript U refers to the upper curve. (The curve of frequencies fe are those found in a small cell of lower frequency only measured near the endplates.) Having found the discontinuity at Re = 64 for one cylinder, one might suspect that cylinder vibrations are involved. However, if this were the case, one would expect other similar discontinuities to show up at other values of Re (corresponding to harmonics of the cylinder frequency), which does not occur. Also, two other cylinders of different diameter both produce a discontinuity at the same Re = 64 as the original cylinder, and this suggests that cylinder vibrations are not involved. Allied to this fact, the Strouhal data close to the discontinuity (and also away from the discontinuity) were unaffected by changes in cylinder tension, which would clearly not be the case if cylinder vibrations were involved.
As a further demonstration that cylinder vibrations do not cause the discontinuity, it was decided to study simultaneously the wake and vibration spectra as Re was decreased through the discontinuity at Re = 64. The fundamental and the first harmonic of the cylinder natural frequency were arranged so that they straddled,

586
0.19
0.18
0.17
0.16
s
0.15
0.14 ~
0.13
0.12
0.11 40
24
20
16 18\
12
8
4
0 40
. +
; I
.t
• fl'
fv •: :r\'
•. o /L .. : + . . ..
•• .. . .
60
I I I · .. · ...
. •
80
o I •, I
' . .. 60 80
C. H. K. Williamson
·' ..... .... .,::- /L .. • .. • ..
(a)
--· ~-tt· .,..,..~ ,..zt· ·~ ........ .,.. ..,... -.....
_,. f. #~ • • e -, . ... . .
.~ .. .
100
100
120
120
I
140 Re
• 0
140 Re
-
I
160 180 200
160 180 200
FIGURE 1. Strouhal numbers and oblique shedding angles as a function of Reynolds number. (a) Strouhal numbers S versus Reynolds numbers Re for three different cylinders: 0, diameter = 0.104cm (L/D = 140); e, diameter= 0.061 em (L/D = 200); +,diameter= 0.051 em (L/D = 240). (b) Absolute value of oblique shedding angle 181 in degrees, versus Re. 0 is for -8, e is for +8. Measurements are from the 0.104 em cylinder. L/D = 123, L =cylinder length, D =cylinder diameter.

~ 0
-10 (dB)
-20
-30
73.4 Hz
Vortex shedding in the wake of a circular cylinder 587
(a)
Spectrum without tunnel motor on
Spectrum with tunnel motor on
140.4 Hz
Hot-wire spectrum
Vibration spectrum
Hot-wire spectrum
Vibration spectrum
173.4 Hz
FIGURE 2. Comparison of vibration spectra and wake velocity spectra. The dashed vertical lines are the natural frequency and first harmonic of the (damped) cylinder. Note the dramatic change in wake spectrum as Re is reduced, which is not reflected by such a change in the vibration spectrum. (a) Vibration spectra without flow; (b) spectra above discontinuity, Re = 70, S = 0.1406, f = 140.4 Hz; (c) spectra below discontinuity, Re = 62.3, S = 0.1317,J= 117.2 Hz.
and were far from, the vortex frequency corresponding to the discontinuity. (The natural frequency was determined by plucking the damped cylinder and noting the broad peak of the spectrum.) These natural frequencies (at 84Hz and 168Hz) are shown by the vertical dashed lines in figure 2. In figure 2(a) the vibration spectrum is shown without the tunnel motor on (at the top). With the tunnel motor running but without any flow in the tunnel, small peaks in the vibration spectrum (the lower spectrum in a) can be seen, and their origin was found to be attributable to natural

588 C. H. K. Williamson
frequencies of the structure holding the vibration monitor. The main result of figure 2 is found in parts (b) and (c). Here the wake and vibration spectra are shown at Re = 70.1, above the diseontinuity (when the shedding frequeney eorresponds with the curve A in figure 1a), and also at Re = 62.3, below the discontinuity (when the shedding frequency of the eentral span corresponds with the curve ful· Despite obvious changes in the form of the wake spectra above and below the discontinuity between figures 2(b) and 2(c), the vibration speetrum remains essentially unaltered and similar to that measured when there was no flow in the tunnel at all. (An explanation of why the wake spectrum changes from single-peaked to multiplepeaked will be given in §3.2 below.) The above observations, combined with the fact that the cylinder natural frequencies are obviously not involved, clearly shows that flow-induced eylinder vibrations are not causing the Strouhal discontinuity.
Given that the Strouhal discontinuity is not caused by flow-induced vibration, it seemed likely that some three-dimensional aspect of the flow was responsible for its appearance. For this reason, two hot wires were then used to study the flow over the whole span, and to measure oblique angles of shedding, and these results are described below.
3.2 Measurements and observations of oblique vortex shedding modes
In this section it will be shown that the Strouhal discontinuity at Re = 64 is caused by a change from one mode of oblique vortex shedding to another oblique mode, and is not due either to non-uniform flow conditions or, as was already found, to flowinduced vibrations.
In figure 1, we can see immediately that the Strouhal discontinuity in figure 1 (a) is mirrored by a discontinuous drop in the oblique shedding angle in figure 1 (b). As Re is decreased, the oblique angle() increases, until there is some form of' breakdown' to a different mode of shedding. The key to this breakdown was found by traversing a hot wire across the complete span of the cylinder wake. For Re above the discontinuity, a single frequency fL was found across the whole span as shown schematically in figure 3 (a), with the exception of small regions near the ends of the cylinder where the lower-frequency cells (at frequency fe in figure 1) are found. In this range of Re, the vortex configuration takes on the appearance of a 'chevron' -shaped pattern. However, at Re below the discontinuity, a central cell of frequency fu (corresponding with the upper Strouhal curve) appears, which is 'sandwiched' between two cells of the lower frequency fL (from the lower Strouhal curve). This is depicted in the schematic of figure 3(b). Owing to the spanwise cells, both the upper frequency fu and the lower frequency fL can be detected simultaneously with a hot wire at a typical point in the wake of the cylinder. The above observations correspond in figure 1 (a) with an overlap of curves fL and fu that extends from Re = 64 down to Re ~53. We can conclude from the above that the Strouhal discontinuity is the result of some change in the mode by which oblique vortices are shed.
A further investigation was made to study the effect of the cylinder length/ diameter ratio, or LjD, on the influence that the end cells of low frequency have on the flow over the rest of the span. The details of this study are outlined in the Appendix. In this case, the Reynolds number was fixed at a value of 101.0, above the discontinuity. It is eoncluded that the end conditions directly influence an end-cell region of the order of 10 diameters in spanlength. For L / D < 28, the end cells merge together, covering the whole span and causing the vortices to shed at only one frequency fe· (This is consistent with the results of Gerich 1986.) The flow over the

Vortex shedding in the wake of a circular cylinder 589
(a)
1 Flow l FweRE 3. The two oblique vortex shedding modes. (a) 'Periodic' oblique shedding mode (for Re = 64-178), with a chevron-shaped oblique vortex pattern. Aside from the endplate cells at frequency J., there is a single cell of frequency JL over the whole span, with periodic wake spectra. (b) 'Quasi-periodic' oblique mode (Re < 64). A central cell of higher frequency fu (and lower shedding angle) appears, pushing to each side the cell offrequency fL. This mode has quasi-periodic wake spectra.

590 C. H. K. Williamson
(a)
0
-10 (dB)
-20
-30
(b)
0
-10 (dB)
-20
-30
- 500Hz ... FIGURE 4. Wake velocity spectra. In (a) Re = 120.2, S = 0.1701, D = 0.061 em., L/D = 200. In (b), for the sharp spectrum (laminar vortex shedding) Re = 172.8, S = 0.1840, J= 1305Hz; for the broad spectrum (vortex shedding involving three-dimensional transition): Re = 172.8, S = 0.1802, J= 1277Hz.
whole span is then directly influenced by the end conditions. For LjD > 28, however, the central cell of frequency fL appears in the central region of the span, and it is found that this frequency is unaffected by a variation of LjD. Velocity fluctuations at the end-cell frequency fe can still be felt by a centrally placed hot wire for LjD up to about 45, thereafter the spectra remain unchanged as L / D is further increased. This suggests that, for L/D > 45, the vortex shedding in the central regions of the span at frequency fL is unaffected by the direct influence from the end conditions.
In order to characterize the oblique modes that were shown in figure 3 in more detail, we shall see how the character of the spectrum changes at different points along the Strouhal curve (i.e. at different Re), and also at different span wise positions for a given Re. In the case of the shedding mode at Re above the discontinuity, (i.e. for Re between 64 and 178), the spectra are periodic, corresponding to a single shedding frequency JL, as shown typically in figure 4(a) for Re = 120.2. In figure 4(b) a similarly sharp spectrum at Re = 172.8 is shown, along with another spectrum with a much broader peak at a lower frequency, but at the same Re. This corresponds with

f.
z/D
100.5
91
/L fu
' I 111.5 11 5.1
(Hz)
(dB)
z/ D ~ - I~ -20
-30
(a)
(b)
(c)
(d)
(e)
138
FIGURE 5. Spectra (on the left) and corresponding time traces of velocity fluctuations (on the right) at different spanwise distances from the endplate, all for Re = 59.7. As spanwise distance from the end (z/D) is reduced, so we move from a cell of frequency fu, into one at frequency fL, and finally into the endplate cell of frequency f •. Frequencies are in Hz. L/D = 90.0. Su = 0.1323, SL = 0.1282, s. = 0.1155.
~ ;::t "" ~ "" ~ "" ~ ~-
""· ;;l
;;:. "" § ?:"'
"" ~ !;l
C"> ... ""'!
2 ~ ""'!
C">
~ [ "" ""'!
01 ~ -

592 C. H. K. Williamson
a hysteretic transition to three-dimensionality in the wake, and is discussed in Williamson (1988b). Of primary interest in the present problem is the way in which the spectrum dramatically changes its form as Re is reduced below the discontinuity, and also how the spectra vary along the cylinder span.
At a Reynolds number of 59.7 (which is below the discontinuity), in figure 5, the spectra measured at different distances away from the end plate are shown on the left, with corresponding time traces of the velocity fluctuations on the right. In (a), when the hot wire is placed 36 diameters from the endplate (z/D = 36), the spectrum shows multiple peaks, although each one of them can be attributed to combinations of the two frequencies fu and fL. This is typical of the quasi-periodic spectra that are associated with the spanwise cells of different frequency. As we reduce z/D in (b) and (c), so the energy at the frequency fu is reduced while the frequency fL takes over. In this case we are moving from a cell of frequency fu into a cell of frequency fL" The time trace in (b) shows a low-frequency modulation corresponding with the beat frequency lfu-fd· The quasi-periodic spectrum in (c) is particularly interesting as it shows three incommensurate frequencies fu, fL, fe, however the spectrum remains 'ordered' in that all the peaks are related to combinations of these three frequencies. In this spectrum most of the energy is at the cell frequency fL, with some effect being 'felt' from the frequency of the cell in the central spanfu on the one side, and from the end-cell frequency fe on the other side. (Again, note the low-frequency modulations in the time trace (c) corresponding with the two different beat frequencies.) Moving closer to the endplate at around z/D = 10 in (d), the energy at the frequency fe becomes comparable with the energy for frequency fL, and the time trace shows a modulation at the beat frequency (JL -fe). Still further towards the endplate, at zjD = 5.2 in (e), most ofthe energy is now at the frequency fe, as shown in the spectrum and the time trace, and we are now within the low-frequency cell adjacent to the endplate. The end cells of low frequency fe extend inwards around 10D from each end, while the cells of frequency fL extend inward about 25D. The picture above of how the spectra and time traces vary with spanwise location is similar for each end of the cylinder span, and led to the schematic diagram of the different frequency cells that was shown in figure 3 (b).
It should be noted that this lower frequency fe is not th~ result of an interaction of the cylinder wake near the ends of the span with the wake behind the endplatc disks. This was proven by changing the dimensions of the disk and thereby its own wake, with the addition of strips of putty, while having no effect on the frequency or velocity spectra in the end-cell region near the cylinder.
Visualization of these different modes of oblique vortex shedding, found for Re above the below the discontinuity, are shown in figure 6 taken from the X-Y towing tank. An example of the mode of shedding that is found for Re above the Strouhal discontinuity is shown in figure 6 (a). In this figure, the flow is upwards past the horizontal cylinder which lies at the bottom of the photograph. Here, the oblique vortices are reasonably straight over one half of the span at a positive shedding angle + 0, and again straight over the other half of the span but now with a negative angle -0, so that a bend occurs in the middle of the span, giving the 'chevron '-shaped pattern of oblique vortices. At the ends can be seen vortex structures which occur at the beat frequency (JL-fe) between the central cell of frequency fL and the endplate cell offrequency fe. The changeover of shedding modes in the case of the towing tank was found at a value of Re close to 75, slightly higher than in the tunnel.
In figure 6(b), the mode of shedding below the discontinuity (at Re = 60) is one where the central cell frequency fu is sandwiched between cells of frequency fL. In

Vortex shedding in the wake of a circular cylinder 593
(a)
(b)
FIGURE 6. Visualization of the different modes of laminar vortex shedding. Flow is upwards. (a) The periodic oblique shedding mode corresponding with the chevron-shaped pattern of oblique vortices, at Re = 85 (Re above the discontinuity). LjD = 140. (b) Quasi-periodic oblique shedding mode, with spa.nwise cells of different shedding frequency, at Re = 60 (Re below discontinuity). LjD = 70.

594 C. H. K. Williamson
this case, the cell boundaries lie very roughly (in the mean) along vertical lines, like the sketch in figure 3 (b). Along such cell boundaries are found 'vortex dislocations', which occur at the beat frequency ifu-fL), and are the result of vortices in one cell moving out of phase with vortices in a neighbouring cell of different frequency. (These are described in detail in §6.) One of these vortex dislocations can be seen in the right half of figure 6 (b), developing in the near wake of the cylinder. An earlier dislocation that occurred on the left can be seen downstream and almost out of view. (At these low Reynolds numbers, the end cells oflower frequency fe are more difficult to observe, as the strength of their fluctuations in this region becomes relatively weak compared with those over the rest of the span. This can also be seen from the time traces of figure 5.) The wake over the central span in figure 6 (a) is a steady configuration, unlike that in (b), and gives the periodic spectra shown typically in figure 4, rather than the quasi-periodic spectra shown typically in figure 5.
It may be thought that the existence of flow non-uniformity could cause the breakdown from one oblique shedding mode to the other. This is a distinct possibility if a large degree of non-uniformity were present, although in the present case the testsection uniformity was better than 0.3% over a range of tunnel speeds. Further evidence to show that non-uniformities are not involved here is found in the plot of oblique shedding angles() versus Rein figure 1 (b). Here both +()and -{}could be measured at the same Re whereas we would expect only one sign of () if nonuniformity were the cause. The final confirmation comes from the visualization in figure 6 where for example in (a), a positive and negative oblique angle occurs on each half of the span, i.e. the 'chevron' -shaped pattern is symmetric with respect to the centre span, and is not due to some shear in the incident flow. In the latter example, the flow incident on the cylinder is likely to be particularly uniform, given that the cylinder is towed through the quiescent fluid (unlike the situation in the wind tunnel). Also, the transition of oblique shedding modes occurs in the towing tank just as it does in the wind tunnel (although at a slightly higher Re). This fact coupled with the symmetry about the centre span of the shedding configuration indicates that oblique shedding and the breakdown from one mode to another is not, in this case, caused by flow non-uniformities.
We can now conclude that the Strouhal discontinuity is caused by a transition from one mode of oblique shedding to another, and is not caused by either cylinder vibration or by flow non-uniformites. One might question what causes the transition of shedding modes ? The answer lies in the 'matching' between the end boundary conditions with the flow over the rest of the span, and these ideas are expanded later in §5. In the following section, the physical mechanism by which the ends impose a certain oblique angle on the whole flow is explored.
3.3 Physical mechanism of oblique and parallel shedding
There are a number of advantages to visualizing the wake in the towing tank, one of which is the fact that the cylinder is started impulsively. In this way, one can see how the vortex shedding develops as the cylinder travels away from its starting position. One rather basic observation is that the' asymptotic' form of the wake (which, in the present case, is oblique shedding) takes some time to evolve. Initially, vortices are shed parallel to the cylinder, and it takes time for the end boundary condition which imposes a certain oblique angle on the flow, to make itself felt across the whole span. An example of an initial and final vortex configuration from a single run can be seen in figure 7. In (a), the wake vortices are still being shed parallel to the cylinder over most of the span after 100 diameters oftravel, although an oblique angle of shedding

Vortex shedding in the wake of a circular cylinder 595
(a)
(b)
FIGURE 7. Development of an oblique shedding mode in (b), from an initially parallel shedding configuration in (a). Flow is upwards. In (a) the cylinder has travelled 100 diameters (x/D = 100). In (b) for x/D = 600, the oblique angle has propagated inwards from the ends, and now covers the whole span in the chevron-shaped pattern. Note also the small waves on the vortices in (b), about 60D downstream of the cylinder. Re = 95.

596 C. H. K. Williamson
can be seen near the ends. In (b), after 600 diameters of travel, the 'chevron '-shaped oblique vortex pattern has taken over the whole span, and matches the oblique angle imposed by the end conditions.
The observation that the starting flow involves parallel shedding although the asymptotic flow involves oblique shedding (at least in this case) could very well explain the contrasting observations by Hama (1957) and Berger (1964). Hama used a towing tank, and it is possible that he made his observations early in a run and therefore noted parallel shedding. Berger, on the other hand, used a wind tunnel and would therefore have made his observations on a wake that had reached its asymptotic state; he thus noted oblique shedding. This explanation assumes that the end conditions were such as to cause a final state of oblique shedding; this will occur with most usual cylinder arrangements. However, this is not always the case, as will be seen at the end of this section.
Another feature of figure 7 (b) that should be pointed out is the waviness in the vortices, which seems to be amplified at around 60 diameters downstream. Each of these waves originated from a disturbance created by one of the vortex dislocations (mentioned earlier), which occurred near the ends of the cylinder. These waves should not be confused with those that travel along vortex cores (such as are discussed by Aref & Flinchem 1984). In the present case, the waves appear at a slightly displaced spanwise position on each successive vortex to be shed, and do not seem to travel along the the vortex cores as these vortices are convected downstream. What is interesting here is that these disturbances are displaced, by the process of vortex shedding, inwards along the span from the ends. It seems that the angle of the oblique shedding is involved in the translation of these disturbances, and that these disturbances travel in a spanwise direction which depends on which way the vortices are oblique.
It was decided at this point to manipulate the end conditions to see whether oblique shedding was always the 'final' state across the whole span. It was soon discovered that by angling inwards the leading edge of the endplates (of 10:1 disk-cylinder diameter ratio) some control of the flow over the whole span could be exerted. The idea of using angled end plates to affect the flow near the ends was first used by Ramberg (1983) in the case of yawed cylinders. If the leading edge of the endplates were angled inwards by 12° or greater (up to 20° was investigated), then parallel shedding was induced to occur near the ends, which caused the whole span to shed parallel vortices. A demonstration of this 'induced' parallel shedding in figure 8, (for Re = 110 and LjD = 130), can be contrasted with the oblique configuration in figures 6 and 7. It was also confirmed from the wind tunnel that, with these end conditions, such parallel shedding was the 'final' state of the wake.
It is believed that the parallel shedding is also two-dimensional, in the sense that the flow in one cross-section of the wake is representative of (and in-phase with) the flow in all cross-sections at other spanwise positions (with the exception of the regions close to the ends). Also, the absence of axial flow in the vortices was demonstrated in a further experiment by showing that blobs of dye placed at several spanwise locations were subsequently convected straight downstream (in planview), rather than being convected with a spanwise velocity component. We can also see in figure 8 how a gap in the dye marking the vortices (which was the result of an absence of dye at this particular spanwise location), convects straight downstream.
A further experiment was conducted in the X-Y towing tank, which showed that as the angle of the endplate disks a (measured positive for the leading edge angled inwards) was varied from -10° to + 12°, so the angle of oblique shedding remained

Vortex shedding in the wake of a circular cylinder 597
FIGURE 8. Parallel vortex shedding mode, induced by angling inwards the leading edges of the endplates by around 12°, or more. Flow is upwards. Re = 110, L/D = 130. Distance travelled by cylinder= 600D.
virtually constant at 14° to 15°. As the endplate angle a> 12°, however, the oblique shedding angle changed sharply to being parallel with the cylinder axis.
With relevance to some of the above results, Eisenlohr & Eckelmann (1989) induced parallel shedding by ending their cylinder span with larger-diameter cylinders. Their explanation for this was that the larger cylinder introduced an end frequency which was sufficiently removed from the central flow frequency to be decoupled from it. The present situation using the angled plates is rather different. As a first step in understanding how the end conditions can control the span flow, it is of use to question why an end cell of lower frequency can appear. Gerich & Eckelmann suggested that the lower velocity in the end plate boundary layer induced a lower frequency up close to the endplate, whose influence extended over a span of several diameters by a 'lock-in' effect. However, Gerich & Eckelmann also found such an end cell of lower frequency to occur in the wake of a free-ended cylinder, when there is no endplate boundary layer present.
In this investigation, it is suggested that the low-frequency end cell is caused by the base pressure being higher in the end region. Such an increase in pressure could be caused by the decrease in the coherence of the vortex shedding, because the vortices in the end region become orientated in the streamwise direction (see figure 24 later). It is also consistent with the fact that very similar end cells are found for a free-ended cylinder as for one with an endplate (as mentioned above), and in the former case it is known that the pressure is higher in a region near the tip because the pressure is 'short-circuited' around the end. Judging from other results, this increase in base pressure has the effect of enlarging the vortex formation region locally (Bearman 1965; Griffin & Votaw 1972) and corresponds with a decrease in

598 0. H. K. Williamson
shedding frequency (as was shown clearly by Roshko 1955). By angling in the endplates, the base pressure near the endplates is reduced, until the pressure and the vortex frequency match those values over the rest of the span, and the shedding becomes parallel. (It seems that even under these conditions a very small lowerfrequency cell remains close to the downstream side of the angled endplates, as indicated by figure 8.) This matching of the base pressure at the ends of the cylinder with that over the central span is a concept which was used by Ramberg (1983) in his study of the flow over yawed cylinders, and was also achieved by angling the endplates. Consistent with the reduction in base pressure is a slight increase in the measured flow velocity incident on the cylinder and close to the plates. This reduction in base pressure may also be the cause of Eisenhlohr & Eckelmann's observations that parallel shedding is also induced if a cylinder span is ended with larger-diameter (and coaxial) cylinders. In their case also, the flow would be speeded up around the ends of the larger cylinders, and the base pressure reduced in this region. However, the principal feature here is that parallel or oblique shedding can be induced over large cylinder spans simply by manipulating the end boundary conditions.
Because it was found possible to induce either oblique or parallel shedding, it was decided to measure the streamwise wavelength in the two cases. The results, from the wind tunnel, are shown in figure 9(a). (The procedure in measuring the wavelengths was to fix a particular Re, and then change the endplate angles to give first oblique shedding (plates parallel to the flow), and then parallel shedding (by angling the plates).) The data show clearly a discontinuity in the wavelength data at Re = 64 for the oblique shedding case, and thereby reflects the discontinuities in Strouhal number and oblique angle () that were found at the same Re in figure 1. What is significant about the results is first that the parallel-shedding curve is continuous whereas the oblique-shedding data are not. Secondly, the results shown in figure 9(a) indicate that the following relationship holds well:
i\.0 = i\.8 cos0, (1)
where i\.0 is the parallel-shedding wavelength and i\.0 is the oblique-shedding wavelength. This means that the wavelength normal to the wavefront remains a constant, and equal to i\.0 (for a given Re) irrespective of the oblique angle 0.
The convection velocity ~ of the vortices downstream can also be calculated simply from
(2)
where U00
is the free-stream speed. The results in figure 9 (b) show that the convection speed is almost unaltered between the cases of oblique and parallel shedding, and therefore implies that Strouhal measurements in the two cases will also have a simple geometric relationship like equation (1), and this is confirmed later.
The present results have shown that it is the effects from the ends that cause an oblique angle of shedding to be generated near the ends of the span, and which then spreads inwards along the span from one shedding vortex to another. The mechanisms that produces an oblique angle of shedding involves the complex interaction of the central-span vortices with those vortices in the end-cell region. The central vortices become 'retarded' by those at the lower frequency, because part of a shedding vortex is influenced by the induced velocity from vorticity all along the span. It is difficult to provide a rigorous argument as to why a specific angle of shedding appears at a particular Reynolds number, although the angle is possibly set by a streamwise and a spanwise lengthscale. The spanwise scale might vary with the

u. u,
Vortex shedding in the wake of a circular cylinder
8r------.------.------r------r------.------r-----~
7
6
s
4 40 60 80
1.0
0
0.9 0
0 ee A s a 0 fi
0.8
0 Parallel shedding 0.7 6. Oblique shedding
(a)
100 120 Re
(b)
a g i s
0 Parallel shedding, /..0 / D
6. Oblique shedding, Aflf D
+ (/..0 / D)jcos 6
140 160
S? 0 s e
180
0.6 .___ __ __,_ __ ___. ___ ......._ __ __._ __ ___;.__ __ _.__ __ __J
~ 60 W 100 1W 140 100 ~0 Re
599
FIGURE 9. (a) Normalized wake wavelength CA/D), and (b) normalized downstream convection speed of vortices (~/U00 ), versus Re. Data for both the oblique and parallel shedding cases are included.
spanwise extent of the end-cell region, Le which remains almost constant at around 10 diameters in length over the whole range of Reynolds numbers of interest. A candidate for the stream wise lengthscale could be the streamwise wavelength of the vortices A./D, which varies nearly proportionately with f) (at least atRe > 64), as Re is changed. It is thus conceivable that the angle of oblique shedding scales with the wavelength of the wake A/D (in this particular case when the end-cell size Le remains constant), and thereby f) increases as Re is reduced.

600 C. H. K. Williarnson
' ., •o I 1 f
Frequency = fo t-1 I I
~--------~----------------------
Vortices
Cylinder
FIGURE 10. Sketch of the oblique front dividing a span wise region of oblique vortiet>s, from a region of parallel vortices. The front begins at the end of the cylinder and propagates span wise to the right, by induction effects during the process of vortex shedding.
The data for the stream wise wavelength A can be used to make some prediction of the time it takes for the wake to develop oblique shedding right across the whole span, after the start of the cylinder motion. Here, we suppose that there is an 'oblique front', as shown in figure 10, between the oblique shedding, which started at the ends and is travelling inwards, and the parallel shedding, which continues in the central portion of the span until the oblique front has passed through. (In reality, the oblique vortices will join the parallel vortices with some curvature rather than a sharp change of angle as shown.) Because the wavelength normal to either the oblique or parallel vortices is A0 , then by symmetry the oblique front will be oriented at an angle ¢> = lO to the free stream, as is shown in the diagram of figure 10.
It was decided to investigate such an oblique front in experiment by having different end conditions, one of which induces an oblique shedding angle across the span (endplate parallel to free stream), while the other end induces parallel shedding (endplate angled-in). This example is shown in figure 11, where a measurement of the angle of the oblique front, ¢>, was made. Some difficulty in this measurement was created by the fact that the parallel vortices were not precisely straight and also because the bend between the oblique and parallel voices splits up into two bends further downstream by Biot-Savart induction (as can also be seen clearly for the bend in the oblique shedding of figure 6a). Therefore the oblique front was defined as the intersection between lines drawn as nearly as possible through the parallel vortices (and parallel to the cylinder), and lines drawn through the oblique vortices. The resulting oblique front in figure 11 was angled at ¢> = 9° to the free stream while

Oblique shedding Parallel shedding
~ ~ 0:> ;;::.~ R. R. ~-.... .. ~
t "' ~ ~ (") .... d .::: 1f ~ i ~
FIGURE 11. Visualization of the oblique front separating oblique vortex shedding on the left side from parallel shedding on the right side. Flow is ~ upwards. Ths situation is caused by having two different end boundary conditions. Distance travelled by cylinder= 500D. Re = 90, LjD = 130. ;:=

602 C. H. K. Williamson
the oblique shedding angle(} was 17°. This result suggests that the theory proposed above, which showed tjJ = te, is approximately correct. Ultimately, with such a pair of different end conditions, the vortices take on a constant oblique angle all the way across the span, rather than form a chevron oblique vortex pattern.
A further interesting feature of the motion of the oblique fronts (travelling in from each end of the span) is the fact that the frequency of the parallel shedding f 0 in the centre of the span must necessarily be greater than that for the oblique shedding f 0 behind the fronts at each side. These two different frequencies coexist simultaneously, yet at the same time the oblique and parallel vortices match up in phase across the front. This is consistent with the fact that by the time the chevron pattern of oblique shedding (across the whole span) has developed there will always have been more vortices shed in the centre of the span than at the sides.
We are now in a position to estimate the distance that the cylinder must travel from its starting position, before the asymptotic state of oblique shedding across the whole span has been reached. When there is an oblique front, each vortex will have a bend between an oblique portion and a parallel portion of its length, although with each new vortex to shed this bend is displaced spanwise. In this way, the front is 'propagated ' along the span at a speed UF, which can be derived from the simple geometry of figure 10 as,
(3)
If the length of the cylinder is L, then the distance (x) travelled by the cylinder, before the final state is reached, can be shown to be,
X = -::-:'=:(L-:--.1 D-=::),-D {}(flc/Uoo)'
(4)
where 0 is small. Now from experiments over a range of Re we have, fle/U00 ~ 0.9,
(} ~ 0.244 rad. (or 14°), and supposing for example that LjD = 100, then (4) gives xjD ~ 450, i.e. the cylinder travels around 450 diameters to reach the asymptotic state of oblique shedding all the way across the span (corresponding with about 90 cycles of vortex shedding). This is surprisingly large, since we might otherwise consider the flow to have reached its asymptotic form after around 5 cycles, if we based our observations solely on a cross-sectional view of the wake. However, judging from estimates of xjD from experiments in the towing tank, such a large value is of the right order.
It is necessary here to make clear one particular aspect concerning the influences of the end conditions on the flow over large cyclinder spans. In such a case, the flow at a particular location in the central portion of a span is only directly influenced (in the main) by the vorticity distribution in the near wake for several diameters of the span to either side; for example, it is shown in Appendix A how the end effects have a direct influence on the flow for a region of the order of lQ-20 diameters in length. Their influence is felt over the rest of the span in an indirect fashion, by the gradual spanwise displacement of a disturbance such as a bend in the vortices (like the oblique front above) away from the ends. Such a bend in one vortex induces a velocity field (and phase of shedding) on the next shedding vortex in such a way that the bend is displaced spanwise. It is this successive vortex shedding in the near wake that is responsible for the gradual span wise shift of such disturbances from the ends, causing the oblique front that was discussed earlier. The timescale over which a disturbance from the ends is ultimately felt in the centre of a long cylinder can be very much larger than a typical shedding period. The influence that the end conditions have on the flow over long cylinders is therefore of an indirect nature, with

0.19
0.18
0.17
s
Vortex shedding in the wake of a circular cylinder
, o•
; .. .,.
·" .,. ••
/ .
. ..~ .i· ,.·
Re
.. •• ••• ••• . )·•
603
FIGURE 12. The 'universal' Strouhal curve for a circular cylinder. Measurements from the wind tunnel: e, parallel-shedding data (D = 0.104 em, L/D = 90); 0, transformed oblique-shedding data using the formula S0 = S0fcosfJ. (D = 0.104 em, LfD = 123); -,curves through the original S0 data. Measurements from the X-Y towing tank: x, 0.657 em cylinder, LfD = 72; +, 0.328 em cylinder, LfD = 140.
disturbances propagating somewhat like a 'chain reaction' along the span from one shed vortex to the next.
In this section, it was shown how the boundary conditions at the ends of a cylinder take time to become 'matched' with the flow over the whole span. This feature was studied using some wake-wavelength measurements where it was found that a simple geometric relationship : ,\0 = ,\8 cos f) holds between the parallel and oblique shedding cases. One might suspect that such a simple relationship also holds between the shedding frequencies for the parallel and oblique cases, given that the convection speed for the two cases almost unchanged. Also, the fact that the wavelength data for parallel shedding vary continuously with Re suggests that the Strouhal data for parallel shedding would be continuous also. Both of the above suppositions are confirmed in the next Section.
4. Defining a universal and continuous S-Re relationship Judging by the results for a cylinder which sheds oblique vortices, it is not clear
whether a continuous Strouhal curve, without discontinuities, actually exists. However, when the vortices are induced to be shed parallel to the cylinder, no mode transition occurs, because the vortices are shed parallel to the cylinder throughout the Reynolds-number range. Under these conditions a completely continuous Strouhal curve is found to exist, and is shown in figure 12 (as the solid symbols). The
20 FLM 206

604 C. H. K. Williamson
(a)
/L fv I I 1 I
0 1 I
I I
-10
(dB)
-20
-30
111.5
I (b) I fo
0
-10
(dB)
91 138
(Hz)
FIGURE 13. Comparison of wake spectra for (a) the quasi-periodic oblique mode, with (b) the (periodic) parallel shedding mode, at precisely the same Reynolds number. Re = 59.7. In (a), the hot wire is at ziD = 37, LID= 71. In (b), the hot wire is at ziD = 40, LID= 90.
parallel-shedding data lie somewhat above the oblique-shedding data (the lines), and are thus consistent with the results of figure 1, where the trend of increasing frequency for decreasing angle of shedding was observed. (This trend is in accordance with the results of Eisenlohr & Eckelmann, and also with those of Ramberg for the wakes of yawed cylinders.) Not only are the data for parallel shedding continuous, but at every point on the curve the spectra are periodic, as can be seen in figure 13 (b), and this is contrasted with the quasi-periodic spectrum for the oblique shedding in (a), which reflected the presence of different-frequency spanwise cells. Both of these spectra were taken at precisely the same Reynolds number.
We shall now transform the original oblique-shedding Strouhal data in a manner similar to that which proved reasonable for the wake-wavelength data. If the oblique-shedding Strouhal numbers (S0 ) are divided by cos() (using data for frequencies and angles such as are in Appendix B), then the curve of the resulting Strouhal data, shown as the open circles in figure 12, becomes continuous and agrees

Vortex shedding in the wake of a circular cylinder 605
35
30
25 fD'
v
20
15
10
5 40 60 80 100 120 140 160 180
Re
FIGURE 14. Variation of JD2 /v with Re. This plot demonstrates the continuous nature of the data ( 0 ), and also shows the least-squares curve fit (--) to the data using the equation: S = A/Re+B+CRe, where A= -3.3265, B = 0.1816, C = 1.600 x t0-4
•
closely with the parallel-shedding data (S0 ), thereby indicating that the following
transformation holds: So= Sefcos() (5)
(The use of such a formula in this context was originally suggested by Garry L. Brown, private communication, from considerations of stability theory.) This result is consistent with (1) and (2), which involved a cos() relationship for the wake wavelength, given that the convection speed ~remains almost unchanged between oblique and parallel shedding, at a given Re. It also shows that the parallel-shedding Strouhal curve S 0 is universal, in that oblique-shedding Strouhal curves can be collapsed onto the universal curve using (5), if the corresponding oblique angle () is also measured.
As a further check to confirm the universality of the curve for S 0 (at least for a circular cylinder), other frequency measurements for parallel shedding were undertaken in the X-Y towing tank. This is a particularly suitable check, because the water tank is a distinctly different facility from the wind tunnel. The vortex frequencies in the wakes of cylinders (of diameter 0.328 em and 0.657 em) were measured using an accurate auxiliary timing unit of a video recorder. The results are shown in figure 12 by the crosses, and agree well with the other data, although the frequencies could not be measured to the same accuracy as in the wind tunnel. This good agreement provides strong evidence that the parallel-shedding Strouhal curve is indeed universal, as well as being completely continuous.
The universal Strouhal curve is believed to represent frequency measurements for two-dimensional vortex shedding. As described in §3.3, two-dimensional vortex shedding is understood to mean that the cross-sectional flow is similar and in-phase at all spanwise positions (except close to the ends), and also that there is an absence of axial flow in the vortex cores. Also, it can be seen that the Strouhal numbers are
20-2

s
606 C. H. K. Williamson
0.21
0.20
0.19
0.18
0.17
0.16
0.15
0.14
0.13
0.12 40 60 80 100 120 140 160 180 200
Re
FIGURE 15. Comparison of two-dimensional vortex shedding frequencies from experiment and from numerical simulations. The plot shows Strouhal numbers S versus Reynolds numbers Re. Experimental results: e. 0, +, x, symbols as in figure 12. Numerical results:---, Karniadakis & Triantafyllou (1989), spectral method;-------, Sa & Chang (1989), finite-difference technique; f::::. Braza et al. (1986), finite-volume method.
unaffected by a variation in LjD, at least for values considered in figure 12 where LjD > 70. This suggests that the parallel shedding is independent of the direct influence of the end conditions. For the purpose of comparison with two-dimensional numerical computations, the Strouhal-Reynolds number relationship is given closely by
S = AjRe+B+CRe (6)
where A= -3.3265, B = 0.1816, C = 1.600 x 10⁻⁴ • This least-squares curve fit was made to the parallel-shedding data plotted in the manner shown in figure 14, where

Vortex shedding in the wake of a circular cylinder 607
the continuous nature of the data is clearly observed. The parameter JD2 I v, where v is the kinematic viscosity, was first used in the context of vortex shedding by Roshko (1954), and is equal to the product SRe. Equation (6) was thus found by fitting a quadratic to this data, giving a root-mean-square error (averaged over all the points) of 0.000089, with an average percentage error of 0.06 %. Similarly, a linear leastsquares fit can also be used, which gives, for (7) with C = 0; A= -5.1064 and B = 0.2175, with a root-square error of 0.000415. For reference purposes, Appendix B contains a tabulation of the main Strouhal data for different cylinders, and data for the oblique and parallel cases. The Appendix also contains some measurements of oblique shedding angles.
Two-dimensional numerical computations of the flow past a circular cylinder have been undertaken by Karniadakis & Triantafyllou (1989) over a range of Re from 40 to 250, using a spectral method, and similarly by Sa & Chang (1989), using a finitedifference technique. Their results for the Strouhal-Reynolds number relationship are compared with the present experimental data for the parallel shedding in figure 15. Two further data points from Braza, Chassaing & Ha Minh (1986), using a finitevolume method, are shown by triangles in this plot. Although the numerical calculations have a trend that agrees with the experiments, one of the curves of the numerical data lies 5 %-15% above the experimental results, while the other numerical data curve lies similarly below the experimental results. However, there is closer agreement with the two data points of Braza et al. It is not known why there is a disparity between the sets of results in figure 15, though it is perhaps possible that differences in the treatment of the boundaries in the calculations might, to some extent, contribute to the differences between them. In the case of Braza et al., their calculations place the boundaries at an infinite distance from the cylinder. Further work is also underway at the California Institute of Technology (A. Leonard and F. Pepin) to simulate the cylinder wake in an infinite domain, circumventing problems that may be associated with proximity of the boundaries to the body.
5. An explanation for the transition between oblique shedding modes The transition of oblique shedding modes at Re = 64 is explained in this section in
terms of a matching or a mismatching between the end conditions and the flow over the rest of the span. Initially, we shall investigate the similarities between Tritton's Strouhal discontinuity and the present one, and see whether it is likely that his discontinuity is caused by the same oblique-mode transition.
Strouhal data from both Roshko and Tritton are compared with the present parallel-shedding data in figure 16. In the case of Tritton's data, one can see that both of his curves lie below the parallel-shedding curve, in a manner not unlike the present oblique-shedding data (see figure 12). If we assume that these frequencies are lower because the vortices are oblique, then it is possible to infer from Tritton's data what value of oblique angles e were present in his experiment from (5) i.e. e =
cos-1 (S01 S 0 ), using the present parallel-shedding data S 0 • It is clear that the trend of the predicted e from Tritton's data in figure 17 is similar to the variation found here, except that Tritton's discontinuity occurs at the higher Reynolds number of around 100. For example, at higher Re the inferred data from Tritton asymptote to around 12°-14° like the present results, and at low Re also, the curve from Tritton's data goes through the present results. Perhaps the most interesting aspect of this comparison is the similarity in the peak values of eat which a transition to a different mode occurs. These similarities in the form of the data, despite the different Re for

608 C. H. K. William8on
0.20 r-----.----...,.----.------.-----,----r----,
0.18
s 0.16
0.14
0.12~----~~----~~----~~----~~----~~----~------~ ~ ~ W 100 1W 1~ 1~ 1W
Re
FIGURE 16. Comparison of the parallel-shedding Strouhal curve (--) with the previous data of Roshko (1954) and of Tritton (1959). The curve fits used were: Roshko, 8 = -4.5/Re+0.212 (----);Tritton (low-speed mode), S= -2.1/Re+0.144+0.00041Re (·······);Tritton (highspeed mode), 8 = -6.7jRe+0.224 (-.-.-).
24
20
16 181 .......... ___ .
~= ~ . I I
4 • ' .. 0 40 60 80 100 120 140 160 180
Re
FIGURE 17. Comparison of present measurements of oblique-shedding angle (} ( 0, e), with the predictions of(} based on Tritton's Strouhal data, using (5) (----). Both sets of data show similar trends, except that the Re for the discontinuities are different.
the discontinuity, suggest that his discontinuity is also likely to be the result of a breakdown from one oblique mode of shedding to another. The difference in the Reynolds numbers for the discontinuity is not fully understood, although this point is further discussed in § 7.
Returning to figure 16, it is interesting that the level of Roshko's original data seems rather close to the present parallel-shedding curve, with the maximum deviation being around 2.5%, but the reasons for this agreement are not known.

Vortex shedding in the wake of a circular cylinder
1.00 r----,----"""'T"""---.------,----,----..,----,
0.98
f. 0.96
J. 0.947·-
0.94
0.92
0.90 .__ __ _...._ ___ __._ ___ _,__ ___ .__ __ __._ ____ ~ __ ___J
40 60 80 100 120 140 160 180 Re
609
FIGURE 18. Variation of (j0/f0 ), i.e. oblique-shedding frequency/parallel-shedding frequency, versus Re. Note the discontinuity at a critical value of (j0ff0 ) = 0.947, occurring at Re = 64.
Similar agreement is also found between the data of Norberg (1987) and the present parallel-shedding data, and a common feature for both Roshko's and Norberg's data is that their length/diameter ratios were of the order of 2000.
It could be suggested that the transition from one oblique-shedding mode to another occurs when the wake in some manner cannot sustain a higher 0, with the critical angle from the present experiment (and Tritton's experiment) being Ocrit ~ 19°. Alternatively, as Re is reduced, the transition can be viewed as occurring when the ratio f 8/f0 (shown in figure 18) decreases to a critical value, which in this case is close to 0.95, at which time f 0/f0 jumps discontinuously to a different higher value. One suggestion for the mode transition is as follows. The effects of the ends is to impose an angle of shedding over the whole span, and thereby also a decrease in the frequency of shedding (/0) compared to the two-dimensional case (/0). If we suppose for the moment that the two-dimensional mode is the most unstable case, then it is likely that there will be a lower limit to which the end effects can 'pull down' the shedding frequency (/0) away from the two-dimensional frequency (/0).
When this lower limit of f 0/f0 is reached, then the flow over the span breaks away from the influence from, or falls 'out of synchronization ' with, the end conditions. This suggestion to explain the transition of oblique shedding modes is explored below.
While it is not correct to apply linear stability theory for parallel shear flows in the highly non-parallel near wake of a bluff body, it is nevertheless worth mentioning at this point a result that is derived from Squire's transformation (Squire 1933). It can be shown (for a given wake profile and Reynolds number, and for a parallel flow) that if the two-dimensional frequency and temporal growth rate of disturbances are respectively fo and u 0 , then for a wave at angle 0, the most unstable frequency fo is given by fo = fo cos 0, and similarly the growth rate u 0 is given by 0'0 = u 0 cosfJ. Thus the growth rate of an oblique wave reduces as its angle ()increases, leaving the twodimensional waves as the most unstable case. It should also be noted that the

A, ~10 \ (•)
z*
' I
\
~.1---, --Uv e ....
Vortices match up cleanly across front
(b)
Sequence of vortex dislocations
FIGURE 19. Matching of the flow over the span to the end conditions. In (a), for Re > 64, the central-span shedding is matching the end conditions. The oblique front propagates from one vortex to the next (in the near wake) at a speed= Up, such as to keep the oblique vortices matched in-phase with the parallel vortices. In (b), for Re < 64, the central-span shedding is not able to match the end conditions. The oblique front is propagated at insufficient speed in the near wake to match the oblique and parallel vortices, and these two cells dislocate from each other, thereby forming the spanwise cells of different frequency.
Q ..... 0
~
!=I=
~ ~ ... .....
f c ;;s

Vortex shedding in the wake of a circular cylinder 611
frequency fo follows a cos() relationship analogous with (5), though we cannot use this locally parallel theory as an explanation of this relationship. Monkewitz (1988) has further shown that the observed bluff-body vortex shedding could be interpreted as the nonlinear saturated result of a global instability, over a spatial region of absolutely unstable flow in the near wake. He investigated a set of typical wake velocity profiles for which the absolute growth rates of oblique waves, in every case, were found to be less than those for the two-dimensional waves. Again, the twodimensional waves were shown to be the most unstable case.
An interpretation of the present results can be given by making the analogous supposition that, in the cylinder wake, two-dimensional or parallel vortex shedding is the most unstable mode. As outlined above, when the Reynolds number is reduced, the end effects impose a decrease in the oblique angle of shedding and a reduction of the shedding frequency fo compared with the two-dimensional shedding frequency J0 , until the ratio folio reaches a lower limit. The central span then jumps out of synchronization with the end conditions to a more unstable mode, where the smaller oblique shedding angle is closer to the two-dimensional case, with a higher growth rate and a higher frequency ratio folio as seen in figure 18. The transition of oblique shedding modes is then a transition from one mode where the central span matches the end boundary conditions to another mode which does not match the end conditions.
This kind of response to the influences from the end conditions has similarities with the forcing of a nonlinear oscillator, whose response can become synchronized with the forcing frequency over a range of values of the forcing frequency. Such a system also exhibits jumps when the frequency of the oscillator falls out of synchronization with the forcing frequency. The above interpretation of the results is clearly only a suggestion that is based on the supposition that smaller oblique angles of vortex shedding are more unstable. Further analytical support could perhaps come from a global theory which takes into account the non-parallel nature of the absolutely unstable wake region behind the body (and ultimately the presence of the body itself).
It could also be mentioned here that, for Re < 64, the angle of shedding in the central-span region, although of a low value, is not actually parallel to the cylinder. This is because the central region is sandwiched between the cells of frequency fL, which are not precisely those end conditions required to generate parallel shedding.
A further suggestion to explain the mode transition can be put forward by considering the spanwise speed of propagation of the oblique front UF, which was introduced in §3.3. A certain speed UF is required to match the oblique and parallel vortices in phase across the front, as shown schematically in figure 19(a). As each vortex is shed, the location of the bend (joining the oblique portion of each vortex to its parallel portion) is displaced spanwise relative to the preceeding vortex. When the transition occurs, the shedding process is unable to translate the front rapidly enough at speed UF to keep the vortices in phase, and then 'vortex dislocations' appear, as are shown in the diagram of figure 19(b). In this case, the bend is not displaced spanwise a sufficient distance (say z*) per cycle to keep the vortices matched in phase. This displacement z* can be estimated by considering the geometry of the front in figure 19 (a), in particular the triangle in this figure, from which z* = -'.0 tan (!8). The mode transition happens when () = 19° and -'.0 = 6.2D, giving a critical value of z* ~D. In the experiment, a reduction in Re brings an increase -'.0 and 8, thereby z* increase until the shedding mechanism is, in some manner, unable to displace the bend greater than this critical z* of one diameter over

612 C. H. K. Williamson
a cycle. The oblique and parallel vortices then move out of phase with each other. At this point, the central portions of the span continue to shed vortices at a higher frequency than the more oblique vortices to the sides, resulting in the appearance of the span wise cells of different frequency, and also the 'vortex dislocations' between the cells.
6. Structure of 'vortex dislocations' between cells of different frequency One of the immediate questions that arises when there are spanwise cells of
different frequency is, what happens to the vorticity between one cell and another? When the vortices in both cells are close to being in phase with each other, then the vortices in the eell of lower frequeney tend to get indueed downstream by the higherfrequency vortices in the other cell, and vice versa. This is because the phase of shedding of one part of a vortex is influenced by the distribution of near-wake vorticity to either side along the span. It is by this process of cell interference that the vortices develop angles that are oblique to the cylinder. When the two eells are out of phase, however, a rather contorted 'tangle' of vortices appears across the eell boundary in what is here ealled a 'vortex dislocation', in analogy with disloeations that appear in solid materials. It is this aspect of the flow about the eylinder that is studied in some detail in the present section.
R,ecent work by Eisenlohr (1986) suggests that it is possible for vortiees of one sign to split and eonneet with two other vortices of the same sign. This was observed from smoke visualization near the ends of the wake of a flat plate (parallel to the flow) which had a blunt trailing edge, and an example is included in Eisenlohr & Eckelmann (1989). We might thus expect similar phenomena to occur when the vortices dislocate near the ends of a circular cylinder.
Browand & Troutt (1985) have also found vortical structures to be generated naturally in the shear layer (downstream of a splitter plate) between spanwise cells of different frequency, or between cells of similar frequency but which are out of phase with each other. These vortical structures were inferred from velocity measurements using a rake of hot wires along the span. Browand & Ho (1987) suggested that these 'defects' or dislocations could be due to slight non-uniformities in the flow, causing differences in frequency along the span. Vortex dislocations could also be induced to oceur artifically by span wise acoustic forcing (Browand & Ho; Browand & Prost-Domasky 1988, 1989) and a process similar to the vortex splitting (mentioned above) could be inferred from their velocity measurements.
Also, Gharib, Aref & Stuber (1988) have extended the work of Van Atta et al. (1988), where a vibrating wire created spanwise structures due to interactions of the wire frequency with the natural shedding frequency. They considered the case of a shear layer forced to have different frequencies over each half-span, by the use of heater strips. They made the suggestion that vortical structures between cells of different frequency could be part of the fundamental process by which streamwise vorticity is generated in shear flows. The present results are consistent with their suggestions, and it is found in this section that the generation of stream wise vorticity is clearly a fundamental characteristic of vortex dislocations.
In the present ease of the oblique vortex shedding modes there are two types of cell boundaries, corresponding with either the beat frequency (fL- fe) or ifu-fL). Physically, it is useful to know how many shedding cycles there are between one dislocation and the next. If two neighbouring cells have Strouhal numbers of 8u and 8L, then this can be derived simply from
nu = 8uf(Su-Sd, (7)

Vortex shedding in the wake of a circular cylinder 613
50~-----------r------------~----------~.-----------~
40
0 0 0
30
0 0 Cb
nl.
20
0
10 ~ooooooooooooooooooo oo oo
0~------------L-------------L-------------~----------~ 0 50 100 150 200
Re
FIGURE 20. The number of cycles between vortex dislocations, on the high-frequency side of the cell boundaries n, versus Re.
where nu is the number of cycles on the high-frequency side of the dislocation. On the low-frequency side, nL = nu- 1. If we take, for example, the case in figure 5, then nu = 32.3. This is approximately indicated in figure 5(b), and it measures the beating period of the velocity fluctuations. Similarly, near the end cell the number of cycles in a beating period is found to be 9.1 or 10.1, depending on which side of the cell boundary is considered, and this is shown in figure 5(d). A plot of nu over the whole range of Re, and for the high-frequency side of the cell boundaries, is shown in figure 20. The lower data in this plot show the number of shedding cycles per beating period for the end-cell boundary (i.e. between cells of frequency fL andfe), while the upper data, at the lower Reynolds numbers, correspond with the boundary between the cells of frequency fu and fL.
Typical formation of vortex dislocations, which occur at the end of the cylinder, can be seen in figure 21. This sequence of photos covers a complete beat cycle, in that the dislocation in figure 21 (a), which is shown in the right half of the picture, is then repeated almost exactly by the time the photograph in figure 21 (f) is reached. It seems to be a common feature of such dislocations that 'vortex division' (termed vortex splitting above) takes place; in this case for exam pie vortex a in figure 21 (c) is shown to divide and connect with two other vortices b and c of the same sign in the higher-frequency cell above. The vortex dislocation, marked by the letter D, can be seen forming in the near wake of the cylinder as we move from figure 21 (b) to 21 (d). Thereafter in the near wake the vortices of each cell are linked more in phase across the cell boundary in figure 21 (e,f), until the next dislocation will appear. The span wise extent of the dislocation clearly expands as it travels downstream in figure 21 (e, f), and the process generates streamwise as well as spanwise vorticity, as will be seen more clearly later. Also, as each dislocation forms, so it is gradually displaced spanwise, leaving a trail of dislocated vortices at some small angle to the free stream. This process is shown schematically in figure 19, and can also be observed in figure 6 (b), and seems to be similar to the 'climbing' or spanwise displacement of

614 C. H. K. Williamson
FIGURE 21. Development over one beating cycle of a' vortex dislocation' near the bottom end of the cylinder span. Flow is from left to right. In (c), note the vortex a in the lower cell dividing and connecting to vortices b and c of the same sign in the higher-frequency upper cell. The dislocation is marked with the letter D. Re = 100.
dislocations observed from hot-wire measurements by Browand & Prost-Domasky (1988). (This terminology again comes from the field of material science.)
From hot-wire measurements (made in the wind tunnel) in this end region of the cylinder, the time traces in figure 22(a) show that within the end cell (z/D = 4.0), or within the central cell (z/D = 19.2), the velocity fluctuations are reasonably periodic, but they have different frequencies. In the trace at z/D = 9.0, it is at the positions marked D that the vortices in each cell dislocate, and thereby minimize the velocity fiuctations, because the induced velocities from the vortices on either side are out of phase. Also, in figure 22 (b), the variation of the phase difference between the trace at z/D = 9.0 relative to that at z/D = 19.2 suggests that the vortices bend gradually out of phase for around six cycles then, during a dislocation, the phase changes rather rapidly in the other direction over about two cycles, and this process repeats itself. It is as though the vortices resist the relinking process across the cell boundary, and then suddenly 'snap' through a dislocation to a new linking configuration. The range of this phase change shown in figure 22 (b) is of the order of l1t, which in space is about half a wavelength.
A more detailed demonstration of the vortex structure of a dislocation is given in

Vortex shedding in the wake of a circular cylinder 615
z/D = 19.2 (a)
200,---------~---------,----------.---------~--------~ (b)
D D D
!50 j l ! 100
50
-50~--------~--------~----------~------~~--------~ 0 5 10 15 20 25
Number of cycles
FIGURE 22. (a) Time traces of velocity fluctuation at different spanwise positions (across the end cell boundary), and (b) phase difference between the fluctuations at z/D = 9.0 and those at zfD = 19.2. Note that the fluctuations at zfD = 19.2 have a higher frequency than those at z/D = 4.0. The dislocation is marked with the letter D. Re = 99.6, SL = 0.1602, s. = 0.1407, n = 8.2 or 7.2.
figure 23 using ordinary dye flow visualization, with the vertical cylinder moving to the right past the fixed camera. Each of the photographs on the left is accompanied by a sketch of the main vortices on the right, where positive vortices are shown as dashed lines and negative vortices by full lines. In this sequence, the higherfrequency cell lies above the lower-frequency cell, and it is of interest to see how the vortices 'divide' as the dislocation develops. In figure 23 (a), the vortex division begins with a positive vortex B in the lower cell being connected to positive vortices B and B' from the upper cell, i.e. some of the vortex lines from the lower vortex B continue to the upper vortex B, while some of the lines continue into B'. The formation of this vortex division occurs during the roll-up process in the near wake of the cylinder. In figure 23(b), similarly to this case the lower negative vortex Cis

616 C. H. K. Williamson
\l ) l
D
F
\ E F
FIGURE 23. Development of a 'vortex dislocation', shown from photographs on the left-hand side, and from corresponding sketches of the vortices shown on the right-hand side. Cylinder moves to the right (camera fixed). The vortex links between the upper-cell vortices (at the higher frequency) with those in the lower cell are stretched into loops, which results in the generation of some streamwise vorticity. Note also vortex division whereby a vortex can be connected with two other vortices of the same sign. Re = 100.
connected to two upper negative vortices C and C', and in figure 23(c), B' is connected both to B and D. By this time the main part of the dislocation is almost complete, and vortices E, F in figure 23 (d) are more directly linked across the cell boundary. One feature that is clearly noticeable in these figures is the stream wise stretching of some of the links between vortices of the upper and lower cells. For example, the links between C to C' orB to B' become stretched into loops of vorticity in figure 23 (b), (c) and (d), and thus some streamwise vorticity is generated during the formation of a vortex dislocation.
Based on the present observations, we can consider an idealization of how the vortices of two cells might be connected. An assumption is made that all the vorticity

Vortex shedding in the wake of a circular cylinder 617
FIGURE 24. Connection of vortices back to the cylinder, occurring at the end of the span. Flow is to the right. This photograph was taken before the first dislocation appeared, near the start of cylinder motion. Note the outer layers of the vortices (vortex sheets) rolling around the central core regions. Re = 70.
1 • Ii ii \
' '
------------10 Wavelengths ------------
1 I I
.!. 8 • 10 ' Iii Iii ii , I I
I I
I
.L 10
I (4)
Vortices of strength !;; I
(2)
J J \ fo fa A t ·! t\ &
i r 1 (3) (I)
I
I I
Vortices of strength I
' \ ' ' \. \
• 7 1 R Ii TO TO Ii Ii
' ' \
' ' '
------------9 Wavelengths ----------...-t
Ii h I
I I
FIGURE 25. Idealized sketch of vortex division and linking between a higher-frequency cell above with a lower one below, of frequency ratio 10 :9. Solid links are of greater strength (indicated by the numbers) than the dashed links.
of one cell is connected to the vortices in the other cell, rather than turning around 180° and being linked to other vortices of the same cell. This assumption is supported by all the present observations, including visualisation of the vortices at the end of a cylinder in figure 24, where it seems that the vortices are connected back upstream to the cylinder. It appears that these connections become distorted by the rotating vortices as they travel downstream, giving only the appearance that they are linked (as could be inferred from figure 21 ). An idealized sketch in figure 25 shows the relative

618 C. H. K. Williamson
strengths of the vortex links (indicated by the numbers) between an upper cell and a lower cell, with a ratio of cell frequencies 10:9. It is assumed that the two cells convect downstream (to the right) at the same speed, and that circulation is produced at the same rate upstream for each cell. The upper-cell vortices therefore have a strength fo-, if the lower vortices are of unity strength. Obviously the relative phase of the two cells affects the picture, and this sketch shows only one possibility. The starting point in drawing the figure was the supposition that a lower vortex (1) divides into two halves. Then vortex (2) in the upper cell will divide into vortices of strength ! and fo. Vortex (3) will then divide into vortices of strength fo and fo, and so on, until the complete sketch is built up. What is of interest in this idealization is the relative strength of the vortex links. It is quite possible that the weaker links (say A strength or below) will be difficult to see in an actual experiment, especially as they may involve vorticity more spread out in the outer layers of the vortices, rather than the more obvious rolled-up core regions of the vortices. For example, the sketches that were drawn from the photographs in figure 23 show only the main vortex divisions. However, upon closer inspection of vortex A in figure 23 (d) as an example, we can see that further vortex division may be present. It may therefore be difficult to trace, in an experiment, all of the vortex linking that might be suggested from such an idealized model.
It has been suggested before by Eisenlohr & Eckelmann (1989) that, at the ends of a cylinder span, all the spanwise vortices join into the horseshoe vortex that is formed upstream at the junction of the cylinder with the endplate. However, the present visualization (in figures 21 and 24, for example) suggests that the wake of the disk and horseshoe vortex are separate from the mechanism by which the vorticity is arranged at the end of a span. This is definitely true in the case of a free-ended cylinder, for which no end plate is present. Although it is clear that, at the ends of a span, the vorticity is turned in the streamwise direction, it is difficult to determine the details of the vorticity distribution in the region close to the cylinder without further careful visualization.
In summary, at the boundary between cells of different frequency, the vortices of one cell and the other are found to move in phase and out of phase with each other. It is therefore not a surprising result that vortex division occurs where typically one vortex is divided up and connected with two others of the same sign in the other cell. However, the dynamics of the vorticity during an out-of-phase period or vortex dislocation is rather complex, and involves a streamwise stretching of some of the vortex links into loops of vorticity. The resulting vortex dislocations may develop into spot-like structures which expand spanwise as they travel downstream.
7. Discussion There are a number of results (in the literature) to support the assertion that
Strouhal-Reynolds number discontinuities can be caused by either flow nonuniformities, in the form of shear in the free stream (e.g. Gaster 1971), or by cylinder vibration (e.g. VanAtta & Gharib 1987; see review by Bearman 1984). However, even without the presence of these phenomena, a discontinuity in the StrouhalReynolds number relationship can exist. In the case of the oblique shedding observed here, we have found that the Strouhal curve has a single discontinuity, which is due to a transition from one oblique shedding mode to another. Also, from the results in figure 17, it seems likely that Tritton's experiments reflected the presence of the same phenomena, although he proposed that there were two intrinsic modes based on different forms of two-dimensional wake instabilities.

Vortex shedding in the wake of a circular cylinder 619
More recently, Karniadakis & Triantafyllou (1989) have concluded, from their two-dimensional numerical computations, that the wake is always periodic in the absence of external forcing, such as that forcing due to cylinder vibrations. They suggested, on the basis of their study of a two-dimensional wake, that non-periodic states in laminar wakes cannot be caused by phenomena of pure fluid-mechanical origin. However, in the present study, it is specifically the three-dimensional nature of the flow (i.e. the oblique shedding) that causes the wake to be non-periodic (i.e. quasi-periodic) despite there being no external forcing. Relevant to this point, there has been some debate recently over whether chaotic or quasi-periodic wake velocity spectra (of the type recorded by Sreenivasan 1985) would exist in the absence of any cylinder vibrations. On the basis of the present results, it seems quite conceivable that some characteristics of Sreenivasan's wake spectra could be attributable to the existence of different oblique shedding modes, although proof of this would require further information regarding body vibrations, etc.
Although the existence of Strouhal discontinuities has been found by a number of previous investigators, there has nevertheless been little agreement as to the critical Reynolds number at which there is a change of shedding modes. The present experiments yielded a critical Reynolds number for all three cylinders of 64± 1 (despite their different length/ diameter ratios, and end plate diameter j cylinder diameter ratios). Possible causes for differences in the critical Reynolds number could, for example, be different levels of flow non-uniformity, differences in the end conditions, or possibly differences in the levels of turbulence in the free stream (as suggested by Berger & Wille 1972). An investigation into such possibilities was not made here. A further feature concerning the oblique modes of shedding is the possibility that a periodic mode may exist below the Reynolds-number region where the Strouhal curves overlap; for example, below Re = 85 for Tritton's data in figure 16. The flow over the span may somehow match the end conditions again over this lower region, although such a case was not observed for any of the cylinders in the present case, because no clear periodic mode was found below Re = 64.
One of the questions prior to the present work was whether the wake over large cylinder spans was truly unaffected by the presence of the end conditions (outside the end cells of lower frequency fe in figure 3), as had previously been supposed. The present results show that, for hundred of diameters, the wake can indeed be affected by the end conditions. It seems likely that spans of even thousands of diameters in length can be affected or 'controlled' by the end effects, although in practice this may require good uniformity of the free stream over large distances, and therefore may be difficult to attain.
Finally, it was of interest to investigate whether the phenomena observed in the present study were applicable also to other bluff body wakes, and for this reason (on the suggestion of Garry L. Brown, private communication) a flat plate parallel to the flow was mounted in the wind tunnel. The plate had an elliptical leading edge and blunt trailing edge to allow vortices to shed effectively from a bluff body, and the chord-to-width ratio could be varied between values of 4, 8 or 12. It was found that not only were vortices shed obliquely, but also that a similar transition of modes and Strouhal discontinuity occurred for the plate as it did for the cylinder, involving also the span wise cells of different frequency and vortex dislocations. This result suggests that similar phenomena found for the cylinder wake may also be observed for a variety of bluff bodies of different cross-section.
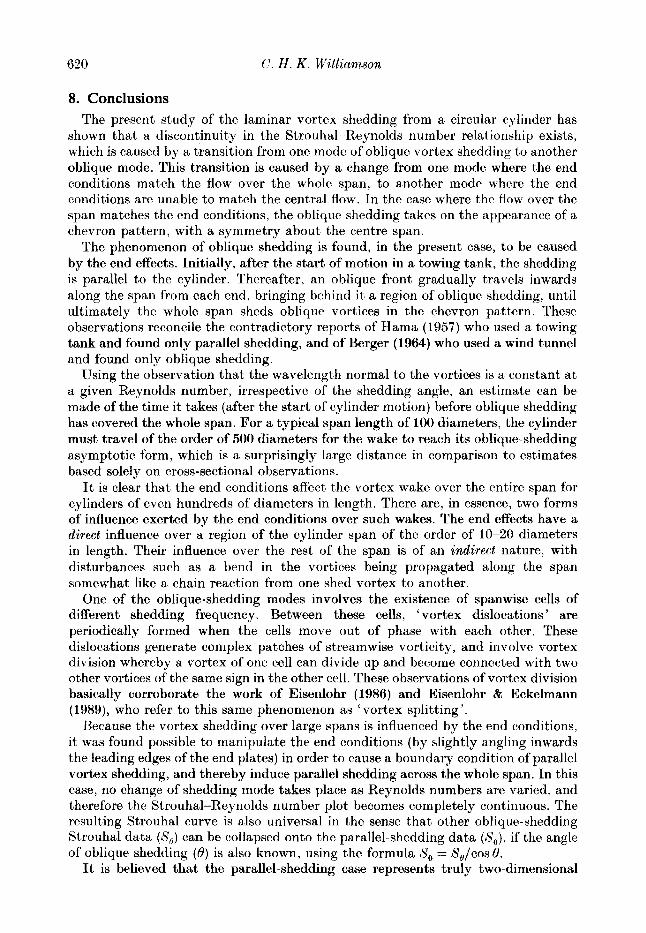
620 C. H. K. Williamson
8. Conclusions The present study of the laminar vortex shedding from a circular cylinder has
shown that a discontinuity in the Strouhal~~Reynolds number relationship exists, which is caused by a transition from one mode of oblique vortex shedding to another oblique mode. This transition is caused by a change from one mode where the end conditions match the flow over the whole span, to another mode where the end conditions are unable to match the central flow. In the case where the flow over the span matches the end conditions, the oblique shedding takes on the appearanoc of a chevron pattern, with a symmetry about the centre span.
The phenomenon of oblique shedding is found, in the present case, to be caused by the end effects. Initially, after the start of motion in a towing tank, the shedding is parallel to the cylinder. Thereafter, an oblique front gradually travels inwards along the span from each end, bringing behind it a region of oblique shedding, until ultimately the whole span sheds oblique vortices in the chevron pattern. These observations reconcile the contradictory reports of Hama (1957) who used a towing tank and found only parallel shedding, and of Berger (1964) who used a wind tunnel and found only oblique shedding.
Using the observation that the wavelength normal to the vortices is a constant at a given Reynolds number, irrespective of the shedding angle, an estimate can be made of the time it takes (after the start of cylinder motion) before oblique shedding has covered the whole span. For a typical span length of 100 diameters, the cylinder must travel of the order of 500 diameters for the wake to reach its oblique-shedding asymptotic form, which is a surprisingly large distance in comparison to estimates based solely on cross-sectional observations.
It is clear that the end conditions affect the vortex wake over the entire span for cylinders of even hundreds of diameters in length. There are, in essence, two forms of influence exerted by the end conditions over such wakes. The end effects have a direct influence over a region of the cylinder span of the order of 10-20 diameters in length. Their influence over the rest of the span is of an indirect nature, with disturbances such as a bend in the vortices being propagated along the span somewhat like a chain reaction from one shed vortex to another.
One of the oblique-shedding modes involves the existence of spanwisc cells of different shedding frequency. Between these cells, 'vortex dislocations' are periodically formed when the cells move out of phase with each other. These dislocations generate complex patches of streamwise vorticity, and involve vortex division whereby a vortex of one cell can divide up and become connected with two other vortices of the same sign in the other cell. These observations of vortex division basically corroborate the work of Eisenlohr (1986) and Eisenlohr & Eckelmann (1989), who refer to this same phenomenon as 'vortex splitting'.
Because the vortex shedding over large spans is influenced by the end conditions, it was found possible to manipulate the end conditions (by slightly angling inwards the leading edges of the end plates) in order to cause a boundary condition of parallel vortex shedding, and thereby induce parallel shedding across the whole span. In this case, no change of shedding mode takes place as Reynolds numbers are varied, and therefore the Strouhal-Reynolds number plot becomes completely continuous. The resulting Strouhal curve is also universal in the sense that other oblique-shedding Strouhal data (S0 ) can be collapsed onto the parallel-shedding data (S0 ), if the angle of oblique shedding (0) is also known, using the formula S 0 = S 0 jcos0.
It is believed that the parallel-shedding case represents truly two-dimensional

Vortex shedding in the wake of a circular cylinder 621
vortex shedding, in the sense that there is an absence of axial flow in the vortices and the flow within one cross-section is representative of (and in-phase with) the flow at all span wise positions (with the exception of close to the ends). The Strouhal data for this two-dimensional shedding has been compared with results from two-dimensional numerical simulations, although the comparison yields a large disparity amongst the computations themselves, and also with the experimental results. This large disparity is not, as yet, understood.
In conclusion, there has been some question in the past whether oblique shedding or parallel shedding is the intrinsic mode of the wake. The present results show that they are both intrinsic and are simply solutions to different problems, because the boundary conditions are different in each case.
The author is particularly grateful to Anatol Roshko for valuable discussions, and to Garry L. Brown (Director of the Aeronautical Research Laboratories, Melbourne, Australia) for his suggestions and great enthusiasm during many of the wind tunnel experiments. Special thanks are due to Holger Eisenlohr (University of Gottingen) for our conversations regarding oblique shedding. The author is also grateful for discussions/help received from Paul Taylor (of Shell Research Ltd., Thornton, England), S. Schneider, M. Holcomb, I. Sugioka, D. Lisoski, J. Jacobs, and for the technical construction work of R. Paniagua. Lastly, the author is grateful to F. Raichlen for the use of a small towing tank (in 1985) which resulted in the visualization of figure 23. This work was supported by the Office of Naval Research Contract No. N00014-84-K-0618.
Appendix A. Effect of a variation of L j D on the oblique-shedding frequency and cell structure
In the case of a long cylinder at a Reynolds number above the discontinuity (Re > 64), a cell of frequency (denoted fL) can be found over the main body of the span, with two further cells of lower frequency (denoted/e) found near the ends and extending over a spanlength of around 10 diameters. If the length of the cylinder is reduced, the central cell is found to contract until, at a certain critical LjD (found here to be 28), this central cell suddenly vanishes. At this point the end cells merge together, leaving the whole span shedding vortices at the one frequency fe· (Such an observation is consistent with the results of Gerich 1986.) This phenomenon can be observed from the spectra and diagrams shown in figure 26, for a Reynolds number of 101.0. In the left column are shown spectra taken from a hot wire situated in the centre of the span, for various LjD. In the right column are shown diagrams of the corresponding arrangements of the different frequency cells across the span.
For values of LjD > 45, the wake velocity fluctuations give a periodic spectrum with a peak corresponding to the frequency fL (giving in this case a Strouhal number of0.1610), as shown in figure 26(a). As LjD is reduced, so the hot wire increasingly feels velocity fluctuations at the end-cell frequency fe until, at a value of LjD = 30 in figure 26(c), there is approximately equal energy from fluctuations at the two frequencies. In this case, the spectrum is quasi-periodic with many peaks, all of which correspond with combinations of the two frequencies fL and fe· As can be seen in figure 26, there is a gradual change in the form of the spectrum as LjD is reduced down to the value of 28, although further reduction in the cylinder length causes a sudden vanishing of the central cell, and with it an abrupt change from a quasiperiodic spectrum to a periodic one. This is demonstrated clearly by comparing figure

622 C. H. K. Williamson
(dB)
~-1~ -20
-30 t.--
(a) LfD = 80 1~
(b)
(c)
(d)
t 150 582 664 1140
(Hz)
• ~: ~--
•
t f
(a)
(b)
(c)
(d)
FIGURE 26. Effect of a variation of cylinder length/diameter ratio (L/D) on the spectra of the wake velocity fluctuations (shown on the left), and on the cell arrangement along the span (on the right). The hot wire was situated in the centre of the cylinder span in each case (position shown in the diagrams by a solid circle), at around 10 diameters downstream of the cylinder axis and 1.5 diameters from the wake centreplane. Re = 101.0. D = 0.061 em. Endplate diam./cylinder diam. = 15. Endplates parallel with the free stream.
26(c and d). In the latter case, the spectrum now has a peak corresponding to a Strouhal number of 0.1408, which is 13% below that for the periodic spectrum in figure 26 (a).
Measurements of Strouhal number in figure 27, again at Re = 101.0, show that for LID> 28 the frequency fL over the central span is unaffected by a variation in LID. Also, velocity fluctuations at the frequency fe can be felt in the spectrum for LID < 45. These results suggest that for LID > 45, the vortex shedding in the central span is unaffected by the direct influence of the end cells. Nevertheless, the end effects have an influence on the flow over the whole span in an indirect fashion, and this point is discussed further in §3.3.
With relevance to the above results, some indication of the relative importance of different parts of a wake vorticity distribution in inducing velocities at a point close to the cylinder, can be given from Biot-Savart considerations. For example, consider

Vortex shedding in the wake of a circular cylinder 623
0.17
0.16
s
0.15 1-
:-·- ..... --- --- --·------ .. -\---- - .. ---- ----·--
1 SL = 0.1610 I I I I
0.14 1- ~-·~
s. = 0.1408
0.13
0 20 40 60 80 100 120 140 160 LID
FIGURE 27. Strouhal numberS versus cylinder length/diameter ratio L/D for the frequency of vortex shedding in the centre of the span. Re = 101.0. Note the sudden drop in the frequency at L/D = 28, which corresponds with an abrupt change in the spectra and cell arrangement shown in figure 26.
an element of a wake vortex parallel to the cylinder, and lying at (x, z) which are the streamwise and spanwise coordinates relative to the point of interest (our origin). Then the magnitude of the induced velocity I ~ul can be shown to vary as
for a small vortex element of length ~s and circulation per unit length r. The induced velocity of a vortex element decays rapidly like 1/z3 at large spanwise distances (z) from the origin, and like 1/x2 for large streamwise distances (x) from the origin. Using a more specific example, consider a parallel vortex half a shedding wavelength downstream (around 2.5 diameters downstream) from a point of interest near the cylinder. In this case, an element ofthe vortex induces a velocity that is less than 1% of its value for the case when z = 0, when the element is greater than 11D away in the spanwise direction. The above considerations suggest that the dynamics of vortex shedding at some spanwise position are influenced in a direct fashion mainly by the local distribution of wake vorticity, in a region spanning typically 10 diameters to either side of the position of interest.

Appendix B. ~ ~ ,j:o.
Basic Strouhal-number measurements Oblique-angle measurements Parallel-shedding measurements
D = 0.104 em. D = 0.061 em. D = 0.051 em. D = 0.104 em. D = 0.104 em.
LJD = 140.0 LJD = 200.0 LJD = 240.0 LJD = 90.0 LJD = 100.0
d/D = 12.2 dJD = 20.7 d/D = 25.0 djD = 12.2 d/D = 10.0
Re s Re s Re s Re s 8 Sjcos8 Re s jD2 jv
49.10 0.1198 49.00 0.1183 53.20 0.1244 49.70 0.1205 2.07 0.1206 47.90 0.1220 5.8438 55.20 0.1271 49.30 0.1189 55.10 0.1292 50.90 0.1222 7.55 0.1233 49.40 0.1241 6.1305 55.30 0.1241 51.20 0.1226 60.40 0.1345 51.00 0.1223 1.34 0.1223 51.70 0.1272 6.5762 57.90 0.1309 52.90 0.1243 62.40 0.1368 52.30 0.1240 6.75 0.1249 54.20 0.1295 7.0189 58.70 0.1275 55.20 0.1280 64.90 0.1352 54.50 0.1267 10.75 0.1290 56.70 0.1325 7.5127 59.30 0.1282 57.10 0.1307 67.20 0.1369 55.30 0.1276 9.37 0.1293 59.20 0.1347 7.9742 0 59.70 0.1322 59.10 0.1333 69.60 0.1389 54.60 0.1268 10.64 0.1290 61.90 0.1378 8.5298 ~ 61.60 0.1343 61.20 0.1351 70.90 0.1406 58.10 0.1306 9.90 0.1326 64.20 0.1399 8.9816
~ 62.00 0.1304 63.00 0.1368 76.70 0.1452 58.20 0.1308 10.58 0.1331 66.60 0.1420 9.4572 62.40 0.1315 65.00 0.1389 89.90 0.1538 60.10 0.1327 8.68 0.1342 69.10 0.1442 9.9642 ~ 62.40 0.1347 66.90 0.1369 100.20 0.1598 60.70 0.1333 9.53 0.1352 71.60 0.1461 10.4608 :;::::
0.1395 104.00 62.60 10.12 0.1372 73.90 0.1478 10.9224 ""· 63.60 0.1366 69.50 0.1615 0.1351 ~
64.20 0.1330 72.40 0.1416 110.40 0.1652 63.10 0.1355 10.31 0.1377 76.50 0.1495 11.4367 ~ "' 64.30 0.1332 75.10 0.1438 119.70 0.1690 64.80 0.1333 18.80 0.1408 79.00 0.1514 11.9606 0 ;;z
65.10 0.1346 77.80 0.1463 125.00 0.1722 66.10 0.1348 18.28 0.1420 81.50 0.1531 12.4776 65.80 0.1350 80.10 0.1481 130.90 0.1740 67.40 0.1362 18.49 0.1436 84:00 0.1545 12.9780 67.20 0.1363 82.60 0.1497 133.20 0.1745 68.20 0.1371 17.42 0.1437 86.30 0.1561 13.4714 67.50 0.1362 85.20 0.1514 140.20 0.1770 69.90 0.1388 17.74 0.1457 89.00 0.1574 14.0086 70.50 0.1395 87.50 0.1529 145.50 0.1778 71.90 0.1407 16.92 0.1471 91.30 0.1590 14.5167 72.30 0.1415 90.10 0.1547 150.00 0.1791 72.20 0.1411 16.55 0.1472 94.00 0.1605 15.0870 76.60 0.1446 92.80 0.1561 155.50 0.1807 74.80 0.1435 16.15 0.1494 96.50 0.1620 15.6330 78.90 0.1471 95.10 0.1577 159.90 0.1814 75.10 0.1437 15.21 0.1489 99.00 0.1635 16.1865 80.80 0.1483 97.70 0.1591 161.50 0.1826 77.40 0.1457 15.49 0.1512 101.40 0.1648 16.7107 81.40 0.1487 100.10 0.1604 165.60 0.1833 77.60 0.1459 14.41 0.1506 103.70 0.1659 17.2038 83.90 0.1505 102.60 0.1617 169.10 0.1844 80.71 0.1483 14.72 0.1533 106.20 0.1669 17.7248 86.30 0.1521 104.90 0.1629 171.20 0.1851 84.70 0.1512 14.29 0.1560 108.70 0.1683 18.2942 89.00 0.1540 107.30 0.1644 87.50 0.1531 13.72 0.1576 111.20 0.1695 18.8484 91.10 0.1557 110.10 0.1655 92.20 0.1561 12.70 0.1600 113.70 0.1704 19.3745

94.00 0.1566 1 12.30 0.1668 - 94.90 0.1577 12.35 0.1614 116.10 0.1716 19.9228 96.20 0.1581 115.10 0.1680 - 95.60 0.1581 12.64 0.1620 118.60 0.1725 20.4-585 98.70 0.1595 117.70 0.1691 - 97.00 0.1589 12.41 0.1627 121.10 0.1737 21.0351
101.60 0.1609 120.20 0.1701 - 99.00 0.1600 12.58 0.1639 123.60 0.1745 21.5682 103.50 0.1620 122.30 0.1711 - 99.50 0.1602 12.46 0.1641 126.00 0.1756 22.1256 106.30 0.1634 125.20 0.1723 - 105.00 0.1630 12.58 0.1670 128.50 0.1766 22.6931 108.50 0.1643 127.40 0.1731 - 110.10 0.1653 12.46 0.1693 131.00 0.1775 23.2525 111.10 0.1653 130.10 0.1740 - 115.30 0.1675 12.16 0.1713 133.40 0.1783 23.7852 113.50 0.1667 132.50 0.1749 - 119.90 0.1693 12.04 0.1731 135.90 0.1791 24.3397 ~ 116.40 0.1678 135.00 0.1758 - 124.90 0.1711 11.92 0.1749 138.40 0.1803 24.9535 "" """" 118.70 0.1691 137.60 0.1765 129.50 0.1728 11.74 0.1765 140.80 0.1809 25.4707 "" - :s!
121.00 0.1701 139.80 0.1770 - 135.60 0.1747 11.74 0.1784 143.10 0.1819 26.0299 Co .,_,... 123.80 0.1709 142.60 0.1776 - 140.20 0.1761 11.98 0.1800 145.60 0.1825 26.5720 "' ~ 124.00 0.1708 145.30 0.1785 - 144.80 0.1774 12.70 0.1818 148.10 0.1835 27.1763 ~
""· 126.30 0.1717 147.50 0.1792 - 149.70 0.1788 12.82 0.1834 150.30 0.1840 27.6552 ;;:;: <Q
128.90 0.1725 149.90 0.1798 - 155.00 0.1802 12.76 0.1848 152.80 0.1847 28.2222 ""· 133.80 0.1743 152.50 0.1804 - 161.10 0.1817 12.58 0.1862 155.40 0.1854 28.8112
;;:;:
136.00 0.1750 155.20 0.1809 - 165.30 0.1827 12.82 0.1874 157.90 0.1861 29.3852 s. "' 138.30 0.1757 157.60 0.1816 - 170.40 0.1838 12.76 0.1885 160.30 0.1864 29.8799 ~
141.40 0.1768 160.20 0.1822 - - - 162.80 0.1871 30.4599 ~ ?:--'
144.10 0.1778 162.80 0.1829 - - 165.20 0.1873 30.9420 "' 147.10 0.1780 165.00 0.1834 - - 167.70 0.1880 31.5276 ~ 149.00 0.1785 167.60 0.1841 - 170.30 0.1892 32.2208 ~
151.40 0.1794 170.00 0.1847 - - 172.60 0.1894 32.6904 '"' ""· 0.1800 172.30 175.00 0.1902 32.2850 "" 154.00 0.1853 - - ·- '"'
"" 156.20 0.1807 174.40 0.1856 - 177.50 0.1906 33.8315 ~ 159.20 0.1812 175.00 0.1858 - - "" 161.30 0.1819 176.10 0.1860 '"' - - - - ~ 163.90 0.1824 177.90 0.1865 - - - - - ""· ;;:;: 166.60 0.1827 - - - ~
"' 169.10 0.1830 "" 171.40 0.1838 174.20 0.1845
TABLE 1. Tabulated examples of Strouhal-number data for oblique and parallel vortex shedding
o-t-:l Cl

626 C. H. K. Williamson
REFERENCES
AREF, H. & FLINCHEM, E. P. 1984 Dynamics of a vortex filament in a shear flow. J. Fluid Mech. 148, 477.
BEARMAN, P. W. 1965 Investigation of the flow behind a two-dimensional model with a blunt trailing edge and fitted with splitter plates. J. Fluid Mechn. 21, 241.
BEARMAN, P. W. 1984 Vortex shedding from oscillating bluff bodies. Ann. Rev. Fluid Mech. 16, 195.
BERGER, E. 1964 Transition of the laminar vortex flow to the turbulent state of the Karman vortex street behind an oscillating cylinder at low Reynolds number. (In German) Jahrbuch 1964 de Wiss. Gess. L. R., p. 164.
BERGER, E. & WILLE, R. 1972 Periodic flow phenomena. Ann. Rev. Fluid Mech. 4, 313. BRAZA, M., CHASSAING, P., HA MINH, H. 1986 Numerical study and physical analysis of the
pressure and velociety fields in the near wake of a circular cylinder. 165, 79. BROW AND, F. K. & Ho, C.-M. 1987 Forced unbounded shear flows. Nucl. Phys. B (Proc. 8uppl.)
2, 139. BROW AND, F. K. & PROST-DOMASKY, S. A. 1988 Technique for acoustic excitation of separated
shear flows: preliminary results. ASME Winter meeting, Chicago, Illinois.
BROWAND, F. K. & PROST-DOMASKY, S. A. 1989 Experiment on pattern evolution in the 2-D mixing layer. To appear in New Trends in Nonlinear Dynamics and Pattern Forming Phenomena (ed. P. Huerre)
BROW AND, F. K. & TROUTT, T. R. 1985 The turbulent mixing layer: geometry of large vortices. J. Fluid Mech. 158, 489.
EISENLOHR, H. 1986 Investigations of the wake of a plate parallel to the flow with a blunt trailing edge. (In German.) Diplom. Thesis, Berich 3/1986, Max-Planck-Inst. fur Stromungsforschung, Gottingen.
EisENLOHR, H. & EcKELMANN, H. 1989 Vortex splitting and its consequences in the vortex street wake of cylinders at low Reynolds number. Phys. Fluids A 1, 189.
FRIEHE, C. A. 1980 Vortex shedding from cylinders at low Reynolds numbers. J. Fluid Mech. 100, 237.
GASTER, M. 1969 Vortex shedding from slender cones at low Reynolds numbers. J. Fluid Mech. 38, 565.
GASTER, M. 1971 Vortex shedding from circular cylinders at low Reynolds numbers. J. Fluid Mech. 46, 749.
GERICH, D. 1986 A limiting process for the Karman street showing the change from two- to threedimensional flow. In Flow Visualisation 4 (ed. C. Veret), pp. 463-467. Hemisphere.
GERICH, D. & EcKELMANN, H. 1982 Influence of end plates and free ends on the shedding frequency of circular cylinders. J. Fluid Mech. 122, 109.
GERRARD, J. H. 1978 The wakes of cylindrical bluff bodies at low Reynolds number. Phil. Trans. Roy. Soc. Lond. A 288, 351.
GHARIB, M., AREF, H. & STUBER, K. 1988 Study of the origin of three-dimensional structures in shear flows through external forcing. AFOSR Contractors meeting, University of Southern California, Los Angeles, Californ'ia.
GRAHAM, J. M. R. 1969 The effect of end-plates on the two-dimensionality of a vortex wake. Aero. Q. 20, 237.
GRIFFIN, 0. M. & VoTAW, C. W. 1972 The vortex street in the wake of a vibrating cylinder. J. Fluid Mech. 55, 31.
HAMA, F. R. 1957 Three-dimensional vortex pattern behind a circular cylinder. J. Aerosp. Sci. 24, 156.
KARNIADAKIS, G. E. & TRIANTAFYLLOU, G. S. 1989 Frequency selection and asymptotic states in laminar wakes. J. Fluid Mech. 199, 441.
KOHAN, S. & SCHWARZ, W. H. 1973 Low speed calibration formula for vortex shedding from cylinders. Phys. Fluids. 16, 1528.
MATHIS, C., PROVANSAL, M. & BOYER, L. 1984 The rotating grating applied to the study of the

Vortex shedding in the wake of a circular cylinder 627
Benard-von Karman instability near the threshold. In Proc. Second lnt 8ymp. on Applications of Laser Anemometry to Fluid Mechanics, Lisbon, p. 12.5
MAULL, D. J. & YouNG, R. A. 1973 Vortex shedding from bluff bodies in a shear flow. J. Fluid Mech. 60, 401.
MONKEWITZ, P. A. 1988 The absolute and convective nature of instability in two-dimensional wakes at low Reynolds numbers. Phys. Fluids. 31, 999.
NoRBERG, C. 1987 Effects of Reynolds numbers and a low-intensity freestream turbulence on the flow around a circular cylinder. Chalmers Univer8ity of Technology, Publication 87/2, S-412-96, Goteborg, Sweden.
RAMBERG, S. E. 1983 The effects of yaw and finite length upon the vortex wakes of stationary and vibrating cylinders. J. Fluid Mech. 128, 81.
RosHKO, A. 1954 On the development of turbulent wakes from vortex streets. NACA Rep. 1191. RoSHKO, A. 1955 On the wake and drag of bluff bodies. J. Aeronaut. Sci. 22, 124. SA, J.-Y. & CHANG, K.-S. 1989 Shedding patterns of the near wake vortices behind a circular
cylinder. J. Fluid Mech. (submitted).
SLAOUTI, A. & GERRARD, J. H. 1981 An experimental investigation of the effects on the wake of a circular cylinder towed through the water at low Reynolds numbers. J. Fluid Mech. 112, 297.
SQUIRE, H. B. 1933 On the stability for three-dimensional disturbances of viscous fluid flow between parallel walls. Proc. Roy. Soc. Lond. A 142, 621.
SREENIVASAN, K. R. 1985 Transition and turbulence in fluid flows and low-dimensional chaos. In Frontiers in Fluid Mechanics (ed. S. H. Davis & J. L. Lumley), pp. 41-66. Springer.
TRITTON, D. J. 1959 Experiments on the flow past a circular cylinder at low Reynolds numbers. J. Fluid Mech. 6, 547.
TRITTON, D. J. 1971 A note on vortex streets behind circular cylinders at low Reynolds numbers. J. Fluid Mech. 45, 203.
VANATTA, C. & GHARIB, M. 1987 Ordered and chaotic vortex streets behind circular cylinders at low Reynolds numbers. J. Fluid Mech. 174, 113.
VAN ATTA, C., GHARIB, M. & HAMMACHE, M. 1988 Three-dimensional structure of ordered and chaotic vortex streets behind circular cylinders at low Reynolds numbers. Fluid Dyn. Res. 3. 127.
WILLIAMSON, C. H. K. 1988a Defining a universal and continuous Strouhal~Reynolds number relationship for the laminar vortex shedding of a circular cylinder. Phys. Fluids 31, 2742.
WILLIAMSON, C. H. K. 1988b The existence of two stages in the transition to three-dimensionality of a cylinder wake. Phys. Fluids 31, 3165.