Embed Size (px)
Citation preview

N.V. Eneco Beheer Annual report 2016


Contents
Management Report
2 Introduction2 Main developments 20163 About this report
4 Message from the Board4 Foreword7 Trends and developments8 Progress19 Risk management
25 Financial statements26 Consolidated financial statements 201630 Notes to the consolidated financial statements40 Notes to the consolidated income statement44 Notes to the consolidated balance sheet68 Notes to the consolidated cash flow statement69 List of principal subsidiaries, joint operations, joint ventures and associates71 Company financial statements73 Notes to the company financial statements
75 Other information
N.V. Eneco Beheer Annual Report 2016 1

Main developments 2016
• Net profit from continued operations € 103 million (2015: €
55 million)
• Nearly 300,000 Toon thermostats installed in the
Netherlands since introduction
• Norther, largest offshore wind farm in Belgium, ready for
construction
• Eneco part of winning consortium offshore wind farm
Borssele III & IV
• Sustainable collaboration with TU Delft, Unilever, Mars and
PostNL
• DELTA places wind and solar energy activities with Eneco
• Eneco acquires 50% holding in German company LichtBlick
Introduction
2 N.V. Eneco Beheer Annual Report 2016

About this report
In view of the unbundling of (the group of) Eneco Holding N.V.
in an energy company and a network company by 31 January
2017, the network activities of N.V. Eneco Beheer have been
transferred to Eneco Holding N.V. in 2016. In the N.V. Eneco
Beheer financial statements, the results of these activities in
2016 up to the moment of unbundling have been classified as
result from discontinued operations. Summary information on
the network activities up to the moment of transfer is provided
in the first part of the Management Report. The information in
the Management Report of N.V. Eneco Beheer further relates
to the production, trading and supply activities of the energy
company, which will be continued.
Introduction
N.V. Eneco Beheer Annual Report 2016 3
Foreword
Towards the new energyworldEnergy company Eneco (hereafter also referred to as Eneco) endedthe final full year of its existence as part of Eneco Group with andencouraging result. Despite the attention that the company devotedto the unbundling of the group in accordance with the IndependentNetwork Management Act (Wet Onafhankelijk Netbeheer, WON),customers, innovation, employees, safety and the financial resultcontinued to be the focal points.
The result after tax from continued operations in 2016 was €
103 million (comparable result 2015: € 55 million). The revenue
from continued operations decreased to € 2,746 million (2015:
€ 3,136 million), mainly as a result of lower electricity and gas
prices.
Unbundling of the organisationAs of 31 January 2017, Eneco Holding N.V. will cease to be an
integrated energy company in which network-related and
production and supply activities exist side-by-side. This is the
consequence of the WON Act of 2006, also known as the
Unbundling Act.
The production and supply activities have been placed in a new
holding, Eneco Groep N.V., which includes energy company
Eneco. This strong, independent and financially sound company
implements a sustainable strategy. Eneco will continue to
invest in the production of sustainable energy together with its
customers and will strive for growth by providing innovative
products and services that give customers control over their
energy supply. Not only in the Netherlands but also in Belgium,
Germany, France and the United Kingdom.
Network activities first half 2016During the first six months of 2016, the activities of Stedin
Netbeheer and Stedin Diensten were still placed under N.V.
Eneco Beheer. The following summary information relates to
the corresponding activities and results.
Market conditions put pressure on the results. Revenue from
regulated activities and the associated transmission purchase
costs were fairly stable. There was a slight increase in revenue
from other commercial services. Total operating expenses rose
due to higher employee benefits and cost of outside staff, an
increase in municipal taxes for encroachments on or over public
land (precario) and higher costs associated with the rollout of
smart meters.
There was an increase both the number of own employees and
hired outside staff. This increase is mainly due to the rollout and
installation of smart meters on a larger scale in 2016 than in
2015, the increased level of construction and replacement of
networks and an expansion of IT activities. These employees
were deployed more on investment projects and these costs
were not charged to the result.
The main causes of the increase in expenses were the precario
and the rollout of smart meters. The cost of the tax levied by
municipalities on our underground cables and pipelines (precario)
went up, partly because the rate was increased and partly
because more municipalities are levying this tax.
The large-scale rollout of smart meters progressed well in 2015
and accelerated in 2016. In the first six months of 2016, Stedin
sent offers for the installation of a smart meter to more than
161,000 customers and installed 130,000 meters. The
installation involves costs in connection with adaptations that
need to be made on site. Other direct and indirect costs related
to this process are the expansion of the vehicle fleet to visit all
the locations, telecoms costs from the time the meters are
connected, depreciation as a result of capital expenditure in
Message from the Board
4 N.V. Eneco Beheer Annual Report 2016

recent years and disposal of ordinary meters which have not
yet been fully depreciated.
In the first half of 2016, Stedin invested €182 million in the gas
and electricity transmission networks. This is an increase
compared with the previous year, which can mainly be
attributed to the large-scale rollout of smart meters.
Furthermore, Stedin took the new Dordrecht Oranjelaan
electricity sub-station into use. This sub-station is part of a € 31
million investment for modernising the electricity network in
Dordrecht and Zwijndrecht.
Energy company Eneco, main resultsThe following information relates to the main results of energy
company Eneco in 2016.
Services in orderIn view of our aim that customers would notice little to nothing
of the unbundling-related activities, these activities have mainly
taken place in the background. Eneco produced good results in
its daily operations, always with the interests of customers in
mind. One Planet Thinking is the theme that determines our
overarching objective, which is to keep our own energy
consumption and that of our customers within the limits of a
habitable planet. By providing innovative solutions that increase
the sustainability of the energy consumption of our customers,
we contribute to society and to the energy system as a whole,
both in the Netherlands and abroad.
Satisfaction among Eneco and Oxxio customers increased, in
part as a result of improved alignment between services
provided and customer needs, for example in relation to the
annual bill and providing customer support over the phone.
SafetySafety will always be a priority in view of the nature of our
work. Despite the changes in our organisation, we succeeded in
paying consistently high attention to safety. The business
culture programme that we have introduced to ensure that
safety risks are identified and discussed, contributed to this
result. This way, safe behaviour is stimulated.
Our aim is to prevent occupational accidents as much as
possible. The total of 17 occupational accidents in 2016 was
significantly below the target of a maximum of 30.
Occupational accidents are accidents that require medical
attention and may result in the need for temporary alternative
work. Although we achieved this year's target, we will continue
to strive to reduce the number of occupational accidents even
further.
Strategy in progressWe continued with the implementation of our strategy in 2016.
The mission ‘sustainable energy for everyone’ forms our
inspiring starting point. Everything that we undertake and every
investment that we make must be relevant for our customers
and contribute to and stimulate the acceleration of the energy
transition.
Eneco builds sustainable production facilities at the request of
or in collaboration with its customers. As a result, the capacity
of our own sustainable production facilities currently exceeds
1,000 MW. At the end of the year, we concluded a number of
large contracts. The Eneco, Mitsubishi Corporation, Shell and
Van Oord consortium won the tender for the construction of
the offshore wind farms Borssele III & IV, located 22 kilometres
off the coast of the province of Zeeland. It is expected that the
wind farms will generate more than 3,200 GWh of electricity
per year, which corresponds to the average consumption of
around 825,000 households. As of 1 January 2017, all of
Unilever's offices and production facilities in the Netherlands
will use Eneco HollandseWind® energy generated by our
Luchterduinen wind farm. This agreement is part of a broader
collaboration aimed at supporting Unilever in achieving its
sustainability objectives. We also acquired the sustainable
assets of energy company DELTA in 2016.
In the municipality of Zeebrugge in Belgium, we put a wind farm
consisting of four wind turbines into operation. Delft University
of Technology and Eneco have agreed that, as of 2017, the
university will only purchase electricity that has been produced
in a sustainable manner within the Netherlands and that these
purchases will take place via Eneco. PostNL and Eneco have
entered into an agreement to install 22,000 solar panels on top
of 19 sorting offices. In the United Kingdom, Mars announced
that, for a period of ten years, it will purchase power from the
Moy wind farm, which was put into operation by Eneco in the
spring. A large solar farm on the Dutch island of Ameland came
on stream. This solar farm was a joint project of the
municipality of Ameland, the local Amelander energy co-
operative and Eneco. In France, we have realised two large
solar power projects: Renaud Extension consisting of solar
panels on the roof of a construction company and Lycée Estat,
where solar panels were installed on the roofs of an agricultural
college.
In addition to supplying energy, we also develop services aimed
at giving our customers full support and providing them with a
better understanding of their energy consumption. In this
context, Eneco acquired a non-controlling interest in Simaxx.
This company develops software that increases energy
efficiency by means of the management and smart control of
installations in industrial buildings and offices. The smart Toon
thermostat, developed by Eneco in collaboration with Quby, is a
highly valued tool for monitoring and reducing the energy
consumption of households. The possibilities of Toon are being
further expanded and improved with the aid of and the input
provided by customers. The sales figures are good; at the end
Message from the Board Foreword
N.V. Eneco Beheer Annual Report 2016 5
of 2016 the installed base of Toon thermostats had grown to
nearly 300,000 units.
The HeatWinner (WarmteWinner) is a promising innovation that
was developed by Eneco in collaboration with Inventum and
customers and was launched in January 2016. This innovative
heat pump captures heat from ventilation air, as a result of
which the amount of gas that is needed for heating purposes is
reduced. 2016 was also the year in which Luminizer for Industry
was introduced, a management and operating environment
developed by Luminext for the safe, sustainable and energy-
efficient operation of lighting on business premises. These
examples are just a selection of our leading-edge solutions and
the partnerships that Eneco has entered into with the aim to
accelerate innovation. A more extensive overview can be found
in the section Innovative products and services (page 9).
In conclusionWhile it was a dynamic year from an organisational point of
view, our focus was on attention for and co-development with
our customers. We introduced the concept of agile working to
maximise our flexibility and to be able to respond to what is
happening in our surroundings and to customer needs. As a
result, we are better equipped to achieve the acceleration
required for the energy transition.
Energy company Eneco is well positioned to realise its mission
'sustainable energy for everyone' and to guide its customers
into the new energy world.
Message from the Board Foreword
6 N.V. Eneco Beheer Annual Report 2016

Trends and developments
TransitionWe have been working on the realisation of our mission 'Sustainableenergy for everyone' since 2007. The trends that we observe in theenergy world reinforce our mission and our vision on how to achieveit. We will not achieve our mission until we have succeeded inreducing our customers’ and our own energy consumption to withinthe limits of a liveable planet (One Planet Thinking).
The energy transition is acceleratingOur society is in the middle of the energy transition: the
transition from the ‘old world’ based on a central fossil energy
system to the ‘new world’ based on a system in which
sustainable energy is produced, used, stored and shared locally.
On the one hand, the energy transition is being slowed down
due to the low prices of fossil fuels and electricity. On the other
hand, it is accelerating as a result of changes in customer
behaviour and local initiatives based on ideals and/or
technological developments. Such initiatives are stimulated by
government bodies at all levels: ranging from municipalities
(phasing out gas in city districts) to the national government
(stimulation of wind power), and from the EU to the global Paris
climate agreement. Eneco strived to achieve growth in 2016 in
the areas of solar power plants, offshore and onshore wind
farms and new, smart innovations that increase the flexibility of
the energy system. By doing so, we ensure that the energy
system continues to be reliable and affordable in collaboration
with our customers. The number of households that are
reducing their energy consumption by means of the Toon smart
thermostat is increasing rapidly. This contributes to lower
energy bills for our customers and to the acceleration of the
energy transition.
New order: new needs, new marketsEven though the price of energy is still the main consideration
for many people, the group of people that put an emphasis on
other aspects is growing. An increasing number of business
customers are opting for sustainable solutions to optimise their
business processes and make them future-proof. Furthermore,
research shows that a large group of consumers expect to be
self-sufficient within ten years. More and more often, they
select solutions that are not only smart and sustainable, but
also reduce their dependency on energy companies and price
fluctuations. As a result of these changes, we are faced with
new market players in addition to the existing energy
companies and with new revenue models.
Emergence of new, decentralisedorganisational structuresDue to the changes in the energy system, more flexibility in the
procurement, production and consumption of energy is required
in order to balance supply and demand efficiently and safely.
This calls for innovation in areas such as transmission, storage
and revenue models. The current centralised system is not
designed to deal with the situation in which large numbers of
households make the transition to heat pumps, solar panels
and electric cars within a short time frame. At present, these
developments put significant pressure on the networks in
neighbourhoods, districts and villages. This means that we
must address local challenges together at the local level. The
traditional boundaries between supplier, producer and customer
are disappearing.
Vision – ‘Decentralised SustainableTogether’Sustainable energy for everyone will be achieved by focusing on
the three aspects of our vision: Decentralised Sustainable
Together. We are not the only one to opt for sustainability. We
believe that the energy transition centres on the shift from a
centrally organised energy system to a decentralised system in
which we all have the role of customer, supplier, producer and
grid operator. Together, we will make the energy transition a
reality.
Message from the Board
N.V. Eneco Beheer Annual Report 2016 7

Progress
Relevant for customersWe provide added value for our customers by supplying innovativeproducts and services to meet their needs. The increase in smarttechnologies in the world of energy enables us to not only provideflexibility, but also add value for our customers in a growing numberof different ways.
Optimal service
ConsumersWe have improved our service and strengthened our
relationship with our customers in 2016. The service provided in
the process that customers go through to inform us that they
are moving to a new house, has been simplified significantly by
placing the focus on the customer and his new home and
visualising the moving process online. We make sure that
everything is taken care of, inform the customer and send them
a small gift on the day of the move.
Each year, customers send us their meter readings after which
they receive their bill and a notification of what their new
monthly payment will be. To make this process easier, faster
and more transparent, we have redesigned this customer
journey by introducing the real-time annual bill. Customers now
receive their bill within 24 hours after submitting their meter
readings. Communication regarding the annual bill has also been
changed. Customers are now able to adjust their monthly
payment amount directly in My Eneco and we show them
where their electricity is actually produced. It is also possible for
them to send us their meter readings easily and quickly by
means of a Facebook Messenger chatbot. These improvements
have reduced the number of customer inquiries significantly and
also resulted in higher customer satisfaction.
In 2016, we recorded the 15,000th member of and the
100,000th response on the digital Eneco & Toon forum. This is
the location where we discuss a variety of topics with our
customers. In 2016, our forum members had the opportunity to
meet in person at an event at Eneco World, during which
various speakers introduced them to the new world. Our forum
members also contributed to Eneco's position in the top five of
the most progressive energy brands in the world in the Charge
Energy Branding Awards.
Furthermore, we welcomed almost 35,000 loyal consumer
customers and close to 6,000 loyal business customers and
their families at our annual event in Rotterdam Zoo. This event
allows us to strengthen our relationship with our customers
and to engage them in sustainable development. Customers are
very enthusiastic about this event.
Oxxio
‘Super Smart and Inexpensive (Superslim Supervoordelig)’ is the
new slogan with which energy supplier Oxxio presents itself as
a low-price provider with a smart app. Oxxio targets millennials,
the price-oriented and internet-minded generation born
between 1981 and 2000. The app provides information about
their energy consumption to customers as well as non-
customers and enables them to make changes and find
answers to their questions. Every day, more than 7,500 people
log into the highly appreciated Oxxio app.
Business customersIn 2015, we assigned dedicated account managers to a limited
number of small and medium enterprise customers. In view of
the resulting increase in customer satisfaction and loyalty
among these customers, this initiative was continued in 2016.
The dedicated account managers work together in sector
teams. This means that they are familiar with the developments
in their customers' sector, speak their language and are able to
advise them in a manner that fits their type of operations. The
times at which the different sector teams can be contacted
correspond to the regular office hours in each of these sectors.
Where appropriate, the dedicated account managers contact
customers proactively, for example in case of deviations in their
energy consumption or to inform them about possibilities to
save energy
The changes that we made to our bills in 2016 to make them
easier to understand and more user-friendly are an important
improvement according to our customers. Furthermore, we
developed a consumption alert to notify customers proactively
Message from the Board
8 N.V. Eneco Beheer Annual Report 2016

in the event of a significant increase or decrease in their energy
consumption. Based on a successful pilot project in 2016, this
alert will be implemented on a larger scale in 2017. We also
developed new forms of communication in 2016, such as the
live-chat functionality for direct online contact with one of our
employees.
Customer satisfactionCustomer satisfaction was improved by means of closer
collaboration with our business customers, for example via the
Council of Entrepreneurs consisting of ten customers who
contribute ideas on the further development and improvement
of our service. This has resulted in better service, the
development of propositions and extended opening hours. The
chairman of this Council also holds the full-time position of
Customer Happiness Manager, whose main task is to ensure
that the interests of customers are taken into account. In
addition, a results team was put in place in April 2016 that is
responsible for increasing customer satisfaction. In December
2015, the customer satisfaction score relating to telephone
contact awarded by Eneco's consumer customers was 7.4. In
December 2016, this score had increased to 7.5. At Oxxio,
customer service by telephone improved significantly, in part
due to a focus on operational excellence and predictability.
Consequently, the customer satisfaction score increased from
6.6 at the beginning of the year to a good final score of 7.4 at
the end of the year. There was a slight increase in the total
number of contracts in 2016 (+0.7%) to 4.3 million.
Innovative products and servicesThe business unit Innovation & Ventures, which launches new
products and services in collaboration with other business units,
partners and ventures, entered its second year in 2016. By
being flexible and taking small steps, we can respond quickly to
developments and customer needs. This means that we are
able to develop and launch new products and functionality
within a short time frame, such as new features for the Toon
thermostat and the energy saving HeatWinner.
Toon, the smart home thermostat
Toon brings having a smart and comfortable home within
everyone's reach. This smart thermostat provides real-time
information on energy consumption and possibilities to save
energy. Using the Toon app, it is also possible to switch
appliances on or off and to control the Philips Hue lighting
system remotely. Further improvement of the Toon app is a
continuous process. An example is the recently added
possibility to use it to adapt the weekly programme. When
people start to drive an electric car that they charge at their
house, their energy consumption changes drastically. We have
developed a Toon application that shows customers the share
of the car in their total energy consumption and gives them
more control over their energy system.
Toon offers added value for existing and new customers,
because we continually strive to make improvements and
develop new services in collaboration with customers.
'Ketelhulp' for example, a tool for monitoring the central heating
installation. In case of a defect in this installation, Toon sends
an SMS text message, email or notification to the customer and
also sends a notification to Eneco automatically. New services
are being developed in collaboration with a special group of
Toon customers, our Toon innovators, on the basis of a short
feedback cycle. These customers provide input and support by
participating in pilot projects and by sharing their experience
with and opinion on newly developed services.
The high customer satisfaction among users of the Toon
thermostat means that they are our most important promoters.
We reward them for this by means of a premium programme
that was developed in a co-creation session with Toon
customers via our forum. Satisfied customers who successfully
28317478263
0
60
120
180
240
300
20162015201420132012
NUMBER OF TOON INSTALLED
(Cumulative x 1,000)
Message from the Board Progress
N.V. Eneco Beheer Annual Report 2016 9

advise others to purchase a Toon thermostat receive a
premium, as do the new customers they bring in. Close to
300,000 thermostats had been installed at the homes of Eneco
customers in the Netherlands by the end of 2016.
We have strengthened our partnership with Philips Lighting.
New and existing Toon customers have the opportunity to
purchase an attractively priced Philips Hue set that is not
available elsewhere on the market.
HeatWinner
Extensive discussions with customers and good collaboration
with our partner Inventum resulted in the development of the
HeatWinner: a compact ventilation heat pump that enables
households to reduce their gas consumption for heating
purposes. In October, a number of HeatWinners were installed
in the homes of the first pioneers, the other customers
followed at a later stage. There is a possibility that the
HeatWinner will also be introduced in other countries. In
connection with this, a pilot project will be started in the United
Kingdom. The Pezy Group awarded Eneco and Inventum the
Collaboration Award for the HeatWinner.
Tesla Powerwall and CrowdNett
Eneco is a distributor of the Tesla Powerwall in the Benelux. As
a follow-up, we developed CrowdNett, a network of home
batteries that can be used to prevent imbalance on the
network. Customers with solar panels can join CrowdNett by
purchasing a Tesla Powerwall at a discount to store the energy
that they generate. As the Powerwall owners that together
form the Eneco CrowdNett share this stored energy, additional
flexibility is created and the need to use coal plants to generate
extra capacity is reduced. In this way, we are taking a step
towards a new energy grid and are reducing CO2 emissions
together with our customers.
SolarHub
A growing number of people want to generate their own
energy, but many of them do not have a roof that is suitable for
the installation of solar panels. On the other hand, there are
numerous large roofs that are not being used. For this reason,
we developed SolarHub (‘Zonnehub’), a link between suitable
roofs and interested people. We take care of the whole process,
from installation to maintenance. The roof providers receive
part of the revenues. In October, the roof of the Rabobank in
Etten-Leur was the first roof that became available for
registration. Installation will start as soon as all the solar panels
have been reserved.
Luminext
Luminizer is a management and operating environment
developed by Luminext that contains all the necessary
information for the safe, sustainable and energy-efficient
operation and efficient maintenance of lighting. Luminizer is
used by many municipalities, but in 2016 Luminizer for Industry
was also introduced. Luminizer is now also used on large
industrial sites such as the business premises of Chemelot and
Heineken.
We believe that all public lighting will be smart in the future. As
not every customer is able to implement smart lighting on a
large scale, we have developed Lightscout, a solution that
makes existing streetlights a bit smarter. The first pilot project
is being carried out in the Utrechtse Heuvelrug area and will be
completed in 2017.
Simaxx
Eneco acquired a non-controlling interest in software company
Simaxx in 2016. The investment in this start-up increases our
focus on the market of energy efficiency and smart control of
buildings.
Jedlix
The #ichargesmart app of our spin-out Jedlix puts smart
charging of electric cars into practice. This service is available at
a growing number of public charging spots. Jedlix is also
integrated in cars; the beta version of the 'Jedlix-Connected'
Tesla was launched in 2016 and BMW will follow in the first
quarter of 2017.
Roamler Tech
Eneco and tech company Roamler have joined forces with the
aim to let users of the Roamler app carry out technical jobs in
the homes of customers by means of the new Roamler Tech
platform. The installation of the Toon thermostat is one of the
jobs posted on the platform. This offers customers the
advantages of lower costs and more flexibility in selecting the
time at which the installation will take place.
Peeeks
Peeeks enables companies to purchase energy in a flexible
manner and at the right times. As a result, energy is distributed
more efficiently over the network. A new customer of this
product in 2016 was SnowWorld. Cooling of the ski slopes in
this indoor ski centre takes place at times when a lot of energy
is available, for example when the wind is strong.
Quby
The Toon thermostat was developed by Quby, a 100%
subsidiary of Eneco. In the past year, Quby made significant
progress toward the international rollout of Toon. In Belgium,
the intelligent thermostat was launched under the name Boxx
by energy company Engie. In several other European countries,
pilot projects are underway or will be started in 2017.
Message from the Board Progress
10 N.V. Eneco Beheer Annual Report 2016

Reliable supply
HeatingThe total duration of interruptions in the supply of heating
amounted to 27 minutes, which is well below our target of a
maximum of 49.5 minutes. In order to detect the early stages
of leaks and insulation damages, aerial thermal images of the
pipeline network in Rotterdam were taken in 2014. Based on
these images, suspect pipelines were investigated more closely
in 2015 and 2016 and repaired where necessary. Priority was
given to the replacement of pipelines that have a greater
impact on the supply of heating in the event of an interruption.
In the municipality of Utrecht, a number of transmission
pipelines were out of operation simultaneously in 2016, due to
planned and unplanned activities. This did not result in an
interruption of the supply of heating, because redundancy of
production and distribution assets was incorporated in the
network at the design stage. Furthermore, a technique that is
used in the oil and gas industry to pinpoint the exact location of
any leaks was applied for the first time.
There were no irregularities in the municipality of The Hague.
The network in the Ypenburg region was monitored and
inspected more closely in connection with a number of leaks
that occurred in 2015, which resulted in a number of
replacements. Consequently, the number of unplanned
interruptions was limited.
Message from the Board Progress
N.V. Eneco Beheer Annual Report 2016 11

Impact on the planetOn a worldwide scale, the annual amount of resources used exceedsthe amount of resources the planet has to offer by one and a halftimes. The global demand for energy plays an important role in thisrespect, as it accounts for 35% of the total emissions of greenhousegasses such as CO2. Our ambition is to fully bring our customers’ andour own energy consumption to within the limits of the planet.
Collaboration with WWFEneco and WWF have been working together on One Planet
Thinking since 2010. One Planet Thinking helps companies to
develop and implement a strategy aimed at staying within the
limits of our planet. In its capacity of founding partner, Eneco
has a seat in the programme's steering group. Eneco also
participates actively in the community of practice. This allows
us to share our knowledge and experience with other
companies. Our ambition is to let One Planet Thinking develop
into an international programme in which companies and
scientists are committed to the concept of One Planet Thinking.
In its One Planet Plan, Eneco has incorporated the One Planet
Thinking philosophy in its own ambitions with respect to
sustainability.
Focus areasOur main impacts on the planet are climate change, air
pollution, loss of biodiversity and depletion of resources. Our
footprint mainly results from the gas consumption of our
customers and the use of gas in our gas-fuelled and combined
heat and power plants. The combustion of natural gas produces
emissions, which cause air pollution and loss of biodiversity. For
our investments in renewable energy, such as the construction
of wind farms, we use non-renewable raw materials, the
extraction of which causes damage to the environment. We
strive to reuse materials and resources where possible and to
create closed-loop resource chains. For these reasons,
circularity is part of our ambition.
Climate change
Higher standards will be applied for the strategic One Planet-
related key performance indicators (KPIs) that we have been
monitoring over the past years. Our entire chain footprint will
be part of our goal. This results in the new strategic objective of
limiting the impact of our operations to well below the global
warming ceiling of 2°C. This objective is absolute and we are on
track. Alternatives for the use of natural gas in existing homes
are an important factor in this respect. The Eneco HeatWinner
should play a significant role in reducing this gas consumption.
Air pollution and biodiversity
Research that we conducted in collaboration with Utrecht
University shows that emissions from our gas and combined
heat and power plants contribute to air pollution and the
possibility of loss of biodiversity in Natura 2000 and other
areas. Many nature areas are in a poor state. Traffic and
agriculture are the main causes of nitrogen precipitation, but
the nitrogen emissions from our plants are also a contributing
factor. We are investigating technical possibilities to reduce our
nitrogen emissions before considering compensation measures
such as nature restoration.
Circularity
We are investigating the possibilities and opportunities of
circular business operations. We strive to recycle materials and
resources to create closed loops and prevent the need for new
raw materials. Priorities will be specified on the basis of the
results of this investigation. The success will depend on the
level of cooperation that we will be able to achieve.
Message from the Board Progress
12 N.V. Eneco Beheer Annual Report 2016

Investment in sustainable capacity andproductionEneco invests in increasing sustainable energy production by
means of wind farms and solar and biomass installations and in
innovative techniques that accelerate this increase. Central
aspects in asset development are our customers and obtaining
maximum value from the developed assets.
We opt to develop our production facilities in the Netherlands
and abroad in direct contact with our customers and with local
stakeholders. They are involved in the developments where
possible: in the role of customers, co-developers, suppliers,
shareholders and participants. An example of this is Moy wind
farm (60MW) in Scotland, which was completed in 2016 and
now supplies renewable energy for the twelve Mars factories in
the United Kingdom. Another example is our investigation in
collaboration with the municipality of Utrecht, NGOs, local
residents and other stakeholders into the possibilities of
improving the sustainability of the municipality's district heating
network by developing a biomass heating installation.
Stakeholders are informed about the progress that we make in
the realisation of our mission ‘sustainable energy for everyone’.
Increase in sustainable capacityAs a result of our investment in a wind farm in the United
Kingdom (Moy) and in a number of smaller wind farms, our wind
energy capacity increased by 79 MW. This brings our own
sustainable energy production capacity (wind, solar and
biomass) to a total of more than 1,000 MW. In addition, we
have Power Purchase Agreements in place with other owners
of sustainable production capacity.
In October 2016, we acquired the wind and solar energy
activities of energy company DELTA, consisting of operational
wind farms with a production capacity of 29 MW, wind farms
that are ready for construction and will have a capacity of 12
MW, and solar and wind energy development projects.
The Supervisory Board of Enco Holding N.V. has approved our
decision to invest in Norther wind farm, the largest offshore
wind farm in Belgium that will produce around 370 MW for
nearly 400,000 households. Based on a 50-50 partnership,
Eneco and partner Mitsubishi Corporation together have a 50
percent interest in this wind farm. The other 50 percent is in the
hands of Elicio. Norther wind farm will require a total joint
investment of around 1.2 billion euros and is expected to start
supplying renewable energy in 2019.
As part of a consortium with partners Shell, Van Oord and
Mitsubishi Corporation, Eneco won the tender for the Borssele
III and IV sites in December 2016. On these sites, the
consortium can now start to develop, build and operate an
offshore wind farm with a capacity of 700 MW. The wind farm
will generate renewable energy for around 825,000 households
as of 2021.
The share of sustainable energy obtained from our own
production facilities and through power purchase contracts in
the total volume of energy supplied, increased from 25% in
2015 to 30% in 2016.
201620152014 201620152014
0
1,000
2,000
3,000
4,000
5,0004,6273,541 1,9191,680
0
450
900
1,350
1,800
2,2504,779 2,054
SUSTAINABLE PRODUCTION
GWh (including purchased production)SUSTAINABLE CAPACITY
MW (including controlled capacity third parties)
Solar + Hydro Onshore wind Offshore windBiomass
Message from the Board Progress
N.V. Eneco Beheer Annual Report 2016 13

Production (GWh) 1 Capacity (MW)2) Capacity (MW) per country2)
Technology Total Total NL B UK F
2016 2015 2016 2015 2016 2015 2016 2015 2016 2015 2016 2015
Biomass 468 795 57 142 56 132 1 10 0 0 0 0
Solar power 70 66 81 76 6 3 45 49 17 10 13 14
Hydro power 2 2 1 1 0 0 0 0 0 0 1 1
Onshore wind energy 2,767 2,390 1,488 1,273 1,022 852 272 287 194 134 0 0
Offshore wind energy 1,472 1,374 427 427 249 249 178 178 0 0 0 0
Subtotal sustainable 4,779 4,627 2,054 1,919 1,333 1,236 496 524 211 144 14 15
Conventional 2,089 2,606 435 435 435 435 0 0 0 0 0 0
Combined heat and power 3) 2,157 1,600 507 622 507 622 0 0 0 0 0 0
Total 9,025 8,833 2,996 2,976 2,275 2,293 496 524 211 144 14 15
1 Including purchased capacity2 Including controlled capacity third parties. The available capacity in the form of biomass energy, onshore wind energy in Belgium and solar energy in
Belgium decreased due to the expiration of a number of power purchase agreements in 2016.3 Part of the heat production capacity in Utrecht was shut down in 2016, as a result of which the installed combined heat and power capacity decreased
by 115 MW.
Message from the Board Progress
14 N.V. Eneco Beheer Annual Report 2016
Dynamic employerOur mission 'Sustainable energy for everyone' is at the top of theminds of our employees. The energy market is in the middle of amajor transition and is characterised by a high level of dynamics andinnovation. We aim for increasingly better performance andacceleration of the transformation. Furthermore, we seek to useworking methods that are in line with our strategy and the situationof the business units with the aim to maintain a close relationshipwith our customers.
Alignment and motivationThe better our employees carry out their work in alignment with
our mission and strategy, the sooner we will be able to realise
our strategy and the more ambassadors we have. Our
performance in the area of alignment continues to improve. A
little over 70% of our employees are fairly or fully familiar with
our mission and contribute to the achievement thereof in their
daily work. Alignment with our mission increased by 7% from
65.7 % at the end of 2015 to 72.7% at the end of 2016.
Our employees are also motivated. This is measured every
three months among a representative quarter of the workforce.
The average motivation score was consistent, as we started
the year with a 7.9 and ended with a score of 8.1. However, we
are not satisfied yet. Alignment and motivation will continue to
be attention points in 2017.
Performance managementMore attention was given to performance management in 2016
with the aim to ensure that our employees contribute to our
mission, vision and strategy to the best of their ability and to
be able to make adjustments quickly if necessary. We believe
that 'constructive conversations' between managers and
employees yield better results than a regular performance
review cycle. Five central questions in these conversations are:
Am I doing the right things? Am I doing them well? In what
ways should I improve myself? What are my strengths? Am I
still in the right place? Acknowledgement is also an important
item in these regular conversations. Performance management
applies to managers as well as employees, thus enabling the
entire team to work on their performance and development
together. Performance management has also been integrated
in the New Leadership, which involved improvement of
information and training programmes.
DiversityIn addition to its more than 2,700 employees, Eneco also hires
temporary employees and external specialists. Having well-
balanced teams is important and so we aim to achieve
diversity. Our objective with respect to external recruitment for
management positions of department head and upwards is a
50-50 ratio of men and women.
Personal development and externalperspectiveBeing a leader involves giving direction, acknowledging and
improving results and self-development. These aspects are
being trained in the development programmes for managers.
We started a transition process in 2016. Our aim is that
managers are flexible and possess learning agility. Agility is also
part of our working method, meaning that we can deal with
developments that occur during the course of projects, in part
to be able to quickly respond to customer needs. This is
achieved through the development of our current management
force and by hiring managers who have gained experience in
other sectors and can offer a different perspective. We also
expect employees to be flexible and stimulate their
development. 70% of this development is the result of doing
new things, 20% is the result of learning from others and 10%
is the result of self-study.
Message from the Board Progress
N.V. Eneco Beheer Annual Report 2016 15

SafetyPart of our valuesIn the changing energy world, safety continues to be part of our
strategy. Working safely is a precondition for complying with
our cultural values: customer first, together, instilling trust and
taking responsibility.
We devoted a lot of attention to further improvement of safety
awareness in 2016. Our goal was to permanently improve
safety for everyone concerned. Based on the starting point that
we do it safely or not at all, we introduced a programme aimed
at stimulating identification and discussion of safety risks and
further promotion of safe behaviour.
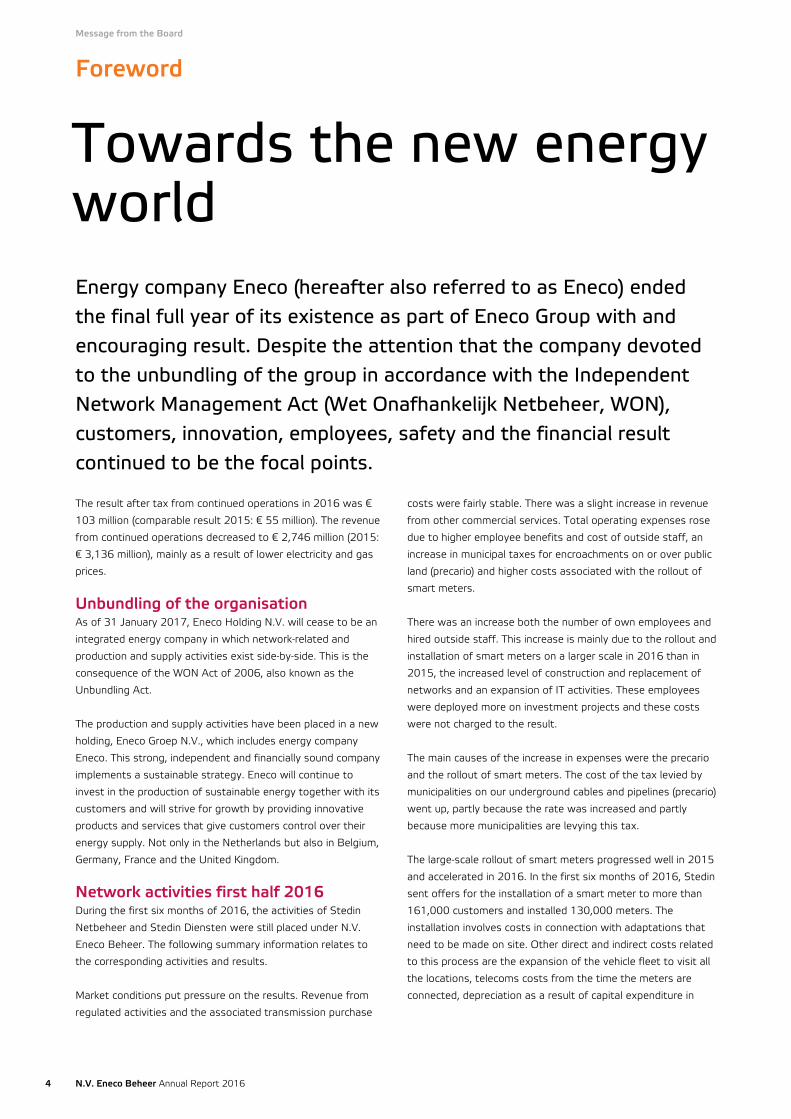
Fewer occupational accidentsThe total of 17 occupational accidents in 2016 was below the
target of a maximum of 30. Occupational accidents are
accidents that require medical attention and may or may not
result in absence from work or the need for temporary
alternative work. This result means that the Recordable Incident
Frequency (RIF), which is the number of occupational accidents
per 200,000 hours worked, was reduced to 0.62. The target
was 0.96.
The number of accidents registered by our contractors was
approximately the same as last year. We will continue our
efforts to reduce the number of accidents.
ChallengesThe energy sector is changing as a result of increased
sustainability, further electrification and innovations. On the one
hand, the use of conventional energy resources is decreasing
while, on the other hand, there is an increase in the use of solar
and wind energy and related forms of transmission and
storage. Controlling safety aspects in current and new areas will
pose a variety of challenges in the future. Identification of these
aspects and timely implementation of adequate measures will
continue to be important in order to significantly reduce the
number of occupational accidents in the coming years.
0.620.811.091.55
0
0.35
0.70
1.05
1.40
1.75
2016201520142013
SAFETY PERFORMANCE
(RIF)
Message from the Board Progress
16 N.V. Eneco Beheer Annual Report 2016

Financial resultThe sustainable Energy Company made a net profit of € 103 millionon continued operations in 2016, an increase of 87% (2015: € 55million). Revenue fell to €2,746 million (2015: € 3,136 million).Operating profit rose by 93% to € 106 million. Eneco speaks of asatisfactory result achieved despite difficult market conditions.
During 2016 N.V. Eneco Beheer transferred its subsidiaries with
network and engineering activities to the parent Eneco Holding
N.V. in connection with the forced unbundling of the Eneco
Group into a Network Company and an Energy Company. The
results on these discontinued operations accrued to N.V. Eneco
Beheer until the date of transfer. Since this occurred during
2016, the total net profit including discontinued operations fell
from € 264 million to € 192 million.
Result developmentThe Energy Company’s overall revenue was € 2,746 million, a
fall of 12% compared with the previous year (2015: € 3,136
million), mainly as a result of lower purchase prices for gas and
electricity that we passed on to our customers. The regulated
price for heating rose slightly as a result of an increase in the
energy tax on gas. There was a slight increase in the number of
customer contracts. As our customers are better able to reduce
their energy consumption, volumes were down a little. The
restructuring of our portfolio in the business and installation
markets was also a cause of the fall in revenue.
The gross margin and other revenues rose, despite the fall in
revenue, by € 72 million (8%) to € 931 million. The margin on
wind farms went up as the number of farms in operation
increased. This raised the company’s ability to generate its own
energy, but growth in wind energy generation was limited as
there was less wind than average in 2016 while there had been
more than average wind in the previous year. The margin in the
consumer market was stable; the price of heating rose slightly.
Trading activities (Eneco Energy Trade) delivered good results
and, in addition, a large energy purchase contract was
restructured to improve its results over the next few years.
Other revenues partly reflect the sale of various assets,
participating interests and CO2 rights and other recharges.
Total operating expenses rose by € 21 million (3%) to €825
million. Employee benefits fell by 2%. The average number of
employees fell by 8% to 2,882 FTEs. In fact, the number of
FTEs fell to 2,581 at year-end (year-end 2015: 3,021 FTEs)
because of the sale of Ecofys in the fourth quarter. Employee
benefits fell more slowly than staff numbers partly because of
higher costs from staff benefit schemes and less capitalisation
of employee benefits as there were fewer projects under
construction. Amortisation and depreciation expense rose in
2016 as a result of investment in and acquisitions of assets
and the restructuring of local generation, but was lower
compared with 2015, when there had been a non-recurring
charge following the cancellation of Navitus Bay.
The increase in other expenses was mainly a result of growth,
research into new products and services, more marketing and
unbundling-related activities. Areas of growth included
expanding sustainable production assets, in particular wind
farms. The Energy Company is investing in the new world of
energy by spending on research and development for new
products through the Eneco Innovations & Ventures business
unit, making acquisitions, attracting more staff and engaging
advisers.
The restructuring of business units that focus on existing
markets also involved expense. An example of this is Eneco
Installatiebedrijven which, following restructuring, is now well
prepared for the future. The coming unbundling also inevitably
involved costs in the form of engaging legal, financial and IT
advisers to help prepare and implement it.
All in all, these developments led to an operating profit (EBIT) of
€ 106 million, € 51 million (93%) higher than in 2015. After tax,
the Energy Company made a net profit of € 103 million from
continued operations; including the result of subsidiaries
transferred to Eneco Holding N.V., the net profit was € 192
million.
ContractsThe total number of contracts rose slightly (0.7%) in 2016 to
4.3 million. While the number of customers fell slightly, they are
Message from the Board Progress
N.V. Eneco Beheer Annual Report 2016 17

increasingly taking several products and services from Eneco,
such as a Toon thermostat or a maintenance contract, for
example for their central heating boiler or solar panels. In
addition, there were various successes in the business market
that will bear fruit over the next few years.
All Dutch office and manufacturing locations of the Unilever
consumer goods group will run on wind energy from 1 January
2017. Each year, Unilever will purchase almost 70,000 MWh of
green electricity generated by Eneco’s Luchterduinen wind farm
in the North Sea.
In co-operation with procurement organisation Intrakoop, no
fewer than 240 healthcare organisations are participating in an
energy deal with Eneco. From 2019, they will receive green
electricity from wind farms. As well as enhancing the
sustainability of the healthcare sector, the participants will also
save € 2.8 million on supply costs. In total, this collective will
purchase 1 million MWh of sustainable electricity and 200
million m3 of gas each year.
Eneco installed a total of 4,613 solar panels on the roofs of the
Kingspan factories in Tiel and Winterswijk in 2016 so that the
Dutch arm of Kingspan, a manufacturer of sustainable
construction materials, will be able to generate 1,140 MWh of
green electricity per year.
In co-operation with Eneco, Wienerberger, market leader in
innovation and production of ceramic construction and paving
materials, created the largest roof-mounted solar installation in
Limburg at its plant in Tegelen where 4,550 solar panels have
been installed to generate some 1,100 MWh of solar power per
year.
From January 2017, the Technical University Delft will only
purchase sustainable electricity generated in the Netherlands.
The choice of green electricity is part of the university’s policy of
a highly-sustainable campus and to halve its CO2 emissions by
2020 compared with 2012. By purchasing green electricity
from Eneco’s Luchterduinen wind farm, the university will
reduce its CO2 emissions by 60%.
InvestmentsIn 2016, the Energy Company invested € 122 million. This is
less than in 2015 (€ 346 million) because a number of large
wind farms have come on stream in the Netherlands and the
United Kingdom. The investments related to wind farms
(completion of Moy in the UK and development of Norther in
Belgium € 51 million), heating networks and production (€ 44
million), solar farms (€ 9 million) and the adaptation of the Bio
Golden Raand power plant (€ 10 million) so that it can also
supply steam to nearby businesses.
In addition to these investments, our sustainable assets
increased € 44 million following various acquisitions, including
solar farms in Belgium and the United Kingdom and the DELTA
wind farms.
We sold Ecofys, our consultancy subsidiary, to Navigant, an
American company, in 2016 having concluded that its activities
would flourish better in an organisation with consultancy in its
DNA.
Another noteworthy item is the 50% holding that Eneco has
acquired since the reporting date in the German green energy
and IT company, LichtBlick.
Credit RatingOur creditworthiness is one of the key figures underlying the
financial policy. Standard & Poor’s assessed the plans and
prospects for N.V. Eneco Beheer in 2016 and we were pleased
that in November it 2016 gave N.V. Eneco Beheer a rating of
BBB+. S&P describes the outlook for the Energy Company as
stable.
N.V. Eneco Beheer has no influence over the setting of the
credit rating. S&P has published a report explaining how it
arrived at it, and this is available on our corporate website.
http://www.eneco.com/about-us/finance/
OutlookThe preparations for the unbundling focused on creating two
healthy independent companies ready for a future in the new
world of energy. We have confidence in the further
development of the autonomous sustainable Energy Company.
Nevertheless, market conditions are challenging and are
expected to remain so for the time being. Against this
background we are unable to present a results forecast for
2017.
Message from the Board Progress
18 N.V. Eneco Beheer Annual Report 2016

Risk management
Risk management contributes to the achievement of our strategicgoals in a responsible manner. Our risk policy encompasses carefulassessment of the risks that Eneco runs, the control measures thatwe implement to mitigate these risks and the manner in which weensure the effectiveness of these measures.
Risk governanceThe Board of Management is responsible for risk management
at the level of the organisation as a whole. Risk management is
structured according to the ‘three lines of defence’ model. This
structure ensures that we comply with the current Good
Practices in the area of risk management. The Board of
Management has delegated its responsibility for risk
management primarily to the directors of the business units
('first line'), who are supported in this matter by the 'second line'
consisting of Business Control and functional areas such as
compliance and safety. The 'second line' also includes the Group
Risk Management department, which is responsible for the
policy framework and the coordination of the risk management
process. The Internal Audit department (‘third line’) carries out
audits and reports the results to the Board of Management.
During the quarterly Business Unit Reviews, each business unit
reports the main risks to the member of the Board of
Management who is responsible for risk management. The
consolidated risk reports of the business units are presented to
the Board of Management.
The risk assessments and the status of measures aimed at
limiting and controlling risks are discussed periodically by the
management teams of the different business segments. The
main risks and measures are discussed by the Audit & Risk
Committee of the Board of Management.
Company-level risk limits have been specified in the form of
various concrete policy statements, codes and guidelines for
areas such as safety, trade mandates, authorisations and
conduct.
Risk and performance managementframeworkWe have adapted the COSO-ERM framework, the worldwide
standard for Enterprise Risk Management, to form Eneco’s
internal risk management and control system, the ECRS. Each
year, the ECRS is adapted to keep up with the latest
developments with respect to risks, business developments
and external influences. The ECRS includes a risk assessment
method, a set of control measures and a self-assessment
method that enables management to determine the
effectiveness of the control measures.
Risk management is an iterative and continuous process and is
part of the regular Business Planning Cycle. At least once a
year, the business units carry out a thorough analysis of the
threats and opportunities and determine the possible impact of
each significant risk on the risk categories Financial, Reputation,
Integrity and Safety. Our management is based on the financial
and non-financial strategic KPIs. With respect to financial
matters, we use the financial framework to manage the main
financial restrictions on the strategy. This is done by means of
financial-strategic projections supported by sensitivity analyses,
including single event stress tests and scenario analyses. Risk
control systems with specific mitigating measures are in place
at each level of the organisation.
Risk toleranceOur risk tolerance is categorised by the types of risk
distinguished by Eneco:
Safety
The construction and operation of (sustainable) energy
production facilities and infrastructure/networks are a central
aspect of our strategy. These activities lead to safety risks. We
apply the principle of zero tolerance with respect to these risks.
Accidents resulting in absence from work are considered to be
significant incidents. More serious incidents (hospitalisation,
fatal accident) are classified as critical or unacceptable.
Financial
Eneco pursues a growth and transformation strategy, which
entails substantial investment in new and existing activities.
This strategy is translated into long-term financial-strategic
projections, which are updated every six months on the basis of
the latest insights. Our financial risk tolerance is derived from
the financial control framework that specifies a number of
tolerance limits, such as the FFO/net debt ratio. Fitting
measures are implemented for risks that may result in
exceeding or not meeting limits specified in the financial control
framework. Controlling risks relating to the provision of financial
and non-financial information and reporting is important,
because it concerns information that forms the basis for the
management of our company.
Integrity
Unethical or fraudulent behaviour of management and
employees is a major risk. As Eneco can only carry out its role
Message from the Board
N.V. Eneco Beheer Annual Report 2016 19

properly if the highest standards of conduct are applied, our risk
tolerance in the area of integrity is low. We strive for an
environment in which no significant possibilities for fraud exist.
The Eneco Code of Conduct and the underlying guidelines
translate this low risk tolerance to daily practice and define
desired conduct and how to act with integrity. Considerable
attention is devoted to integrity awareness of management
and employees during work meetings and workshops. There is
an integrity hotline and employees can also contact one of the
confidential counsellors for the adequate and confidential
handling of integrity incidents.
Reputation
A good and reliable reputation is essential to the existence of
our company. Consequently, our risk tolerance is low. A 'limited
negative image among stakeholders’ is on the edge of what is
considered to be acceptable. The risk of not achieving our
strategic goal, which is the realisation of a sustainable and
reliable energy supply, is also classified as a reputation risk. This
is also true for not realising our commitments with respect to
sustainability as agreed with WWF in the context of the Climate
Savers Initiative and our own ambitions regarding One Planet
Thinking.
FRAMEWORK RISK AND PERFORMANCE MANAGEMENT
Risk categories
SafetyIntegrity
Financial Reputation
1
Strategic Framework Strategic KPIs
Energy as a Service,
Smart Sustainable Solutions, Client Sources
CO2 target
Credit rating target
2
Financial-Strategic Prognoses (FSP)
Forecast realisation
strategic targets
Forecast financial results
Forecast credit rating ratios
3
Risk & control assessment
Gross risk assessment (risk register)
Defining controls in Eneco Control & Risk System (ECRS)
Specifying potential impact of risks on financial-strategic
prognoses
4
Risk control & monitoring
Mitigating measures and follow-up
Net risk reporting and monitoring at all levels
Assessing risk acceptability
Message from the Board Risk management
20 N.V. Eneco Beheer Annual Report 2016

Developments 2016More attention was devoted in 2016 to bringing the quality of
the self-assessments to a higher level. A 'prove me' level was
added to the self-assessment method with respect to the key
controls. This level requires the business units to document
instructions, such as sample size, frequency and evidence to be
submitted, before carrying out the self-assessment.
Furthermore, the business units now carry out the self-
assessments twice a year instead of once as in previous years.
The addition of the previously mentioned 'prove me' level as a
requirement for self-assessments has improved awareness with
respect to and the quality of supporting information on the
structure and functioning of the controls and, in particular, to
the controls relating to the supply of internal and external
information.
Several control measures were taken in the areas of
authorisation management and IT change management. A more
structured approach is now applied for the management of
asset projects and complex IT projects. In addition, more
attention is given to business continuity and cyber security by
means of the implementation of a number of risk mitigating
measures and by providing training for and increasing the
awareness of employees.
Incidents
A number of incidents occurred in 2016. Information on two of
these incidents is provided below.
In October, there were two interruptions in the additional
services of the Toon thermostat that affected a large number
of Toon customers. The thermostat itself was functioning
properly, but it was not possible to control the thermostat
remotely by means of the Toon app as a result of a defect.
Eneco and Quby, the company that developed the thermostat,
tested several solutions and solved the problem within a week.
Communication with Toon customers is a point of attention for
Eneco. Quby is working on bringing the service centre to the
cloud, which should prevent such problems in the future.
The Authority for Consumers and Markets has determined that
there has been a violation of the Information Code Electricity
and Gas in relation to Oxxio's low-volume customers. It
concerns the specification of an end date in the Contract
Termination Register for open-ended contracts. Oxxio
submitted a statement of defence on 2 December 2016; a
ruling is not expected until February 2017.
Unbundling
The main risk relating to the unbundling was the disruption of
business operations due to activities associated with
preparation for the unbundling. As a result of a multidisciplinary
programmatic approach in combination with the use of external
expertise in the areas of governance, financing and accounting,
the unbundling can take place on 31 January 2017 at the latest
in accordance with our expectations.
The starting point of the Board of Management has always
been that the unbundling will result in two independent, sound
companies that continue to be able to implement their strategy.
An important element in this respect was the allocation of
capital, which, as far as the new network company is
concerned, must meet a number of specific requirements
included in the Independent Network Management Act. The
ultimate allocation, which has the approval of the stakeholders,
is in compliance with the Act and also provides a stable starting
position for both companies.
Top risks For consolidation and reporting purposes, all the top risks of
Eneco have been divided into five clusters. The top risks
associated with our strategic objectives and the measures we
take in order to control these risks are numbered in the
following figure and explained in more detail below.
1) Spark spread
Eneco's gas-fuelled plants are exposed to the spark-spread risk.
Spark spread is the gross margin on the sale of electricity
produced by a gas plant. A spark-spread risk exists if the
production costs approximate the selling price of the electricity.
This risk is mitigated in part by means of portfolio management
and hedging. In addition, a gas plant can be shut down in case
of a negative spark-spread. This risk was further reduced in
2016 as a result of the restructuring of a number of contracts.
At present, this risk is estimated to amount to a maximum of €
5 to € 10 million.
2) Weather risk
Eneco's results are affected by weather conditions such as a
mild winter or periods in which there is less wind than expected.
The weather-related risk is hedged within the portfolio as much
as possible. In addition, weather-related contracts and hedges
are used to reduce Eneco's sensitivity to weather conditions.
The total weather conditions risk is estimated to amount to a
maximum of € 20 to € 40 million.
3) Credit rating
The credit rating of Eneco Holding N.V. has been issued by
credit rating agency Standard and Poor’s (S&P). The risk of a
downward adjustment of this credit rating resulting from a
change in S&P’s assessment of the financial outlook (in part as
a possible consequence of unbundling) or from changes
implemented by the rating agency with respect to the rating
criteria, rating method and/or assumptions, could have
consequences for both companies after unbundling (as well as
Eneco Holding N.V.) with respect to access to capital and
money markets, financing costs, and the terms and conditions
Message from the Board Risk management
N.V. Eneco Beheer Annual Report 2016 21

imposed by parties in the business sector. The impact for the
energy company of a downgrade after unbundling from BBB+
to BBB is approximately € 2.5 million per year.
By means of regular scenario planning and stress testing,
assessments carried out and advice provided by experts and
periodic information exchanges with S&P, we make every effort
to prevent unexpected adjustments to the credit rating.
4) Emergence of new, cheaper technologies during the
development of sustainable assets
The development of production facilities such as offshore wind
farms can take several years to complete. This is why Eneco is
very thorough in the development of large, capital-intensive
projects. There is a risk that a lot of time and money are
invested in a development project that, in the end, will not be
implemented or that cheaper technologies become available
while development is in progress. Eneco applies the 'Decision-
Gate' method to mitigate development risks. This means that at
each development stage, an assessment is carried out to
determine if the projected costs and revenues are still in line
with expectations. The results of these assessments form the
basis for the decision to either stop or to continue to the next
phase.
5) Decreasing energy prices during the development of
sustainable production assets
Eneco is active in the area of developing sustainable energy
producing assets and has concluded contracts for the purchase
of sustainable energy produced by third parties. In connection
with these activities, Eneco is exposed to the risk of a decrease
in energy prices. This risk is partly mitigated by the structure of
the subsidy scheme for the stimulation of sustainable energy
(Stimulering Duurzame Energie (SDE+)), on the basis of which
higher subsidies are granted when the electricity price is low.
This means that a substantial part of the income is steady.
Sustainable energy for everyone
Leve
l 1 Market and financial Strategic Operational Legislation and
regulations Safety & health
Leve
l 2
Reporting
Price & volume
Credit
Market liquidity
Competition
Interest & currencies
Investment
Liquidity
Macroeconomic/global changes
Disruptive technologies
Geopolitics
Sustainability
Interruptions
Business continuity
Transformation
Personnel
Projects
Supply chains
Failure systems and/or processes
Security
Future and existing laws and regulations
Governance
Legal
Integrity
Employee safety
Safety of third parties
Employee health and wellbeing
Top
risk
s E
neco
Gro
up
Financial risks: including credit, price, counterparty and default risk
Spark spread (1)
Weather risk (2)
Credit rating (3)
New, cheaper technologies during development of sustainable assets (4)
Decreasing energy prices during development of sustainable production assets (5)
Business continuity & ICT/cyber security (6)
Insufficient competencies to realise transformation (7)
Non-compliance with legislation and regulations, including WON, REMIT, EMIR, MiFiD, IFRS, and privacy
Unclear government policy as regards energy transition (8)
Safety policy, awareness and behaviour
Projects risks
Safety of employees and subcontractors
RISK CLUSTERS ENECO
Message from the Board Risk management
22 N.V. Eneco Beheer Annual Report 2016

Eneco further mitigates this risk by monitoring the medium- to
long-term buying and selling positions by means of stringent
position management under the supervision of an independent
Eneco Financial Risk Management department, which is part of
the Group Risk Management department. In addition, risk
analyses are carried out before concluding sustainable energy
contracts and prior to new investments in sustainable assets,
and the financial ratios are analysed periodically.
6) Business continuity & ICT/cyber security
The continuity of the service that we provide could be
threatened by situations such as large-scale interruptions in ICT
systems or unavailability of people or buildings. Such situations
may affect our customers in the form of untimely invoices or a
lower level of service. Furthermore, interruptions in the systems
that we use for energy trading or cyber-attacks aimed at Eneco
could result in financial damage.
To mitigate these risks, energy-trade related activities and the
activities of our infrastructure and asset operation centres are
run on a separate, duplicated ICT platform and periodic recovery
tests are carried out for critical systems. Creating awareness
among Eneco employees with respect to the importance of
information security and increasing the security of the basic
infrastructure and our information systems have our ongoing
attention. In these areas, we collaborate with our suppliers and
with external organisations such as NCSC and EDSN. In
addition, specialised companies are engaged to carry out
investigations and for the operational monitoring of the IT
systems. Additional assurance with respect to the effectiveness
of implemented measures is obtained by means of activities
such as audits and certification.
7) Insufficient competencies to realise the transformation
The success of the transformation of the organisation, which is
necessary for the realisation of our strategy, depends for a
large part on the competencies and versatility of management
and employees. Insufficient availability of suitable employees
forms a risk with respect to the company's ability to adapt and,
thus, its transformation speed. This risk is controlled by
attracting top talent from other sectors, investing in
management and employee development programmes and
letting people go if necessary.
8) Uncertainty with respect to future government policy on
the energy transition
The energy market is strongly affected by government
interventions. Tariff regulation by the government mainly
relates to the network tariffs. The subsidy policy affects the
profitability of assets. An example of this is the competitive
disadvantage for gas-fuelled plants as a result of the decision
to subsidise co-firing of biomass in coal-fuelled plants. The
profitability of onshore and offshore assets for the production
of sustainable wind energy for which the government has
already decided that subsidy will be granted, is less sensitive to
fluctuations in government policy.
Eneco's new products and services are exposed to the risk
associated with fluctuations in government policy. These new
products and services are affected by regulations relating to the
grid operator, consumers and privacy policies, but these types
of government interventions are of a different order of
magnitude than those relating to investments in large-scale
sustainable energy production facilities.
Eneco seeks to convince government bodies in various ways of
the importance of a stable investment and financing climate. In
addition, Eneco spreads its sustainable investments across
several countries, subsidy regimes and sustainable technologies
(such as wind energy, solar energy and energy storage).
Furthermore, we will only construct sustainable energy
production facilities in collaboration with and at the request of
customers (Client Sources), in accordance with our strategy.
Rotterdam, 30 January 2017
Board of Management N.V. Eneco Beheer
J.F. (Jeroen) de Haas, chairman
C.J. (Kees-Jan) Rameau
G.A.J. (Guido) Dubbeld
M.W.M. (Marc) van der Linden
Message from the Board Risk management
N.V. Eneco Beheer Annual Report 2016 23

24 N.V. Eneco Beheer Annual Report 2016

Financial statements
Consolidated financial statements 2016 26Consolidated income statement 26Consolidated statement of comprehensiveincome
26
Consolidated balance sheet 27Consolidated cash flow statement 28Consolidated statement of changes in equity 29
Notes to the consolidated financialstatements
30
1 Accounting principles for financial reporting 302 Accounting policies 32
Notes to the consolidated income statement 403 Revenues from energy sales and energy-related
activities40
4 Other revenues 405 Employee benefits 406 Renumeration of the Board of Management 407 Share of profit of associates and joint ventures 418 Financial income 419 Financial expenses 41
10 Income tax on the result from continuedoperations
41
11 Result after tax on discontinued operations 4212 Government grants 43
Notes to the consolidated balance sheet 4413 Property, plant and equipment 4414 Intangible assets 4615 Business combinations 4716 Associates and joint ventures 4717 Deferred taxes 4818 Derivative financial instruments 5019 Other financial assets 5320 Assets/liabilities held for sale 5321 Trade receivables 5322 Other receivables 5423 Cash and cash equivalents 5424 Equity 5525 Provisions for employee benefits 5626 Other provisions 5727 Interest-bearing debt 5828 Trade and other payables 5929 Operating leases 5930 Contingent assets and liabilities 5931 Related party transactions 6132 Financial risk management 6133 Capital management 6634 Events after the reporting date 6735 First adoption of International Financial
Reporting Standards (IFRS)67
Notes to the consolidated cash flowstatement
68
36 Movements in working capital 68
List of principal subsidiaries, joint operations,joint ventures and associates
69
Company financial statements 711 Company income statement 712 Company balance sheet 72
Notes to the company financial statements 731 Accounting policies 732 Financial assets 733 Equity 734 Interest-bearing debt 735 Contingent assets and liabilities 746 Auditor's fees 747 Events after the reporting date 748 Profit appropriation 74
Other information 751 Profit appropriation pursuant to the articles of
association75
2 Independent auditor's report 76
N.V. Eneco Beheer Annual Report 2016 25

Consolidated financial statements 2016
Consolidated income statementx € 1 million Note 2016 2015
Revenues from energy sales and energy related activities 3 2,642 3,070
Purchases of energy and energy related activities 1,815 2,277
Gross margin 827 793
Other revenues 4 104 66
Gross margin and other operating revenues 931 859
Employee benefit expenses 5 211 215
Cost of contracted work and other external costs 355 319
Depreciation and impairment of property, plant and equipment 13 218 227
Amortisation and impairment of intangible assets 14 32 31
Other operating expenses 9 12
Operating expenses 825 804
Operating profit 106 55
Share of profit of associates and joint ventures 7 7 9
Financial income 8 14 8
Financial expenses 9 –10 –8
Profit before income tax from continued operations 117 64
Income tax 10 –14 –9
Profit after income tax from continued operations 103 55
Profit after income tax from discontinued operations 11 89 209
Profit after income tax 192 264
Consolidated statement of comprehensive incomex € 1 million Note 2016 2015
Profit after income tax 192 264
Unrealised gains and losses that will not be reclassified to profit orloss –25 –
Unrealised gains and losses that may be reclassified to profit or loss
Exchange rate differences –14 7
Unrealised gains and losses on cash flow hedges 24 –80 45
Deferred tax liabilities on cash flow hedges and hedge of netinvestment in foreign operations 24 20 –10
Total other comprehensive income –99 42
Total comprehensive income 93 306
26 N.V. Eneco Beheer Annual Report 2016

Consolidated balance sheetx € 1 million Note At 31 December 2016 At 31 December 2015 At 1 January 2015
Non-current Assets
Property, plant and equipment 13 2,499 7,487 7,526
Intangible assets 14 282 315 338
Associates and joint ventures 16 60 61 58
Deferred income tax assets 17 5 5 4
Financial assets
- Derivative financial instruments 18 90 144 136
- Other financial assets 19 76 39 37
Total non-current assets 3,012 8,051 8,099
Current assets
Assets held for sale 20 12 325 121
Intangible assets 23 23 11
Inventories 29 71 59
Trade receivables 21 500 618 772
Current income tax assets 3 – –
Other receivables 22 996 238 178
Derivative financial instruments 18 155 221 248
Cash and cash equivalents 23 343 211 84
Total current assets 2,061 1,707 1,473
TOTAL ASSETS 5,073 9,758 9,572
Equity
Equity attributable to N.V Eneco Beheershareholders 24 3,118 6,474 6,177
Non-controlling interests 24 3 4 4
Total equity 3,121 6,478 6,181
Non-current liabilities
Provisions for employee benefits 25 7 34 32
Other provisions 26 72 82 86
Deferred income tax liabilities 17 187 421 428
Derivative financial instruments 18 56 69 70
Interest-bearing debt 27 388 653 434
Other liabilities 28 110 438 419
Total non-current liabilities 820 1,697 1,469
Current liabilities
Liabilities held for sale 20 9 18 1
Provisions for employee benefits 25 6 8 3
Other provisions 26 7 5 30
Derivative financial instruments 18 129 164 225
Interest-bearing debt 27 27 61 43
Current income tax liabilities – 24 45
Trade and other liabilities 28 954 1,303 1,575
Total current liabilities 1,132 1,583 1,922
TOTAL EQUITY AND LIABILITIES 5,073 9,758 9,572
N.V. Eneco Beheer Annual Report 2016 27

Consolidated cash flow statementx € 1 milllon Note 2016 2015
Profit after income tax 192 264
Adjusted for:
∙ Financial income and expense recognised in profit or loss 8,9,11 –1 7
∙ Income tax recognised in profit or loss 10,11 39 71
∙ Share of profit of associates and joint ventures 7,11 –7 –9
∙ Depreciation, amortisation and impairment 13,14 362 495
∙ Result from sale of tangible and intangible assets 7 5
∙ Movement in working capital 36 –113 –202
∙ Movements in provisions, derivative financial instruments and other –154 257
Cash flow from business operations 325 888
Dividend received from associates and joint ventures 7 8 2
Interest paid –10 –8
Interest received – 5
Income tax paid / received –30 –21
Cash flow from operating activities 293 866
Issued loans granted –25 –45
Repayment of loans granted – 3
Acquisition of subsidiaries 15 –24 –50
Acquisition of joint operations, joint ventures and associates 16 –1 –1
Disposal of joint operations, joint ventures and associates 16 – 2
Investments in property, plant and equipment 13 –298 –706
Disposal of property, plant and equipment 13 9 55
Investments in intangible assets 14 –6 –9
Cash flow from investing activities –345 –751
Repayment of non-current interest-bearing debt 27 –34 –36
Non-current interest-bearing debt issued 27 218 56
Acquisition of non-controlling interests – –8
Cash flow from financing activities 184 12
Movements in cash and cash equivalents: 132 127
Balance of cash and cash equivalents at 1 January 23 211 84
Balance of cash and cash equivalents at 31 December 23 343 211
28 N.V. Eneco Beheer Annual Report 2016
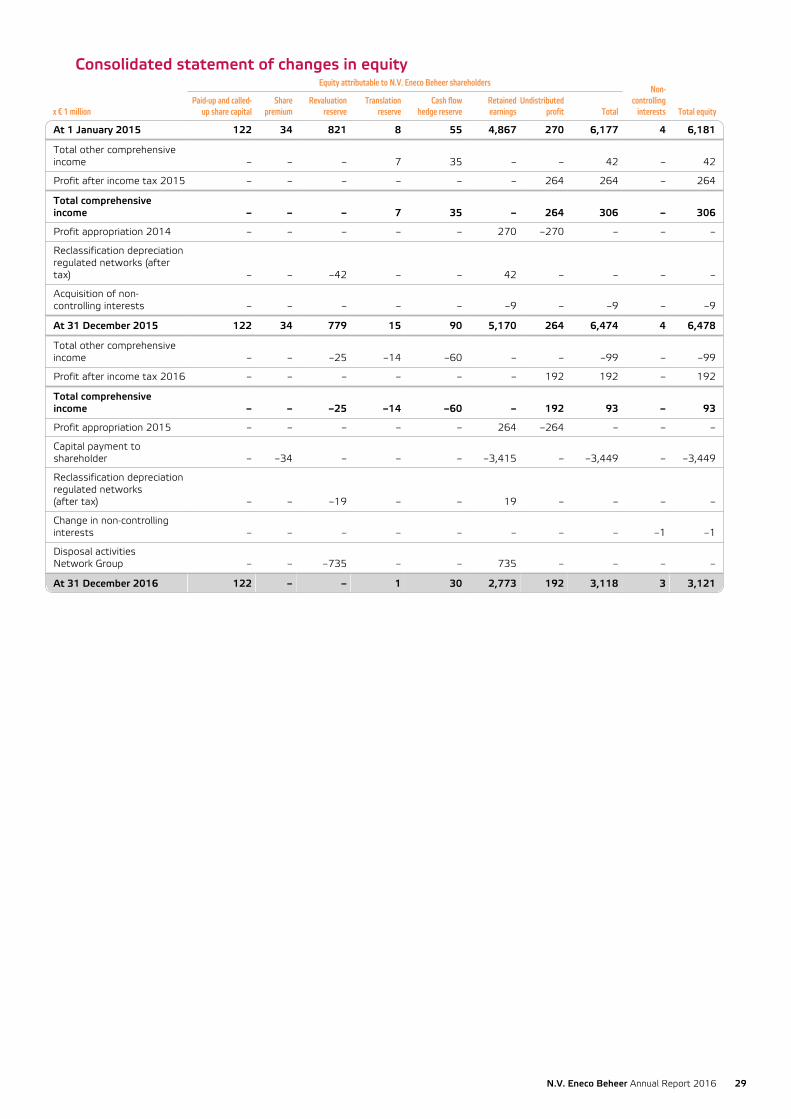
Consolidated statement of changes in equityEquity attributable to N.V. Eneco Beheer shareholders
Non-controlling
interests Total equityx € 1 millionPaid-up and called-
up share capitalShare
premiumRevaluation
reserveTranslation
reserveCash flow
hedge reserveRetainedearnings
Undistributedprofit Total
At 1 January 2015 122 34 821 8 55 4,867 270 6,177 4 6,181
Total other comprehensiveincome – – – 7 35 – – 42 – 42
Profit after income tax 2015 – – – – – – 264 264 – 264
Total comprehensiveincome – – – 7 35 – 264 306 – 306
Profit appropriation 2014 – – – – – 270 –270 – – –
Reclassification depreciationregulated networks (aftertax) – – –42 – – 42 – – – –
Acquisition of non-controlling interests – – – – – –9 – –9 – –9
At 31 December 2015 122 34 779 15 90 5,170 264 6,474 4 6,478
Total other comprehensiveincome – – –25 –14 –60 – – –99 – –99
Profit after income tax 2016 – – – – – – 192 192 – 192
Total comprehensiveincome – – –25 –14 –60 – 192 93 – 93
Profit appropriation 2015 – – – – – 264 –264 – – –
Capital payment toshareholder – –34 – – – –3,415 – –3,449 – –3,449
Reclassification depreciationregulated networks(after tax) – – –19 – – 19 – – – –
Change in non-controllinginterests – – – – – – – – –1 –1
Disposal activitiesNetwork Group – – –735 – – 735 – – – –
At 31 December 2016 122 – – 1 30 2,773 192 3,118 3 3,121
N.V. Eneco Beheer Annual Report 2016 29

Notes to the consolidated financial statements1. Accounting principles for financial reporting1.1 General information
N.V. Eneco Beheer (‘the Company’) is a company incorporated under Dutch law, with its registered office in Rotterdam. It is the
holding company of subsidiaries, interests in joint operations and joint ventures and associates (referred to jointly as ‘the
Group’). Eneco Holding N.V. is the company’s sole shareholder and ultimate parent.
In line with its mission of ‘sustainable energy for everyone’, the Group is investing in making the supply chain more sustainable with
the aim of keeping energy clean, available and affordable for customers into the future. The Group focuses on innovative energy
services and products that allow customers to save energy or generate sustainable energy jointly or alone and feed it into the
energy network. New services are being developed for this that form and shape the energy transition. These include the Toon®
platform, innovative flexible services and services focusing on saving energy. Until 1 July 2016, the Group also transmitted energy
(electricity, gas and heating) but these activities have been disposed of outside the Group in preparation for the unbundling of Eneco
Holding N.V. into an energy company and a network company. The network activities have been distributed to the shareholder,
Eneco Holding N.V., as a dividend. In addition to the Netherlands, the Group operates in Belgium, France, Germany and the United
Kingdom.
The Group’s main strategic alliances are its investments and participating interests in onshore and offshore wind farms and start-
ups, and memberships of co-operatives. An example of this is the joint investment with Mitsubishi Corporation in the Luchterduinen
off-shore wind farm which came on stream in 2016. The Group is also a member of the Enecogen VOF power station partnership
and has an interest in Groene Energie Administratie B.V. (Greenchoice).
The consolidated financial statements have been prepared by the company’s Board of Management. The 2016 financial statements
were signed by the Board of Management during the meeting on 30 January 2017 and were adopted by the General Shareholders’
Meeting, also on 30 January 2017.
Unless otherwise stated, all amounts in the financial statements are in millions of euros.
The company’s consolidated financial statements have been prepared in compliance with the International Financial Reporting
Standards (IFRS) in force at 31 December 2016, as adopted by the European Commission, and with the provisions of Part 9, Book 2
of the Dutch Civil Code. The consolidated financial statements have been prepared on a going-concern basis using the accrual basis
of accounting.
The company income statement is presented in an abridged form pursuant to the provisions of Section 402, Part 9, Book 2 of the
Dutch Civil Code.
1.2 New and amended IFRS standardsThe following new IFRS standards are relevant to Eneco and had been adopted by the European Commission but are not mandatory
for 2016. They will be applied from 1 January 2018:
• IFRS 9 ‘Financial Instruments’: this standard sets a comprehensive framework for the classification, presentation, recognition and
measurement of all financial assets and liabilities and replaces the existing regulations in IAS 39 ‘Financial Instruments:
Recognition and Measurement’. IFRS 9 is effective for reporting periods beginning on or after 1 January 2018 with early adoption
permitted, but the Group will not do this. This standard includes amended provisions on the classification of financial assets and
liabilities that are closer to the business model and on impairment of financial assets based on an ‘expected loss’ model rather
than an ‘actual loss’ model. The provisions on hedge accounting have also been amended to be more closely in line with
businesses’ risk policy and are less rigid. The Group does not intend to amend the basis of its measurement of those financial
instruments when implementing this standard. The Group expects to complete the analysis of the potential effect on the
consolidated financial statements from applying this standard during the first half of 2017.
• IFRS 15 ‘Revenue from Contracts with Customers’: this standard provides a framework for revenue recognition. This new
standard replaces the existing regulations on revenue recognition, including IAS 18 ‘Revenue’, IAS 11 ‘Construction Contracts’ and
IFRIC 18 ‘Transfers of Assets from Customers’. IFRS 15 is effective for reporting periods beginning on or after 1 January 2018
with early adoption permitted, but the Group will not do this. The Group expects to complete the analysis of the potential effect
on the consolidated financial statements from applying this standard during the first half of 2017.
30 N.V. Eneco Beheer Annual Report 2016

Other new IFRS standards, amendments to existing standards and new interpretations that will apply in later reporting periods but
that have not yet been adopted by the European Commission and/or that are not relevant to the Group are not addressed further in
these financial statements.
1.3 Basis of consolidationThe consolidated financial statements incorporate the financial statements of N.V. Eneco Beheer, its subsidiaries and the relevant
proportion of the joint operations, non-consolidated joint ventures, associates and other capital interests.
Subsidiaries
A subsidiary is an entity where the company exercises control. This means that the company controls, directly or indirectly, that
entity’s financial and business operations with the purpose of gaining economic benefits from the activities of that entity. Control is
based on whether the investor (1) exercises control over the entity, (2) is exposed, or has rights, to variable returns from the
investment in the entity and (3) has the ability to affect those returns through its control. In general, the company holds more than
half the shares in its subsidiaries.
The financial statements of a subsidiary are recognised in the consolidated financial statements according to the full consolidation
method from the date on which control is obtained until the date on which that control no longer exists. Potential voting rights
which can be exercised immediately are also taken into account when determining whether control exists. Pursuant to the full
consolidation method, 100% of the assets, liabilities, income and expenses from subsidiaries are recognised in the consolidated
financial statements. Intercompany balance sheet positions, transactions and results on such transactions between subsidiaries are
eliminated.
Non-controlling interests consist of the capital interests of minority shareholders in the fair value of the identifiable assets and
liabilities when a subsidiary is acquired and the non-controlling interest in subsequent changes to the equity. Non-controlling
interests in the equity and results of subsidiaries are disclosed separately.
Joint operations / Joint ventures
Joint operations and joint ventures are entities for alliances in respect of which there are contractual undertakings with one or more
parties under which they have joint decisive control over that entity. A joint operation is a joint arrangement whereby the parties
that have joint control of the arrangement have rights to the assets and obligations for the liabilities relating to the arrangement. A
joint venture is a joint arrangement whereby the parties that have joint control of the arrangement have rights to the net assets of
the arrangement.
Only the Group’s share of assets, liabilities, income and expenses of joint operations are consolidated, in accordance with the
accounting policies of the Group. Joint ventures are recognised using the equity method in accordance with the accounting policies
of the Group. Interests in joint operations and joint ventures are recognised from the date on which joint control is obtained until
that joint control no longer exists.
Associates
An associate is an entity where there is significant influence over the financial and operating strategy, but not control. In general,
20% to 50% of the voting rights are held in an associate.
The share in associates is recognised in the consolidated financial statements using the equity accounting method, in which initial
recognition is at historical cost with the carrying amount being adjusted for the share in the result. Dividends received are deducted
from the carrying amount. Associates are recognised from the date on which significant influence has been obtained until the date
on which that influence no longer exists. Results on transactions with associates are eliminated in proportion to the interest in the
associate. Impairment losses on associates are not eliminated.
Losses on associates are recognised up to the amount of the net investment in the associate, including both the carrying amount
and any loans granted to the associate. A provision is only formed for the share in further losses if the Group has assumed liability
for those losses.
Other capital interests
Other capital interests are investments in entities in which the Group has an interest but where neither control nor significant
influence can be exercised. These interests are carried at fair value with movements recognised through profit or loss. If its fair value
cannot be reliably measured, a capital interest is carried at historical cost. Dividends are recognised through the income statement
when they fall due.
N.V. Eneco Beheer Annual Report 2016 31

2. Accounting policies2.1 General
First adoption of International Financial Reporting Standards (IFRS)
The Group did not prepare financial statements in the reporting periods to 2015 as it made use of the exemption pursuant to
Section 403, Part 9, Book 2 of the Dutch Civil Code. From 2016, the group is preparing financial statements and has opted to apply
IFRS measurement principles. As a result of its first adoption of IFRS in the reporting period, the Group is complying with IFRS 1.
Judgements, estimates and assumptions
In preparing the financial statements management applied judgements, estimates and assumptions which affect the reported
amounts and rights and obligations not disclosed in the balance sheet. In particular, they relate to the revenues from sales to retail
customers, the useful life of property, plant and equipment, the fair value of the relevant assets and liabilities, impairment of assets
and the size of provisions. The judgements, estimates and assumptions that have been applied are based on market information,
knowledge, historical experience and other factors that can be deemed reasonable in the circumstances. Actual results could,
however, differ from the estimates. Judgements, estimates and assumptions are reviewed on an on-going basis. Changes in
accounting estimates are recognised in the period in which the estimate is revised if the revision affects only that period. If the
revision also affects future periods, the change is made prospectively in the relevant periods. Any points of particular importance
with regard to judgements, estimates and assumptions are set out in the notes to the income statement and balance sheet items.
Impairment of assets
There is evidence of an impairment when the carrying amount of an asset is higher than the recoverable amount. The recoverable
amount of an asset is the higher of the sale price less costs to sell and the value in use. An asset’s value in use is based on the
present value of estimated future cash flows calculated using a pre-tax discount rate which reflects the time value of money and the
specific risks of the asset. The recoverable amount of an asset which does not independently generate a cash flow and is dependent
on the cash flows of other assets or groups of assets is determined for the cash-generating unit of which the asset is part.
A cash-generating unit is the smallest identifiable group of assets separately generating cash flows that are significantly
independent of the cash flows from other assets or groups of assets. Cash-generating units are distinguished on the basis of the
economic interrelationship between assets and the generation of external cash flows and not on the basis of separate legal entities.
Goodwill is allocated on initial recognition to one or more cash-generating units in line with the way in which the goodwill is assessed
internally by the management.
Impairment tests are performed each half year. If there is evidence of impairment, the recoverable amount of the relevant asset or
cash-generating unit is determined. The recoverable amount of goodwill is determined each year.
When the carrying amount of assets allocated to a cash-generating unit is higher than the recoverable amount, the carrying amount
is reduced to the recoverable amount. This impairment is recognised through the income statement. Impairment of a cash-
generating unit is first deducted from the goodwill attributed to that unit (or group of units) and then deducted proportionately from
the carrying amount of the other assets of that unit (or group of units).
Impairment may be reversed through the income statement if the reasons for it no longer exist or have changed. Impairment is only
reversed up to the original carrying amount less regular depreciation. Impairment losses on goodwill are not reversed.
Foreign currencies
The euro (€) is the Group’s functional currency and the currency in which the financial statements are presented. Transactions in
foreign currencies are translated into euros at the exchange rate prevailing on the date of the transaction. Monetary assets and
liabilities denominated in foreign currencies on the reporting date are translated into euros at the exchange rate prevailing on the
reporting date. Foreign currency exchange differences that arise on translation are recognised through the income statement.
If the functional currency of a foreign subsidiary, joint operation, joint venture or associate is not the euro, foreign currency exchange
differences arising from translation are recognised as translation differences in equity. The accumulated translation difference is
recognised through the income statement when a foreign subsidiary, joint operation, joint venture or associate is sold. Translation
differences on monetary items that are or were part of the net investment in such foreign operations are also accumulated in the
translation reserve and released to profit or loss on sale of the foreign operation.
32 N.V. Eneco Beheer Annual Report 2016

Netting off
Receivables and payables with a counterparty are netted off if there is a contractual right and the intention to settle net. In the
absence of an intention or actual netted settlement, the existence of an asset or liability is determined for each contract.
2.2 RevenuesRevenues are recognised when it is probable that the economic benefits will be attributed to the Group and the revenues can be
reliably measured. Revenues a re recognised less discounts, taxes and levies, such as energy tax and value added tax. Amounts that
are invoiced and collected for third parties are not recognised as revenues.
Energy supply and transmission
Revenues from the sale of energy and transmission services to end users are recognised at the time of supply, when the rewards of
ownership and risk of any impairment are transferred to the customer. These revenues have been recognised in the income
statement as discontinued operations.
Regulated sales of electricity, gas and metering services to large-volume consumers are billed monthly based on meter readings. The
mandatory suppliers model for retail consumers has been in place since 1 August 2013. Transmission revenues are billed to the grid
operator by energy suppliers with a one month delay.
Actual costings under the applicable regulatory method settled through regulated tariff decisions are recognised as revenue in the
year in which the tariff is actually generated on the basis of the service provided in that year.
Energy-related activities
Revenues from the construction, maintenance and leasing of energy installations and equipment, the sale of solar panels and rental
of smart thermostats are recognised as revenues from energy-related activities.
Services and construction contracts
Revenues are recognised through the income statement using the percentage of completion method when they become sufficiently
certain. The extent to which performance has been delivered is determined on the basis of either the relationship between the costs
incurred and the total expected costs or an analysis of the work performed.
Trading of energy commodities and CO2 emission rights
When sale and purchase contracts for energy commodities and emission rights not concluded for the company’s own use but for
trading purposes are entered into, countervailing sales and purchase contracts are concluded at virtually the same time. Gains and
losses arising from such trading transactions are netted and recognised as Other revenues from the time the relevant transactions
are concluded. Gains and losses arising from the revaluation to fair value of a trading contract are recognised directly through the
income statement as Other revenues.
Government grants
Government grants are recognised when it is reasonably certain that the conditions related to receiving the grants have been or will
be met and that the grants have been or will be forthcoming. Grants related to income as a contribution to costs are recognised as
revenues in the period in which those costs are incurred.
2.3 Purchase cost of energyThe purchase cost of energy contracts and commodities intended for the company’s own use are recognised in the same period as
that in which the revenues from the sale are realised. This also applies to the costs of transmission and the cost of compensation
for technical and administrative network losses.
2.4 Financial income and expensesFinancial income and expenses comprise interest income from outstanding investments, dividend revenues from other capital
interests, interest charges on borrowings, foreign exchange rate gains and losses and gains and losses on financial hedge
instruments recognised through the income statement. Interest income and expenses are recognised using the effective interest
method. Dividend revenues from other capital interests are recognised when they fall due.
2.5 Income taxesIncome taxes comprise current taxes and movements in deferred taxes. These amounts are recognised through the income
statement unless they concern items that are recognised directly through equity.
N.V. Eneco Beheer Annual Report 2016 33

Current tax is the likely amount of income taxes payable or recoverable in respect of the taxable profit or loss for the year under
review and is calculated on the basis of applicable tax legislation and rates.
Income taxes comprise all taxes based on taxable profits and losses, including taxes which subsidiaries, associates or joint ventures
must pay on distributions to the Group.
Additional income taxes on the result before dividend distributions are recognised at the same time as the obligation to distribute
that dividend is recognised.
2.6 Property, plant and equipmentProperty, plant and equipment is recognised at cost less accumulated depreciation and impairment. Cost comprises the initial
acquisition price plus all directly attributable costs. Cost of assets constructed by the company comprises the cost of materials and
services, direct labour and other directly attributable costs. Contributions towards cost from third parties and government grants are
deducted from the cost, provided they are not contributions from customers. Cost includes an estimate of the present value of the
cost of dismantling, demolishing and removing the item when it ceases to be used and of restoring the site on which it is located, if
there is a legal or constructive obligation to do so. Financing costs (interest) directly attributable to the purchase, construction or
production of an eligible asset are recognised in cost. If an asset comprises multiple significant components with differing useful
lives, these components are recognised separately.
Networks and network-related assets in the regulated domain
In 2016, the Group disposed of the networks and network-related assets in preparation for the forthcoming unbundling of Eneco
Holding N.V. Furthermore, Stedin’s networks and network-related assets in the regulated domain have been revalued and are
measured at the revaluation value, which is the fair value at revaluation date less accumulated depreciation and impairment.
The fair value of these network assets was measured at the beginning of each regulatory period. If in the interim period the fair
value differed significantly from the carrying amount, the revaluation was adjusted. An increase in the carrying amount as a result of
a revaluation of networks and network-related assets in the regulated domain was recognised directly in equity through the
revaluation reserve. A reduction in the carrying amount was also recognised directly in equity through the revaluation reserve up to
the amount of any previous increase in the same asset. If that figure is exceeded, the excess is recognised as a charge in the income
statement.
The difference between depreciation based on the revalued carrying amount and depreciation based on the original cost, less
deferred tax, was transferred periodically from the revaluation reserve to the retained earnings reserve.
Government grants
Government grants are recognised when it is reasonably certain that the conditions related to receiving the grants have been or will
be met and that the grants have been or will be forthcoming. Grants contributing to the cost of an asset are deducted from the
asset’s cost and reflected in the depreciation throughout the useful life of the asset.
Expenditure incurred subsequent to initial recognition
Expenses incurred at a later date are only added to the carrying amount of an asset if and to the extent that the condition of the
asset is improved compared to the originally formulated performance standards. Repair and maintenance are recognised through the
income statement in the period in which the costs are incurred.
Depreciation
The depreciation charge for each period is recognised through the income statement using the straight-line method based on
estimated useful life, taking into account the estimated residual value. Useful lives and residual values are reassessed annually and
any changes are recognised prospectively. Land, sites and assets under construction are not depreciated.
The following useful lives are applied:
Category Useful life in years
Buildings 25 - 50
Machinery and equipment 10 - 50
Networks, regulated 10 - 50
Other operating assets 3 - 25
34 N.V. Eneco Beheer Annual Report 2016

2.7 Leases (Group as lessee)A lease where the Group, as lessee, has in fact all the benefits and risks of ownership is designated as a finance lease; otherwise,
such agreements are recognised as operating leases.
Property, plant and equipment acquired on a finance lease are recognised, when the lease commences, at the lower of fair value of
the leased asset and the present value of the lease instalments. These assets are then recognised pursuant to the accounting
policies for property, plant and equipment. Lease instalments are broken down into interest and repayment components. The
interest component is based on a constant periodic rate of interest on the carrying amount of the investment. The interest
component is recognised through the income statement in the relevant period. The repayment component is deducted from the
lease obligation.
Operating lease instalments are recognised in equal amounts through the income statement over the term of the lease.
2.8 GoodwillThe acquisition price of a subsidiary, joint venture or associate is equal to the amount paid to purchase the interest. If the acquisition
price is higher than the share in the fair value at the date of acquisition of the identifiable assets, liabilities and contingent liabilities,
the excess is recognised as goodwill. Any shortfall is recognised as a gain (bargain purchase) through the income statement.
Goodwill is measured at cost less impairment. Goodwill is allocated to one or more cash-generating units. Goodwill is tested for
impairment annually.
Goodwill purchased on acquisition of subsidiaries and joint operations is recognised in the balance sheet in intangible assets.
Goodwill paid to acquire an interest in a joint venture or associate is included in the cost of acquisition.
2.9 Other intangible assetsOther intangible assets comprise customer databases acquired with acquisitions, software and licences, concessions, permits, rights
and development costs. The related costs are capitalised if it is probable that these assets will have an economic benefit and their
costs can be reliably measured. Other intangible assets are recognised at cost less accumulated amortisation and impairment.
Customer databases
A customer database obtained from an acquiree is initially recognised at fair value. This value is determined on the date of
acquisition on the basis of the most recent comparable transactions if the economic conditions are comparable or, if they are not,
the fair value is determined from the present value of the estimated future net cash flow from this asset.
Software
Software is capitalised at cost. Cost of standard and customised software comprises the one-time costs of licences plus the costs
of making the software ready for use. All costs attributable to software which qualifies as an intangible asset are recognised at cost.
Costs of software maintenance are recognised as an expense in the period in which they are incurred.
Development costs
Development costs are the costs of applying knowledge acquired through research by the company or a third party for a plan or
design for the manufacture or application of improved materials, products, processes, systems or services, prior to the
commencement of commercial manufacture or use. Development costs are only capitalised if they can be regarded as intangible
assets. If this is not the case, they are recognised as an expense in the period in which they are incurred. Research costs are the
costs of research aimed at the acquisition of new scientific or technical knowledge and understanding and are recognised through
the income statement in the period in which they are incurred.
Amortisation
Amortisation is recognised as an expense on the basis of the estimated useful life from the time that the relevant asset is taken into
use. Other intangible assets are amortised using the straight-line method. The residual value of these assets is nil.
N.V. Eneco Beheer Annual Report 2016 35
The following useful lives are applied:
Category Useful life in years
Customer databases 6 - 20
Licences 3 - 30
Software 3 - 5
Concessions, permits and rights 3 - 30
Development costs 5 - 15
2.10 Emission rightsEmissierechten worden bij eerste opname onderscheiden naar rechten bestemd voor eigen gebruik ('own use') en rechten bestemd
voor handelsdoeleinden.
Emission rights held for periodic redeeming to the government for actual CO2 emissions (company’s own use) are recognised as
intangible assets and recognised at cost. Rights of a current nature are presented as intangible assets. A provision, also carried at
cost, is formed for this redemption obligation. If a shortfall in the quantity required for redeeming is expected, an addition, charged
through the income statement, is made to this provision for the lower of the market value of that shortfall or the penalty expected
to be due for that shortfall.
Emission rights held for trading purposes are recognised as derivative financial instruments. The profit or loss arising from revaluing
these rights to fair value is recognised directly through the income statement as Other revenues.
2.11 Deferred taxesDeferred taxes are calculated using the balance sheet method for the relevant differences between the carrying amount and taxable
value of assets and liabilities. Deferred taxes are measured using the tax rates that are expected to apply to the period when the
asset is realised or the liability is settled, based on applicable tax rates and tax laws. Deferred taxes are recognised at face value.
Deferred tax assets are recognised for temporary differences available for relief, tax losses carried forward and the settlement of
unused tax credits if and to the extent it is probable that future taxable profit will become available, so enabling an offset of
unrelieved tax losses and unused taxed credits.d.
Deferred tax assets for all temporary differences available for relief relating to investments in subsidiaries, joint operations and
interests in associates and joint ventures are only recognised if it is probable that the temporary difference will be settled in the near
future and that future taxable profit will be available against which the deductible temporary difference can be utilised.
Deferred tax liabilities are recognised for all taxable temporary differences arising from investments in subsidiaries, joint operations
and interests in associates and joint ventures, unless the Group can determine the time at which the temporary difference will be
settled and it is probable that the temporary difference will not be settled in the near future.
Deferred tax assets and liabilities are offset if there is a legally enforceable right to set off tax assets against tax liabilities and
where the deferred tax assets and liabilities relate to taxes levied by the same tax authority on the same fiscal unity.
2.12 Derivative financial instrumentsThere is exposure to risks in operational and financing activities arising from developments in market prices of energy commodities
(electricity, gas, oil, etc.), foreign currencies, interest rates and emission rights. Derivative financial instruments such as financial
option, future and swap contracts are used to manage these risks. In the case of commodity contracts, the instruments are
categorised as for own use, trading or hedging when the transaction is entered into. Derivative financial instruments other than
commodity contracts are generally only entered into to hedge risk.
Measurement and recognition
Derivative financial instruments are measured at fair value, which is based on listed bid prices for assets held or for liabilities to be
issued and current offer prices for the assets to be acquired or the obligations held (mark-to-market). Derivative financial instruments
for energy commodity contracts are measured using mid-prices.
36 N.V. Eneco Beheer Annual Report 2016

Derivative financial instruments with a positive value are recognised as current (settlement within one year) or non-current
(settlement after one year) assets. Instruments with a negative value are recognised as current or non-current liabilities. Assets and
liabilities with each counterparty are netted off if there is a contractual right and the intention to settle the contracts net.
Movements in the fair value of derivative financial instruments are recognised directly through the income statement, unless the
derivative financial instruments are for own use or risk hedging.
Own use
Contracts are classified for own use if they are settled by physical delivery or receipt of energy commodities or emission rights in line
with the company’s needs. Transactions based upon these contracts are recognised through the income statement in the period in
which delivery or receipt takes place (accrual accounting).
Hedge accounting
Contracts are classified as hedging instruments if the risk of fluctuations in current or future cash flows which could affect the result
is hedged. If the hedge can be attributed to a particular risk or to the full movement in the transaction (energy contracts) associated
with an asset, liability or highly probable forecast transaction, the attributed derivative financial instruments are recognised as
hedging instruments.
If the conditions for hedge accounting are met, the effective portion of the changes to the fair value of the derivative financial
instruments concerned are recognised directly in the equity through the cash flow hedge reserve. The ineffective portion is
recognised through the income statement.
Amounts recognised through equity are recognised through the income statement when the hedged asset or liability is settled.
When a hedge instrument expires, is sold, terminated or exercised, or when the conditions for hedge accounting are no longer met,
although the underlying future transaction has yet to take place, the accumulated result remains in equity (in the cash flow hedge
reserve) until the forecast future transaction has taken place. If the forecast future transaction is no longer likely to take place, the
cumulative result is transferred directly from equity to the result.
Net investment hedge accounting is applied to mitigate translation differences on foreign non-euro operations. Application of this
type of hedge accounting means that foreign currency exchange differences arising from translation of foreign operations and those
on financial instruments (such as loans) allocated to them are recognised through the translation reserve (taking into account
deferred tax) until the end of the hedging relationship or earlier termination.
2.13 Other financial assetsOther financial assets are mainly long-term items with a term of more than one year, such as loans, receivables and prepayments
due from associates, joint ventures or third parties. Long-term receivables, loans and prepayments are measured at amortised cost
using the effective interest method.
2.14 Assets and liabilities held for saleAssets (and liabilities of an asset group) held for sale and discontinued operations are classified as held for sale when the carrying
amount will be recovered through a sale transaction rather than through continuing use. The classification is only made if it is highly
probable that the asset group or operations are available for immediate sale in their present condition and the sale is expected to be
completed within one year. If activities to be disposed are classified as discontinued operations (e.g. significant business units), their
results and the comparative figures in the income statement are presented on the discontinued operations line. Where necessary,
eliminations for consolidation are made.
Assets and asset groups held for sale are measured at the lower of the carrying amount preceding classification as held for sale and
fair value less costs to sell.
2.15 InventoriesInventories are recognised at the lower of weighted average cost and net recoverable amount. Cost of inventories is the purchase
price including directly attributable costs incurred to bring the inventories to their current location and state. Net recoverable amount
is the estimated sales price in the ordinary course of business less forecast costs of sale. Impairment of inventories is recognised
through the income statement if the carrying amount exceeds the net recoverable amount.
N.V. Eneco Beheer Annual Report 2016 37

2.16 Trade and other receivablesTrade and other receivables have a term of less than one year. These receivables also include the net amounts that on the reporting
date have yet to be billed for energy supplied or transmission services rendered. Receivables are measured at fair value and
thereafter at amortised cost less impairment losses. Receivables with a term of less than one year are not discounted on initial
recognition. In view of their short-term nature, the carrying amount of trade and other receivables at the reporting date is equal to
their fair value.
2.17 Cash and cash equivalentsCash and cash equivalents comprise cash and bank balances and deposits with a maturity of no more than three months.
2.18 Provisions for employee benefitsPensions
Pension liabilities of almost all business units have been placed with the industry-wide pension funds: Stichting Pensioenfonds ABP
(ABP) and the Stichting Pensioenfonds Metaal en Techniek (PMT). A limited number of employees have individual plans insured with
various insurance companies.
The amount of the pension depends on age, salary and years of service. Employees may opt to retire earlier or (with the Group’s
agreement) later than the state retirement age, in which case their pension is adjusted accordingly. At ABP this is between 60 and
the state retirement age plus 5 years and at PMT between 5 years before and 5 years after the state retirement age.
In the event of future shortfalls, the pension funds may only adjust future contributions and only within a limited range. Under IFRS
these plans are classified as multi-employer defined-contribution plans. A defined-contribution plan is a plan in which a fixed
contribution is paid for the benefit of an employee without any further claim by or liability to that employee. Liabilities in respect of
contributions to pension and related plans on the basis of available contributions are recognised as an expense in the period to
which they relate.
Other provisions for employee benefits
A provision is recognised for the obligation to pay out amounts related to long-service benefits and on the retirement of employees.
A provision is also recognised for the obligation to contribute towards the health insurance premiums of retired employees, salary
payments in the event of illness and the employer’s risk under the Unemployment Act. Where appropriate, these liabilities are
calculated at the reporting date using the projected unit credit method, using a pre-tax discount rate which reflects the current
market assessment of the time value of money.
2.19 Other provisionsA provision is recognised when, due to a past event, there is a present legal or constructive obligation that is of an uncertain size or
that will occur at an uncertain future date, and where its settlement will probably lead to outgoings of an economic nature.
Provisions that will be settled within one year of the reporting date, or that are of limited material significance, are recognised at
face value. Other provisions are recognised at the present value of the expected expenditure. The specific risks inherent to the
relevant obligation are taken into account when determining this expenditure. The present value is calculated using a pre-tax
discount rate which reflects the current market valuation of the time value of money. The determination of the expected expenditure
is based on detailed plans in order to limit the uncertainty regarding the amount.
Decommissioning
A provision is recognised that equals the present value of the expected costs where there is an obligation to dismantle, demolish or
remove an item of property, plant or equipment when it ceases to be used. The initial recognition of the decommissioning provision
for an asset is included in the cost of that asset. Interest is added periodically to the decommissioning provision.
Onerous contracts
A provision for onerous contracts is recognised when it is probable that the unavoidable costs of meeting the contractual obligations
exceed the economic benefits to be derived from the contract.
Restructuring
A restructuring provision is recognised if a formal plan for the restructuring has been approved and its main features have been
announced to those affected by it and there is a valid expectation that the restructuring will be carried out. A restructuring provision
only includes the expenditures necessarily entailed by the restructuring and not those relating to continuing activities.
38 N.V. Eneco Beheer Annual Report 2016
2.20 Interest-bearing debtOn initial recognition, interest-bearing debt is carried at fair value plus the transaction costs directly attributable to this debt.
Subsequent to initial recognition, interest-bearing debt is recognised at amortised cost using the effective interest method.
2.21 Leases (Group as lessor)A lease where the Group, as lessor, has in fact all the benefits and risks of ownership is designated as an operating lease; otherwise,
such agreements are recognised as finance leases.
Property, plant and equipment made available to third parties by means of an operating lease is recognised in accordance with the
accounting policies for property, plant and equipment. Lease instalments are allocated to the various periods so that a constant
annual return is made on the net investment.
Property, plant and equipment made available to third parties by means of a finance lease is recognised as a receivable for the net
investment in the assets. Lease instalments are then broken down into interest and repayment components based on a constant
periodic rate of interest. The interest component is recognised through the income statement in the relevant period. The repayment
component is deducted from the lease obligation.
2.22 Trade and other payablesTrade payables and other financial liabilities are recognised at fair value and subsequently at amortised cost. Payables with a term of
less than one year are not discounted on initial recognition. In view of their short-term nature, the carrying amount of trade and
other payables at the reporting date is equal to their fair value.
N.V. Eneco Beheer Annual Report 2016 39

Notes to the consolidated income statementAll amounts in millions of euros unless stated otherwise.
3. Revenues from energy sales and energy-related activities2016 2015
Electricity 1,198 1,370
Gas 1,088 1,371
District heat 252 220
Energy-related activities 104 109
Total 2,642 3,070
Sales to large-volume consumers are billed monthly based on meter readings. Billing for sales to retail consumers is based on meter
readings taken throughout the year. The amount of energy supplied to retail consumers during the reporting period and the resulting
revenues are, therefore, estimated in part on the basis of historical consumption information, standard customer profiles, weather
conditions and applicable energy tariffs.
4. Other revenuesOther revenues are mainly proceeds from recharges of costs, sales of CO2 rights and income from the disposal of interests in
associates.
5. Employee benefits2016 2015
Wages and salaries 153 146
Social security contributions 17 24
Pension contributions 17 20
Other employee benefits 24 25
Total 211 215
Total employee benefits were € 236 million (2015: € 242 million). € 8 million (2015: € 7 million) of employee benefits have been
capitalised. As their nature is directly related to revenue, employee benefits of € 17 million (2015: € 20 million) have been recognised
as part of the cost of energy sales and energy-related activities.
Total employee benefits (including capitalised employee benefits) consist of wages and salaries, social security contributions and
pension contributions for continued and discontinued operations together were € 263 million (2015: € 380 million), € 30 million
(2015: € 50 million) and € 27 million (2015: € 43 million) respectively.
HeadcountThe table below shows average headcount of continued and discontinued operations expressed in full-time equivalents (FTE):
FTE 2016 2015
Energy company Eneco (continued operations) 2,882 3,141
Stedin 1 (discontinued operations) 1,455 3,570
Total 4,337 6,711
of whom, working outside the Netherlands 266 314
1 The reduction in the average number of employees is a result of Stedin no longer forming part of the Group after 1 July 2016.
6. Renumeration of the Board of ManagementThe members of the Group’s Board of Management did not receive any remuneration during the year under review (2015: nil) since
their executive duties and responsibilities are part of their position with the Group’s shareholder.
40 N.V. Eneco Beheer Annual Report 2016

7. Share of profit of associates and joint venturesThe associates and joint ventures are included in the List of principal subsidiaries, joint operations, joint ventures and associates in
these financial statements.
2016 2015
Share in net profit 7 7
Result on disposal – 3
Impairment – –1
Total 7 9
8. Financial incomeThe financial income is mainly interest.
9. Financial expenses2016 2015
Interest expense 7 3
Interest added to provisions 2 3
Other 1 2
Total 10 8
10. Income tax on the result from continued operationsThe Group is a member of a fiscal unity for corporate income tax purposes headed by Eneco Holding N.V. The table below shows the
income taxes:
2016 2015
Current tax expense 31 29
Movements in deferred taxes –15 –19
Adjustment for prior years movements deferred taxes –2 –1
Income tax 14 9
The movements in deferred taxes include a reduction of € 4 million in the Energy Investment Allowance to be amortised
(2015: reduction of € 3 million).
The table below shows the tax expense for continued operations:
2016 2015
Profit before income tax 117 64
Participation exemption –39 –9
Non tax-deductible expenses 10 3
Depreciation at non-statutory rates 48 61
Addition to provisions treated differently for tax purposes –10 –4
Adjustment prior years results –2 –
Disallowable losses 1 1
Taxable profit 125 116
Carry forward of losses – –
Taxable amount 125 116
Nominal tax rate 25,0% 25,0%
Current tax expense 31 29
N.V. Eneco Beheer Annual Report 2016 41

The table below shows the effective tax burden expressed as a percentage of the profit before income tax for continued operations:
2016 2015
Nominal tax rate 25.0% 25.0%
Effect of:
- Participation exemption –8.4% –3.5%
- Non tax-deductible expenses 2.1% 1.2%
- Tax incentives (Energy Investment Allowance, EIA scheme –4.5% –8.5%
- Other –2.2% –0.1%
Effective tax rate 12.0% 14.1%
11. Result after tax on discontinued operationsThe network and engineering activities (comprising CityTec B.V., Joulz Energy Solutions B.V., Stedin Diensten B.V., Stedin
Netbeheer B.V., Utility Connect B.V. and their subsidiaries) were classified as a discontinued operation in 2016 as a result of the
preparations for the forthcoming unbundling of Eneco Holding N.V. into an energy company and a network company. These
companies were transferred to Eneco Holding N.V. in January 2016 and July 2016. The consultancy activities (Ecofys) were sold in
November 2016. Their net results to the date of disposal have been presented as ‘Result after income tax from discontinued
operations’.
11.1 Result from discontinued operationsThe income statement for discontinued operations is summarised below. For 2016, this is six months for Stedin Diensten B.V. and
Stedin Netbeheer B.V. and their subsidiaries. For 2015, it is the full calendar year for CityTec B.V., Joulz Energy Solutions B.V.,
Stedin Diensten B.V., Stedin Netbeheer B.V., Utility Connect B.V. and their subsidiaries.
2016 2015
Revenues from energy sales and energy related activities 494 989
Purchases of energy and energy related activities –69 –142
Gross margin 425 847
Other revenues 48 187
Gross margin and other operating revenues 473 1,034
Operating expenses –356 –756
Operating profit 117 278
Financial income and expenses –3 –7
Profit before income tax 114 271
Income tax –25 –62
Profit after income tax 89 209
The disposal of the network and engineering activities has not led to an impairment or profit. Ahead of classification as a
discontinued operation, there was a test of whether this asset group should be written down by an impairment as described in
1.3 ‘Basis of consolidation’. The fair value less the expected costs of transferring the asset group to be disposed of was not below
the carrying amount.
The revaluation reserve for the regulated networks was recognised in unrealised gains and losses for the network and engineering
activities. This revaluation reserve was released to retained earnings. The network and engineering activities do not include
unrealised gains and losses that have to be settled though the income statement.
42 N.V. Eneco Beheer Annual Report 2016

11.2 Cash flow from discontinued operationsThe cash flows for discontinued operations are summarised below. They are for six months for 2016 and the full calendar year for
2015.
x € 1 mln. 2016 2015
Kasstromen uit operationele activiteiten 165 425
Kasstromen uit investeringsactiviteiten –182 –304
Kasstromen uit financiëringsactiviteiten – –126
Kasstromen beëindigde bedrijfsactiviteiten –17 –5
12. Government grantsGovernment grants recognised in the result were as follows:
2016 2015
Environmental Quality of Electricity Production (MEP scheme) ) 81 93
Energy Investment Allowance (EIA scheme) 5 6
Stimulation Sustainable Energy Production (SDE scheme) 55 46
Other government grants 2 1
Total 143 146
Government grants relate to continued activities.
N.V. Eneco Beheer Annual Report 2016 43
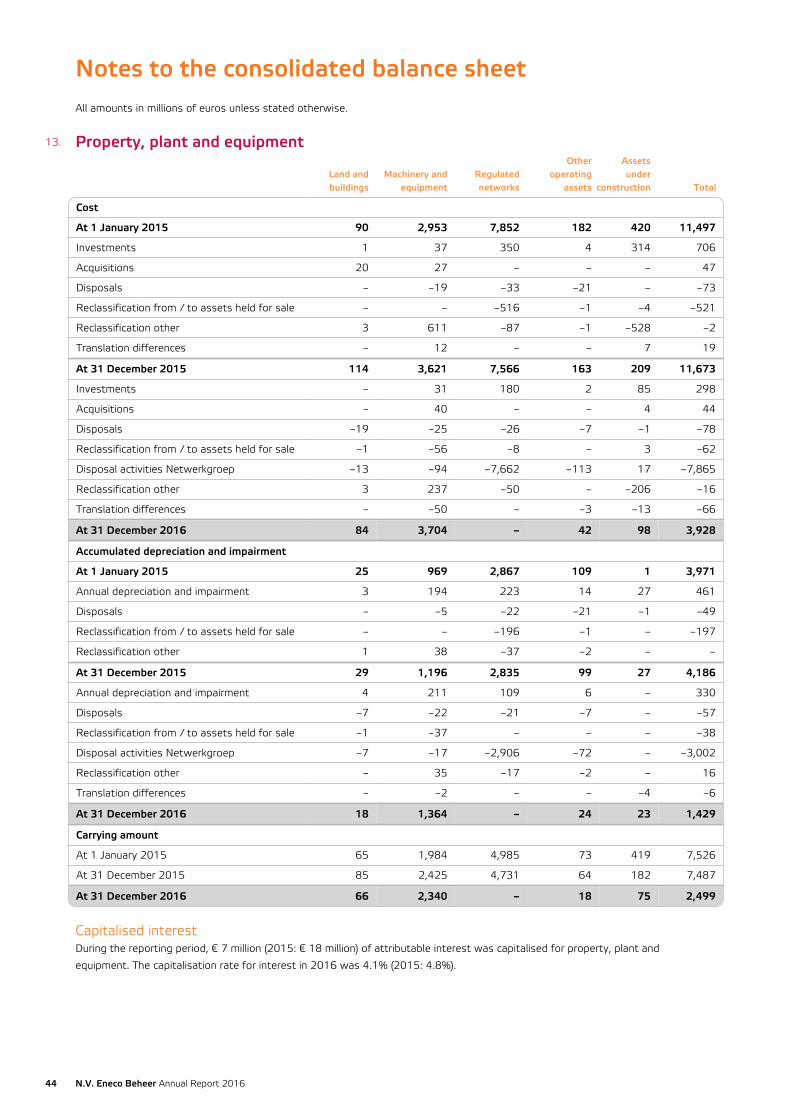
Notes to the consolidated balance sheetAll amounts in millions of euros unless stated otherwise.
13. Property, plant and equipment
Land andbuildings
Machinery andequipment
Regulatednetworks
Otheroperating
assets
Assetsunder
construction Total
Cost
At 1 January 2015 90 2,953 7,852 182 420 11,497
Investments 1 37 350 4 314 706
Acquisitions 20 27 – – – 47
Disposals – –19 –33 –21 – –73
Reclassification from / to assets held for sale – – –516 –1 –4 –521
Reclassification other 3 611 –87 –1 –528 –2
Translation differences – 12 – – 7 19
At 31 December 2015 114 3,621 7,566 163 209 11,673
Investments – 31 180 2 85 298
Acquisitions – 40 – – 4 44
Disposals –19 –25 –26 –7 –1 –78
Reclassification from / to assets held for sale –1 –56 –8 – 3 –62
Disposal activities Netwerkgroep –13 –94 –7,662 –113 17 –7,865
Reclassification other 3 237 –50 – –206 –16
Translation differences – –50 – –3 –13 –66
At 31 December 2016 84 3,704 – 42 98 3,928
Accumulated depreciation and impairment
At 1 January 2015 25 969 2,867 109 1 3,971
Annual depreciation and impairment 3 194 223 14 27 461
Disposals – –5 –22 –21 –1 –49
Reclassification from / to assets held for sale – – –196 –1 – –197
Reclassification other 1 38 –37 –2 – –
At 31 December 2015 29 1,196 2,835 99 27 4,186
Annual depreciation and impairment 4 211 109 6 – 330
Disposals –7 –22 –21 –7 – –57
Reclassification from / to assets held for sale –1 –37 – – – –38
Disposal activities Netwerkgroep –7 –17 –2,906 –72 – –3,002
Reclassification other – 35 –17 –2 – 16
Translation differences – –2 – – –4 –6
At 31 December 2016 18 1,364 – 24 23 1,429
Carrying amount
At 1 January 2015 65 1,984 4,985 73 419 7,526
At 31 December 2015 85 2,425 4,731 64 182 7,487
At 31 December 2016 66 2,340 – 18 75 2,499
Capitalised interestDuring the reporting period, € 7 million (2015: € 18 million) of attributable interest was capitalised for property, plant and
equipment. The capitalisation rate for interest in 2016 was 4.1% (2015: 4.8%).
44 N.V. Eneco Beheer Annual Report 2016
Assets under constructionAssets under construction were mainly offshore and onshore wind farms and standard investment in district heating networks and,
until the disposal of the regulated network activities, in gas and electricity networks. In September 2015, the United Kingdom
government refused consent for the development and construction of the Navitus Bay offshore wind farm in southern England. This
impairment was recognised in ‘Depreciation and impairment of property, plant and equipment’ in 2015.
Regulated networksIn 2016, the regulated network activities were disposed of to Eneco Holding N.V. The regulated networks category relates to
different types of Stedin’s assets in the regulated domain such as the electricity and gas networks, gas connections and meters
required for gas and electricity distribution and transmission activities. Regulated network activities are subject to regulation by the
Office of Energy Regulation of the Netherlands Authority for Consumers and Markets (ACM).
The information for measuring the regulated network activities is covered by ‘level 1’ in the fair value hierarchy as specified in
IFRS 13 ‘Fair Value Measurement’ (see note 18 'Derivative financial instruments'). These measurement models use observable
market prices, being the Standardised Asset Value tariffs set by the government. The reserve formed for the revaluation of the
regulated networks to fair value was released on the disposal of the network company to retained earnings.
At 31 December 2015, the carrying amount of the regulated networks at historical cost was € 3,685 million
(1 January 2015: € 3,884 million).
N.V. Eneco Beheer Annual Report 2016 45

14. Intangible assets
GoodwillCustomer
databasesLicences and
software
Concessions,permits and
rightsDevelopment
costs Total
Cost
At 1 January 2015 171 198 95 231 3 698
Investments – – 7 1 1 9
Disposals –10 – –14 –150 – –174
Reclassification from / to assets held forsale – – –1 – – –1
Translation differences 1 – – 1 – 2
Reclassification other –1 1 1 1 – 2
At 31 December 2015 161 199 88 84 4 536
Investments 1 – 3 – 2 6
Disposals – – –2 –1 –2 –5
Translation differences –2 – – –2 – –4
Disposal assets Netwerkgroep – – –13 –8 – –21
Reclassification other – – 7 – – 7
At 31 December 2016 160 199 83 73 4 519
Accumulated depreciation andimpairment
At 1 January 2015 10 103 76 170 1 360
Annual depreciation and impairment – 20 9 5 – 34
Disposals –10 – –14 –150 – –174
Reclassification from / to assets held forsale – – –1 – – –1
Reclassification other – – 1 1 – 2
At 31 December 2015 – 123 71 26 1 221
Annual depreciation and impairment – 20 7 4 1 32
Translation differences – – – –1 – –1
Disposal assets Netwerkgroep – – –10 –2 – –12
Disposals – – –2 – –1 –3
At 31 December 2016 – 143 66 27 1 237
Carrying amount
At 1 January 2015 161 95 19 61 2 338
At 31 December 2015 161 76 17 58 3 315
At 31 December 2016 160 56 17 46 3 282
GoodwillGoodwill is allocated to one or more cash-generating units. Goodwill at 31 December 2016 was € 160 million
(31 December 2015: € 161 million; 1 January 2015 € 161 million). An impairment analysis was performed on this goodwill which
showed that the recoverable amount of this group of cash-generating units (value in use) higher than their carrying amount. The
following assumptions were used to establish the value in use: the value in use of the cash-generating units was based on expected
future cash flows for five years as in the Group’s long-term plans (based in part on historical figures) and thereafter extrapolated on
the expected life of the assets of these cash-generating units, which is generally longer than the five-year period; long-term growth
of 1.0% was taken into account. The pre-tax discount rates, which reflect the risks of the activities of the relevant cash-generating
units, were 6% - 7% (2015: 6% - 7% for all cash-generating units). The discount rates are based on the weighted average cost of
capital (WACC), whose parameters are derived from data from a peer group and market information. The calculation of the value in
use of these assets is sensitive to the following assumptions: the discount rate, the growth figure applied for extrapolating cash
flows beyond the five-year plan and the average life of the assets. Of these factors, the discount rate is the most sensitive and an
increase of 0.5 percentage points would reduce the value in use by some € 0.1 billion but would not lead to impairment.
46 N.V. Eneco Beheer Annual Report 2016

Customer databasesCustomer databases relate mainly to DONG Energy Sales (acquired in 2014), Oxxio (acquired in 2011) and REMU N.V. (acquired in
2003).
Concessions, permits and rightsConcessions, permits and rights consist mainly of capitalised permits granted for existing and future wind farms in Belgium and the
United Kingdom.
15. Business combinationsThere were four acquisitions in 2016, relating mainly to the acquisition of part of the sustainable energy production and
development activities of DELTA in the Netherlands in October 2016. In 2016, the Group also acquired two solar farms in Belgium
(March and November) and one solar farm in the United Kingdom (December). These acquisitions were effected by purchasing the
entire share capital and associated control in a cash transaction. Payment for the solar farm in the United Kingdom was made in
early 2017.
The purchase price for the acquisition of the Belgian solar farms was finalised in the second half of 2016. The final purchase price for
DELTA’s assets and development activities depends in part on the settlement of specific items and had not been determined on the
reporting date. The settlement may to some extent affect the allocation of the purchase price to the identified assets and liabilities
(based on fair value). In addition, the solar farm in the United Kingdom was acquired shortly before the reporting date and so the
allocation of the purchase price did not take place in 2016. Consequently, the acquisition of the sustainable energy production and
development activities of DELTA and the solar farm in the United Kingdom have been recognised ‘provisionally’ in these 2016
financial statements. These acquisitions fit the Group’s strategy of investing in the development and production of sustainable
energy and so reinforce the Group’s market position.
The total acquisition price of all these businesses was some € 24 million. The assets and liabilities were recognised on the
acquisition date at their provisional fair value and consisted of some € 44 million of property, plant and equipment, € 4 million of
current assets, € 4 million of provisions, € 9 million of non-current liabilities and € 11 million of current liabilities. These acquisitions
are very unlikely to lead to the recognition of goodwill. The costs related to these transactions were some € 0.5 million.
The purchased businesses have contributed a total of some € 2 million to the revenue of the Group since the acquisition date and
are making a limited positive contribution to the profit after income tax. Pro rata, the revenues of the Group including these
acquisitions would be € 4 million higher per year (for the full year 2016).
16. Associates and joint venturesThe Group participates with one or more parties in businesses in the form of an associate or joint venture to perform shared
operations.
Movements in the value of associates and joint ventures were as follows in 2016:
2016 2015
Carrying amount at 1 January 61 58
Investments 2 1
Share in net profit of associates 5 7
Dividend received –8 –2
Impairment – –1
Reclassification other – –2
Carrying amount at 31 December 60 61
N.V. Eneco Beheer Annual Report 2016 47

The table below summarises the financial data of the associates and joint ventures 1:
Balance sheet information At 31 December 2016 At 31 December 2015 At 1 January 2015
Property, plant and equipment 57 17 13
Current assets 260 171 135
Non-current liabilities 37 2 1
Current liabilities 154 117 106
Net assets (100%) 126 69 41
Eneco’s share of net assets 38 39 36
Carrying amount of interest in associates and jointventures (incl. acquired goodwill) 60 61 58
Profit or loss information
Revenues (100%) 425 442
Profit after income tax (100%) 19 27
Total other comprehensive income (100%) – –
Total comprehensive income (100%) 19 27
Eneco’s share of total comprehensive income 5 7
Eneco’s share of profit after income tax and totalcomprehensive income 5 7
1 These figures have been prepared using the most recently published/available financial information of these associates and joint ventures.
17. Deferred taxesThe table below shows the deferred tax assets and liabilities:
Assets
At 31 December 2016 At 31 December 2015 At 1 January 2015
Loss carry forwards 5 5 4
Total 5 5 4
Liabilities
At 31 December 2016 At 31 December 2015 At 1 January 2015
Property, plant and equipment 166 380 391
Intangible fixed assets 15 15 17
Cash flow hedges 10 31 21
Loss carry forwards – 18 – 19 – 15
Losses at non-resident participating interests 18 20 21
Provisions – 4 – 6 – 7
Total 187 421 428
Deferred tax assets and liabilities related to cash flow hedges have been recognised through equity. The regulations for preventing
double taxation create the deferred tax liability presented for losses at non-resident permanent establishments.
48 N.V. Eneco Beheer Annual Report 2016

Movements in deferred taxes during 2016 were as follows:
Netbalance
at 1 January2016
Recognisedin profit or
loss1
Recognised inother
comprehensiveincome
DisposalactivitiesNetwork
Group
Net balanceat
31 December2016
Deferred taxassets
Deferredtax
liabilities
Property, plant and equipment – 380 12 – 202 – 166 – – 166
Intangible fixed assets – 15 – – – – 15 – – 15
Cash flow hedges – 31 – 20 1 – 10 – – 10
Loss carry forwards 24 – 1 – – 23 23 –
Losses at non-resident participatinginterests – 20 2 – – – 18 – – 18
Provisions 6 – 2 – – 4 4 –
Tax liabilities (assets) before set-off – 416 11 20 203 – 182 27 – 209
Set-off of tax – 22 22
Total 5 – 187
1 This amount is included in 'Movements in deferred taxes' as part of 'Income tax on the result'. See note 10 'Income tax on the result from continued
operations'.
Movements in deferred taxes during 2015 were as follows:
Netbalance
at 1 January2015
Recognisedin profit or
loss2
Recognised inother
comprehensiveincome Other
Net balanceat
31 December2015
Deferred taxassets
Deferredtax
liabilities
Property, plant and equipment – 391 9 – 2 – 380 – – 380
Intangible fixed assets – 17 2 – – – 15 – – 15
Cash flow hedges – 21 – – 10 – – 31 – – 31
Loss carry forwards 19 5 – – 24 5 19
Losses at non-resident participatinginterests – 21 1 – – – 20 - – 20
Provisions 7 – 1 – – 6 6 -
Deferred tax liabilities (assets) beforeset-off – 424 16 – 10 2 – 416 11 – 427
Set-off of tax – 6 6
Total 5 – 421
2 This amount is included in 'Movements in deferred taxes' as part of 'Income tax on the result'. See Note 10 'Income tax on the result from continued
operations'.
The table below shows the expiry periods for temporary differences available for relief at 31 december 2016:
Expiry periods for differences available for relief
Property, plant and equipment 1 - 50 yrs
Intangible fixed assets 1 - 25 yrs
Cash flow hedges 1 - 30 yrs
Losses available for relief 1 - 10 yrs
Provisions 1 - 10 yrs
N.V. Eneco Beheer Annual Report 2016 49

No deferred tax asset has been recognised on pre-consolidation and other losses of € 95 million (31 December 2015: € 105 million;
1 January 2015: € 95 million) since it is not certain whether sufficient taxable profits will be available in the future at the associates
and permanent establishment, which are not members of the fiscal unity. The tax regulations state that this relief is only available
against profits made in the years 2017 to 2021 (there is unlimited carry forward in Belgium). There is a loss of € 32 million
(31 December 2015: € 32 million; 1 January 2015: € 32 million) against these tax losses on which no deferred tax asset has been
recognised.
18. Derivative financial instruments18.1 Financial instruments of the GroupThe table below shows the fair value of derivative financial instruments:
Financial assets At 31 December 2016 At 31 December 2015 At 1 January 2015
Currency swap contracts 10 2 1
Energy commodity contracts 231 355 374
CO2 emission rights 4 8 9
Total 245 365 384
Classification
Current 155 221 248
Non-current 90 144 136
Total 245 365 384
Financial liabiilities At 31 December 2016 At 31 December 2015 At 1 January 2015
Interest rate swap contracts 10 5 7
Currency swap contracts 3 1 1
Energy commodity contracts 172 226 286
CO2 emission rights – 1 1
Total 185 233 295
Classification
Current 129 164 225
Non-current 56 69 70
Total 185 233 295
18.2 Financial instruments recognised through the income statementThe table below shows the fair value of derivative financial instruments for which movements in fair value have been recognised
through the income statement:
Financial assets At 31 December 2016 At 31 December 2015 At 1 January 2015
Currency swap contracts – 1 –
Energy commodity contracts 178 221 279
CO2 emission rights 4 8 9
Total 182 230 288
Classification
Current 139 165 223
Non-current 43 65 65
Total 182 230 288
50 N.V. Eneco Beheer Annual Report 2016

Financial liabiilities At 31 December 2016 At 31 December 2015 At 1 January 2015
Energy commodity contracts 169 222 272
CO2 emission rights – 1 1
Total 169 223 273
Classification
Current 127 160 211
Non-current 42 63 62
Total 169 223 273
18.3 Financial instruments recognised in equityThe table below shows the fair value of derivative financial instruments for which movements in fair value have been recognised in
equity through the cash flow hedge reserve:
Financial assets At 31 December 2016 At 31 December 2015 At 1 January 2015
Currency swap contracts 10 1 1
Energy commodity contracts 53 134 95
Total 63 135 96
Classification
Current 16 56 25
Non-current 47 79 71
Total 63 135 96
Financial liabiilities At 31 December 2016 At 31 December 2015 At 1 January 2015
Interest rate swap contracts 10 5 7
Currency swap contracts 3 1 1
Energy commodity contracts 3 4 14
Total 16 10 22
Classification
Current 2 4 14
Non-current 14 6 8
Total 16 10 22
These instruments are used in cash flow hedge transactions to hedge interest rate, currency and energy price risks.
18.4 Fair value hierarchyThe following hierarchy was used for the measurement of the financial instruments:
Level 1Level 1 recognises financial instruments whose fair value is measured using unadjusted quoted prices in active markets for identical
instruments.
Level 2Level 2 recognises financial instruments whose fair value is measured using market prices or pricing statements and other available
information. Where possible, the measurement method uses observable market prices. Level 2 energy commodity contracts are
measured using market prices or pricing statements for periods in which an active market exists for the underlying commodities such
as electricity, gas (title transfer facility), oil-related prices and emission rights. Other contracts are measured by agreement with the
counterparty, using observable interest rate and foreign currency forward curves.
N.V. Eneco Beheer Annual Report 2016 51
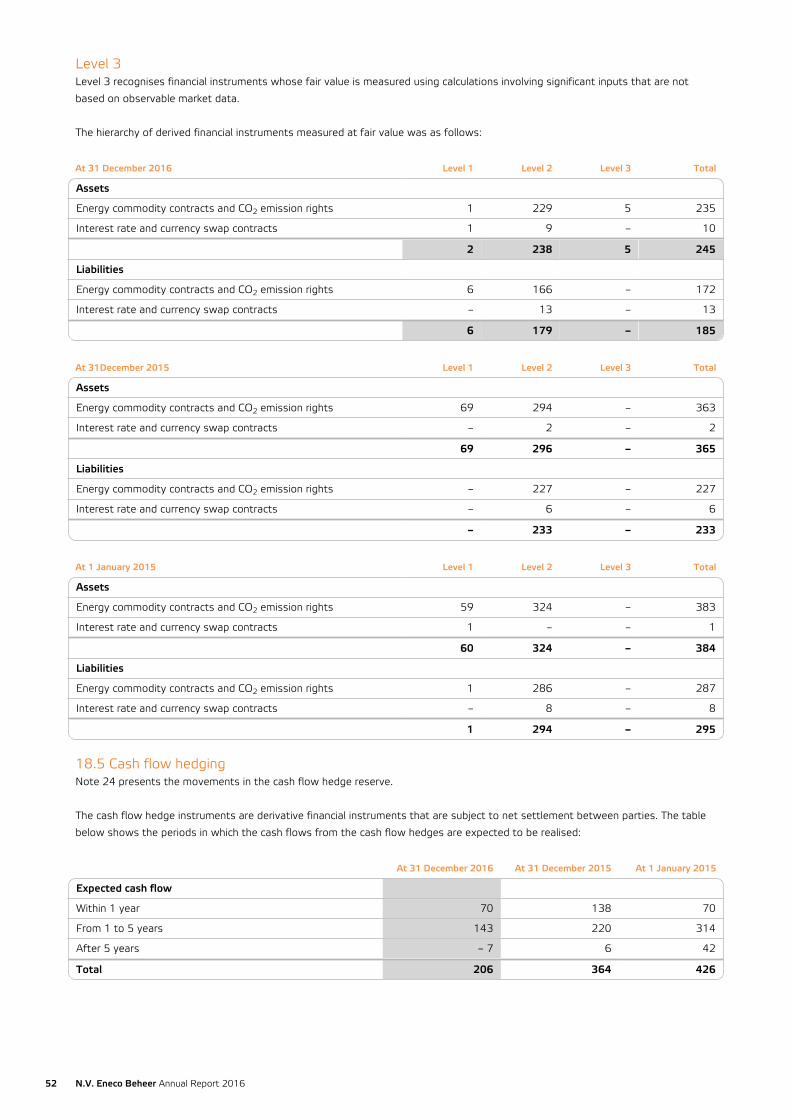
Level 3Level 3 recognises financial instruments whose fair value is measured using calculations involving significant inputs that are not
based on observable market data.
The hierarchy of derived financial instruments measured at fair value was as follows:
At 31 December 2016 Level 1 Level 2 Level 3 Total
Assets
Energy commodity contracts and CO2 emission rights 1 229 5 235
Interest rate and currency swap contracts 1 9 – 10
2 238 5 245
Liabilities
Energy commodity contracts and CO2 emission rights 6 166 – 172
Interest rate and currency swap contracts – 13 – 13
6 179 – 185
At 31December 2015 Level 1 Level 2 Level 3 Total
Assets
Energy commodity contracts and CO2 emission rights 69 294 – 363
Interest rate and currency swap contracts – 2 – 2
69 296 – 365
Liabilities
Energy commodity contracts and CO2 emission rights – 227 – 227
Interest rate and currency swap contracts – 6 – 6
– 233 – 233
At 1 January 2015 Level 1 Level 2 Level 3 Total
Assets
Energy commodity contracts and CO2 emission rights 59 324 – 383
Interest rate and currency swap contracts 1 – – 1
60 324 – 384
Liabilities
Energy commodity contracts and CO2 emission rights 1 286 – 287
Interest rate and currency swap contracts – 8 – 8
1 294 – 295
18.5 Cash flow hedgingNote 24 presents the movements in the cash flow hedge reserve.
The cash flow hedge instruments are derivative financial instruments that are subject to net settlement between parties. The table
below shows the periods in which the cash flows from the cash flow hedges are expected to be realised:
At 31 December 2016 At 31 December 2015 At 1 January 2015
Expected cash flow
Within 1 year 70 138 70
From 1 to 5 years 143 220 314
After 5 years – 7 6 42
Total 206 364 426
52 N.V. Eneco Beheer Annual Report 2016

The total cash flow hedges recognised through the income statement in the future are recognised in the Cash flow hedge reserve
after deduction of taxes. The table below shows the periods in which the cash flows from the cash flow hedges are expected to be
realised:
At 31 December 2016 At 31 December 2015 At 1 January 2015
Expected recognition in result after tax
Within 1 year 11 33 5
From 1 to 5 years 21 56 43
After 5 years – 2 1 7
Total 30 90 55
19. Other financial assetsAt 31 December 2016 At 31 December 2015 At 1 January 2015
Other capital interests – 1 –
Related party receivables 1 7 10
Other receivables 75 31 27
Total 76 39 37
20. Assets/liabilities held for saleIn the second half of 2016, the project portfolio was re-evaluated and it was decided to dispose of certain heating infrastructure and
installations. This process has now started. Measurement is at the lower expected fair value less selling costs. Classification as
assets held for sale led to a downward revaluation of € 12 million that is included in the table in note 13 under annual depreciation
and impairment.
At 31 December 2015, the assets held for sale (and associated liabilities) related to the expected sale of part of Stedin Netbeheer
B.V.’s gas and electricity networks (carrying amount of € 319 million, including € 93 million in the revaluation reserve) and to the
expected sale of half of our 50% interest in the Belgian offshore Norther wind farm.
The Norther assets consist primarily of capitalised development costs for the construction of the wind farm. In June 2016
agreement was reached with a potential investor who will purchase half of our investment. The associated assets and liabilities are
recognised at carrying amount in the balance sheet. The sale was recognised in the financial statements at the end of 2016.
The carrying amount at 1 January 2015 included a property that was sold on 30 December 2015. After renovation, this property has
been leased back by the Network Group for an initial period of 15 years.
Beneficial ownership of the high-voltage networks in Utrecht was transferred to TenneT on 1 January 2015. Legal ownership was
transferred on 17 November 2015 with the financial settlement (€ 43 million). A small book profit was made on this transaction.
21. Trade receivablesThe table below shows the trade receivables:
At 31 December 2016 At 31 December 2015 At 1 January 2015
Energy receivables 515 594 790
Other trade receivables 51 114 83
Less: impairments –66 –90 –101
Total 500 618 772
N.V. Eneco Beheer Annual Report 2016 53

The table below shows the aged analysis of the outstanding receivables
At 31 December 2016 At 31 December 2015 At 1 January 2015
Prior to due date 367 445 609
After due date
- under 3 months 66 102 108
- 3 to 6 months 13 20 26
- 6 to 12 months 20 43 42
- over 12 months 100 98 88
Face value 566 708 873
Less: impairments – 66 – 90 – 101
Total 500 618 772
The table below shows the aged analysis of the impaired receivables:
At 31 December 2016 At 31 December 2015 At 1 January 2015
Prior to due date 2 3 3
After due date
- under 3 months 4 5 10
- 3 to 6 months 2 6 10
- 6 to 12 months 8 17 20
- over 12 months 50 59 58
Total 66 90 101
Movements in the impairment losses on receivables were as follows:
2016 2015
At 1 January 90 101
Additions through profit or loss 8 16
Withdrawals – 20 – 26
Disposal assets Network Group – 11 –
Other movements – 1 – 1
At 31 December 66 90
22. Other receivablesAt 31 December 2016 At 31 December 2015 At 1 January 2015
Prepayments and accrued income 142 121 100
Margin calls 18 25 –
Other receivables 836 92 78
Total 996 238 178
Other receivables include a loan to Eneco Holding N.V. (see note 31 'Related party transactions ').
23. Cash and cash equivalentsCash and cash equivalents comprised bank balances, cash and deposits of € 343 million at 31 December 2016
(31 December 2015: € 211 million; 1 January 2015: € 84 million). Term deposits and blocked accounts which are not freely available
were € 65 million at 31 December 2016 (31 December 2015: € 50 million; 1 January 2015: € 43 million).
54 N.V. Eneco Beheer Annual Report 2016

24. EquityAt 31 December 2016 At 31 December 2015 At 1 January 2015
Share capital 122 122 122
Share premium – 34 34
Revaluation reserve – 779 821
Translation reserve 1 15 8
Cash flow hedge reserve 30 90 55
Retained earnings 2,773 5,170 4,867
Undistributed result for the financial year 192 264 270
Equity attributable to N.V. Eneco Beheer shareholders 3,118 6,474 6,177
Non-controlling interests 3 4 4
Total equity 3,121 6,478 6,181
Share capitalN.V. Eneco Beheer’s authorised share capital is € 341.25 million, divided into 750,000 shares with a nominal value of € 455 each. At
31 December 2016, 267,458 shares had been issued and fully paid. There were no changes in 2016. N.V. Eneco Beheer has only
issued ordinary shares.
Share premiumThe share premium consists of capital paid in on shares in excess of their nominal value. The share premium can be distributed free
of tax. The share premium was distributed to the shareholder in 2016.
Revaluation reserveThe revaluation reserve relates to the revalued carrying amount of networks and network-related assets. The difference between
depreciation based on the revalued carrying amount and depreciation based on the original historical cost, less deferred tax, was
transferred from the revaluation reserve to retained earnings at the date of the transfer of the regulated networks. The revaluation
reserve was not freely at the disposal of the shareholders at the date of the transfer of the regulated networks.
In 2016, the revaluation reserve for the regulated electricity and gas networks was released to the retained earnings as a result of
the disposal of the regulated network activities in the form of a dividend to the shareholder.
Translation reserveAssets and liabilities of foreign group companies denominated in foreign currency and foreign-currency funding of those subsidiaries
relating to long-term loans denominated in foreign currency, after tax, are translated into euros at the reporting date at the
exchange rate prevailing on the reporting date. Foreign currency exchange differences arising on this are recognised in the
translation reserve in equity. The results of foreign group companies are translated into euros at the average rate. The difference
between the profit after income tax at the average rate and based on the exchange rate prevailing on the reporting date is
recognised through equity in the translation reserve. If an investment in a foreign operation is ended or reduced, the related
accumulated translation differences are recognised through the income statement. The translation reserve is not freely at the
disposal of the shareholder.
The Group applies net investment hedge accounting to limit the translation gains and losses on its UK operations in the translation
reserve and the income statement. The foreign currency exchange differences on the sterling loan has an opposite effect to the
foreign currency exchange differences on the UK operations. Both the foreign currency exchange differences on the UK operations
and the sterling loan are recognised through the translation reserve.
Cash flow hedge reserveThe cash flow hedge reserve recognises gains and losses in the fair value of the effective portion of derivative financial instruments
designated as cash flow hedges for which the hedge transaction has not yet been settled. Consequently, the Group meets the
conditions for cash flow hedge accounting. The cash flow hedge instruments are mainly energy, forward and swap contracts agreed
with other market parties in order to cover the market price risks of purchasing and selling energy commodities. This reserve also
recognises the effective portion of hedging with interest rate and currency swap contracts. The cash flow hedge reserve is not freely
at the disposal of the shareholders.
N.V. Eneco Beheer Annual Report 2016 55

The movements in the cash flow hedge reserve were as follows:
Energycommodities
Interest rate swapcontracts
Currencyswap contracts Total
At 1 January 2015 60 – 5 – 55
Newly defined cash flow hedges in financial year 26 – – 26
Movements in fair value cash flow hedges 38 – – 38
Deferred income tax liabilities – 12 2 – – 10
Non-effective portion of cash flow hedges – 6 – 1 – – 7
Discontinued cash flow hedges – 12 – – – 12
At 31 December 2015 94 – 4 – 90
Newly defined cash flow hedges in financial year – – 6 – 2 – 8
Movements in fair value cash flow hedges – 45 1 – – 44
Deferred income tax liabilities 17 2 1 20
Non-effective portion of cash flow hedges 6 – – 6
Discontinued cash flow hedges – 34 – – – 34
At 31 December 2016 38 – 7 – 1 30
Non-controlling interestsThese are third-party shares in the equity of subsidiaries of which the Group is not the sole shareholder.
25. Provisions for employee benefitsLong-service benefits Other Total
Classification at 1 January 2015
Current 2 1 3
Non-current 32 – 32
At 1 January 2015 34 1 35
Addition 1 7 8
Withdrawals – 1 – 3 – 4
Reclassification – 3 3
At 31 December 2015 34 8 42
Classification at 31 December 2015
Current 2 6 8
Non-current 32 2 34
At 31 December 2015 34 8 42
Additions – 8 8
Withdrawals – 2 – 5 – 7
Disposal activities Netwerkgroep – 20 – 3 – 23
Other – 7 – – 7
At 31 December 2016 5 8 13
Classification at 31 December 2016
Current 1 5 6
Non-current 4 3 7
At 31 December 2016 5 8 13
Long-service benefitsThis provision covers the obligation to pay amounts on achieving a certain number of years of employment and on the retirement of
employees.
56 N.V. Eneco Beheer Annual Report 2016

The following actuarial assumptions were used for the provisions:
31 December 2016 31 December 2015 1 January 2015
Discount rate at reporting date 1.4% 1.8% 1.8%
Future salary increases 1.0% 1.0% - 1.9% 1.0%
Mortality table GBM & GBV 2009-2014 GBM & GBV 2005-2010 GBM & GBV 2005-2010
Expenditures from the provisions for employee benefits are made over the long term. The provisions are remeasured annually using
current employee information and properly reflect the expected cash flows.
Other employee benefitsThe other provisions for employee benefits include the obligations for salary payments in the event of illness and unemployment
benefits since the Group bears this risk under the Unemployment Act. In view of their predominantly short-term nature, these
provisions are measured at nominal value.
26. Other provisionsDecommissioning
provisionOnerous
contracts Restructuring Other Total
Classification at 1 January 2015
Current – 5 20 5 30
Non-current 62 – 10 14 86
At 1 January 2015 62 5 30 19 116
Additions 13 – 6 2 21
Withdrawals – –5 –20 –3 –28
Reclassification –8 – –8 –3 –19
Release – – – –3 –3
At 31 December 2015 67 – 8 12 87
Classification at 31 December 2015
Current – – 5 – 5
Non-current 67 – 3 12 82
At 31 December 2015 67 – 8 12 87
Additions 3 – 11 3 17
Withdrawals – – –7 –2 –9
Disposal activities Netwerkgroep –1 – –4 –2 –7
Additions through acquisitions 4 – – – 4
Release –3 – – –2 –5
Other –5 – – –3 –8
At 31 December 2016 65 – 8 6 79
Classification at 31 December 2016
Current – – 7 – 7
Non-current 65 – 1 6 72
At 31 December 2016 65 – 8 6 79
Interest in a range of 0.6% to 2.3% has been added to the provisions in 2016 (2015:2.5% - 4.8%). In view of its normally short-term
nature, no interest is added to the restructuring provision.
DecommissioningThe decommissioning provision is of a long-term nature. The cash flows will generally occur after ten years and within twenty years.
The amounts are the best estimate and are reviewed annually for expected future movements in the cost of removing assets.
N.V. Eneco Beheer Annual Report 2016 57
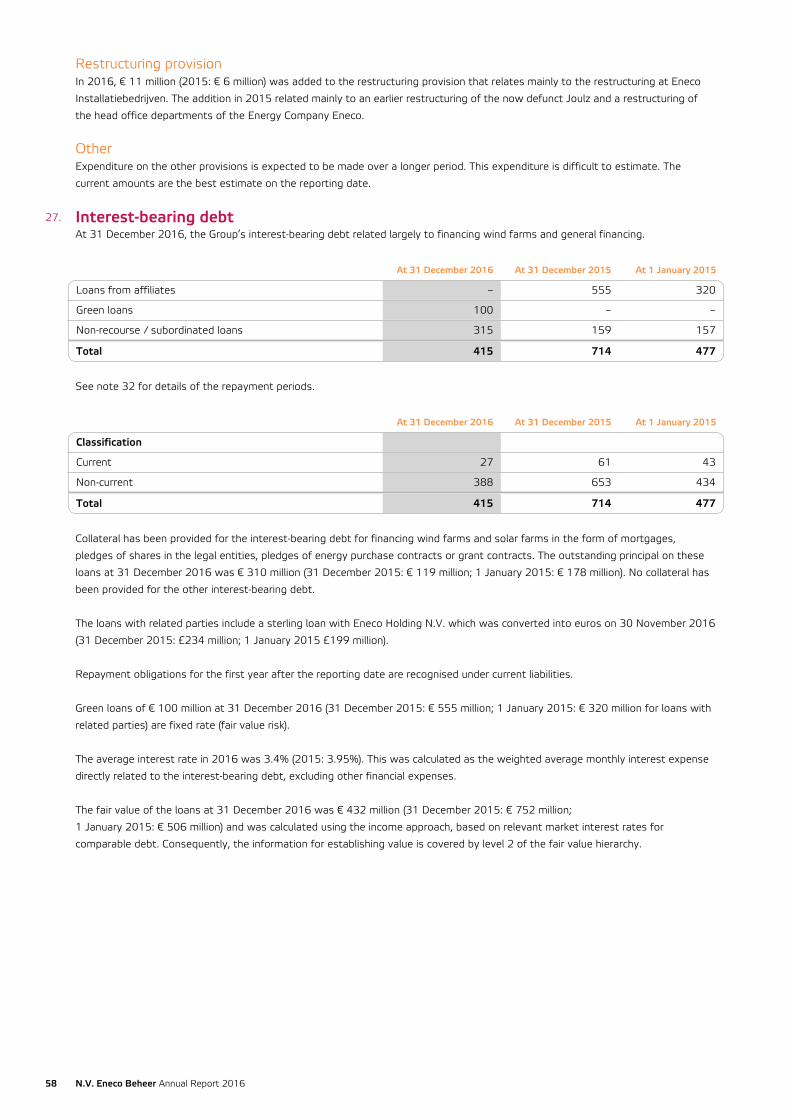
Restructuring provisionIn 2016, € 11 million (2015: € 6 million) was added to the restructuring provision that relates mainly to the restructuring at Eneco
Installatiebedrijven. The addition in 2015 related mainly to an earlier restructuring of the now defunct Joulz and a restructuring of
the head office departments of the Energy Company Eneco.
OtherExpenditure on the other provisions is expected to be made over a longer period. This expenditure is difficult to estimate. The
current amounts are the best estimate on the reporting date.
27. Interest-bearing debtAt 31 December 2016, the Group’s interest-bearing debt related largely to financing wind farms and general financing.
At 31 December 2016 At 31 December 2015 At 1 January 2015
Loans from affiliates – 555 320
Green loans 100 – –
Non-recourse / subordinated loans 315 159 157
Total 415 714 477
See note 32 for details of the repayment periods.
At 31 December 2016 At 31 December 2015 At 1 January 2015
Classification
Current 27 61 43
Non-current 388 653 434
Total 415 714 477
Collateral has been provided for the interest-bearing debt for financing wind farms and solar farms in the form of mortgages,
pledges of shares in the legal entities, pledges of energy purchase contracts or grant contracts. The outstanding principal on these
loans at 31 December 2016 was € 310 million (31 December 2015: € 119 million; 1 January 2015: € 178 million). No collateral has
been provided for the other interest-bearing debt.
The loans with related parties include a sterling loan with Eneco Holding N.V. which was converted into euros on 30 November 2016
(31 December 2015: £234 million; 1 January 2015 £199 million).
Repayment obligations for the first year after the reporting date are recognised under current liabilities.
Green loans of € 100 million at 31 December 2016 (31 December 2015: € 555 million; 1 January 2015: € 320 million for loans with
related parties) are fixed rate (fair value risk).
The average interest rate in 2016 was 3.4% (2015: 3.95%). This was calculated as the weighted average monthly interest expense
directly related to the interest-bearing debt, excluding other financial expenses.
The fair value of the loans at 31 December 2016 was € 432 million (31 December 2015: € 752 million;
1 January 2015: € 506 million) and was calculated using the income approach, based on relevant market interest rates for
comparable debt. Consequently, the information for establishing value is covered by level 2 of the fair value hierarchy.
58 N.V. Eneco Beheer Annual Report 2016

28. Trade and other payablesAt 31 December 2016 At 31 December 2015 At 1 January 2015
Trade creditors 623 712 899
Accruals and deferred income 162 348 454
Pension contributions 2 4 5
Other liabilities 277 677 636
Total 1,064 1,741 1,994
Classification
Current 954 1,303 1,575
Non-current 110 438 419
Total 1,064 1,741 1,994
In view of their nature, the carrying amount of trade and other payables is their fair value.
29. Operating leasesCosts and liabilities of operating leasesThe Group has operating lease agreements for IT facilities and the vehicle fleet. There are also rental agreements for land and a
number of business premises. A cost of € 37 million (2015: € 54 million) has been recognised through the income statement of
which € 25 million related to continued operations (2015: € 33 million) and € 12 million to discontinued operations
(2015: € 21 million).
The minimum receivables from non-terminable lease agreements fall due as follows:
At 31 December 2016 At 31 December 2015 At 1 January 2015
Within 1 year 28 54 54
From 1 to 5 years 80 176 159
After 5 years 148 208 167
Total 256 438 380
Revenues from operating leasesEquipment and energy installations are leased for periods of 5 to 15 years while the assets concerned remain the property of the
Group. The lease covers making the equipment available to users and maintenance. Revenues of € 28 million
(2015: € 30 million) have been recognised through the income statement of which € 25 million related to continued operations
(2015: € 27 million) and € 3 million to discontinued operations (2015: € 3 million).
The minimum receivables from non-terminable lease agreements fall due as follows:
At 31 December 2016 At 31 December 2015 At 1 January 2015
Within 1 year 21 27 31
From 1 to 5 years 64 91 90
After 5 years 40 68 60
Total 125 186 181
30. Contingent assets and liabilitiesContingent assets and liabilities other than guarantees are measured at present value, calculated using a discount rate that reflects
current market assessments of the time value of money.
Energy purchase and sale commitmentsThe Group has energy purchase commitments of € 5.8 billion (31 December 2015: € 5.9 billion; 1 January 2015: € 7.4 billion) under
contracts relating to 2017 and later years. The purchase commitments comprise energy contracts for the company’s own use with
various energy generators. There are sales commitments relating largely to the business market of € 3.0 billion
(31 December 2015: € 2.6 billion; 1 January 2015: € 3.0 billion) for 2017 and later years.
N.V. Eneco Beheer Annual Report 2016 59

The Group has commitments of € 0.7 billion (31 December 2015: € 0.8 billion; 1 January 2015: € 0.7 billion) for the purchase of heat
until 2043. The perpetual commitments for the sale of heat are € 0.3 billion per year (31 December 2015: € 0.3 billion;
1 January 2015: € 0.3 billion).
Investment obligationsAt 31 December 2016, the Group had entered into investment obligations with a total amount of € 0.2 billion
(31 December 2015: nil; 1 January 2015: € 0.2 million).
Other contingent obligationsAt 31 December 2016 there were other contractual obligations of € 0.5 billion (31 December 2015: € 0.5 billion;
1 January 2015: € 0.8 billion), mainly under maintenance contracts.
GuaranteesThe Group has issued group and bank guarantees of € 0.2 billion (31 December 2015: € 0.1 billion; 1 January 2015: nil) to third
parties. At 31 December 2016, N.V. Eneco Beheer had issued guarantees of € 0.1 billion
(31 December 2015 and 1 January 2015: nil). The remaining group guarantees have been issued by subsidiaries for which N.V.
Eneco Beheer has issued a declaration of joint and several liability pursuant to Section 403(1)(f), Part 9, Book 2 of the Dutch Civil
Code.
Fiscal unityThe Group forms a fiscal unity for corporate income tax and VAT purposes headed by Eneco Holding N.V. All companies in this fiscal
unity, including N.V. Eneco Beheer, are jointly and severally liable for the tax obligations of the fiscal unity.
Corporate income tax
Pending the unbundling of Eneco Group on 31 January 2017, the fiscal unity for corporate income tax purposes was dissolved on 31
December 2016 with respect to Eneco Holding N.V. Since 1 January 2017, the Group’s companies that were part of the dissolved
fiscal unity have formed a new, separate fiscal unity for corporate income tax purposes.
VAT
The fiscal unity for VAT purposes has also been changed. With effect from 1 January 2017, Eneco Holding N.V. is no longer head of
the Group fiscal unity. N.V. Eneco Beheer is head of the fiscal unity for VAT purposes. Past liability under a joint fiscal unity continues
even after a change in that fiscal unity.
Cash poolAs a result of its participation in the Group cash pool N.V. Eneco Beheer is jointly and severally liable for deficits in the pool as a
whole.
Juridische proceduresThe Group is involved either as plaintiff or defendant in various legal and regulatory claims and proceedings related to its operations.
Management ensures proper representation in these matters. The amounts claimed in some of these proceedings may be significant
to the consolidated financial statements. Liabilities and contingencies in connection with these claims and proceedings are assessed
periodically based on the latest information available, usually with the assistance of lawyers and other specialists. A liability is only
recognised if an adverse outcome is probable and the amount of the loss can be reasonably estimated. The actual outcome of
proceedings or a claim may differ from the estimated liability and, consequently, could have a material adverse effect on the financial
performance and position of the Group.
Unbundling Protocol between the Network Group and the Energy CompanyFor a period of 6 years from 31 January 2017, N.V. Eneco Beheer will indemnify Eneco Holding N.V. (renamed Stedin Holding N.V.
from the unbundling date of 31 January 2017) and its associated companies for:
• all liability, claims and costs suffered or to be suffered by Stedin Holding N.V. and its associated companies, if and to the extent
that such liability, claims and costs relate to the activities of or companies in the group of N.V. Eneco Beheer and its associated
companies, irrespective of whether the legal relationship for such claim arises from a relationship that relates to a period before
or after the unbundling; and
• the right of recourse of third parties against Stedin Holding N.V. or an associated company relating to liabilities as referred to in
the preceding paragraph, excluding any liability, claims, costs or right of recourse in respect of tax matters.
60 N.V. Eneco Beheer Annual Report 2016

Furthermore, for a period of 6 years from 31 January 2017, Stedin Holding N.V. will indemnify N.V. Eneco Beheer and its associated
companies for:
• all liability, claims and costs suffered or to be suffered by N.V. Eneco Beheer and its associated companies, if and to the extent
that such liability, claims and costs relate to the activities of or companies in the group of Stedin Holding N.V. and its associated
companies, irrespective of whether the legal relationship for such claim arises from a relationship that relates to a period before
or after the unbundling; and
• the right of recourse of third parties against N.V. Eneco Beheer or an associated company relating to liabilities as referred to in
the preceding paragraph, excluding any liability, claims, costs or right of recourse in respect of tax matters.
31. Related party transactionsThe Group’s related companies (the shareholder and its subsidiaries which are not part of the N.V. Eneco Beheer group), associates,
joint ventures and Management Board are considered as related parties.
Sales to and purchases from related parties are on terms of business normally prevailing with third parties. Receivables and liabilities
are not covered by collateral and are paid by bank transactions.
The table below shows the trading transactions with the principal related parties:
Sales Purchases
2016 2015 2016 2015
Affiliates 83 – 56 –
Associates 66 125 7 17
Joint ventures – – 1 4
Assets
At 31 December 2016 At 31 December 2015 At 1 January 2015
Affiliates 838 – 25
Associates 8 14 15
Joint ventures – 2 1
Liabilities
At 31 December 2016 At 31 December 2015 At 1 January 2015
Affiliates 56 513 306
Associates 1 3 3
Joint ventures – 1 6
Note 6 provides details of the remuneration of members of the Management Board.
If directors are energy customers of the Group, there is no other relationship than that of customer and supplier on normal arm’s
length terms and conditions. The Group applies the exemption from disclosures on related party transactions with government-
related entities. The Municipality of Rotterdam has indirect significant influence. There is no relationship other than the shareholder
relationship, except that of customer and supplier on normal arm’s length terms and conditions.
32. Financial risk managementNormal business activities involve exposure to credit, commodity market, interest rate and liquidity risk. The Group’s policy is
designed to minimise the adverse consequences of unforeseen circumstances on its financial results. The aims formulated to this
end are derived from the company’s strategic objectives. Procedures and guidelines have been drawn up in accordance with these
objectives and are evaluated at least once a year and, if required, adjusted.
The Board of Management is responsible for risk management. In this context, it sets out procedures and guidelines and ensures
they are complied with. Authority to commit the Group is specified in the Corporate Authority Manual. Mandates have also been
drawn up for all business units, including the Group’s purchasing and trading department and sales channels, to manage the above
risks such as commodity (electricity, gas, heating, emission rights and fuels) risks the Group.
N.V. Eneco Beheer Annual Report 2016 61

The Board of Management and senior business unit management regularly review the results, key figures such as changes in
working capital and the trading position, the principal risks (or concentration of certain risks) and the measures to manage them.
Stress tests are developed for the principal identified risks and incorporated in the long-term financial plan. This clarifies the impact
of risk on operations. Senior business unit management reports to the Board of Management by means of an In Control Statement
every year.
The internal Audit & Risk Committee, Commodity Risk Committee and Investment Risk Committee are in charge of the formulation
and application of the company’s risk policy and advise the Board of Management accordingly.
32.1 Credit riskCredit risk is the risk of a loss if a counterparty or its guarantor cannot or will not meet its obligations. For the purposes of managing
this risk, a distinction is drawn between debtor risk and counterparty risk.
Debtor risk
Debtor risk is the risk that a debtor fails to pay a receivable. Most receivables are of limited size and there are a great number of
debtors. There is, therefore, no concentration of risk.
Policy is designed not to provide customers with any credit going beyond normal supplier credit as set out in the applicable
conditions of supply. Policy is also formulated at a decentralised level within the organisation. The effectiveness of that policy is
monitored at the corporate level and adjustments are made as required.
Measures in place to limit debtor risk are:
• an active debt collection policy;
• credit limits, bank guarantees and/or margining (cash collateral) for business customers;
• recourse to debt collection agencies and different collection methods for current and former customers.
The amount of a receivable is adjusted pursuant to a set procedure. The adjustment depends on the time that the receivable has
remained outstanding and the probability that it will not be paid in full. There are also individual reviews for business customers.
Counterparty risk
Counterparty risk is the risk that a trading partner cannot or will not meet its delivery or payment obligations. This risk is primarily
encountered in trading in energy commodities, emission rights and interest rate and foreign currency hedge transactions. The basis
for the management of this risk is set out in the Counterparty Mandate (part of the Eneco Energy Trade commodity mandate) and
the Treasury Charter drawn up by the Board of Management.
The size of the counterparty risk is primarily determined by the replacement value of the future deliveries and the commodity
delivered which has not yet been paid for. The replacement value is calculated each day for each counterparty based on current
market prices for future deliveries. The risk position is measured against the risk tolerance. That tolerance is drawn up for each
contract party on the basis of an assessment of the creditworthiness of that counterparty derived from a public or internal rating
and/or alternative assessment methods.
Het tegenpartijrisico wordt beperkt door:
• setting financial limits based on the financial strength of the counterparty;
• setting trading volume restrictions for each counterparty (position management),
• use of standard agreements, in particular based on EFET and ISDA terms;
• use of third-party margining and clearing;
• use of bilateral margining agreements with counterparties;
• executing risk-reducing transactions with counterparties leading to partly-offsetting positions;
• requiring additional guarantees from counterparties, e.g. bank guarantees;
• credit insurance taken if necessary to cover exposures exceeding the limits.
62 N.V. Eneco Beheer Annual Report 2016

Third-party margining and clearing is in place for futures. This transfers the counterparty risk of a futures contract to a clearing bank.
This bank is linked to a clearing house that facilitates settlement of futures transactions through exchanges such as ICE ENDEX
(InterContinental Exchange European Energy Derivatives Exchange N.V.), EEX (European Energy Exchange A.G.) and the ECX
(European Climate Exchange). Every day, the clearing house settles interim changes in market value with its clearing banks which in
turn settle with the market parties concerned (margin calls). This neutralises counterparty risk for each party to the contract. Bilateral
margining implies similar daily settlement directly with the counterparty to the transaction. The contract with the counterparty sets
an initial minimum value (threshold). Bilateral margining is only applied if the threshold is exceeded.
The margining system creates liquidity risk and so risk policy is designed to monitor and match counterparty risk by forward trading
and liquidity risk by margining. There is a system for monitoring internal limits using regular reports, to manage both risks.
The maximum credit risk is equal to the carrying amount of the financial assets, including derivative financial instruments.
Where the Group meets the IFRS criteria for netting, financial assets and financial liabilities are netted and recognised net in the
balance sheet. Transactions in derivative financial instruments use standardised terms and conditions and contract types such as the
master netting agreements based on ISDA and EFET terms. Most of the Group’s contracts for derivative financial instruments meet
netting criteria since there is a legally enforceable right to set off the recognised amounts and in addition all amounts relating to
netted financial assets and financial liabilities are settled as a single sum.
The table below sets out only the financial assets and financial liabilities netted in the balance sheet in accordance with the criteria in
IAS 32. As the table does not include all the financial assets and liabilities in the balance sheet, it is not possible to reconcile these
figures with the net amounts presented in the balance sheet.
At 31 December 2016Gross amounts of recognised
financial assets
Gross amounts of recognisedfinancial liabilities offset inthe statement of financial
position
Net amounts of financialassets presented in the
statement of financialposition
Assets
Derivative financial instruments 1,322 1,077 245
Other financial instruments 1,514 518 996
2,836 1,595 1,241
Gross amounts of recognisedfinancial liabilities
Gross amounts of recognisedfinancial assets offset in the
statement of financialposition
Net amounts of financialliabilities presented in the
statement of financialposition
Liabilities
Derivative financial instruments 1,262 1,077 185
Other financial instruments 1,582 518 1,064
3,259 1,595 1,664
N.V. Eneco Beheer Annual Report 2016 63

At 31 December 2015Gross amounts of recognised
financial assets
Gross amounts of recognisedfinancial liabilities offset inthe statement of financial
position
Net amounts of financialassets presented in the
statement of financialposition
Assets
Derivative financial instruments 1,483 1,118 365
Current assets to affiliates 1,591 1,591 –
Other financial instruments 2,268 2,030 238
5,342 4,739 603
Gross amounts of recognisedfinancial liabilities
Gross amounts of recognisedfinancial assets offset in the
statement of financialposition
Net amounts of financialliabilities presented in the
statement of financialposition
Liabilities
Derivative financial instruments 1,351 1,118 233
Current liabilities to affiliates 2,305 1,591 714
Other financial instruments 2,180 439 1,741
5,836 3,148 2,688
At 1 January 2015Gross amounts of recognised
financial assets
Gross amounts of recognisedfinancial liabilities offset inthe statement of financial
position
Net amounts of financialassets presented in the
statement of financialposition
Assets
Derivative financial instruments 1,074 690 384
Other financial instruments 1,734 1,734 –
Current assets to affiliates 794 616 178
3,602 3,040 562
Gross amounts of recognisedfinancial liabilities
Gross amounts of recognisedfinancial assets offset in the
statement of financialposition
Net amounts of financialliabilities presented in the
statement of financialposition
Liabilities
Derivative financial instruments 985 690 295
Current liabilities to affiliates 2,211 1,734 477
Other financial instruments 2,610 616 1,994
5,806 3,040 2,766
Financing instruments
Management of financing instruments is set out the Treasury Charter drawn up by the Board of Management. Counterparty risk on
borrowing money is very limited. The risk tolerance formulated in the Treasury Charter is taken into account when lending money.
The risk position of a counterparty is measured against the risk tolerance. Risk tolerance is set for each contracting party using an
assessment of the counterparty’s creditworthiness according to a public credit rating. Counterparty risk is further reduced by
dispersion across a number of parties, predetermined limits for each counterparty and maximum lending terms.
The counterparty risk for financial instruments (swap contracts) is limited by:
• the use of framework agreements on ISDA terms;
• procedures for regular assessment of counterparty risk;
• margining as a result of the agreed credit support agreements.
The margining system based on credit support agreements creates liquidity risk. The risk policy is designed to monitor this through
regular reporting.
64 N.V. Eneco Beheer Annual Report 2016

32.2 Market riskMarket risk is the exposure to changes in value in current or future cash flows and financial instruments arising from changes in
market prices, market interest rates and exchange rates.
Price risk
Exposure to market price risk on the commodity portfolios for purchasing and supply to customers is initially limited by back-to-back
transactions for purchase and sales obligations, for which derivative financial instruments are also used. Structured hedging
strategies are used where back-to-back hedging is not possible, or only with excessively high transaction charges. In these cases,
positions are hedged temporarily in other countries, commodities and/or periods which have an historically strong correlation with
the price risks to be hedged. These instruments are deployed within a conservative mandate and limit structure that includes on-
going registration, monitoring and analysis of trading positions and market value.
The market price risk on the company’s own generation and long-term structured commodity purchase contracts is also limited
through back-to-back transactions and structured hedging strategies as described above. It should be noted that there is no liquid
energy trading market for exposures that lie further in the future and they are difficult or impossible to hedge.
Price risks inherent to energy commodity trading portfolios and emission rights are managed using position limits, MtM limits, Value
at Risk (VaR) measures and stop-loss limits. The limits that can best be applied to manage risks are determined for each business
activity. VaR represents the potential loss on a portfolio in the event of a poor scenario over a 10-day period, at a 95% confidence
level. VaR calculations are based on price history and include data such as correlations between products, markets and time periods.
Retrospective testing is conducted to check the calculated VaR values and the model used is checked. The risk managers and energy
traders are notified each day of the VaR, the MtM and positions in relation to the limit. Limit infringements are reported immediately,
in accordance with the Eneco Energy Trade commodity mandate. The VaR in the trading portfolio at 31 December 2016 was
€ 2.0 million (31 December 2015: € 2.1 million; 1 January 2015: € 2.3 million). The average VaR in 2016 was € 1.7 million
(2015: € 1.7 million).
Foreign currency risk
Foreign currency risk is the exposure to changes in value of financial instruments arising from changes in exchange rates. The
Treasury department is responsible for managing the Group’s other foreign currency risk. Companies included in the consolidation are
not permitted to maintain open positions in foreign currencies in excess of € 250,000 without the Treasury department’s approval.
Based upon the aggregate foreign currency position and the associated limit set for open positions, the Treasury department
determines whether hedging is desirable and the strategy to be followed. Foreign currency risk attaching to commodity-related
financial instruments is managed in accordance with the price risk.
The sensitivity of the Translation reserve in equity to a 1% movement in the sterling/euro exchange rate in 2016 was € 2.6 million
(2015: nil).
Interest rate risk
Interest rate risk is the exposure to changes in value in financial instruments arising from changes in market interest rates. The
Treasury department manages interest rate risk. The interest rate risk policy is aimed at managing the net financing liabilities
through fluctuations in market interest rates. A specified range for the proportions of loans at fixed and variable interest rates
serves as the base tool. The Group may use derivative financial instruments such as interest rate swap contracts to achieve the
desired risk profile. If all other variables remain constant, it is estimated that a general increase of 1 percentage point in Euribor (for
a period of twelve months) would lead to a decrease in profit before tax of € 0.1 million (2015: € 0.1 million).
32.3 Liquidity riskThe Group is a capital-intensive business. Its financing policy after the forthcoming unbundling of Eneco Holding N.V. is aimed at
growing into an optimum financing structure taking into account its current asset base and investment programme while maintaining
and further developing them. The criteria are access to the capital market and flexibility at acceptable financing costs.
Most financing for wind farms is drawn locally, as necessary.
A specific liquidity risk arises from margining through clearing houses and contracts with bilateral margin obligations. Risk limits have
been set in the Counterparty Mandate to cover both the outstanding balance and price change sensitivity for the purposes of
managing this. This risk is the subject of weekly reports to senior management and six-monthly reports to the Commodity Risk
Committee. The sensitivity of the margin call to a 1% price change was € 0.7 million in 2016 (2015: € 1.5 million). At
31 December 2016, the Group had deposited a total of € 14 million (2015: € 20 million).
N.V. Eneco Beheer Annual Report 2016 65

Great importance is attached to managing all the above risks to avoid the Group finding itself in a position in which it could not meet
its financial obligations. In addition, liquidity needs are planned on the basis of long, medium and short-term cash flow forecasts. The
cash flow forecasts incorporate operating and investing cash flows, dividends, interest payable and debt redemption. The Treasury
department sets this capital requirement against available funds. A report is submitted to the Board of Management every month.
Uncommitted credit and guarantee facilities
Uncommitted credit and guarantee facilities totalling € 439 million have been agreed with a number of banks and € 90 million of this
had been drawn at 31 December 2016.
Committed credit and bridging facilities
From the unbundling date, 31 January 2017, the Group will have a € 500 million revolving credit facility available. This facility is
currently available to Eneco Holding N.V.
On 26 September 2016, Eneco Holding N.V. and N.V. Eneco Beheer entered into a committed guarantee and letter of credit facility
agreement of € 200 million on behalf of the Energy Company. Eneco Holding N.V. will withdraw from this agreement on
31 January 2017. This agreement ends on 30 June 2017. This facility had not been drawn on at year-end 2016.
Cash outflows on financial instrumentsThe table below shows forecast nominal cash outflows and any interest arising from financial instruments over the coming years.
The cash flows from derivatives are based on the prices and volumes in the contracts.
At 31 December 2016 Within 1 year From 1 to 5 years After 5 years Total
Derivative financial instruments 3 13 7 23
Interest-bearing debt 40 238 179 457
Trade and other payables 954 15 95 1,064
Total 997 266 281 1,544
At 31 December 2015 Within 1 year From 1 to 5 years After 5 years Total
Derivative financial instruments 152 33 – 185
Interest-bearing debt 68 591 43 702
Trade and other payables 1,303 91 347 1,741
Total 1,523 715 390 2,628
At 1 January 2015 Within 1 year From 1 to 5 years After 5 years Total
Derivative financial instruments 486 235 – 721
Interest-bearing debt 45 393 48 486
Trade and other payables 1,575 130 289 1,994
Total 2,106 758 337 3,201
33. Capital managementThe primary aim of the Group’s capital management is to maintain good creditworthiness and healthy solvency to support
operations and minimise the cost of debt. The Group regards both capital and net debt as relevant elements of its financing and so
of its capital management. The Group can influence its capital structure by altering the proportions of equity and debt. Net interest-
bearing debt (excluding discontinued operations) is defined as long-term and current interest-bearing debt less cash and cash
equivalents.
The Group monitors its capital using the ‘Financial Management Framework’. This includes the equity/total assets ratio which is
regularly monitored by the Board of Management. At year-end 2016 it was 61.5% (31 December 2015: 66.4%;
1 January 2015: 64.6%).
66 N.V. Eneco Beheer Annual Report 2016

34. Events after the reporting date• On 17 January 2017, N.V. Eneco Beheer signed a contract with the shareholders of LichtBlick Holding AG, with its registered
office in Hamburg, Germany, to purchase a 50% holding in that company. LichtBlick is the largest independent energy and IT
company in Germany. It is a leading green energy company with 500 employees, providing renewable energy to over
645,000 customers. There is a strategic and cultural fit between the two companies, expressed firstly in their missions. Secondly,
Eneco and LichtBlick are sure of the trends that are changing global energy markets. The new partnership reinforces Eneco’s
strength in the European energy market with opportunities for investment, combined experience in the main energy markets and
a large customer base.
This acquisition is expected to take place in the first quarter of 2017 provided the German competition authorities give their
approval.The total amount involved in this purchase is some € 0.2 billion. Under the terms of the purchase contract, Eneco is
expected to obtain control as meant by IFRS 10 ‘Consolidated Financial Statements’.
• In January 2017, the Group distributed a dividend of € 351 million to its shareholder. This dividend has been deducted from the
outstanding amount receivable from the shareholder.
• On 19 January 2017, N.V. Eneco Beheer entered into a committed bridging facility with a bank for € 0.3 billion at a variable
Euribor interest rate. This will relate entirely to the Energy Company after the unbundling date. This contract runs from
1 February 2017 to 1 November 2017.
• On 27 January 2017, Eneco Holding N.V. and N.V. Eneco Beheer (as lender) entered into a financing agreement for loans on arm’s
length terms for a total of € 0.2 billion that Eneco Holding N.V. will repay to N.V. Eneco Beheer in two tranches (in 2018 and
2020).
• On 30 January 2017, the shareholders will very probably resolve during an Extraordinary General Meeting to distribute
N.V. Eneco Beheer and its subsidiaries to the shareholders as a ‘dividend in kind’ on 31 January 2017. This will actually be done
by distributing the shares that Eneco Holding N.V. owns in Eneco Groep N.V. Ahead of the unbundling on 31 January 2017,
N.V. Eneco Beheer will be contributed to Eneco Groep N.V.
• From 31 January 2017, all declarations of joint and several liability pursuant to Section 403(1)(f), Part 9, Book 2 of the
Dutch Civil Code that had been issued by Eneco Holding N.V. to entities within the Energy Company at the 2016 reporting date
will be withdrawn. This will be done in compliance with the provisions in Section 404, Part 9, Book 2 of the Dutch Civil Code.
After the companies concerned (part of the Energy Company) have been placed outside the Eneco Holding N.V. group, Eneco
Holding N.V. (then renamed Stedin Holding N.V.) intends to end its remaining liability pursuant to Section 2:404(3) Part 9, Book 2
of the Dutch Civil Code.
• On 31 January 2017, € 0.1 billion of group guarantees and the remaining bank guarantees of Eneco Holding N.V. will be
transferred to N.V. Eneco Beheer.
35. First adoption of International Financial Reporting Standards (IFRS)From 2016 N.V. Eneco Beheer is preparing its financial statements in accordance with IFRS as adopted by the European Union. To
this end, these financial statements meet all the mandatory disclosures required by IFRS-EU. Until 2015, the Group only prepared
abridged company financial statements pursuant to the exemption in Section 403, Part 9, Book 2 of the Dutch Civil Code, which
were not published externally. The Group’s IFRS accounting standards have been derived from those of Eneco Holding N.V. These
are the Group’s first consolidated financial statements and, consequently, there are no comparative figures for earlier years.
N.V. Eneco Beheer Annual Report 2016 67
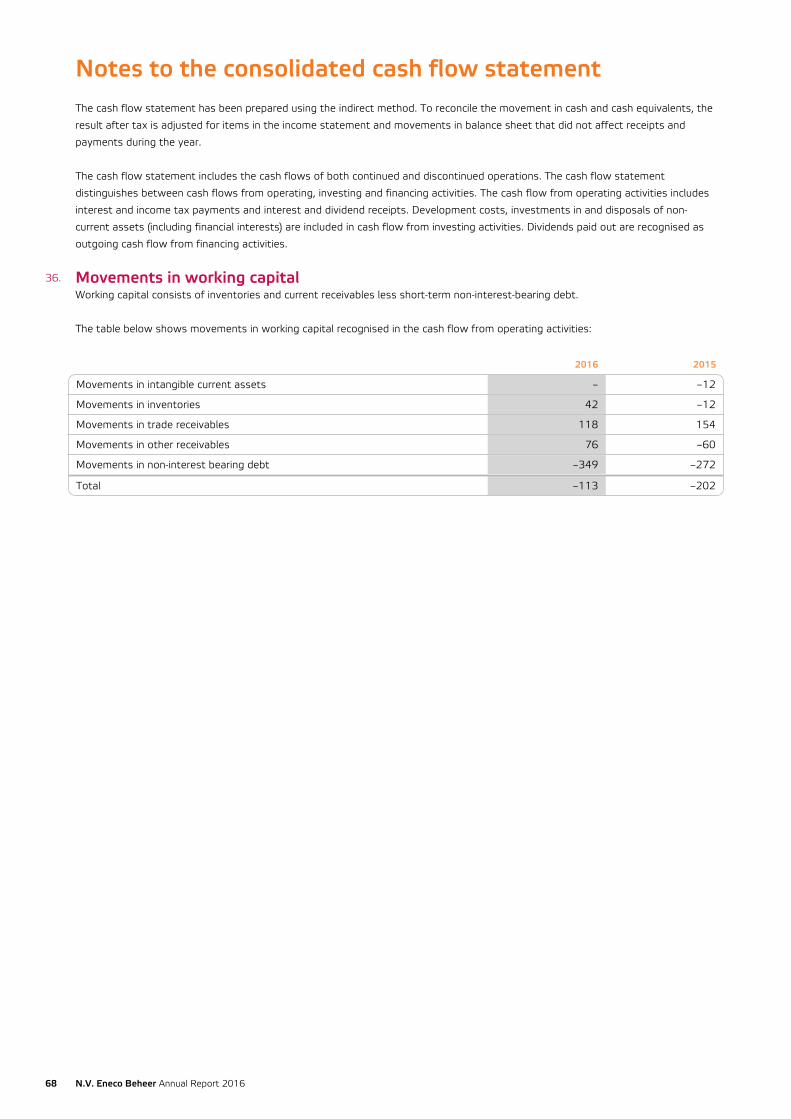
Notes to the consolidated cash flow statementThe cash flow statement has been prepared using the indirect method. To reconcile the movement in cash and cash equivalents, the
result after tax is adjusted for items in the income statement and movements in balance sheet that did not affect receipts and
payments during the year.
The cash flow statement includes the cash flows of both continued and discontinued operations. The cash flow statement
distinguishes between cash flows from operating, investing and financing activities. The cash flow from operating activities includes
interest and income tax payments and interest and dividend receipts. Development costs, investments in and disposals of non-
current assets (including financial interests) are included in cash flow from investing activities. Dividends paid out are recognised as
outgoing cash flow from financing activities.
36. Movements in working capitalWorking capital consists of inventories and current receivables less short-term non-interest-bearing debt.
The table below shows movements in working capital recognised in the cash flow from operating activities:
2016 2015
Movements in intangible current assets – –12
Movements in inventories 42 –12
Movements in trade receivables 118 154
Movements in other receivables 76 –60
Movements in non-interest bearing debt –349 –272
Total –113 –202
68 N.V. Eneco Beheer Annual Report 2016

List of principal subsidiaries, joint operations, jointventures and associatesThis is a list of the principal subsidiaries, joint operations, joint ventures and associates. See 1.1 'General information' for further
details of the Group’s activities and composition.
SubsidiariesName Seat Share
AgroPower B.V. * Delft 100%
BioEnergieCentrale Delfzijl B.V. Rotterdam 100%
CEN B.V. * Hilversum 100%
Eneco B.V. * Rotterdam 100%
Eneco België B.V. * Rotterdam 100%
Eneco Consumenten B.V. * Rotterdam 100%
Eneco Consumenten Nederland B.V. * Rotterdam 100%
Eneco Energy Trade B.V. * Rotterdam 100%
ENECO France SAS Avignon (F) 100%
Eneco Gasspeicher B.V. * Rotterdam 100%
Eneco Innovation & Ventures B.V. Rotterdam 100%
Eneco Installatiebedrijven B.V. * Rotterdam 100%
Eneco Installatiebedrijven Groep B.V. * Rotterdam 100%
Eneco Installatiebedrijven TI B.V. * Rotterdam 100%
Eneco Services B.V. * Rotterdam 100%
Eneco Solar Belgium N.V. Gent (B) 100%
Eneco Solar, Bio & Hydro B.V. * Rotterdam 100%
Eneco UK Limited [previously: Eneco Wind UK Limited] London (UK) 100%
Eneco Warmte & Koude B.V. * Rotterdam 100%
Eneco Warmte & Koude Leveringsbedrijf B.V. * Rotterdam 100%
Eneco Warmtenetten B.V. * Rotterdam 100%
Eneco Warmteproductie Utrecht B.V. Rotterdam 100%
Eneco Wind B.V. * Rotterdam 100%
Eneco Wind Belgium S.A. Waver (B) 100%
Eneco Windenergie Delfzijl Noord v.o.f. Rotterdam 100%
Eneco Windmolens Offshore B.V. Rotterdam 100%
Eneco Zakelijk B.V. * Rotterdam 100%
Eneco Zakelijk Nederland B.V. Rotterdam 100%
Jedlix B.V. Rotterdam 100%
Luminext B.V. Amsterdam 100%
Oxxio Nederland B.V. * Hilversum 100%
Quby B.V. Amsterdam 100%
Windpark de Beemden B.V. Rotterdam 100%
Windpark Houten B.V. Rotterdam 100%
* N.V. Eneco Beheer has issued a declaration of joint and several liability for the subsidiaries marked with an *, pursuant to Section 403(1f), Part 9, Book 2 of the Dutch Civil Code.
N.V. Eneco Beheer Annual Report 2016 69

Joint operationsName Seat Share
Enecogen v.o.f. Rotterdam 50%
Q10 Offshore Wind B.V. Rotterdam 50%
Zonnepark Ameland B.V. Ameland 33,3%
Joint venturesName Seat Share
PVNED Holding B.V. Middelburg 50%
AssociatesName Seat Share
Groene Energie Administratie B.V. Rotterdam 30%
Peeeks B.V. Delft 50%
A full list of companies has been filed with the trade registry in Rotterdam pursuant to Section 379 of Part 9, Book 2 of the
Dutch Civil Code.
70 N.V. Eneco Beheer Annual Report 2016

Company financial statements1. Company income statement
x € 1 million 2016 2015
Share of profit of subsidiaries 181 246
Other results after income tax 11 18
Profit after income tax 192 264
N.V. Eneco Beheer Annual Report 2016 71

2. Company balance sheetBefore profit appropriationx € 1 million Note At 31 December 2016 At 31 December 2015
Non-current assets
Property, plant and equipment – 12
Financial assets 2 2,569 6,645
Total non-current assets 2,569 6,657
Current assets
Receivables from group companies 884 1,344
Cash and cash equivalents 128 25
Total current assets 1,012 1,369
TOTAL ASSETS 3,581 8,026
Equity
Share capital 122 122
Share premium – 34
Revaluation reserve – 779
Translation reserve 1 15
Cash flow hedge reserve 30 90
Reserve for undistributed profit of associates 34 36
Reserve for research and development expenses 4 2
Retained earnings 2,735 5,132
Undistributed profit 192 264
Total equity 3 3,118 6,474
Non-current liabilities
Interest-bearing debt 4 100 –
Other liabilities 1 4
Total non-current liabilities 101 4
Non-current liabilities
Interest-bearing debt 4 213 –
Liabilities to group companies 147 1,548
Other liabilities 2 –
Total current liabilities 362 1,548
TOTAL EQUITY AND LIABILITIES 3,581 8,026
72 N.V. Eneco Beheer Annual Report 2016

Notes to the company financial statementsAll amounts in millions of euros unless stated otherwise.
1. Accounting policiesThe company financial statements have been prepared in accordance with the provisions of Part 9, Book 2 of the Dutch Civil Code,
and the same accounting policies have been applied as in the consolidated financial statements as permitted by Section 362(8),
Part 9, Book 2 of the Dutch Civil Code, except that subsidiaries are carried at net asset value determined on the basis of the IFRS
accounting policies used in the consolidated financial statements. The descriptions of the activities and structure of the enterprise as
stated in the 'Notes to the consolidated financial statements' also apply to the company financial statements.
2. Financial assets
Subsidiaries
Receivablesfrom
subsidiariesOther
receivables
Deferredincome tax
assets Total
At 1 January 2015 5,715 897 – 1 6,613
Share of profit of subsidiaries 246 – – – 246
Movements in loans to subsidiaries 1 10 – – 11
Dividend received – 258 – – – – 258
Movements in fair value of derivative financialinstruments in equity 35 – – – 35
Acquisition of non-controlling interests – 9 – – – – 9
Translation differences 7 – – – 7
At 31 December 2015 5,737 907 – 1 6,645
Share of profit of subsidiaries 181 – – – 181
Dividend received – 175 – – – – 175
Disposal of subsidiaries – 3,181 – – – – 3,181
Movements in loans to subsidiaries – – 832 – – – 832
Movements in fair value of derivative financialinstruments in equity – 60 – – – – 60
Purchase of derivative financial instruments – – 8 – 8
Acquisition of non-controlling interests 1 – – – 1
Translation differences – 13 – 5 – – – 18
At 31 December 2016 2,490 70 8 1 2,569
3. EquityDetails of changes in equity are set out in the Consolidated statement of changes in equity in the consolidated financial statements.
The individual components of equity are disclosed in note 24 to the consolidated financial statements.
Statutory reserves are recognised pursuant to Part 9, Book 2 of the Dutch Civil Code. N.V. Eneco Beheer’s statutory reserves are a
revaluation reserve, translation reserve, cash flow hedge reserve, retained earnings, reserve for undistributed profit of associates
and a reserve for research and development costs.
Distributable resultsA dividend of € 1,122 per share was paid in 2016 (2015: no dividend). In addition, N.V. Eneco Beheer distributed the network
company to its shareholder as dividend in kind for € 3,149 million (2015: no dividend), which corresponds to € 11,647 per share.
The non-distributable capital attributable to N.V. Eneco Beheer’s shareholder was € 85 million at 31 December 2016
(2015: € 1,002 million). The individual method was used for the cash flow hedge reserve.
4. Interest-bearing debtLong-term interest-bearing debt is predominantly the ‘green loans’ in note 27 to the consolidated financial statements.
N.V. Eneco Beheer Annual Report 2016 73

5. Contingent assets and liabilitiesLiabilityN.V. Eneco Beheer has issued a declaration of joint and several liability pursuant to Section 403(1)(f), Part 9, Book 2 of the
Dutch Civil Code for the principal subsidiaries marked with an * in the list of subsidiaries, joint operations, joint ventures and
associates.
Fiscal unityN.V. Eneco Beheer and almost all its subsidiaries are members of a fiscal unity for corporate income tax purposes. N.V. Eneco
Beheer is also a member of a fiscal unity for VAT purposes, covering part of the Group. All companies in both of these fiscal unities
are jointly and severally liable for the tax obligations of the fiscal unity. See note 30 ‘Contingent assets and liabilities’ to the
consolidated financial statements for more information on the changes to these fiscal unities in connection with the unbundling at
31 January 2017.
Cash poolUnder its participation in the Group cash pool, N.V. Eneco Beheer like the other participants, is jointly and severally liable for deficits
in the pool as a whole.
Contingent assets and liabilitiesGuarantees
See note 30 ‘Contingent assets and liabilities’ to the consolidated financial statements for group guarantees issued by N.V. Eneco
Beheer.
Other liabilities
N.V. Eneco Beheer’s remaining contingent liabilities at 31 December 2016 were € 6 million (2015: € 4 million). These amounts are
set out in note 30 'Contingent assets and liabilities' to the consolidated financial statements.
6. Auditor's feesThe company is applying the exemption in Section 382a(3), Part 9, Book 2 of the Dutch Civil Code and not disclosing the auditor’s
fees. The financial information is disclosed in the consolidated financial statements of Eneco Holding N.V.
7. Events after the reporting dateSee note 34 ‘Events after the reporting date’ to the consolidated financial statements for events after the reporting date.
8. Profit appropriationA proposal will be put to the General Meeting of Shareholders to resolve to add the Profit after income tax of € 192 million to
retained earnings.
Rotterdam, 30 January 2017
N.V. Eneco Beheer
Board of Management
J.F. (Jeroen) de Haas, chairman
C.J. (Kees-Jan) Rameau
G.A.J. (Guido) Dubbeld
M.W.M. (Marc) van der Linden
74 N.V. Eneco Beheer Annual Report 2016

Other information1. Profit appropriation pursuant to the articles of association
Pursuant to the company’s articles of association, the profit is at the disposal of the general meeting of shareholders. Distributions
from the profit may only be made if the financial statements show that this is permitted. The articles of association also state that
the general meeting of shareholders may resolve to make interim distributions. The provisions of the articles of association and the
law apply to the amount and formalities for this.
N.V. Eneco Beheer Annual Report 2016 75

2. Independent auditor's reportTo: The shareholder of N.V. Eneco Beheer
Report on the financial statementsOur opinionWe have audited the financial statements 2016 of N.V. Eneco Beheer in Rotterdam (the “Company”). The financial statements
include the consolidated financial statements and the company financial statements.
In our opinion:
• the consolidated financial statements give a true and fair view of the financial position of the Company as at December 31, 2016
and of its result and cash flows over 2016 in accordance with International Financial Reporting Standards as adopted by the
European Union (“EU-IFRS”) and with Part 9 Book 2 of the Dutch Civil Code; and
• the company financial statements give a true and fair view of the financial position of the Company as at December 31, 2016 and
of the result over 2016 in accordance with Part 9 Book 2 of the Dutch Civil Code.
The consolidated financial statements comprise:
1. the consolidated balance sheet as at December 31, 2016;
2. the following statements over 2016: the consolidated profit and loss account, the consolidated statement of realized and
unrealized results, the consolidated statements of movements in the group equity and the consolidated cash flow statement;
and
3. the notes comprising a summary of the main accounting policies and other explanatory information.
The company financial statements comprise:
1. the company balance sheet as at December 31, 2016;
2. the company profit and loss account over 2016; and
3. the notes comprising a summary of the accounting policies and other explanatory information.
Basis for our opinionWe have performed our audit in accordance with Dutch law, including the Dutch Standards on Auditing. Our responsibilities in this
respect are set out in the section “Our responsibilities for the financial statements audit”.
We are independent of the Company as required under the Regulation on Auditor Independence in Assurance Engagements
[‘Verordening inzake de onafhankelijkheid van accountants’] and other relevant independence requirements in the Netherlands
relevant to the engagement. Furthermore, we have complied with the Regulation Code of Conduct and Professional Practice
Auditors [‘Verordening gedrags- en beroepsregels accountants’].
We believe that the audit evidence we have obtained is sufficient and appropriate to provide a basis for our opinion.
Report on the other information recorded in the annual reportIn addition to the financial statements and our audit opinion, the annual report includes other information. This comprises:
• Management report; and
• the other information.
Based on the following procedures we believe that the other information:
• is consistent with the financial statements and does not contain any material misstatements; and
• contains all information required under Part 9 Book 2 Dutch Civil Code.
We have read the other information and based on our knowledge and our understanding, obtained from the financial statements
audit or otherwise, considered whether the other information contains material misstatements.
Through our procedures we have complied with the requirements under Part 9 Book 2 Dutch Civil Code and Dutch Accounting
Standard 720. These procedures do not have the same depth as our audit procedures as regards the financial statements.
76 N.V. Eneco Beheer Annual Report 2016

The Board of Management is responsible for preparing of the other information, among which the Board of Management’s report
and the other information, in conformity with Part 9 Book 2 Dutch Civil Code.
Description of responsibilities relating to the financial statementsResponsibilities of the Board of Management for the financial statementsThe Board of Management is responsible for the preparation and fair presentation of the financial statements in accordance with
EU-IFRS and Part 9 of Book 2 of the Dutch Civil Code. In this respect the Board of Management is responsible for such internal
control as the Board of Management determines is necessary to enable the preparation of the Report and the financial statements
that are free from material misstatement, whether due to fraud or error.
As part of the preparation of the financial statements, the Board of Management is responsible for assessing the company’s ability
to continue as a going concern. Based on the financial reporting framework mentioned, the Board of Management should prepare
the financial statements using the going concern basis of accounting unless the Board of Management either intends to liquidate the
Company or to cease operations, or has no realistic alternative but to do so.
The Board of Management should disclose events and circumstances that may cast significant doubt on the Company’s ability to
continue as a going concern in the financial statements.
The Board of Management is responsible for overseeing the Company’s financial reporting process.
Our responsibilities for the financial statements auditOur responsibility is to plan and perform the audit that allows us to obtain sufficient and appropriate audit evidence for our opinion.
Our audit has been performed with a high, but not absolute, level of assurance, which makes it possible that we did not detect all
errors or frauds.
Misstatements may arise due to fraud or errors. They are considered to be material if, individually or in the aggregate, they could
reasonably be expected to influence the economic decisions of users taken on the basis of these financial statements. Materiality
influences the nature, timing and scope of our audit procedures and the evaluation of the impact of identified misstatements on our
opinion.
We have exercised professional judgment and have maintained professional skepticism throughout the audit, in accordance with
Dutch Standards on Auditing, ethical requirements, independence requirements and the WNT Audit Protocol.
Our audit included, e.g.:
• Identifying and assessing the risks of material misstatements of the financial statements, whether due to fraud or error,
designing and performing audit procedures responsive to those risks, and obtaining audit evidence that is sufficient and
appropriate to provide a basis for our opinion. The risk of not detecting a material misstatement resulting from fraud is higher
than for one resulting from error, as fraud may involve collusion, forgery, intentional omissions, misrepresentations, or the
override of internal control.
• Obtaining an understanding of internal control relevant to the audit in order to design audit procedures that are appropriate in the
circumstances, but not for the purpose of expressing an opinion on the effectiveness of the company's internal control.
• Evaluating the appropriateness of accounting policies used and the reasonableness of accounting estimates and related
disclosures made by the Board of Management.
• Concluding on the appropriateness of the Board of Mangement's use of the going concern basis of accounting, and based on the
audit evidence obtained, whether a material uncertainty exists related to events or conditions that may cast significant doubt on
the company's ability to continue as a going concern. If we conclude that a material uncertainty exists, we are required to draw
attention in out auditor's report to the related disclosures in the financial statements or, if such disclosures are inadequate, to
modify our opinion. Our conclusions are based on the audit evidence obtained up to the date of our auditor's report. However,
future events or conditions may cause the company to cease to continue as a going concern.
• Evaluating the overall presentation, structure and content of the financial statements, including the disclosures.
• Evaluating whether the financial statements represent the underlying transactions and events in a manner that achieves fair
presentation.
N.V. Eneco Beheer Annual Report 2016 77

Given our responsibility for the opinion on the financial statements, we are responsible for managing, supervising, and performing
the audit of the Group. As part of this responsibility we have determined the nature and scope of the procedures to be performed
for the business units of the Group. Relevant factors we considered in this respect are the scope and/or the risk profiles of the
business units or the business operations. Based on this we selected the business units for which an audit or a review of the full
financial information or of specific items was necessary.
We communicate with the Board of Management regarding, among other matters, the planned scope and timing of the audit and
significant audit findings, including any significant findings in internal controls that we identify during our audit.
We provide the Board of Management with a statement that we have complied with relevant ethical requirements regarding
independence, and to communicate with them all relationships and other matters that may reasonably be thought to bear on our
independence, and where applicable, related safeguards.
Rotterdam, January 30, 2017
Deloitte Accountants B.V.
Was signed,
J. A. de Bruin
78 N.V. Eneco Beheer Annual Report 2016

Published by
N.V. Eneco Beheer
Communications & Public Affairs
PO Box 1003
3000 BA Rotterdam
Telephone +31 (0)88 806 0600
www.eneco.com
Feedback
Design and project realisation
C&F Report
Disclaimer
This annual report contains statements relating to the future. These statements can be recognised by the use of
wording such as ‘anticipated’, ‘expected’, ‘forecasts’, ‘intends’, and similar expressions. These statements are subject
to risks and uncertainties and the actual results and events can differ considerably from the current expectations.
Factors that could lead to this include, but are not limited to, the general economic situation, the situation in
the markets in which N.V. Eneco Beheer operates, the behaviour of customers, suppliers and competitors,
technological developments and legal provisions and stipulations of regulatory bodies that affect the activities of
N.V. Eneco Beheer. Future results can also be influenced by factors including, but not limited to, financial risks, such
as foreign currency risks, interest risks and liquidity and credit risks. N.V. Eneco Beheer does not accept any liability
or obligation related to the adjustment or revision of the current forecasts on the basis of new information or future
events or for any other reason.
This annual report is only published in Dutch-language and English-language versions. In the case of any discrepancy
between language versions, the Dutch version prevails.
Eneco, Oxxio, Toon, Jedlix, Luminext, Eneco HollandseWind, Eneco WarmteWinner and Eneco HeatWinner
are registered trademarks of Eneco B.V.

www.eneco.com
N.V. Eneco BeheerPO Box 1003
3000 BA Rotterdam