Embed Size (px)
Citation preview

Nutrition 526 - 10/4/2002

Topics
• Pregnancy Data
• Intergenerational Nutritional Effects
• Fetal Growth and Chronic Disease
• Public Health Approaches to Nutrition and Pregnancy

Health, United States, 2002: www.cdc.gov/nchs/hus.htm
• What does the pregnant/parenting population look like?
• What have the trends been?
• Who’s not having babies?

Emerging Understandings about Nutrition in Pregnancy:
• Fetal nutritional status is affected by the intrauterine and childhood nutritional experiences of the mother
• Maternal nutritional status at time of conception is an important determinant of outcomes
• Intrauterine nutritional environment affects health and development of the fetus throughout life

Emerging Understandings about Nutrition in Pregnancy
• Periods of critical development are key when considering effects of nutrition in pregnancy. Undernutrition has different effects at different times of life.
• Societies transitioning from chronic malnutrition to access to high calorie foods are at high risk of chronic disease due to lasting effects of early nutritional status

Emerging Understandings about Nutrition in Pregnancy
(Coming Attractions….)
• Pregnancy is a period of increased flexibility in metabolism and absorption of energy and nutrients.

Effect of Women’s own Intrauterine Nutritional
Experience her Offspring

Two Studies of Effects of Maternal Birthweight on Infant
Birthweight

Godfrey KM, Barker DJP, Robinson S, Osmond C. Mother's birthweight and diet in pregnancy in relation to the baby's thinness at birth. Br J Obstet Gynaecol 1997;104:663–7


Illinois StudyCoutinho et al. Am J Epi, 1997 146:804-809
• N=15,287 Black and 117,708 white matched pairs of infants and mothers.
• Mothers were born between 1956-75, infants between 1989-1991
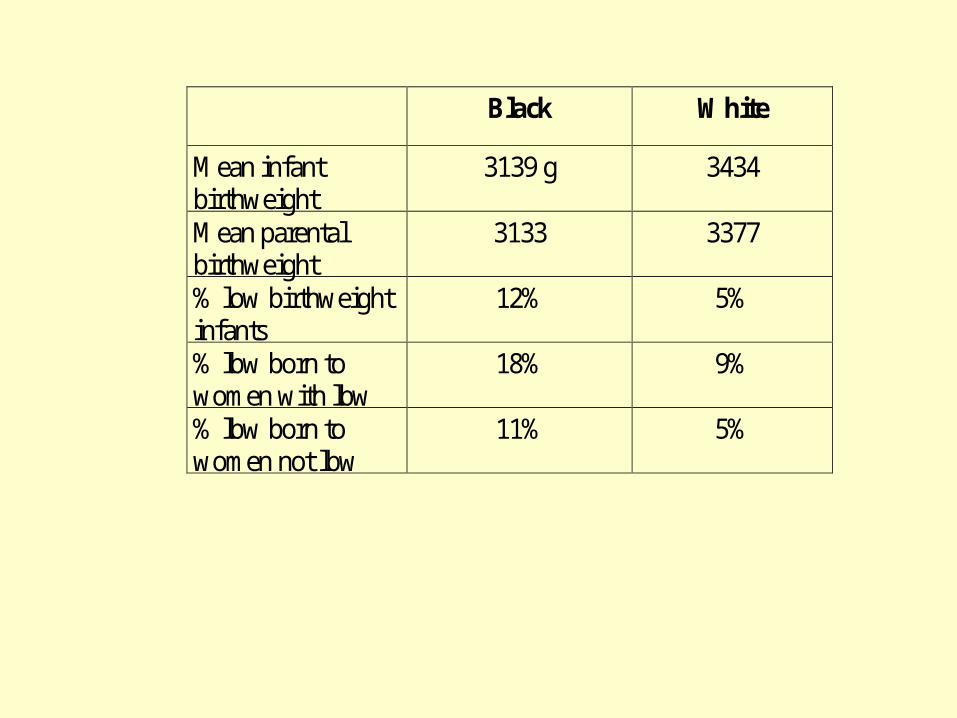
Black White
Mean infantbirthweight
3139 g 3434
Mean parentalbirthweight
3133 3377
% low birthweightinfants
12% 5%
% lbw born towomen with lbw
18% 9%
% lbw born towomen not lbw
11% 5%

Results
• Father’s birthweight had effect on infant birthweight but not as strong as mothers.
• In multiple linear regression for infants who weighed more than 2500 g, parental birthweight accounted for 5% of variance among black infants and 4% among white infants.
• (included parental age, years of schooling, matiral status and adequacy of prenatal care)

Results, cont.
• Each 100 g increase in maternal birthweight was associated with 24-27 g increase in infant birthweight

Influence of Maternal Intrauterine & Childhood Nutrition on Outcomes of
Pregnancy

Reproductive performance and nutrition during childhood
Nutrition Reviews; Washington; Apr 1996; Martorell, Reynaldo; Ramakrishnan, Usha; Schroeder, Dirk G; Ruel, Marie;

Longitudinal Supplementation Trial (1969-1977)
• Guatemala, 4 Villages, one pair of villages had about 900 people each and the other about 500 each.
• 2 each randomized to:• Atole (Incaparina, a vegetable protein mix
developed by INCAP*, dry skim milk, sugar, and flavoring, 163 kcal/cup, 11/5 g protein)
• Fresco (flavored drink with sugar, vitamins and minerals, 59 kcal/cup)
*Institute of Nutrition of Central America and Panama

• Feeding center was open daily for over 7 years, from 1969 to 1977.
• Anyone in the village could attend, but careful recording of consumption, including of additional servings as well as of leftovers, was done only for women who were pregnant or breastfeeding and for children 7 years or younger.
• Supplements were available twice daily, in midmorning and midafternoon, so as not to interfere with meal times.

Conceptual framework
“Malnutrition in early childhood constrains the future capacity of women to bear healthy newborns and their ability to feed and care for them, and through these mechanisms the growth and development of the next generation.”


Follow-Up data - 1990s
• The prevalence of low birthweight is currently 12% in Atole villages (n = 65) and 28% in Fresco villages (n = 58) among women exposed to the supplements during the intrauterine period and the first 3 years of life.
• Mean birthweights are 2.90 kg in Atole villages and 2.73 in Fresco villages.

Role of intergenerational effects on linear growth
U Ramakrishnan; R Martorell; D G
Schroeder; R Flores; The Journal of Nutrition; Bethesda; Feb 1999;

Methods
• The sample was restricted to singleton, term (>37 wk of gestation) births that occurred in the four study villages between 1991 and 1996, to women who were born during the original longitudinal study (1969-1977)
• Complete data were available for 215 mother-child pairs, and 60% of the mothers (n = 140)
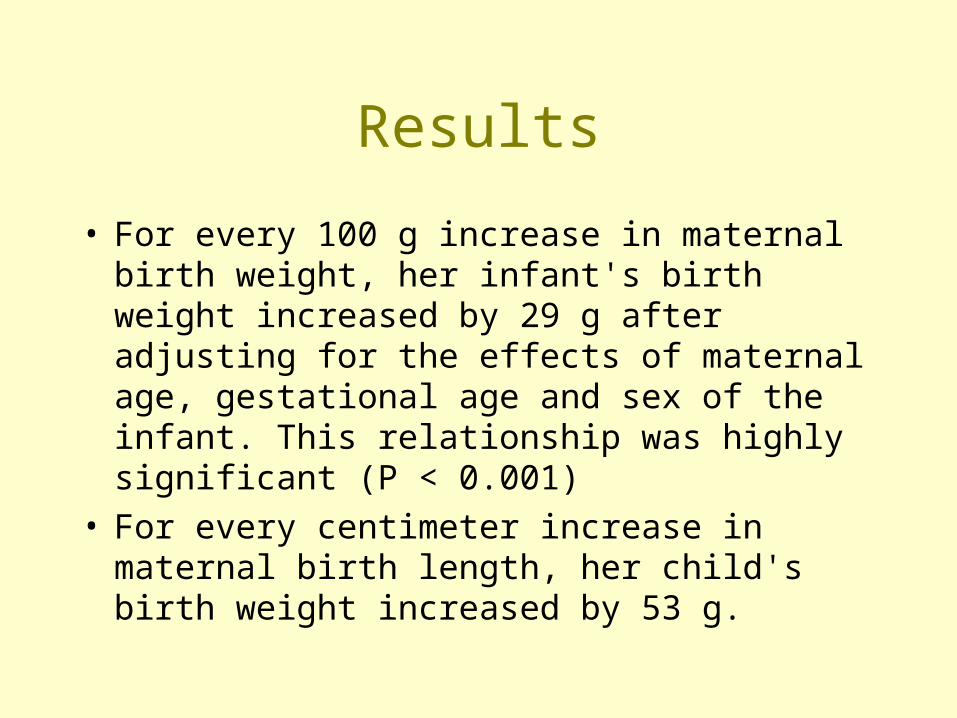
Results
• For every 100 g increase in maternal birth weight, her infant's birth weight increased by 29 g after adjusting for the effects of maternal age, gestational age and sex of the infant. This relationship was highly significant (P < 0.001)
• For every centimeter increase in maternal birth length, her child's birth weight increased by 53 g.

Influence of Maternal Nutrition in Pregnancy

Dutch Famine StudiesSusser and Stein, Nutrition Reviews, 1994
• Dutch famine winter lasted 6 months, from November 1944- when nazis imposed transport embargo on west Holland until-
• May 7, 1945 when Holland was liberated from the occupation
• Strong evidence for critical stages of development in several physiological systems

Affects of Famine
• Fertility decreased• Maternal weight fell during pregnancy
with famine exposure• Third trimester famine exposure had
strong effect on birthweight• Third trimester famine exposure was
associated with infant mortality at 30-90 days

Results for Infants Exposed to Famine
• Excess central nervous system disorders (such as NTD)
• Exposure early in gestation associated with excess obesity in young men (military records) and women
• Famine exposure late in pregancy associated with less obesity in young adulthood
• Famine exposure associated with twofold risk of schizophrenia in 50 year old women.

Second Generation
• Modest association found in this cohort between birthweights of mothers and their offspring.

Prenatal exposure to famine and brain morphology in schizophrenia
Hulshoff Pol HE; Hoek HW; Susser E; Brown AS; Dingemans A; Schnack HG; van Haren NE; Pereira Ramos LM; Gispen-de Wied CC; Kahn RS; American Journal of Psychiatry , Jul 2000;

Methods
• Nine schizophrenic patients and nine healthy comparison subjects exposed during the first trimester of gestation to the Dutch Hunger Winter were evaluated with magnetic resonance brain imaging, as were nine schizophrenic patients and nine healthy subjects who were not prenatally exposed to the famine.

RESULTS:
• Prenatal famine exposure in patients with schizophrenia was associated with decreased intracranial volume.
• Prenatal Hunger Winter exposure alone was related to an increase in brain abnormalities, predominantly white matter hyperintensities.

Further evidence of relation between prenatal famine and
major affective disorder.
Alan S Brown; Jim van Os; Corine Driessens; Hans W Hoek;
et al; The American Journal of Psychiatry; Washington; Feb
2000;
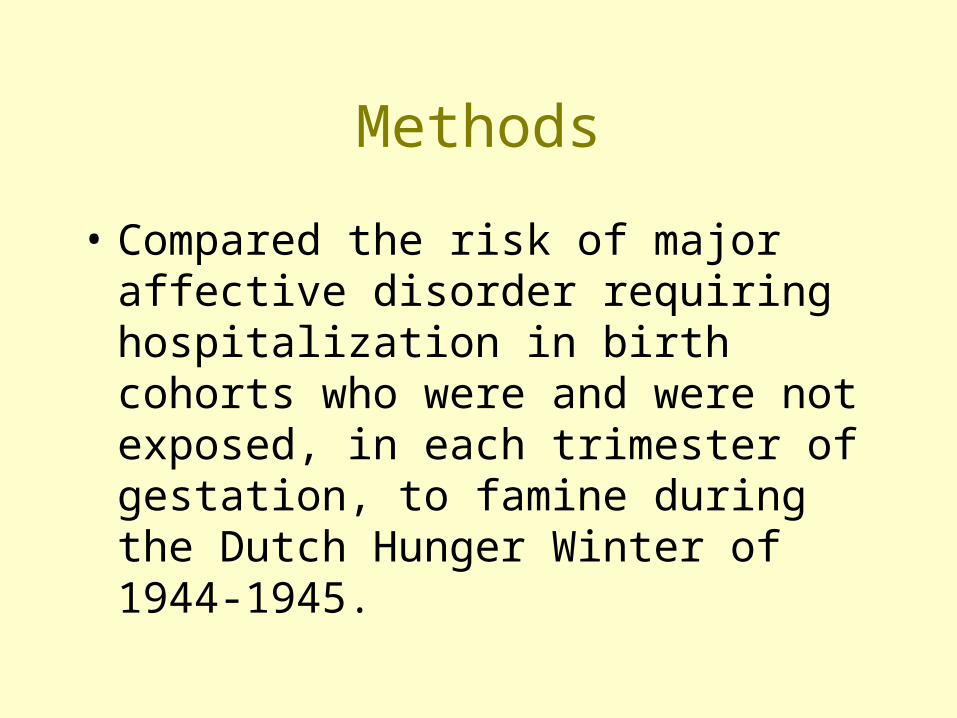
Methods
• Compared the risk of major affective disorder requiring hospitalization in birth cohorts who were and were not exposed, in each trimester of gestation, to famine during the Dutch Hunger Winter of 1944-1945.

Results
• The risk of developing major affective disorder requiring hospitalization was increased for subjects with exposure to famine in the second trimester and was increased significantly for subjects with exposure in the third trimester, relative to unexposed subjects.

Fetal Nutrition and Chronic Diseases of Adulthood

Fetal Origins ConceptsBarker et al
• Nutrition in early life has permanent effects• Undernutrition has different effects at
different times of life.• Rapidly growing fetuses and neonates are
vulnerable to undernutrition• Undernutrition results from inadequate
maternal intake, transport, or transfer of nutrients.
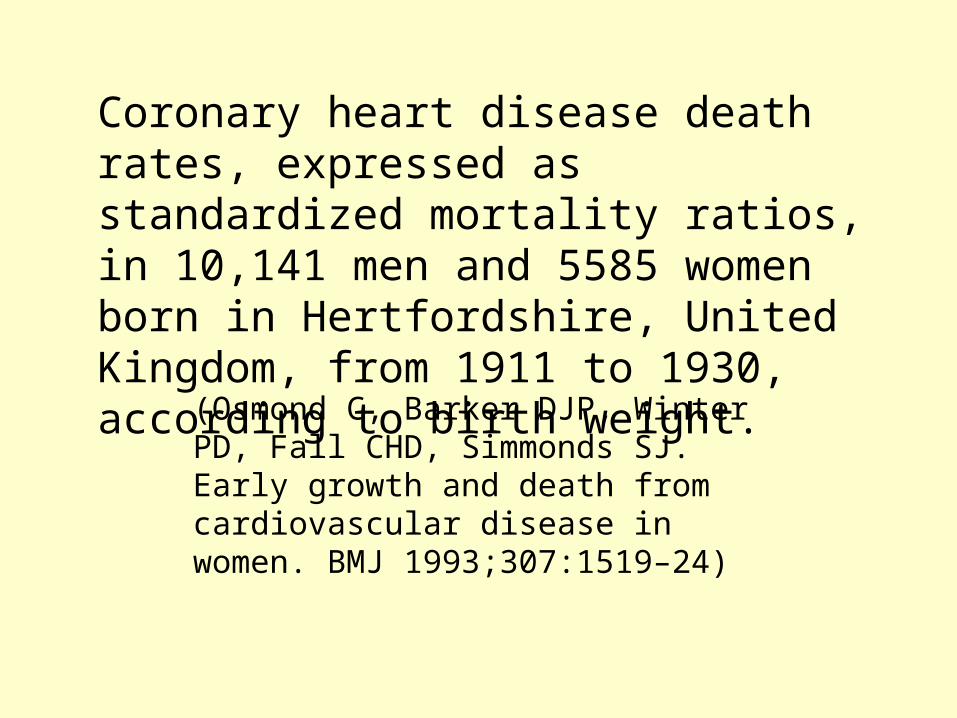
Coronary heart disease death rates, expressed as standardized mortality ratios, in 10,141 men and 5585 women born in Hertfordshire, United Kingdom, from 1911 to 1930, according to birth weight.
(Osmond C, Barker DJP, Winter PD, Fall CHD, Simmonds SJ. Early growth and death from cardiovascular disease in women. BMJ 1993;307:1519–24)


Catch-up growth in childhood and death from coronary heart disease: longitudinal
study (Eriksson et al, BMJ, 1999)
• Subjects: 3641 men born in Helsinki between 1924-1933
• Followed with school data for weight and height
• Deaths from coronary heart disease from 1971-95 (standardized mortality ratios) were endpoints.

Catch-up growth in childhood and death from coronary heart disease: longitudinalstudy (Eriksson et al, BMJ, 1999
• Men who had low birth weight or were thin at birth have high death rates from coronary heart disease
• Death rates are even higher if weight "catches up" in early childhood
• Death from coronary heart disease may be a consequence of prenatal undernutrition followed by improved postnatal nutrition
• Programs to reduce obesity among boys may need to focus on those who had low birth weight or who were thin at birth

Framework for understanding the maternal regulation of fetal development and programming. Keith M Godfrey and David JP Barker
(Fetal nutrition and adult disease Am J Clin Nutr 2000 71: 1344-1352)


Early Nutrition & Chronic Disease in
Adulthood (Waterland& Garza, Am J Clin Nutr, 1999;69:179-97)
• Epi studies: BMI, CVD, Htn, IGT
• Animal studies
• Potential mechanisms of metabolic imprinting

Obesity in Young Men after Famine Exposure in Utero and early Infancy(Ravelli et al NEJM, 1976)• N=300, 000 Dutch military inductees at age 19
• Famine exposure in first 2 trimesters lead to 80% higher prevalence of overweight (p<0.0005)
• Famine exposure in last trimester or famine exposure in first 5 months of life associated with 40% lower prevalence of overweight (p<0.005)
BMI
• The relationship between birth weight and BMI complicates studies of birth weight and chronic disease

Preadult Influences on Cardiovascular Disease and Cancer (Leon & Ben-Shlomo in A Lifecourse approach to
chronic disease epidemiology, 1997)
• 5 large retrospective studies - 4 found inverse relationship between birth weight and adult CVD
• Confounding issues include SES and BMI

CVD
“The preponderance of data suggest an inverse association between birth weight and adult CVD risk.” (Waterland and Garza)
Blood Pressure
“Retrospective studies in diverse populations have found that birth weight is inversely correlated with adult blood pressure. Although each of the studies has some weaknesses, together they support a biological link between intrauterine growth and adult blood pressure” (Waterland and Garza)

Impaired Glucose Tolerance
• Several large retrospective cohort studies in several countries have found relationship between bw and IGT.
• 266 men and women at age 50: odds ratio for ITG or type II diabetes were 3.5 for men and 12 for women with birth weights < 2.5 compared to >3.4 (Phillips et al, Diabetologia, 1994)
Impaired Glucose Tolerance, cont..
• In some populations (ex: Pima Indians) both high and low birth weights are associated with IGT in adults.

Animal Models (Waterland and Garza)
“Overall the data from animal models of metabolic imprinting support the observed epidemiological associations.”
Metabolic Imprinting
“…the basic biological phenomena that putatively underlie relations among nutritional experiences of early life and later diseases.”

Metabolic Imprinting: Characteristics
• Susceptibility limited to a critical ontogenic window early in development
• Persistent effect lasting through adulthood
• Specific and measurable outcome
• Dose-response or threshold relation between exposure and outcome

Metabolic Imprinting: Potential Mechanisms
• Organ structure
• Cell number
• Clonal selection
• Metabolic differentiation

Organ Structure
• Organogenesis starts early: by 5 weeks rudimentary organs are in place, by 8 weeks organogenesis is nearly complete
• Driven by inductive signals from adjacent cells and morphogen gradients (ex: retinoic acid/vit. A)
• Local concentrations of nutrients and metabolites may modulate this process.

Cell Number
• Tissues go through limited periods of hyperplastic and hypertrophic growth
• Rate of growth is dependent on nutrient availability
• Winnick’s rat studies found severe malnutrition during critical periods limited brain cell number
• An organ’s metabolic activity is limited by cell number

Clonal Selection
• Each organ is based on a finite number of founder cells which may have slight differences
• Founder cells that divide the most rapidly may disproportionally make up a tissue
• Nutrient availability may “select” cells with certain characteristics
• Ex: cells with more active lipogenic pathways could grow faster if access to fatty acids was limited

Metabolic Differentiation
• Process: cells develop stable patterns of basal and inducible gene expression
• Cells are characterized by the ability to express a limited number of genes.
• Mechanisms of control include:– chromatin structure (DNA “packaging”)– transcription factors (maintained through cell
divisions)– DNA methylation

Metabolic Imprinting:
• Early nutrition may influence the cascade that establishes cell specific patterns.
• Ex: hepatocyte polyploidization - in adults hepatocytes often have > normal complement of chromosomes and increased metabolic activity. Lack of polyploidization could limit hepatic metabolic activity.

Catch-up growth in childhood and death from coronary heart disease: longitudinal
study (Eriksson et al, BMJ, 1999)
• Subjects: 3641 men born in Helsinki between 1924-1933
• Followed with school data for weight and height
• Deaths from coronary heart disease from 1971-95 (standardized mortality ratios) were endpoints.

Catch-up growth in childhood and death from coronary heart disease: longitudinal
study (Eriksson et al, BMJ, 1999
• Men who had low birth weight or were thin at birth have high death rates from coronary heart disease
• Death rates are even higher if weight "catches up" in early childhood
• Death from coronary heart disease may be a consequence of prenatal undernutrition followed by improved postnatal nutrition
• Programs to reduce obesity among boys may need to focus on those who had low birth weight or who were thin at birth

Public Health Approaches to Nutrition and Pregnancy

Highlights of Trends in Pregnancies and Pregnancy Rates by Outcome:
Estimates for the United States, 1976-96
Ventura et al., National Vital Statistics Reports. 47:29, 1999.

Basic US Data
• In 1996 there were:• 6.24 million pregnancies• 3.89 live births• 1.37 induced abortions• 0.98 fetal losses
• 1996 pregnancy rate was 104.7 pregnancies per 1000 women aged 15044 - 9% lower than 1990

Effects of pregnancy planning status on birth outcomes and infant care (Kost
et al. Family Planning Perspectives, 1998)
• Analysis of 1988 NMIHS (n=9122) and NSFG (n=2548) data.

Effects of pregnancy planning status on birth outcomes and infant care (Kost
et al. Family Planning Perspectives, 1998)
Intended Mistimed Unwanted
LBW 5.1 6.5 9.7
SGA 9.5 11.3 13.7
Anynegativeoutcomes
15.6 20.4 25.5
Everbreastfed
59.9 46.6 36.1

Effects of pregnancy planning status on birth outcomes and infant care (Kost
et al. Family Planning Perspectives, 1998)
• “Knowing the planning status of a pregnancy can help identify women who may need support to engage in prenatal behaviors that are associated with healthy outcomes and appropriate infant care.”

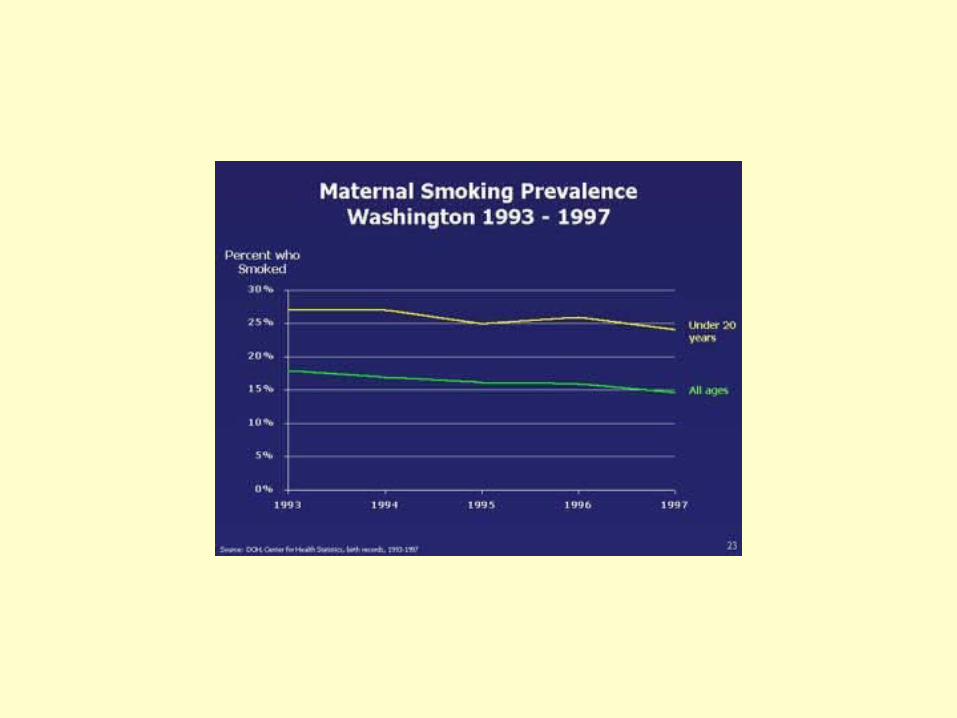
Surveillance for Pregnancy
• PRAMS results


Healthy People 2010 Goals Related to Maternal and Infant
& Nutrition

Reduce low birth weight (LBW) and very low birth weight (VLBW).
1998Baseline
2010TargetReduction in Low and
Very Low Birth Weight Percent
Low birth weight (LBW) 7.6 5.0Very low birth weight(VLBW)
1.4 0.9

Reduce preterm births
Reduction inPreterm Births
1997Baseline (%)
2010Target (%)
Total preterm 11.4 7.6
Live births at 32 to 36weeks of gestation
9.4 6.4
Live births at lessthan 32 weeks ofgestation
1.9 1.1

Increase the proportion of mothers who achieve a recommended weight gain during
their pregnancies. (Developmental) • In 1988, approximately three-quarters of
married women who delivered at full term gained the recommended weight during pregnancy.71 Two groups of women who continue to gain less than the recommended level of weight during pregnancy—teenagers and African American women—also are at particularly high risk for having LBW infants and other adverse pregnancy outcomes

Reduce the occurrence of spina bifida and other neural tube defects (NTDs)
• Target: 3 new cases per 10,000 live births.
• Baseline: 6 new cases of spina bifida or another NTD per 10,000 live births in 1996.
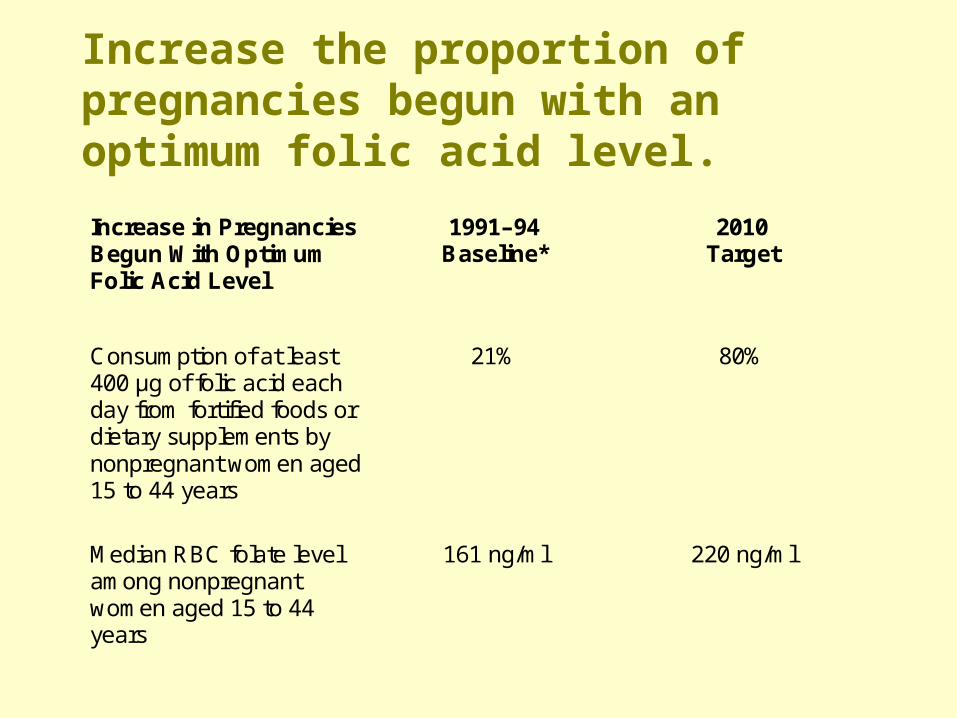
Increase the proportion of pregnancies begun with an optimum folic acid level.
Increase in PregnanciesBegun With OptimumFolic Acid Level
1991–94Baseline*
2010Target
Consumption of at least400 μg of folic acid eachday from fortified foods ordietary supplements bynonpregnant women aged15 to 44 years
21% 80%
Median RBC folate levelamong nonpregnantwomen aged 15 to 44years
161 ng/ml 220 ng/ml

Increase abstinence from alcohol, cigarettes, and illicit drugs among pregnant women
Increase in ReportedAbstinence in PastMonth FromSubstances byPregnant Women*
1996–97Baseline %
2010Target %
Alcohol 86 94
Binge drinking 99 100
Cigarette smoking† 87 98
Illicit drugs 98 100
Reduce the occurrence of fetal alcohol syndrome(FAS).(Developmental)
• Estimates of the cases of FAS vary from 0.2 to 1.0 per 1,000 live births.

Increase the proportion of mothers who breastfeed their babies
Increase in MothersWho Breastfeed
1998Baseline (%)
2010Target (%)
In early postpartumperiod
64 75
At 6 months 29 50
At 1 year 16 25
Increase smoking cessation during pregnancy
• Target: 30 percent.
• Baseline: 12 percent smoking cessation during the first trimester of pregnancy in 1991 (age adjusted to the year 2000 standard population).
Reduce growth retardation among low income children under age 5 years
• Target: 5 percent.
• Baseline: 8 percent of low-income children under age 5 years were growth retarded in 1997 (defined as height-for-age below the fifth percentile in the age-gender appropriate population using the 1977 NCHS/CDC growth charts;31 preliminary data; not age adjusted).

Reduce iron deficiency among young children and females of childbearing age.
Reduction in IronDeficiency*
1988–94Baseline (%)
2010Target (%)
Children aged 1 to 2years
9 5
Children aged 3 to 4years
4 1
Nonpregnant femalesaged 12 to 49 years
11 7

Reduce anemia among low-income pregnant females in their third trimester
• Target: 20 percent.
• Baseline: 29 percent of low-income pregnant females in their third trimester were anemic (defined as hemoglobin < 11.0 g/dL) in 1996

Anemia Rates - 1996
African American, non-Hispanic 44%
American Indian/Alaska Native 31%
Asian/Pacific Islander 26%
Hispanic 25%
White, non-Hispanic 24%
Reduce iron deficiency among pregnant females (Developmental)
• Although the prevalence of iron deficiency among low-income children continued to decline from 1976-80 to 1988-94, the prevalence of iron deficiency among all young children remained the same, and the prevalence of iron deficiency among females of childbearing age actually increased


![Intergenerational Gap Bridging.ppt - School Nutrition · • Experienced World War II as ... Microsoft PowerPoint - Intergenerational Gap Bridging.ppt [Compatibility Mode] Author:](https://img.dokumen.tips/doc/110x75/5aea705b7f8b9a585f8c6172/intergenerational-gap-school-nutrition-experienced-world-war-ii-as-microsoft.jpg)