Embed Size (px)
Citation preview

U.S. Environmental Protection Agency Region IX
Noyo RiverTotal Maximum Daily Load
for Sediment
Approved by:
original signed by 16 December 1999____________________ ____________Alexis Strauss DateDirector, Water Division

i
TABLE OF CONTENTS
List of Tables . . . . . . . . . . . . . . . . . . . . . . . . . . . . . . . . . . . . . . . . . . . . . . . . . . . . . . . . . . . . . . . iiList of Figures . . . . . . . . . . . . . . . . . . . . . . . . . . . . . . . . . . . . . . . . . . . . . . . . . . . . . . . . . . . . . . iiEXECUTIVE SUMMARY . . . . . . . . . . . . . . . . . . . . . . . . . . . . . . . . . . . . . . . . . . . . . . . . . . . . 1
A. Section 303(d) and the Noyo River Watershed . . . . . . . . . . . . . . . . . . . . . . . . . . . . . . . . 1B. Components of the TMDL . . . . . . . . . . . . . . . . . . . . . . . . . . . . . . . . . . . . . . . . . . . . . . . 1
CHAPTER I: INTRODUCTION . . . . . . . . . . . . . . . . . . . . . . . . . . . . . . . . . . . . . . . . . . . . . . . 5A. Characteristics of the Noyo River Watershed . . . . . . . . . . . . . . . . . . . . . . . . . . . . . . . . . 5B. Application of Section 303(d) to the Noyo River Watershed . . . . . . . . . . . . . . . . . . . . . . 5C. Data Sources . . . . . . . . . . . . . . . . . . . . . . . . . . . . . . . . . . . . . . . . . . . . . . . . . . . . . . . . . 7D. Components of a TMDL . . . . . . . . . . . . . . . . . . . . . . . . . . . . . . . . . . . . . . . . . . . . . . . . 7
CHAPTER II: EXISTING WATER QUALITY REQUIREMENTS . . . . . . . . . . . . . . . . . . . . 9A. Beneficial Uses . . . . . . . . . . . . . . . . . . . . . . . . . . . . . . . . . . . . . . . . . . . . . . . . . . . . . . . . 9B. Water Quality Objectives . . . . . . . . . . . . . . . . . . . . . . . . . . . . . . . . . . . . . . . . . . . . . . . 10
CHAPTER III: PROBLEM STATEMENT . . . . . . . . . . . . . . . . . . . . . . . . . . . . . . . . . . . . . . 11A. General Background . . . . . . . . . . . . . . . . . . . . . . . . . . . . . . . . . . . . . . . . . . . . . . . . . . 11B. Description of the Noyo River Watershed . . . . . . . . . . . . . . . . . . . . . . . . . . . . . . . . . . . 12C. Summary of Findings for the Noyo River Watershed Overall . . . . . . . . . . . . . . . . . . . . 15D. Summary of Findings in the Headwaters Assessment Area . . . . . . . . . . . . . . . . . . . . . . 19E. Summary of Findings in the North Fork Noyo River Assessment Area . . . . . . . . . . . . . 25F. Summary of Findings in the South Fork Noyo River Assessment Area . . . . . . . . . . . . . 27G. Summary of Findings in the Mainstem Noyo River Assessment Area . . . . . . . . . . . . . .30H. Relevant Findings in the Caspar Creek Watershed . . . . . . . . . . . . . . . . . . . . . . . . . . . . 32
CHAPTER IV: NUMERIC AND OTHER TARGETS . . . . . . . . . . . . . . . . . . . . . . . . . . . . . . 35A. Summary of Numeric and Other Targets . . . . . . . . . . . . . . . . . . . . . . . . . . . . . . . . . . . 35B. Discussion of Numeric and Other Targets . . . . . . . . . . . . . . . . . . . . . . . . . . . . . . . . . . 37
CHAPTER V: SOURCE ANALYSIS . . . . . . . . . . . . . . . . . . . . . . . . . . . . . . . . . . . . . . . . . . 44A. Land Use History . . . . . . . . . . . . . . . . . . . . . . . . . . . . . . . . . . . . . . . . . . . . . . . . . . . . . 44B. Sediment Budget . . . . . . . . . . . . . . . . . . . . . . . . . . . . . . . . . . . . . . . . . . . . . . . . . . . . . 51
CHAPTER VI: LINKAGE ANALYSIS . . . . . . . . . . . . . . . . . . . . . . . . . . . . . . . . . . . . . . . . . 61CHAPTER VII: LOAD ALLOCATIONS . . . . . . . . . . . . . . . . . . . . . . . . . . . . . . . . . . . . . . . 63
A. Calculation of the TMDL . . . . . . . . . . . . . . . . . . . . . . . . . . . . . . . . . . . . . . . . . . . . . . . 63B. Calculation of Background Loading . . . . . . . . . . . . . . . . . . . . . . . . . . . . . . . . . . . . . . . 63C. Calculation of Load Allocations . . . . . . . . . . . . . . . . . . . . . . . . . . . . . . . . . . . . . . . . . . 64D. Summary of Load Allocations and Required Reductions . . . . . . . . . . . . . . . . . . . . . . . . 66
CHAPTER VIII: MARGIN OF SAFETY AND SEASONAL VARIATION . . . . . . . . . . . . . 68CHAPTER IX: IMPLEMENTATION, MONITORING, AND TIME FRAME . . . . . . . . . . . 72CHAPTER X: PUBLIC PARTICIPATION . . . . . . . . . . . . . . . . . . . . . . . . . . . . . . . . . . . . . . 75References . . . . . . . . . . . . . . . . . . . . . . . . . . . . . . . . . . . . . . . . . . . . . . . . . . . . . . . . . . . . . . . . 76Glossary . . . . . . . . . . . . . . . . . . . . . . . . . . . . . . . . . . . . . . . . . . . . . . . . . . . . . . . . . . . . . . . . . 80

ii
List of Tables
1. Summary of Numeric and Other Targets . . . . . . . . . . . . . . . . . . . . . . . . . . . . . . . . . . . . . . . 32. Noyo Coho Numbers for 1962-63 through 1998-99 Seasons . . . . . . . . . . . . . . . . . . . . . . . 163. Summary of the Results of Fish Distribution Surveys in the Upper Noyo River
Watershed, Conducted by Louisiana-Pacific Corporation (now Mendocino Redwood Company) from 1994-1996 . . . . . . . . . . . . . . . . . . . . . . . . . . . . . . . . . . . . . . . . 19
4. Summary of Salmonid Sitings Reported in Stream Surveys Conducted by theDepartment of Fish and Game in the 1950s and 1960s . . . . . . . . . . . . . . . . . . . . . . . . . . . . 22
5. Summary of In-stream Data Collected by Mendocino Redwood Company in the Upper Noyo River Watershed . . . . . . . . . . . . . . . . . . . . . . . . . . . . . . . . . . . . . . . . . . . 23
6. Summary of Aquatic Surveys Conducted by the Department of Fish and Game from 1983 to 1989 in the Noyo River Watershed (Contained in DFG’s Biosample Database) . . . . . . . . . . . . . . . . . . . . . . . . . . . . . . . . . . . . . . . . . . . . . . . . . . . . . 28
7. Summary of Numeric Targets . . . . . . . . . . . . . . . . . . . . . . . . . . . . . . . . . . . . . . . . . . . . . . 368. Summary of Other Targets . . . . . . . . . . . . . . . . . . . . . . . . . . . . . . . . . . . . . . . . . . . . . . . . . 369. Summary of the Logging Activity Permitted by the California Department of
Forestry and Fire Protection by the Five Largest Landowners/Managers from 1986-1998 in the Noyo River Watershed . . . . . . . . . . . . . . . . . . . . . . . . . . . . . . . . . . . . . . 46
10. Summary of Silvicultural Practices used in the Noyo River Watershed as Derived from Timber Harvest Plans Submitted to the Department of Forestry and Fire Protection from 1986 to 1998 . . . . . . . . . . . . . . . . . . . . . . . . . . . . . . . . . . . . . . . . 47
11. Summary of Yarding Statistics from Timber Harvest Activity in the Noyo River Watershed as Compiled from Timber Harvest Plans Submitted to the California Department of Forestry and Fire Protection from 1986-1998 . . . . . . . . . . . . . . . . . . . . . . . 47
12. Summary of Road Length and Density Data Derived from Timber Harvest Plans Submitted to the Department of Forestry and Fire Protection from 1986-1998 . . . . . . . . . . 48
13. Noyo River Watershed Sediment Source Analysis -- Preliminary Sediment Budget . . . . . . 5314. Summary of Sediment Inputs to the Noyo River Watershed as Derived from
Data Presented by Matthews (1999) . . . . . . . . . . . . . . . . . . . . . . . . . . . . . . . . . . . . . . . . . 5415. Calculation of Load Allocations for Railroad, Harvest Areas, and Skid Trail-
related Sources . . . . . . . . . . . . . . . . . . . . . . . . . . . . . . . . . . . . . . . . . . . . . . . . . . . . . . . . . 6516. Summary of Load Allocations and Required Reductions . . . . . . . . . . . . . . . . . . . . . . . . . . 6717. Supporting Information for Margin of Safety. . . . . . . . . . . . . . . . . . . . . . . . . . . . . . . . . . . 71
List of Figures
1. Watershed Location map . . . . . . . . . . . . . . . . . . . . . . . . . . . . . . . . . . . . . . . . . . . . . . . . . . . 62. Noyo River Watershed TMDL Planning Areas and Sub-watersheds . . . . . . . . . . . . . . . . . . 133. Average Annual Dredging Volume in the Noyo River Harbor . . . . . . . . . . . . . . . . . . . . . . 18

1
EXECUTIVE SUMMARY________________________________________________________________________
The Noyo River watershed is a forested, coastal watershed in Mendocino County, California, thatencompasses approximately 113 square miles (72,323 acres). Its logging history dates back to1853 when the first water-powered mill was built in the lower Noyo River. Old growth loggingcontinued into the early part of the 20th century. Second growth logging began in the 1960s,primarily in the lower main drainage area, and continues today. Removal of residual old-growthstands began in the 1960s and continued into the mid-1980s (M. Jameson pers. comm. w/ A.Mangelsdorf as reported in Regional Water Board, 1999). The California Western Railroadoperates the Skunk Train that traverses the Noyo River watershed along the mainstem channel. Other minor land uses found in the basin include ranching and recreation.
The U.S. Environmental Protection Agency (EPA) is establishing the Noyo River Total MaximumDaily Load (TMDL) for sediment to identify sediment loading allocations that, whenimplemented, are expected to result in the attainment of the applicable water quality criteria forsediment, which are established to protect the beneficial uses of the Noyo River. The primarybeneficial use of concern in the Noyo River watershed is the salmonid fishery, particularly thecoho salmon (Oncorhynchus kisutch) fishery.
A. SECTION 303(d) AND THE NOYO RIVER WATERSHED
The Noyo River watershed was listed on the 1998 303(d) list by the State of California asrequired by Section 303(d) of the Clean Water Act. This list describes water bodies that do notfully support all beneficial uses or are not meeting water quality objectives. It also describes thepollutant(s) for each water body that limit(s) its use or prevent(s) attainment of its water qualityobjectives. As required by Section 303(d), a TMDL must be developed for water bodies on the303(d) list. For the Noyo River watershed, the listing was the result of water quality problemsrelated to sedimentation throughout the watershed. Sedimentation was determined to beimpacting the cold water fishery, a beneficial use of the Noyo River watershed, including themigration, spawning, reproduction, and early development of cold water fish such as coho salmonand steelhead trout. Cold freshwater and estuarine habitats are also designated beneficial uses ofthe Noyo River watershed.
B. COMPONENTS OF THE TMDL
The TMDL includes:· Problem statement;· Numeric targets;· Source analysis;· Linkage analysis;· Load allocations; and· Discussion of the margin of safety and annual and seasonal variation.

2
Problem StatementThe problem statement includes an assessment of existing in-stream conditions. The watershed isdivided into four assessment areas: Headwaters, North Fork Noyo River, South Fork NoyoRiver, and Mainstem Noyo River. Historically, salmonids have been found in each of theassessment areas. Salmonid populations have declined in recent years, quantitativelydemonstrated by data from the egg-taking station in the South Fork Noyo River AssessmentArea. Pool frequency, pool depth, the lack of large woody debris, and the lack of other forms ofshelter (particularly from high winter flows) appear to be factors currently limiting the success ofsalmonids (especially coho salmon) throughout the watershed. In addition, the data indicate thatcobble may be too embedded and the substrate composed of too many fines for successfulspawning and fry emergence.
Numeric TargetsThe numeric targets interpret water quality standards and provide indicators of watershed health. In particular, they reflect in-stream and watershed conditions presumed to be suitable for thesuccessful migration, spawning, rearing, and over-wintering of salmonids in the fresh waterenvironment. The indicators and targets are identified in Table 1.
Source AnalysisThe source analysis includes an assessment of sources of sediment historically and/or presentlyimpacting water quality. Several factors have contributed to the increased sediment deliveryabove natural rates throughout the watershed. They include: high rates of timber harvest, astrong reliance on ground-based yarding methods (particularly in the Headwaters and North ForkNoyo River Assessment Areas), and high road densities. These factors have led to an increase inthe rates of sediment delivery due to landsliding, fluvial erosion, and surface erosion related toland management activities. Estimates of the current rates of sediment delivery are compared toestimates for the period prior to 1958. Although large-scale tractor yarding had not occurredprior to 1958, sediment delivery prior to 1958 was influenced by historic land managementpractices (e.g., turn-of-the-century old growth logging) and is not considered to be entirely“natural.”
Linkage AnalysisThe linkage analysis defines the relationship between hillslope sediment production processes andin-stream effects. Thus, the linkage analysis provides the basis for the magnitude of sedimentreductions and associated hillslope controls necessary to attain water quality standards andprotect the beneficial uses.
EPA has determined that salmonids were relatively abundant in the period 1933 - 1957, comparedto current levels, in the Noyo River. Thus, average sediment delivery rates from 1933 to 1957represent conditions acceptable to salmonids. Accordingly, EPA has concluded that if averagesediment delivery rates do not exceed the levels in the 1933-1957 period, then sediment will notimpair beneficial uses of the Noyo River.

3
Table 1: Summary of Numeric and Other TargetsIndicator Target ReferencesTurbidity 20% above background Basin Plan, 1994; Reid, 1999% fines <0.85 mm 14% (mean) as wet volume Burns, 1970; CDF, 1994Embeddedness Increasing percentage of riffle habitat units that are
less than 25% embeddedFlosi and Reynolds, 1994; DFG1995 (a) and (b)
Pool frequency/depth 40% of habitat length in pools greater than 3 feetin depth at low flow in third and higher orderstreams
Flosi and Reynolds, 1994; G.Flosi pers. comm. w/ A.Mangelsdorf as reported inRegional Water Board, 1999
V* 0.27 (mean) Knopp, 1993Backwater pools Increasing percentage of backwater pools per
habitat lengthDietrich, 1998
Large woody debris Increase in the number and volume of key pieces oflarge woody debris per stream length
Bilby and Ward, 1989; Beechieand Sibley, 1997; USDA, 1994
Thalweg profile Increasing variation in thalweg elevation aroundthe mean thalweg slope
Trush, 1999; Madej, 1999
Stream crossings withdiversion potential
1% of all stream crossings, as a result of a stormwith a 100-year recurrence interval or less
Weaver and Hagans, 1994; D.Hagans pers. comm. w/ A.Mangelsdorf as reported inRegional Water Board, 1999
Stream crossings withsignificant crossingfailure potential
1% of all stream crossings, as a result of a stormwith a 100-year recurrence interval or less
Flanagan et al., 1998
Hydrologicconnectivity
Decrease in the miles of road hydrologicallyconnected to a watercourse
Ziemer, 1998; Furniss, 1999
Disturbed area Decrease in the area disturbed by facilities + Lewis, 1998Activity in unstableareas
No activities (e.g., roads, harvest, yarding, etc.) inunstable areas (e.g., steep slopes, headwall swales,inner gorges, streambanks, etc.) unless a detailedgeological assessment is performed that showsthere is no potential for increased sediment deliveryto a watercourse as a result.
Dietrich et al., 1998; Weaverand Hagans, 1994; Pitlick,1982; Pacific WatershedAssociates, 1998
+A facility is defined as any management-related structure such as a road, railroad roadbed, skid trail, landing,harvest unit, animal holding pen, or agricultural field (e.g., pasture, vineyard, orchard, row crops). For thepurpose of this target, a harvest unit or agricultural field that retains its natural characteristics with respect torainfall interception, rainfall infiltration, and soil protection, is not considered a “facility.”
Load AllocationsEPA is setting the TMDL equal to the loading capacity, at a level expected to result in attainmentof the applicable water quality criteria for sediment. EPA is defining the current loading capacityof the Noyo River to be equivalent to the sediment loading rate for the period 1933-1957, whichis 470 tons/mi2/yr. Of this, 370 tons/mi2/yr is attributable to background sources.
EPA has allocated the remaining 100 tons/mi2/yr among individual land use activities that deliversediment to the Noyo River. Meeting these load allocations is necessary to attain water qualitycriteria for sediment and protect beneficial uses. The allocations are also expressed as percentreductions from existing rates of management-related sediment delivery. Specific allocations aredeveloped for each of the four assessment areas. The determination of loading allocationsincluded consideration of the differences in management practices among the assessment areas. The allocations are set forth in Tables 15 and 16 in Chapter VII.

4
Margin of Safety and Seasonal VariationErosion is inherently variable, both temporally and spatially, and sediment delivery to streamsdoes not always coincide with erosion. Therefore, the sediment load allocations are designed toapply to the sources of sediment, not the movement or delivery of the sediment to the streams. They are also applied as 10-year rolling averages.
Likewise, the condition of the in-stream environment displays temporal and spatial variability, andthe Regional Water Quality Control Board, North Coast Region, (Regional Water Board) hasexpressed its intention to analyze the in-stream targets as 10-year rolling averages. In addition,the hillslope targets are specifically designed with variations in rainfall and peak flows in mind.
Also, the TMDL contains an implicit margin of safety in order to ensure that the allocations, whenachieved, will result in attainment of the applicable water quality criteria for sediment, given theuncertainties.

5
CHAPTER IINTRODUCTION
________________________________________________________________________
The Noyo River watershed (see Figure 1) is a forested, coastal watershed in Mendocino County,California, which encompasses approximately 113 square miles (72,323 acres) immediately westof Willits. The Noyo River flows through the coastal range and out to the Pacific Ocean at FortBragg. Its logging history dates back to 1853 when the first water-powered mill was built in thelower Noyo River. Old growth logging continued into the early part of the 20th century. Secondgrowth logging began in the 1960s, primarily in the lower main drainage area, and continuestoday. Removal of residual old-growth stands began in the 1960s and continued into the mid-1980s (M. Jameson pers. comm. w/ A. Mangelsdorf as reported in Regional Water Board, 1999). The California Western Railroad operates the Skunk Train that traverses the Noyo Riverwatershed along the mainstem channel. Other minor land uses found in the basin include ranchingand recreation.
The primary purpose of the Noyo River TMDL for sediment is to identify sediment loadingallocations that, when implemented, are expected to result in the attainment of the applicablewater quality criteria for sediment. These criteria are established in order to protect beneficialuses. The primary beneficial use of concern is the salmonid fishery, particularly the coho salmon(Oncorhynchus kisutch) fishery.
I.A. CHARACTERISTICS OF THE NOYO RIVER WATERSHED
The Noyo River watershed is unique to Mendocino County with respect to the large percent of itin public ownership. Approximately 19% of the basin is owned by the State of California andmanaged by the California Department of Forestry and Fire Protection (CDF) as a demonstrationforest. Other major owners in the basin include the Mendocino Redwood Company (primarily inthe upper watershed) and The Timber Company (primarily along the mainstem). There arenumerous other small and moderately-sized timber operations in the basin, as well as a cattleranch, summer camp, seasonal and year-round homes, the railroad, and miscellaneous activities.
I.B. APPLICATION OF SECTION 303(d) TO THE NOYO RIVER WATERSHED
The Noyo River watershed has been placed on the 303(d) list as required by Section 303(d) of theClean Water Act. This list describes water bodies that do not fully support all beneficial uses orare not meeting water quality objectives, and describes the pollutants for each water body thatlimit its use or prevent attainment of its water quality objectives. Water quality objectives andbeneficial uses are identified for all of the water bodies in the North Coast Region in the WaterQuality Control Plan for the North Coast Region (the Basin Plan). As required by Section303(d), pollutant loading allocations must be prepared for waterbodies on the 303(d) list. Asstated above, the Noyo River watershed was listed due to water quality problems related to


7
sedimentation. Sedimentation was determined to be impacting the cold water fishery, a beneficialuse of the Noyo River watershed, including the migration, spawning, reproduction, and earlydevelopment of cold water fish such as coho salmon and steelhead trout. Cold freshwater andestuarine habitats are also designated uses of the Noyo River watershed.
As discussed herein, management-related activities have contributed to an increase in sedimentdelivery to the Noyo River watershed above acceptable background levels. Existing salmonidhabitat is limited by various erosion-influenced factors, including infrequent and shallow pools,few backwater pools and other overwintering habitat, embedded cobble, and elevated fines inpotential spawning gravels. In addition, the limited availability of large woody debris in thechannels of Noyo River watershed contributes to the problems associated with sedimentation.
I.C. DATA SOURCES
The technical analysis which forms the basis for this TMDL was originally developed by theRegional Water Board, as part of a work-sharing agreement with EPA. Their report was signedand submitted to EPA on 23 August 1999 (Regional Water Board, 1999).
EPA and Regional Water Board staff conducted an assessment of existing data with contractorsupport from Graham Matthews and Associates through a subcontract with Tetra Tech, Inc. Data were provide by many sources. The primary sources of data were: the CaliforniaDepartment of Fish and Game (DFG), CDF, the Mendocino Redwood Company, and U.S.Geological Survey (USGS). DFG provided historic aquatic surveys. CDF provided TimberHarvest Plan (THP) data. The Mendocino Redwood Company provided fish distribution andaquatic habitat data. USGS provided stream flow and topographic data.
This TMDL is based on the best available information. Because of the limited precision of theanalyses and the limitations of implementation monitoring, allocations expressed as percentagereductions are rounded to the nearest 5%.
Chapter VIII includes a discussion of uncertainties associated with this TMDL and the margin ofsafety included in the analysis to ensure that the TMDL, when implemented, will attain applicablewater quality criteria for sediment.
I.D. COMPONENTS OF A TMDL
The requirements of a TMDL are described in 40 CFR 130.2 and 130.7 and Section 303(d) of theClean Water Act, as well as in various guidance documents (e.g., EPA, 1991). A TMDL isdefined as “the sum of the individual waste load allocations for point sources and load allocationsfor non-point sources and natural background” (40 CFR 130.2) such that the capacity

8
of the water body to assimilate pollutant loadings (i.e., the loading capacity) is not exceeded. That is:
TMDL = WLAs + LAs + NB
where WLAs = sum of the wasteload allocations, LAs = sum of the load allocations, andNB = natural background. A TMDL must include consideration of seasonal variations andinclude a margin of safety to address uncertainty in the analysis.
This TMDL includes: · Discussion of existing water quality requirements;· Problem statement;· Numeric targets;· Source analysis;· Linkage analysis;· Load allocations;· Discussion of the margin of safety and annual and seasonal variation;· Recommendations pertaining to implementation, monitoring, and the time frame associated
with implementation of the TMDL; and· Discussion of public participation.
The problem statement includes an assessment of existing in-stream and hillslope conditions. Thenumeric targets interpret water quality standards and provide indicators of watershed health. Thesource analysis includes an assessment of sources of sediment historically and/or presentlyimpacting water quality. The linkage analysis provides the basis for the magnitude of hillslopecontrols necessary to attain water quality standards and protect the beneficial uses. The loadallocation(s) are the assignment of sediment loads to land use activities in individual assessmentareas necessary to attain water quality standards and protect beneficial uses. The discussion of themargin of safety summarizes the qualitative and quantitative means by which the final loadallocations account for any uncertainty in the data or data analysis. Seasonal variation in erosionand sediment delivery requires consideration of seasonal effects in the implementation of the loadallocation(s). A discussion of recommendations for the future development of an implementationplan and monitoring plan is included, as well as a discussion of the schedule for implementing theTMDL. A discussion of public participation is also included.

9
CHAPTER IIEXISTING WATER QUALITY REQUIREMENTS
________________________________________________________________________
Existing water quality requirements are described in the Water Quality Control Plan, North CoastRegion-- Region 1 (Basin Plan). The Basin Plan describes the existing and potential beneficialuses of water in each of the watersheds throughout the North Coast Region. It also identifiesboth numeric and narrative water quality objectives, the attainment of which is intended to protectthe identified beneficial uses. Further, the Basin Plan includes implementation plans that describethe means by which specific water quality issues will be addressed by the Regional Water Board.
II.A. BENEFICIAL USES
The Basin Plan identifies municipal, industrial, and recreational uses of the Noyo River. Notably,the Noyo River is an industrial water supply and the municipal drinking water supply for the Cityof Fort Bragg. The cold water fishery, though, appears to be the most sensitive series ofbeneficial uses in the watershed. Accordingly, protection of these beneficial uses is presumed toprotect any of the other beneficial uses that might also be harmed by sedimentation.
In addition, the Basin Plan identifies the following existing beneficial uses that are related to theNoyo River’s cold water fishery:· Commercial and sport fishing (COMM);· Cold freshwater habitat (COLD);· Migration of aquatic organisms (MIGR);· Spawning, reproduction, and early development (SPWN); and· Estuarine habitat (EST).
The COMM beneficial use applies to water bodies in which commercial or sport fishing occurs orhistorically occurred for the collection of fish, shellfish, or other organisms, including, but notlimited to, the collection of organisms intended either for human consumption or bait purposes. The COLD beneficial use applies to water bodies that support or historically supported cold waterecosystems, including, but not limited to, the preservation or enhancement of aquatic habitats,vegetation, fish, or wildlife, including invertebrates. The MIGR beneficial use applies to waterbodies that support or historically supported the habitats necessary for migration or othertemporary activities by aquatic organisms, such as anadromous fish. The SPWN beneficial useapplies to water bodies that support or historically supported high quality aquatic habitats suitablefor the reproduction and early development of fish. The EST beneficial use applies to waterbodies that support or historically supported estuarine ecosystems, including, but not limited to,the preservation or enhancement of estuarine habitats, vegetation, fish, shellfish, or wildlife (e.g.,estuarine mammals, waterfowl, shorebirds).

10
II.B. WATER QUALITY OBJECTIVES
The Basin Plan establishes four water quality objectives pertaining to suspended material,settleable material, sediment, and turbidity.
“Waters shall not contain suspended material in concentrations that cause nuisance oradversely affect beneficial uses.”
“Waters shall not contain substances in concentrations that result in deposition of material thatcauses nuisance or adversely affect beneficial uses.”
“The suspended sediment load and suspended sediment discharge rate of surface waters shallnot be altered in such a manner as to cause nuisance or adversely affect beneficial uses.
“Turbidity shall not be increased more than 20 percent above naturally occurring backgroundlevels. Allowable zones of dilution within which higher percentages can be tolerated may bedefined for specific discharges upon the issuance of discharge permits or waiver thereof.”
In addition to the water quality objectives, the Basin Plan includes two discharge prohibitionsspecifically applicable to logging, construction and other associated activities. These are includedin the action plan for these activities.
“The discharge of soil, silt, bark, slash, sawdust, or other organic and earthen material fromany logging, construction or associated activity of whatever nature into any stream orwatercourse in the basin in quantities deleterious to fish, wildlife, or other beneficial uses isprohibited.”
“The placing or disposal of soil, silt, bark, slash, sawdust, or other organic and earthenmaterial from any logging, construction, or associated activity of whatever nature at locationswhere such material could pass into any stream or watercourse in the basin in quantities whichcould be deleterious to fish, wildlife, or other beneficial uses is prohibited.”

11
CHAPTER IIIPROBLEM STATEMENT
________________________________________________________________________
This chapter summarizes the life cycle of the coho salmon (Oncorhynchus kisutch), outlines thefreshwater habitat factors that influence the success of coho salmon, and discusses the data thatexist for the Noyo River watershed from which certain inferences can be made with respect to theproblems currently facing coho salmon. Conservative assumptions have been made regarding thefactors that are potentially limiting coho salmon in the basin to account for the limited amount ofinformation available. The discussion in Chapter IV (Numeric and Other Targets) is based on theproblems identified in this analysis. Should additional data be made available in the future thatimproves upon this analysis, the TMDL can be modified, including modifications to the numerictargets.
III.A. GENERAL BACKGROUND
Coho Salmon Life CycleSalmonids are anadromous fish that live part of their lives in freshwater and part in the ocean. The species of focus in this TMDL is the coho salmon (Oncorhynchus kisutch), which has beenlisted by the National Marine Fisheries Service as a threatened species along much of theCalifornia coast, including that in Mendocino County. Coho salmon generally return from theocean to spawn in fresh water at the age of three years. In California, this typically occurs duringthe months of December and January. Once eggs are laid and fertilized, the incubation periodusually lasts from 35 to 50 days. Coho fry emerge from their gravel nests from early March tomid-May. The fry first congregate along stream margins, in shallow pools, and in backwaters andeddies. They develop into parr (juveniles), eventually seek out deeper pools, and becomeaggressive and territorial. California coho generally remain in freshwater for one to two yearsbefore migrating to the ocean (CDF, 1994).
Sometime in April or May, when temperatures are rapidly warming, one- to two-year-old cohosalmon parr begin their migration downstream to the estuary where they undergo “smoltification.” Smoltification is the process of physiological transformations that will allow them to survive in thesaline environment of the ocean. The coho feed and grow in the ocean until they return to theirnatal stream for spawning (CDF, 1994).
Potentially Limiting FactorsAs described by CDF (1994), the success of salmonids depends on many factors, including:· Unimpeded access to spawning gravels;· Cool stream temperatures (i.e., 4.4 to 9.4 °C for spawning and 4.4 to 13.3 °C for embryo
incubation);· Adequate dissolved oxygen levels in the water column (>6.3 mg/l for spawning); · Availability of appropriately sized spawning gravels with few fines (i.e., < 5% fines for high
fry emergence, <15% fines to avoid a sharp drop-off in emergence success);

12
· Adequate dissolved oxygen levels in the redds ( 8 mg/l for high embryo survival and fryemergence);
· Adequate food (Young fish feed on drifting terrestrial and aquatic insects. Older fish also feedon other salmonid fry. Insect production is a function of substrate composition, riffles, andriparian vegetation.);
· Adequate cover as protection from predators; and· Protection from winter and spring freshets, including adequate availability of deep pools,
backwater pools, and in-stream and bank cover.
DFG has described a system for evaluating the quality of stream habitat, based on the ability ofthe habitat to provide shelter for fish (Flosi and Reynolds, 1994). They have determined thatstreams should have a shelter rating of at least 100 to provide adequate shelter for coho. Further,they suggest that good coho streams in California have 40% of their habitat length in primarypools. Primary pools are defined for 3rd and 4th order streams as those at least three feet deep.
Limitations in any of these factors can potentially limit the success of coho salmon. It should benoted, however, that in addition to freshwater habitat conditions, coho success also depends onocean conditions, climate, disease cycles, and other controllable and uncontrollable factors.
III.B. DESCRIPTION OF THE NOYO RIVER WATERSHED
The Noyo River watershed is a forested, coastal watershed in Mendocino County thatencompasses approximately 113 square miles (i.e., 72,323 acres) immediately west of Willitsflowing through the coastal range and out to the Pacific Ocean at Fort Bragg. It has been dividedinto subwatersheds for the purpose of reviewing and assessing in-stream and hillslope data (seeFigure 2). The four assessment areas are: Headwaters (HAA), North Fork Noyo River (NFAA),South Fork Noyo River (SFAA), and Mainstem Noyo River (MAA). MAA combines the MiddleNoyo and Lower Noyo Planning Watersheds, as defined by Matthews (1999).
The assessment area boundaries were chosen because: (1) they result in areas of roughly the samegeographic size; (2) they delineate hydrologic sub-basins; (3) they roughly delineate areas ofdiffering rainfall intensities; and (4) they have different land management histories.

14
Headwaters Assessment AreaHAA is composed of 17,390 acres or 27.17 mi2, including the CDF’s Planning Watershednumbers 113.20010, 113.20011, and 113.20012. It is located at the upper end of the basin,immediately west of the city of Willits, and includes the upper Noyo River, Olds Creek, McMullenCreek and Redwood Creek. It is primarily underlain by Coastal Belt Franciscan geology, thoughit also includes some Franciscan Melange at the upper end of the Noyo River main stem and OldsCreek. A thrust fault separates the Coastal Belt Franciscan from the Franciscan Melange. HAAcontains large translational/rotational slides and earth flows (DMG, 1984). The average annualrainfall is approximately 65 inches, which falls primarily between October and April (Matthews,1999). Mendocino Redwood Company is the largest landowner in HAA.
North Fork Noyo River Assessment AreaNFAA is composed of 16,045 acres or 25.07 mi2, including CDF’s Planning Watershed numbers113.20013, 113.20014, and a portion of 113.20015. It is located at the upper end of the basin,immediately northwest of the city of Willits, and includes the North Fork Noyo River, the MiddleFork of the North Fork Noyo River, Hayworth Creek, and the North Fork of Hayworth Creek. NFAA is primarily underlain by Coastal Belt Franciscan geology. Many of the tributaries to theNorth Fork Noyo River and Hayworth Creek have steep inner gorges. Similarly, the areasdrained by the upper reaches of nearly all the streams in this assessment area contain largetranslational/rotational slides, earth flows, and numerous debris slides (DMG, 1982). NFAA hasan average annual rainfall of approximately 65 inches, which falls primarily between October andApril (Matthews, 1999). Mendocino Redwood Company is the largest landowner in NFAA.
South Fork Noyo River Assessment AreaSFAA is composed of 17,575 acres or 27.46 mi2, including CDF’s Planning Watershed numbers113.20030, 113.20031, and 113.20033. It is located near the lower end of the basin, immediatelysoutheast of the city of Fort Bragg, and includes the South Fork Noyo River, Parlin Creek, theNorth Fork of the South Fork Noyo River, and Kass Creek. SFAA is primarily underlain byCoastal Belt Franciscan geology. Kass Creek, the North Fork of the South Fork and some of theSouth Fork Noyo River and Parlin Creek have steep inner gorges. The North Fork of the SouthFork Noyo River also has extensive debris slide amphitheaters, as do various small tributariesthroughout SFAA (DMG, 1982). SFAA has an average annual rainfall of approximately 50inches that fall primarily between October and April (Matthews, 1999). The State of California isthe largest landowner in SFAA (Jackson Demonstration State Forest).
Mainstem Noyo River Assessment AreaMAA is composed of 21,314 acres or 33.30 mi2, including CDF’s Planning Watershed numbers113.20015 (partial), 113.20020, 113.20021, and 113.20040. It is located in the middle of thebasin, between the cities of Fort Bragg to the west and Willits to the east. It is primarily underlainby Coastal Belt Franciscan geology, with the exception of Marine Terrace Deposits and BeachDeposits along the coast (DMG, 1983). Much of the Noyo River mainstem and its smallertributaries have steep inner gorges from Northspur (at the confluence of the North Fork NoyoRiver and the mainstem) to the west. Similarly, the upper reaches of nearly all the streams in theupper reaches of this assessment area contain large translational/rotational slides, earth flows,

1 Coho salmon have a predictable life cycle in which three-year old fish return to their natal streams to spawn (W.Jones pers. comm. w/ A. Mangelsdorf as reported in Regional Water Board, 1999). For example, a fish returningto the Noyo River in 1963 spawned fish that then returned in 1966. Thus, there are three separate cohopopulations represented by the data in Table 1.
15
and numerous debris slides, including reaches of the mainstem Noyo River (DMG, 1982). Theaverage annual rainfall ranges from 40 inches at the coast to 55 inches further inland (Matthews,1999). It falls primarily between October and April. MAA includes the mainstem Noyo River,Duffy Gulch, the Little North Fork Noyo River, and the lower estuary. The Timber Company isthe largest landowner in MAA.
III.C. SUMMARY OF FINDINGS FOR THE NOYO RIVER WATERSHED OVERALL
Salmonid AbundanceBrown et al. (1994) report that coho salmon previously occurred in as many as 582 Californiastreams from the Smith River near the Oregon border to the San Lorenzo River on the centralcoast. There are now probably less than 5,000 native coho salmon spawning in California eachyear, many in populations of less than 100 individuals. Coho populations today are probably lessthan 6% of what they were in the 1940s and there has been at least a 70% decline since the 1960s. Brown et al. (1994) conclude that the reasons for the decline of coho salmon in California include:stream alterations brought about by poor land-use practices and by the effects of periodic floodsand drought, the breakdown of genetic integrity of native stocks, introduced diseases, over-harvest, and climatic change.
There are no quantitative estimates of coho populations in the Noyo River watershed in the earlierpart of this century. Anecdotal information, however, indicates that the Noyo River once had athriving population of coho and steelhead (Brown et al., 1994). Coho salmon have since beenlisted by the National Marine Fisheries Service as a threatened species due to a steep decline intheir numbers. Evidence of continued, recent decline in their populations exists locally in the formof in-migrant fish trap data collected by DFG since 1963 at its egg-taking station on the SouthFork of the Noyo River (see Table 2). The average numbers of returning coho to this hatchery-influenced system prior to the drought of 1977 were 2,819; 2,669; and 2,132 for each of the threerespective populations.1 The numbers of returning coho subsequent to the 1993 droughtrepresent a decline of the pre-1977 numbers of 93%, 60%, and 27% for each of the threerespective populations (A. Grass pers. comm. w/ A. Mangelsdorf as reported in Regional WaterBoard, 1999).
Stream GradientsThe stream gradients (as well as the climate, geology and vegetation) in the Noyo Riverwatershed are appropriate for the development of aquatic habitat suitable for salmonids, includingcoho salmon. For example, CDF has calculated that there are approximately 104 miles of Class Istreams in the Noyo River watershed. Of these, 91 miles, or 88%, have gradients less than 5%,which is a gradient capable of supporting spawning and rearing for salmonids. There

17
are approximately 149 miles of Class II streams, some of which may be restorable fish-bearingstreams. (S. Lang pers. comm. w/ A. Mangelsdorf as reported in Regional Water Board, 1999)
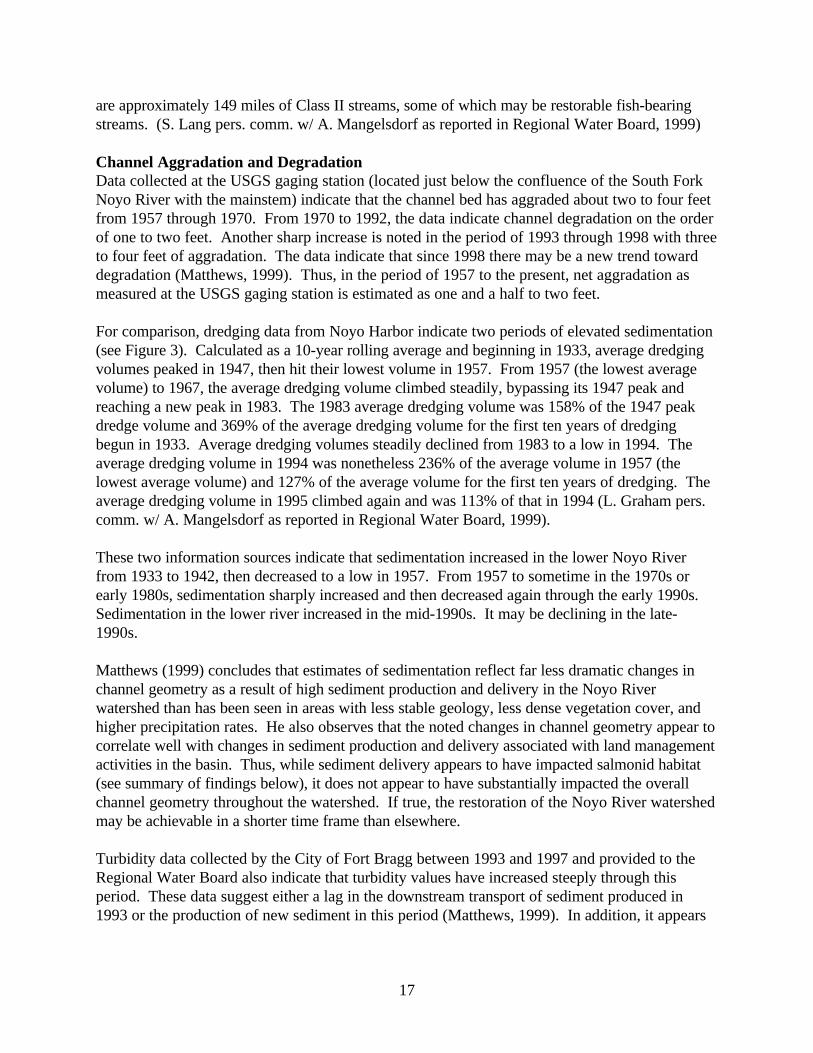
Channel Aggradation and DegradationData collected at the USGS gaging station (located just below the confluence of the South ForkNoyo River with the mainstem) indicate that the channel bed has aggraded about two to four feetfrom 1957 through 1970. From 1970 to 1992, the data indicate channel degradation on the orderof one to two feet. Another sharp increase is noted in the period of 1993 through 1998 with threeto four feet of aggradation. The data indicate that since 1998 there may be a new trend towarddegradation (Matthews, 1999). Thus, in the period of 1957 to the present, net aggradation asmeasured at the USGS gaging station is estimated as one and a half to two feet.
For comparison, dredging data from Noyo Harbor indicate two periods of elevated sedimentation(see Figure 3). Calculated as a 10-year rolling average and beginning in 1933, average dredgingvolumes peaked in 1947, then hit their lowest volume in 1957. From 1957 (the lowest averagevolume) to 1967, the average dredging volume climbed steadily, bypassing its 1947 peak andreaching a new peak in 1983. The 1983 average dredging volume was 158% of the 1947 peakdredge volume and 369% of the average dredging volume for the first ten years of dredgingbegun in 1933. Average dredging volumes steadily declined from 1983 to a low in 1994. Theaverage dredging volume in 1994 was nonetheless 236% of the average volume in 1957 (thelowest average volume) and 127% of the average volume for the first ten years of dredging. Theaverage dredging volume in 1995 climbed again and was 113% of that in 1994 (L. Graham pers.comm. w/ A. Mangelsdorf as reported in Regional Water Board, 1999).
These two information sources indicate that sedimentation increased in the lower Noyo Riverfrom 1933 to 1942, then decreased to a low in 1957. From 1957 to sometime in the 1970s orearly 1980s, sedimentation sharply increased and then decreased again through the early 1990s. Sedimentation in the lower river increased in the mid-1990s. It may be declining in the late-1990s.
Matthews (1999) concludes that estimates of sedimentation reflect far less dramatic changes inchannel geometry as a result of high sediment production and delivery in the Noyo Riverwatershed than has been seen in areas with less stable geology, less dense vegetation cover, andhigher precipitation rates. He also observes that the noted changes in channel geometry appear tocorrelate well with changes in sediment production and delivery associated with land managementactivities in the basin. Thus, while sediment delivery appears to have impacted salmonid habitat(see summary of findings below), it does not appear to have substantially impacted the overallchannel geometry throughout the watershed. If true, the restoration of the Noyo River watershedmay be achievable in a shorter time frame than elsewhere.
Turbidity data collected by the City of Fort Bragg between 1993 and 1997 and provided to theRegional Water Board also indicate that turbidity values have increased steeply through thisperiod. These data suggest either a lag in the downstream transport of sediment produced in1993 or the production of new sediment in this period (Matthews, 1999). In addition, it appears

19
that turbidity levels have periodically obscured visibility and have remained elevated even after thecessation of rain. This can adversely affect fish and drinking water quality.
III.D. SUMMARY OF FINDINGS IN THE HEADWATERS ASSESSMENT AREA
The primary data available for assessing in-stream conditions in the Headwaters Assessment Area(HAA) come from the Mendocino Redwood Company, including:· Fish distribution;· % pool by stream length surveyed;· % of all pools with residual depth 3 feet;· Shelter rating (using Flosi and Reynolds, 1994);· % embeddedness (using Flosi and Reynolds, 1994);· % fine sediment in gravel cores <0.85 mm and <6.3 mm in diameter (as dry weight);· Board feet of large woody debris per 100 m of stream; and· Amount of woody debris removed by DFG between 1959-1964.
The fish distribution data are augmented with data and estimates provided by DFG.
Fish AbundanceSteelhead trout are found throughout the Headwaters Assessment Area (HAA), includingeighteen sampling stations on: the Noyo River (three sites), unnamed tributaries to the NoyoRiver (three sites), Olds Creek (two sites), unnamed tributaries to Olds Creek (two sites),Redwood Creek (three sites), McMullen Creek (two sites), an unnamed tributary to McMullenCreek (one site), and Burbeck Creek (two sites) (Mendocino Redwood Company, unpublished). Coho have been found at eight of the eighteen stations sampled, including: two sites in the NoyoRiver, in three unnamed tributaries to the Noyo River, and all three sites in Redwood Creek (seeTable 3). The most abundant populations were found in Redwood Creek (Mendocino RedwoodCompany, unpublished; DFG, unpublished (a); DFG, unpublished (b)). Both coho and steelheadwere once more common in HAA (see Table 4). Redwood Creek may have been producing asmany as 3,700 coho and 1,500 steelhead in the 1960s (DFG, unpublished (b)).
Table 3: Summary of the Results of Fish Distribution Surveys in the Upper Noyo RiverWatershed, Conducted by Louisiana-Pacific Corporation (now Mendocino Redwood Company)from 1994 to 1996
Survey Site Location SurveySite No.
SurveyDate
SteelheadAge Class
SteelheadAbundance
Coho AgeClass
CohoAbundance
North Fork Noyo 70-6 7/27/94 0+, 1 yr, 2yr
>40 0+ <10
“ “ 6/13/95 0 10-40 NF NF“ “ 6/20/96 0 <10 0 <10Marble Gulch 70-7 7/24/96 0 <10 0 <10“ 70-8 7/24/96 0 <10 NF NF“ 70-9 7/23/96 0,1 <10 NF NFGulch 7 70-10 8/3/94 1 <10 NF NF“ “ 7/14/95 1 <10 NF NF“ “ 7/19/96 1 <10 NF NF

Survey Site Location SurveySite No.
SurveyDate
SteelheadAge Class
SteelheadAbundance
Coho AgeClass
CohoAbundance
20
Gulch 7 70-11 7/19/96 1 <10 NF NFHayworth Creek 70-12 7/27/94 0,1 10-40 1 <10“ “ 6/14/95 0 <10 NF NF“ “ 6/19/96 0,1,2 10-40 0 <10Trib to HayworthCreek
70-13 7/19/96 0,1 <10 NF NF
Hayworth Creek 70-14 6/19/96 0,1 10-40 0 10-40No. Fork HayworthCreek
70-15 8/3/94 0,1 10-40 NF NF
“ “ 6/14/95 0,1,2 <10 NF NF“ “ 6/19/96 0,1 <10 0 <10“ 70-16 8/3/94 1,2 <10 NF NF“ “ 6/14/95 0,1,2 10-40 NF NF“ “ 7/18/96 NF NF NF NF“ 70-17 7/27/96 NF NF NF NFHayworth Creek 70-18 8/3/94 0,1,2 10-40 NF NF“ “ 6/14/95 0 <10 NF NF“ “ 6/19/96 0,1,2 10-40 NF NF“ 70-19 8/4/94 0,1 10-40 NF NF“ “ 6/14/95 1 <10 NF NF“ “ 7/19/96 0,1,2 <10 NF NFTrib. to HayworthCreek
70-20 7/19/96 0,1,2 <10 NF NF
Hayworth Creek 70-21 7/19/96 0,1,2 <10 NF NFSoda Creek 70-22 8/4/94 1,2 <10 NF NF“ “ 8/3/95 0 <10 NF NF“ “ 7/19/96 0,1 <10 NF NF“ 70-23 7/19/96 NF NF NF NFNorth Fork Noyo 70-24 7/27/94 NF NF NF NF“ “ 6/14/95 0 10-40 NF NF“ “ 6/19/96 0,1 10-40 0 <10Middle Fork NorthFork Noyo
70-25 7/27/94 0,1 10-40 0 <10
“ “ 7/14/95 0,1,2 <10 NF NF“ “ 7/18/96 0,1 10-40 0 <10“ 70-26 8/4/94 0,1,2 10-40 0 <10“ “ 7/14/95 0,1 2 NF NF“ “ 7/18/96 0,1,2 10-40 NF NF“ 70-27 8/25/94 0,1 <10 NF NF“ 70-28 8/3/95 0,1,2 10-40 NF NF“ “ 7/23/96 0,1,2 10-40 NF NFNorth Fork Noyo 70-29 7/27/94 0,1 <10 NF NF“ “ 7/14/95 0,1 <10 NF NF“ “ 7/18/96 0,1,2 10-40 0 <10“ 70-30 7/27/94 0,1 10-40 NF NF“ “ 7/14/95 0,1,2 <10 NF NF“ “ 7/18/96 0,1,2 <10 NF NFDeWarren Creek 70-31 8/4/94 0,1 <10 NF NF“ “ 7/14/95 0,1 10-40 NF NF

Survey Site Location SurveySite No.
SurveyDate
SteelheadAge Class
SteelheadAbundance
Coho AgeClass
CohoAbundance
21
DeWarren Creek 70-31 7/18/96 0,1,2 10-40 NF NFTrib. to DeWarrenCreek
70-32 8/4/94 1 <10 NF NF
“ “ 7/14/95 0,1,2 10-40 NF NF“ “ 7/18/96 0,1 <10 NF NFDeWarren Creek 70-33 8/3/94 1,2 <10 NF NF“ “ 7/14/95 0,1,2 10-40 NF NF“ “ 7/18/96 1 <10 NF NFNoyo River 70-34 7/27/94 0,1,2 10-40 0 <10“ “ 6/13/95 0 10-40 NF NF“ “ 6/20/96 0,1 <10 0 <10Trib. to Noyo 70-35 7/25/96 0,1 10-40 0 <10Fork of trib. to Noyo 70-36 7/25/96 0,1,2 <10 0 <10Trib. to Noyo 70-37 7/25/96 0,1,2 <10 0 <10Olds Creek 70-38 7/24/96 0,1 10-40 NF NFTrib. to Olds Creek 70-39 7/25/96 0,1,2 <10 NF NFOlds Creek 70-41 7/25/96 0,1,2 >40 NF NFRedwood Creek 70-42 7/28/94 0,1 10-40 0 <10“ “ 7/14/95 0,1,2 10-40 0 10-40“ “ 6/5/96 0,1,2 <10 0,1 >40“ 70-43 7/28/94 0,1 <10 NF NF“ “ 7/14/95 0,1 <10 NF NF“ “ 7/22/96 0,1,2 <10 0 <10“ 70-44 7/28/94 1 <10 NF NF“ “ 7/14/95 0 <10 NF NF“ “ 7/22/96 0,1,2 10-40 0 <10McMullen Creek 70-45 7/28/94 0,1,2 10-40 NF NFTrib. to McMullen 70-46 7/14/95 0 <10 NF NF“ “ 7/22/96 0,1 <10 NF NFNoyo River 70-48 7/28/94 0,1 10-40 1 <10“ “ 6/13/95 0,1,2 10-40 NF NFBurbeck Creek 70-49 8/25/94 0,1,2 10-40 NF NF“ “ 7/14/95 0,1 10-40 NF NF“ “ 6/5/96 0,1 <10 NF NF“ 70-50 7/23/96 1 <10 NF NFNoyo River 70-51 8/25/94 0,1,2 <10 NF NF“ “ 6/13/95 0,2 10-40 0 <10“ “ 6/5/96 0,1 10-40 NF NF“ 70-52 7/23/96 0,1,2 >40 NF NF
NF = no fishShaded area = coho observations

22
Table 4: Summary of Salmonid Sitings Reported in Stream Surveys Conducted by theDepartment of Fish and Game in the 1950s and 1960s
Assess.Area
Location Observation
HAA Mainstem 1957: Steelhead and salmon noted throughout. Size and abundanceincreased farther up mainstem to headwaters. Past stocking noted atNorthspur and in reach between the confluence with Redwood Creek up toShake City.
Redwood Creek 1957: Numerous 1-4 inch fish1966: 112 salmon, 1.5-2.5 inches (avg. 2.25 inches) 496 steelhead, 1.5-7 inches (avg. 2 inches)Surveyor estimated stream producing about 3,700 silver salmon and 1,500steelhead trout. No known past stocking.
NFAA North Fork NoyoRiver
1957: 3-7 inch salmonids, not that numerous.1966: 112 coho (avg. 2.25 inches) 238 steelhead (avg. 2 inches). Surveyor estimated stream producing 11,200 coho and 23,800 steelhead.
Middle Fork ofNorth Fork NoyoRiver
1967: Abundant coho and steelhead (150 of each per 100 feet of stream). Steelhead average 1.5 inches and coho average 2 inches.
Hayworth Creek 1957: Fish up to 7 inches long above waterfall.1967: 117 coho (avg. 2.25 inches) 582 steelhead (avg. 2 inches)Surveyor estimated stream producing 2,340 coho and 11,600 steelhead.
SFAA South Fork NoyoRiver
1957: Steelhead and salmon “good”1959: Coho most abundant followed by steelhead and then stickleback. Coho 1-2.5 inches (avg. 2 inches). Steelhead 2-24 inches (avg. 2 inches). 1967: Observed silver salmon, steelhead and sticklebacks. Coho rangedfrom 2-4 inches. Steelhead ranged from 2-7 inches.
North Fork ofSouth Fork NoyoRiver
1957: Steelhead and coho 2-6 inches (avg. 2 inches). Abundant and in“good” condition.1959: Steelhead and coho 1-7 inches with 1-3 inch fish common.
Parlin Creek 1957: Steelhead and salmon 1-6 inches.1959: Coho and steelhead observed. Steelhead ranged from 2-7 inches (avg.2 inches) and coho ranged from 1-2 inches (avg. 1.5 inches).
Kass Creek 1957: Steelhead and coho 1-3 inches. Abundant and “good” success.1959: Coho and steelhead observed throughout creek.1966: 408 coho, 1.25-3 inches (avg. 1.75 inches) 0 steelheadSurveyor estimated stream producing 6,800 coho and no steelhead.
MAA Mainstem 1957: Steelhead and salmon observed with lengths ranging from 1-4 inches. Adult steelhead ranging in size from 14-30 inches observed several mileseast of estuary in February.

23
Table 5: Summary of In-stream Data Collected by Mendocino Redwood Company in the NoyoRiver Watershed
Stream Name Assess.Area
Segment
% poolsby streamlength
% pools> 3’
Shelterrating
% embed. Key LWD(bf/100m)
% fines<0.85 mm(mean)—as dryweight
Noyo HAA 1 42 81 27 25-50 0.5 7%North Fork Noyo NFAA 3 34 20 14 25-50 0.4 NRMarble Gulch NFAA 12 50 13 25 <25 0.9 NRMarble Gulch NFAA 23 NR NR NR NR NR 7%Gulch #7 NFAA 48 26 0 11 <25 0.0 NRNoyo HAA 56 38 16 55 <25 0.5 NROlds Creek HAA 57 23 31 34 <25 0.0 NRUnnamed trib HAA 63 37 0 30 <25 3.2 NRUnnamed trib HAA 64 2 0 25 <25 0.3 NRBurbeck Creek HAA 80 5 0 150 <25 5.6 NRRedwood Creek HAA 92 55 13 30 25-50 1.2 NRRedwood Creek HAA 92(2) 64 89 16 <25 0.0 NRHayworth Creek NFAA 104 63 59 93 <25 1.8 NRHayworth Creek NFAA 106 61 7 36 25-50 1.3 7%North ForkHayworth
NFAA 112 50 0 90 25-50 0.0 NR
Hayworth Creek NFAA 118 32 0 17 25-50 1.0 NRSoda Creek NFAA 119 31 0 25 <25 2.9 NRNorth Fork Noyo NFAA 152 79 21 39 <25 0.5 NRNorth Fork Noyo NFAA 152(2) 45 12 86 25-50 2.1 NRMiddle ForkNorth Fork Noyo
NFAA 153 34 0 15 <25 1.4 9%
Middle ForkNorth Fork Noyo
NFAA 153(2) 26 0 43 25-50 0.0 NR
Middle ForkNorth Fork Noyo
NFAA 156 70 0 34 <25 3.4 NR
North Fork Noyo NFAA 159 24 0 24 25-50 9.8 10%North Fork Noyo NFAA 159(2) 23 0 45 25-50 14.2 NRDeWarren Creek NFAA 161 39 9 53 >50 10.5 NR
Spawning HabitatEmbeddedness measurements and substrate composition data describe spawning habitatconditions in HAA (see Table 5). The Mendocino Redwood Company rates other spawninghabitat features (e.g., spawning gravel quantity), but they do not report actual measurements. There is one site on the Noyo River from which substrate composition data were collected. Embeddedness measurements were collected at two sites on the Noyo River, one site on OldsCreek, on two unnamed tributaries, one site on Burbeck Creek, and two sites on Redwood Creek.
The substrate composition data collected on the Noyo River were collected from one habitatreach, but from four separate pool tail-outs. The data indicate that fine sediment at all of the tail-outs in the 18-30 cm depth range is a higher proportion of the substrate core than may be

24
necessary to ensure adequate oxygenation and waste removal from redds. At one of the tail-outs,the fine sediment in the 0-18 cm range was also elevated.
The embeddedness data indicate that cobble in one of the sites on Redwood Creek and one of thesites on the Noyo River are 25 to 50% embedded. The others sites are less than 25% embedded. This data set is limited, but it suggests that coho may have difficulty digging redds in reaches ofthe Noyo River mainstem and Redwood Creek. Rearing HabitatRearing habitat is described by the percent of pools by stream length, the percent of all pools withresidual depth greater than or equal to three feet, and shelter rating. These data were collectedfrom two sites on the Noyo River, one site on Olds Creek, two unnamed tributaries, one site onBurbeck Creek, and two sites on Redwood Creek. Table 5 summarizes these data.
The “percent of pools by stream length” and “percent of all pools with residual depth 3 feet”were combined to determine the percent of pools with depths of at least three feet. Of the eightsites sampled, only one—on Redwood Creek—had numerous enough deep pools for cohorearing. Similarly, only one—on Burbeck Creek—had shelter well enough developed for cohorearing.
Overwintering HabitatOverwintering habitat provides protection to young coho from being washed out in winter andspring freshets. Such habitat includes backwater pools and large woody debris, other largeobstructions, and shelter. Large woody debris is also valuable for sediment metering, sedimentgrading, pool formation, and summer shelter. The Mendocino Redwood Company reports datawith respect to the removal of large woody debris between 1959 and 1964. It also reports theresults of a more recent large woody debris survey. There are no data with respect to the number,area or volume of backwater pool habitat in HAA. The Mendocino Redwood Company reportsthe percent of habitat units dominated by cobble or boulder as a factor relevant to overwintering.
According to the Mendocino Redwood Company, DFG removed from 1959 to 1964 a total of1,111,284 board feet (bf) of large woody debris from streams in HAA. This includes:· Burbeck Creek 67,800 bf; · Olds Creek 153,900 bf or 2,224 bf/100 m of stream;· Redwood Creek 590,244 bf or 7,053 bf/100 m of stream; and· McMullen Creek 299,340 bf or 6,889 bf/100 m of stream.
Current levels of large woody debris have been measured at two sites in the Noyo River, one sitein Olds Creek, two sites in Redwood Creek, one site in Burbeck Creek, and sites in twotributaries to the Noyo River. There are 1.8 bf/100 m of stream at each of the eight sites. Table5 summarizes these data.
Potential Limiting FactorsBased on the available data, the following appear to be potentially limiting factors in HAA:· Fine sediment intrusion of redds throughout HAA;

25
· Embedded spawning gravels in reaches of Redwood Creek and the Noyo River;· Few deep pools throughout HAA, except in reaches of Redwood Creek;· Poorly developed shelter throughout HAA, except in Burbeck Creek; and· Limited large woody debris throughout HAA.
Due to the lack of data regarding the backwater pool habitat, a conservative approach requiresthat backwater pools be considered a potentially limiting factor until further data can bedeveloped.
III.E. SUMMARY OF FINDINGS IN THE NORTH FORK NOYO RIVERASSESSMENT AREA
The primary data available for assessing in-stream conditions in the North Fork Noyo RiverAssessment Area (NFAA) come from the Mendocino Redwood Company (Mendocino RedwoodCompany), including:· Fish distribution;· % pool by stream length;· % of all pools with residual depth 3 feet;· Shelter rating;· % embeddedness;· % fine sediment in gravel cores <0.85 mm and <6.3 mm in diameter (as dry weight);· Board feet of large woody debris per 100 m of stream; and· Amount of woody debris removed by DFG between 1959-1964.
The fish distribution data are augmented with data and estimates provided by DFG.
Fish AbundanceSteelhead trout are found throughout NFAA, except in Soda Creek, as demonstrated by samplescollected at 28 stations located in: the North Fork Noyo River (four sites), Marble Gulch (threesites), Gulch 7 (two sites), Hayworth Creek (five sites), two unnamed tributaries to HayworthCreek (two sites), the North Fork of Hayworth Creek (three sites), Soda Creek (two sites), theMiddle Fork of the North Fork Noyo River (four sites), DeWarren Creek (two sites), and anunnamed tributary to DeWarren Creek (one site) (see Table 3). They were found in each yearbetween 1994 and 1996, except in 1996 at a station on the North Fork of Hayworth Creek (#70-16)—two rainbow trout were identified—and at a station on Soda Creek (#70-23). Coho salmonwere found at 10 of the 28 stations, and only sporadically over time. Coho were found in: theNorth Fork Noyo River, Marble Gulch, Hayworth Creek, the North Fork of Hayworth Creek, andthe Middle Fork of the North Fork Noyo River (Mendocino Redwood Company, unpublished).
Both coho and steelhead were once more common in NFAA (see Table 4). The North ForkNoyo River may have been producing as many as 11,200 coho salmon and 1,500 steelhead troutin the 1960s. Similarly, Hayworth Creek may have been producing as many as 2,340 coho and11,600 steelhead in this same time period (DFG, unpublished (c)).

26
Spawning HabitatEmbeddedness measurements and substrate composition data describe spawning habitatconditions in NFAA. The Mendocino Redwood Company rates other spawning habitat features(e.g., spawning gravel quantity), but they do not report actual measurements. Substratecomposition data were collected from three to four tail-outs within four streams, including:Hayworth Creek, the North Fork Noyo River, Marble Gulch, and the Middle Fork of the NorthFork Noyo River. Embeddedness measurements were collected at five sites on the North ForkNoyo River, one site on Marble Gulch, one site on Gulch #7, three sites on Hayworth Creek, onesite on North Fork Hayworth Creek, one site Soda Creek, three sites on the Middle Fork of theNorth Fork Noyo River, and one site on DeWarren Creek. Table 5 summarizes these data.
Of the fifteen substrate cores collected, only two were free of elevated fines: Tail-out #5 onHayworth Creek and Tail-out #5 on Marble Gulch. All the others had fines exceeding 14% wetvolume (an estimated 7% dry weight using Shirazi et al., 1981). The embeddedness data indicate that cobble in four of the five North Fork Noyo River sites are25 to 50% embedded, as are two of the three sites in Hayworth Creek, and one of the three sitesin the Middle Fork of the North Fork Noyo River. Cobble at the site on DeWarren Creek is morethan 50% embedded. This data set suggests that coho may have difficulty digging redds inreaches of the North Fork Noyo River, Hayworth Creek, the Middle Fork of the North ForkNoyo River, and DeWarren Creek. Rearing HabitatRearing habitat is described by: the percent of pools by stream length, the percent of all poolswith residual depth greater than or equal to three feet, and shelter rating. These data werecollected from the same sites from which embeddedness data were collected. Table 5 summarizesthese data.
The “percent of pools by stream length” and “percent of all pools with residual depth 3 feet”were combined to determine the percent of pools with depths of at least three feet. None of thesixteen sites sampled had numerous enough deep pools or well enough developed shelter for cohorearing.
Overwintering HabitatOverwintering habitat provides protection to young coho against being washed out in winter andspring freshets. Such habitat includes backwater pools and large woody debris, other largeobstructions, and shelter. Large woody debris is also valuable for sediment metering, sedimentgrading, pool formation, and summer shelter. The Mendocino Redwood Company reports datawith respect to the removal of large woody debris between 1959 and 1964. It also reports theresults of a more recent large woody debris survey. There are no data with respect to the number,area or volume of backwater pool habitat in NFAA. The Mendocino Redwood Company reportsthe percent of habitat units dominated by cobble or boulder as a factor relevant to overwintering.

27
According to the Mendocino Redwood Company, DFG removed from 1959 to 1964 a total of2,854,920 board feet of large woody debris from streams in NFAA. This includes:· North Fork Noyo River 18,000 bf or 135 bf/100 m of stream;· Hayworth Creek 2,232,480 bf or 23,512 bf/100 m of stream; and· Marble Gulch 604,440 bf.
Current levels of large woody debris have been measured at four sites on the North Fork NoyoRiver, three sites on Hayworth Creek, one site on Marble Gulch, one site on Gulch #7, three siteson the Middle Fork of the North Fork Noyo River, one site on DeWarren Creek, one site on theNorth Fork Hayworth Creek, and one site on Soda Creek. With the exception of these last three,there are less than six board feet of large woody debris per 100 meters at each of the sites inNFAA. The sites in DeWarren Creek, North Hayworth Creek and Soda Creek each have 15board feet of large woody debris per 100 meters of stream (see Table 5).
Potential Limiting FactorsBased on the available data, the following appear to be potentially limiting factors in NFAA:· Fine sediment intrusion of redds throughout NFAA except reaches in Hayworth Creek and
Marble Creek;· Embedded spawning gravels in reaches of North Fork Noyo River, Hayworth Creek, Middle
Fork of the North Fork Noyo River, and DeWarren Creek;· Few deep pools throughout NFAA;· Poorly developed shelter throughout NFAA; and· Poorly developed overwintering habitat throughout NFAA, including limited large woody
debris.
Due to the lack of information regarding backwater pool habitat, a conservative approach requiresthat backwater pools be considered a potentially limiting factor until further data can bedeveloped. The V-shaped valleys of NFAA may preclude the development of an abundance ofbackwater pool habitat in this region, however.
III.F. SUMMARY OF FINDINGS IN THE SOUTH FORK NOYO RIVERASSESSMENT AREA
The primary data available for assessing in-stream conditions in the South Fork Noyo RiverAssessment Area (SFAA) come from DFG, including:· Annual count of upstream migrants;· Pool frequency;· % of all pools with residual depth 2 feet and 3 feet;· Pool type;· Shelter rating; and· % embeddedness.
These data are augmented with the Mendocino Redwood Company’s estimates of large woodydebris removal between 1959-1964 and Knopp’s V* data from 1992 (Knopp, 1993).

28
Fish AbundanceCoho salmon raised in DFG hatcheries from eggs collected on the South Fork Noyo River havebeen released to the South Fork Noyo River since 1963 (A. Grass pers. comm. with A. Mangelsdorf as reported in Regional Water Board, 1999). As such, coho populations have beenhighly managed in SFAA. Returning coho fish counts are included in Table 2. Table 4 indicatesthat Kass Creek may have been producing as many as 6,800 coho in the 1960s (DFG, unpublished(d)). Steelhead trout and coho salmon have been found throughout SFAA during the 1980s andearly 1990s, including the North Fork of the South Fork Noyo River, the South Fork Noyo Riverand Kass Creek (see Table 6) (DFG, 1995(a) and (b); DFG, unpublished (d)).
Table 6: Summary of Aquatic Surveys Conducted by the Department of Fish and Game from1983 to 1989 in the Noyo River Watershed (Contained in DFG’s Biosample Database)
Stream Date Steelhead troutpopulations
Coho salmonpopulations
Shelter ratings
Density(fish/m2)
Biomass(kg/ha)
Density(fish/m2)
Biomass(kg/ha)
Turbu-lence
Instreamobject
Undercutbank
Veg.
Total
RedwoodCreek (HAA)
5/12/89 0.46 5.17 0.02 0.14 60 70 5 1 136
South ForkNoyo River(SFAA)
9/13/83 0.17 11.35 0.01 0.39 NR NR NR NR NR
South ForkNoyo River(SFAA)
9/12/86 NR NR NR NR 0 10 2 1 13
Kass Creek(SFAA)
10/4/83 0.42 6.85 0.28 9.10 NR NR NR NR NR
North ForkSouth ForkNoyo River(SFAA)
9/12/86 NR NR NR NR 1 10 25 1 37
Duffy Gulch(MAA)
6/25/86 0.88 9.50 NR NR 60 50 0 0 110
Little NorthFork NoyoRiver (MAA)
8/22/84 1.16 26.92 0.09 4.00 5 25 20 15 65
Spawning HabitatSpawning habitat conditions in SFAA are primarily described by embeddedness measurementscollected by DFG in habitat inventories conducted in the Parlin Creek watershed and South ForkNoyo River watershed.
In Parlin Creek, DFG measured the embeddedness of cobbles in 249 pool tail-outs. Of these pooltail-outs, 16% were less than 25% embedded, 49% were between 25-50% embedded, 28% werebetween 50-75% embedded, and 7% were more than 75% embedded. In three tributaries toParlin Creek, 11%, 29%, and 3% of the pool tail-outs, respectively, had cobble less than 25%embedded (DFG, 1995(b)). In the South Fork Noyo River, DFG measured the embeddedness ofcobbles in 351 pool tail-outs. Of these pool tail-outs, 29% were less than 25% embedded, 37%were between 25-50% embedded, 28% were between 50-75% embedded, and 6% were morethan 75% embedded. In two tributaries to the South Fork Noyo River, 22% and 3% of the pool

29
tail-outs had cobble less than 25% embedded (DFG, 1995(a)). These data indicate that coho mayhave difficulty digging redds in a majority of the pool tail-outs in SFAA.
Rearing HabitatRearing habitat conditions in SFAA are described by pool frequency, the percentage of poolsdeeper than three feet, and the shelter rating as collected by DFG in habitat inventories in ParlinCreek and the South Fork Noyo River.
In Parlin Creek, 45% of the habitat length inventoried (20,736 feet) were pool units, 31% wereflatwater, and 21% were riffle units. The mean pool depth was 1.0 foot. Approximately 12% ofthe pools had depths greater than or equal to three feet. Pool habitat types had a mean shelterrating of 24 and flatwater habitat had a mean shelter rating of seven. The main channel pools hadthe highest mean shelter rating at 30. Large woody debris (49%) followed by bedrock ledges(15%) and undercut banks (12%) dominated shelter in pools. DFG concluded that shelter wasgenerally lacking in complexity and extent. In the three tributaries to Parlin Creek, pools made up52%, 40% and 30% of the habitat units (5,036 feet) surveyed, respectively. No more than 18%,8%, and 8% of the pools in each tributary, respectively, had depths greater than two feet. Themean shelter ratings were 38, 42 and 33, respectively (DFG, 1995(b)). These data indicate thatthe infrequency of deep pools may be limiting coho rearing success in the Parlin Creek watershedas may the lack of adequate shelter.
In the South Fork Noyo River, 56% of the habitat length surveyed (49,762 feet) was in poolunits, while 32% were in flatwater and 12% in riffles. The mean pool depth was measured at 1.4feet. Approximately 32% of the pools had a maximum depth 3 feet. Pool habitat units had amean shelter rating of 21. Flatwater habitats had a mean shelter rating of 7. Undercut banks werethe dominant cover type (35%) followed by bedrock ledges (22%). DFG concluded that largeand small woody debris were lacking in nearly all habitat types. In two tributaries to the SouthFork Noyo River, pools made up 30% and 43% of the habitat units surveyed (2,922 feet). Nomore than 19% and 12% of the pools had maximum depths greater than 2 feet. The mean shelterratings for pools were 37 and 69 (DFG, 1995(a)). These data indicate that the infrequency ofdeep pools may be limiting coho rearing success in the South Fork Noyo River watershed as maythe lack of adequate shelter. The lack of large woody debris was particularly noted.
In a study of North Coast streams, Knopp collected, among other parameters, V* measurementsin the North Fork of the South Fork Noyo River, Parlin Creek and Kass Creek. V* is a measure,of the ratio of the volume of sediment filling a pool to the scoured volume of a pool, originallydeveloped by Lisle and Hilton (1992). A V* measurement of 0.50, therefore, indicates that 50%of the pool is filled with sediment. The sediment residing in pools is thought to be annuallymobile. V* measurements for the North Fork of the South Fork Noyo River, Parlin Creek andKass Creek were 0.35, 0.31, and 0.60, respectively (Knopp, 1993). Reference data werecollected from the North Fork Caspar Creek. The mean V* measurement there was 0.27. Thesedata indicate that pools in the North Fork of the South Fork Noyo River, Parlin Creek and KassCreek have excessive sediment filling them.

30
Overwintering HabitatOverwintering habitat provides protection to young coho from being washed out in winter andspring freshets. Such habitat includes backwater pools and large woody debris, other largeobstructions, and shelter. Large woody debris is also valuable for sediment metering, sedimentgrading, pool formation, and summer shelter. DFG reports backwater pool frequencies and meandepths. The Mendocino Redwood Company reports data with respect to the removal of largewoody debris between 1959 and 1964. There are no data with respect to current levels of largewoody debris in SFAA, with the exception of DFG’s observation that large woody debris islacking in the South Fork Noyo River (DFG, 1995(a)).
In Parlin Creek, backwater pools make up 7% of the pool units identified. The mean backwaterpool depth is 1.5 feet (DFG, 1995(b)). In the South Fork Noyo River, backwater pools make up5% of the pool units identified. The mean backwater pool depth is 1.4 feet (DFG, 1995(a)).
According to the Mendocino Redwood Company, DFG removed from 1959 to 1964 a total of132,024 board feet (or 2,413 bf/100 m of stream) of large woody debris in Kass Creek. Additional large woody debris is reported to have been removed in later years, as well (P.Cafferata pers. comm. w/ A. Mangelsdorf as reported in Regional Water Board, 1999).
Potential Limiting FactorsBased on the available data, the following appear to be potentially limiting factors in SFAA:· Embedded spawning gravels throughout SFAA;· Few deep pools throughout SFAA, including excessive filling by sediment;· Poorly developed shelter throughout SFAA; and· Infrequent backwater pools throughout SFAA.
Due to the lack of data regarding substrate composition and large woody debris, a conservativeapproach requires that these factors be considered potentially limiting, as well, until further datacan be developed.
III.G. SUMMARY OF FINDINGS IN THE MAINSTEM NOYO RIVER ASSESSMENTAREA
There is no primary data source for assessing in-stream conditions in the Mainstem Noyo RiverAssessment Area (MAA). Instead, individual pieces of data are combined from DFG, CDF, TheTimber Company, and the Mendocino Redwood Company. Data include:· Fish distribution (DFG and the Mendocino Redwood Company);· Pool frequency (DFG);· Mean pool depth (CDF);· Shelter rating (DFG);· Substrate composition (DFG and CDF); and· Large woody debris (CDF).
31
Salmonid AbundanceBurns of DFG studied conditions in the Little North Fork Noyo River before and after roadbuilding and logging in the late 1960s. Valentine and Jameson of CDF replicated elements ofBurns’ study in the early 1990s. With respect to salmonid abundance, Valentine and Jameson(1994) report that total salmonid biomass was similar between the two studies. The difference,however, was that steelhead trout made up 80% of the 1992 sample, but only 17% of the 1966-1969 samples (averaged).
W. Jones (DFG) has surveyed Duffy Gulch, the Little North Fork Noyo River, and the mainstemNoyo River at Matson Hole for the presence of coho salmon and steelhead trout. Steelhead troutwere observed at all three locations. Coho salmon were observed only in the Little North ForkNoyo River (see Table 6).
The Mendocino Redwood Company surveyed two locations on the Noyo River and locations ontwo unnamed tributaries to the Noyo River less than two miles above the gaging station in MAA. Steelhead were observed at all eight stations. Coho salmon were observed at three of the eightstations.
Spawning HabitatSpawning habitat conditions in MAA are primarily described by substrate composition datacollected in the Little North Fork Noyo River by Burns (1970) and Valentine and Jameson(1994).
Burns (1970) measured substrate composition using a McNeil-like core sampler before and afterroad building and logging in the late 1960s. Fine sediment < 0.8 mm in diameter was 20.0%(mean) of the total substrate sample (wet volume) in 1966 prior to the construction of a new roadfor logging second growth forest. In 1968, the mean was 31.0%. In 1969, the mean was 33.3%. For particles < 3.3 mm in diameter, the mean in 1968 was 42.1% and 44.4% in 1969. No datawere reported for particles < 3.3 mm in diameter in 1966. Valentine and Jameson (1994)reproduced Burns’ study and found that fine sediment <0.85 mm in diameter was 25.4% (mean)of the total substrate sample (wet volume) in 1992. These data indicate that fine sediment may betoo high a proportion of the substrate composition to ensure adequate oxygenation and wasteremoval from redds. They also indicate that the proportion of fine sediment in the substrate in1992 was lower than in 1968 and 1969, but higher than in 1960. The mechanism by which finesediment has been reduced since 1969, however, is unclear. It could be related to changes inmanagement practices. It could also be related to the difference in climatic regime represented bythe two study periods. For example, Burns conducted his study immediately after two large peakflows in Water Years 1965 and 1966 (the 2nd and 5th largest annual peak flows, respectively). Valentine and Jameson (1994), on the other hand, conducted their study at the tail end of adrought year.
Rearing HabitatRearing habitat conditions in MAA are described by pool frequency, mean pool depth, and shelterratings. Burns (1971) reported a pool frequency of 68% in the Little North Fork Noyo River in1966. Valentine and Jameson (1994) report a mean pool depth of 1.4 feet as measured

32
in 1992. Jones (DFG, unpublished (a)) reports a pool frequency in the Little North Fork NoyoRiver of 50% as measured in 1984 and in Duffy Gulch of 5% as measured in 1986. He alsoreports shelter ratings for the Little North Fork Noyo River and Duffy Gulch of 65 and 110,respectively. These data are limited, particularly in that data for all the parameters were notcollected in all of the studies, but they indicate that the frequency of deep pools in the Little NorthFork Noyo River may be limiting the rearing success of coho salmon as may poor shelter. Thefrequency of pools of any sort in Duffy Gulch also may be limiting the rearing success of cohosalmon.
Overwintering HabitatOverwintering habitat provides protection to young coho from being washed out in winter andspring freshets. Such habitat includes backwater pools and large woody debris, other largeobstructions, and shelter. Large woody debris is also valuable for sediment metering, sedimentgrading, pool formation, and summer shelter. The Mendocino Redwood Company reports datawith respect to the removal of large woody debris between 1959 and 1964. Valentine andJameson (1994) report large woody debris volumes and site lengths in the Little North Fork NoyoRiver. There are no data with respect to the availability of backwater pools in MAA.
According to the Mendocino Redwood Company, a total of 563,460 board feet of large woodydebris was removed from MAA in the period of 1959 to 1964: · Little North Fork Noyo River 201,420 bf or 2,503 bf/100 m of stream; and· Duffy Gulch 362,040 bf.
In 1992, Valentine and Jameson (1994) measured 89 m3 of large woody debris in 518 m of streamin the Little North Fork Noyo River (e.g., 17 m3/100m or 7208 bd ft/100m, where 1 m3 = 424board feet).
Potential Limiting FactorsBased on the available data, the following appear to be potentially limiting factors in MAA:· Fine sediment intrusion of redds in the Little North Fork Noyo River, and throughout MAA;· Few deep pools throughout MAA; and· Poorly developed shelter in the Little North Fork Noyo River and throughout MAA (except
Duffy Gulch).
Due to the limited availability of data regarding substrate composition, embeddedness, backwaterpools, and large woody debris throughout MAA (except the Little North Fork Noyo River), aconservative approach requires that these factors be considered potentially limiting throughoutMAA, until further data can be developed.
III.H. RELEVANT FINDINGS IN THE CASPAR CREEK WATERSHED
Long-term studies have been conducted in the Caspar Creek watershed, immediately south of theNoyo River watershed. Caspar Creek is similar in many respects to the coastal sub-basins of theNoyo River watershed, such as the South Fork Noyo River. In addition, Caspar Creek, the South
33
Fork Noyo River, and portions of the Big River now comprise the Jackson Demonstration StateForest, owned by the State of California and managed by CDF. Thus, there are similarities in themanagement practices that have been employed over time. A summary of relevant findings fromthe Caspar Creek watershed is provided here so as to highlight additional issues, beyond thepotential limiting factors identified above, that should be considered in the Noyo River watershed. These issues, where not addressed as numeric targets or load allocations, should be considered inthe development of a TMDL implementation plan.
The Caspar Creek watershed has been the subject of paired watershed studies in the 1960s and1970s. The South Fork Caspar Creek was roaded and selectively logged and tractor yarded in thelate 1960s and early 1970s. Hillslope and in-stream measurements in the South Fork CasparCreek were compared to those for the unlogged second-growth forest in the North Fork CasparCreek watershed. The North Fork Caspar Creek was clear-cut in patches and cable and tractoryarded in the late 1980s and early 1990s. Comparisons between pre-Forest Practices Act loggingand post-Forest Practices Act logging have since been made (Lewis, 1998).
Several relevant issues are illuminated by the Caspar Creek studies.· Activities which increase peak flows or decrease the stability of the armor layer may elevate
the risk of poor ova survival (Lisle, 1989).· Cable yarding substantially reduces the risk of immediate landsliding as well as post-harvest
landsliding (Cafferata and Spittler, 1998).· Suspended sediment loads increase after road building and logging but return to normal levels
after seven years of rest (Lewis, 1998).· There is a statistically significant, positive relationship between ground disturbance and
suspended sediment (Lewis, 1998; J. Lewis pers. comm. w/ A. Mangelsdorf as reported inRegional Water Board, 1999).
· Suspended sediment discharges resulting from pre-Forest Practices Act logging are an averageof three times greater than those resulting from post-Forest Practices Act logging when nomore than 50% of the basin is logged and cable yarding is used on at least 80% of the harvestarea (Lewis, 1998).
· Post-Forest Practices Act-related excess sediment loads are mostly related to increases instorm flow volumes. Reductions may be achieved by reducing or preventing disturbance tosmall drainage channels (Lewis, 1998).
· Peak flows, except those during very large storms, and annual runoff increase as a result oflogging. Clear-cutting causes greater such increases than selective harvest. These effectssubside within 15 years of rest as the trees re-grow (Ziemer, 1998).
· Deep pools are important to salmonid success in small, low-gradient streams where waterdepth and habitat complexity are otherwise reduced (Harvey and Nakamoto, 1996).
· The presence of juvenile steelhead has a negative effect on the growth of 0+ coho salmonwhich may have population-level ramifications. When the species are found together, cohooccupy the middle of pools whereas steelhead are more widely distributed. The availability oflarge pools, then, is vital to coho successful competition (Harvey and Nakamoto, 1996).
· While windthrow and bank erosion are the most common known sources of large woodydebris to the channel, unknown sources are responsible for the largest percentage of notedlarge woody debris (O’Connor and Ziemer, 1989; Surfleet and Ziemer, 1996).

34
Studies conducted in the Caspar Creek watershed, therefore, suggest that when the RegionalWater Board develops an implementation plan for the Noyo River TMDL, they should considerincluding measures to reduce clear-cutting, increase cable yarding, increase periods of restbetween harvests, reduce overall ground disturbance, and reduce or prevent disturbance in smalldrainages.
35
CHAPTER IVNUMERIC AND OTHER TARGETS
________________________________________________________________________
Numeric targets interpret water quality objectives, provide indicators of watershed health, andrepresent habitat conditions adequate for the success of salmonids. The water quality objectivesof concern, as noted in Chapter II (Existing Water Quality Requirements), are narrative standardsfor suspended material, settleable material, sediment, and turbidity. In addition, two prohibitionson sediment discharge from logging, construction and related activities further define waterquality-related requirements. Indicators allow resource managers and others to assess the degreeto which positive changes are occurring in the watershed that, over time, will result in a greaterabundance and quality of habitat necessary to support the cold water fishery.
A TMDL is intended to result in attainment of water quality suitable to support beneficial uses. To this end, it is necessary to monitor in-stream parameters to determine if water quality is in factimproving over time. Many in-stream parameters, identified in the scientific literature as criticalto coho success, vary as a result of both natural and anthropogenic changes. Thus, using in-stream parameters as a means of quantifying the benefits to water quality that are derived fromchanges in hillslope management practices is difficult. Hillslope targets define watershedconditions which are associated with well-functioning watersheds which are needed to protectwater quality and assist in assessment of sediment control. Thus, both in-stream and hillslopetargets are identified for the Noyo River watershed.
Although the Noyo River watershed was included on the 303(d) list for sedimentation and itsthreat to water quality and the salmonid fishery, many factors affect salmonid populations. Inparticular, the amount, type, size and placement of large woody debris in the watercourse and thetiming, rate and duration of water flow are other watershed processes which interact withsediment to affect salmonid habitat. California coastal streams are especially dependent on thepresence of large woody debris to provide ecological functions, such as sediment metering,sediment grading, pool formation, and shelter. Therefore, a numeric target for large woody debrisis identified for the Noyo River watershed.
IV.A. SUMMARY OF NUMERIC AND OTHER TARGETS
Table 7 summarizes the in-stream numeric targets. The in-stream numeric targets are developedfor parameters identified in Chapter III (Problem Statement) as potentially limiting the success ofcoho salmon. The turbidity, % fines <0.85 mm, and embeddedness targets are intended to reflectthe likely impacts due to elevated sediment delivery, particularly sediment from roads. The poolfrequency/depth, backwater pools, and large woody debris targets are intended to reflect the likelyimpacts due to elevated sediment delivery, particularly in conjunction with limited large woodydebris recruitment. The thalweg profile target is intended to reflect more general changes inchannel complexity as they relate to the interaction of sediment delivery, large woody debrisrecruitment, and flow.

36
Table 7: Summary of Numeric TargetsParameter Target Reference(s)Turbidity No greater than 20% above background Basin Plan, 1994; Reid, 1999% fines <0.85 mm 14% (mean) as wet volume Burns, 1970; CDF, 1994Embeddedness Increasing percentage of riffle habitat units
which are less than 25% embeddedFlosi and Reynolds, 1994; DFG,1995 (a) and (b)
Pool frequency/depth 40% of habitat length in pools greater than 3feet in depth at low flow in third and higherorder streams
Flosi and Reynolds, 1994; G. Flosipers. comm. w/ A. Mangelsdorf asreported in Regional Water Board,1999
Backwater pools Increasing percentage of backwater pools perhabitat length
Deitrich, 1998
V* 0.27 Knopp, 1993Large woody debris Increase in the number and total volume of key
pieces of large woody debris per stream lengthBilby and Ward 1989; Beechie andSibley 1997; USDA, 1994
Thalweg profile Increasing variation in the thalweg elevationaround the mean thalweg profile slope
Trush, 1999; Madej, 1999
Table 8 summarizes the hillslope targets established to define watershed conditions needed toprotect water quality. Hillslope targets are developed for management-related parametersidentified in Chapter III (Problem Statement) that are important to the delivery of sediment to awatercourse. The stream crossing targets are intended to focus on road-related sediment delivery,particularly sediment delivery that is highly controllable. The hydrologic connectivity target isintended to focus on the problem of an expanded channel network, particularly the accompanyingissues of elevated sediment (as scour) and flow. The disturbed area target is intended to focus onthe problem of increased erosion and flow potential accompanying unvegetated and/or
Table 8: Summary of Other TargetsParameter Target Reference(s)Stream crossing withdiversion potential
1% of all stream crossings, as a result of a stormwith a 100 year recurrence interval or less
Weaver and Hagans, 1994; D.Hagans pers. comm. w/ A.Mangelsdorf as reported inRegional Water Board, 1999
Stream crossing withsignificant crossingfailure potential
1% of all stream crossings, as a result of a stormwith a 100 year recurrence interval or less
Flanagan et al., 1998
Hydrologicconnectivity
Decrease in the miles of road (including railroad)hydrologically connected to a watercourse
Ziemer, 1998; Furniss, 1999
Disturbed area Decrease in the area disturbed by facilities* Lewis, 1998Activity in unstableareas
No activities (e.g., roads, harvest, yarding, etc.) inunstable areas (e.g., steep slopes, headwall swales,inner gorges, stream banks, etc.) unless a detailedgeological assessment is performed that shows thereis no potential for increased sediment delivery to awatercourse as a result.
Dietrich et al., 1998; Weaverand Hagans, 1994; Pitlick,1982; PWA, 1998.
*A facility is defined as any management-related structure such as a road, railroad roadbed, skid trail, landing,harvest unit, or agricultural field (e.g., pasture, vineyard, orchard, row crops). For the purpose of this target, aharvest unit or agricultural field that retains its natural characteristics with respect to rainfall interception, rainfallinfiltration, and soil protection, is not considered a “facility.”
37
compacted soil surfaces. The unstable area target is intended to focus on the problem of theincreased risk of erosion and sediment delivery that is likely from unstable areas.
IV.B. DISCUSSION OF NUMERIC AND OTHER TARGETS
What follows is a brief discussion of each of the targets summarized above. Chapter III (ProblemStatement) provides the data or data references from which these numeric targets were chosen. Several of the targets are expected to be sensitive to the type of channel, especially channel slopeand the preceding rainfall patterns. Therefore, the target should be used within an analysis of thepreceding hydrological conditions and channel type.
TurbidityThe turbidity data collected in the lower Noyo River by the City of Fort Bragg from 1992 to thepresent indicate that the turbidity occasionally obscures visibility and remains elevated even oncerainfall has ceased. As described in Chapter III (Problem Statement), Matthews (1999) concludesthat turbidity values have increased steeply in recent years. No study has yet been conducted bywhich the natural background levels of turbidity have been determined. Accordingly, it is difficultto determine the degree to which the existing water quality objective for turbidity has beenexceeded. To better ensure a thorough evaluation of this matter, the numeric target for turbidityis simply a reiteration of the water quality objective for turbidity, as described in the Basin Plan. Future monitoring for turbidity should be able to assist in identifying tributary watershedsrequiring immediate hillslope erosion control.
Percent FinesMcNeil samples were collected at several locations throughout NFAA and HAA, as well as in theLittle North Fork Noyo River. Valentine and Jameson (1994) demonstrated a positive curvilinearrelationship between coho biomass and percent fines in the Little North Fork. In addition, theFredle Index calculation predicted a range of 0-80% coho survival-to-emergence as a function ofparticle size.
Burns (1970) developed substrate composition data for the Little North Fork Noyo River, theSouth Fork Caspar Creek, and North Fork Caspar Creek prior to second growth logging and roadbuilding. In the Little North Fork Noyo River, 27 samples were collected in 1966. In the SouthFork Caspar Creek, 20 samples were collected in 1967. In the North Fork Caspar Creek, 100samples were collected between 1967 and 1969. The mean percentage of particles <0.8 mm indiameter in each year and in each stream ranged from 17.5% (as calculated from data collected in1967 from North Fork Caspar Creek) to 23.2% (as calculated from data collected in 1969 fromNorth Fork Caspar Creek). The mean of all years and all streams is 19.4%.
Burns (1970) began his study in October 1966 following the second largest annual peak flow inthe Noyo River in December 1964 and the fifth largest in January 1966. These flows haverecurrence intervals of 24 and 10 years, respectively. With respect to annual runoff, Water Years1965 and 1969 were the 7th and 11th wettest years of record. With respect to magnitude andduration, Water Years 1965, 1966 and 1969 were the 2nd, 12th, and 16th wettest years of record,

38
respectively. With respect to annual precipitation, Water Year 1969 was wetter than either 1965or 1966 with a rainfall of 66 inches in Willits (compared to a 50-inch mean) and 51 inches in FortBragg (compared to a 39-inch mean). The highest ranked storm of record with respect to 1-dayprecipitation intensity occurred in Water Year 1965 with 8.8 inches of rain in Willits. Indeed, aquarter of the 20 most intense 1-day precipitation events in Willits occurred in the 1960s, agreater proportion than in any other decade of the 120-year record (Matthews, 1999).
There is uncertainty regarding the degree to which the mean of Burns’ pre-logging and controlstream data from the 1966 to 1969 represent a reasonable target for the protection of cohosalmon today. Indeed, CDF (1994) reports that, in all other studies on this matter, emergence ofcoho fry was high at < 5% fines but dropped sharply at 15% fines. For this TMDL, aconservative target of 14% fines <0.85 mm is established so as to maximize the potential forcoho fry emergence.
Burns’ Caspar Creek and Little North Fork Noyo River data appear to represent sedimentconditions resulting from unusually inclement weather conditions and elevated sediment delivery. Accordingly, it cannot be used as a mean target level across the range of possible rainfall and flowevents. Since it was collected prior to second growth logging activities, however, it provides arealistic snapshot of background conditions resulting from a particular series of events. As such,analysis of substrate composition data in the future should take into account rainfall, flow, andsediment delivery preceding and during data collection. A mean stream reach value that exceeds14% but not 19% fines < 0.85 mm, for example, might represent adequate water quality if thedata were collected following a large storm (e.g., 20-year event) or a series of moderately largestorms (e.g., 10-year events).
Cobble EmbeddednessExcessive cobble embeddedness was noted as an issue at several sampling locations in the NoyoRiver watershed. DFG generally looks for embeddedness measurements of less than 25% as anindicator of unembedded substrate (DFG, 1995 (a) and (b)). Unembedded substrate is necessaryfor the building of salmonid redds.
Current research appears insufficient to determine the number or area of riffles that must beunembedded to provide adequate potential spawning habitat. As such, the embeddedness targetrequires an increasing trend in the number of riffle habitat units that are less than 25% embedded.
Pool Frequency/DepthHabitat data in HAA, NFAA, SFAA, and MAA all indicate that pool frequency and/or pool depthmay be factors limiting the success of salmonids. Deep and frequent pools are necessary assummer rearing habitat, particularly for coho salmon, which are less able than steelhead trout tocompete for food supplies in the absence of deep pools (Harvey and Nakamoto, 1996).
Flosi and Reynolds (1994, p. V-12) report that:
“DFG habitat typing data indicate that the better coastal coho streams may have as muchas 50 percent of their total habitat length in primary pools. In first and second orderstreams a primary pool is defined to have a maximum depth of at least two feet, occupy at

39
least half the width of the low-flow channel, and be as long as the low-flow channel width. In third and fourth order streams the criteria is the same, except maximum depth must beat least three feet.”
Habitat typing data collected since 1993 indicates that better coho streams in California mayrather have about 40 percent of their total habitat length in primary pools (G. Flosi pers. comm.w/ A. Mangelsdorf as reported in Regional Water Board, 1999). Thus, the numeric targetrequires that 40% of total habitat length be at least three feet in depth at low flow in third andhigher order streams. This target applies in streams with pool/riffle morphology.
Backwater PoolsThe availability of overwintering habitat may be an important factor limiting the success ofsalmonids in the watershed. To the degree that large woody debris is important to the formationof adequate overwintering habitat, such habitat is almost certainly lacking. Specific data, such as abundance of backwater pools, are not currently available. A conservative approach requires thatbackwater pools be considered a potentially limiting factor until further data can be developed.
Backwater pools are generally formed by boulders, root wads or logs (Flosi and Reynolds, 1994). As these channel roughness elements are removed or buried by sediment, the habitat becomes lessdiverse, including the loss of backwater pools. Dietrich (1998) identified the condition of thefloodplain, particularly with respect to the availability of backwater pools, as critical to thesuccess of coho salmon in California, in a letter to the Regional Water Board commenting on theproposed TMDL for sediment in the Garcia River. There does not appear to have been sufficientresearch on overwintering habitat, however, to identify a specific number of backwater pools, forexample, that is necessary for coho success. Therefore, the numeric target for the Noyo RiverTMDL is simply an increasing trend in the number of backwater pools per habitat length.
This target will only apply where the channel morphology otherwise supports development ofbackwater pools. In steep, V-shaped valleys with little floodplain connection, such as found intributaries in NFAA for example, a significant number of backwater pools would not be expectedas a part of the natural array of habitat units. In such regions, the large woody debris and thalwegprofile targets are presumed to adequately address the issue of overwintering habitat.
V*V* is a measure of the fraction of a pool’s volume that is filled by fine sediment and represents thein-channel supply of mobile bedload sediment (Lisle and Hilton, 1992). A study conducted onover 60 streams representing different levels of disturbance in the North Coast found that a meanV* value of 0.21 (21%) represented good stream conditions (Knopp, 1993). Sample sites for thisstudy were located in Franciscan geology.
The data available in the Noyo River watershed indicate that pool depth and frequency are factorslimiting success of salmonids throughout the basin. Chapter V (Source Analysis) indicates thatexcessive fine sediment is delivered due to surface erosion throughout the basin, as well. Theexisting V* data include samples in the North Fork of the South Fork Noyo River, Parlin Creek,and Kass Creek. All Noyo River watershed V* data indicate excessive filling of pools by fines.

40
One of the control streams studied by Knopp (1993) was the North Fork Caspar Creek. Themean V* value in this stream was 0.27. As a general matter, numeric targets developed fromlocal reference streams are preferable to those derived from the literature or from distantreference streams. Accordingly, the numeric target established for V* is 0.27 even though it ishigher (29% higher) than the coast-wide mean for control streams.
Large Woody DebrisLarge pieces of woody debris in streams influence the physical form of the channel, the movementof sediment, the retention of organic matter and the composition of the biological community(Bilby and Ward, 1989). According to Bilby and Ward (1989) debris can be instrumental informing and stabilizing gravel bars (Lisle, 1986) or in accumulating fine sediment (Zimmerman etal., 1967; Megahan, 1982). Debris also can form pools by directing or concentrating flow in thestream in such a way that the bank or bed is scoured or by impounding water upstream from theobstruction (Lisle and Kelsey, 1982). Large woody debris plays a more significant role in routingsediment in small streams than in large ones (Bilby and Ward, 1989).
A large woody debris survey is conducted by counting and measuring the number and volume ofwoody debris pieces that meet certain criteria regarding size, location and orientation and arefound within representative reaches of stream. Data collected in the Noyo River watershedindicate that large woody debris is generally lacking throughout the watershed. In the 1960'sDFG began an aggressive campaign to remove log jams that were potentially blocking themigration of anadromous fish to upstream spawning grounds. They apparently removed a total of4,661,688 board feet of woody debris from the Noyo River watershed in the period of 1959 to1964 (Mendocino Redwood Company, unpublished). Undocumented amounts of large woodydebris continued to be removed up through the 1980s (P. Cafferata pers. comm. w/ A.Mangelsdorf as reported in Regional Water Board, 1999).
A comparison of data from the 1960s to that of the 1990s indicates in the North Fork NoyoRiver, for example, 135 board feet of large woody debris per 100 meters of stream was removedbetween 1959 and 1964 while somewhere between 0.4 and 14.2 board feet/100 meters existsthere now. In Hayworth Creek, 23,512 board feet/100 meter was removed in the period of 1959to 1964 while no more than 1.8 board feet/100 meters exists now.
Large woody debris, like sediment, is delivered to a stream and transported through the system. It either moves through the channel network, decays in place, or moves intermittently in and outof short and/or long-term storage on the floodplain or in the stream channel until it decays. Itsrouting is much more difficult to predict than sediment because of the immense variation in sizeand composition. The degree to which large woody debris influences sediment routing, however,makes it an important factor.
The numeric target for large woody debris calls for an increase in the number and volume of keylarge woody debris pieces in those locations where the lack of large woody debris is currentlylimiting salmonid success. The definition of a key piece of large woody debris is based on thedebris’ diameter and length, but varies by stream width.

41
Thalweg ProfileThe thalweg profile is a profile, measured parallel to stream flow, of the lowest elevation of eachof many channel cross sections. As a stream descends from its headwaters to its mouth, the meanthalweg profile slope also descends. As the number of pieces and volume of large woody debrisincreases as well as the number and depth of pools, the thalweg profile develops more dramaticvariation around the mean profile slope, which generally indicates better habitat conditions.
The availability of large woody debris and deep pools appear to be two of the main factorslimiting the success of salmonids in the Noyo River watershed. The techniques proposed by theForest, Fish and Farm Committee at its 1999 Workshop (“Using Stream GeomorphicCharacteristics as a Long-term Monitoring Tool to Assess Watershed Function) include themeasurement of the channel thalweg to determine the variation around the mean thalweg profileslope. Not enough research appears to have been conducted to establish a specific number thatreflects a satisfactory degree of variation. Therefore, the numeric target is simply an increasingtrend in variation from the mean thalweg profile slope.
Stream Diversion Potential and Stream Crossing FailuresTruck roads, skid roads, and railroad roads generally cross ephemeral or perennial streams. Stream crossing structures are built to capture the stream flow and safely convey it through oraround the roadbed. The Forest Practice Rules (CDF, 1997) require that: (1) the number ofwatercourse crossings be minimized; (2) crossing structures allow for unrestricted passage of fish,where fish are present; (3) crossings be constructed or maintained to prevent the diversion ofstream overflow down the road; (4) crossings be constructed to allow a 50-year flood event pass;and (5) trash racks be installed to prevent debris from reducing the flow capacity of the crossingstructure.
There is no existing data in the Noyo River watershed regarding the current rate of streamdiversions or stream crossing failures or the contributions of sediment to the watercourse fromthese processes. In other North Coast basins (Rolling Brook, a tributary of the Garcia River, andRedwood Creek in Redwood National Park), sediment from stream diversions and other sourcesassociated with haul road and skid trail crossings have been estimated to contribute from 25-38%of the overall sediment budget. As such, this sediment process is likely to be a significantcomponent of the Noyo River watershed sediment budget as well.
Diversion potential is the potential for a road to divert water from its intended drainage systemacross or through the road fill thereby delivering road-related sediment to a watercourse. Asdescribed in the South Fork Trinity TMDL (EPA, 1998), the potential delivery of sediment to awatercourse can be eliminated from almost all potential road diversions by identifying andcorrecting sites with diversion potential. Correction measures include eliminating inboard ditches,outsloping roads, and/or installing rolling dips at crossings. No more than 1% of potential roaddiversion sites are expected to be either physically impossible to correct or of such a nature thattheir correction would make the road unsafe for travel.
Stream crossing failures are generally related to undersized, poorly placed, plugged or partiallyplugged culverts. When a culvert fails, the sediment associated with the crossing is delivered

42
directly into the watercourse. Indeed, in most crossing failures, the total sediment volumedelivered is the volume of road fill associated with the crossing as well as sediment from collateralfailures such as debris torrents that scour the channel and stream banks (EPA, 1998). The ForestPractices Act requires that road crossings be designed to pass a 50-year flood and be protectedfrom damage by debris with trash racks. Given the large percentage of seasonal roads in theNoyo River watershed, however, maintenance of culverts and trash racks following storm eventsis likely to be irregular. The target, therefore, is being established based on the 100-year flood. No more than 1% of all culverts are expected to fail as a result of a 100-year flood or less, if allthe culverts are properly sized, installed, and maintained. Only those crossings wheremodification would endanger travelers, or where there are other physical constraints, should fallwithin this 1%.
Hydrologic ConnectivityIncreased flows result in increased suspended sediment discharge and can result in thedestabilization of the stream channel’s armor layer (Lewis, 1998; Ziemer, 1998). A decrease in astream channel’s armor layer, particularly during early spring flows, can have a devastating effecton salmonid redds and growing embryos (Lisle, 1989).
Stream flows are increased as a result of logging, in part, because of the de facto increase in thechannel network that often accompanies the construction of roads, particularly those with inboardditches. Water that on a naturally graded hillside would be either intercepted by tree cover orinfiltrate through the duff and into groundwater, instead hits an inboard ditch to become surfacewater delivered directly to a watercourse. Groundwater is also intercepted by inboard ditches.
The reduction of road densities and the reconstruction of roads (including the railroad) to reducethe miles of inboard ditches, for example, can reduce the amount of water that is directly deliveredto watercourses, including any associated sediment load. Current research appears insufficient toidentify a specific number of miles of road or road with inboard ditch that would adequatelyprevent excessive stream flows and sediment discharge. Accordingly, the target calls for areduction in the hydrologic connectivity of roads to watercourses.
Disturbed AreaStudies in Caspar Creek (Lewis, 1998) indicate that the disturbed area in the South Fork CasparCreek is 15% while that in the North Fork is 3.2%. There is a statistically significant relationshipbetween the difference in the disturbed areas and the corresponding suspended sediment dischargerate (Lewis, 1998; J. Lewis pers. comm. w/ A. Mangelsdorf as reported in Regional Water Board,1999). In addition, studies in Caspar Creek indicate that clearcutting causes greater increases inpeak flows (and by extension suspended sediment loads) than does selective harvest (Ziemer,1998). As with the “hydrologic connectivity” target above, increases in peak flows, annual flows,and suspended sediment discharge rates negatively affect the potential survivability of ova in redds(Lisle, 1989). The available information is insufficient to identify a threshold below which effects (such asincreases in peak flows, annual flows and suspended sediment discharge) on the Noyo Riverwatershed would be insignificant. Accordingly, the target calls for a reduction in the amount of

2 SHALSTAB is a coupled, steady-state runoff and infinite-slope stability model that can be used to map therelative potential for shallow landsliding across a landscape. Dietrich, et al., 1998 state that shallow landslides area major source of sediment delivered to streams. Individual landslides may mobilize in the form of a debris flow,and subsequently travel several kilometers downstream, scouring stream channels of all sediment and wood, thendepositing it in a large accumulation when the debris flow comes to rest in a low gradient channel.
43
disturbed area. With respect to this target, “disturbed area” is defined as the area covered bymanagement-related facilities of any sort, including: roads, landings, skid trails, firelines, harvestareas, animal holding pens, and agricultural fields (e.g., pastures, vineyards, orchards, row crops,etc). The definition of a facility is intentionally made broad to include managed agricultural areas,such as pastures and harvest areas, where the management activity (e.g., logging or grazing)results in substantially enough removal of vegetation to significantly reduce important rainfallinterception and soil protection functions. Agricultural fields or harvest areas in which adequatevegetation is retained to perform these ecological functions can be excluded from consideration as“facilities.” Dramatic reductions in the amount of disturbed area, then, can be made by reducingroad densities, skid trail densities, clearcut areas, and other management-induced bare areas.
Activity in Unstable AreasUnstable areas are those areas that have a high risk of landsliding and include: steep slopes, innergorges, headwall swales, stream banks, existing landslides, and other locations identified in thefield. Because of the high risk of landsliding inherent in these features, any activity that mighttrigger an erosional event should be kept to a minimum. Such activities include: road building,harvesting, yarding, terracing for vineyards, etc.
Dietrich et al. (1998) validated the SHALSTAB model2 using data collected in the Noyo Riverwatershed and elsewhere. The model predicts areas of chronic landsliding based on the ratio ofeffective precipitation to soil transmissivity (q/T). The data indicate that landslides in the NoyoRiver watershed observed on aerial photographs largely coincide with predicted chronic riskareas. Chronic risk areas include steep slopes, inner gorges and headwall swales, as well as otherlocations.
Weaver and Hagans (1994) suggest methods for eliminating or decreasing the potential for road-related sediment delivery. They recommend avoiding construction of roads in unstable areasunless construction involves professional geotechnical assistance. Studies in the lower Eel Riverbasin suggest that landslides in recently harvested second growth areas underlain by Franciscangeology are larger and more common than those in areas of unharvested second growth (PWA,1998). In Redwood Creek basin, Pitlick (1982) found that slides in harvested inner gorge areaswere no more common but were much larger than those in uncut inner gorge slopes. Thus, thetarget calls for avoidance of unstable areas, unless the activity involves professional geotechnicalassistance.

44
CHAPTER VSOURCE ANALYSIS
________________________________________________________________________
The Source Analysis provides an assessment of the sources of sediment to the Noyo Riverwatershed that may be contributing to the impairment of aquatic habitat and salmonid success. It includes a history of land use in the watershed with respect to increased erosion and elevatedsediment delivery. It also includes an assessment of landsliding, surface erosion, fluvial erosion,and changes to in-channel stored sediment over time. This is given in the form of a sedimentbudget, including supporting discussion.
V.A. LAND USE HISTORY
Early Industrial ActivityThe first industrial activity on the Noyo River watershed began with the development of theRichardson-Hegenmeyer water-powered sawmill in 1853. The mill was washed out by a springfreshet the following year. However, the lower Noyo River mainstem still has the remnants ofseveral mid-channel booms which were erected to assist in the floating of logs down the river tothe mill (Stebbins, 1986).
A second sawmill was built on the Noyo River in 1858. By 1880, it was estimated that the millowners had cut about 5,700 acres of timber land to supply the mill, producing approximately120,000,000 board feet of lumber in that time (Stebbins, 1986). As with the Richardson-Hegenmeyer mill, logs reached this second mill via transport down the Noyo River. The history isunclear, but splash dams may have occasionally been used to assist in river transportation (M.Jameson pers. comm. w/ A. Mangelsdorf as reported in Regional Water Board, 1999).
In 1885, the Fort Bragg Lumber Company was formed and included the purchase of property onthe Noyo River, as well as the site of Fort Bragg itself. Relying exclusively on ships for thetransport of logs to market, the Fort Bragg Lumber Company formed the Fort Bragg Railroad (the precursor to the current-day Skunk Train) in hopes of improving transportation (Crump,1998). In 1893, the Fort Bragg Lumber Company incorporated with White and Plummer, apartnership owning substantial stands of redwoods, to form the Union Lumber Company. Production increased substantially (Crump, 1998).
By 1930, more than half of the Noyo River watershed had been logged, with yarding conducted inthe watercourse channels. During the 1960s, logging of second-growth began, primarily in thelower main drainage area. The harvesting of second growth continues today. Removal ofresidual old-growth stands began in the 1960s and continued into the mid-1980s (M. Jamesonpers. comm. w/ A. Mangelsdorf as reported in Regional Water Board, 1999).
Modern Industrial ActivityToday, the Noyo River watershed is primarily owned by three large land owners: MendocinoRedwood Company, The Timber Company, and the State of California (Jackson Demonstration

45
State Forest). Property now owned by Mendocino Redwood Company was previously owned byLouisiana-Pacific Corporation, and The Timber Company was previously known as Georgia-Pacific Corporation and Rex Timber Company. Together the three major land owners ownapproximately 70% of the basin (Jones & Stokes, 1997; Mendocino Redwood Company,unpublished; P. Caferrata pers. comm. w/ A. Mangelsdorf as reported in Regional Water Board,1999). The predominant land use in the Noyo River watershed is timber production and harvest.
Since 1986, the Department of Forestry and Fire Protection has been digitizing Timber HarvestPlans (THP), submitted and approved in the Noyo River watershed, into a GeographicInformation System (GIS). Among other data, included in the GIS are: landowner, road locationand type, hydrography, topography, harvest location and type, and yarding type. Below is asummary of these data. The GIS does not distinguish between harvest activities that werepermitted and those that actually occurred. That is, THPs may have been submitted that werenever implemented or were implemented only in part. Similarly, the data contained in the GIS donot indicate the degree to which approved THPs were faithfully implemented. For the purpose ofthis assessment, however, all permitted activities are assumed to have occurred in the year and inthe manner in which they were permitted. Timber Harvest ActivityTHPs approved by CDF from 1986 through 1998 allowed for timber harvest activity on 44,764acres of a 72,323-acre basin (62%). Harvest activity occurred on: · 54% of the Headwaters Assessment Area;· 76% of the North Fork Noyo River Assessment Area;· 64% of the South Fork Noyo River Assessment Area; and · 56% of the Mainstem Noyo River Assessment Area.
Rates in individual sub-basins, however, are higher. For example, the rate of harvest in the LittleNorth Fork Noyo River, a tributary in the Mainstem Noyo River Assessment Area, wasapproximately 229% from 1964 to 1993 (Valentine and Jameson, 1994). This means that29% of this 2,443-acre tributary sub-basin was harvested three times in 28 years, while therest was harvested twice. Thus, impacts in the Little North Fork Noyo River are likely to beeven greater than would be assumed by an average harvest rate since 1986 in MAA of 56%.
As depicted in Table 9, the five largest landowners conducted 83% of the timber harvest activityfrom 1986 through 1998:
· Mendocino Redwood Company (formerly Louisiana-Pacific Corporation)-- 30%;· The Timber Company (formerly Georgia-Pacific Corporation and Rex Timber Company)--
28%;· The State of California at Jackson Demonstration State Forest-- 17%; · Congaree River, Ltd.-- 5%; and· Barnum Timber-- 3%.

46
Table 9: Summary of the Logging Activity Permitted by Timber Harvest Plans Submitted to theCalifornia Department of Forestry and Fire Protection by the Five Largest Landowners/Managersfrom 1986-1998 in the Noyo River Watershed
LANDOWNER HEADWATERS NORTH FORKNOYO
SOUTHFORK NOYO
MAINSTEMNOYO
TOTAL
ACRES % ACRES % ACRES
% ACRES
% ACRES %
Barnum Timber 0 0 1243 10 0 0 0 0 1242 3Congaree River Ltd. 2381 25 10 0 0 0 0 0 2391 5Georgia-Pacific Corp./The Timber Company
0 0 0 0 2206 20 5969 49.48 8174 18
Louisiana-Pacific Corp./Mendocino Redwood Co.
2938 31 9770 80 209 2 515 4.27 13431 30
Rex Timber Company/The Timber Company
0 0 0 0 505 5 4170 34.56 4674 10
State of California-- JDSF 0 0 0 0 7862 70 0 0.00 7862 17TOTAL HARVEST 9466 100 12236 100 11191 100 12063 100.0
044956 10
0TOTAL ACRES ANDPERCENT ACRESHARVESTED
17390 54 16045 76 17574 64 21314 55.81 72323 62
Table 10 shows the number of acres of property permitted for harvest in each assessment area andthe percentage of the harvest conducted by each of the silivicultural methods described in theForest Practices Act. These are categorized, following the categories contained in the ForestPractices Act, as: evenaged management, unevenaged management, intermediate treatments,special prescriptions, and alternative prescriptions. Several points can be noted from Table 10.· In HAA, silvicultural methods practiced are generally divided among evenaged methods
(38%), unevenaged methods (28%), and alternative prescriptions (27%).· In NFAA, evenaged management is the predominant series of methods practiced (61%) with
the subdominant methods including unevenaged methods (19%) and alternative prescriptions(13%).
· In SFAA, unevenaged management is the predominant series of methods practiced (47%)with evenaged management as the subdominant series of methods (31%).
· In MAA, evenaged management is the predominant series of methods practiced (60%) withunevenaged management as the subdominant series of methods (35%).
Yarding ActivityTable 11 shows the yarding methods used per area and per year in the Noyo River watershed. According to CDF’s GIS, tractor yarding is the predominant yarding method used in the NoyoRiver watershed. It accounts for 66% of the yarding conducted since 1986. Further, tractoryarding accounts for the majority of yarding conducted in each of the assessment areas except theSFAA. It accounts for 75% of the yarding in HAA, 83% in NFAA, and 64% in MAA.
Cable yarding methods have been used in the SFAA and MAA since 1986. This method ofyarding accounts for 56% of the yarding in the SFAA and 36% in the MAA since 1986. Cableyarding accounts for 32% of the yarding conducted in the watershed, overall.

47
Table 10: Summary of Silvicultural Practices used in the Noyo River Watershed as Derived fromTimber Harvest Plans Submitted to the Department of Forestry and Fire Protection from 1986 to1998
SilviculturalManagement
Prescription HAA NFAA SFAA MAA
Acres % oftotal
Acres % oftotal
Acres % oftotal
Acres % oftotal
Evenage Clearcut 78 1 573 5 1,496 13 4,158 35Shelterwood 3,245 34 6,035 64 1,379 12 2,878 34Seed Tree 287 3 421 3 558 5 698 6SUBTOTAL 3,610 38 7,029 61 3,432 31 7,734 60
Unevenage Selection 2,422 26 1,777 15 3,790 34 3,608 22Transition 235 2 378 3 1,497 14 952 8SUBTOTAL 2,658 28 2,155 19 5,287 47 4,560 35
Intermediate
CommercialThinning
289 3 308 3 2,030 18 285 2
SanitationSalvage
45 0 194 2 3 0 0 0
SUBTOTAL 334 4 502 4 2,033 18 285 2Special Rehabilitation 314 3 463 4 0 0 0 0
SUBTOTAL 314 3 463 4 0 0 0 0Alternative Alternative 2,551 27 1,449 12 438 4 340 3
SUBTOTAL 2,551 27 1,449 13 439 4 340 3Grand Total 9,466 100 11,599 100 11,191 100 12,919 100
Table 11: Summary of Yarding Statistics for Timber Harvest Activity in the Noyo RiverWatershed as Compiled from Timber Harvest Plans Submitted to the California Department ofForestry and Fire Protection from 1986-1998
AssessmentArea
Logged Area Yardedby Tractor
Logged Area Yardedby Cable Skyline
Logged Area Yarded byHelicopter
Total LoggedArea
Acres % of loggedarea yardedby tractor
Acres % of loggedarea yardedby cable
Acres % of loggedarea yarded byhelicopter
Acres
HAA 7141 75 1550 16 775 8 9466NFAA 10072 83 2052 17 75 1 12199SFAA 4667 42 6313 56 212 2 11191MAA 7623 64 4295 36 0 0 11919Total 29503 66 14209 32 1063 2 44774
Helicopter yarding was first used in the Noyo River watershed by Louisiana-Pacific Corporationin 1994. Several other operations have since used helicopter yarding in the NFAA and SFAA. Inall, 1,062 acres (or 2% of the area logged) were yarded by helicopter in the period between 1986and 1998. The relationship between yarding technique and sediment delivery is well established. Asdescribed in Chapter III (Problem Statement), there is a statistically significant, positiverelationship between ground disturbance and suspended sediment (Lewis, 1998; J. Lewis pers.

48
comm. w/ A. Mangelsdorf as reported in Regional Water Board, 1999). Further, it is clear thatcable yarding substantially reduces the risk of immediate landsliding as well as post-harvestlandsliding, compared to tractor yarding (Cafferata and Spittler, 1998). Thus, it can be generallyconcluded that tractor yarding causes the most ground disturbance and sediment delivery whilecable and helicopter yarding cause the least. Accordingly, reductions in sediment delivery due toyarding are best accomplished by altering current management practices in favor of greater use ofcable and helicopter yarding.
RoadsTable 12 shows the density and classification of roads proposed for use in timber harvestoperations permitted since 1986. Aerial photographs going back to 1942, where available, wereused to estimate the miles of road added in each period up to the present. The calculated roaddensities are similar to those estimated using aerial photographs. The analysis of aerialphotographs resulted in estimates for HAA, NFAA, SFAA, and MAA that differ from CDF’s GISestimates by –0.1%, -9.3%, +0.3%, and +5.1%, respectively, so the amount of roads may beunderestimated or overestimated by five to ten percent.
Table 12: Summary of Road Length and Density Data Derived from Timber Harvest PlansSubmitted to the Department of Forestry and Fire Protection From 1986-1998
ROADTYPE
HEADWATERSSUB-BASIN ( 27.17 mi2)
NORTH FORKNOYO SUB-BASIN(25.07 mi2)
SOUTH FORKNOYO SUB-BASIN(27.46 mi2)
MAINSTEMNOYO SUB-BASIN(33.30 mi2)
NOYO RIVERWATERSHED(113.00 mi2)
Length(mi)
Density(mi/mi2)
Length(mi)
Density(mi/mi2)
Length(mi)
Density(mi/mi2)
Length(mi)
Density(mi/mi2)
Length(mi)
Density(mi/mi2)
Primaryroute
0 0 0 0 0 0 0 0 0 0
Secondaryroute
2 0 0 0 11 0 11 0 24 0
Existingpermanent
13 1 11 0 19 1 57 2 101 1
Existingseasonal
115 4 147 6 96 3 184 6 542 5
Existingtemporary
12 0 7 0 6 0 1 0 26 0
Proposedpermanent
0 0 0 0 0 0 0 0 0 0
Proposedseasonal
14 1 18 1 26 1 2 0 59 1
Proposedtemporary
0 0 0 5 0 0 0 5 0
Bridge 0 0 0 0 0 0 0 0 0Abandonedseasonal
0 1 0 0 0 0 0 1 0
TOTAL 156 6 184 7 163 6 255 8 758 7
According to CDF’s GIS, the road density is highest in MAA at 7.67 mi/mi2. The lowest roaddensity is found in HAA with 5.74 mi/mi2. The average road density for the watershed overall is6.71 mi/mi2. Road densities in individual tributary basins, however, are higher. For example, the

49
road density in the lower portion of the South Fork Noyo River is 10.04 mi/mi2; and it is 9.97mi/mi2 in the Little North Fork Noyo River (Matthews, 1999).
According to CDF’s GIS, the roads are classified as per the Forest Practices Act as permanent,seasonal, or temporary. CDF’s data indicate that the majority (72%) of recently used roads (since1986) were classified in individual THPs as “existing seasonal roads.” Only 13% of the miles ofroad contained in THPs were classified as “existing permanent roads.” Less than 0.01% of theroads were classified as “proposed permanent roads” while more than 8% were classified as either“proposed seasonal roads” or “proposed temporary roads.” Only 0.2% of the roads wereidentified for abandonment.
Road density and road classification adds fundamental information regarding the potential forsediment delivery from roads.· The higher the road density, the higher the ground disturbance, and therefore the higher the
potential management-related sediment delivery (Lewis, 1998). · Permanent roads are theoretically designed for all-season use and theoretically receive regular
wet-weather maintenance. Seasonal roads are designed primarily for non-wet weather useand do not receive regular winter maintenance. Both permanent and seasonal roads areintended to have watercourse crossings capable of passing a fifty-year flood event. However,because of the difference in maintenance, the failure of a watercourse crossing on a seasonalroad is more likely to go unchecked than one on a permanent road.
· Permanent roads are more likely to be surfaced than a seasonal road and thereforetheoretically contribute less sediment from the road surface, as long as the surfacing is welldesigned.
The Regional Water Board was provided road-related data regarding hillslope and proximity toClass I streams (S. Lang pers. comm. w/ A. Mangelsdorf as reported in Regional Water Board,1999). Based on their review of available data and information Regional Water Board staff(1999) identified several sediment-related factors.· Roads on steep or convergent hillslopes are more likely to fail and/or deliver sediment than
those on ridge tops or above wide, flat riparian zones.· Streamside roads are more likely to deliver sediment generated by road-related causes than
those outside a riparian buffer.· Roads with well-placed rolling dips are less likely then those with numerous culverts
(particularly if they are undersized or prone to blockage by debris) to divert streams anddeliver eroded road fill.
· Roads with well-engineered outsloping are less likely than those with miles of inside ditch andwaterbars to deliver eroded fill and elevated flow.
Several conclusions regarding roads in the Noyo River watershed are appropriate.· The road densities indicate a substantial degree of ground disturbance within individual sub-
basins, within individual assessment areas, and throughout the Noyo River watershed overall.· The density of seasonal roads (which is substantially greater than that of permanent or
temporary roads) indicates a significant potential for minimally maintained crossings and otherroad-related facilities. This suggests the possibility of failed crossings that go unfixed

50
for some period. Further, as a general matter, unsurfaced roads have a greater potential forsurface erosion than do surfaced ones.
· The lack of any significant road abandonment since 1986 indicates the potential for numerousold or poorly built, unused roads to chronically deliver sediment.
Public Transportation RoutesSeveral public transportation routes exist within the Noyo River watershed. Highway 1 crossesthe Noyo River at its estuary. Highway 20 follows the ridgetop at the Noyo River’s headwatersbefore crossing into the Big River watershed and then back into the Noyo River watershed alongthe South Fork Noyo River. Other major and minor county roads also exist. The CaliforniaWestern Railroad operates the Skunk Trains from Willits to Fort Bragg following the Noyo Rivermainstem.
Public RoadsThe Highway 1 bridge may introduce various issues with respect to sediment transport throughthe Noyo River watershed. Bridge abutments often serve to constrict a river channel causingflooding upstream and channel erosion downstream. At this time, however, the specific effects ofHighway 1 are not known.
Highway 20 crosses from the Noyo River watershed into the Big River watershed and backbefore intersecting Highway 1 at the coast. In the Noyo River watershed headwaters, Highway20 runs primarily along the ridgetop and is not expected to contribute significantly to the problemof sedimentation. Where it returns from the Big River watershed to the Noyo River watershedalong the South Fork Noyo River, however, Highway 20, like any road in the watershed, mayhave the potential to contribute sediment via failed stream crossings, the downcutting of insideditches, water diversions onto fill or unstable soils, etc. These potential issues may also face thevarious minor and major county roads in the watershed, as well.
Skunk TrainLaying the tracks for what is now known as the Skunk Train began in the 1880s and wascompleted in 1911 (Crump, 1998). The tracks begin at the Fort Bragg railroad depot just southof Pudding Creek, follow lower Pudding Creek, and then travel a tunnel through a mountaindividing the Pudding Creek drainage from the Noyo River drainage. Most of the length of thetrack follows the Noyo River mainstem corridor, until a second tunnel that delivers the train toWillits.
Forty miles of track were laid to reach a destination of only 22 airline miles (Crump, 1998). Itoriginally required 113 bridges and trestles as it crossed back and forth over the river channel. That number has been reduced to 31 bridges and trestles at present (M. Scribner pers. comm. w/A. Mangelsdorf as reported in Regional Water Board, 1999). Landsliding associated with therailroad steadily increased from 1933 to 1957 when it was the largest cause of management-related landsliding. By 1996, the aerial photographs show no landslides specifically related to therailroad (Matthews, 1999).
3 Only landslides greater than 75 feet in width or length were evaluated due to the photo scale used. Landslideswere associated with harvest units, roads, the railroad, or natural forest based on the judgement of the analyst.
51
Current maintenance primarily calls for the replacement of culverts and repair of damage due togullies and chronic landslides.
V.B. SEDIMENT BUDGET
Graham Matthews and Associates conducted a desk-top analysis, during the spring of 1999, ofsediment delivery and transport in the Noyo River watershed. They estimated the inputs ofsediment to streams in the Noyo River watershed and they estimated the output of sediment fromthe Noyo River to the Pacific Ocean. They prepared a sediment budget by comparing thesediment inputs and outputs. The results of their study are reported in Sediment Source Analysisand Preliminary Sediment Budget for the Noyo River (1999).
Matthews (1999) evaluated landsliding throughout the watershed using 1:24,000 scale aerialphotographs for the years: 1942, 1952, 1957, 1963, 1965, 1978, 1988, 1996, and 19993. Complete photo sets for 1942, 1952, 1957 and 1999 were not available for every region of thewatershed. The 1942 aerial photos were assumed to give a snapshot of landscape eventsoccurring over a 10-year period (i.e., back to 1933). For each additional photo year, only newfeatures (i.e., those not seen on the previous year’s photo) were tabulated. The following are thetime periods evaluated via aerial photographic analysis: 1933-1942, 1943-1952, 1953-1957,1958-1963, 1964-1965, 1966-1978, 1979-1988, 1989-1996, 1997-1999.
Surface erosion was estimated for roads and skid trails based on road/skid trail density and usepatterns. Streamside fluvial erosion was estimated using data collected by Mendocino RedwoodCompany on its property in the upper watershed. Background surface erosion was estimatedusing regional figures described by CDF for Jackson Demonstration State Forest (P. Caferrata,pers. comm. w/ A. Mangelsdorf as reported in Regional Water Board, 1999). Fluvial erosionrelated to roads, skid trails and harvesting were not estimated due to the lack of information.
Table 13 summarizes the sediment budget prepared by Matthews (1999). Conceptually, thesediment budget can be described as:
Sediment Inputs - Sediment Outputs = Change in Storage.
In this case, the sediment budget indicates that sediment inputs are 40% less than sedimentoutputs, which would lead to the conclusion that there has been a net decrease in the amount ofsediment stored within the streams of the Noyo River watershed. However, as described inChapter III (Problem Statement), from 1957 to present the lower Noyo River appears to haveaggraded one and a half to two feet. Thus, rather than representing an overall sediment deficit,the discrepancy between inputs and outputs is more likely an artifact of the uncertainty in theanalyses and time lags from sediment delivery to transport through the system. Indeed, with desk-top analytical tools that tend to under-estimate sediment inputs and over-estimate sedimentoutputs, such a discrepancy is to be expected.

52
The sediment inputs determined by Matthews probably underestimate actual sediment delivery(Matthews, 1999). This is because of the scale of aerial photos used, the lack of data or desk-toptools with which to evaluate fluvial erosion rates and changes in channel storage, and the lack oftime for field verification. Nonetheless, this is the best available data with which to assesssediment inputs and develop load allocations.
Table 14 includes estimates for sediment inputs to the Noyo River watershed in nine time periodsfrom 1933 through 1999 as described above. It includes estimates of sediment outputs for thoseperiods, as well. Sediment inputs are divided into the following categories:· Mass wasting;· Background surface erosion;· Surface erosion from skid trails;· Surface erosion from roads;· Bank erosion; and· Changes in channel storage.
The estimate of mass wasting is a compilation of the estimates of mass wasting due to naturalcauses, harvest units, roads, and the railroad. Table 14 segregates the estimates into these finercategories. Bank erosion is estimated at 200 tons/mi2/yr. This is likely an over-estimate, but it isbased on reasonably good data collected by the Mendocino Redwood Company and is the bestavailable information. The 200 tons/mi2/yr rate is not applied to the length of the Noyo Rivermainstem where limited field observations indicate little streamside mass wasting occurs(Matthews, 1999). Changes in channel storage are estimated based on analysis of historicremoval of large woody debris. The estimate does not include consideration of other means bywhich channel storage is altered over time. Again, this is due to the lack of available informationregarding other changes in channel storage.
In general, sediment input can be calculated as:
Sediment Input = MW + SEB + SEST + SER + BE + STOR
where: MW = mass wasting, SEB = background surface erosion, SEST = surface erosion fromskid trails, SER = surface erosion from roads, BE = bank erosion, and STOR = changes inchannel stored sediment.
Using data displayed in Table 13 for the Noyo River watershed for the period 1933 to 1999:
mass wasting = 1,276,800 tons,background surface erosion = 567,900 tons, surface erosion from skid trails = 114,900 tons, surface erosion from roads = 836,100 tons, bank erosion = 1,515,000 tons, and changes in storage = 146,000 tons.

PERIOD MASS WASTING SURFACE EROSION FLUVIAL EROSION CHANGE IN TOTAL OUTFLOW YIELDYEAR BACKGROUND SKID ROADS ROAD BANK EROSION STORAGE INPUTS SSL AND BL
(tons) (tons) (tons) (tons) (tons) (tons) (tons) (tons) (tons/mi2/yr)
1933-1942 220,000 84,800 500 27,500 226,000 558,000 1,080,000 955
1943-1952 52,600 84,800 4,600 31,300 226,000 399,000 695,000 615
1953-1957 148,000 42,400 10,900 40,500 113,000 +30000 385,000 824,000 1458
1958-1963 243,000 50,900 21,500 66,900 136,000 +36000 554,000 508,000 749
1964-1965 116,000 17,000 15,200 22,300 45,200 +12000 228,000 643,000 2845
1966-1978 61,200 110,000 24,100 233,000 294,000 +78000 800,000 1,880,000 1283
1979-1988 356,000 84,800 13,900 178,000 226,000 858,000 984,000 871
1989-1996 56,300 67,800 16,900 172,000 181,000 494,000 797,000 882
1997-1999 23,700 25,400 7,300 64,600 67,800 189,000
Mean YieldTOTAL 1,276,800 567,900 114,900 836,100 1,515,000 - 4,465,000 7,411,000 979
Notes: -- All values rounded to three significant figures-- Mass Wasting derived from landslides mapped from aerial photographs taken at the end of each budget period Certain areas were not covered by the phtograpgs in 1942, 1952, 1957, and 1999. See text for details.-- Background rates (containing creep, surface erosion by sheetwash and rilling, and deep-seated landslide components) based on work of Roberts and Church (1986) and Cafferata/Stillwater Sciences ( pers. Comm. 1999).-- Skid roads based on measured harvest areas on the 1942, 1957, 1965, and 1978 aerial photographs, delineated into 3 classes of skid road density. Harvest areas after 1986 are computed from GIS coverages developed by CDF.-- Road erosion computed from measured road miles in 1942, 1952, 1957, 1965, 1978 aerial photographs, and 1985 USGS topographic maps. Roads after 1985 are based on GIS coverage developed from THP submitted to CDF.-- Bank erosion is based on a rate of 200 tons/mi2/yr, and includes bank erosion and small streamside mass movements generally under the canopy and not visible on aerial photography. Adjusted from data by MRC (C. Surfleet, pers. Comm 1999) and USDA (1972).-- Change in storage represents estimates of loss of storage through LWD removal between 1950-1980. Rate of 100 tons/mi2 based on calculations by Cafferata/Stillwater Sciences (pers. comm. 1999).-- Sediment Outflow computed from regional suspended sediment and bedload transport equations developed as described in the text and applied to the USGS gage#11468500 for the period 1952-1997. Pre-1952 values based on correlation with annual precipitation.
TABLE 13
NOYO RIVER WATERSHED SEDIMENT SOURCE ANALYSIS Preliminary Sediment Budget
INPUTS OUTPUTS
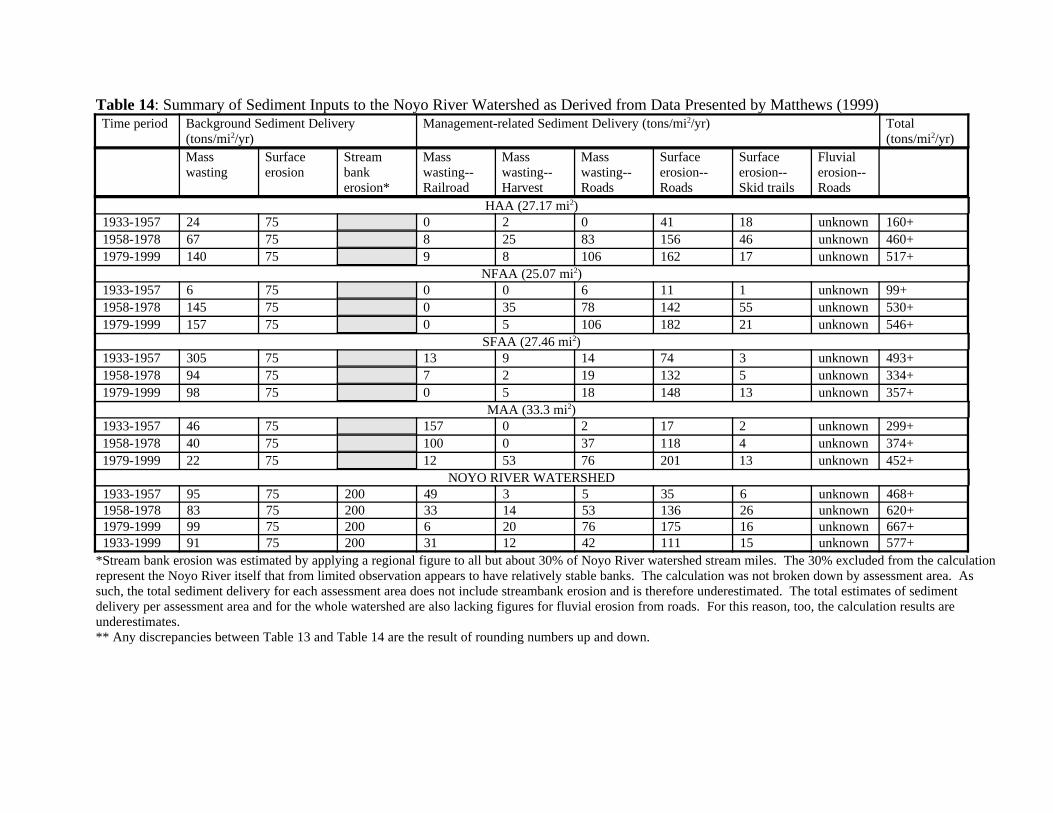
Table 14: Summary of Sediment Inputs to the Noyo River Watershed as Derived from Data Presented by Matthews (1999) Time period Background Sediment Delivery
(tons/mi2/yr)Management-related Sediment Delivery (tons/mi2/yr) Total
(tons/mi2/yr)Masswasting
Surfaceerosion
Streambankerosion*
Masswasting--Railroad
Masswasting--Harvest
Masswasting--Roads
Surfaceerosion--Roads
Surfaceerosion--Skid trails
Fluvialerosion--Roads
HAA (27.17 mi2)1933-1957 24 75 0 2 0 41 18 unknown 160+1958-1978 67 75 8 25 83 156 46 unknown 460+1979-1999 140 75 9 8 106 162 17 unknown 517+
NFAA (25.07 mi2)1933-1957 6 75 0 0 6 11 1 unknown 99+1958-1978 145 75 0 35 78 142 55 unknown 530+1979-1999 157 75 0 5 106 182 21 unknown 546+
SFAA (27.46 mi2)1933-1957 305 75 13 9 14 74 3 unknown 493+1958-1978 94 75 7 2 19 132 5 unknown 334+1979-1999 98 75 0 5 18 148 13 unknown 357+
MAA (33.3 mi2)1933-1957 46 75 157 0 2 17 2 unknown 299+1958-1978 40 75 100 0 37 118 4 unknown 374+1979-1999 22 75 12 53 76 201 13 unknown 452+
NOYO RIVER WATERSHED1933-1957 95 75 200 49 3 5 35 6 unknown 468+1958-1978 83 75 200 33 14 53 136 26 unknown 620+1979-1999 99 75 200 6 20 76 175 16 unknown 667+ 1933-1999 91 75 200 31 12 42 111 15 unknown 577+
*Stream bank erosion was estimated by applying a regional figure to all but about 30% of Noyo River watershed stream miles. The 30% excluded from the calculationrepresent the Noyo River itself that from limited observation appears to have relatively stable banks. The calculation was not broken down by assessment area. Assuch, the total sediment delivery for each assessment area does not include streambank erosion and is therefore underestimated. The total estimates of sedimentdelivery per assessment area and for the whole watershed are also lacking figures for fluvial erosion from roads. For this reason, too, the calculation results areunderestimates.** Any discrepancies between Table 13 and Table 14 are the result of rounding numbers up and down.

55
Thus, the total loading can be calculated as:
Sediment Input (tons) = 1,276,800 + 567,900 + 114,900 + 836,100 + 1,515,000 + 146,000 = 4,456,700.
The average sediment loading over the 67 year period from 1933 to 1999 and over the 113 mi2
watershed can be calculated as:
Sediment Input (tons/mi2/yr) = (4,456,700 tons)/(113 mi2)/67 years = 589.
Table 14 summarizes the assessment of sources of sediment to the Noyo River watershed over aperiod of 67 years from 1933 to 1999. The 67-year period of study has been divided into threeperiods: 1933-1957, 1958-1978, and 1979-1999. The period of 1933-1957 includes a quiescentperiod between the logging of old growth at the turn of the century and logging of second growthin the middle of the 20th century. The period of 1958-1978 includes an intensive period ofsecond growth logging, prior to the enactment and implementation of the California ForestPractices Act. The period of 1979-1999 includes an intensive period of second growth logging,conducted under the California Forest Practices Act.
Sediment input data have been evaluated for each assessment area. Sediment delivery rates havebeen compared between time periods. In addition, the rate of change in sediment delivery withina specific time period is used to compare the various source categories, because the aerial photosets for the various assessment areas are incomplete for some time periods. Land management-related fluvial erosion was not evaluated because of the lack of existing data.
Headwaters Assessment AreaWith respect to landslides, the data show that the rate of sediment delivery from backgroundsources increased from the 1933-1957 period to the 1958-1978 period by 179% and then fromthe 1958-1978 period to the 1979-1999 period by 109%. By comparing the rate of change in management-related categories of sediment delivery to the rate of change in background sedimentdelivery, we can make several observations regarding management influence with respect tolandsliding in HAA.· The rate of sediment delivery due to the activities of the railroad also increased through these
periods. The increase in the rate of sediment delivery from the 1958-1978 period to the 1979-1999 period, however, is only an eighth of the rate of increase in background sources.
· The rate of sediment delivery from harvest sites increased from the 1933-1957 period to the1958-1978 period by 1150% or almost 6 times the background rate. However, harvest-related sediment delivery decreased from the 1958-1978 period to the 1979-1999 period by68% at the same time that the background rate increased by 109%.
· The rate of sediment delivery from landslides associated with roads also increased throughthese periods. The increase in the rate of sediment delivery from the 1958-1978 period to the1979-1999 period, however, is only a quarter of the rate of increase in background sources.
The background rate of surface erosion was estimated using a uniform rate of sediment deliveryacross the watershed and over time. The estimate does not take into account fluctuations in the

56
timing of rainfall, rainfall volumes, or rainfall intensities, so the relationship between backgroundrates of surface erosion and management-related rates of surface erosion is undetermined. Nonetheless, the following can be said with respect to surface erosion.· The rate of sediment delivery due to surface erosion from roads has increased over time.
However, the rate of increase has slowed from 280% to 4% in the most recent period.· The rate of sediment delivery from skid trails increased from the period of 1933-1957 to
1958-1978. However, it decreased from the period of 1958-1978 to 1979-1999.
In summary, the background rate of sediment delivery due to landsliding increased throughout the1933-1999 period. The rate of management-related sediment delivery due to landslidingincreased from the 1933-1957 period to the 1958-1978 at rates significantly greater than thatassociated with background sources. In the transition from the 1958-1978 period to the 1979-1999 period (Forest Practices Act period), however, the rate of management-related sedimentdelivery due to landsliding changed at rates significantly less than that associated with backgroundsources. Indeed, harvest-related sediment delivery due to landsliding actually decreased in the1979-1999 period. Given the direct relationship between management practices and rates ofsediment delivery due to landsliding, EPA reaches several conclusions.· Management practices conducted during the Forest Practices Act period (1979-1999) have
contributed to a reduction in the rate of sediment delivery due to landsliding in harvest areas inHAA.
· Management practices conducted during the Forest Practices Act period (1979-1999) havecontributed to a deceleration in the rate of sediment delivery due to landsliding from roads inHAA; but they have not controlled it.
· Management practices conducted since 1979 have contributed to a deceleration in the rate ofsediment delivery due to landsliding from the railroad in HAA; but they have not controlled it.
With respect to surface erosion, sediment delivery from roads has increased from 1933-1999. However, the rate of increase has slowed since 1979. Sediment delivery due to surface erosionfrom skid trails, on the other hand, increased up through 1978; but it has decreased since then to arate less than that estimated for the 1933-1957 period. Given the direct relationship betweenmanagement practices and rates of sediment delivery due to surface erosion, EPA draws severalconclusions. · Management practices conducted in the Forest Practices Act period (1979-1999) have
contributed to a deceleration in the rate of sediment delivery due to surface erosion fromroads; but they have not controlled it.
· Management practices conducted in the Forest Practices Act period have contributed to thereduction in the rate of sediment delivery due to surface erosion from skid trails.
North Fork Noyo River Assessment AreaWith respect to landslides, the data show that the rate of sediment delivery from backgroundsources increased from the 1933-1957 period to the 1958-1978 period by 2317% and then fromthe 1958-1978 period to the 1979-1999 period by 8%. By comparing the rate of change in management-related categories of sediment delivery to the rate of change in background

57
sediment delivery, EPA makes several observations regarding management influence with respectto landsliding in NFAA.· The rate of sediment delivery from harvest sites increased from the 1933-1957 period to the
1958-1978 period at a rate greater than that of background sources. However, it decreasedfrom the 1958-1978 period to the 1979-1999 period by 63% during the same period in whichbackground sources increased by 8%.
· The rate of sediment delivery due to landsliding from roads increased from the 1933-1957period to the 1958-1978 period at a rate less than that of background sources. However, itincreased from the 1958-1978 period to the 1979-1999 period and from the 1933-1978 periodto the 1979-1999 period at a rate greater than that of background sources.
The background rate of surface erosion was estimated using a uniform rate of sediment deliveryacross the watershed and over time. The estimate does not take into account fluctuations in thetiming of rainfall, rainfall volumes, or rainfall intensities. Therefore, the relationship betweenbackground rates of surface erosion and management-related rates of surface erosion isundetermined. Nonetheless, the following can be said with respect to surface erosion.· The rate of sediment delivery from roads increased from the period of 1933-1957 to 1958-
1978 but decelerated from the period of 1958-1978 to 1979-1999. It increased from theperiod of 1933-1978 to 1979-1999.
· The rate of sediment delivery from skid trails increased from the period of 1933-1957 to1958-1978 but decreased from the period of 1958-1978 to 1979-1999. It decreased from theperiod of 1933-1978 to 1979-1999.
In summary, the background rate of sediment delivery due to landsliding increased throughout the1933-1999 period. On balance, the rate of management-related sediment delivery due tolandsliding increased at rates comparable to those from background sources from the 1933-1957period to the 1958-1978, the 1958-1978 period to the 1979-1999 period, and the 1933-1978period to the 1979-1999. However, this balance was achieved by reductions in the rate ofharvest-related landsliding as the rate of road-related landsliding increased at rates greater thanthose of background sources. Given the direct relationship between management practices andrates of sediment delivery due to landsliding, EPA draws several conclusions.· Management practices conducted during the Forest Practices Act period have contributed to a
reduction in the rate of sediment delivery due to landsliding in harvest areas in NFAA.· Management practices conducted during the Forest Practices Act period have contributed to a
deceleration in the rate of sediment delivery due to landsliding from roads in NFAA; but theyhave not controlled it.
With respect to surface erosion, sediment delivery from roads has increased from 1933-1999. However, the rate of increase has slowed since 1979. Sediment delivery due to surface erosionfrom skid trails, on the other hand, increased up through 1978, but it has decreased since then. Given the direct relationship between management practices and rates of sediment delivery due tosurface erosion, EPA draws several conclusions.· Management practices conducted in the Forest Practices Act period have contributed to a
deceleration in the rate of sediment delivery due to surface erosion from roads; but they havenot controlled it.

58
· Management practices conducted in the Forest Practices Act period have contributed to thereduction in the rate of sediment delivery due to surface erosion from skid trails.
South Fork Noyo River Assessment AreaWith respect to landslides, the data show that the rate of sediment delivery from backgroundsources decreased from the 1933-1957 period to the 1958-1978 period by 69% and thenincreased from the 1958-1978 period to the 1979-1999 period by 4%. By comparing the rate ofchange in management-related categories of sediment delivery to the rate of change inbackground sediment delivery, EPA makes several observations regarding management influencewith respect to landsliding in SFAA.· The rate of sediment delivery due to the activities of the railroad have decreased since 1993
and is now 0.· The rate of sediment delivery from harvest sites decreased more steeply than background
sources from the 1933-1957 period to the 1958-1978 period; and it increased more steeplythan background sources from the 1958-1978 period to the 1979-1999 period.
· The rate of sediment delivery due to landsliding from roads increased from the period of1933-1957 to 1958-1978; but it decreased slightly from the period of 1958-1978 to 1979-1999.
The background rate of surface erosion was estimated using a uniform rate of sediment deliveryacross the watershed and over time. The estimate does not take into account fluctuations in thetiming of rainfall, rainfall volumes, or rainfall intensities. Therefore, the relationship betweenbackground rates of surface erosion and management-related rates of surface erosion isundetermined. Nonetheless, the following can be said with respect to surface erosion.· Surface erosion from both roads and skid trails has increased since 1933, though more steeply
from skid trails.
In summary, the background rate of sediment delivery due to landsliding decreased significantlyfrom the 1933-1957 period to the 1958-1978 period but has increased since then. The rate ofmanagement-related sediment delivery due to landsliding has steadily decreased since 1933. Thishas occurred because of decreases in sediment delivery due to landsliding from railroad sites andharvest areas even while there have been increases due to roads. Nonetheless, the decrease inmanagement-related sediment delivery due to landsliding from 1933-1978 to 1979-1999 is stillonly half of that experienced from background sources. Given the direct relationship betweenmanagement practices and rates of sediment delivery due to landsliding, EPA draws severalconclusions.· Management practices conducted since 1979 have contributed to a decrease in the rate of
sediment delivery from management-related sources overall.· Management practices conducted since 1979 have contributed to a decrease in the rate of
sediment delivery from railroad sites.· Management practices conducted in the Forest Practice Act period (1979-1999) have
contributed to a decrease in the rate of sediment delivery from road sites.· Management practices conducted in the Forest Practice Act period (1979-1999) have been
unsuccessful in reducing sediment delivery from harvest areas.

59
With respect to surface erosion, sediment delivery from roads has increased from 1933-1999. However, the rate of increase has slowed since 1979. Sediment delivery due to surface erosionfrom skid trails, on the other hand, has accelerated up through 1999. Given the direct relationshipbetween management practices and rates of sediment delivery due to surface erosion, EPA drawsseveral conclusions.· Management practices conducted in the Forest Practice Act period (1979-1999) have
contributed to the deceleration in surface erosion from roads; but they have not controlled it.· Management practices conducted in the Forest Practice Act period (1979-1999) have been
unsuccessful in reducing sediment delivery from skid trails.
Mainstem Noyo River Assessment AreaWith respect to landslides, the data show that the rate of sediment delivery from backgroundsources decreased from the 1933-1957 period to the 1958-1978 period by 13% and then from the1958-1978 period to the 1979-1999 period by 45%. By comparing the rate of change in management-related categories of sediment delivery to the rate of change in background sedimentdelivery, EPA makes several observations regarding management influence with respect tolandsliding in HAA. · The rate of sediment delivery due to the activities of the railroad also decreased through these
periods, but at a greater rate than the decrease from background sources.· Landslides associated with harvest units were not identified in the aerial photographs until the
1979-1999 period. Accordingly, the increase from the early periods to the 1979-1999 isinfinite.
· The rate of sediment delivery due to landsliding from roads increased from the 1933-1957period to the 1958-1978 period by 1750% and from the 1958-1978 period to the 1979-1999period by 105%. These are enormous rates of increase when compared to the decrease insediment delivery from background sources in these same periods.
The background rate of surface erosion was estimated using a uniform rate of sediment deliveryacross the watershed and over time. The estimate does not take into account fluctuations in thetiming of rainfall, rainfall volumes, or rainfall intensities. Therefore, the relationship betweenbackground rates of surface erosion and management-related rates of surface erosion isundetermined. Nonetheless, the following can be said with respect to surface erosion.· The rate of sediment delivery from roads has increased over time. The rate of increase has
slowed from 594% to 70% in the most recent period.· The rate of sediment delivery from skid trails has increased over time. The increase has
accelerated from 100% to 225% in the most recent period.
In summary, the background rate of sediment delivery due to landsliding decreased throughoutthe 1933-1999 period. The rate of management-related sediment delivery due to landsliding alsodecreased from the 1933-1957 period to the 1958-1978 period and at a comparable rate (e.g.,14% vs. 13%). The rate of management-related sediment delivery due to landsliding increased,however, from the 1958-1978 period of the 1979-1999 period as compared to the decrease inbackground sediment delivery. Given the direct relationship between management practices andrates of sediment delivery due to landsliding, EPA draws several conclusions.
60
· Management practices conducted during the 1979-1999 period have contributed to adeceleration in the delivery of sediment due to mass wasting associated with the railroad.
· Management practices conducted during the Forest Practices Act period have beenunsuccessful in controlling sediment delivery due to mass wasting from harvest areas androads.
With respect to surface erosion, sediment delivery from roads has increased from 1933-1999. However, the rate of increase has slowed since 1979. Sediment delivery due to surface erosionfrom skid trails, on the other hand, has accelerated through 1999. Given the direct relationshipbetween management practices and rates of sediment delivery due to surface erosion, EPA drawsseveral conclusions.· Management practices conducted in the Forest Practices Act period have contributed to a
deceleration in the rate of sediment delivery increase due to surface erosion from roads; butthey have not controlled it.
· Management practices conducted in the Forest Practices Act period have been unsuccessful incontrolling the acceleration in sediment delivery due to surface erosion from skid trails.
Noyo River Watershed in GeneralIn summary, the data presented in Table 14 indicate that sediment delivery in the Noyo Riverwatershed has generally increased over time: from an estimated 468 tons/mi2/yr in the 1933-1957period to 620 tons/mi2/yr in the 1958-1978 period and to 667 tons/mi2/yr in the 1979-1999period. Estimates of management-related sediment delivery indicate that rates increased from the1933-1957 period to the 1958-1978 period by 167% and from the 1958-1978 period to the 1979-1999 period by 12%. As a general matter, it appears that practices conducted in the ForestPractices Act period of 1979-1999 have contributed to a deceleration in the rate of sedimentdelivery from management-related sources, but they have not controlled them.
Based on these data, EPA draws several conclusions regarding individual sediment sourcecategories in the Noyo River watershed.· The estimated rate of sediment delivery from mass wasting associated with the railroad was at
its greatest in the 1933-1957 period and has steadily declined since then. This is the onlysource category in which estimated rates of sediment delivery in the 1979-1999 period areequivalent to or less than the 1933-1957 rates. The estimated rate of sediment delivery in the1979-1999 period for all other source categories ranges from 167% to 1420% greater thanthe estimated rates in the 1933-1957 period.
· The estimated rate of sediment delivery from mass wasting associated with harvest areas is atits greatest in the 1979-1999 period.
· The estimated rate of sediment delivery from mass wasting associated with roads is at itsgreatest in the 1979-1999 period.
· The estimated rate of sediment delivery from surface erosion associated with roads is at itsgreatest in the 1979-1999 period.
· The estimated rate of sediment delivery from surface erosion associated with skid trails was atits greatest in the 1958-1978 period and has declined since then. (It remains at its greatest intwo of the assessment areas for the period of 1979-1999.)
61
CHAPTER VILINKAGE ANALYSIS
________________________________________________________________________
This chapter analyzes the relationship between hillslope processes and in-stream effects. InChapter IV targets are defined that interpret the applicable water quality criteria for sediment. Load allocations are established in Chapter VII that establish limits on the allowable sedimentloading from various hillslope sources. The linkage analysis provides the basis for calculating loadallocations that, when met, will result in attainment of the applicable water quality criteria forsediment.
Hillslope activities affect in-stream habitat, although the processes are not understood in sufficientdetail at this time to be able to describe the relationships mathematically. The linkage analysis forthe Noyo River TMDL is based on: (1) the determination that salmonids were abundant (relativeto today) prior to 1958, and (2) the conclusion that achieving a rate of sediment deliveryequivalent to the rate in the period prior to 1958 is expected to result in attainment of waterquality criteria for sediment.
Salmonid Abundance in the Early Part of this CenturyBrown et al. (1994) report that coho salmon previously occurred in as many as 582 Californiastreams from the Smith River near the Oregon border to the San Lorenzo River on the centralcoast. There are now probably less than 5,000 native coho salmon spawning in California eachyear, many in populations of less than 100 individuals. Coho populations today are probably lessthan 6% of what they were in the 1940s and there has been at least a 70% decline since the 1960s. Brown et al. (1994) conclude that the reasons for the decline of coho salmon in California include:stream alterations brought about by poor land-use practices and by the effects of periodic floodsand drought, the breakdown of genetic integrity of native stocks, introduced diseases, over-harvest, and climatic change. Many factors may have contributed to the decline in salmonidpopulations, but EPA has concluded that impacts to freshwater habitat from an overabundance ofsediment is an important one.
There are no quantitative estimates of coho populations in the Noyo River watershed in the earlierpart of this century, but anecdotal information available to the Regional Water Board indicatesthat the Noyo River once had a thriving population of coho and steelhead. As indicated by datafrom the South Fork egg taking station, coho populations have declined since 1963 by an averageof 68%. If coho populations today are less than 6% of what there were in the 1940s as suggestedby Brown et al. (1994), then there may have existed an average of 19,000 coho in the South Forkof the Noyo River watershed at that time.
This linkage analysis is based on two determinations. First, EPA has determined that thefreshwater habitat found in the Noyo River watershed in the early part of this century supportedcoho salmon, based on the information discussed above. Second, EPA has determined thatthe freshwater habitat conditions found in the Noyo River watershed in the early part of thiscentury correspond to those described by the in-stream targets in Chapter IV. Quantitativetargets are identified for substrate composition (e.g., % fines < 0.85 mm), pool frequency/depth,

62
and V*. All the other identified in-stream targets simply call for an improving trend. The % finestarget represents the results of a myriad of in-stream and laboratory studies and is conservativelybased specifically on coho fry emergence success. The pool frequency/depth target is based on alarge data set representing today’s “good” coho streams. And the V* target is based onconditions in a local reference stream. With respect to habitat conditions in the early part of thecentury, then, the % fines target may be slightly over-estimated, the pool frequency/depth may beslightly under-estimated, and the V* target is probably accurate. Overall, EPA believes that thetargets are consistent with habitat conditions early in the century.
Sediment Delivery Rates Over TimeThe assessment of sources of sediment to the Noyo River watershed covers a period of 67 yearsfrom 1933 to 1999 (Matthews, 1999). The 67-year period of study has been divided into threeperiods: 1933-1957, 1958-1978, and 1979-1999.
The period of 1933-1957 includes a quiescent period between the logging of old growth at theturn of the century and logging of second growth in the middle of the 20th century. The averagesediment delivery during this period is estimated at 468 tons/mi2/yr (see Table 14).
The period of 1958-1978 includes an intensive period of second growth logging, prior to theenactment and implementation of the California Forest Practices Act. Our understanding is thatthis is the period in which the most significant modifications to hillslope and in-stream processeshad occurred. The average sediment delivery during this period is estimated to be 620 tons/mi2/yr(see Table 14).
The period of 1979-1999 includes an intensive period of second growth logging, which has beenmitigated by the enactment and implementation of the California Forest Practices Act. Theaverage sediment delivery in this period is estimated at 667 tons/mi2/yr (see Table 14).
LinkageFor the purpose of the linkage analysis, the period of 1933-1957 is considered to be the periodjust prior to the steep decline in salmonid populations, most notably coho salmon. Since cohosalmon were successful (relative to today) in the Noyo River prior to 1958, as suggested byBrown et al. (1994), the habitat conditions in that period must have been adequate to supportcoho salmon. Though the specific habitat conditions of that period are unknown, it is reasonableto conclude that they were consistent with those defined by the numeric targets in Chapter IV, asdescribed above. Therefore, achieving a rate of sediment delivery equivalent to the rate ofsediment delivery in the period of 1933-1957 is expected to achieve the in-stream targets, protectwater quality, and attain the applicable water quality criteria for sediment.

63
CHAPTER VIILOAD ALLOCATIONS
________________________________________________________________________
This chapter establishes the loading capacity of the Noyo River for sediment, based on the linkageanalysis in Chapter VI, and apportions it among the various sources of sediment to the system. EPA is apportioning the total load among several non-point sources of sediment, after accountingfor background loading. The TMDL and the load allocations are expressed as 10-year rollingaverages due to the considerable variability in sediment loading rates.
VII.A. CALCULATION OF THE TMDL
For the Noyo River, EPA is defining the TMDL as the current loading capacity (i.e., the totalloading of sediment that can be delivered to the river and still attain the applicable water qualitycriteria for sediment). EPA has determined that the current loading capacity is equivalent to thesediment loading rate for the period 1933-1957, as discussed in the linkage analysis (Chapter VI). Sustainable populations of salmonids, coho salmon in particular, appear to have existed in thisperiod, so the sediment delivery rate at that time was capable of supporting salmonids. Therefore,achieving a sediment delivery rate comparable to that of this period is expected to result inattainment of the applicable water quality criteria for sediment.
The estimate of the average sediment delivery from the Noyo River watershed from 1933 to 1957is 468 tons/mi2/yr (from Table 14), which is rounded to 470 tons/mi2/yr. This is the TMDL forthe Noyo River.
The loading capacity (i.e., the TMDL) is apportioned among the various sources of the pollutantso as to focus attention on the sources that are influenced by human activities. In establishingTMDLs, EPA generally apportions the loading capacity among: (1) the background loading; (2)the wasteload allocations for point sources; and (3) the load allocations for non-point sources. For this TMDL, there are no point sources, so the wasteload allocations equal zero. Therefore,the TMDL for the Noyo River can be divided into the background loading and the loadallocations:
TMDL = Background Loading + Load Allocations = 470 tons/mi2/yr.
VII.B. CALCULATION OF BACKGROUND LOADING
The background sediment delivery rate is calculated using data from the entire period analyzed forthis TMDL (1933-1999). Using the data presented in Table 14, background rates for masswasting (91 tons/mi2/yr), surface erosion (75 tons/mi2/yr), and stream bank erosion (200tons/mi2/yr) are summed to derive the total background sediment delivery rate of 366 tons/mi2/yr,which is rounded to 370 tons/mi2/yr:
Background Loading = 370 tons/mi2/yr.

64
VII.C. CALCULATION OF LOAD ALLOCATIONS
EPA considered several factors in setting load allocations for various source categories, includingthe effectiveness of available methods of controlling sediment from the particular source category,equity in imposing needed controls, and the feasibility of monitoring to determine compliance withthe allocations.
EPA is establishing load allocations for mass wasting from the railroad, mass wasting fromharvest areas, and surface erosion from skid trails. The allocations are set at levels which willnecessitate reductions from current sediment delivery rates for those areas where current rates areelevated.
EPA is establishing load allocations for roads which will necessitate aggressive sediment controlefforts. This is appropriate because roads appear to be the greatest source of management-relatedsediment delivery, in the most recent period, in the watershed. Also, most sediment delivery dueto roads (including mass wasting, surface erosion, and fluvial erosion) is readily controllable.
Load Allocations for Sources other than RoadsEPA has identified several sources of management-related sediment delivery, in addition to roads,that may be significant: mass wasting from the railroad, mass wasting from harvest areas andsurface erosion from skid trails. EPA has determined that, for a particular source category, noassessment area should have a loading rate that is more the 25% above the watershed average forthat source category, as calculated in this report. Limiting the allocation to 25% above the basin-wide average is appropriate, because those rates are elevated and have significant potential toimpair water quality. By addressing the elevated railroad, harvest area, and skid trail sources,implementation of the requirements ensures that landowners throughout the basin are treatedequitably. The maximum allowable loading, therefore, is 125% of the watershed average. Thus,any assessment area which has a more elevated loading is given an allocation equal to 125% ofthe watershed average. Any assessment area whose loading is not elevated above 125% of thewatershed average is given an allocation equal to its current loading.
The current levels of sediment loading and allocations for these sources are presented in Table 15for the four assessment areas and for the overall watershed.
All loading rates are expressed in terms of tons/mi2/yr. These figures are meant to be averagefigures for the entire assessment area. These allocations can be converted to total tons/yr bymultiplying the loading allocation by the area of the assessment area. For example, the allocationof 8 tons/mi2/yr applies to the entire HAA, not just the harvest areas within the HAA. This can beexpressed in terms of tons/yr:
Allocation for harvest areas in HAA = (8 tons/mi2/yr)(27.2 mi2) = 220 tons/yr.

65
Table 15: Calculation of Load Allocations for Railroad, Harvest Area, and Skid Trail-relatedSources
Mass wastingfrom therailroad
Mass wastingfrom harvestareas
Surface erosionfrom skid trails
Total
Estimated current sediment deliveryrate in HAA 9 tons/mi2/yr 8 tons/mi2/yr 17 tons/mi2/yr 34 tons/mi2/yrEstimated current sediment deliveryrate in NFAA 0 tons/mi2/yr 5 tons/mi2/yr 21 tons/mi2/yr 26 tons/mi2/yrEstimated current sediment deliveryrate in SFAA 0 tons/mi2/yr 5 tons/mi2/yr 13 tons/mi2/yr 18 tons/mi2/yrEstimated current sediment deliveryrate in MAA 12 tons/mi2/yr 53 tons/mi2/yr 13 tons/mi2/yr 78 tons/mi2/yr
Estimated watershed average 7 tons/mi2/yr 20 tons/mi2/yr 16 tons/mi2/yr N/AMaximum allowable loading (125% ofaverage) 9 tons/mi2/yr 25 tons/mi2/yr 20 tons/mi2/yr N/A
Load Allocation for HAA (27.2 mi2) 9 tons/mi2/yr 8 tons/mi2/yr 17 tons/mi2/yr 34 tons/mi2/yr
Load Allocation for NFAA (25.1 mi2) 0 tons/mi2/yr 5 tons/mi2/yr 20 tons/mi2/yr 25 tons/mi2/yr
Load Allocation for SFAA (27.5 mi2) 0 tons/mi2/yr 5 tons/mi2/yr 13 tons/mi2/yr 18 tons/mi2/yr
Load Allocation for MAA (33.3 mi2) 9 tons/mi2/yr 25 tons/mi2/yr 13 tons/mi2/yr 47 tons/mi2/yr
Because the size of the assessment areas varies, the values for the individual areas are weighted bysize to determine the watershed average, which is the overall load allocation for other sources.
Load Allocation for Sources Other than Roads = (AA area/watershed area)(AA loading rate)= (27.2 mi2/113 mi2)(34 tons/mi2/yr) + (25.1 mi2/113 mi2)(25 tons/mi2/yr) + (27.5 mi2/113 mi2)(18 tons/mi2/yr) + (33.3 mi2113 mi2)(47 tons/mi2/yr)= 32 tons/mi2/yr.
Load Allocation for Roads (including mass wasting, surface erosion, and fluvial erosion)The source analysis (Chapter V) discusses three categories of road-related sources of sediment:mass wasting, surface erosion, and fluvial erosion. Loading estimates were derived for masswasting and surface erosion. No estimate was made for fluvial erosion from roads, because nofield data were available.
EPA is establishing a load allocation for roads that applies to the sum of all road-related sedimentsources. Thus, the load allocation for roads includes fluvial erosion, as well as mass wasting andsurface erosion.
Knowing the allocation for other sources, the TMDL, and the background loading rate, theallocation for roads, which applies to all assessment areas, is determined by difference. It is

66
reasonable to limit the allocation for roads to that remaining after allocations have been made forother sediment sources because sediment delivery due to roads is readily controllable.
Load Allocation for Roads = TMDL - Background Loading - Load Allocation for Other Sources= 470 tons/mi2/yr - 370 tons/mi2/yr - 32 tons/mi2/yr= 68 tons/mi2/yr.
Aggressive action to reduce sediment delivery from roads will be needed to meet this allocation. This is appropriate because roads appear to be the greatest source of management-relatedsediment delivery in the watershed. Also, improved methodologies for conducting roadinventories and “storm-proofing” roads are now available to land managers which, ifimplemented, will lead to dramatic reductions in sediment from historic road-related loading rates(Weaver and Hagans, 1994). EPA has identified roads as a source amenable to aggressivesediment reduction efforts in other North Coast TMDLs, including the South Fork Trinity RiverTMDL (EPA, 1998).
VII.D. SUMMARY OF LOAD ALLOCATIONS AND REQUIRED REDUCTIONS
Table 16 presents a summary of the load allocations. It also expresses the allocations in terms ofthe percentage reductions needed from the estimates of current levels described in this analysis. The load allocations pertain to entire assessment areas, whereas implementation actions may befocused at a smaller scale, and percent reductions can be applied at any scale. Because of thelimited precision of the analysis and the limitations of implementation monitoring, allocationsexpressed as percentage reductions are rounded to the nearest 5%.

67
Table 16: Summary of Load Allocations and Necessary Reductions
Current Estimate(1979-1999)
Load Allocation Percent ReductionNecessary
Headwaters Assessment Area
- Roads: Mass WastingSurface ErosionFluvial ErosionSubtotal for Roads
106 tons/mi2/yr162 tons/mi2/yrunknown268 tons/mi2/yr 68 tons/mi2/yr 75%
- Mass Wasting from Railroad 9 tons/mi2/yr 9 tons/mi2/yr none
- Mass Wasting from Harvest Areas 8 tons/mi2/yr 8 tons/mi2/yr none
- Surface Erosion from Skid Trails 17 tons/mi2/yr 17 tons/mi2/yr none
North Fork Assessment Area
- Roads: Mass WastingSurface ErosionFluvial ErosionSubtotal for Roads
106 tons/mi2/yr182 tons/mi2/yrunknown288 tons/mi2/yr 68 tons/mi2/yr 75%
- Mass Wasting from Railroad 0 tons/mi2/yr 0 tons/mi2/yr none
- Mass Wasting from Harvest Areas 5 tons/mi2/yr 5 tons/mi2/yr none
- Surface Erosion from Skid Trails 21 tons/mi2/yr 20 tons/mi2/yr 5%
South Fork Assessment Area
- Roads: Mass WastingSurface ErosionFluvial ErosionSubtotal for Roads
18 tons/mi2/yr148 tons/mi2/yrunknown166 tons/mi2/yr 68 tons/mi2/yr 60%
- Mass Wasting from Railroad 0 tons/mi2/yr 0 tons/mi2/yr none
- Mass Wasting from Harvest Areas 5 tons/mi2/yr 5 tons/mi2/yr none
- Surface Erosion from Skid Trails 13 tons/mi2/yr 13 tons/mi2/yr none
Mainstem Assessment Area
- Roads: Mass WastingSurface ErosionFluvial ErosionSubtotal for Roads
76 tons/mi2/yr201 tons/mi2/yrunknown277 tons/mi2/yr 68 tons/mi2/yr 75%
- Mass Wasting from Railroad 12 tons/mi2/yr 9 tons/mi2/yr 25%
- Mass Wasting from Harvest Areas 53 tons/mi2/yr 25 tons/mi2/yr 50%
- Surface Erosion from Skid Trails 13 tons/mi2/yr 13 tons/mi2/yr none

68
CHAPTER VIIIMARGIN OF SAFETY AND SEASONAL VARIATION
________________________________________________________________________
Section 303(d) of the Clean Water Act and the regulations at 40 CFR 130.7 require that TMDLsbe established at levels necessary to attain and maintain the applicable narrative and numericalwater quality standards with seasonal variations and a margin of safety which takes into accountany lack of knowledge concerning the relationship between effluent limitations and water quality. The regulations also require that TMDLs account for critical conditions for stream flow, loading,and water quality parameters. The margin of safety can be incorporated into conservativeassumptions used to develop the TMDL or added as a separate, quantitative component of theTMDL (EPA, 1991).
Annual and Seasonal VariationThere is inherent annual and seasonal variation in the delivery of sediment to stream systems asthe result of variation in rainfall patterns. There is also considerable spatial variation resultingfrom numerous factors, including: slope, geology, aspect, vegetation, soil type, etc. Surfaceerosion, including erosion from roads, occurs on an annual basis, but primarily as a result ofwinter rains. Surface erosion from ridge top roads, however, is much less likely to enter awatercourse than that from stream-side roads. Mass wasting occurs as a result of large storms,but is more likely in inner gorges and headwall swales, for example, than on gently sloping terrain.
Because of the large temporal and spatial variation in erosion and sediment delivery, the sedimentload allocations are designed to apply to the sources of sediment, not the movement of sedimentacross the landscape or delivery of sediment to the stream channel. Also, the load allocations areapplied as 10-year rolling averages. If implemented as envisioned, using the allocations expressedas percent reductions at the scale of individual sediment production sites, potential and existingsediment delivery sites will be identified and the quantity of sediment associated with each sitemeasured or estimated. Then, as a result of mitigation or altered land management, the amount ofpotential sediment saved from delivery to waters of the State will be measured or estimated. Therelationship between the original measurement or estimate and the amount saved by mitigationwill indicate the degree to which the allocation (as a percent reduction) has been achieved. Applied in this way, the effects of spatial and temporal variation on the implementation of loadallocations are minimal. Only following mitigation, when large storms occur, will the effects oftemporal and spatial variation be important. Mitigation measures that do not hold up to thevariation in rainfall patterns, for example, should be redesigned and re-implemented, asappropriate.
There is also inherent annual and seasonal variation in the condition of the in-stream environmentresulting from variation in sediment delivery, flow, and the longevity of large woody debris, forexample. In addition, there is considerable spatial variation resulting from variation in channelslope, geology, aspect, vegetation, topography, etc. The in-stream and hillslope targetsestablished as part of this TMDL take into account this variation, but in different ways. The in-stream targets are indicators that are generally collected during the summer months

69
when stream flows are low and field crews can safely enter the stream for monitoring. (Turbidityis the exception.) The indicators are ones that are directly related to factors potentially limitingthe success of coho salmon in the Noyo River watershed. And they are all related to the issue ofsedimentation, either as a primary factor (e.g., % fines) or as a secondary factor (e.g., pooldepth/frequency, large woody debris). If the monitoring plan is developed and implemented asenvisioned, monitoring will be conducted on an annual basis for some parameters (e.g., % fines)and after storms of a specific recurrence interval for other parameters (e.g., % large woodydebris). The data will be analyzed with respect to mean and maximum values per stream reach. They will be analyzed as a long-term rolling average (e.g., 10 years). And they will be analyzed inconjunction with rainfall and/or stream flow data to ensure that climatic influences are considered. Finally, the monitoring plan will locate or propose a process for locating monitoring sitesappropriate for answering specific critical questions regarding habitat value, changes in habitatover time, and impacts on habitat from hillslope activities.
The hillslope targets, on the other hand, are specifically designed with variation in rainfall andpeak flows in mind. The road crossing failure and flow diversion targets will require regularassessment of road facilities before and after the effects of storms of a specific recurrence interval(e.g., 10 years). Conformance with the disturbance area and hydrologic connectivity targets canbe assessed remotely via GIS, for example. However, they specifically track critical changes inthe landscape over time that influence the rates of erosion and peak flows resulting from variableclimatic events.
It is difficult to accurately predict the specific impacts of sediment loading at particular times andplaces on particular salmonid life stages as they occur throughout a watershed. There aresubstantial and poorly defined spatial and temporal lags between sediment delivery and theoccurrence of sediment–related impacts on beneficial uses. Therefore, the approach taken in thisTMDL is to: · Establish conservative in-stream targets that interpret narrative water quality standards and
address the factors potentially limiting the success of salmonids in the Noyo River watershed,including factors that are secondarily related to sedimentation such as large woody debris andpeak flows;
· Select hillslope indicators that are directly related to management-induced sedimentation,including targets associated with sediment delivery and hydrologic modification;
· Establish conservative hillslope targets based on scientific literature, reference streams, andbest professional judgement; and,
· Establish conservative load allocations based on estimates of current and historic rates ofsediment delivery.
Similarly, this TMDL does not explicitly estimate critical flow conditions. Sediment impacts mayoccur long after sediment is discharged, often at locations far downstream of the sediment source. Also, it is impractical to measure accurately sediment loading and transport, and the resultingshort term effects, during high magnitude flow events that produce most channel modifications. Rather, the TMDL accounts for critical conditions by establishing targets and allocations based onnet long term effects.

70
Margin of SafetyAs set forth in EPA guidance (EPA, 1991) the margin of safety can be incorporated intoconservative assumptions used to develop the TMDL or added as a separate, quantitativecomponent of the TMDL. This TMDL incorporates an implicit margin of safety through use ofthe conservative assumptions discussed in this chapter.
An important factor in the implicit margin of safety is that the calculation of the TMDL and theload allocations is based on an estimate of sediment loading in the 1933-1957 period, derivedusing a conservative methodology. The methodology used most likely results in an underestimateof sediment loading, as described below, for this period. Since salmonids were relativelyabundant in this time period, and the sediment delivery estimate is probably low, salmonids canlikely tolerate a higher sediment delivery rate than the one estimated for this period. Since theTMDL and load allocations are established based on this estimate of sediment loading, the TMDLand load allocations are conservative.
That the estimates of sediment loading used in this analysis are conservative is illustrated by acomparison between the calculated sediment budget and actual observations. The calculatedsediment budget indicates that sediment inputs are 40% less than sediment outputs, whereasactual data (as discussed in Chapter III) indicate that the lower Noyo River appears to haveaggraded by one and half to two feet from 1957 to present. Matthews (1999) indicates that thecalculated sediment output has been somewhat overestimated, and the calculated inputs havelikely been underestimated, because of limitations with the available data and analytic techniques.
For example, Matthews (1999) lists the following reasons why the mass wasting analysis is likelyan underestimate: (1) there was a lack of data regarding landslides that were smaller than theresolution of the aerial photos used; (2) continuing sediment delivery from old slides was ignored;(3) the subsequent reactivation of old slides was ignored; and (4) slides in inner gorge areas wereassumed to deliver sediment to the stream at the same rate as slides in other areas, when theyprobably deliver at higher rates.
There are additional factors that contribute to the implicit margin of safety, including: · Consideration of limiting factors that are both primarily and secondarily related to
sedimentation, such as percent fines (primary), V* (primary), pool depth/frequency(secondary), and number and volume of key pieces of large woody debris (secondary);
· Development of conservative numeric targets where the scientific literature supports them(e.g., percent fines);
· Conservative assumptions, where data are sparse, regarding which limiting factors arepotentially affecting coho salmon; and
· Conservative assumption with respect to the direct nature of the relationship between hillslopesediment production and in-stream effect.
Some of the relationships between uncertainties in the analysis and the corresponding adjustmentsmade by EPA are summarized in Table 17.

71
Table 17: Supporting Information for Margin of Safety
UNCERTAINTIES IN TMDLSUPPORTING DOCUMENTATION
ADJUSTMENTS TO ACCOUNT FOR UNCERTAINTIES
Existing data is limited. The targets represent the optimal conditions for beneficial usesupport (salmonids) and include targets for watershedconditions (hillslope and roads).
Considerable uncertainty exists in the sourceanalysis, including a lack of information onfluvial erosion from roads.
A single allocation for roads was established. Because there isno estimate of fluvial erosion from roads, the roads allocation isconservative.
Linkages between hillslope sediment sourcesand in-stream conditions are poorlyunderstood, and temporal/spatial lagsassociated with the movement of sedimentfrom source to stream impact could result inirreversible sediment impacts.
A broad range of indicators were selected, including those thatwill address: (1) a protected beneficial use (salmonids) directly;(2) advancement of our understanding of the processes definingthe linkages (including continued trend monitoring); (3)in-stream conditions; and (4) protection of water quality at thesources of delivery to the stream (e.g., hillslope and roadconditions). In addition, assuming a linear relationship betweentargets and loads is conservative.

72
CHAPTER IXIMPLEMENTATION, MONITORING, AND TIME FRAME
________________________________________________________________________
Federal regulations require states to identify measures needed to implement TMDLs in state waterquality management plans (40 CFR 130.6). EPA has established policies which emphasize theimportance of timely development of measures to implement TMDLs that address nonpointsource discharges (memorandum from Robert Perciasepe, Assistant Administrator for Water, toEPA Regional Division Directors, August 8, 1997). EPA expects the State of California todevelop and ensure the prompt implementation of source control measures adequate to achievethe allocations in this TMDL.
EPA expects that the State of California will incorporate the TMDL, and associatedimplementation measures, into the Basin Plan, as required by 40 CFR 130.6. The State ofCalifornia should also establish a monitoring and evaluation plan that identifies parties responsiblefor implementation and monitoring and establishes a time frame for Regional Water Board reviewof monitoring results.
EPA understands that the Regional Water Board intends to implement the TMDL using data to becollected through baseline surveys (Regional Water Board, 1999). The Regional Water Boardintends to apply the sediment allocations, expressed as percent reductions, to field-basedassessments of sediment sources conducted by individual landowners on their properties. EPAsupports this approach to implementation, as long as the load allocations set in the TMDL areattained. Furthermore, EPA expects that the data collected will be useful in periodicallyreviewing the sediment budget for the Noyo River and revising the TMDL as appropriate. EPAbelieves that review of the TMDL after five to ten years would be appropriate.
The technical analysis prepared by the Regional Water Board in support of the TMDL (RegionalWater Board, 1999) describes in broad terms factors related to implementation, monitoring, andschedule that they plan to consider during the development of an implementation plan. EPAsupports the general approach described by the Regional Water Board, as outlined below.
The Regional Water Board has expressed its intention to consider the following issues during thedevelopment of an implementation plan.· The analysis based on existing data under-estimates current sediment delivery rates. The
implementation plan should include a means of identifying, mapping, and measuring andestimating actual and potential sediment delivery sites through on-the-ground, baselinesurveys.
· The implementation plan should provide procedures for identifying immediate threats to waterquality, especially potential refuge streams, and a means of reducing or eliminating thosethreats as soon as physically possible.
· The implementation plan should focus primarily on the control of sediment delivery from roadsites (i.e., timber, ranch, public, and railroad), including procedures for: inventorying roads,abandoning or obliterating roads, maintaining roads, upgrading roads, and building new roads.

73
· The implementation plan should include procedures for estimating the amount of disturbedarea on a given property and reducing the disturbed area over time. Similarly, it shouldinclude procedures for estimating the miles of road (i.e., timber, ranch, public and railroad)hydrologically connected to watercourses and reducing that hydrologic connection over time. Further, the implementation plan should include procedures for inspecting stream crossings,evaluating causes of failure and diversion, and reducing the rate of stream crossing failuresand diversions over time.
· The implementation plan should include procedures for identifying unstable areas andreducing the risk of sediment delivery from them, including existing landslides, inner gorges,headwall swales, other potential landslide-prone areas, and stream banks.
· The implementation plan should include procedures for characterizing the potential of theriparian zone to produce large woody debris for ensuring an increase in the number andvolume of key pieces of large woody debris over time. Similarly, it should include proceduresfor evaluating the need for large woody debris installations in potential refuge streams andidentify options for their funding/implementation.
· The implementation plan should include procedures for characterizing the potential of theriparian zone to filter eroded soil prior to its discharge as sediment and increase the filteringpotential, as possible.
· The implementation plan should include procedures for evaluating appropriate lag timesbetween timber harvests, timber harvest rates, and timber harvest locations (e.g., in smalldrainages) to determine likely effects on peak flows, annual flows, and suspended sediment. Itshould include procedures for increasing lag times, reducing harvest rates, and reducingharvest in small drainages over time.
The Regional Water Board has expressed its intention to consider the following issues during thedevelopment of a monitoring plan.· The monitoring plan should specifically state the hypotheses that are to be tested via
monitoring as a way of assessing, over time, the degree to which the program as designed isaccomplishing the goals.
· The monitoring plan should include methods, locations, and frequency of monitoringnecessary to determine compliance with the load allocations.
· The monitoring plan should include methods, locations, and frequency of hillslope and/or in-stream monitoring necessary to assist landowners in the identification of tributaries requiringimmediate modification to management practices or mitigation.
· The monitoring plan should include methods, locations, and frequency of monitoringnecessary to establish trends in habitat and stream channel conditions over time.
· The monitoring plan should include methods, locations, and frequency of monitoringnecessary to characterize regions of the watershed for which there is little or no existing data.
The Regional Water Board has expressed its intention to consider the following issues during thedevelopment of an implementation schedule.· An implementation schedule should ensure that immediate threats to water quality, especially
to potential refuge streams, are reduced or eliminated as soon as physically possible.· An implementation schedule should be as short as possible to ensure timely protection of
endangered and threatened species.

74
· An implementation schedule should provide adequate time for landowners to assess theirproperty and design a TMDL-sensitive management strategy.
· An implementation schedule should provide adequate time for landowners to fix existing andpotential sediment delivery sites.
· An implementation schedule should ensure that any activities conducted after the adoption ofa Basin Plan amendment are conducted in a manner consistent with the TMDL.
· An implementation schedule should provide adequate time for monitoring data to reflecthillslope changes and changes in the in-stream environment, including changes tomanagement-related facilities (i.e., roads, skid trails, etc.), the riparian zone, the stream bank,and in-stream habitat.

75
CHAPTER XPUBLIC PARTICIPATION
________________________________________________________________________
Federal regulations require that TMDLs be subject to public review (40 CFR 130.7). The Stateof California and EPA have provided for public review through several mechanisms.
To date, the Regional Water Board has solicited the following public involvement.· A newsletter (Noyo River Watershed News: Watershed Planning for the Future, Winter
1998/99) was sent to the Noyo River mailing list requesting information and data relevant tothe development of the TMDL (January 1999).
· Telephone and face-to-face meetings were conducted with those who responded to therequest for information/data (February-May 1999).
· A rough draft of the Regional Water Board’s technical analysis in support of developing theTMDL and summary of existing supporting data were circulated to interested parties forreview and comment (May 1999).
· Comments were considered in the development of the final draft of the Regional WaterBoard’s report (May-June 1999).
· A newsletter (Noyo River Watershed News: Watershed Planning for the Future, Summer1999) was sent to the Noyo River mailing list announcing the availability of the final draft ofthe TMDL for review (June 1999).
· The final draft of the Regional Water Board’s report and supporting document werecirculated to interested parties for review.
· Comments were considered in the development of the final Regional Water Board report(June-August 1999).
The EPA draft TMDL was based on the report submitted by the Regional Water Board on 23August 1999.
EPA provided several opportunities for public participation in the review of the draft TMDL. EPA invited public comment on the EPA draft TMDL in a public notice, dated 8 October 1999. The public notice was published in the Santa Rosa Press Democrat, the Ukiah Daily Journal, andthe Eureka Times Standard and mailed to a list of interested parties identified by the RegionalWater Board. EPA held an informal public meeting, on 12 October 1999, at the Fort BraggTown Hall, to present the document to interested persons. EPA held a public hearing, on 26October 1999, in Redway to receive oral and written comments from the public on the draftTMDL. Written comments were also mailed to EPA.
EPA considered all written comments and oral testimony at the hearing on the proposed TMDL. EPA prepared a responsiveness summary (EPA, 1999) which shows how EPA considered thepublic comments in its final decision. In response to comments, EPA clarified language in severalsections of the TMDL, including the Numeric and Other Targets chapter.

76
REFERENCES________________________________________________________________________
Beechie, Timothy J., and Thomas H. Sibley. 1997. “Relationships between channel characteristics, woody debris,and fish habitat in northwestern Washington streams.” Transactions of the American Fisheries Society, 126. Pp.217-229.
Bilby, Robert E., and James W. Ward. 1989. “Changes in characteristics and function of woody debris withincreasing size of streams in western Washington.” Transactions of the America Fisheries Society, 118. Pp. 368-378.
Brown, L.R., P.B. Moyle, and R.M. Yoshiyama. 1994. “Historical decline and current status of coho salmon inCalifornia.” North America Journal of Fisheries Management. Vol. 4, No. 2. Pp. 237-261.
Burns, James W. 1970. “Spawning bed sedimentation studies in northern California streams.” Calif. Fish andGame, 56(4). Pp. 253-270.
Burns, James W. 1971. “The carrying capacity for juvenile salmonids in some northern California streams.” Calif.Fish and Game, 57(1). Pp. 44-57.
Cafferata, Peter H., and Thomas E. Spittler. 1998. “Logging impacts of the 1970’s vs. the 1990’s in the CasparCreek watershed.” In Proceedings of the Conference on Coastal Watersheds: The Caspar Creek Story, May 6,1998. Robert R. Ziemer, editor. Pp. 103-116.
California Department of Forestry and Fire Protection (CDF). 1994. “Coho salmon habitat impacts: Qualitativeassessment technique for Registered Professional Foresters (Draft No. 2).” Prepared for the Board of Forestry.Sacramento, CA. November 1994.
California Department of Forestry and Fire Protection. 1997. “California Forest Practice Rules.” Title 14,California Code of Regulations, Chapters 4 and 4.5 with the Z’Berg Nejedley Forest Practice Act. January 1997version.
Crump, Spencer. 1998. The California Western “Skunk” Railroad. Zeta Publishers Company. Fort Bragg, CA.
Department of Fish and Game. 1995(a). “Stream Inventory Report: South Fork Noyo River.” Yountville, CA.
Department of Fish and Game. 1995(b). “Stream Inventory Report: Parlin Creek.” Yountville, CA.
Department of Fish and Game. Unpublished (a). Biosample database.
Department of Fish and Game. Unpublished (b). Stream surveys of the upper Noyo River in 1957 and of RedwoodCreek in 1957 and in 1966.
Department of Fish and Game. Unpublished (c). Stream surveys of the North Fork of Noyo River, Hayworth Creek,and North Fork of Hayworth Creek in 1957 and North Fork Noyo River, Hayworth Creek and Middle Fork ofNorth Fork Noyo River in 1967.
Department of Fish and Game. Unpublished (d). Stream surveys of Kass Creek in 1957, 1959, and 1966; NorthFork of South Fork Noyo River in 1957 and 1959; South Fork Noyo River in 1957, 1959 and 1967; and ParlinCreek in 1957 and 1959.
Dietrich, William. 1997. Presentation at a meeting held by Louisiana-Pacific Corporation on 15 and 16 May 1997,entitled “Forest Management: Keeping sediment out of the streams.” Calpella, CA.

77
Dietrich, William. 1998. Letter to Robert Klamt of North Coast Regional Water Quality Control Boardtransmitting comments on the draft Garcia River Water Quality Attainment Strategy for Sediment. 19 January1996 (sic).
Dietrich, W.E., R. Real de Asua, J. Coyle, B. Orr, and M. Trso. 1998. “A validation study of the shallow slopestability model, SHALSTAB, in forested lands of Northern California.” Prepared for Louisiana-PacificCorporation, Calpella, CA. 29 June 1998.
Division of Mines and Geology. 1982. “Geology and geomorphic features related to landsliding, Glenblair NE 7.5’quadrangle (NE ¼ Comptche 15’), Mendocino County. Compiled by Richard T. Kilbourne, Geologist.
Division of Mines and Geology. 1983. “Geology and geomorphic features related to landsliding, Fort Bragg 7.5’quadrangle, Mendocino County.” Compiled by Richard T. Kilbourne, Geologist.
Division of Mines and Geology. 1984. “Geology and geomorphic features related to landsliding, Willits NW 7.5’quadrangle, Mendocino County, California.” Compiled by Richard T. Kilbourne, Geologist.
Environmental Protection Agency. 1991. “Guidance for water quality-based decisions: The TMDL process. EPA440/4-91-001.
Environmental Protection Agency. 1998. “South Fork Trinity River and Hayfork Creek sediment total maximumdaily loads.” Region IX Water Division. San Francisco, CA. December 1998.
Environmental Protection Agency. 1999. “Noyo River total maximum daily load for sediment; commentresponsiveness summary.” Region IX Water Division. San Francisco, CA. 16 December 1999.
Flanagan, S.A., M.J. Furniss, T.S. Ledwith, M.A. Love, K. Moore, and J. Ory. 1998. “Methods for inventory andenvironmental risk assessment of road drainage crossings.” Water/Road Interaction Technology Series (in press).USDA Forest Service, Technology and Development Program, Draft. 17 September 1994. 54 pp.
Flosi, Gary, and Forrest L. Reynolds. 1994. “California salmonid stream habitat restoration manual.” Sacramento,CA.
Furniss, Mike. 1999. “Case Study #3: Putting channel monitoring in context.” In Using stream geomorphiccharacteristics as a long-term monitoring tool to assess watershed function: a workshop. Co-sponsored by Fish,Farm, Forests, and Farm Communities Forum; Simpson Timber Company; National Marine Fisheries Service;Environmental Protection Agency; Forest Science Project; and the Americorp Watershed Stewards Program.Edited by Ross N. Taylor, M.S. Arcata, CA.
Harvey, Bret C., and Rodney J. Nakamoto. 1996. “Effects of steelhead density on growth of coho salmon in smallcoastal California stream.” Transactions of the American Fisheries Society. Vol. 125. Pp. 237-243.
Jones & Stokes Associates, Inc. 1997. “Georgia-Pacific Fort Bragg timberlands sustained yield plan.” April 8,1997. (JSA 96-087.) Sacramento, CA. Prepared for Georgia-Pacific Corporation, Fort Bragg, CA.
Knopp, Chris. 1993. “Testing indices of cold water fish habitat.” North Coast Regional Water Quality ControlBoard and California Department of Forestry, Santa Rosa, CA.
Lewis, Jack. 1998. “Evaluating the impacts of logging activities on erosion and suspended sediment transport inthe Caspar Creek watersheds.” In Proceedings of the Conference on Coastal Watersheds: The Caspar Creek Story,May 6, 1998. USDA Forest Service Gen. Tech. Rep. PSW-GTR-168.
Lisle, T. E. 1986. “Stabilization of a gravel channel by large streamside obstructions and bedrock bends, JacobyCreek, northwestern California.” Geological Society of America Bulletin 8:999-1011.

78
Lisle, Thomas E. 1989. “Sediment transport and resulting deposition in spawning gravels, north coastalCalifornia.” Water Resources Research. Vol. 25, No. 6. Pp. 1303-1319. June.
Lisle, T.E., and S. Hilton. 1992. “The volume of fine sediment in pools: an index of sediment supply in gravel-bedstreams.” Water Res. Bulletin, 28:2. Pp. 371-383. Paper No. 981120. April 1992.
Lisle, T.E. and H.M. Kelsey, 1982. “Effects of large roughness elements on the thalweg course and pool spacing.”In American geomorphological field group field trip guidebook, 1982 conference, Pinedale, Wyoming. L. B.Leopold, editor. American Geophysical Union, Berkeley, California.
Madej, Mary Ann. 1999. “Time, space, and rates of change in channel monitoring.” In Using stream geomorphiccharacteristics as a long-term monitoring tool to assess watershed function: a workshop. Co-sponsored by Fish,Farm, Forests, and Farm Communities Forum; Simpson Timber Company; National Marine Fisheries Service;Environmental Protection Agency; Forest Science Project; and the Americorp Watershed Stewards Program.Edited by Ross N. Taylor, M.S. Arcata, CA.
Matthews & Associates. 1999. “Sediment source analysis and preliminary sediment budget for the Noyo River.”Weaverville, CA. (Contract 68-C7-0018. Work Assignment #0-18.) Prepared for Tetra Tech, Inc. Fairfax, VA.
Megahan, W.F.1982. “Channel sediment storage behind-obstructions in forested drainage basins draining thegranitic bedrock of the Idaho Batholith. In Sediment budgets and routing in forested drainage basins. F.J.Swanson, R.J. Janda, T. Dunne, and D.N. Swanston, editors. U.S. Forest Service Research Paper PNW-141.
Mendocino Redwood Company. Unpublished. “ Draft Noyo River watershed analysis.”
North Coast Regional Water Quality Control Board. 1994. Water quality control plan for the North Coast region.Adopted 9 December 1993. Santa Rosa, CA.
North Coast Regional Water Quality Control Board. 1999. Analysis of sediment-related sources and water qualityimpacts in the Noyo River watershed. Dated 23 August 1999.
O’Connor, Matthew, and Robert Ziemer. 1989. “Coarse woody debris ecology in a second-growth Sequoiasempervirens forest stream.” USDA Forest Service Gen. Tech. Rep. PSW-110.
Pacific Watershed Associates. 1998. “Sediment source investigation for the lower Eel River (draft).” Prepared forU.S. Environmental Protection Agency, San Francisco, CA. January 1998.
Pitlick, John. 1982. “Sediment routing in tributaries of Redwood Creek basin, Northwestern California, RedwoodNational Park, Arcata, California.”
Reid, Leslie. 1999. “Case Study #1.” In Using stream geomorphic characteristics as a long-term monitoring toolto assess watershed function: a workshop. Co-sponsored by Fish, Farm, Forests, and Farm Communities Forum;Simpson Timber Company; National Marine Fisheries Service; Environmental Protection Agency; Forest ScienceProject; and the Americorp Watershed Stewards Program. Edited by Ross N. Taylor, M.S. Arcata, CA.
Shirazi, M.A., W.K. Seim, and D.H. Lewis. 1981. “Characterization of spawning gravel and stream systemevaluation.” In Proceedings from the conference on salmon spawning gravel: a renewable resource in the PacificNorthwest. Washington State University. Washington Water Research Center Report 39, Pullman. Pp. 227-278.
Stebbins, Beth. 1986. The Noyo. Bear and Stebbins. Mendocino, CA.
Surfleet, Christopher, and Robert Ziemer. 1996. “Effects of forest harvesting on large organic debris in coastalstreams.” In Proceedings of the Conference on Coast Redwood Forest Ecology & Management, 18-20 June 1996.John LeBlanc, Technical Coordinator and Editor, U.C. Cooperative Extension, Forestry.
79
Trush, Bill. 1999. “Know your X’s and Y’s.” In Using stream geomorphic characteristics as a long-termmonitoring tool to assess watershed function: a workshop. Co-sponsored by Fish, Farm, Forests, and FarmCommunities Forum; Simpson Timber Company; National Marine Fisheries Service; Environmental ProtectionAgency; Forest Science Project; and the Americorp Watershed Stewards Program. Edited by Ross N. Taylor, M.S.Arcata, CA.
USDA Forest Service. 1994. “Environmental assessment for the implementation of interim strategies for managinganadromous fish-producing watershed in eastern Oregon and Washington, Idaho, and portions of California.”Washington, D.C.
Valentine, Bradley E., and Marc Jameson. 1994. “Little North Fork Noyo Fishery Study, 1992.” CaliforniaDepartment of Forestry and Fire Protection: Coast Cascade Region. Santa Rosa, CA.
Weaver, W.E., and D.K. Hagans. 1994. “Handbook for forest and ranch roads: a guide for planing, designing,constructing, reconstructing, maintaining and closing wildland roads.” Prepared for the Mendocino CountyResource Conservation District, Ukiah, CA, in cooperation with the California Department of Forestry and FireProtection and the USDA Soil Conservation Service. 149 pages + appendices.
Ziemer, Robert. 1998. “Flooding and stormflows.” In Proceedings of the Conference on Coastal Watersheds: TheCaspar Creek Story, May 6, 1998. USDA Forest Service Gen. Tech. Rep. PSW-GTR-168. Pp. 15-24.
Zimmerman, R.C., J.C. Goodlet, and G.H. Comer, 1967. “The influence of vegetation on channel form of smallstreams. In Symposium on river morphology. International Association of Scientific Hydrology Publication 75,Wallingford, England.

80
GLOSSARY________________________________________________________________________
Aggradation To fill and raise the elevation of the stream channel by deposition of sediment.
Alternative prescriptions Timber harvesting methods, including site-specific regeneration or intermediate treatmentmethods, that accomplish the goals of the Forest Practices Act in a more effective or morefeasible way than the standard silvicultural methods.
Anadromous Refers to aquatic species which migrate up rivers from the sea to breed in fresh water.
Areas of instability Locations on the landscape where land forms are present which have the ability todischarge sediment to a watercourse.
Baseline data Data derived from field-based monitoring or inventories used to characterize existingconditions and used to establish a database for planning or future comparisons.
Beneficial Use Uses, as designated in the Basin Plan, of waters of the state that may be protected againstquality degradation including, but not limited to, domestic, municipal, agricultural andindustrial supply; power generation; recreation; aesthetic enjoyment; navigation; and thepreservation and enhancement of fish, wildlife and other aquatic resources or preserves.
Basin Plan The Water Quality Control Plan, North Coast Region-- Region 1.
Cable yarding That system of skidding (transporting) logs by means of cable (wire rope) to the yardingmachine (yarder) or a landing while the yarder remains stationary.
CDF The California Department of Forestry and Fire Protection.
Controllable source Any source of sediment with the potential to enter a water of the state which is caused byhuman activity and will respond to mitigation, restoration, or altered land management.
Debris torrents Long stretches of bare, generally unstable stream channel banks scoured and eroded by theextremely rapid movement of water-laden debris, commonly caused by debris sliding orroad stream crossing failure in the upper part of a drainage during a high intensity storm.
Deep seated landslide Landslides involving deep regolith, weathered rock, and/or bedrock, as well as surficialsoil. Deep seated landslides commonly include large (acres to hundreds of acres) slopefeatures and are associated with geologic materials and structures.
DFG The California Department of Fish and Game.
DMG The California Department of Conservation, Division of Mines and Geology.
Drainage structure A structure or facility constructed to control road runoff, including (but not limited to)fords, inside ditches, water bars, outsloping, rolling dips, culverts or ditch drains.
EPA The United States Environmental Protection Agency.
Embeddedness The degree that larger particles (boulders, rubble or gravel) are surrounded or covered byfine sediment. It is usually measured in classes (<25%, 25-50%, 50-75%, and >75%)according to percentage of random large particles that are covered by fine sediment.

81
Evenaged management Timber harvesting techniques, including clearcut regeneration, seed tree regeneration,and shelterwood regeneration. In a clearcut, timber is removed in one harvest andregeneration is accomplished by direct seeding, planting, sprouting or by natural seed fall. In seed tree regeneration, timber is removed in one harvest; but, seed trees are leftdistributed throughout the harvest area for natural regeneration. In shelterwoodregeneration, timber is removed in three harvests: the preparatory step improves crowndevelopment; the seed step promotes natural reproduction from seed; and the removal stepremoves timber, including the protective overstory trees.
Facility For purposes of the target for disturbed area, a facility is defined as any management-related structure such as a road, railroad roadbed, skid trail, landing, harvest unit, animalholding pen, or agricultural field (e.g., pasture, vineyard, orchard, row crops). A harvestunit or agricultural field that retains its natural characteristics with respect to rainfallinterception, rainfall infiltration, and soil protection, is not considered a facility.
Flooding The overflowing of water onto land that is normally dry.
Fluvial erosion Essentially synonymous with gully erosion, it includes: downcutting in roadside ditches,streams diverted out of culverts and through road fill as a result of plugged culverts,gullies resulting from “shot gun” culverts, etc.
Fry A young juvenile salmon after it has absorbed its egg sac and emerged from the redd.
GIS Geographic Information System.
Grilse A young salmon which returns early to fresh or brackish waters.
Habitat inventory The identification of individual habitat units (e.g., pool, riffle, or flatwater) that arefurther defined by their origin and/or orientation (e.g., backwater pool, boulder-formed),as described by Flosi and Reynolds (1994). A basin-level habitat inventory is designed toproduce a thorough description of the physical fish habitat.
HAA Headwaters Assessment Area
Habitat length The entire length of stream surveyed during a habitat inventory.
Inner gorge A geomorphic feature formed by coalescing scars originating from mass wasting anderosional process caused by active stream erosion. The feature is identified as that area ofstream bank situated immediately adjacent to the stream, having a slope generally over65% and being situated below the first break in slope above the channel.
Inside ditch The ditch on the inside of the road, usually at the foot of the cutbank.
Intermediate treatments Timber harvesting techniques, including commercial thinning and sanitation salvagelogging. Commercial thinning is the removal of trees in a young-growth stand tomaintain or increase average stand diameter, promote timber growth, and/or improveforest health. Sanitation salvage logging is the removal of insect attacked or diseasedtrees in order to maintain or improve the health of the stand.
Landslide Any mass movement process characterized by downslope transport of soil and rock, undergravitational stress by sliding over a discrete failure surface-- or the resultant landform.
Large woody debris A piece of woody material having a diameter greater than 30 cm (12 inches) and a lengthgreater than 2 m (6 feet) located in a position where it may enter the watercourse channel.

82
MAA Mainstem Noyo River Assessment Area.
Mass wasting Downslope movement of soil mass under force of gravity-- often used synonymously with"landslide.” Common types if mass soil movement include rock falls, soil creep, slumps,earthflows, debris avalanches, debris slides and debris torrents.
NFAA North Fork Noyo River Assessment Area.
Numeric targets A numerical expression of the desired in-stream or hillslope environment. For eachpollutant or stressor addressed in the problem statement, a numeric target is developed.
Permanent drainage A road drainage structure designed and constructed to remain in place following activestructure land management activities while allowing year round access on a road.
Permanent road A road planned and constructed to be part of a permanent all-season transportationfacility. These roads have drainage structures, if any, at watercourse crossings thataccommodate the fifty-year flood flow and have a surface that is suitable for hauling forestproducts throughout the winter period. Normally they are maintained during the winterperiod.
Planning Watershed The uniform designation and boundaries of sub-basins within a larger watershed. Thesewatersheds are described by CDF as Cal Water Watersheds.
Redd A gravel nest or depression in the stream substrate formed by a female salmonid in whicheggs are laid, fertilized and incubated.
Regional Water Board Regional Water Quality Control Board, North Coast Region.
Seasonal road A road planned and constructed as part of a permanent transportation facility; but has asurface adequate for hauling forest products only in non-winter periods and extended dryperiods or hard frozen conditions occurring during the winter period. It has drainagestructures, if any, at watercourse crossings that will accommodate the fifty-year flood flow. Some maintenance usually is required.
Sediment Fragmented material that originates from weathering of rocks and decomposed organicmaterial that is transported by, suspended in, and eventually deposited by water or air.
Sediment budget An accounting of the sources, movement, storage and deposition of sediment produced bya variety of erosional processes, from its origin to its exit from a basin.
Sediment delivery Material (usually referring to sediment) which is delivered to a watercourse channel bywind, water or direct placement.
Sediment discharge The mass or volume of sediment (usually mass) passing a watercourse transect in a unit of
time. Sediment erosion The group of processes whereby sediment (earthen or rock material) is loosened,
dissolved and removed from the landscape surface. It includes weathering, solubilizationand transportation.
Sediment source The physical location on the landscape where earthen material resides which has or mayhave the ability to discharge into a watercourse.

83
Sediment yield The sediment yield consists of dissolved, suspended and bed loads of a watercoursechannel through a given cross section in a given period of time.
SFAA South Fork Noyo River Assessment Area.
Shallow seated A landslide produced by failure of the soil mantle on a steep slope (typically to a depth ofone or two meters; sometimes includes some weathered bedrock). It includes debrisslides, soil slips and failure of road cut-slopes and sidecast. The debris moves quickly(commonly breaking up and developing into a debris flow) leaving an elongated, concavescar.
SHALSTAB A coupled, steady-state runoff and infinite-slope stability model that can be used to mapthe relative potential for shallow landsliding across a landscape.
Skid trail Constructed trails or established paths used by tractors or other vehicles for skidding logs. Also known as tractor roads.
Smolt A young salmon at the stage at which it migrates from fresh water to the sea.
Special prescriptions Timber harvesting techniques, including: (1) site-specific treatments for special areas suchas ecological reserves, historical sites, or archaeological sites and (2) the rehabilitation ofunderstocked areas. Rehabilitation includes the harvesting of an understocked area andsubsequent restocking to meet stocking standards.
Steep slope A hillslope, generally greater than 50% that leads without a significant break in slope to awatercourse. A significant break in slope is one that is wide enough to allow thedeposition of sediment carried by runoff prior to reaching the downslope watercourse.
Stream See watercourse.
Stream class The classification of waters of the state, based on beneficial uses, as required by theDepartment of Forestry in Timber Harvest Plan development. See definitions for Class I,Class II, Class III, and Class IV for more specific definitions.
Stream order The designation (1,2,3, etc.) of the relative position of stream segments in the drainagebasin network. For example, a first order stream is the smallest, unbranched, perennialtributary which terminates at the upper point. A second order stream is formed when twofirst order streams join. Etc.
Sub-basin A subset or division of a watershed into smaller hydrologically meaningful Watersheds. For example, the North Fork Noyo River watershed is a sub-basin of the larger Noyo Riverwatershed.
Swale A channel-like linear depression or low spot on a hillslope which rarely carries runoffexcept during extreme rainfall events. Some swales may no longer carry surface flowunder the present climatic conditions.
Tail-out The lower end of a pool where flow from the pool, in low flow conditions, discharges intothe next habitat unit.
Temporary road A road that is to be used only during the timber operation. It must have a surfaceadequate for seasonal logging use and have drainage structures, if any, adequate to carrythe anticipated flow of water during the period of use.

84
Thalweg The deepest part of a stream channel at any given cross section.
Thalweg profile Change in elevation of the thalweg as surveyed in an upstream-downstream directionagainst a fixed elevation.
THP Timber harvest plan.
TMDL Total Maximum Daily Load.
Tractor yarding That system of skidding (transporting) logs by a self-propelled vehicle, generally bydragging the logs with a grapple or chokers.
Transition regeneration Timber harvesting method used to create an unevenaged stand from a stand with anunbalanced, irregular or evenaged structure.
USGS The United States Geological Survey.
Unevenaged management Timber harvesting techniques whose attributes include the establishment and/ormaintenance of a multi-aged, balanced stand structure, promotion of growth on leave treesthroughout a broad range of diameter classes, and encouragement of natural reproduction. Unevenaged management techniques include the selection regeneration method andtransition regeneration method. In the selection method, trees are removed individuallyor in small groups sized from 0.25 to 2.5 acres. The transition method is used to create anunevenaged stand from a stand with an unbalanced, irregular or evenaged structure.
Unstable areas Characterized by slide areas, gullies, eroding stream banks, or unstable soils. Slide areasinclude shallow and deep seated landslides, debris flows, debris slides, debris torrents,earthflows and inner gorges and hummocky ground. Unstable soils includeunconsolidated, non-cohesive soils and colluvial debris.
V* A numerical value which represents the proportion of fine sediment that occupies thescoured residual volume of a pool. Pronounced “V-star.”
Watercourse Any well-defined channel with a distinguishable bed and bank showing evidence ofhaving contained flowing water indicated by deposit of rock, sand, gravel, or soil.
Waters of the state Any ground or surface water, including saline water, within the boundaries of the state.
Watershed Total land area draining to any point in a watercourse, as measured on a map, aerial photoor other horizontal plane. Also called a basin, drainage area, or catchment area.
Water quality criteria Limits or level of water quality constituents or characteristics which are established for thereasonable protection of beneficial uses of water or the prevention of nuisance within aspecific area.
Water quality objective Water quality criteria as described in the Basin Plan.
Water quality standard Consist of the beneficial uses of water and the water quality objectives as described in theBasin Plan.
Water Year An annual period used to record rainfall, beginning on 1October and ending on 30September of the following year. For example, Water Year 1999 began on 1 October1998 and ended 30 September 1999.