Embed Size (px)
Citation preview

6 YBL JOURNAL OF BUILT ENVIRONMENT Vol. 1 Issue 1 (2013)
NOVEL MEASUREMENTS IN PRIMARY SETTLING TANKS OF LARGE MUNICIPAL WASTEWATER TREATMENT
PLANTS
Katalin Kiss 1 and Miklós Patziger 2
1Institute of Civil Engineering,Ybl Miklós Faculty of Architecture and Civil Engineering, Szent István University, Budapest, Hungary
[email protected] Komplex Engineering, Budapest, Hungary
Abstract: This paper shows the in situ analysis of a primary settling tank (PST) at the Graz Municipal Wastewater Treatment Plant (500 000 PE). The study aims at the deeper understanding of primary settling tanks behaviour by measurement of flow pattern within the tank and suspended solids (SS) separation.
Measurement campaigns were carried out at different surface overflow rates (a main measure of PST load), that ranged from low to even higher values than recommended ones by design guidelines. During the measurements the inflowing and outflowing SS concentrations and loads were registered on-line. The flow pattern (3D velocity measurements, turbulence characteristics) was measured by using Acoustic - Doppler - Velocimetry (ADV) in raster [1]. The settling function was carried out by laboratory test at Budapest Central Wastewater Treatment Plant, which was investigated at representative concentration of PST.
The measurements provided detailed insight into the flow and mass transport processes within the PST and valuable calibration and verification data for further CFD modelling.
Keywords: waste water treatment, primary settling tanks, CFD
1. INTRODUCTION
In the wastewater treatment process, PSTs are used to remove primary (raw) sludge from waste water. Common used design guidelines (e.g. ATV A 131-2000, [2]) recommend calculation of the removal efficiency by using the diagrams of Sierp [3] and Greeley (1938) (cited by [4]) shown in Figure 1:
10.2478/jbe-2013-0001
Unauthenticated | 193.6.201.128Download Date | 9/26/13 4:25 PM

7YBL JOURNAL OF BUILT ENVIRONMENT Vol. 1 Issue 1 (2013)
Figure 1: Sierp’s diagram [3]; TSS: Total Suspended Solids, BOD: Biochemical Oxygen Demand
The two main design parameters of PSTs using in practice are the hydraulic surface overflow rate, q [m3/m2h; m/h] and the hydraulic retention time (HRT) [h]. The further details of tank design are usually based on empirical experiences [2].
The local flow measurement in primary settling tanks can be similar than in secondary settling tanks, and both contain fine velocity components. In the following part the development of flow measurement is described in secondary settling units till present.
Designing secondary settling tanks was based on the suppositions of Hazen [5], that the secondary settling tanks in longitudinal direction (radius direction in case of circle shaped tanks) look like an uniformly flown through point source.
Anderson [6] made the first flow velocity measurements with swimming velocity measurement in a 27 m long, square shaped, longitudinal flow secondary settling tank. He showed that against the suppositions of Hazen [5], different flow structures can be developed in several deep zones of secondary settling tanks according to the density.
Ponn [7] measured the emerging low flow rates with thermo sensor. Due to this much improved quality method he could publish more punctual results than the results of Anderson [6] were. Results of Anderson [6] were confirmed fundamentally by Ponn [7]. He also extended the description of flow structures to circle shaped secondary settling tanks. Along the depth of the tank the effect of different densities for the flow image were verified by comparing measurements in secondary settling tanks filled with clear groundwater instead of sludge-wastewater mixture.
Due to appearance of the ultrasonic velocimeters more accurate observation of emergent flow rates in secondary settling tanks could be done. This method was applied by Larsen [8], Krebs [9] and Deininger [10]. Larsen [8] was the first who registered turbulent velocity fluctuant in an examined square shaped longitudinal flow tank.
Unauthenticated | 193.6.201.128Download Date | 9/26/13 4:25 PM
8 YBL JOURNAL OF BUILT ENVIRONMENT Vol. 1 Issue 1 (2013)
In recent years the ADV (Acoustic Doppler Velocimetry) method was developed which is based on an acoustic Doppler principle. These instruments can measure developing flow rates in fine space- and time resolution, with large preciseness. Nevertheless, for examining secondary settling tanks it was begun to apply in the latest years ([11], [12], [13], [14]).
The comprehensive knowledge of the processes within the tank is crucial by analysing the advantages and disadvantages of different geometric features, operation settings and their improvement possibilities.
2. MATERIALS AND METHODS
2.1. Fine scale flow and mass transport measurements in the primary settling tank
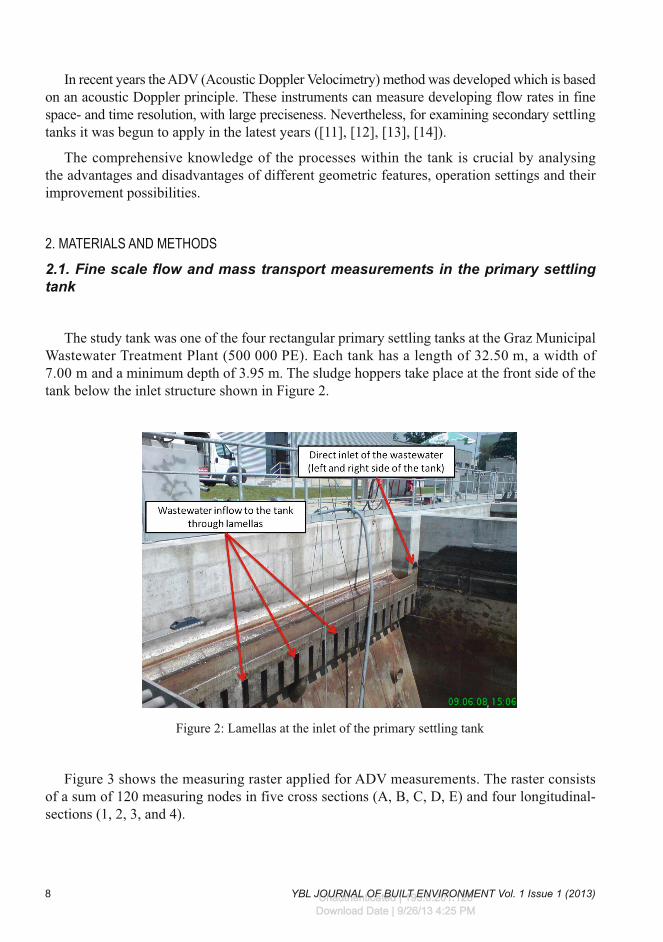
The study tank was one of the four rectangular primary settling tanks at the Graz Municipal Wastewater Treatment Plant (500 000 PE). Each tank has a length of 32.50 m, a width of 7.00 m and a minimum depth of 3.95 m. The sludge hoppers take place at the front side of the tank below the inlet structure shown in Figure 2.
Figure 2: Lamellas at the inlet of the primary settling tank
Figure 3 shows the measuring raster applied for ADV measurements. The raster consists of a sum of 120 measuring nodes in five cross sections (A, B, C, D, E) and four longitudinal-sections (1, 2, 3, and 4).
Unauthenticated | 193.6.201.128Download Date | 9/26/13 4:25 PM

9YBL JOURNAL OF BUILT ENVIRONMENT Vol. 1 Issue 1 (2013)
Figure 3: The measuring raster of primary settling tank (all dimensions in Meter)
A Nortek Vector Current Meter (ADV) shown in Figure 4 was used for measuring the flow pattern. The Vector [15] uses the Doppler Effect to measure current velocity by transmitting short pairs of sound pulses, listening to their echoes and, ultimately, measuring the change in pitch or frequency of the returned sound.
Sound does not reflect from the water itself, but rather from particles suspended in the water. These particles are typically zooplankton or suspended sediment. These small particles move with the same average speed as the water – the velocity, it measures consequently the velocity of the water.
The velocity measurement is available in 0.01-7 m/s ranges, sampling rate with 1-64 Hz (1/s). The Vector accuracy is +0.5% of measured value and +1 mm/s.
In contrast to standard Doppler profilers and current meters, the Vector is a bistatic sonar. This means that it uses separate transmit and receive beams. It transmits through a central beam and receives through three beams displaced off to the side.
Figure 4: Nortek Vector Figure 5: Solitax ts-line sc
Unauthenticated | 193.6.201.128Download Date | 9/26/13 4:25 PM

10 YBL JOURNAL OF BUILT ENVIRONMENT Vol. 1 Issue 1 (2013)
For measurement the inflowing and the outflowing SS concentrations SOLITAX ts-line sc turbidity meter (Figure 5) was used. This instrument enables the measurement of SS concentrations in a range from 0.001 mg/l to 50 g/l, covering the full scale of concentration ranges in a conventional PST. Systematic cleaning of the wiper area and LED Window is important and in this case the manually cleaning of the sensors was done one time a week.
Because of the time-varying concentration of the inflow, a calibration of TSS data from the Solitax sensors with measured TSS concentrations of the laboratory was necessary.
2.2. Sedimentation tests
As an important input toward modelling PST behaviour the sedimentation properties of settling solids are to be investigated. State of the art CFD settling tank models generally use the settling function as a mathematic description of settling, expressing the settling velocity as a function of the local SS concentration [16]. The settling function was carried out by laboratory tests shown in Figure 6.
The settling function was carried out by laboratory tests at Budapest Central Wastewater Treatment Plant. Large settling cylinders made from plexiglas served as a main tool enabling the visual observation of the settling process. The cylinder size of a height of 1.0 m and a diameter of 194 mm was large enough to avoid the wall effect which largely influences the settling velocities within the cylinder (Figure 6).
Figure 6: Primary sludge sampling and settling measurement process
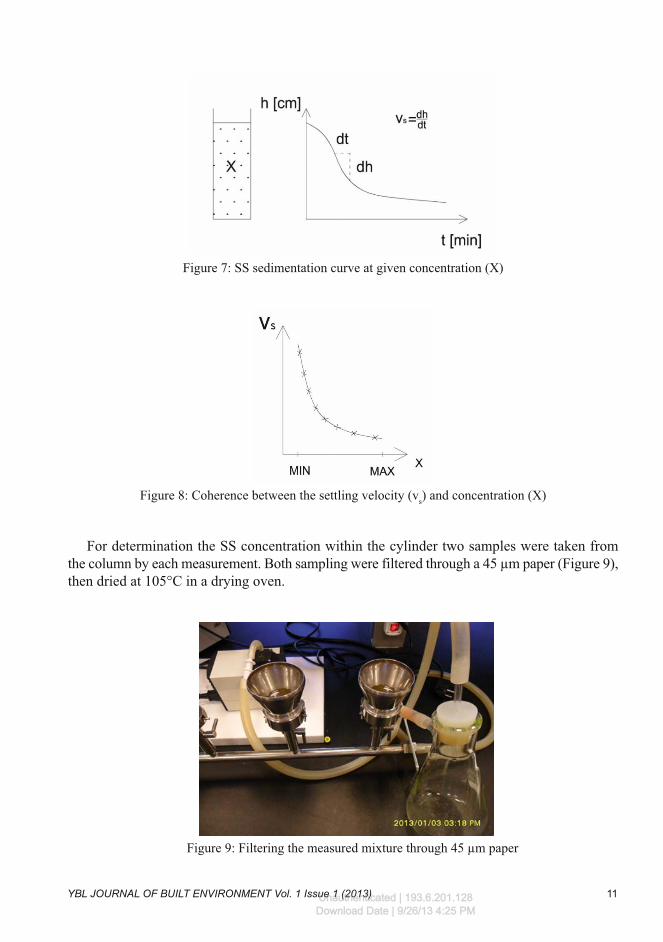
The SS sedimentation curves were obtained at each concentration by the test and series measurements. The maximum ratio of the sludge mirror of one curve gives the settling velocity at the measured concentration (Figure 7 and 8).
Unauthenticated | 193.6.201.128Download Date | 9/26/13 4:25 PM
11YBL JOURNAL OF BUILT ENVIRONMENT Vol. 1 Issue 1 (2013)
Figure 7: SS sedimentation curve at given concentration (X)
Figure 8: Coherence between the settling velocity (vs) and concentration (X)
For determination the SS concentration within the cylinder two samples were taken from the column by each measurement. Both sampling were filtered through a 45 μm paper (Figure 9), then dried at 105°C in a drying oven.
Figure 9: Filtering the measured mixture through 45 μm paper
Unauthenticated | 193.6.201.128Download Date | 9/26/13 4:25 PM

12 YBL JOURNAL OF BUILT ENVIRONMENT Vol. 1 Issue 1 (2013)
3. RESULTS
Figure 10 shows the flow pattern in one relevant longitudinal section (at longitudinal section 2) of the PST at 13, 9.5 and 5 m/h surface overflow rates.
q [m/h]
Mean HRT[min]
Velocity [cm/s]
13 14.4
9.5 19.2
5 38.2
Figure 10: Mean velocity distribution at three different surface load along the longitudinal and horizontal section of the tank
Unauthenticated | 193.6.201.128Download Date | 9/26/13 4:25 PM

13YBL JOURNAL OF BUILT ENVIRONMENT Vol. 1 Issue 1 (2013)
The inlet jet plunges with considerable downward momentum component facilitated by lamellas positioned at the inlet. This phenomenon shows one of the design failures of the inlet facility. The flow pattern is strongly affected by the high vertical velocity components induced by the inlet construction, and by the developing density current along PST length. Due to the inflow suspended solids concentrations and the stored sludge mass are much lower in PSTs than in the case of secondary settling tanks [16], the flow processes of the already settled sludge mass do not affect the flow pattern considerably. In the second half of the tank a well-developed plug - flow is to observe.
In the horizontal sections an asymmetrically distributed flow pattern is to observe in a great part of the tank, also caused by lacks in design of the inlet facility.
Figure 11 shows the mean and the 85% percentile flow velocity values at different surface overflow rates. Increasing surface overflow rates occur higher velocities and wider ranges between mean and 85 % percentile values.
Figure 11: Relationship of mean velocity and its percentile 85% and surface load in the PST
According to future research goals (CFD modelling), also turbulence features at different surface overflow rates were investigated. Figure 12 shows the strongly inhomogeneous pattern of turbulent kinetic energy within the PST, varying in a wide range, from 0 to 30 cm2/s2).
Unauthenticated | 193.6.201.128Download Date | 9/26/13 4:25 PM

14 YBL JOURNAL OF BUILT ENVIRONMENT Vol. 1 Issue 1 (2013)
q [m/h]
Mean HRT[min]
Turbulent kinetic energy
[cm2/s2]
13 14.4
9.5 19.2
5 38.2
Figure 12: Mean TKE distribution at three different surface load along the longitudinal and horizontal section of the tank
Figure 13 shows the mean values and the 85% percentile values at different surface overflow rates.
Unauthenticated | 193.6.201.128Download Date | 9/26/13 4:25 PM

15YBL JOURNAL OF BUILT ENVIRONMENT Vol. 1 Issue 1 (2013)
Figure 13: Relationship of mean turbulent kinetic energy and its percentile 85% in the PST
Similarly to the conclusions of Figure 11, higher hydraulic flow rates generate higher turbulent kinetic energies (TKE), and wider ranges of the mean and 85 % values of TKE in the tank.
Figure 14 shows the interval of SS removal depending on the surface overflow rate.
The results of Figure 15 are slightly different from that of Sierp [3] and Greeley (1938) (cited by [4]) widely used in common praxis.
Figure 14: Interval of removal efficiency of TSS
Unauthenticated | 193.6.201.128Download Date | 9/26/13 4:25 PM

16 YBL JOURNAL OF BUILT ENVIRONMENT Vol. 1 Issue 1 (2013)
Figure 15: Removal efficiency and hydraulic retention time
The SS sedimentation curve of the third measurement can be seen in Figure 16 at given SS concentration. The left part of this figure represents the measuring cylinder within the mixture of primary sludge and SEDIPAC effluent.
Figure 16: Sedimentation curve of the third measurement at given concentration
Figure 17 shows the settling function, which gives the settling velocity as function of the local concentration. The settling process in PSTs is characterised by surprisingly high settling velocities particularly in the range of low SS concentrations, even 0.180 cm/s below a SS concentration of 100 - 150 mg/l.
Unauthenticated | 193.6.201.128Download Date | 9/26/13 4:25 PM

17YBL JOURNAL OF BUILT ENVIRONMENT Vol. 1 Issue 1 (2013)
Figure 17: Settling function
4. CONCLUSIONS AND OUTLOOK
The methodology described above could successfully be applied at the investigated PST providing valuable results for deeper understanding of the hydrodynamic processes within PSTs and further research, like how are inlet features affecting flow pattern often leading to decreased tank performance, real separation efficiencies compared to the theoretical ones, velocity and turbulence ranges, absence of density waterfall described in case of secondary settling tanks [16] and first results on settling properties of solids in PSTs.
Future research goals are the setting, the calibration and verification of a computational fluid dynamic (CFD) model of the investigated tank. The model will enable the further detailed analysis flow and mass transport processes within the tank and their impact on the removal efficiency, providing important and valuable suggestions for design guidelines and for operation of wastewater treatment plants.
ACKNOWLEDGEMENT
The authors would like to thank to Prof. Harald Kainz (Graz University of Technology), Prof. János Józsa (Budapest University of Technology and Economics), the staff of the Graz Municipal Wastewater Treatment Plant and the Budapest Central Wastewater Treatment Plant for the valuable support of this research.
Unauthenticated | 193.6.201.128Download Date | 9/26/13 4:25 PM

18 YBL JOURNAL OF BUILT ENVIRONMENT Vol. 1 Issue 1 (2013)
REFERENCES
[1] KISS, K., PATZIGER M., JÓZSA J. Előülepítő medencék áramlási és leválasztási folyamatainak helyszíni mérése. MHT Vándorgyűlés, on CD, Eger, 6-8th of July 2011.
[2] ATV-DVWK, Dimensioning of Single-Stage Activated Sludge Plants. ATV-DVWK A 131E Standard, GFA Publishing Company of ATV-DVWK, Hennef. p. 57. (2000)
[3] GUJER, W. Siedlungswasserwirtschaft (Vol. 3.). Berlin: Springer. 3th Edition (2007) p. 431.
[4] METCALF & EDDY, I. Wastewater Engineering: Treatment and Reuse. New York: McGrawHill, Inc. 4th Edition (2003) p. 1819.
[5] HAZEN, A. On Sedimentation. Transactions ASCE 53. (1904).
[6] ANDERSON, N. E. Design of final settling tanks for activated sludge. Sewage Work Journal, 17 (1), (1945) 50-63.
[7] PONN, J. Geschwindigkeitsverteilung in radial durchströmten Nachklärbecken - Verwendung einer neu entwickelten Thermosonde. Veröffentlichungen des Institutes für Siedlungs- und Industriewasserwirtschaft, Grundwasserhydraulik, Schutz- und Landwirtschaftlichen Wasserbau der Technischen Universität Graz, 3, (1977).
[8] LARSEN, P. On the hydraulics of rectangular settling basins. Experimental and theoretical studies. Department of Water Resources Engineering, Lund Institute for Technology, University of Lund, p.170, (1977).
[9] KREBS, P. The hydraulics of final settling tanks. Water Science and Technology, (1991) 1037-1046.
[10] DEININGER, A. Geschwindigkeits- und Feststoffverteilung in radial durchströmten Nachklärbecken. Berichte aus Wassergüte- und Abfallwirtschaft, 131, Technische Universität München, p. 280, (1997).
[11] FREIMANN, R. Strömungsstrukturen in horizontal durchströmten Nachklärbecken. Mitteilungen des Lehrstuhls für Hydraulik und Gewässerkunde, 65, Technische Universität München. p. 233, (1999).
[12] JARDIN, N., HUNZE, M., & KREBS, P. Optimierung flacher, rechteckiger Nachklärbecken mit Hilfe von Strömungsimulationen. 35. Essener Tagung für Wasser- und Abfallwirtschaft vom 20.03.-22.03.2002, Gewässerschutz Wasser Abwasser, Nr. 188, pp. 32/1-32/24, (2002).
[13] PATZIGER, M., KAINZ, H., JÓZSA, J., & HUNZE, M. Messung und Modellierung von physikalischen Prozessen in Nachklärbecken. Österreichische Wasser und Abfallwirtschaft, Vol. 12/05, 57, (2005) pp. 177-184, Wien.
[14] PATZIGER, M. Untersuchung der Schlammbilanz in Belebungsstufen aufbauend auf Processen im Nachklärbecken. Schriftenreihe zur Wassrrwirtschaft, 48, Technische Universität Graz, p. 210, (2007).
[15] NORTEK AS User Manual. N300-100, 08.2005
[16] PATZIGER M., KAINZ H., HUNZE M., JÓZSA J. Influence of secondary settling tank performance on suspended solids mass balance in activated sludge systems. Water Research 46, (2012) 2415-2424.
Unauthenticated | 193.6.201.128Download Date | 9/26/13 4:25 PM


![Mobile Malware Madness, and How to Cap the Mad Hatters · PDF file · 2012-04-07of the first malicious Android payloads distributed via a mobile malvertisement [Lookout]. The history](https://img.dokumen.tips/doc/110x75/5aa4008d7f8b9ab4788b47e3/mobile-malware-madness-and-how-to-cap-the-mad-hatters-2012-04-07of-the-first.jpg)