Embed Size (px)
Citation preview

Rheol Acta (2011) 50:675–689DOI 10.1007/s00397-011-0551-4
ORIGINAL CONTRIBUTION
The effect of boundary curvature on the stress responseof linear and branched polyethylenesin a contraction–expansion flow
David Geraint Hassell · T. D. Lord · L. Scelsi · D. H. Klein ·D. Auhl · O. G. Harlen · T. C. B. McLeish ·M. R. Mackley
Received: 4 November 2010 / Revised: 15 March 2011 / Accepted: 12 April 2011 / Published online: 1 June 2011© Springer-Verlag 2011
Abstract The effect of flow-boundary curvature onthe principal stress difference (PSD) profiles observedthrough a contraction–expansion (CE) slit flow isevaluated for three different polyethylenes exhibitingincreasing levels of branching. Studies were performedusing both experimental optical techniques and compu-tational simulations, in the latter case to evaluate theability of constitutive models to predict these complexflows. The materials were characterised using linearand extensional rheology, which were fitted to themulti-mode ROLIE-POLY and POM-POM models
D. G. Hassell · T. D. Lord · L. Scelsi · M. R. MackleyDepartment of Chemical Engineering,University of Cambridge, Pembroke Street,Cambridge, CB2 3RA, UK
D. H. Klein · D. Auhl · T. C. B. McLeishIRC in Polymer Science and Technology,Department of Physics and Astronomy,University of Leeds, Leeds, LS2 9JT, UK
O. G. Harlen (B)Department of Mathematics, University of Leeds,Leeds, LS2 9JT, UKe-mail: [email protected]
Present Address:D. G. HassellDepartment of Chemical Engineering, University ofNottingham Malaysia Campus, Jalan Broga,43500 Semenyih, Selangor D.E., Malaysiae-mail: [email protected]
Present Address:T. C. B. McLeishDepartment of Physics, University of Durham,South Road, Durham, DH1 3LE, UK
depending upon material branching. Three CE-slitgeometries were used; with sharp corners, and withrounding equal to one quarter and one half of the slitlength. These created a mixed, but primarily simpleshear flow, with different levels of extension and sheardepending upon the level of curvature. The PSD de-veloped from an initial Newtonian profile to increasinglevels of asymmetry between the inlet and the outletflow as the level of material branching increased. Therounding was found to lead to the delocalisation of PSDwithin the flow and removal of the stress singularityfrom the corner of the CE-slit. It also led to a decreasein the pressure drop across the geometry and an “open-ing out” of features such as downstream stress fangsto create downstream “crab-claws”. Matching betweenexperiments and simulations for the time evolutionof flow from start up for each material in the variousgeometries illustrated good agreement for both models.
Keywords Stress difference · Contraction flow ·Flow visualisation · Birefringence
Introduction
Recent developments in rheological characterisation,molecular-based rheological models, numerical simu-lation and precise polymer processing now make itpossible to compare numerical prediction of a polymerprocess with experimental observations. The recentpast has witnessed a series of examples (see for in-stance, Peters et al. 1999; Agassant et al. 2002; Mitsouliset al. 2003; Clemeur et al. 2004a; Sirakov et al. 2005;Valette et al. 2006; Abedijaberi et al. 2009; Emberyet al. 2010; Lord et al. 2010; Russo and Phillips 2010;

676 Rheol Acta (2011) 50:675–689
Table 1 Material properties of the three polyethylenes
Label Description Mw (g/mol) Mw/Mn η0 (Pa s)
CM1 Linear (metallocene Catalysed) 104,000 2.07 7,900 (175 ◦C)CM3 LLCB (metallocene Catalysed) 84,000 2.2 35,000 (155 ◦C)DOW150R LDPE 242,000 11 368,000 (160 ◦C)
The values for DOW150R have been taken from previous work (den Doelder et al. 2005). It should be noted that the data in Table 1 forDOW150R (den Doelder et al. 2005) was acquired using both gel permeation chromatography (GPC) and light scattering techniques.This gives a more accurate result for branched materials than conventional GPC and leads to the different values used here than quotedelsewhere (Mw ∼ 107,000, Mw/Mn ∼ 5.8, Martyn et al. 2000
Ganvir et al. 2011; Silva et al. 2011) for flow fieldsexhibiting both regions of simple shear and extensionalflow. Different polymers, geometries, models andnumerical codes have been used. In general, reasonablesuccess has been reported in the matching of simulationwith experiment.
In the case of contraction and contraction–expansion(CE) slit geometries, most previously reported experi-ment work uses sharp corners at the inlet and outlet(see for instance, Collis and Mackley 2005; Collis et al.2005; Gough et al. 2008). While experimentally thispresents little difficulties, subsequent modelling of thegeometries has to contend with the stress singularitylocated at the sharp corner. This is generally dealtwith by adding an artificial rounding at the corner toremove the stress singularity (see for instance, Leeet al. 2001) while some numerical studies of constitutivemodels have bypassed the problem by using contractiongeometries with a set curvature.
Another aspect of the growing sophistication of thenon-Newtonian models employed in flow computationhas been their sensitivity to the branching structure ofpolymer melts. In particular, it has long been knownthat long-chain branching can completely change thenature of the extensional response of melt rheology,switching between softening to hardening regimes ofresponse, while retaining softening behaviour in shear.This phenomenon has clear empirical consequences incomplex flows (e.g. Hertel et al. 2008). A series ofmolecular-based constitutive equations (McLeish andLarson 1998; Inkson et al. 1999) successfully capturedthis behaviour both qualitatively and quantitatively.Variations on such “pom-pom” models have further-more been shown to be suited to flow-computation(see for instance, Sirakov et al. 2005). Since it is theboundary geometries of a complex flow that primarilysets the balance of shear and extensional componentsin a complex deformation gradient, it is compelling touse the comparisons now possible between flow visu-alisations and corresponding computations in a studythat varies both the degree of branching and boundarygeometry.
This paper presents a combined experimental andnumerical study of the behaviour of a range of poly-ethylenes flowing through a series of CE-slit geometrieswhich exhibit increasing levels of slit rounding. Theexperiments were carried out using a Cambridge Multi-Pass Rheometer (MPR; see, for instance, Mackley et al.1995) and this enabled small quantities of polymer to betested with precision. Three geometries were used, withlevels of rounding radii at the slit corners equivalent to0, 0.25 and 0.5 the slit length.
Similar to previous studies (see, for instance, Hassellet al. 2008) three different polymers were chosen, ex-hibiting increasing levels of branching, to characterisethe effect of this increase on the stress present withinpolymer flow. The principal stress difference (PSD) wascaptured using flow birefringence and compared to sim-ulation predictions. In order to compare the experimen-tal observation with robust simulations, it was necessaryto characterise the flow behaviour of each polymeremploying both linear oscillatory and transient rheo-logical measurements. The rheological models chosenfor fitting the experimental rheology and predicting theprocessing behaviour were the multi-mode POM-POM(McLeish and Larson 1998; Blackwell et al. 2000) andROLIE-POLY (Likhtman and Graham 2003) models.Numerical simulation of the complex flow was carriedout using the Lagrangian–Eulerian finite element soft-ware flowSolve (Harlen et al. 1995).
Table 2 ROLIE-POLY parameters gi (modulus of the ithmode), τd,i (reptation time of the ith mode) and τ r,i (rousetime of the ith mode) used in the equations outlined in section“Numerical modelling”, fitted to linear and non-linear shear data
gi (Pa) τd,i (s) τr,i (s)
280193 0.01 057480 0.0572 0.0653640.8 0.32721 0.25187.3 1.87173 0.511.2492 10.7068 0.5
The software used was Reptate (www.reptate.com), developedas part of the microscale polymer processing 2 project by JorgeRamirez and Alexei Likhtman

Rheol Acta (2011) 50:675–689 677
Table 3 POM-POM parameters τ i (linear relaxation time of theith mode), gi (modulus of the ith mode), qi (number of armsat either end of the branched molecule in the ith mode) and ri(ratio of linear to stretch relaxation time of the ith mode) used
in the equations outlined in “Numerical modeling” section, fittedto linear and uniaxial extensional data using techniques similar tothose presented in Inkson et al. (1999)
LLCB (CM3) 155◦C LDPE (DOW150R) 160◦C
τi gi gi ri τi gi gi ri
0.00626 274,740 1 1 0.0316 44,506 1 10.0217 37,838 1 1 0.1 18,936 2 20.0750 31,114 2 1.44 0.3163 12,464 3 20.259 11,775 1 1 1 8,664 4 30.899 5,663 1 1 3.1623 5,463 5 33.11 2,475 4 2.69 10 3,168 6 3.510.8 657 1 1 31.6228 1,605 7 337.2 248 5 4.43 100 718 8 4372 23.7 7 2.78 316.228 259 9 4– – – – 1000 66.6 13 3.75– – – – 3162.28 12.3 20 3
The software used was Reptate (www.reptate.com), developed as part of the microscale polymer processing 2 project by Jorge Ramirezand Alexei Likhtman
Experimental
Materials characterisation
The materials used were three polyethylenes, the prop-erties of which are outlined in Table 1. CM1 and CM3are linear and branched metallocene catalysed poly-
ethylenes repectively, which have been used previouslyin both CE slit and Cross-Slot studies (see for instance,Hassell et al. 2008; Coventry and Mackley 2008), aswell as in the exploration of rheological methods ofassessing degrees of branching (Crosby et al. 2002).DOW150R is a low-density polyethylene which hasbeen the subject of previous processing investigations
Fig. 1 a Plot of zero shearviscosity of each relaxationmode, ηi = Gi× λi, as afunction of relaxation time, λ,using the multi-modeROLIE-POLY andPOM-POM modelparameters of CM1, CM3 andDOW150R as indicated inTables 2 and 3. Transientshear and transient uniaxialelongational viscosity of bCM1 (shear only), c CM3 andd DOW150R at differentstrain-rates between 30 s−1
and 0.01 s−1. The lines aremodel calculations using therelevant model parameters(cf. Table 2). The uniaxialelongational results for CM1have been omitted as nodiscernable extensionhardening was observedduring testing. For furtherinformation please see Fig. 1of Hassell et al. (2008)
678 Rheol Acta (2011) 50:675–689
Table 4 Experimentally obtained stress optical coefficient (SOC) for the materials and corresponding principal stress difference (PSD)value per fringe for the experiments
CM1 175◦C CM3 155◦C DOW150R 160◦C
SOC ×109 (Pa−1) 1.29 1.70 2.10Stress per fringe (Pa) 40,000 30,000 24,500
While different, these values are within the literature range for polyethylene of 1.2–2.4 × 10⁻⁹ Pa−1 (Macosko 1994)
by a number of authors (see, for instance, Martyn et al.2000; Lee et al. 2001).
Examples of the relevant rheological response havebeen published for all three materials as follows: CM1(Hassell et al. 2008), CM3 (Coventry and Mackley2008) and DOW150R (see for instance, Lee et al. 2001).All three materials were characterised in both simpleshear and uniaxial extension at the same temperature asthe subsequent processing experiments; CM1 at 175 ◦C,CM3 at 155 ◦C and DOW150R at 160 ◦C. Shear flowexperiments were conducted with an ARES rheometer(Advanced Rheometric Expansion System, Rheomet-ric Scientific) in order to obtain the linear rheolog-ical and non-linear shear flow behaviour as well asthe corresponding spectra. The non-linear elongationalflow behaviour was characterised using the uniaxialstretching device SER (Sentmanat 2003; Aho et al.2010) attached to the ARES rheometer. All of the rhe-ological experiments were carried out under nitrogenatmosphere to prevent degradation (further evidencefor CM1 and DOW150R is provided in Hassell et al.2008).
The materials exhibited increasing levels of vis-coelasticity, as a result of a combination of increasedbranching and molecular weight and decreased tem-perature. The results were used to fit a set of multi-mode ROLIE-POLY parameters in the case of CM1and POM-POM parameters for CM3 and DOW150R.These parameters are given in Tables 2 and 3.
Figure 1 shows the good agreement between thetransient shear and uniaxial elongational viscosities andthose modelled by these parameters, and the contribu-tion of each mode to the zero shear viscosity for allthree materials is given in Fig. 1a. This illustrates theincreasing contribution of the longer relaxation modesto the zero shear viscosity, from CM1 to CM3 andfinally DOW150R.
The stress optical coefficient (SOC) at the processingtemperature for each material was calculated using atechnique similar to that reported previously (Lodge1955) which relates the pressure drop across a longslit to the slit wall fringe order. Further details canbe found elsewhere (Coventry 2006). The values andtheir corresponding values of PSD per fringe for thiswork are given in Table 4. As previously reported, the
variation between these results may arise both fromnatural uncertainty in the fringe counting techniqueemployed at low fringe-order regions (of the order of25%) and also from inherent differences arising fromdifferential degrees of short-chain branching.
Processing experiments
A Cambridge MPR (see, for instance, Mackley et al.1995; Hassell and Mackley 2011) was used for theprocessing experiments. Its application with an opti-cal configuration has been previously described by anumber of authors (see for instance Collis and Mackley2005).
Three different geometries used during this studyare shown in Fig. 2 and have previously been usedelsewhere (see, for instance, Hassell et al. 2009). Theyconsist of a series of CE slit geometries with a lengthto width ratio of order 1:1 and a contraction ratio ∼7:1.They comprise a sharp-edged slit (CE1) and two withincreasing levels of rounding at the slit corner, withradii 0.375 mm (mildly rounded, CE2) and 0.75 mm(fully rounded, CE3). All geometries create regions ofhigh simple shear near the slit walls and extensionalflow in the region of the symmetry line in the inlet andoutlet areas of the flow, the amount of which dependsupon material, temperature, geometry and flowrate.
For all the geometries used, the material was repeat-edly passed through the midsection, from one reservoirto the other and back again at different flow rates,allowing multiple experiments to be performed on onesample. All the geometries were 10 mm deep and whilethe aspect ratios of depth to width within the slitswere ∼7:1, equating approximately to two-dimensionalflow (Wales 1976), the inlet and outlet have an aspectratio of order 1. Three-dimensional flow is expectedin this region; however, previous work has concludedthat this three-dimensional effect may not have a greatimpact on the observed birefringence, since response isessentially linear (Clemeur et al. 2004b).
Stress-induced birefringence was captured usingmonochromatic polarised light with a wavelength of514 nm, which passed through the midsection and or-thogonal analyser before being captured using a digital

Rheol Acta (2011) 50:675–689 679
Fig. 2 Schematic outline ofCE1-3
video camera. Quarter wave plates were used to eliminatethe isoclinic extinction bands and leave only the stress-related isochromatic fringes.
The apparent wall shear rate used to characteriseflow through the CE slits was based on the solution forNewtonian flow through infinite parallel plates and isgiven as,
·•γ app = 6Q
Z 2d= 6rp
2πVp
Z 2d(1)
where Q is the volumetric flowrate (in cubic millimeterper second), Z is the width of the slit at its narrowestpoint, d is the depth of the slit (10 mm), rp is the pistonradius (in millimeters) and Vp is the speed of the pistons(in cubic millimeter per second). Note that since thecontraction ratio is approximately 7:1 the shear-ratesupstream are lower by a factor of 50.
The Weissenberg number is used to characterise thelevel of deformation experienced by the polymer, andis given by,
Wi = ·•γ appτ (2)
where τ is the viscosity-averaged relaxation time of thepolymer and can be defined as
τ =
N∑
i=1giτ
2i
N∑
i=1giτi
(3)
where gi is the modulus and τ i is the relaxation time ofthe ith mode.
There are various sources of potential experimentalerror when comparing experimental polymer flow withsimulations. A non-exhaustive list of these include:shear heating at the walls of the slit, heat losses throughthe quartz windows, slight discrepancies in the slit widthdue to manufacturing and placement and possible slipat the walls of the slit. The following design measuresand experimental protocols were taken to minimisethe effects above (given in order): large thermal massoffered by the MPR and temperature control, relatively
low heat conductivity of quartz and temperature con-trol, observation of flow due to impurities showed noslip at slit walls, high-precision manufacture (micronstolerance) and careful placement/measurement of gapbefore start of the experiment.
Numerical modelling
To model the flow of these melts, two recent con-stitutive models based on simplified versions of tubedynamics of linear and branched polymers were chosen.The linear material (CM1) is modelled using a multi-mode version of the ROLIE-POLY model (Likhtmanand Graham 2003). This is a simplified version of theGLaMM model (Graham et al. 2003) and incorporatesthe molecular motion mechanisms of reptation, chain-stretch and convective constraint release. The polymerstress is given by
σ (t) =∑
i
σ i =∑
i
giSi (t)
DSi (t)Dt
= κ · Si + Si · κT − 1τdi
(Si − I)
−2
(1−
√3
Tr(Si)
)
τRi
(
Si+β
(Tr(Si)
3
)δ
(Si − I)
)
(4)
where κκκ = (∇u)T is the velocity gradient. Each modehas two characteristic relaxation times, one for theorientation of the molecules (τ di, the linear relaxationtime) and a second for the relaxation of chain stretch(τRi the tube Rouse time). The parameters β and δ
control the influence of convective constraint releaseand are set equal to 1 and −0.5 respectively (for furtherinformation see Likhtman and Graham 2003).
The multi-mode POM-POM model was used forthe branched materials (CM3 and DOW150R), and isbased on tube theory for a branched molecule havingtwo q-armed stars connected by a backbone segment

680 Rheol Acta (2011) 50:675–689
(McLeish and Larson 1998; Inkson et al. 1999; Blackwellet al. 2000). It takes the form
σ (t) =∑
i
σ i = 3∑
i
giλ2i (t) Si (t) (5)
Si (t) = Ai (t)trAi (t)
,DAi (t)
Dt
= κ · Ai + Ai · κT − 1τbi
(Ai − I) , (6)
Dλi (t)Dt
= λi (t) κ : Si
− 1τsi
(λi (t) − 1) exp{ν∗
i (λi (t) − 1)}, λi ≤ qi
(7)
where v∗i = 2
qi−1 (McLeish 2002). In the model, eachsection of polymer backbone is considered to have twodifferent characteristic relaxation times, one for thestretch (τ s) and the other for the orientation (τ bi, thelinear relaxation time) of the backbone. For modes withqi = 1, there are no branches and since v∗
i → ∞ in thislimit λi = 1, and so the stretch Eq. 7 is not solved.
The numerical simulations were carried out usingthe Lagrangian–Eulerian finite element code flowSolve(Harlen et al. 1995; Lee et al. 2001). This uses triangularfinite elements that move and deform with the fluid,allowing the constitutive equations to be solved in theco-deforming frame of the material. Since these mate-rials have a very wide range of relaxation times, modeswith relaxation rates much faster than the fluid velocitygradients behave as Newtonian fluid with viscosity giτi.As with previous work (Lee et al. 2001), modes for
which•γ appτi < 0.01 are treated as Newtonian contribu-
tions to the stress in order to speed computation, wherea further reduction in this value has no appreciableeffect upon the final computation (Nicholson, privatecommunication 2011).
Results
In the following section, a series of experimental andmatching numerical simulations are presented and insome cases time evolution of both experiment and sim-ulation are followed. Both polymer types, linear (CMI)and branched (CM3 and Dow150R) are examined, to-gether with a progressively changing geometry from asharp edge (CE1) to a mild rounding (CE2) and fullrounding (CE3).
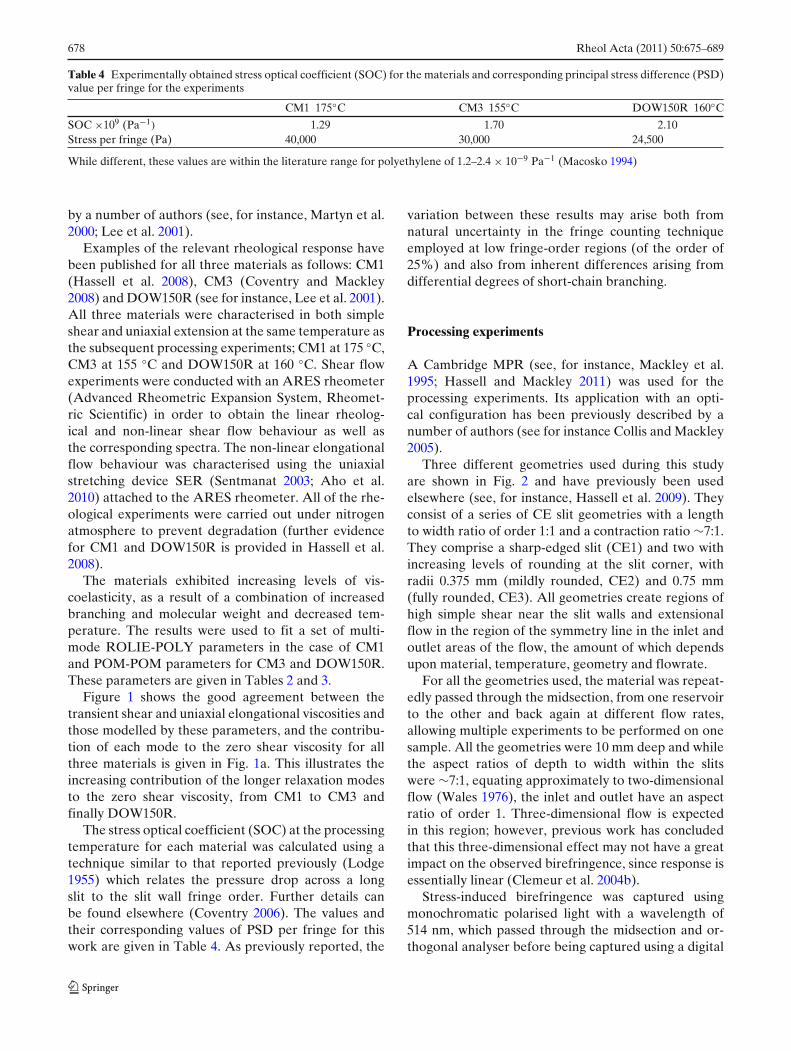
In the first sequence of matching data shown inFig. 3, the linear polymer (CM1) is shown flowinginto a sharp entry slit (CE1) for various times afterthe start of flow. The experimental data and matchingROLIE-POLY simulation shows the classic behaviourof a viscoelastic polymer which has been describedpreviously elsewhere (see, for instance, Lee et al. 2001).The steady development of PSD stress fringes in theupstream region is followed by stress rearrangementwithin the slit and relaxation in the downstream region.At this modest Wi (≈79—it should be noted that thenonlinearity responsible for most asymmetric featuresin the flow is the flow rate with respect to modestretch rather than mode orientation, or a “stretchWeissenberg number” considerably smaller than the“orientation Weissenberg number” given here) there isonly slight asymmetry between the inlet and outlet, andthe time evolution of the stress build up is very fast, withlittle difference between the 0.15 and 2.0-s sequence.The qualitative matching of the simulation with theexperimental result appears satisfactory indicating thatfor this linear polymer the ROLIE-POLY constitutiveformulation is appropriate. Comparison of pressuredrop between the two shows that the simulation overpredicts the change in pressure by approximately 20%.This is the opposite of a previous study that used thePOM-POM to model the flow of CM1 (Hassell et al.2008) and found that the simulation under-predictedthe pressure by approximately 20%. This illustrates thatwhile the ROLIE-POLY model satisfactorily matchesthe measured PSD it fails to accurately capture thepressure drop and further work is required to identifywhy this is the case.
Figures 4 and 5 show the effect that long-chainbranching can have on the stress field. Here, twobranched polymers (CM3 and Dow150R) are testedwithin the sharp edged slit (CE1) and the simula-tion now uses the POM-POM constitutive equation.With the increased Wi within the flow (CM3 ≈ 409,DOW150R ≈ 721) an increase in asymmetry betweenthe inlet and outlet is observed and well captured bythe simulations.
In both time sequences shown in Figs. 4 and 5, thereis a clear time dependence in the time evolution ofstress and in addition the development of downstream“stress fangs” as first reported by Lee et al. (2001) isclearly visible for both experiment and simulation. Thequalitative matching between experiment and simula-tion is again good, indicating that the POM-POM con-stitutive model is appropriate for these two branchedpolymers.
Although Figs. 3 to 5 appear to show very differentbirefringence structures between the three polymers,
Rheol Acta (2011) 50:675–689 681
Fig. 3 CM1 (175 ◦C) flowingat 785 mm3 s−1 in CE1,equating to an apparent wallshear rate of ≈240 s−1 and Wi≈ 79. Experimental flowbirefringence (left) andcorresponding simulatedprincipal stress differencefields (right) at a t = 0.15 s, bt = 0.25 s, c t = 0.30 s and dt = 2 s. Pressure drop acrossthe slit was given as 27 bar(experiment) and 35 bar(simulation), respectively
Fig. 4 CM3 (155 ◦C) flowingat 78.5 mm3 s−1 in CE1,equating to an apparent wallshear rate of ≈24 s−1 and Wi≈ 409. Experimental flowbirefringence (left) andcorresponding simulatedprincipal stress differencefields (right) at a t = 0.4 s, bt = 1 s, c t = 2 s and d t = 5 s.Pressure drop across the slitwas given as 6.9 bar(experiment) and 7.8 bar(simulation), respectively

682 Rheol Acta (2011) 50:675–689
Fig. 5 DOW150R (160 ◦C)flowing at 3.9 mm3 s−1 inCE1, equating to an apparentwall shear rate of ≈1.2 s−1
and Wi ≈ 721. Experimentalflow birefringence (left) andcorresponding simulatedprincipal stress differencefields (right) at a t = 6 s, b t =13 s, c t = 25 s and d t = 50 s.Pressure drop across the slitwas given as 3.4 bar(experiment) and 2.4 bar(simulation), respectively
some of this can be attributed to the differences inthe magnitudes of the stresses and hence the fringedensity. Since the relaxation times of the branchedpolymers are much longer, equivalent values of theWeissenberg number correspond to much slower flow-rates which result in lower values of principal stressdifference. In order to remove this artefact, the con-cept of ‘scaled birefringence’ is introduced when re-porting the simulation results, where the stress optical
coefficient is artificially set to be proportional to themaximum value of the principal stress difference, sothat the number of fringes is equal. In Fig. 6, this scaledbirefringence is compared between simulations of thelinear polymer CM1 and the moderately branched CM3at Weissenberg numbers of 79 and 82 respectively,which are, respectively, the highest and lowest flow-rates that could be achieved in the experiment. In thisview, it can be seen that the distribution of high values
Fig. 6 Comparison of thescaled birefringence and flowpatterns between (left) CM1at Wi = 79 (right) CM3 at Wi= 82. Time from flow startapproximately 5 s

Rheol Acta (2011) 50:675–689 683
Fig. 7 Comparison of thescaled birefringence and flowpatterns between (left) CM3at Wi = 409 (right) Dow150R at Wi = 721. Time fromflow start approximately 6 s
of PSD is actually quite similar, being concentratedaround the slit walls, but with a slight hint of a fangstructure in the case of CM3. The streamline pattern,shown in the right-hand part of the figures also ap-pears to be similar with only a slight increase in thesize of the upstream vortex relative to the downstreamvortex. Figure 7 compares the moderately branchedCM3 with the much more heavily branched Dow 150 atWeissenberg numbers of 409 and 721 which correspondto the experiments shown in Figs. 4 and 5. Here, we dosee significant differences in both the stress distributionand streamline patterns. The more heavily branchedDow 150 shows a much stronger fang structure down-stream of the slit. We also observe a large increase inthe size of the upstream vortex for Dow 150, whichbecomes convex in shape. The observations confirmthat strain hardening induced by long-chain branchingis directly responsible for the fang structures.
The effect of curvature on the experimentally ob-served birefringence is illustrated in Fig. 8 for one of thebranched polymers (CM3). This figure is representative
of the trends in PSD observed for all three materials,and elegantly illustrates the increasing delocalisation ofstress found with increasing slit rounding. As roundingis increased, the stress level decreases, and the regionof maximum stress moves along the wall from the inletcorner towards the centre of the slit. This delocalisationimproves the resolution of the stress within the experi-ments and decreases the stress concentration at the slitinlet/outlet corner. The “zero stress eye” is also seento develop from an initially triangular shape towardsthat of a circle for the most rounded geometry (CE3).The corresponding pressure drop for CM3 over a rangeof γ is shown in Fig. 9. As with the level of stress, thepressure drop over the entire range of rates is seen todecrease with increasing rounding, similar to that foundin similar circumstances for polystyrenes (Combeaudet al. 2004).
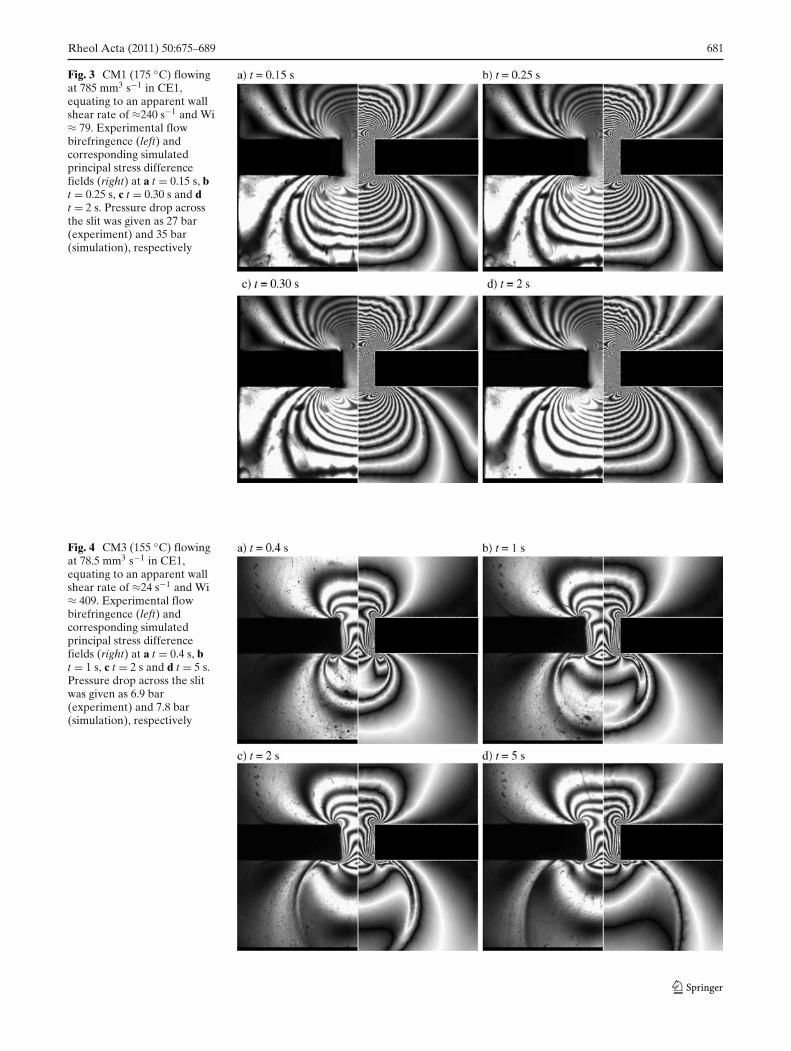
In Figs. 10, 11, 12 and 13, the effect of curvature forbranched polymers is shown as a series of time evo-lution experiments and POM-POM simulations. Fig-ures 10 and 11 show the transient evolution of the
Fig. 8 Flow induced birefringence images for CM3 (155 ◦C) flowing at 39.8 mm3 s−1, equating to an apparent wall shear rate of ≈12 s−1
and Wi ≈ 205 a CE1, b CE2 and c CE3

684 Rheol Acta (2011) 50:675–689
Fig. 9 Pressure difference comparisons between CM3 flowingthrough the three geometries. Based on the pressure transducersensitivity the experimental error is of the order plus/minus0.5 bar
experimental PSD and corresponding computationalprediction CM3 at Wi ≈ 409 (same conditions as Fig. 4in CE1) in both CE2 and CE3, respectively. It can beseen that for the same volumetric flowrate, the stresslevels are reduced with increased rounding. For thesimulations, the delocalisation of stress associated withthe increased rounding removes the need to artificially
round the slit corners as in previous work (see, forinstance, Lee et al. 2001). The prediction during thetransient evolution in CE2 match extremely well, andaccurately capture the increasingly circular appearanceof the “zero stress eye” and the transition of maximumstress away from the slit corner towards a position onthe wall in the middle of the slit. While a similar state-ment can be made about the flow in CE3, it is noted thatat the longer times shown in Fig. 11c and d, t ≥ 2 s, thelevel of stress along the symmetry centre-line is overpredicted by approximately one fringe. In both cases,the fang structure is present in a similar form to thatseen in the sharp cornered CE-slit and for this polymerthe stress field is essentially fully developed within afew seconds. The measured and simulated pressuredrops for all cases of CM3 are given in the captions ofFigs. 4, 10 and 11 (for CE1, CE2 and CE3, respectively).They show that while the simulated pressure drop fol-lows the same trend shown experimentally in Fig. 9 ofdecreasing pressure drop with increasing rounding, thesimulations over predict the pressure drop in all cases.
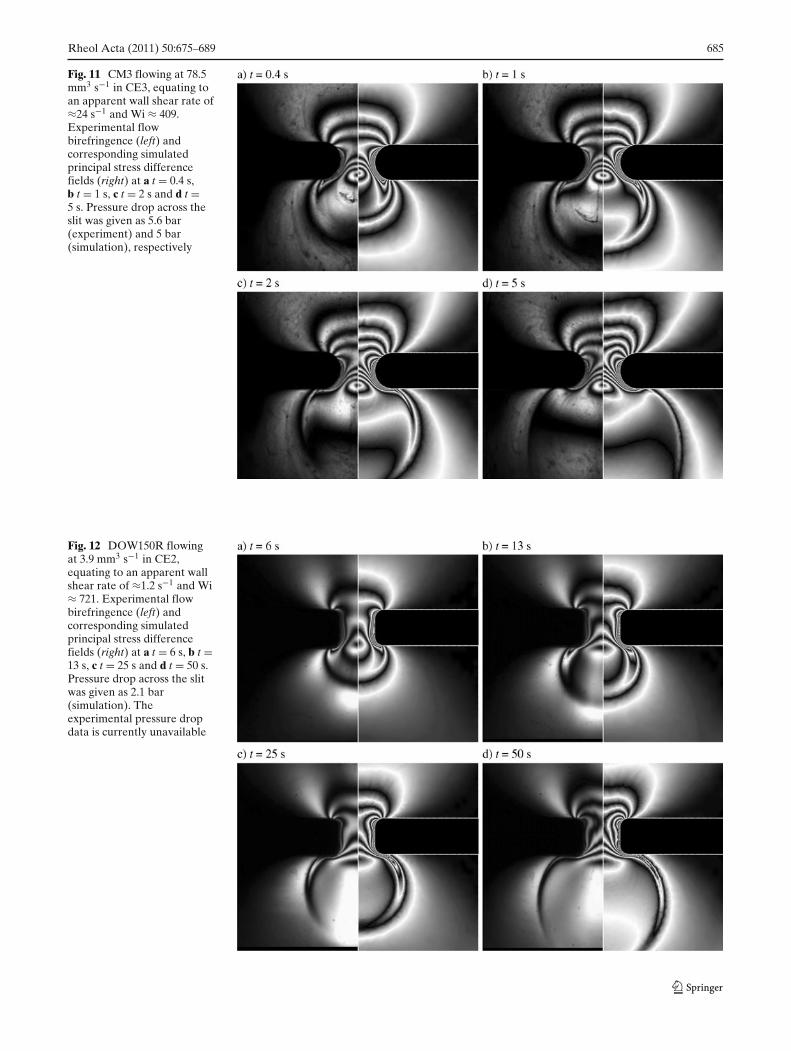
For the case of the more heavily branched polymer(Dow150R), a greater time dependence for the stressevolution is clearly seen in Figs. 12 and 13. The overall
Fig. 10 CM3 flowing at78.5 mm3 s−1 in CE2,equating to an apparent wallshear rate of ≈24 s−1 and Wi≈ 409. Experimental flowbirefringence (left) andcorresponding simulatedprincipal stress differencefields (right) at a t = 0.4 s, b t= 1 s, c t = 2 s and d t = 5 s.Pressure drop across the slitwas given as 5.85 bar(experiment) and 7.2 bar(simulation), respectively
Rheol Acta (2011) 50:675–689 685
Fig. 11 CM3 flowing at 78.5mm3 s−1 in CE3, equating toan apparent wall shear rate of≈24 s−1 and Wi ≈ 409.Experimental flowbirefringence (left) andcorresponding simulatedprincipal stress differencefields (right) at a t = 0.4 s,b t = 1 s, c t = 2 s and d t =5 s. Pressure drop across theslit was given as 5.6 bar(experiment) and 5 bar(simulation), respectively
Fig. 12 DOW150R flowingat 3.9 mm3 s−1 in CE2,equating to an apparent wallshear rate of ≈1.2 s−1 and Wi≈ 721. Experimental flowbirefringence (left) andcorresponding simulatedprincipal stress differencefields (right) at a t = 6 s, b t =13 s, c t = 25 s and d t = 50 s.Pressure drop across the slitwas given as 2.1 bar(simulation). Theexperimental pressure dropdata is currently unavailable

686 Rheol Acta (2011) 50:675–689
Fig. 13 DOW150R flowingat 3.9 mm3 s−1 in CE3,equating to an apparent wallshear rate of ≈1.2 s−1 and Wi≈ 721. Experimental flowbirefringence (left) andcorresponding simulatedprincipal stress differencefields (right) at a t = 6 s, b t =13 s, c t = 25 s and d t = 50 s.Pressure drop across the slitwas given as 2.2 bar(experiment) and 2 bar(simulation), respectively
pattern is similar to that seen in Figs. 10 and 11;however, the fang structure is more pronounced forthis polymer which has longer relaxation modes thanCM3 (illustrated in Fig. 1a and Table 3). The sim-ulation predictions match well with the experimentalresults, but while the transient evolution in CE2 andCE3 is well captured, the stress prediction at longertimes in CE1 and CE3 is over predicted by approxi-mately one fringe. It is possible that the discrepanciesfor CM3 and DOW150R may be the result of eitherthree-dimensional affects in the experiments (see, forinstance, Hertel et al. 2008 for further informationon the effects of branching on 3D flow) or a failureat higher Hencky strains to capture the behaviour ofthe materials in uni-axial rheology. The pressure dropvalues obtained (see captions for Figs. 5 and 13) showthat for DOW150R the simulations under predict thepressure drop by a similar margin to previous workusing a different POM-POM spectrum (Hassell et al.2008).
In all the simulation results presented in this work,it can be seen that in the region near the slit wallthere are thicker regions of high PSD gradients thanthose present in the experiments. This has also beenseen in previously published work (see for instance,
Collis and Mackley 2005; Hassell et al. 2008) for variousconstitutive models and numerical codes. It is unclearat this time why these are seen; there was no observedslip during experiments and the rheology presented inFig. 1 illustrates the accurate model capture of shearviscosity at higher rates. Further work will investigatethis observation and the possible relationship betweenshear and normal stresses in these regions.
Exact comparison of the simulations with experi-mental observation is difficult, and the introductionof a global best fit optimisation between experimentaland numerical results is one solution (see, for instance,Agassant et al. 2002). A global fitting parameter hasnot been used here, and the slight discrepancies notedshould not detract from the overall conclusion thatin the cases presented here the constitutive modelsaccurately predict the transient evolution of the PSDfor all three polyethylenes. The results described inthis paper represent a situation where it can now besaid with some confidence that numerical simulationsof the type used here are able to capture many complexexperimental features of polymer melt processing.
Finally, we report a detail relating to experimentobservation that as yet we have not simulated. Fig-ure 14 shows a snap shot of the PSD pattern during
Rheol Acta (2011) 50:675–689 687
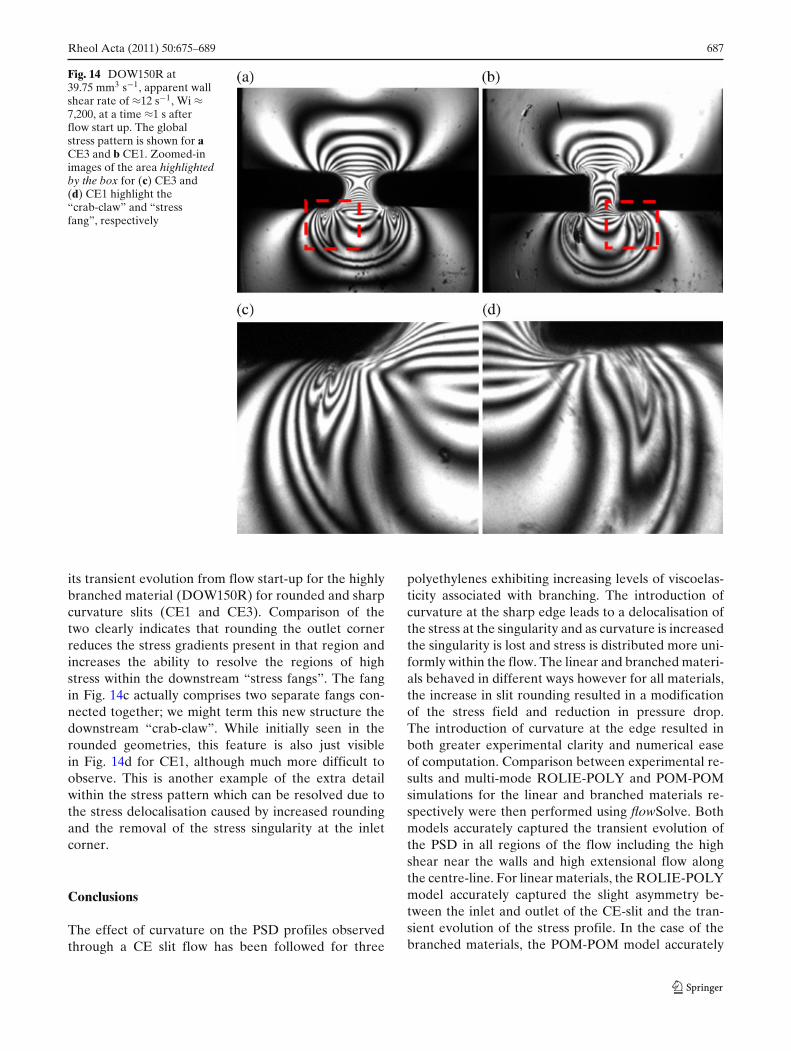
Fig. 14 DOW150R at39.75 mm3 s−1, apparent wallshear rate of ≈12 s−1, Wi ≈7,200, at a time ≈1 s afterflow start up. The globalstress pattern is shown for aCE3 and b CE1. Zoomed-inimages of the area highlightedby the box for (c) CE3 and(d) CE1 highlight the“crab-claw” and “stressfang”, respectively
its transient evolution from flow start-up for the highlybranched material (DOW150R) for rounded and sharpcurvature slits (CE1 and CE3). Comparison of thetwo clearly indicates that rounding the outlet cornerreduces the stress gradients present in that region andincreases the ability to resolve the regions of highstress within the downstream “stress fangs”. The fangin Fig. 14c actually comprises two separate fangs con-nected together; we might term this new structure thedownstream “crab-claw”. While initially seen in therounded geometries, this feature is also just visiblein Fig. 14d for CE1, although much more difficult toobserve. This is another example of the extra detailwithin the stress pattern which can be resolved due tothe stress delocalisation caused by increased roundingand the removal of the stress singularity at the inletcorner.
Conclusions
The effect of curvature on the PSD profiles observedthrough a CE slit flow has been followed for three
polyethylenes exhibiting increasing levels of viscoelas-ticity associated with branching. The introduction ofcurvature at the sharp edge leads to a delocalisation ofthe stress at the singularity and as curvature is increasedthe singularity is lost and stress is distributed more uni-formly within the flow. The linear and branched materi-als behaved in different ways however for all materials,the increase in slit rounding resulted in a modificationof the stress field and reduction in pressure drop.The introduction of curvature at the edge resulted inboth greater experimental clarity and numerical easeof computation. Comparison between experimental re-sults and multi-mode ROLIE-POLY and POM-POMsimulations for the linear and branched materials re-spectively were then performed using flowSolve. Bothmodels accurately captured the transient evolution ofthe PSD in all regions of the flow including the highshear near the walls and high extensional flow alongthe centre-line. For linear materials, the ROLIE-POLYmodel accurately captured the slight asymmetry be-tween the inlet and outlet of the CE-slit and the tran-sient evolution of the stress profile. In the case of thebranched materials, the POM-POM model accurately

688 Rheol Acta (2011) 50:675–689
captured the development of the “stress fangs” for var-ious levels of slit rounding and Weissenberg number.As with previous work (see for instance Collis andMackley 2005; Hassell et al. 2008), the models wereless successful in capturing the pressure drop acrossthe flow. While the simulations qualitatively capturedthe trend of the reduced pressure drop with increasedslit rounding, they were less quantitatively accuratefor all three materials. The results illustrate the goodpredictive ability of the two models over a range ofdeformation rates for CE-slit geometries with variouslevels of slit rounding, but also indicate that furtherwork is required to ensure that both the stress andpressure drop is accurately modelled. When simula-tions parameterised by rheometry in simple flows arecompared with experimental observation, some dis-crepancies do arise at higher Weissenberg numbersand longer times. Optimising the model from the flowitself (a “global best fit optimisation”) as discussed inAgassant et al. (2002) would yield in some cases a moreaccurate parameterisation of the model. Such a globalfitting parameter has not been used here; however, theresults described in this paper for different geometries,polymers, timescales and flowrates in our opinion rep-resent a situation where it can now be said with someconfidence that numerical simulation of the type usedhere is able to capture many complex experimentalfeatures of polymer melt processing.
Acknowledgements We would like to thank S Butler and JEmbery for useful input and discussions and Dow Chemical formaterials. All authors would like to acknowledge funding underthe EPSRC Microscale Polymer Processing 2 research project,EPSRC Contract No. GR/T11807/01.
References
Abedijaberi A, Soulages J, Kröger M, Khomami B (2009) Flowof branched polymer melts in a lubricated cross-slot channel:a combined computational and experimental study. RheolActa 48(1):97–108
Agassant JF, Baaijens F, Bastian H, Bernnat A, Bogaerds ACB,Coupez T, Debbaut B, Gavrus AL, Goublomme A, vanGurp M, Koopmans RJ, Laun HM, Lee K, Nouatin OH,Mackley MR, Peters GWM, Rekers G, Verbeeten WHM,Vergnes B, Wagmer MH, Wassner E, Zoetelief WF (2002)The matching of experimental polymer processing flowsto viscoelastic numerical simulation. Int Polym ProcessXVII(1):3–10
Aho J, Rolon-Garrido VH, Syrjala S, Wagner MH (2010) Mea-surement technique and data analysis of extensional viscos-ity for polymer melts by Sentmanat extensional rheometer(SER). Rheo Acta 49(4):359–370
Blackwell RJ, Harlen OG, McLeish TCB (2000) Molecular drag-strain coupling in branched polymer melts. J Rheol 44:121–136
Clemeur N, Rutgers RPG, Debbaut B (2004a) Numerical simula-tion of abrupt contraction flows using the double convectedPom-Pom model. J Non-Newton Fluid Mech 117:193–209
Clemeur N, Rutgers RPG, Debbaut B (2004b) Numerical eval-uation of three dimensional effects in planar flow birefrin-gence. J Non-Newton Fluid Mech 123:105–120
Collis MW, Mackley MR (2005) The melt processing of monodis-perse and polydisperse polystyrene melts within a slit entryand exit flow. J Non-Newton Fluid Mech 128(1):29–41
Collis MW, Lele AK, Mackley MR, Graham RS, GrovesDJ, Likhtman AE, Nicholson TM, Harlen OG, McLeishTCB, Hutchings L, Fernyhough CM and Young RN (2005)Constriction flows of monodisperse linear entangled poly-mers: multiscale modelling and flow visualization. J Rheol49(2):501
Combeaud C, Demay Y, Vergnes B (2004) Experimental study ofthe volume defects in polystyrene extrusion. J Non-NewtonFluid Mech 121(2–3):175
Coventry KD (2006) Cross-slot rheology of polymers. PhD The-sis, Department of Chemical Engineering, University ofCambridge
Coventry, KD, Mackley, MR (2008) Cross-slot extensional flowof polymer melts using a multi-pass rheometer. J Rheol52(2):401
Crosby, BJ, Mangnus, M, de Groot, W, Daniels, R, McLeish,TCB (2002) Characterisation of long chain branching: di-lution rheology of industrial polyethylenes. J Rheol 46:401
den Doelder, CF, Koopmans R, Dees M, Mangnus M (2005).Pressure oscillations and periodic extrudate distortions oflong-chain branched polyolefins. J Rheol 49(1):113–126
Embery J, Tassier M, Hine PJ, Lord TD (2010) An investigationinto the constriction flow of a particle reinforced polystyrenemelt using a combination of flow visualisation and finiteelement simulations. J Rheol 54(5):1097–1118
Ganvir V, Gautham BP, Pol H, Bhamia MS, Scelsi L, ThaokarR, Lele A, Mackley MR (2011) Extrudate swell of linearand branched polyethylene’s: ALE simulations and compar-ison with experiments. J Non-Newton Fluid Mech 166(1–2):12–24
Gough T, Spares R, Kelly AL, Brook SM, Coates PD (2008)Three-dimensional characterisation of full field stress andvelocity fields for polyethylene melt through abrupt contrac-tion. Plast Rubber Compos 37(2–4):158–165
Graham RS, Likhtman AE, Milner ST, McLeish TCB (2003)Microscopic theory of linear entangled polymer chains underrapid deformation including chain stretch and convectiveconstraint release. J Rheol 47:1171–1200
Harlen OG, Rallison JM, Szabo P (1995) A split Lagrangian–Eulerian method for simulating transient viscoelastic flows.J Non-Newton Fluid Mech 60:81
Hassell DG, Mackley MR (2011) The multipass rheometer; areview. J Non-Newton Fluid Mech 166:421–456
Hassell DG, Auhl D, McLeish TCB, Mackley MR (2008) Theeffect of viscoelasticity on stress fields within polyethylenemelt flow for a cross-slot and contraction–expansion slitgeometry. Rheol Acta 47:821–834
Hassell DG, Embery J, McLeish TCB, Mackley MR (2009) Anexperimental evaluation of the formation of an instability inmono and polydisperse polystyrenes. J Non-Newton FluidMech 157:1–14
Hertel D, Valette R, Münstedt H (2008) Three-dimensional en-trance flow of a low-density polyethylene (LDPE) and a

Rheol Acta (2011) 50:675–689 689
linear low-density polyethylene (LLDPE) into a slit die. JNon-Newton Fluid Mech 153(2–3):82–94
Inkson NJ, McLeish TCB, Harlen OG, Groves DG (1999) Pre-dicting low density polyethylene melt rheology in elonga-tional and shear flows with “Pom-Pom” constitutive equa-tions. J Rheol 43:873–896
Lee K, Mackley MR, Mcleish TCB, Nicholson TM, Harlen O(2001) Experimental observation and numerical simulationof transient stress fangs within flowing molten polyethylene.J Rheol 45(6):1261–1277
Likhtman AE, Graham RS (2003) Simple constitutive equa-tion for linear polymer melts derived from molecular the-ory: the ROLIEPOLY equation. J Non-Newton Fluid Mech114(1):1–12
Lodge AS (1955) Variation of flow birefringence with stress.Nature 176:838
Lord TD, Scelsi L, Hassell DG, Mackley MR, Embery J,Auhl D, Harlen OG, Tenchev R, Jimack PK, WalkleyMA (2010) The matching of 3D Rolie-Poly viscoelastic nu-merical simulations with experimental polymer melt flowwithin a slit and a cross-slot geometry. J Rheol 54(2):355–373
Mackley MR, Marshall RTJ, Smeulders JBAF (1995) The multi-pass rheometer. J Rheol 39(6):1293–1309
Macosko CW (1994) Rheology, principles, measurements andapplications. Wiley, New York
McLeish, TCB (2002) Tube theory of entangled polymers. AdvPhys 51:1379–1527
McLeish TCB, Larson RC (1998) Molecular constitutive equa-tions for a class of branched polymers: the Pom-Pom poly-mer. J Rheol 42(1):81–110
Martyn MT, Groves DJ, Coates PD (2000) In process measure-ment of apparent extensional viscosity of low density poly-ethylene melts using flow visualization. Plast Rubber Com-pos 29:14–22
Mitsoulis E, Schwetz M, Münstedt H (2003) Entry flow of LDPEmelts in a planar contraction. J Non-Newton Fluid Mech111(1):41–61
Peters GWM, Schoonen JFM, Baaijens FPT, Meijer HEH (1999)On the performance of enhanced constitutive models forpolymer melts in a cross-slot flow. J Non-Newton Fluid Mech82:387–427
Russo G, Phillips TN (2010) Numerical prediction of extrudateswell of branched polymer melts. Rheol Acta 49(6):657–676
Sentmanat ML (2003) Dual windup extensional rheometer. USPatent No 6,578,413
Silva L, Valette R, Laure P, Coupez T (2011) A new three-dimensional mixed finite element for direct numerical sim-ulation of compressible viscoelastic flows with moving freesurfaces. Int J Mater Form. doi:10.1007/s12289-011-1030-2
Sirakov I, Ainser A, Haouche M, Guillet J (2005) Three-dimensional numerical simulation of viscoelastic contractionflows using the Pom-Pom differential constitutive model. JNon-Newton Fluid Mech 126(2):163–173
Valette R, Mackley MR, Hernandez Fernandez del Castillo G(2006) Matching time dependent pressure driven flows witha Rolie Poly numerical simulation. J Non-Newton FluidMech 136(2–3):118–125
Wales JLS (1976) The application of flow birefringence to rheo-logical studies of polymer melts. PhD Thesis, Delft Univer-sity of Technology, Delft