Embed Size (px)
Citation preview
1-50 Grant Timmins Drive
Kingston, Ontario
K7M 8N2
Tel: (343) 266-0002
Fax: (343) 266-0028
Submitted To:
County of Peterborough
County Court House
470 Water Street
Peterborough, Ontario, K9H 3M3
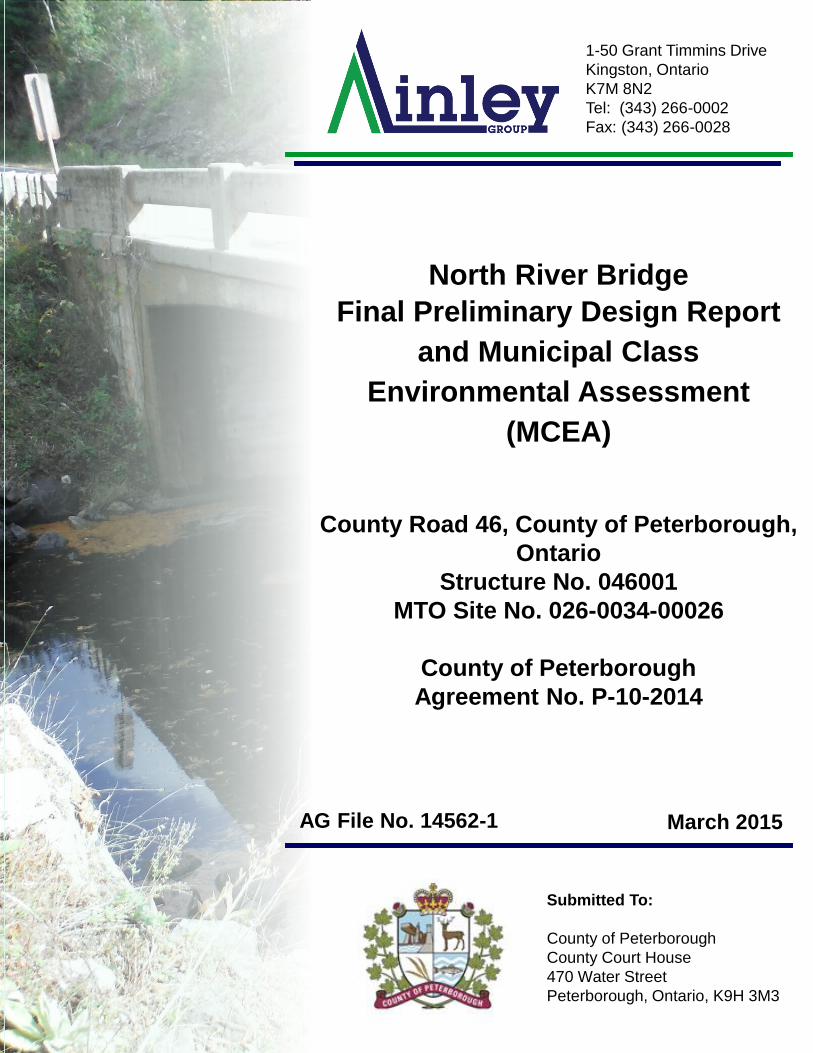
North River Bridge
Final Preliminary Design Report
and Municipal Class
Environmental Assessment
(MCEA)
County Road 46, County of Peterborough,
Ontario
Structure No. 046001
MTO Site No. 026-0034-00026
County of Peterborough
Agreement No. P-10-2014
March 2015AG File No. 14562-1
North River Bridge Final Preliminary Design Report and MCEA
County Rd. 46, Havelock, Ontario
Agreement No. P-10-2014
AG File No. 14562-1 i
EXECUTIVE SUMMARY
Ainley Group was retained by the County of Peterborough to complete a Preliminary Design and Municipal
Class Environmental Assessment (MCEA) for Structural Rehabilitation/Replacement of North River Bridge
(MTO Site No. 026-0034). This Preliminary Design Report (PDR) has been prepared to document the
planning process for the Municipal Class EA and Preliminary Design of this structure.
The Study was undertaken to obtain approval under the Ontario Environmental Assessment Act to designate,
construct, and operate the facility. This project was initiated by the County of Peterborough as a Municipal
Class EA Schedule ‘B’ project.
The goal of this study is to document the need and justification for rehabilitation/replacement of the North
River Bridge, identify the preferred rehabilitation/replacement alternative for this structure, and determine
the traffic staging/detour plan and roadway required for the scope of this project. The study will also identify
any short term and long term effects of the project on the environment. It has been confirmed that the
preferred rehabilitation/replacement alternative for this structure would be “Replacement of the bridge with
precast concrete rigid frame structure”. The scope of this alternative would involve replacement of the entire
structure with a wider structure. This would allow maintaining one lane of traffic throughout construction
using temporary traffic signals.
The Class EA planning process undertaken satisfies the provincial EA Act requirements.

North River Bridge Final Preliminary Design Report and MCEA
County Rd. 46, Havelock, Ontario
Agreement No. P-10-2014
AG File No. 14562-1 ii
TABLE OF CONTENTS
1.0 PROJECT OVERVIEW AND OBJECTIVE .............................................................................................................. 1
2.0 BACKGROUND .................................................................................................................................................. 1
2.1 Site Location ..................................................................................................................................................... 1
2.2 Background Information ................................................................................................................................... 1
3.0 EXISTING CONDITIONS .................................................................................................................................... 2
3.1 OSIM Inspection 2012 ...................................................................................................................................... 2
3.2 Summary of Detailed Bridge Deck Condition Survey ........................................................................................ 2
3.3 Summary of Detailed Bridge Substructure (abutments and wingwalls) Condition Survey ................................... 3
4.0 STUDY APPROACH AND CONSULTATION ..................................................................................................... 5
4.1 Consultation ..................................................................................................................................................... 5
4.2 Methodology .................................................................................................................................................... 5
4.3 Rehabilitation/Replacement Alternatives ........................................................................................................... 5
4.4 Evaluation Criteria and corresponding weighting factors ................................................................................... 7
4.5 Detailed discussion of Rehabilitation/Replacement Alternatives: ....................................................................... 8
4.6 Rating the Proposed Rehabilitation/Replacement Alternatives: ........................................................................ 10
4.7 Preferred rehabilitation/replacement alternative: ............................................................................................. 12
5.0 MISCELLANEOUS ............................................................................................................................................. 12
5.1 Environmental ................................................................................................................................................ 12
5.2 Hydraulic Analysis .......................................................................................................................................... 13
5.3 Traffic ............................................................................................................................................................. 16
5.4 Highway Geometrics ...................................................................................................................................... 17
5.5 Utilities ........................................................................................................................................................... 17
6.0 RECOMMENDATIONS AND CONCLUSIONS ................................................................................................. 17
7.0 CLOSING .......................................................................................................................................................... 18
APPENDIX A: 2012 BRIDGE INSPECTION REPORT
APPENDIX B: 2014 BRIDGE DECK CONDITION SURVEY REPORT
APPENDIX C: 2015 BRIDGE SUBSTRUCTURE CONDITION SURVEY REPORT
APPENDIX D: GENERAL ARANGEMENT OF PREFERRED REHABILITATION/REPLACEMENT ALTERNATIVE
North River Bridge Final Preliminary Design Report and MCEA
County Rd. 46, Havelock, Ontario
Agreement No. P-10-2014
AG File No. 14562-1 iii
LIST OF TABLES
Table 1 - Alternative A-1 Expected Design Life .............................................................................................................8
Table 2 - Alternative A-3 Expected Design Life ...........................................................................................................10
Table 3 - Alternatives Weighted Rating Table .............................................................................................................11
Table 4 - Drainage Area Information ..........................................................................................................................13
Table 5 - Peak Flow Comparison ................................................................................................................................14
North River Bridge Final Preliminary Design Report and MCEA
County Rd. 46, Havelock, Ontario
Agreement No. P-10-2014
AG File No. 14562-1 iv
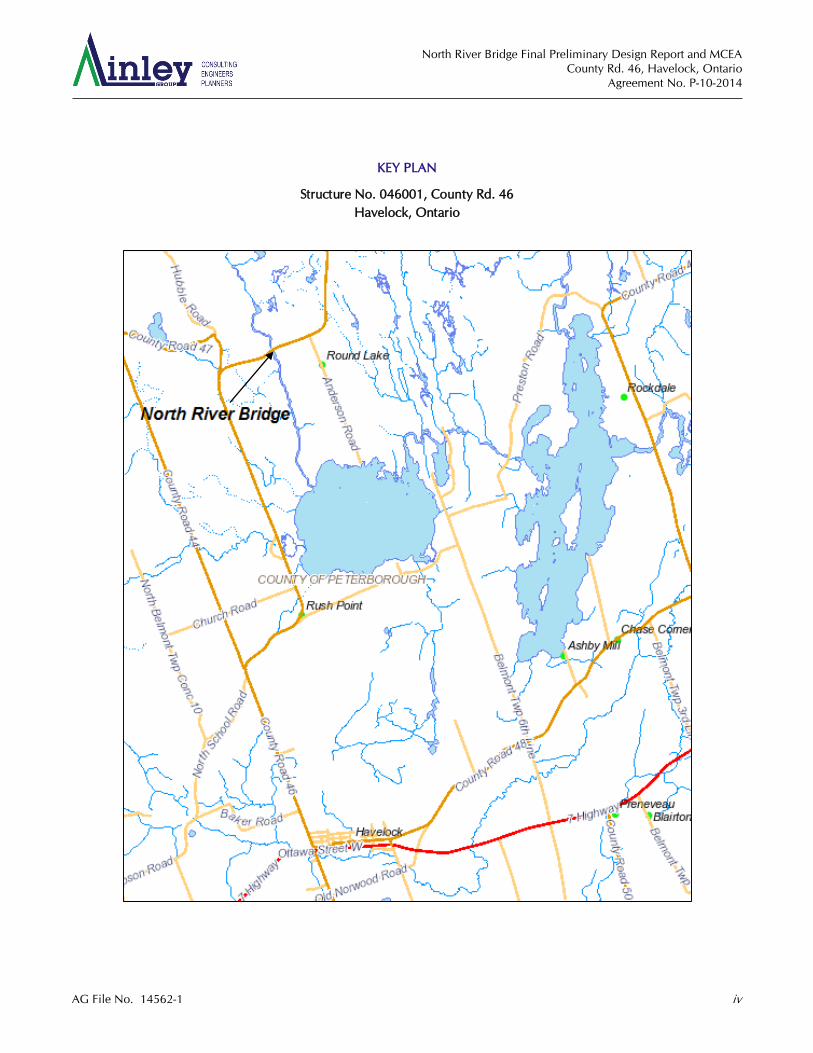
KEY PLAN
Structure No. 046001, County Rd. 46
Havelock, Ontario

North River Bridge Final Preliminary Design Report and MCEA
County Rd. 46, Havelock, Ontario
Agreement No. P-10-2014
AG File No. 14562-1 1
1.0 PROJECT OVERVIEW AND OBJECTIVE
Ainley Group was retained by the County of Peterborough to undertake a Preliminary Design and Municipal Class
Environmental Assessment (MCEA) for the structural rehabilitation/replacement of North River Bridge (Structure No.
046001, MTO Site No. 026-0034). The current structure is exhibiting deterioration in several components which
require rehabilitative action. The 2012 Ontario Structure Inspection Manual (OSIM) Appraisal recommended repairs
to the structure. The 2014 Bridge Deck Condition Survey recommended that, given the existing condition of the bridge,
a detailed investigation including cost/benefit analysis should be undertaken for the two alternative options, namely:
‘major rehabilitation’ and ‘structure replacement’. As part of the scope of work for this assignment, Ainley undertook
further visual and detailed inspection of the structure to determine appropriate rehabilitation/replacement measures.
The objective of the project is to address the identified structural concerns on North River Bridge and to recommend
best structural rehabilitation/replacement measures to the bridge so that it may continue to safely convey present and
future traffic flows.
2.0 BACKGROUND
2.1 Site Location
North River Bridge is a single span, rigid frame concrete structure, currently owned and maintained by the County of
Peterborough. The structure is located on County Road (CR) 46, approximately 1.3km east of CR 47, in the Township
of Havelock-Belmont-Methuen, County of Peterborough, Ontario. The structure spans the North River approximately
9.14 m in width and has no skew to the North River at the bridge location. The road over the structure carries two
lanes of traffic in the east-west direction with an AADT of 1,700 and percentage Truck Volume of 15% in 2014, as
reported by the County. The legal posted speed limit is 80 km/hr.
The surrounding area to the east of the structure is predominantly residential with the immediate area being comprised
of recreational cottages along the river to the south and north of the structure. Embankments at all four corners are
moderately steep and are vegetated. There are two local access roads on the southwestern and northeastern quadrants
of the structure.
There are no additional structures across the North River in close proximity to the subject structure and there is no
acceptable local road detour around the site. The shortest detour route is approximately 44 km, which creates an out-
of-way travel time of over 30 minutes.
2.2 Background Information
Based on the original drawings provided by the County of Peterborough, the existing North River Bridge structure, built
in 1966, is a single span, rigid frame concrete bridge with a deck width of 8.33 m (27’-4”), deck length of 10.36 m (34’-
0”) and total structure length of 17.37 m (57’-0”). The net clear span of the structure is 9.14 m (30’-0”). The conventional
abutments and wingwalls are supported on shallow spread footings (2’-0” deep) with a minimum vertical distance to
the soffit equal to 2.44 m (8’-0”). The existing barrier wall system is comprised of concrete railing and posts put on
concrete curbs.
A deck rehabilitation is reported to have been undertaken in 1984 with no available records on the scope of work.
The existing bridge deck is comprised of two asphalt paved lanes of traffic with a total travelled width of approximately
7.3 m curb to curb. The deck is not protected with a waterproofing system based on the findings of the latest Detailed
Bridge Deck Condition Survey carried out by G. D. Jewell Engineering Inc. in 2014.

North River Bridge Final Preliminary Design Report and MCEA
County Rd. 46, Havelock, Ontario
Agreement No. P-10-2014
AG File No. 14562-1 2
3.0 EXISTING CONDITIONS
3.1 OSIM Inspection 2012
On August 17, 2012, a detailed visual inspection was undertaken by Dane Kelly, under the supervision of Mr. D. Baxter,
P. Eng., from AECOM, on behalf of the County of Peterborough, to evaluate the condition of the substructure and
superstructure. The bridge was reported to be in overall fair to good condition with no serious evidence of structural
distress. The structure was not posted with a load limit at the time of inspection. It was confirmed that it did not require
any load limit posting. The report advises conducting a detailed bridge deck condition survey on the structure. The
following provides a summary of findings at that time and a copy of their report is presented in Appendix A.
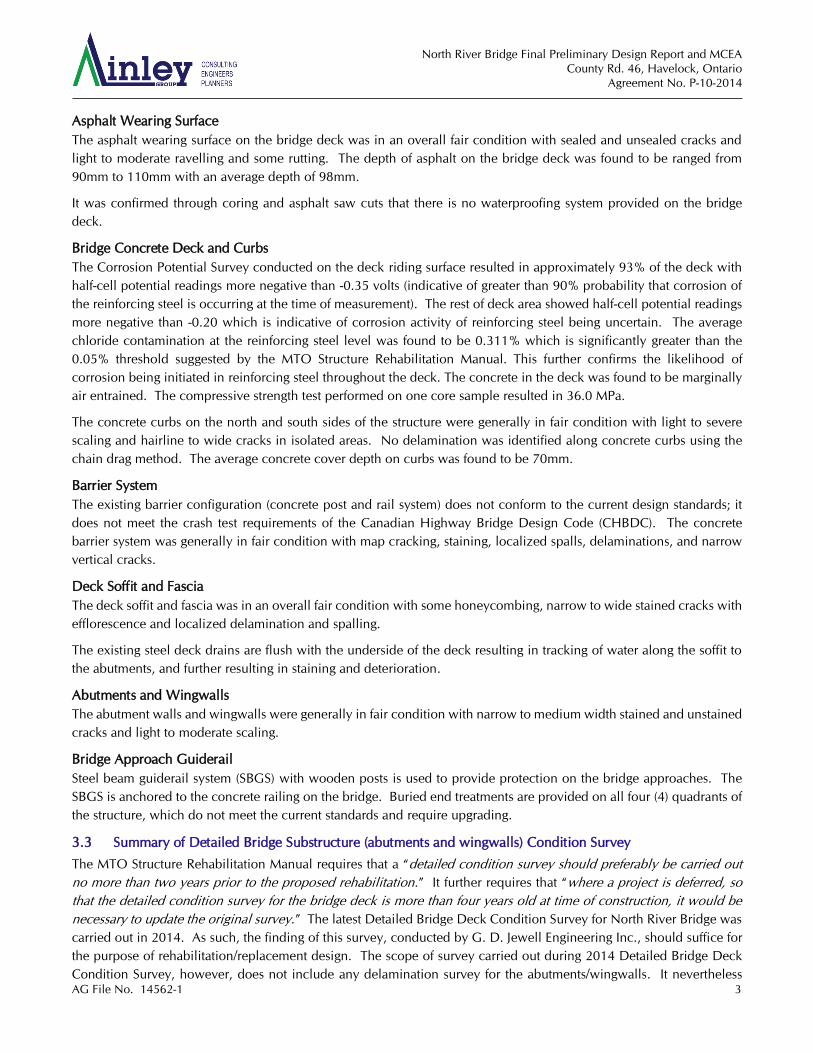
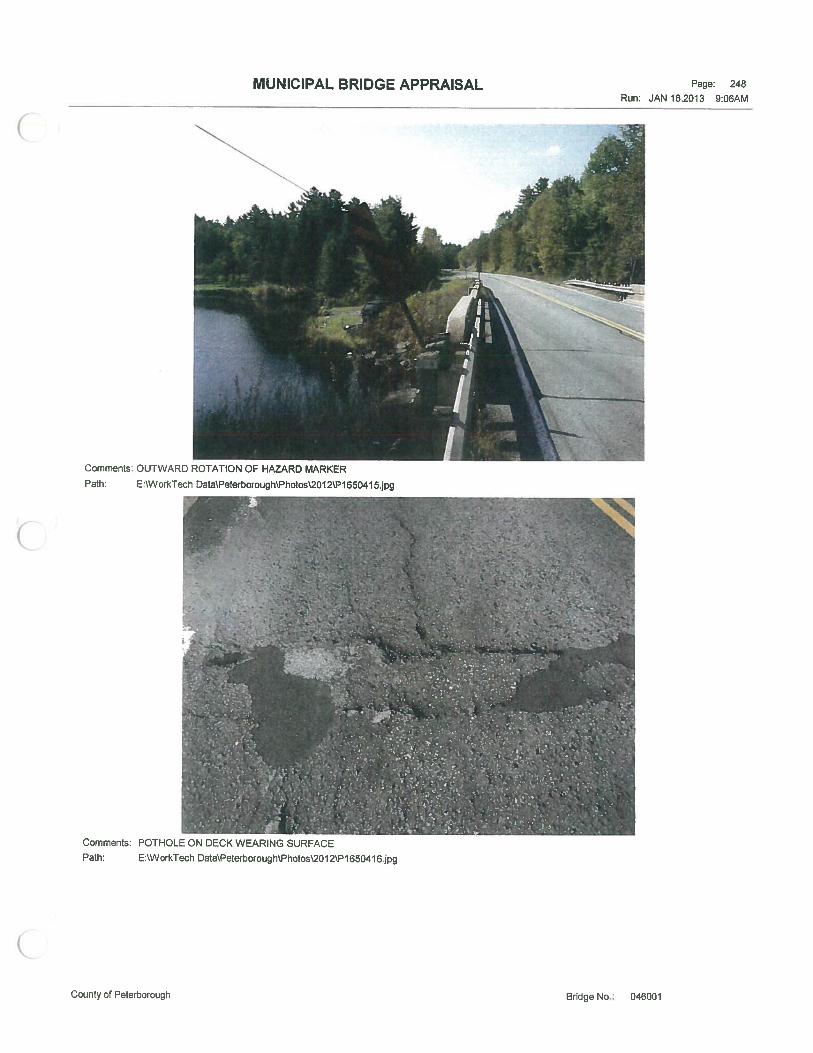
Asphalt Wearing Surface
The asphalt wearing surface was reported to be in generally good condition with wide cracking, sealed cracks, asphalt
patches, and potholes.
Barrier System and Sidewalks
The concrete railing and posts, comprising the barrier system, were reported to be in good condition, with extensive
narrow random cracking, delaminations, staining, and light scaling.
Deck Soffit
The concrete deck soffit was reported to be in good condition with minor cracking, wet areas, staining and light scaling.
Spalling and delaminations were also noted along the deck fascia and at the deck outlet locations.
Deck drainage is reported to be accommodated by six (6) 75mm diameter steel drains which outlets below the deck
soffit. (It is noteworthy that the original drawings show four (4) 100mm deck drains further confirmed by site
observations.) The existing deck drain system was reported to be extensively deteriorated with one being plugged.
Abutments and Wingwalls
Concrete abutments and wingwalls were reported to be in good condition with narrow cracking, a few delaminations
and surface rust stains.
Bridge Approaches
Asphalt-paved approaches of the structure were noted to be in an overall good condition with sealed cracking and
narrow cracks.
Steel beam guiderails, on the approaches, were reported to be in good condition with minor collision damage. Buried
end treatments are provided on all four (4) quadrants.
Embankments
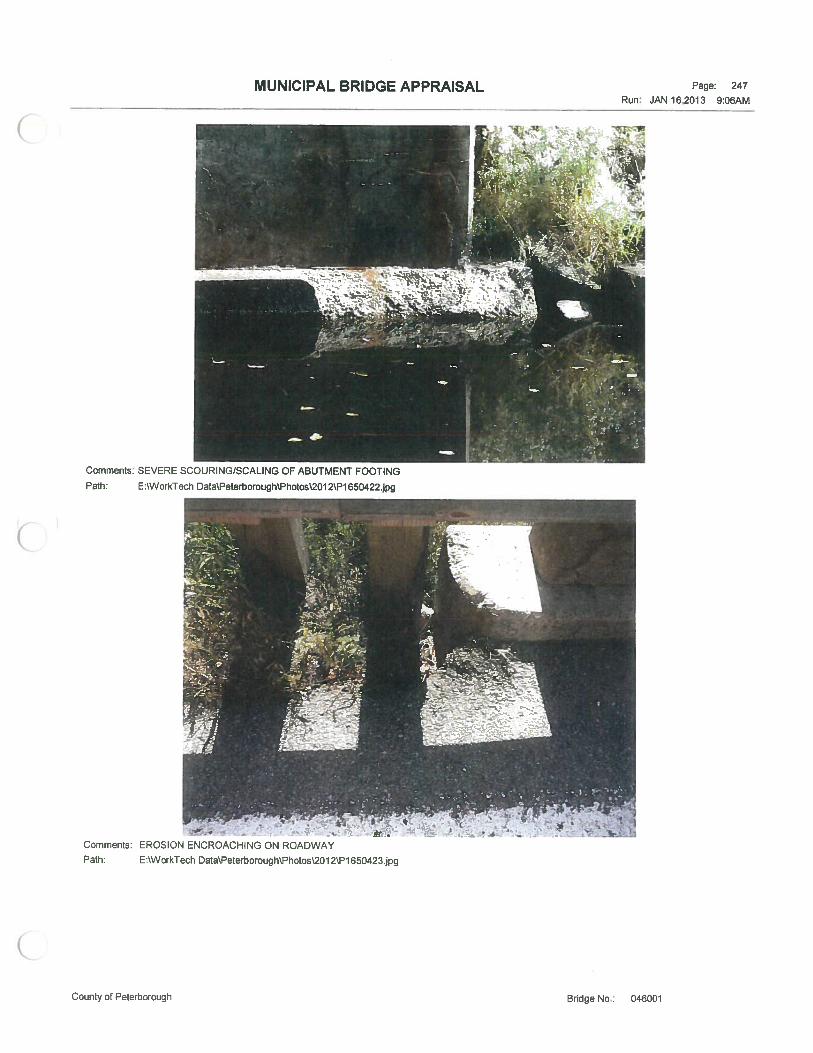
Vegetated roadway embankments were noticed to be in fair condition with erosion encroaching onto the roadway.
Watercourse
The watercourse (North River) underneath the structure was reported to not be obstructed. Scour, however, was noted
on the east abutment footing.
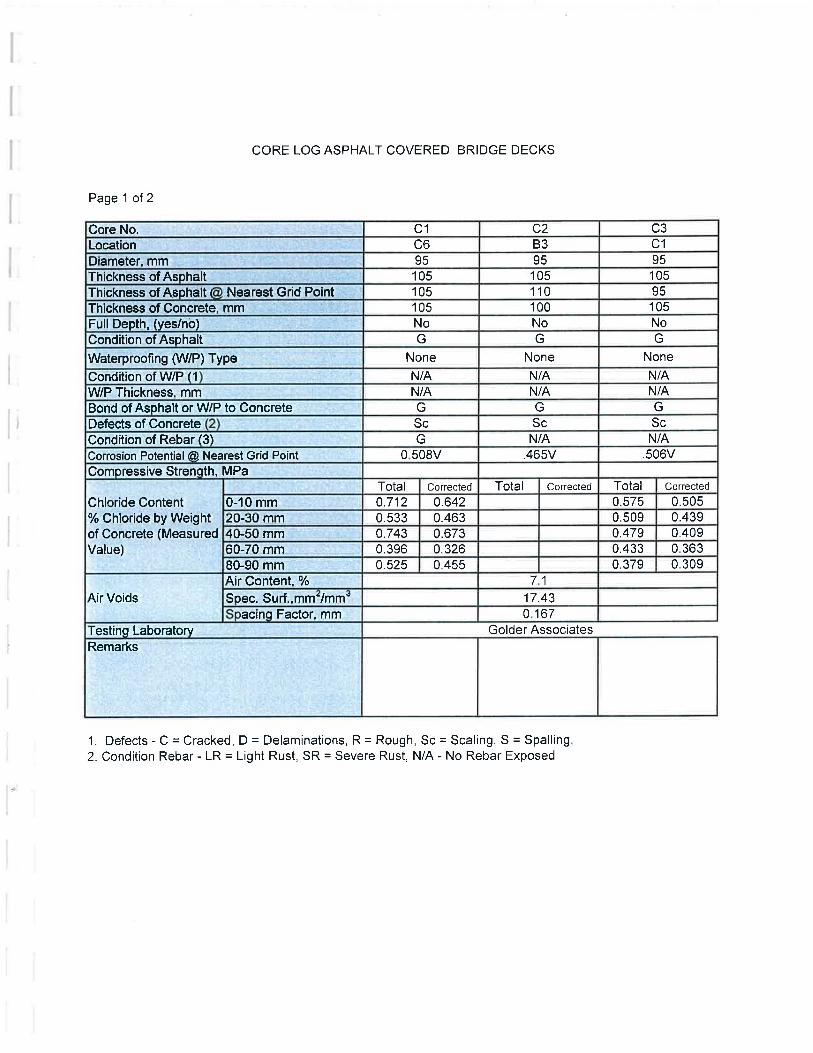
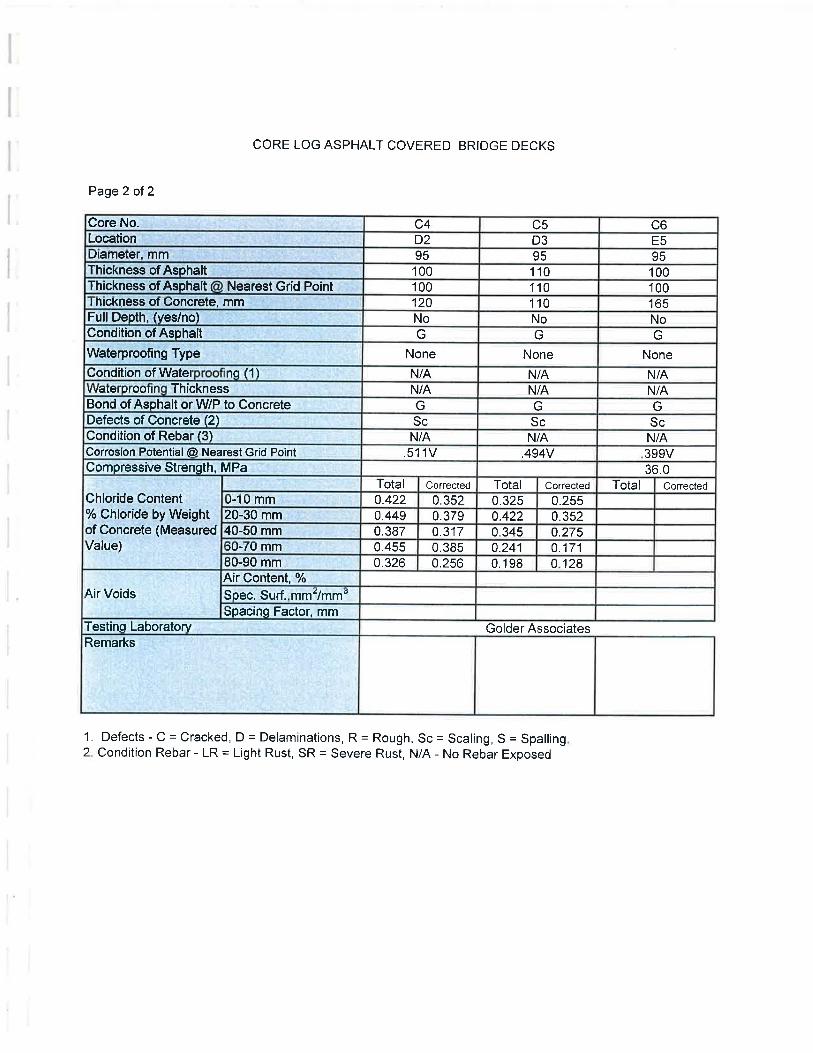
3.2 Summary of Detailed Bridge Deck Condition Survey
A detailed deck condition survey was carried out, by G. D. Jewell Engineering Inc., on North River Bridge in September
2014. The findings of this survey will be used to adequately estimate the tender quantities, and to ensure the most
effective method of rehabilitation/replacement is recommended. The findings of this survey are summarized below and
a copy of the complete Detailed Condition Survey report is presented in Appendix B.
North River Bridge Final Preliminary Design Report and MCEA
County Rd. 46, Havelock, Ontario
Agreement No. P-10-2014
AG File No. 14562-1 3
Asphalt Wearing Surface
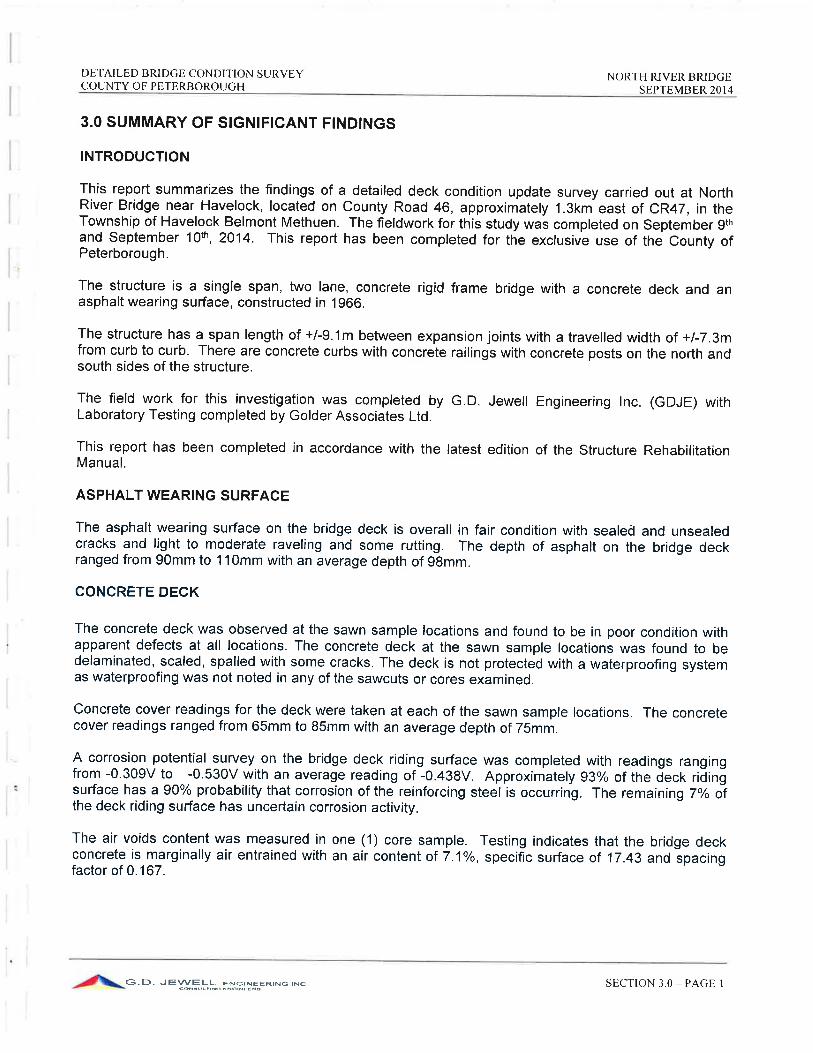
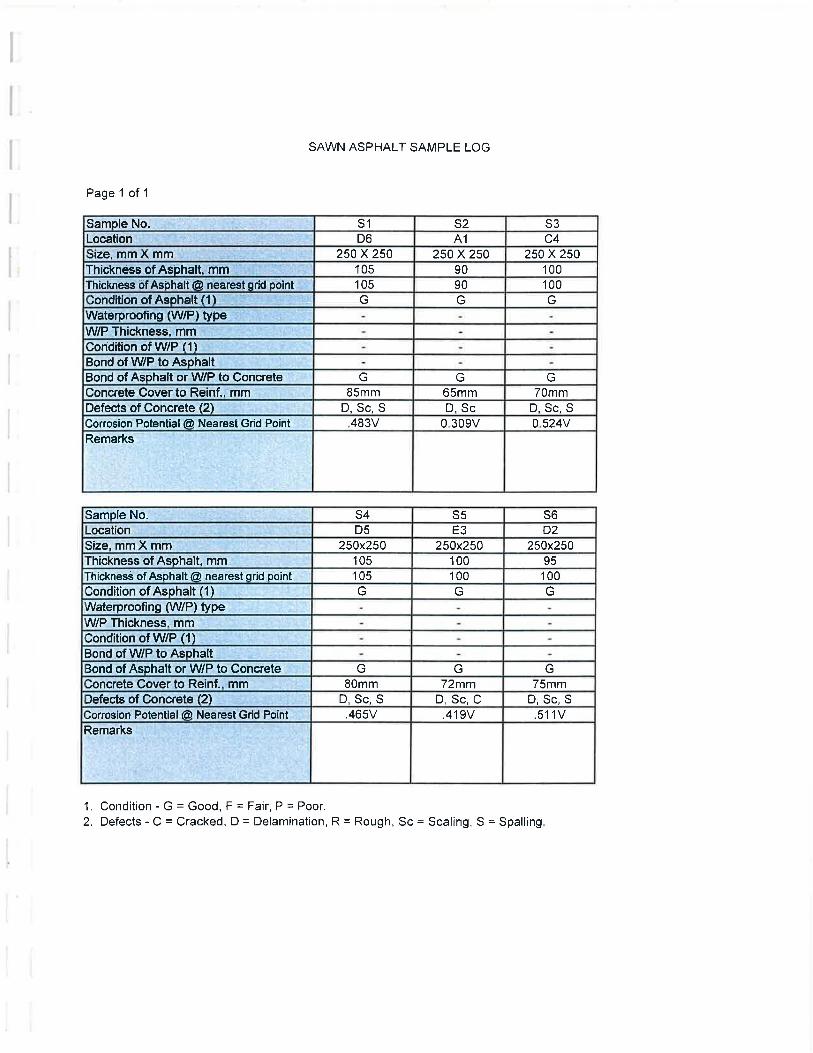
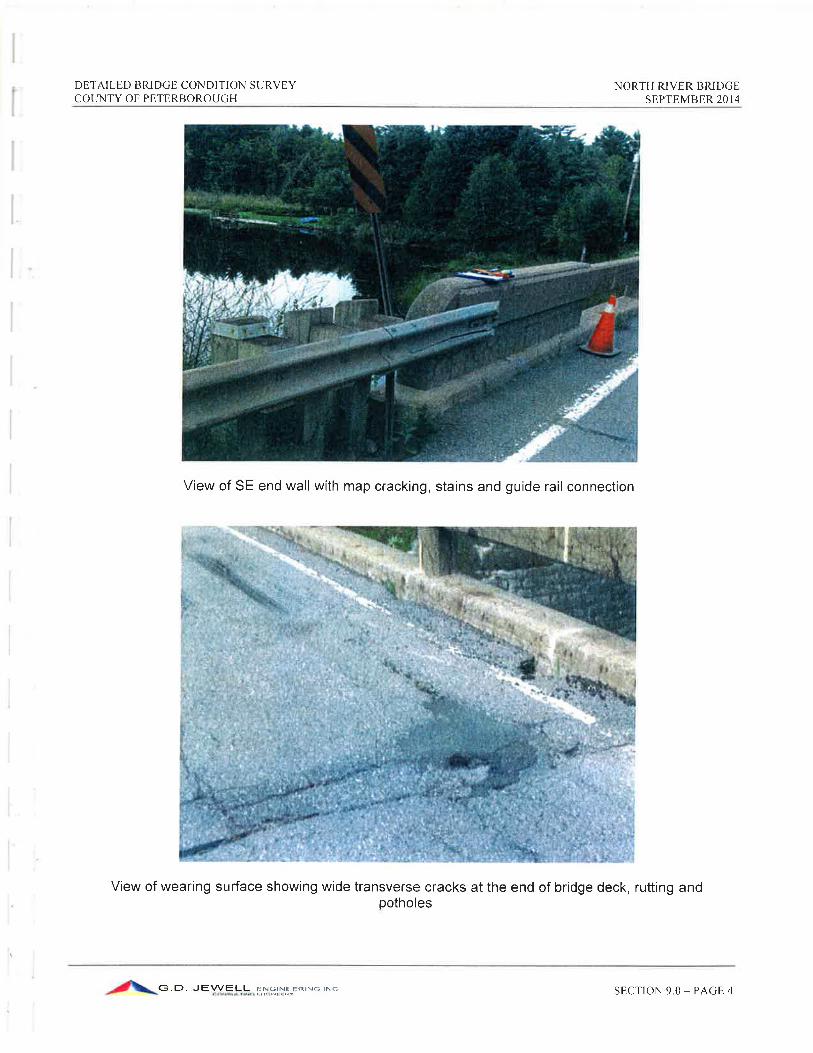
The asphalt wearing surface on the bridge deck was in an overall fair condition with sealed and unsealed cracks and
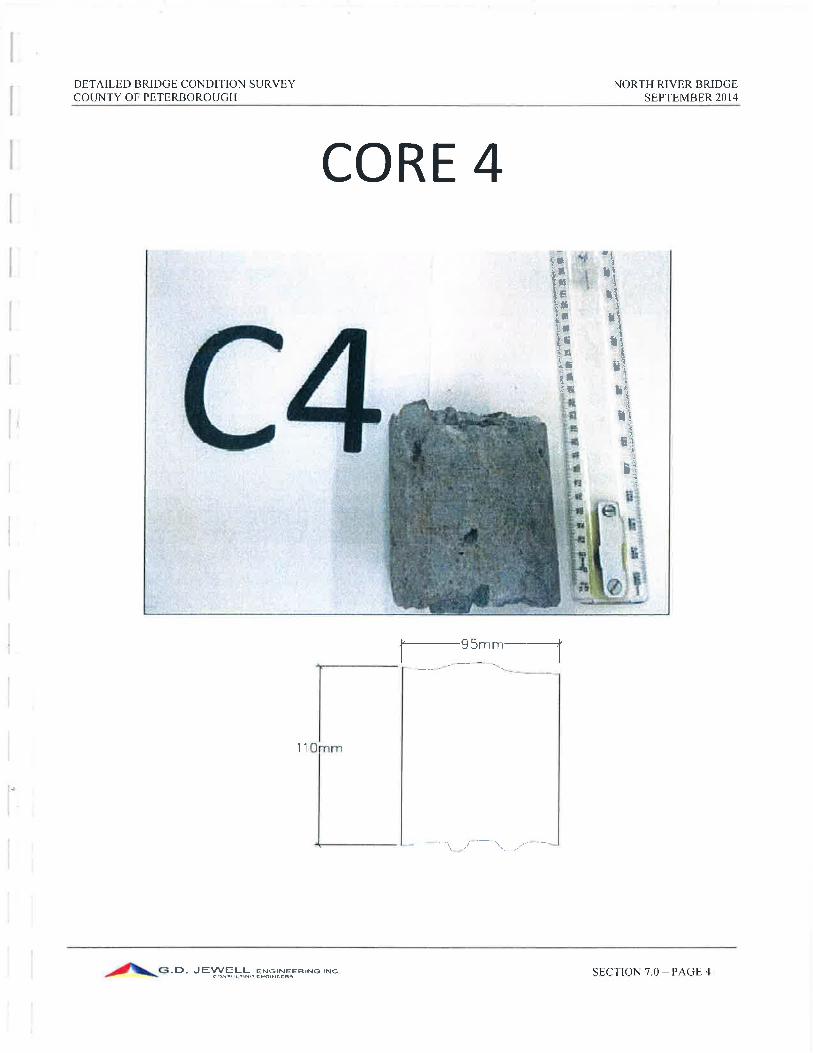
light to moderate ravelling and some rutting. The depth of asphalt on the bridge deck was found to be ranged from
90mm to 110mm with an average depth of 98mm.
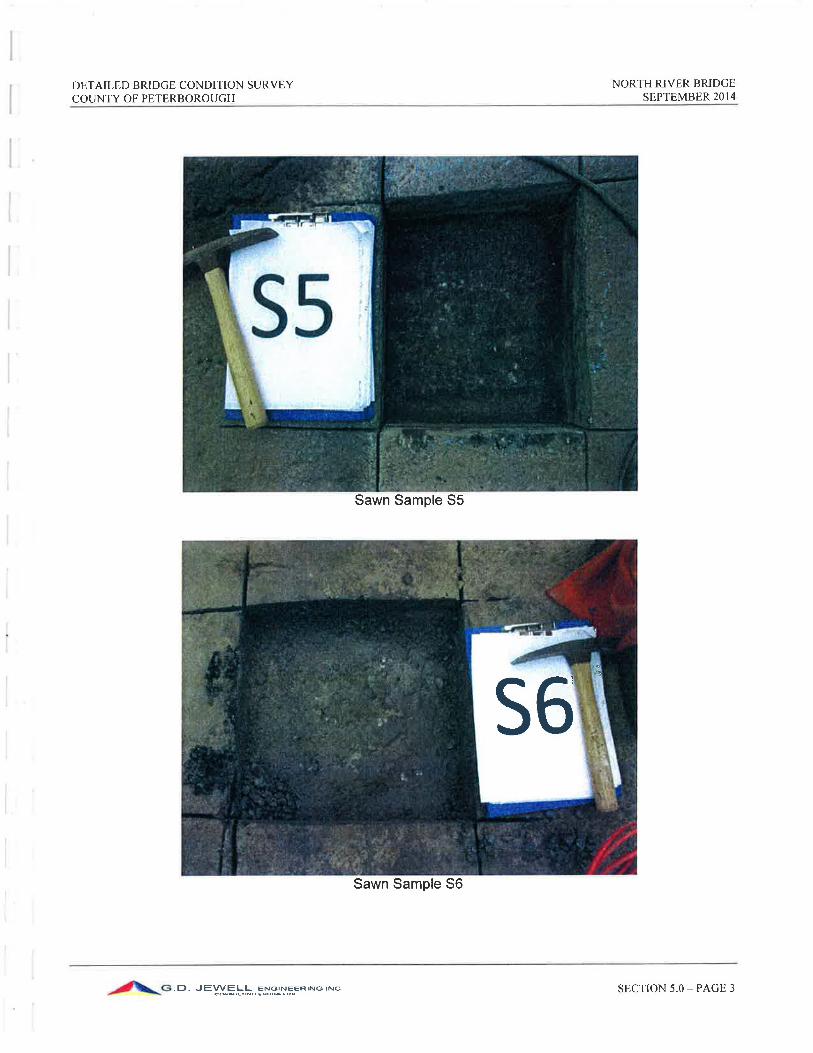
It was confirmed through coring and asphalt saw cuts that there is no waterproofing system provided on the bridge
deck.
Bridge Concrete Deck and Curbs
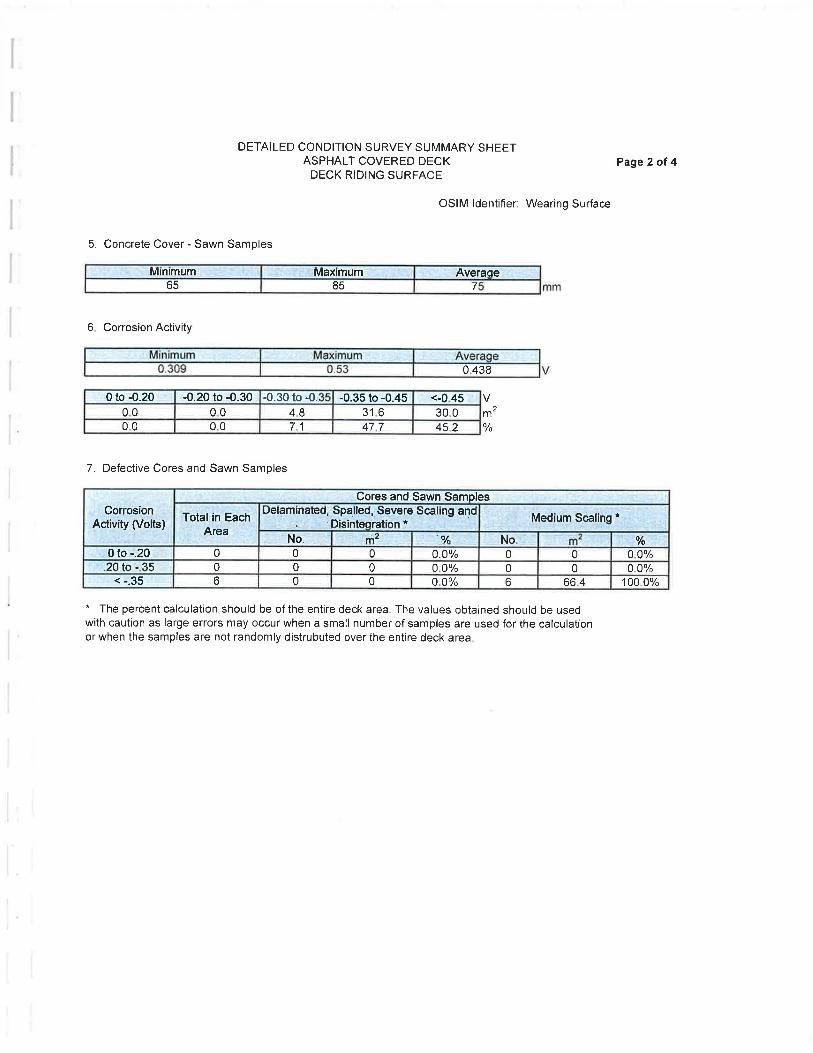
The Corrosion Potential Survey conducted on the deck riding surface resulted in approximately 93% of the deck with
half-cell potential readings more negative than -0.35 volts (indicative of greater than 90% probability that corrosion of
the reinforcing steel is occurring at the time of measurement). The rest of deck area showed half-cell potential readings
more negative than -0.20 which is indicative of corrosion activity of reinforcing steel being uncertain. The average
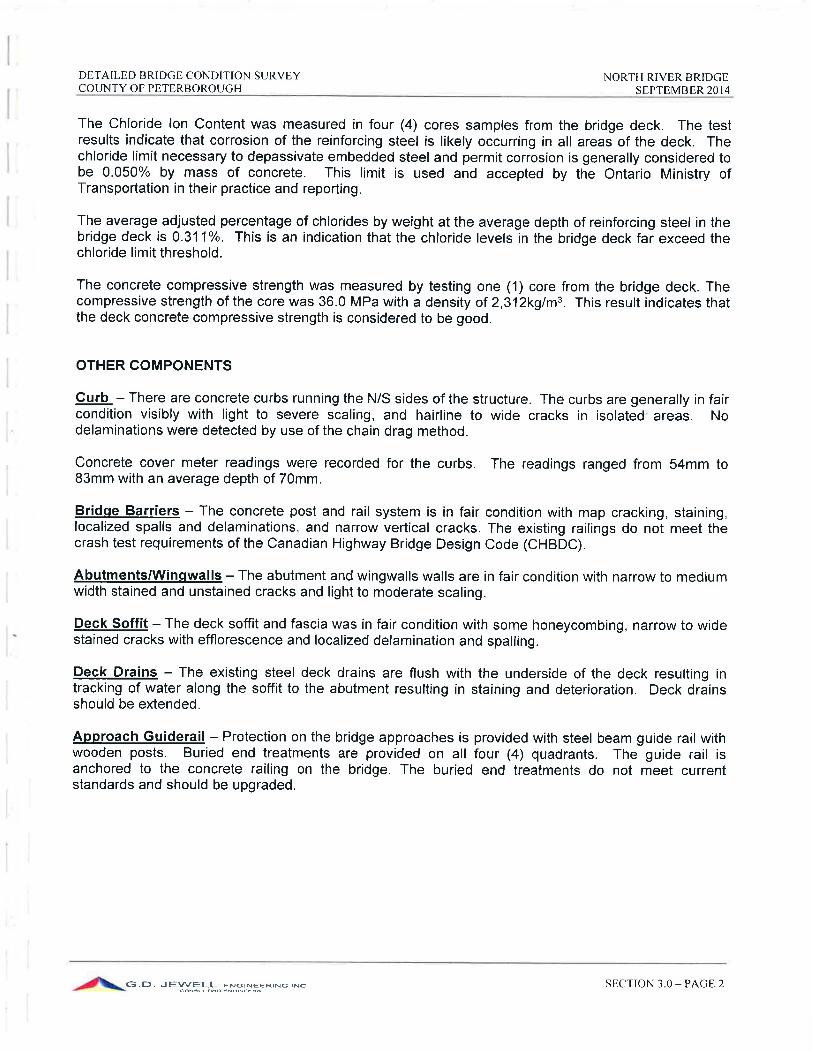
chloride contamination at the reinforcing steel level was found to be 0.311% which is significantly greater than the
0.05% threshold suggested by the MTO Structure Rehabilitation Manual. This further confirms the likelihood of
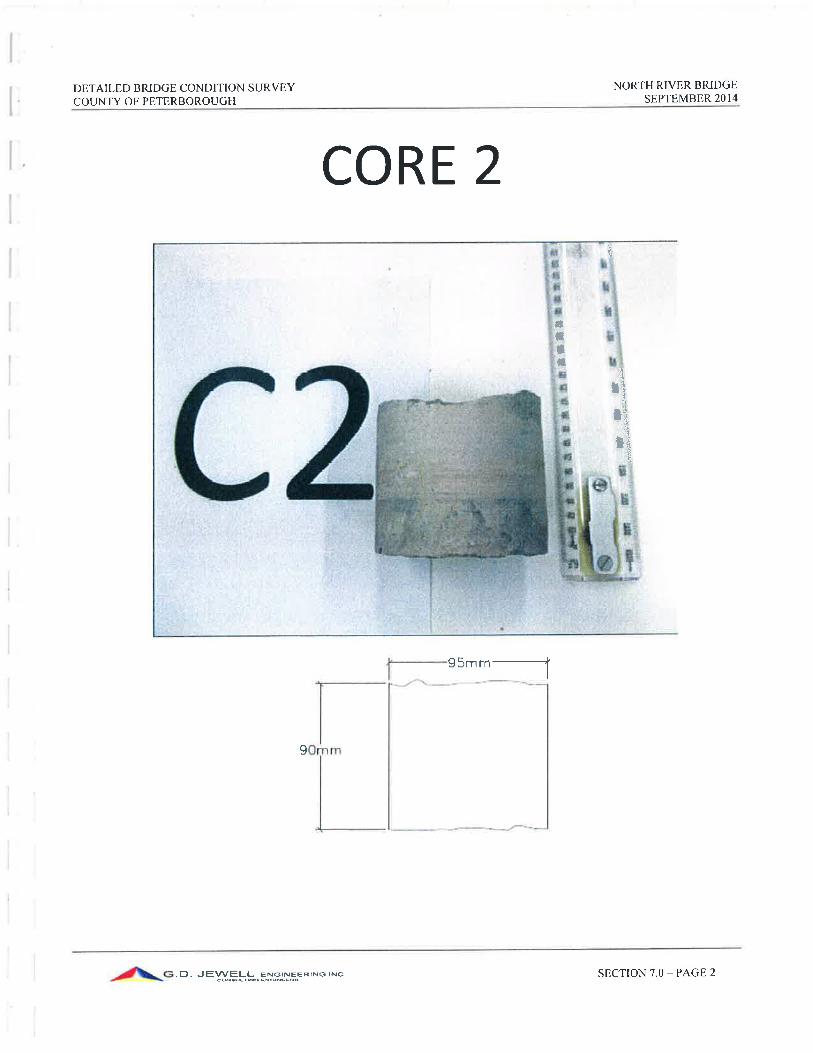
corrosion being initiated in reinforcing steel throughout the deck. The concrete in the deck was found to be marginally
air entrained. The compressive strength test performed on one core sample resulted in 36.0 MPa.
The concrete curbs on the north and south sides of the structure were generally in fair condition with light to severe
scaling and hairline to wide cracks in isolated areas. No delamination was identified along concrete curbs using the
chain drag method. The average concrete cover depth on curbs was found to be 70mm.
Barrier System
The existing barrier configuration (concrete post and rail system) does not conform to the current design standards; it
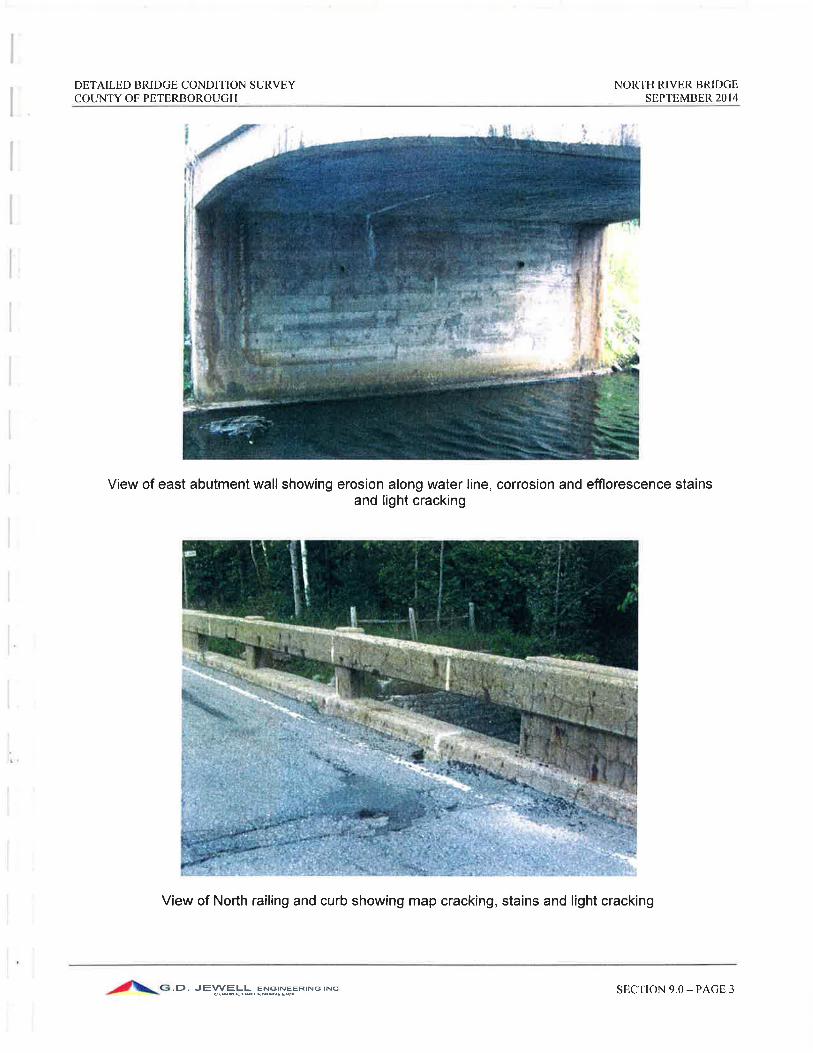
does not meet the crash test requirements of the Canadian Highway Bridge Design Code (CHBDC). The concrete
barrier system was generally in fair condition with map cracking, staining, localized spalls, delaminations, and narrow
vertical cracks.
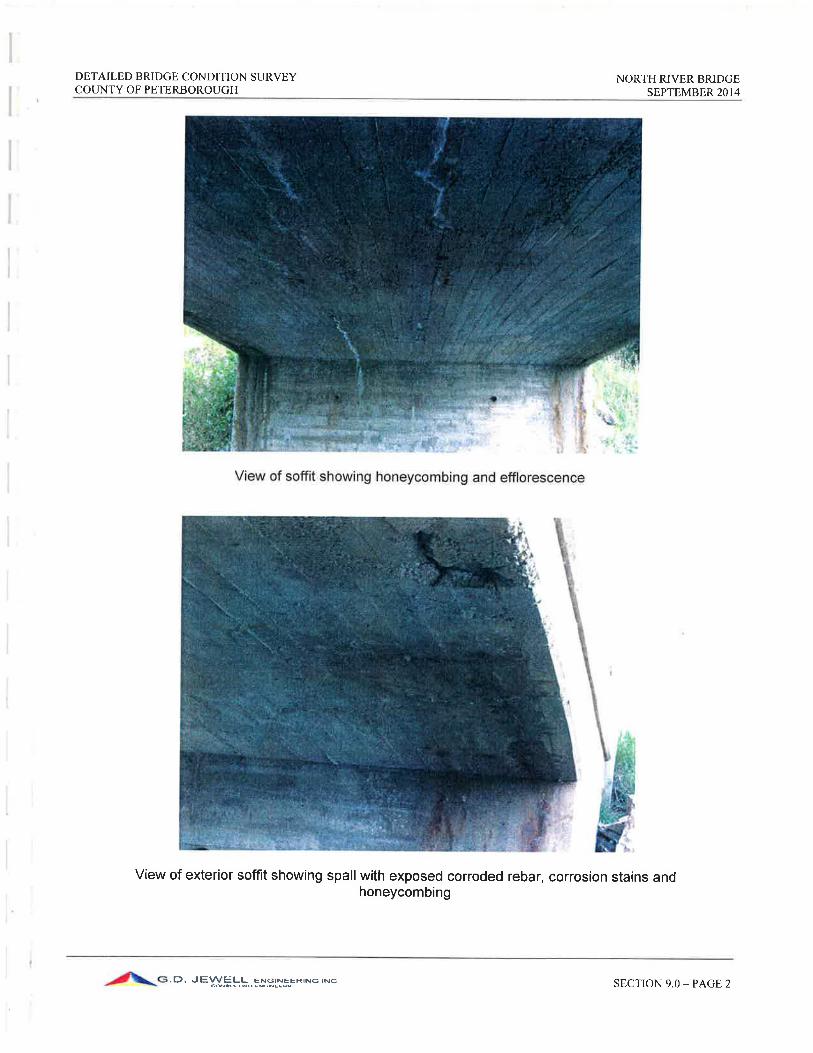
Deck Soffit and Fascia
The deck soffit and fascia was in an overall fair condition with some honeycombing, narrow to wide stained cracks with
efflorescence and localized delamination and spalling.
The existing steel deck drains are flush with the underside of the deck resulting in tracking of water along the soffit to
the abutments, and further resulting in staining and deterioration.
Abutments and Wingwalls
The abutment walls and wingwalls were generally in fair condition with narrow to medium width stained and unstained
cracks and light to moderate scaling.
Bridge Approach Guiderail
Steel beam guiderail system (SBGS) with wooden posts is used to provide protection on the bridge approaches. The
SBGS is anchored to the concrete railing on the bridge. Buried end treatments are provided on all four (4) quadrants of
the structure, which do not meet the current standards and require upgrading.
3.3 Summary of Detailed Bridge Substructure (abutments and wingwalls) Condition Survey
The MTO Structure Rehabilitation Manual requires that a “detailed condition survey should preferably be carried out
no more than two years prior to the proposed rehabilitation.” It further requires that “where a project is deferred, so
that the detailed condition survey for the bridge deck is more than four years old at time of construction, it would be
necessary to update the original survey.” The latest Detailed Bridge Deck Condition Survey for North River Bridge was
carried out in 2014. As such, the finding of this survey, conducted by G. D. Jewell Engineering Inc., should suffice for
the purpose of rehabilitation/replacement design. The scope of survey carried out during 2014 Detailed Bridge Deck
Condition Survey, however, does not include any delamination survey for the abutments/wingwalls. It nevertheless

North River Bridge Final Preliminary Design Report and MCEA
County Rd. 46, Havelock, Ontario
Agreement No. P-10-2014
AG File No. 14562-1 4
refers to the overall condition of the abutments as being fair. Moreover, the extensive level of deterioration on the
bridge deck riding surface (more than 93% of the subject area has greater than 90% probability of being in active
corrosion state), the extremely high level of chloride contamination on the deck, the fact that there has been no
waterproofing system provided on the deck surface, and the inadequacy of the deck drain steel tube extensions (which
has resulted in salt-laden run-off water tracking down the abutment walls) increases the likelihood that a significant area
of the abutment walls may already be suffering from deterioration. It is noteworthy that the most efficient
rehabilitation/replacement measures for the substructure of a bridge (abutment walls and wingwalls) would be
determined based on the level of existing deterioration in the subject components (MTO Structure Rehabilitation
Manual, dated April 2007). As such, the County of Peterborough was advised of the necessity of a condition survey to
be conducted on the North River Bridge substructure (abutment walls and wingwalls). The purpose of the new survey
is to provide sufficient additional information to best estimate the tender quantities, and to ensure the most effective
method of rehabilitation/replacement is recommended.
Due to the extreme cold temperature of January 2015, the results of a half-cell potential survey would have not been
reliable. The MTO Structure Rehabilitation Manual requires half-cell readings to be undertaken in an ambient
temperature above +5 °C. An alternative method, namely Ground Penetration Radar (GPR) survey, was consequently
adopted for this purpose. A Detailed Bridge Substructure Condition Survey was conducted on January 14, 2015, by
multiVIEW Locates Inc. (as a sub-consultant to Ainley Group). As a value added to the scope of job, and in an attempt
to provide a correlation between the GPR reading and half-cell potential readings obtained in the latest Detailed Bridge
Deck Condition Survey, multiVIEW Locates Inc. proposed to conduct GPR on the bridge deck as well. Their findings
are summarized below and a copy of the complete Detailed Bridge Substructure Condition Survey report is presented
in Appendix C.
Based on the ASTM Standard D 6087-08, the areas with Signal Amplitude Attenuation Index above 6-8 dB should be
considered to be potentially deteriorated. The ASTM standard further suggests that other intrusive deterioration
assessment techniques, where available, shall be used to statically correlate and predict the Signal Amplitude
Attenuation Index threshold value indicative of the actual deterioration level.
By comparing the GPR readings carried out over the deck riding surface and the half-cell corrosion potential reading
undertaken as part of the Detailed Bridge Deck Condition Survey (G. D. Jewell, 2014), the GPR report has concluded
that the half-cell corrosion potential contour of -0.450 volts best correlates with the 6dB Signal Amplitude Attenuation
Index contour level for this specific case. This Signal Amplitude Attenuation Index has therefore been taken as the
ASTM deterioration threshold level (i.e. an indication of significant potential of active deterioration).
The GPR report further states that, excluding Core Sample C6, all the remaining sawn and core samples were located
within 8+ dB contour levels. The GPR report states that the condition of concrete deck observed in all sawn and core
samples, according to the Detailed Bridge Deck Condition Survey (G. D. Jewell, 2014), are reported delaminated,
scaled, spalled with some cracks, or otherwise deteriorated. This Attenuation Index level (i.e. 8 dB) has therefore been
taken as an indication of high deterioration level.
Areas of the bridge structure with a Signal Amplitude Attenuation Index less than 6 dB has been considered to have an
uncertain deterioration condition.
Based on the above discussion, the percentage of the total subject area corresponding to a Signal Amplitude Attenuation
Index greater than 6 dB (indicative of significant potential of active deterioration), are as follows:
Bridge Deck: 70%
East Abutment Wall: 24%
West Abutment Wall: 15%
Northwest Wingwall: 38%
Southwest Wingwall: 31%
North River Bridge Final Preliminary Design Report and MCEA
County Rd. 46, Havelock, Ontario
Agreement No. P-10-2014
AG File No. 14562-1 5
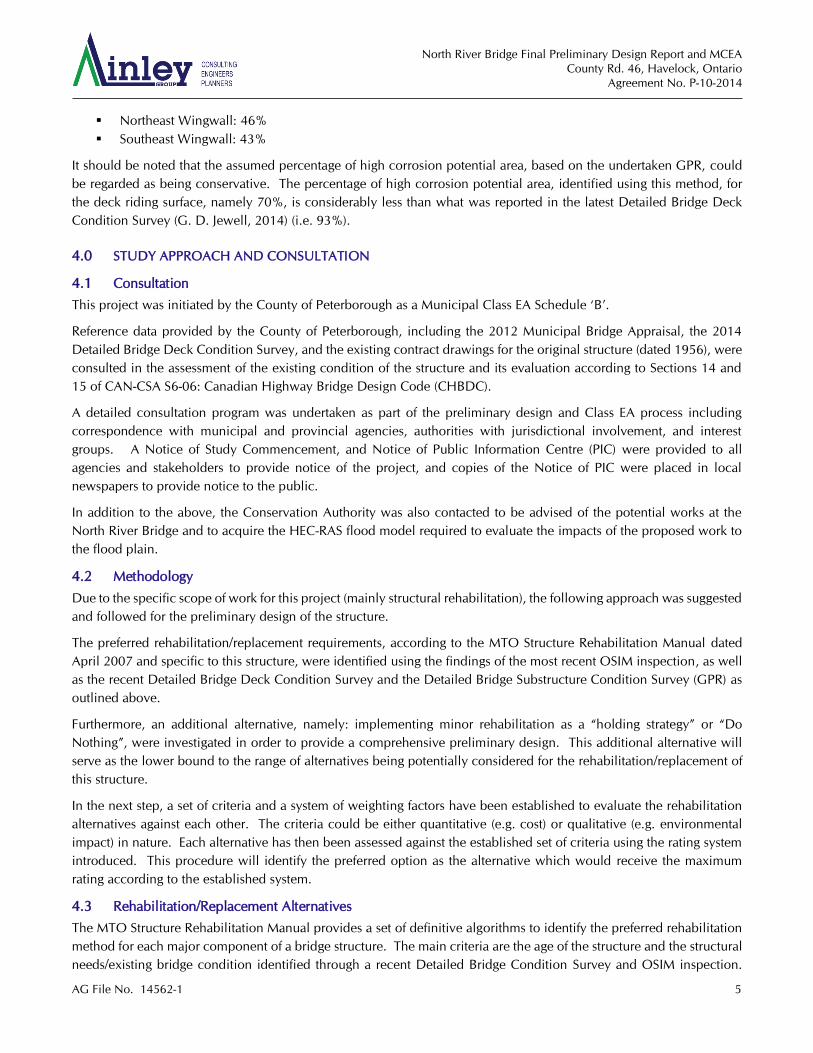
Northeast Wingwall: 46%
Southeast Wingwall: 43%
It should be noted that the assumed percentage of high corrosion potential area, based on the undertaken GPR, could
be regarded as being conservative. The percentage of high corrosion potential area, identified using this method, for
the deck riding surface, namely 70%, is considerably less than what was reported in the latest Detailed Bridge Deck
Condition Survey (G. D. Jewell, 2014) (i.e. 93%).
4.0 STUDY APPROACH AND CONSULTATION
4.1 Consultation
This project was initiated by the County of Peterborough as a Municipal Class EA Schedule ‘B’.
Reference data provided by the County of Peterborough, including the 2012 Municipal Bridge Appraisal, the 2014
Detailed Bridge Deck Condition Survey, and the existing contract drawings for the original structure (dated 1956), were
consulted in the assessment of the existing condition of the structure and its evaluation according to Sections 14 and
15 of CAN-CSA S6-06: Canadian Highway Bridge Design Code (CHBDC).
A detailed consultation program was undertaken as part of the preliminary design and Class EA process including
correspondence with municipal and provincial agencies, authorities with jurisdictional involvement, and interest
groups. A Notice of Study Commencement, and Notice of Public Information Centre (PIC) were provided to all
agencies and stakeholders to provide notice of the project, and copies of the Notice of PIC were placed in local
newspapers to provide notice to the public.
In addition to the above, the Conservation Authority was also contacted to be advised of the potential works at the
North River Bridge and to acquire the HEC-RAS flood model required to evaluate the impacts of the proposed work to
the flood plain.
4.2 Methodology
Due to the specific scope of work for this project (mainly structural rehabilitation), the following approach was suggested
and followed for the preliminary design of the structure.
The preferred rehabilitation/replacement requirements, according to the MTO Structure Rehabilitation Manual dated
April 2007 and specific to this structure, were identified using the findings of the most recent OSIM inspection, as well
as the recent Detailed Bridge Deck Condition Survey and the Detailed Bridge Substructure Condition Survey (GPR) as
outlined above.
Furthermore, an additional alternative, namely: implementing minor rehabilitation as a “holding strategy” or “Do
Nothing”, were investigated in order to provide a comprehensive preliminary design. This additional alternative will
serve as the lower bound to the range of alternatives being potentially considered for the rehabilitation/replacement of
this structure.
In the next step, a set of criteria and a system of weighting factors have been established to evaluate the rehabilitation
alternatives against each other. The criteria could be either quantitative (e.g. cost) or qualitative (e.g. environmental
impact) in nature. Each alternative has then been assessed against the established set of criteria using the rating system
introduced. This procedure will identify the preferred option as the alternative which would receive the maximum
rating according to the established system.
4.3 Rehabilitation/Replacement Alternatives
The MTO Structure Rehabilitation Manual provides a set of definitive algorithms to identify the preferred rehabilitation
method for each major component of a bridge structure. The main criteria are the age of the structure and the structural
needs/existing bridge condition identified through a recent Detailed Bridge Condition Survey and OSIM inspection.

North River Bridge Final Preliminary Design Report and MCEA
County Rd. 46, Havelock, Ontario
Agreement No. P-10-2014
AG File No. 14562-1 6
Utilizing this methodology to identify the preferred rehabilitation method for the North River Bridge has been discussed
in detail as follows:
Bridge Deck
Guidelines presented in Appendix 2.C of the MTO Structure Rehabilitation Manual were used to select the preferred
rehabilitation method for the concrete bridge deck.
The most recent Half-Cell Corrosion Potential Survey conducted on the deck has identified that more than 93% of the
subject area has greater than 90% probability that corrosion of the reinforcing steel is occurring. This has been confirmed
through a supplementary GPR survey which indicates that at least 70% of the deck riding surface is in the state of
significant potential of active deterioration. This is consistent with the observed concrete deck condition and the
chloride contamination during core sampling. Guidelines presented in Appendix 2.C-2 of the MTO Structure
Rehabilitation Manual were used to select the preferred rehabilitation method.
The existing bridge deck is approximately 49 years old (built in 1966) with the latest rehabilitation performed in 1984
(31 years ago). The total combined area of concrete removal (delaminations, spalls, medium to severe scaling and High
Corrosion Potential (HCP) according to chloride content) will most likely extend over 40% of the deck area. As such,
the algorithm presented in Figure 2.C-2: Flow Chart III recommends that the rehabilitation method should be selected
based on strength and cost-benefit between deck rehabilitation vs. replacement.
Bridge Substructure (Abutment Walls and Wingwalls)
Guidelines presented in Appendix 2.D of the MTO Structure Rehabilitation Manual were used to select the preferred
rehabilitation method for concrete substructure components.
The remaining life of the structure (built in 1966; major rehabilitation in 1984) is more than 15 years. The average total
area with high corrosion potential on abutment walls, based on GPR results, is less than 30%. It, however, comprises
of more than 30% and 40% of the west and east wingwalls respectively. Chloride content has not been measured for
abutment walls and wingwalls; nevertheless, chloride contamination is expected to exist and be greater than the
threshold limit similar to the existing condition for concrete deck. Following the Guidelines provided in Table 2.D-1
and the flow chart for substructure rehabilitation presented in Figure 2.D-1, the most efficient rehabilitation approach
for abutment walls would be “concrete patch and sealant”, whereas “concrete refacing with cathodic protection (CP)”
shall be considered as the best method of rehabilitation for wingwalls. For east wingwalls, Figure 2.D-1 requires due
consideration of the replacement by doing a financial analysis. It is noteworthy that this bridge is a rigid frame structure.
As such, replacement of the superstructure without substructure, or wingwalls without abutment walls, would be a
significant undertaking. Moreover, the remaining life of the rehabilitated component of the structure (25-30 years)
would not be consistent with the new deck (75 years). Therefore, it is highly recommended to use a similar
rehabilitation/replacement strategy for both superstructure and substructure elements of the bridge. No detailed
structural analysis has been performed at this stage (preliminary design) to identify any potential need for strengthening.
With no evidence of structural distress, however, it could be assumed that there would be no need for substructure
strengthening if the rehabilitation of the superstructure would not involve any widening.
Two options would therefore be carried forward in the preliminary design: 1) replacement of the entire structure with
a new bridge of greater width; and 2) rehabilitation of the deck (concrete overlay, waterproof, and pave), abutment
walls (patch and sealant), and wingwalls (refacing with cathodic protection) without any widening of the structure.
Parapet Walls and Sidewalks
Guidelines presented in Appendix 2.E of the MTO Structure Rehabilitation Manual were used to select the preferred
rehabilitation. Considering that the existing parapet wall system (concrete post and rail system, constructed in 1966)
does not conform to the current design standard (CHBDC), and it is in an overall fair condition with map cracking,
staining, localized spalls, and delaminations, the preferred rehabilitation methodology for these components would be

North River Bridge Final Preliminary Design Report and MCEA
County Rd. 46, Havelock, Ontario
Agreement No. P-10-2014
AG File No. 14562-1 7
“replacement”, according to Figure 2E-1. Based on the existing configuration of the structure and traffic data on the
road crossing the structure, the new barrier system should be a minimum PL-1 barrier system.
Based on the afore-mentioned discussion, the two preferred rehabilitation strategies for North River Bridge, based on
MTO Structure Rehabilitation Manual dated April 2007, would be:
A-1: Major Rehabilitation
The scope of this alternative would involve: concrete overlay, waterproof and pave of the deck area; concrete repair
and crack seal to the soffit; replacement of parapet walls; refacing of the wigwalls with applying cathodic protection;
and concrete patch and sealant for the abutment walls.
A-2: Replacement of the Structure
The scope of this alternative would involve replacement of the entire existing structure. The new structure would be
widened to meet the minimum requirements of the MTO Geometric Design Manual.
Two different options will be considered for the replacement structure; 1) supercore structural steel plate box, and 2)
precast concrete rigid frame bridge.
As discussed in Section 4.2 of this document, an additional alternative, as a lower bound to the range of
rehabilitation/replacement approaches considered for this structure, will also be considered to perform a comprehensive
preliminary study. The third alternative is subsequently:
A-3: Implementing Minor Rehabilitation as a “Holding Strategy”, if needed, or “Do Nothing”
The existing structure is in no imminent need of any rehabilitation measures to provide a “holding strategy”. As such
this alternative will be simplified into “Do Nothing”.
4.4 Evaluation Criteria and corresponding weighting factors
Life-Cycle Cost
Life-cycle financial analysis for each rehabilitation/replacement alternative has been carried out, according to the MTO
Structural Financial Analysis Manual dated March 1990. Present value analysis, assuming Level 3 analysis and using
life span estimates given in Appendix A.1.3 of the same document, has been performed for each alternative to calculate
the present value of that option. The rating system used to compare the alternatives is defined as follows:
Rc= 1- [(Individual Alternative Present Value) / (Maximum Net Present Value among all alternatives)]
The overall weighting factor for this criterion is considered to be 50.
Construction Duration and Traffic Impacts
Based on the following factors:
The existing narrow width of the structure would not accommodate for maintaining one lane of traffic
throughout construction without widening the structure.
There is no acceptable local road detour route around the site. The shortest detour route is approximately
44km, which creates an out-of-way travel time of over 30 minutes.
it is proposed that, for Alternative 1-Major Rehabilitation, construction traffic will be diverted off the existing bridge
using a temporary Bailey bridge located on the north of the existing structure. The proposed temporary Bailey bridge
will maintain one lane of traffic throughout the construction. For Alternative 2- Replacement of the Structure, however,
it is proposed to widen the new structure to a minimum which accommodates maintaining one lane of traffic over the
bridge throughout construction. Traffic right of way would be controlled by temporary traffic signals for both options.
Since the nature of traffic control would be the same for all rehabilitation/replacement alternatives, this criterion could
be considered as a quantitative one using the estimated construction duration. The rating factor would thus be defined
as follows:

North River Bridge Final Preliminary Design Report and MCEA
County Rd. 46, Havelock, Ontario
Agreement No. P-10-2014
AG File No. 14562-1 8
Rt= 1- [(Individual Alternative construction duration) / (Maximum construction duration among all alternatives)]
The overall weighting factor for this criterion is considered to be 30.
Providing for a temporary Bailey bridge north of the existing structure would require a horizontal alignment shift to the
existing roadway, meaning approximately 285 m of temporary detour. The temporary Bailey bridge and associated
roadway works would be removed following construction. The temporary detour route can be constructed within the
existing property limits, although there would be some impacts to an existing private entrance on north-east corner of
the structure.
It is understood that diverting construction traffic off the existing bridge provides the contractor with a better working
environment, consequently production rates normally increase thereby reducing construction time. However, it is
always difficult to predict how much deck repair work is required until construction actually reveals the extent of the
deterioration. As such, Alternative 1- Major Rehabilitation has the highest potential for cost overruns. Moreover, the
temporary roadway costs associated with this traffic staging would be considered a ‘throw away’. And further, the
rehabilitated bridge would not provide any additional width to accommodate traffic staging when future work is
required.
The favourable impact of potentially reduced construction time as a result of using a temporary Bailey bridge, would
be directly taken into account by the way the traffic rating (Rt) is defined. Nevertheless, to account for the negative
impact of the disadvantages of this alternative, several of which were explained in the above paragraph, an additional
reduction factor equal to 0.6 would be applied to it.
Environmental/Utility Impacts
This criterion (Re) is of a qualitative nature. The anticipated likelihood of significant environmental/utility impact due
to each alternative is introduced as a percentage and the corresponding Environmental rating (a factor between 0-1) is
introduced as:
Re= 1- (Environmental Impact)
The overall weighting factor for this criterion is considered to be 20.
4.5 Detailed discussion of Rehabilitation/Replacement Alternatives:
A-1: Major Rehabilitation:
The scope of this alternative would involve: concrete overlay, waterproof and pave of the deck area; concrete repair
and crack seal to the soffit; replacement of the parapet walls; refacing of the wingwalls and applying cathodic protection;
and concrete patch and sealant for the abutment walls.
The expected design life for each of the major rehabilitation listed above, according to the MTO Structure Financial
Analysis Manual (SFAM), dated March 1990, is shown in Table 2.
Table 1 - Alternative A-1 Expected Design Life
Scope Assumed Life (years)
Concrete overlay, waterproof and pave 30
Replace the parapet walls 75
Abutment/wingwall refacing with
cathodic protection
15-25
The existing parapet walls will be replaced due to its non-conformity with the current standards and existing poor
condition. Nevertheless, its new life span would be in the same line with other rehabilitation methods selected for the
remainder of the structure and thereby would not be included in the following calculation. As such, the average life

North River Bridge Final Preliminary Design Report and MCEA
County Rd. 46, Havelock, Ontario
Agreement No. P-10-2014
AG File No. 14562-1 9
span range assumed for deck concrete overlay and abutment refacing (i.e. 25 years), will be considered in the life cycle
calculations.
The existing structure is 49 years old and it will approach the end of its design life in 26 years. The expected extended
life of the structure, as a result of this rehabilitation alternative, would be approximately 25 years. It is therefore expected
that this rehabilitation alternative would extend the life of the structure until it is due for a full replacement.
The preliminary cost estimate for this alternative, according to the MTO Manual “Parametric Estimating Guide”, dated
2011, is expected to be:
Preliminary cost estimate: 86.3 ×2900 × 1.25≈$315,000
Unit cost of major rehabilitation per unit area (m2) of the deck is assumed to be the upper range given in the MTO
Parametric Estimating Guide for structural rehabilitation of concrete rigid frame structures (i.e. $2900), due to the
relatively short span of the structure and the extensive envisioned scope of work including concrete overlay on deck
and parapet wall replacement. The additional cost associated with traffic control, grading, paving, potential utility work,
and inflation rate (between 2011 and 2015), has been considered to be 25% of the structural work as suggested by the
MTO Parametric Estimating Guide.
The expected additional cost associated with the Bailey bridge and the temporary road way would be approximately
$330,000.
There will be no residual value for this alternative at the end of the theoretical design life of the existing structure in 26
years as discussed above. Therefore:
Net Present Value= $315,000+$330,000 – $0 = $645,000
The expected construction duration for this alternative (including the time needed for construction and removal of the
temporary detour route and Bailey bridge would be 9-11 weeks (maximum 55 working days).
A-2: Structure Replacement:
Two different options will be considered for the replacement structure; namely, 1) Supercore structural steel plate box,
and 2) precast concrete rigid frame bridge. These types of structures could be categorized under ‘Culvert - over 3.0
meter span’. The preliminary cost estimate for this alternative, according to the MTO Manual “Parametric Estimating
Guide”, dated 2011, is therefore expected to be:
Preliminary cost estimate: 110.8 ×7000 × 1.25≈$ 970,000
Unit cost of replacement per unit area (m2) of the deck is assumed to be slightly greater than the average given in the
MTO Parametric Estimating Guide (namely $5600), due to the relatively short span of the structure. The additional cost
associated with traffic control, grading, paving, potential utility work, and inflation rate (between 2011 and 2015), has
been considered to be 25% of the structural work as suggested by the MTO Parametric Estimating Guide. It should be
noted that the new deck area for the replacement structure is anticipated to be approximately 110.8 m2 (=10.35*10.7).
This approximate cost estimate will be assumed to be the same for both options in the preliminary design stage.
A-2-1: Supercore structural steel plate box
The expected service life for this structure would be 60 years. The preliminary cost estimate is assumed as the present
value for this alternative. At the end of the theoretical design life of the existing structure (i.e. in 26 years), the residual
value of the structure will be $550,000. Nevertheless, at that point it is due for a round of major rehabilitation (patch,
waterproof and pave) at an approximate value of $220,000 (=110.8 ×1600 × 1.25) which needs to be subtracted from
the residual value of the structure at that point. As such, the net residual value of the structure at that point will be
$330,000, which results in a net present value of this alternative to be:

North River Bridge Final Preliminary Design Report and MCEA
County Rd. 46, Havelock, Ontario
Agreement No. P-10-2014
AG File No. 14562-1 10
Net Present Value= $970,000 – $330,000 = $640,000
The expected construction duration for this alternative would be 10-12 weeks (maximum 60 working days).
A-2-2: Precast Concrete Rigid Frame
The expected service life for this structure would be 75 years. The preliminary cost estimate is assumed as the present
value for this alternative. At the end of the theoretical design life of the existing structure (i.e. in 26 year), the residual
value of the structure will be $634,000. Nevertheless, at that point it is due for a round of major rehabilitation (patch,
waterproof and pave) at an approximate value of $235,000 (=110.8 ×1700 × 1.25) which needs to be subtracted from
the residual value of the structure at that point. This is slightly higher than what has been envisioned for Supercore
structural steel plate box option. As such, the net residual value of the structure at that point will be $399,000 which
results in a net present value of this alternative to be:
Net Present Value= $970,000 – $399,000 = $571,000
The expected construction duration for this alternative would be 10-12 weeks (maximum 60 working days days).
A-3: Implementing Minor Rehabilitation as a “Holding Strategy”, if needed, or “Do Nothing”:
The existing structure does not require imminent rehabilitation measures, and therefore the “holding strategy” is
simplified to “do nothing”. As such this alternative will be
Table 2 - Alternative A-3 Expected Design Life
Scope Assumed Life (years)
N/A N/A
This expected immediate construction cost and duration for this alternative would be zero. It should be however noted
that, due to the extensive deterioration of the bridge deck and wingwalls, and the crucial importance of these
components of the structure, this could not be considered as the optimum solution. This approach, therefore, shall be
considered as a temporary measure (for a period less than 4-5 years) until there is sufficient funding available to
implement one of the previously mentioned rehabilitation/replacement alternatives (most likely alternative A-2-2 with
a net present value of $668,000). In the meantime, it is strongly recommended to reduce the intervals between OSIM
inspections to one (1) year and that of detailed superstructure and substructure condition survey to two (2) years. This
will impose an additional maintenance cost equal to approximately $40,000 in current dollar value. This, therefore,
shall be added to the net present value of this alternative which results in a total net present value equal to $708,000.
The same logic would apply to construction duration and traffic impact. The same construction duration as that of
alternative A-2-2 would apply to this case within the next 4-5 years. Furthermore, there will be some additional traffic
impact due to the increased number of routine inspections in the meantime. As such the equivalent construction
duration for this alternative, for the purpose of calculating Rt, would be considered to be 70 days.
4.6 Rating the Proposed Rehabilitation/Replacement Alternatives:
Using the evaluation criteria and corresponding weighting factors introduced in Sec. 4.4 of this document would result
in the following rating for each alternative. Maximum Net Present Value and Construction Duration, among all
alternatives, being used in calculating Rc and Rt respectively are bolded in the following table.
Alternative A-2-2: Replacement of the Bridge with Precast Concrete Rigid Frame, highlighted in green in Table 3 shown
below, results in a maximum rating and therefore is the preferred option.

North River Bridge Final Preliminary Design Report and MCEA
County Rd. 46, Havelock, Ontario
Agreement No. P-10-2014
AG File No. 14562-1 11
Table 3 - Alternatives Weighted Rating Table
Rehabilitation/ Replacement Alternative
Net Present Value ($)
Rc
Weighted Rc
(Rc, f = Rc × 50)
Construction Duration
(days) Rt
Weighted Rt
(Rt, f=Rt× 30)
Environmental Impact
Rc
Weighted Re
(Re, f=Re × 20)
Total Weighted
Rating (Rf = Rc,f + Rt,f + Re,f)
Alternative 1: Major Rehabilitation 645,000 0.09 4.5 55 0.13* 3.9 35% 0.65 13 21.4
Alternative 2-1: Replacement of the bridge with Supercore structural steel plate box structure 640,000 0.10 5.0 60 0.14 4.2 40% 0.6 12 21.2
Alternative 2-2: Replacement of the bridge with Precast concrete rigid frame structure 571,000 0.19 9.5 60 0.14 4.2 40% 0.6 12 25.7
Alternative 3: Do Nothing 708,000 0.0 0.0 70 0.0 0.0 40% 0.6 12 12.0
* An additional reduction factor equal 0.6 has been applied to this case as discussed in Sec. 4.4

North River Bridge Final Preliminary Design Report and MCEA
County Rd. 46, Havelock, Ontario
Agreement No. P-10-2014
AG File No. 14562-1 12
4.7 Preferred rehabilitation/replacement alternative:
As illustrated in Sec. 4.6 of this document, the preferred rehabilitation/replacement alternative would be “Alternative
A-2-2: Replacement of the bridge with a precast concrete rigid frame structure”.
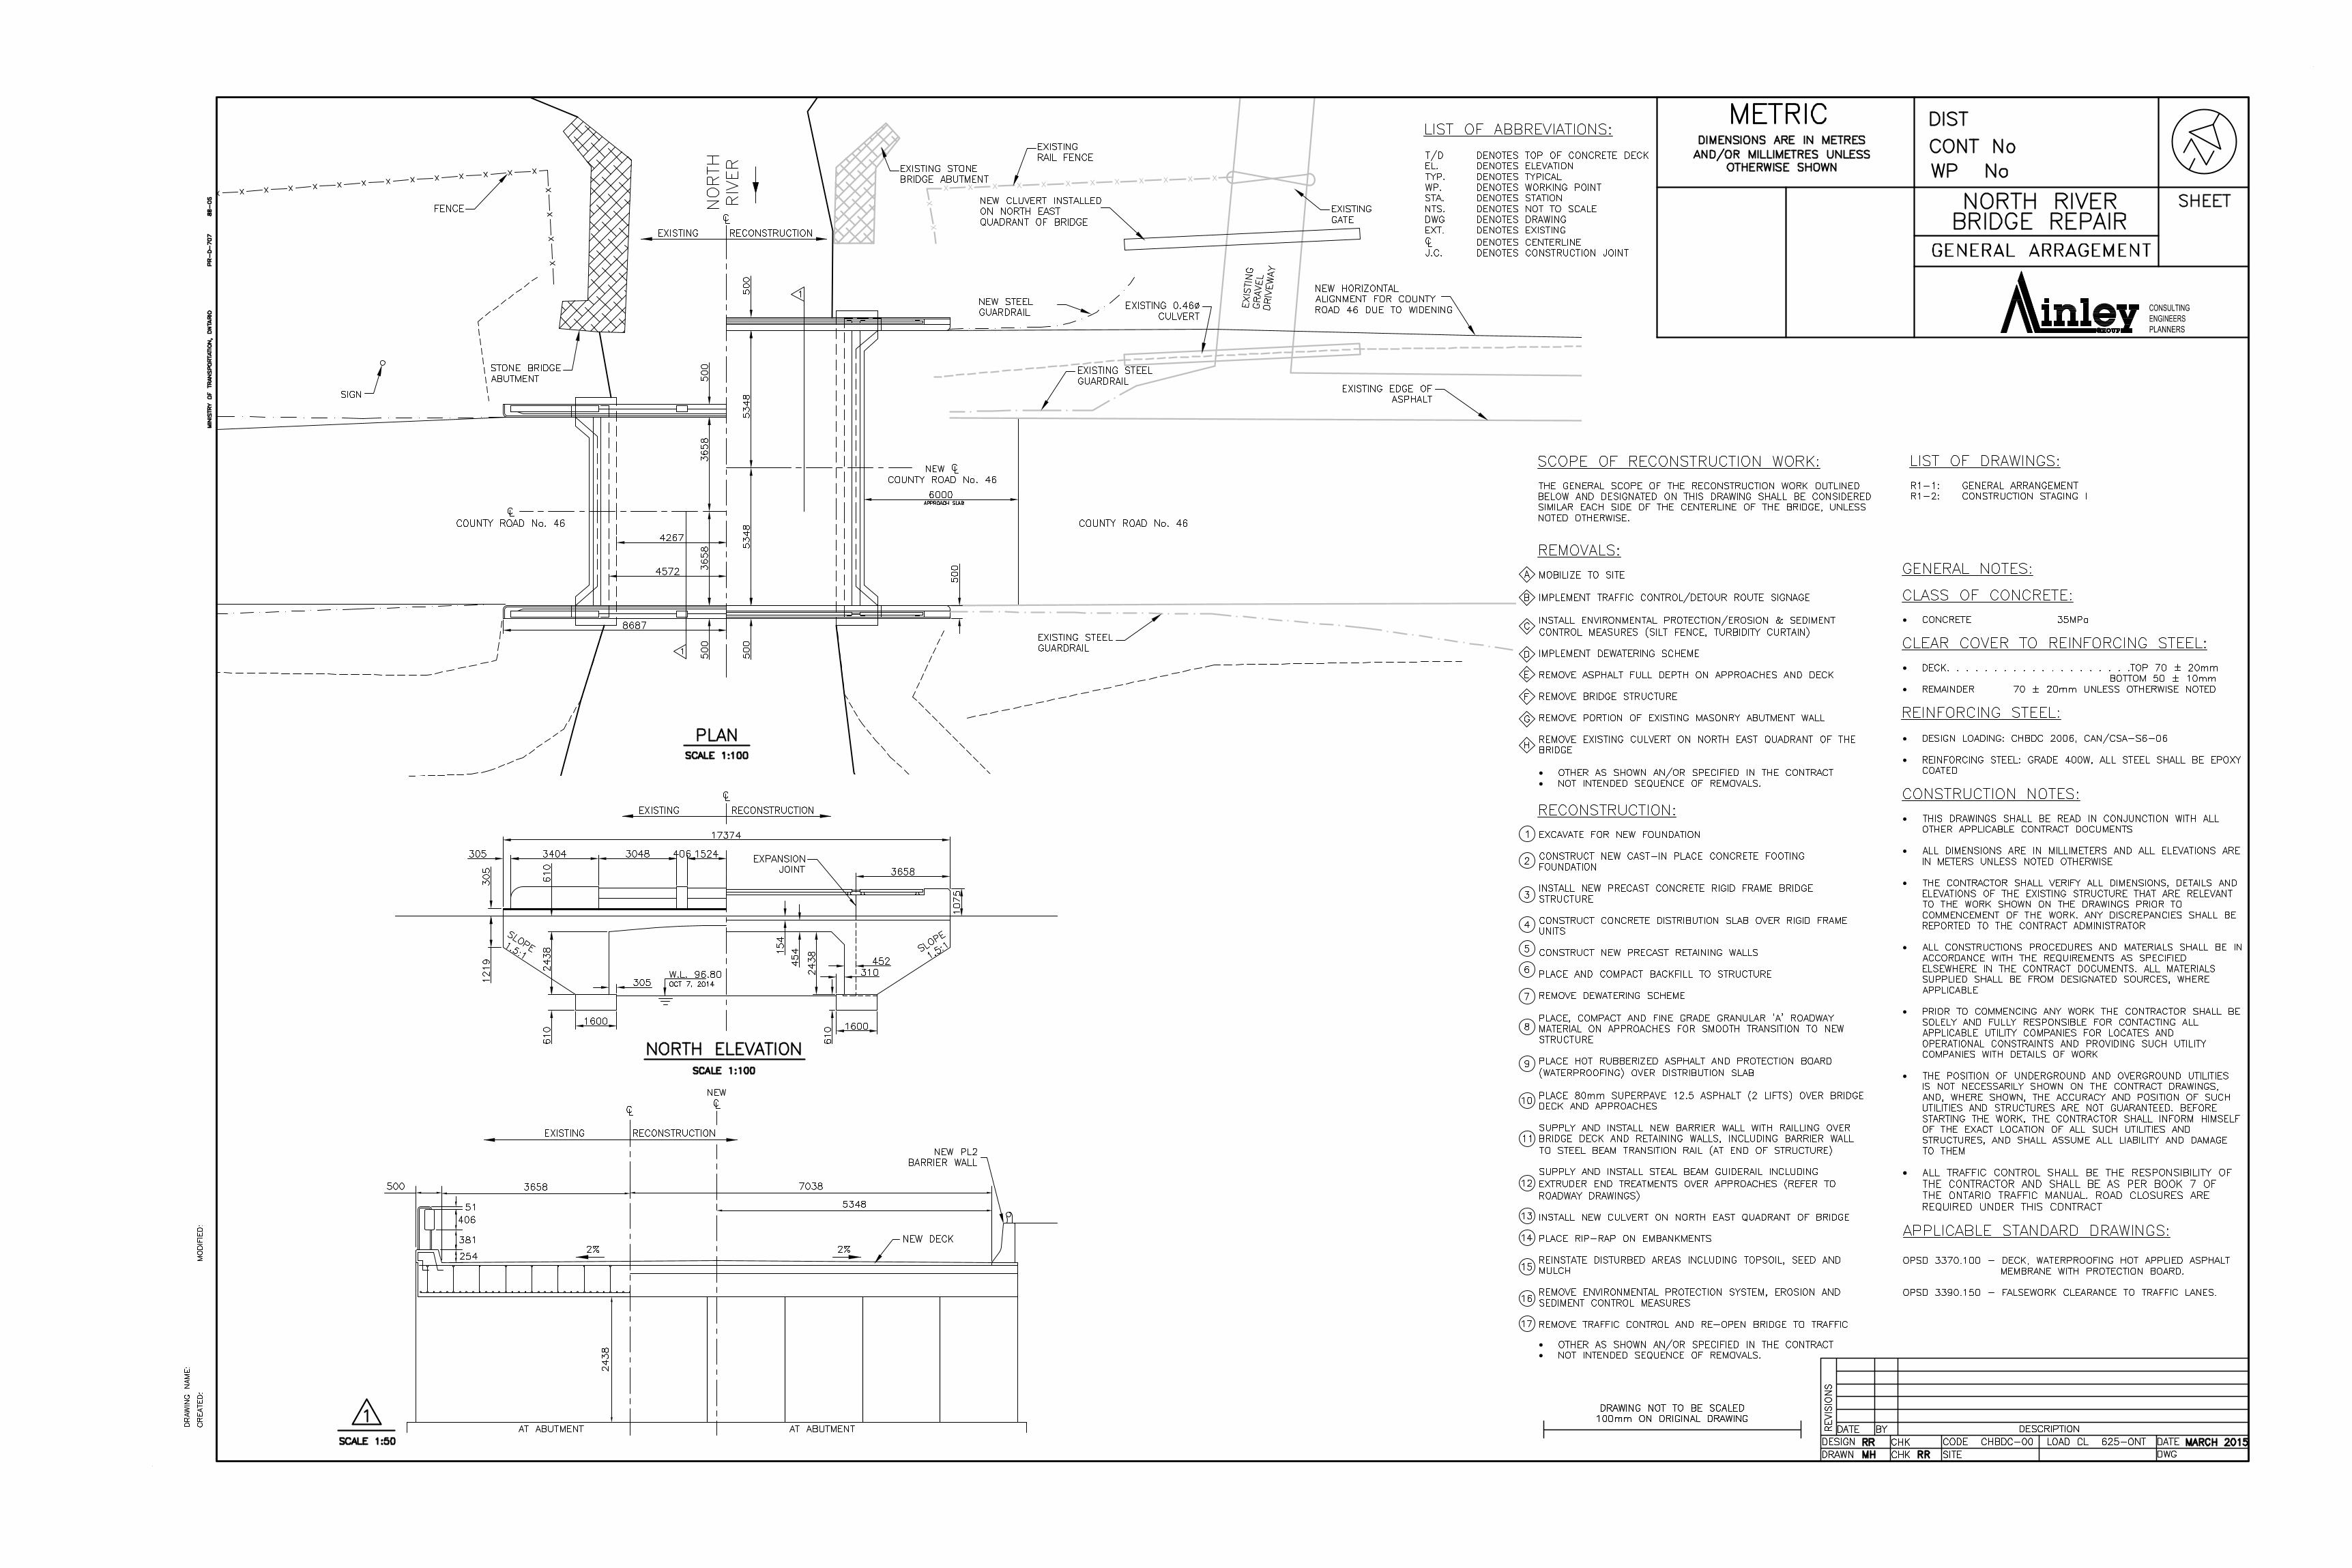
The expected service life of the new structure will be approximately 75 years. A General Arrangement of the preferred
rehabilitation/replacement alternative can be found in Appendix D.
5.0 MISCELLANEOUS
5.1 Environmental
Environmental investigations for the replacement/rehabilitation of the North River Bridge included a background review
and limited field assessment of both the terrestrial and aquatic environments on November 26, 2014. The study area
incorporated the terrestrial environment located within a 120 m radius of the structure, as well as the aquatic
environment upstream and downstream of the structure. To evaluate existing terrestrial ecosystem conditions and
species at risk within the study area, the following tasks have been undertaken:
A review of all relevant background information including the Natural Heritage Information Centre (NHIC),
Department of Fisheries and Oceans (DFO), and information provided by the MNR, for the project area.
A review of habitat types for SAR having the potential to occur within the study limits as provided by the MNR
and NHIC databases.
A field survey to identify the presence of natural heritage features and SAR, conducted on November 26, 2014.
To evaluate the existing aquatic ecosystem existing conditions within the study area, a field survey was completed in
conjunction with the terrestrial field survey. The survey included a review of the following:
Watercourse morphology, including type of watercourse, length, velocity and associated wetlands.
Subsections of the watercourse, including runs, pools, riffles.
Water quality features including temperature, conductivity, dissolved oxygen, resistivity, salinity and pH.
Habitat features, including woody debris, undercut banks, boulder clusters, organic debris, and vascular
macrophytes.
Terrestrial groundwater seepage areas, watercourse substrate, bank stability, riparian and aquatic vegetation.
Physical barriers.
Background review sources indicate that occurrences of the following species have been reported within 1.0 km of the
bridge location: Snapping Turtle (Special Concern) and Eastern Ribbonsnake (Special Concern). Other species have
been reported within the general project area (5 km radius) including: Blanding’s Turtle (Threatened), Eastern Musk
Turtle (Special Concern), Milksnake (Special Concern), Eastern Hog-nosed Snake (Threatened), Common Five-lined
Skink (Southern Shield population – Special Concern), American Eel (Endangered), Butternut (Endangered), Whip-poor-
will (Threatened), Common Nighthawk (Special Concern), Golden-winged Warbler (Special Concern), Barn Swallow
(Threatened), Bobolink (Threatened) and Eastern Meadowlark (Threatened).
During the completion of the limited field survey, no SAR species were observed, and no evidence of turtle nesting was
present. Footprint impacts (3-4 m) are anticipated to occur to the north of the existing structure; however, the works
will be concentrated within the footprint of the former bridge which is considered to be previously disturbed. Given
the location of the proposed works within the previously disturbed footprint, and relatively short duration of the
undertaking, impacts to SAR are not anticipated. No Barn Swallows were observed beneath the structure during the
field investigation.

North River Bridge Final Preliminary Design Report and MCEA
County Rd. 46, Havelock, Ontario
Agreement No. P-10-2014
AG File No. 14562-1 13
To limit potential impacts to the adjacent watercourse, in-water works will be restricted during the period of April 1 to
June 30 in any calendar year, and erosion and sediment control measures will be implemented to limit impacts to the
adjacent watercourse.
Detailed mitigation measures to limit impacts to fish and fish habitat, terrestrial ecosystems and SAR will be incorporated
as part of the detail design.
5.2 Hydraulic Analysis
A hydrologic and hydraulic analysis was completed for North River Bridge in order to further support the
replacement/rehabilitation options for this structure.
The drainage area for the North River Bridge was estimated using contour and land use data from the County of
Peterborough GIS (County of Peterborough, 2015) and the Ontario Ministry of Natural Resources and Forestry Make a
Map website (MNRF, 2014). The drainage area lies within Crowe Valley Conservation Authority (CVCA) lands. It is
relatively flat and predominately consists of woodland interspersed with lakes and wetlands. North River flows
southerly from Imp Lake northerly through Methuen Lake, Kasshabog Lake, and South Lake crossing under County Road
46 at the structure in question, and then continues south into Round Lake where it then heads east into Belmont Lake.
The contributing areas to the North River Bridge encompass natural landscape with little residential and agriculture
development. The estimated drainage area information for North River Bridge is summarized in Table 4.
Table 4 - Drainage Area Information
Structure ID 046001 – North River Bridge
Drainage Area (km2) 159
Percent Lake / Wetland Storage (%) 25
Percent Lake Storage (%) 15
Location of Storage Evenly Distributed throughout Watershed
Main Channel Length (km) 32
Average Slope (%) 0.4
Basin Type Northern (Shield)
Type of Watershed Outlet Lake
Runoff Coefficient 0.08
Hydrologic Soil Type B
Curve Number 57
Design Criteria
The Ministry of Transportation (MTO) Highway Drainage Design Standards have been applied as the minimum design
guidelines for the North River Bridge replacement/rehabilitation. County Road 46 is classified as a rural arterial road at
the structure location, which has a span of 9.1 m. Therefore, the design flow for the bridge is a 50 year event (Ministry
of Transportation, 2008). Although floodplain mapping is unavailable for North River, CVCA lands lies with Zone 2
and is therefore subject to the 100 year regulatory flood event (Ontario Ministry of Natural Resources, 2002).
Design Flows
Flow data was not available for North River, therefore the peak flow hydrologic assessment was carried out for both the
50 year and 100 year storm events using MTO Northern Ontario Method, MTO Modified Index Flood Method, and a
SWMHYMO model of a 48 hr SCS Type II storm.
The peak flow comparison is presented in Table 5.

North River Bridge Final Preliminary Design Report and MCEA
County Rd. 46, Havelock, Ontario
Agreement No. P-10-2014
AG File No. 14562-1 14
Table 5 - Peak Flow Comparison
Return
(year)
Peak Flows (m3/s)
MTO Northern
Ontario Method
MTO Modified Index Flood
Method
SWMHYMO
48 hr SCS Type II x Ks Average
2 19.96 9.91 10.45 12.09
5 25.40 12.85 15.98 15.99
10 28.61 15.42 20.06 18.73
25 32.18 18.36 25.84 22.05
50 34.53 20.56 30.51 24.49
100 36.65 22.95 35.22 26.92
Table 5 shows that peak flows given by the MTO Northern Ontario Method exceeds the peak flows calculated by the
other two methods. Therefore, the 50 year design flows and 100 year regulatory flows are 34.53 m3/s and 36.65 m3/s,
respectively.
Hydraulic Analysis
The HEC-RAS Version 4.1.0 model, developed by the U.S. Army Corps of Engineers, was used to perform one-
dimensional steady flow hydraulic analysis of the existing and proposed bridge alternatives. The model has the ability
to calculate the impacts of various hydraulic parameters related to the replacement of the existing bridge. The principal
model input parameters include cross-sections that represent surface characteristics upstream and downstream of the
crossing, bridge geometry, design flows, and a starting water surface elevation at the downstream end of the model.
Existing Conditions
The following was noted with respect to the bridge and watercourse during Ainley’s November 24, 2014 site visit:
At time of visit, water level observed was fairly low, but with high velocity.
There was limited evidence of high water in the area.
The road alignment is significantly higher than the watercourse.
An old pair of bridge abutments is located just upstream of the existing structure. The old abutments are slightly
narrower and as such are acting as the hydraulically constricting structure at this location.
Downstream limit to approximately 15 m south of structure (STA. 0+000 to 0+045):
▫ Flows were relatively deep with some pools and shoals.
▫ Channel was winding with some stones weeds.
▫ Steep embankments, approaching 1:1 (H:V) in places.
▫ Overbanks generally contained medium to dense brush predominately consisting of large trees, shrubs,
and grasses.
▫ Based on field observations, a 1.0 m deep trapezoidal main channel below water surface elevations
gathered during JBF’s survey has been assumed in the model.
Approximately 15 m south of structure to upstream limit (STA. 0+045 to 0+130):
▫ Flows were relatively shallow with some pools and shoals.
▫ Channel was winding with stones and some weeds.
▫ Steep embankments, approaching 1:1 (H:V) in places on the left bank and approaching a 7% slope on
the right bank.
▫ Overbanks generally contained medium to dense brush predominately consisting of large trees, shrubs,
and grasses. However, the right overbank was less densely covered and contained a gravel boat launch
and portions of manicured lawn.
▫ Based on field observations, the model assumed a rectangular main channel with a depth of 150 mm

North River Bridge Final Preliminary Design Report and MCEA
County Rd. 46, Havelock, Ontario
Agreement No. P-10-2014
AG File No. 14562-1 15
below water surface elevations gathered during JBF’s survey.
There was significant downstream development at a relatively low elevation.
Erosion was not observed on any of the embankments.
Proposed Replacement / Rehabilitation Alternatives
The following is the hydraulic summary based on the various options considered. There are two options for each
condition; 1) travelled width maintained and 2) travelled width increased by 5 m. It is expected that the travelled width
is expected to be widened in the range of 3.5 - 4.0 m, by evaluating the hydraulics based on 5 m it ensures that our
water level estimates are conservative (higher than expected to occur).
Rehab (like for like)
▫ 50 year water level – 98.225
▫ 100 year water level – 98.284
▫ Soffit elevation – 99.50
Rehab (widened)
▫ Abutment separation maintained
▫ Road widened 5m
▫ 50 year water level – 98.300
▫ 100 year water level – 98.360
▫ Soffit elevation – 99.50
Replacement - New abutments – outside existing
▫ Same road width
▫ 50 year water level – 98.086
▫ 100year water level – 98.137
▫ Soffit elevation – 99.50
Replacement - New abutments – outside existing
▫ Road widened 5m
▫ 50 year water level – 98.167
▫ 100 year water level – 98.220
▫ Soffit elevation 99.50
Replacement – Internal Arch (SC-37B, s=8604, r=2326)
▫ Same road width
▫ 50 year water level -98.498
▫ 100 year water level – 98.572
▫ Soffit elevation – 99.116
Replacement – Internal Arch (SC-37B, s=8604, r=2326)
▫ Road widened 5m
▫ 50 year water level -98.592
▫ 100 year water level – 98.678
▫ Soffit elevation – 99.116
All options satisfy the hydraulic requirements for the structure.
Erosion and Sediment Control
A number of precautions need to be taken when completing the proposed works since it will be situated in a
permanently flowing watercourse. The primary issue is to minimize the intrusion into the existing watercourse during
the construction period. The following measures are recommended to minimize impacts to the watercourse during
construction.
North River Bridge Final Preliminary Design Report and MCEA
County Rd. 46, Havelock, Ontario
Agreement No. P-10-2014
AG File No. 14562-1 16
Only rubber tired vehicles should access the watercourse.
Minimize the number of times that the vehicle accesses the watercourse.
Minimize the amount of in-water work required by machinery.
Equipment shall not be cleaned in the watercourse.
Equipment shall not be refueled in or near the watercourse.
Fuel shall not be stored near the watercourse.
Accumulated sediment or other debris shall be disposed of in a suitable designated area or disposed of
in accordance with OPSS 180.
Provide a silt fence barrier between the construction area and the watercourse in accordance with OPSD
219.13 for work areas adjacent to the river.
Provide straw bale check dams (OPSD 219.18) or rock check dams (OPSD 219.21) in ditches conveying
runoff through construction areas.
Water pumped from dewatering areas shall be discharged to a dewatering trap (OPSD 219.24) or silt sack.
Provide a turbidity curtain (OPSD 219.26) around all in-water work.
Any area disturbed by construction shall be restored to the existing condition or better.
Restoration should follow immediately after construction has been completed using non-erodible material.
Maintain a vegetative buffer next to the watercourse.
Work in the watercourse should be restricted to non-spawning seasons.
All work to be completed in dry conditions.
Further details regarding staging / dewatering and erosion and sediment control will be provided as part of the detailed
design.
Approvals
The subject structure falls within the regulated area of the Crowe Valley Conservation Authority, accordingly a permit
will likely be required for the proposed works. This should be applied for once the proposed work plan is finalized.
In addition to the requirements listed above, any permitting requirements from Transport Canada (Navigable Waters
Protection) should be investigated during detailed design and prior to the start of construction.
5.3 Traffic
Background
North River Bridge is located on Peterborough County Road 46, approximately 1.3 km east of County Road 47. County
Road 46 is a paved two lane rural arterial roadway with an approximate Average Annual Daily Traffic (AADT) of 1700
vehicles. This route also accommodates commercial traffic from Unimin Canada, who operate a mine north of the
North River Bridge. The regulatory posted speed is 80 km/h, and the adjacent roadside development near North River
Bridge is rural residential.
Construction Traffic Staging
Traffic staging options for bridge rehabilitations generally involve two alternatives:
1. Traffic detoured off and around the bridge using temporary routes or methods
2. Traffic maintained on the bridge using two or more stages of re-construction
At this site, the existing narrow cross-section width will not permit staged construction while maintaining traffic over
the bridge. If a design option is chosen that does not include widening of the existing bridge, then traffic will need to
be re-directed around the bridge. Unfortunately, there is no short detour route around this site and out of way travel
for motorists will be substantial, in the order of 44 km in distance, which translates into approximately 30-40 minutes
of delay. Assuming this is an unrealistic imposition for motorists, then detouring traffic using a roadway re-alignment
and temporary bridge system at the site would be preferred.

North River Bridge Final Preliminary Design Report and MCEA
County Rd. 46, Havelock, Ontario
Agreement No. P-10-2014
AG File No. 14562-1 17
A roadway re-alignment with associated temporary bridge would involve constructing approximately 285m of new one
lane roadway to provide traffic a safe re-direction around the north side of the existing bridge. Alternating right of way
for both directions of travel would be controlled by temporary traffic control signals. The traffic signals would be
actuated by electronic detection, but would ‘rest in red’ for both directions when no vehicles are present. Temporary
portable signals, with illumination during nighttime operations, would be recommended.
The existing posted speed limit of 80 km/h would be reduced to 60 km/h during construction. Temporary pavement
markings delineating the new edge of pavement will be installed. Temporary signing clearly identifying the detour
alignment shift would be installed.
Consideration should be given to including hours of work operational constraints in the tender package to ensure
minimum traffic disruptions for motorists and minimum noise intrusions and inconvenience for adjacent residents.
There would be some minor impact to the private entrance located within the limits of the detour, just east of the bridge.
5.4 Highway Geometrics
The existing roadway width over the bridge is 7.3 m from barrier to barrier. The minimum roadway width over the
bridge should accommodate two 3.25 m lanes with 0.5 m shoulders, for a total width of 7.5 m.
5.5 Utilities
Ainley Group has started the process to confirm the presence or absence of utilities within or on the existing bridge.
6.0 RECOMMENDATIONS AND CONCLUSIONS
A comprehensive preliminary design has been conducted to identify the most appropriate rehabilitation/replacement
methodology for North River Bridge, based on the existing condition of the structure and the remaining theoretical
service life of the structure.
In consideration of all influencing factors, a set of criteria was established to compare and narrow down the alternatives
to the most suitable design options. The design options that were carried forward for final evaluation are those that
were rated the highest with respect to the following criteria:
Cost effectiveness (Life-Cycle cost),
Ability to sufficiently address the structural deficiencies and mitigate causes of these deficiencies,
Minimal or no anticipated disruption to local traffic during the construction stage,
Minimal anticipated impact on the environmental footprint, and
Minimal or no relocation of existing utilities.
Accordingly, the options that have been carried forward for further review and evaluation are:
1. Alternative 1: Major rehabilitation of the structure.
2. Alternative 2-1: Replacement of the bridge with Supercore structural steel plate box structure.
3. Alternative 2-2: Replacement of the bridge with precast concrete rigid frame structure.
One additional alternative was also considered as the lower bound for the range of potential alternatives considered for
this project:
4. Alternative 3: “Do Nothing”
A set of criteria (covering the above-mentioned influencing factors) and a corresponding rating system was introduced
to conduct a comparative analysis between all considered alternatives. This resulted in “Alternative 2–2: Replacement
of the bridge with precast rigid frame structure” being identified as the preferred option.

North River Bridge Final Preliminary Design Report and MCEA
County Rd. 46, Havelock, Ontario
Agreement No. P-10-2014
AG File No. 14562-1
APPENDIX A: 2012 INSPECTION REPORT


North River Bridge Final Preliminary Design Report and MCEA
County Rd. 46, Havelock, Ontario
Agreement No. P-10-2014
AG File No. 14562-1
APPENDIX B: 2014 BRIDGE DECK CONDITION SURVEY REPORT


North River Bridge Final Preliminary Design Report and MCEA
County Rd. 46, Havelock, Ontario
Agreement No. P-10-2014
AG File No. 14562-1
APPENDIX C: 2015 BRIDGE SUBSTRUCTURE CONDITION SURVEY REPORT

multiVIEW Locates Inc. Phone: 1-800-363-3116
Fax: 1-866-571-5946 325 Matheson Blvd., East, Mississauga, ON, L4Z 1X8
www.multiVIEW.ca
CONTRACT REF: 28665
NDT ASSESSMENT REPORT
RoadMap & Noggin Ground Penetrating Radar for
Abutment Walls Condition Assessment
Country Rd 46 approximately 1.2 km east of CR 47, Havelock, Ontario
Submitted to:
Ainley Graham & Associates Limited
1-50 Grant Timmins Drive, Kingston, ON, K7M 8N2
Prepared by:
multiVIEW Locates Inc. 325 Matheson Blvd. East, Mississauga, ON, L4Z 1X8
Evelio Martinez, M.Sc., P.Geo Senior Geophysicist
February 28, 2015
Abutment Walls Condition Assessment Country Rd 46 approximately 1.2 km east of CR 47, Havelock, Ontario
Ainley Graham & Associates Limited
CONTRACT REF: 28665
February 28, 2015
II
TABLE OF CONTENTS
Digital Archive Content ..................................................................................................................... - 5 -
Project Specification List ................................................................................................................... - 6 -
Contract Release Letter: 28665 ......................................................................................................... - 7 -
1 Introduction ......................................................................................................................... - 8 -
1.1 Survey Objectives ......................................................................................................... - 8 -
2 Project Overview .................................................................................................................. - 9 -
2.1 Site and Weather Conditions ....................................................................................... - 9 -
3 Methodology ...................................................................................................................... - 10 -
3.1 Survey Grid Installment .............................................................................................. - 10 -
3.2 RoadMap GPR Data Acquisition ................................................................................. - 14 -
3.3 Noggin SmartCart GPR Data Acquisition .................................................................... - 15 -
3.4 Site Documentation ................................................................................................... - 16 -
3.5 Data Processing and Analysis ..................................................................................... - 16 -
3.6 GPR Signal Amplitude Attenuation Index Estimation ................................................ - 16 -
3.7 Rebar Identification and Interpretation ..................................................................... - 17 -
4 Results ................................................................................................................................ - 18 -
5 Conclusion and Recommendations .................................................................................... - 37 -
6 References.......................................................................................................................... - 39 -
7 Statement of Qualifications ............................................................................................... - 40 -
Appendices .......................................................................................................................................... 41
Appendix A: Terms and Conditions for Ground Penetrating Radar Survey ............................ - 42 -
Appendix B: Instrument Specifications ................................................................................... - 45 -
Appendix C: Ground Penetrating Radar Theory and Application ........................................... - 46 -

Abutment Walls Condition Assessment Country Rd 46 approximately 1.2 km east of CR 47, Havelock, Ontario
Ainley Graham & Associates Limited
CONTRACT REF: 28665
February 28, 2015
III
LIST OF FIGURES
Figure 2-1: Photo illustrating North River Survey Location with GPR Profile Layout ....................... - 9 -
Figure 3-1: Photo illustrating North River Survey Location with GPR Profile Layout ..................... - 10 -
Figure 3-2: View Looking East of the GPR Grid 1 on the East Abutment Wall ................................ - 11 -
Figure 3-3: View Looking West of the GPR Grid 2 on the West Abutment Wall ............................ - 12 -
Figure 3-4: View Looking Southwest of the GPR Survey Grid 3 on the West Winwall ................... - 12 -
Figure 3-5: View Looking Northwest of the GPR Survey Grid 4 on the West Winwall ................... - 13 -
Figure 3-6: View Looking Northeast of the GPR Survey Grid 5 on the East Winwall ...................... - 13 -
Figure 3-7: View Looking Southeast of the GPR Survey Grid 6 on the East Winwall ...................... - 14 -
Figure 3-8: RoadMap System with Ground Coupled GPR Sensors ................................................. - 15 -
Figure 3-9: Noggin 1000 MHz Custom System ................................................................................ - 16 -
Figure 4-1: Example of Interpreted Bridge Deck GPR Cross-sections ............................................. - 22 -
Figure 4-2: Example of GPR Cross-section on the East Abutment Wall- Grid 1 .............................. - 22 -
Figure 4-3: Example of GPR Cross-section on the East (Southeast) Winwall – Grid 5 .................... - 22 -
Figure 4-4: Example of GPR Cross-section on the East (Northwest) Winwall – Grid 6 ................... - 23 -
Figure 4-5: Example of GPR Cross-section on the West Abutment Wall - Grid 2 ........................... - 23 -
Figure 4-6: Example of GPR Cross-section on the West (Southeast) Winwall – Grid 3 .................. - 23 -
Figure 4-7: Example of GPR Cross-section on the West (Northwest) Winwall – Grid 4 ................. - 23 -
Figure 4-8: Bridge Deck GPR SA Index with Corrosion Potential Contours Overlay ....................... - 24 -
Figure 4-9: East Abutment Wall Signal Amplitude Attenuation Index ............................................ - 25 -
Figure 4-10: East (Southeast) Winwall Signal Amplitude Attenuation Index .................................. - 26 -
Figure 4-11: East (Northwest) Winwall Signal Amplitude Attenuation Index ................................. - 27 -
Figure 4-12: West Abutment Wall Signal Amplitude Attenuation Index ........................................ - 28 -
Figure 4-13: West (Southeast) Winwall Signal Amplitude Attenuation Index ................................ - 29 -
Figure 4-14: West (Northwest) Winwall Signal Amplitude Attenuation Index ............................... - 30 -
Figure 4-15: Bridge Deck Corrosion Potential Grid with GPR SA Index Contours Overlay ............. - 31 -
Figure 4-16: Bridge Deck Rebar Depth Contour Grid Map .............................................................. - 32 -
Figure 4-17: Profile E – Half-Cell Corrosion Potential vs GPR SA Index........................................... - 33 -
Figure 4-18: Profile D – Half-Cell Corrosion Potential vs GPR SA Index .......................................... - 34 -
Figure 4-19: Profile C – Half-Cell Corrosion Potential vs GPR SA Index .......................................... - 35 -
Figure 4-20: Profile B – Half-Cell Corrosion Potential vs GPR SA Index .......................................... - 36 -
Abutment Walls Condition Assessment Country Rd 46 approximately 1.2 km east of CR 47, Havelock, Ontario
Ainley Graham & Associates Limited
CONTRACT REF: 28665
February 28, 2015
IV
LIST OF TABLES
Table 1: Digital Archive Content........................................................................................................ - 5 -
Table 2: Project Specification List ..................................................................................................... - 6 -
Table 3: Bridge Deck GPR SA Index Summary Table ....................................................................... - 19 -
Table 4: Grid1 (East Abutment Wall) GPR SA Index Summary Table .............................................. - 19 -
Table 5: Grid2 (West Abutment Wall) GPR SA Index Summary Table ............................................ - 20 -
Table 6: Grid3 (West Winwall) GPR SA Index Summary Table ........................................................ - 20 -
Table 7: Grid4 (West Winwall) GPR SA Index Summary Table ........................................................ - 20 -
Table 8: Grid5 (East Winwall) GPR SA Index Summary Table ......................................................... - 20 -
Table 9: Grid6 (East Winwall) GPR SA Index Summary Table ......................................................... - 21 -

Abutment Walls Condition Assessment Country Rd 46 approximately 1.2 km east of CR 47, Havelock, Ontario
Ainley Graham & Associates Limited
CONTRACT REF: 28665
February 28, 2015
Digital Archive Content - 5 -
DIGITAL ARCHIVE CONTENT
Table 1: Digital Archive Content
Folder Content
…//Drawings/ Digital copy of Bridge Structural maps and sections
…//Figures / Screen captured images of the GPR maps and sketches, including site photographs
…//Maps/ Grid contoured and interpretation maps
…//Photos/ Photos of bridge deck features and reference location
…//Processing/ Processed GPR data and results
…//Raw Data/ Acquired raw data
…//Reports/ Field and survey reports and presentations with interpretation results
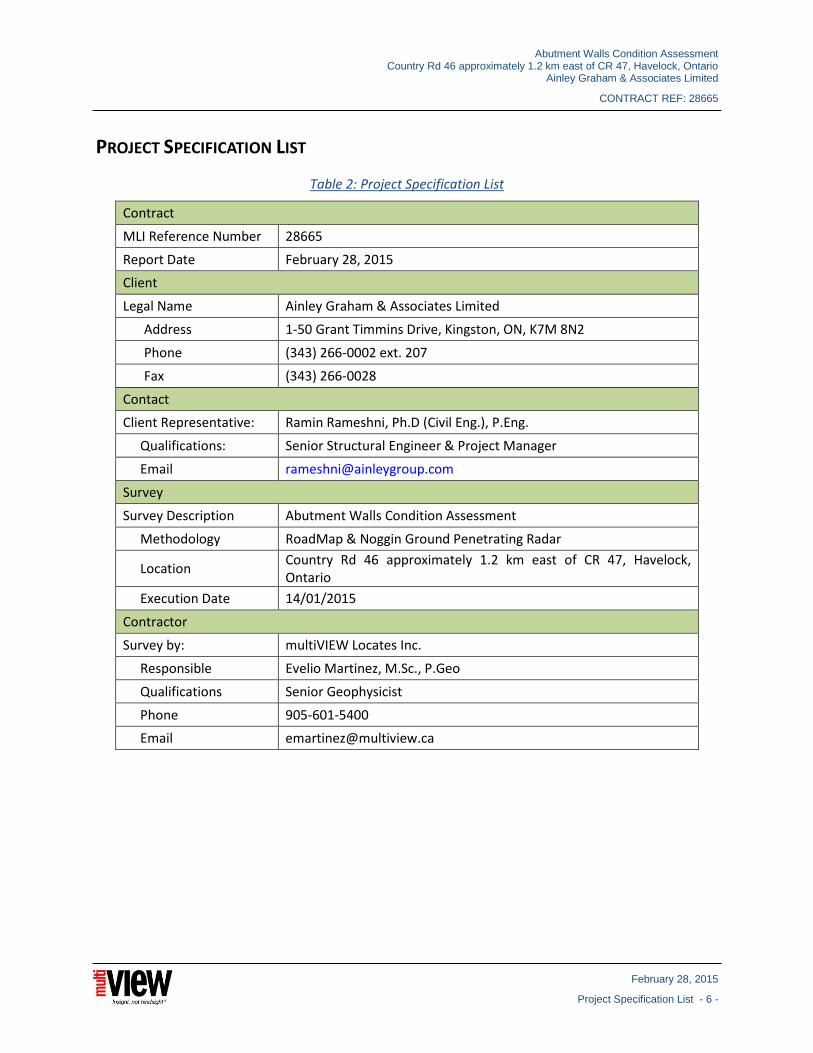
Abutment Walls Condition Assessment Country Rd 46 approximately 1.2 km east of CR 47, Havelock, Ontario
Ainley Graham & Associates Limited
CONTRACT REF: 28665
February 28, 2015
Project Specification List - 6 -
PROJECT SPECIFICATION LIST
Table 2: Project Specification List
Contract
MLI Reference Number 28665
Report Date February 28, 2015
Client
Legal Name Ainley Graham & Associates Limited
Address 1-50 Grant Timmins Drive, Kingston, ON, K7M 8N2
Phone (343) 266-0002 ext. 207
Fax (343) 266-0028
Contact
Client Representative: Ramin Rameshni, Ph.D (Civil Eng.), P.Eng.
Qualifications: Senior Structural Engineer & Project Manager
Email [email protected]
Survey
Survey Description Abutment Walls Condition Assessment
Methodology RoadMap & Noggin Ground Penetrating Radar
Location Country Rd 46 approximately 1.2 km east of CR 47, Havelock, Ontario
Execution Date 14/01/2015
Contractor
Survey by: multiVIEW Locates Inc.
Responsible Evelio Martinez, M.Sc., P.Geo
Qualifications Senior Geophysicist
Phone 905-601-5400
Email [email protected]
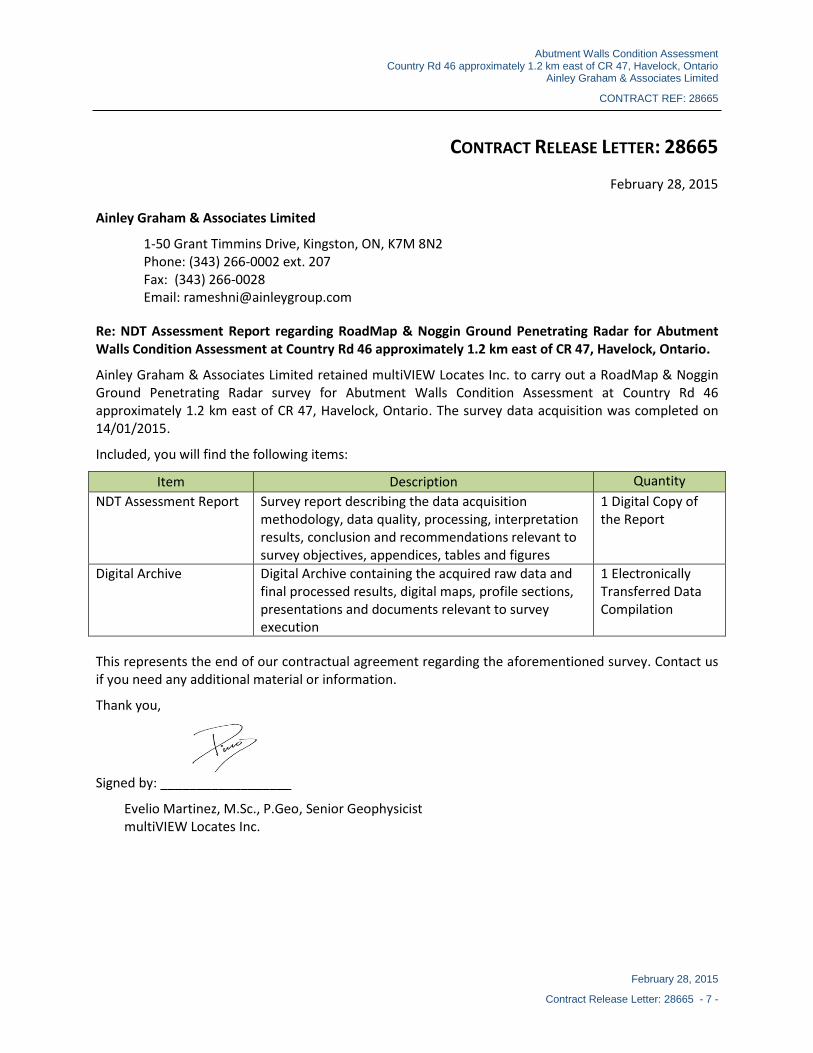
Abutment Walls Condition Assessment Country Rd 46 approximately 1.2 km east of CR 47, Havelock, Ontario
Ainley Graham & Associates Limited
CONTRACT REF: 28665
February 28, 2015
Contract Release Letter: 28665 - 7 -
CONTRACT RELEASE LETTER: 28665
February 28, 2015
Ainley Graham & Associates Limited
1-50 Grant Timmins Drive, Kingston, ON, K7M 8N2 Phone: (343) 266-0002 ext. 207 Fax: (343) 266-0028 Email: [email protected]
Re: NDT Assessment Report regarding RoadMap & Noggin Ground Penetrating Radar for Abutment Walls Condition Assessment at Country Rd 46 approximately 1.2 km east of CR 47, Havelock, Ontario.
Ainley Graham & Associates Limited retained multiVIEW Locates Inc. to carry out a RoadMap & Noggin Ground Penetrating Radar survey for Abutment Walls Condition Assessment at Country Rd 46 approximately 1.2 km east of CR 47, Havelock, Ontario. The survey data acquisition was completed on 14/01/2015.
Included, you will find the following items:
Item Description Quantity
NDT Assessment Report Survey report describing the data acquisition methodology, data quality, processing, interpretation results, conclusion and recommendations relevant to survey objectives, appendices, tables and figures
1 Digital Copy of the Report
Digital Archive Digital Archive containing the acquired raw data and final processed results, digital maps, profile sections, presentations and documents relevant to survey execution
1 Electronically Transferred Data Compilation
This represents the end of our contractual agreement regarding the aforementioned survey. Contact us if you need any additional material or information.
Thank you,
Signed by: __________________
Evelio Martinez, M.Sc., P.Geo, Senior Geophysicist multiVIEW Locates Inc.
Abutment Walls Condition Assessment Country Rd 46 approximately 1.2 km east of CR 47, Havelock, Ontario
Ainley Graham & Associates Limited
CONTRACT REF: 28665
February 28, 2015
Introduction - 8 -
1 INTRODUCTION
Ainley Graham & Associates Limited retained multiVIEW Locates Inc. to carry out a Noggin Ground Penetrating Radar for Abutment Walls Condition Assessment at Country Rd 46 approximately 1.2 km east of CR 47, Havelock, Ontario. In an effort to provide a correlation between GPR results and Half-Cell readings multiVIEW carried out a RoadMap Ground Penetrating Radar for bridge deck condition assessment in addition to and as a value added to the requested scope of project. A brief discussion comparing the GPR results for the bridge deck and the conventional Half-Cell readings carried out during the latest “Detailed Bridge Deck Condition Survey (2014) will therefore be provided as part of this report.
This Non-Destructive Testing (NDT) Assessment Report summarizes the GPR data collection logistics and methodology, processing results, tabulated data summaries associated with the bridge deck and abutment wall deterioration analysis. Scaled images of RoadMap plan maps, Noggin GPR sections and Excel format tables are available in the digital archive submitted on the accompanying DVD. The acquisition, processing and analysis of the Ground Penetrating Radar (GPR) data were performed according to professionally regulated industry ASTM D 6087–07 standards. The data interpretation contained in this report is based on the analysis of the Ground Penetrating Radar responses recorded during the acquisition and processing stage.
Examples of the results are presented in screen captured figures, cross-sections and depth plan maps throughout the sections of this interpretation report. The images and figures are intended for referencing and illustration purposes only. The interpretation of the data obtained during this investigation is intended for the guidance of the follow-up preliminary and detail design. Interpretation and use of the GPR data during any subsequent programs is subject to the Law of Physics and Technical limitations as stated in Appendix A: Terms and Conditions for Ground Penetrating Radar Survey. The criteria and models used for the interpretation of the acquired GPR data are not unique and may not represent the actual objects present on site.
1.1 SURVEY OBJECTIVES
The scope and deliverables of the GPR surveys carried out over the Country Rd 46 approximately 1.2 km east of CR 47, Havelock, Ontario were:
Collect RoadMap GPR Data over the bridge deck, 2 passes per lane equipped with three ground-coupled 1000 MHz antennas.
Collect Noggin GPR data on the abutment walls using a handheld system equipped with one ground-coupled 1000 MHz antenna.
Process RoadMap and Noggin GPR data to identify amplitude of top layer of rebar of the bridge deck and abutment walls; and produce GPR Signal Amplitude Attenuation Index maps based on ASTM standard.
Provide tabulated summary of GPR based Signal Amplitude Attenuation Index and overall percent area of the bridge deck and abutment walls that is considered deteriorated based on a defined amplitude threshold level (ASTM D 6087–08).
Provide appendices containing plan view images of the bridge deck and abutment walls displaying the GPR Signal Amplitude Attenuation Index and summary statistics.

Abutment Walls Condition Assessment Country Rd 46 approximately 1.2 km east of CR 47, Havelock, Ontario
Ainley Graham & Associates Limited
CONTRACT REF: 28665
February 28, 2015
Project Overview - 9 -
2 PROJECT OVERVIEW
RoadMap & Noggin Ground Penetrating Radar imaging and deterioration analysis were performed for the bridge deck and abutment walls located at Country Rd 46 approximately 1.2 km east of CR 47, Havelock, Ontario.
Over the bridge deck, the RoadMap survey grid and profiles were situated between bridge deck ends over the accessible deck area. Short term closure of one lane was not necessary during the GPR surveys. Six GPR grids were scanned over the abutment walls. The position and orientation of the survey grids for each wall section.
2.1 SITE AND WEATHER CONDITIONS
The surface of the RoadMap survey grid for most of the scanned profiles consisted of asphalt paved lanes. In some cases, asphalt filled cracks were observed on the surface of the paved bridge deck. The Noggin survey grids for the abutment walls were situated over concrete walls.
The RoadMap profiling and Noggin GPR data acquisition was performed during year 2014-2015 winter season. The data acquisition was performed on a moderately dry day with average temperatures of ~-10 degrees Celsius. In general, during the survey period local weather conditions did not impede the collection of the Noggin GPR data over the abutment walls.
The bridge deck surface was partially covered with ~1cm snow layer. Areas covered with snow or presence of salting in snow/ice conditions can significantly affect GPR signal amplitudes. Since bridge deck assessment data analysis is contingent on consistent amplitude information in the GPR data, best results are obtained by avoiding surveying in adverse weather conditions (Sensors & Software. 2008).
Figure 2-1: Photo illustrating North River Survey Location with GPR Profile Layout
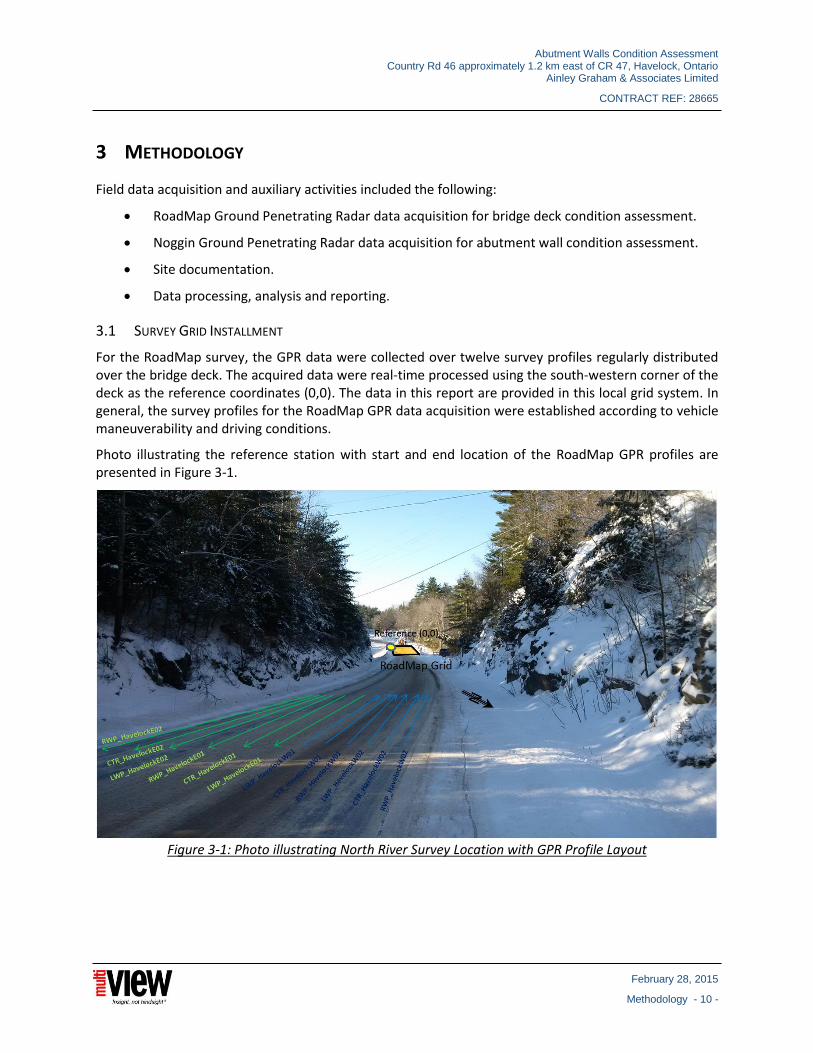
Abutment Walls Condition Assessment Country Rd 46 approximately 1.2 km east of CR 47, Havelock, Ontario
Ainley Graham & Associates Limited
CONTRACT REF: 28665
February 28, 2015
Methodology - 10 -
3 METHODOLOGY
Field data acquisition and auxiliary activities included the following:
RoadMap Ground Penetrating Radar data acquisition for bridge deck condition assessment.
Noggin Ground Penetrating Radar data acquisition for abutment wall condition assessment.
Site documentation.
Data processing, analysis and reporting.
3.1 SURVEY GRID INSTALLMENT
For the RoadMap survey, the GPR data were collected over twelve survey profiles regularly distributed over the bridge deck. The acquired data were real-time processed using the south-western corner of the deck as the reference coordinates (0,0). The data in this report are provided in this local grid system. In general, the survey profiles for the RoadMap GPR data acquisition were established according to vehicle maneuverability and driving conditions.
Photo illustrating the reference station with start and end location of the RoadMap GPR profiles are presented in Figure 3-1.
Figure 3-1: Photo illustrating North River Survey Location with GPR Profile Layout

Abutment Walls Condition Assessment Country Rd 46 approximately 1.2 km east of CR 47, Havelock, Ontario
Ainley Graham & Associates Limited
CONTRACT REF: 28665
February 28, 2015
Methodology - 11 -
For the Noggin GPR survey grids over the abutment walls, the reference stations were positioned in the bottom-left corner of each wall at approximately 20 cm from the vertical edges, and 10 cm from the bottom of the wall edges. The GPR survey grids were arranged in a squared pattern to ensure proper alignment to bridge structures, as illustrated in Figure 3-2 to Figure 3-4.
After marking out the reference corners, a colour mark was placed every 20 cm to mark the line interval along the horizontal axis of the grid.
The data and results are reported using local x-y coordinates system with the reference origin (X=0, Y=0) at the left-bottom side of each bridge wall. Starting from the reference location (0,0), the GPR survey profiles were installed with parallel passes (profiles) and increasing stations on the direction of the scanning.
Figure 3-2: View Looking East of the GPR Grid 1 on the East Abutment Wall
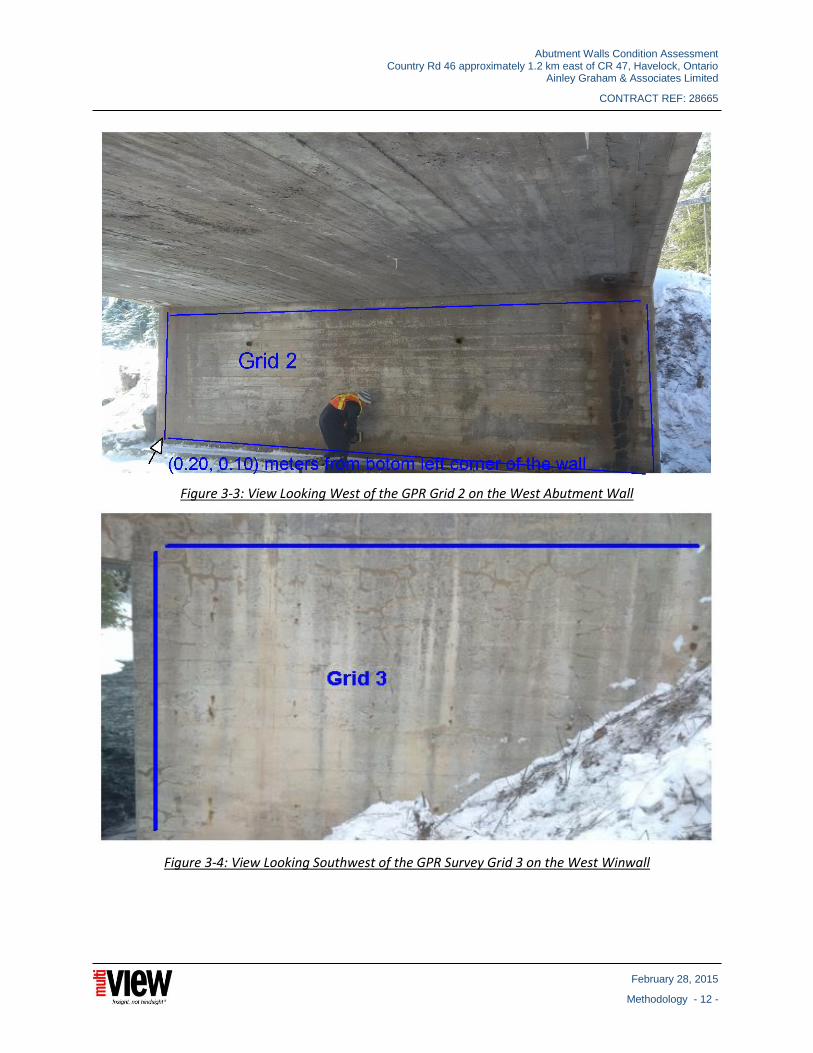
Abutment Walls Condition Assessment Country Rd 46 approximately 1.2 km east of CR 47, Havelock, Ontario
Ainley Graham & Associates Limited
CONTRACT REF: 28665
February 28, 2015
Methodology - 12 -
Figure 3-3: View Looking West of the GPR Grid 2 on the West Abutment Wall
Figure 3-4: View Looking Southwest of the GPR Survey Grid 3 on the West Winwall

Abutment Walls Condition Assessment Country Rd 46 approximately 1.2 km east of CR 47, Havelock, Ontario
Ainley Graham & Associates Limited
CONTRACT REF: 28665
February 28, 2015
Methodology - 13 -
Figure 3-5: View Looking Northwest of the GPR Survey Grid 4 on the West Winwall
Figure 3-6: View Looking Northeast of the GPR Survey Grid 5 on the East Winwall

Abutment Walls Condition Assessment Country Rd 46 approximately 1.2 km east of CR 47, Havelock, Ontario
Ainley Graham & Associates Limited
CONTRACT REF: 28665
February 28, 2015
Methodology - 14 -
Figure 3-7: View Looking Southeast of the GPR Survey Grid 6 on the East Winwall
3.2 ROADMAP GPR DATA ACQUISITION
RoadMap GPR data were acquired with a SmartTrailer using a standard ground coupled configuration with 3 GPR sensors operating at 1000 MHz. multiVIEW uses the unique RoadMap GPR system developed by Sensors & Software Inc. of Mississauga, Ontario. This technology enables ground-coupled GPR measurements at highway speeds yielding high spatial resolution and improved depth penetration GPR data (Sensors & Software, 2013).
The RoadMap GPR custom platform obtains GPR traces at user-defined spatial intervals and provides positioning using an integrated DMI (distance measuring instrument), integrated GPS, and manual fiducial markers indicating features visible during data acquisition. The RoadMap GPR sensors meet all government regulatory conditions for UWB GPR radio frequency emissions. In order to assure high resolution data acquisition required for bridge deck analysis, the RoadMap survey was carried out at a nominal driving speed of approximately 40 km/h, conditioned by traffic and logistics. At 40 km/h, independent GPR observations were collected at 2 cm station intervals simultaneously on all three positions; center, left and right wheel paths along the survey area.
The RoadMap GPR survey was completed during off peak hours in such a way that there was no measurable impact to the regular traffic flow. High resolution GPS data were also collected in conjunction with GPR data to provide geo-referenced positioning. Prior to data collection all safety equipment and vehicle lights were checked to ensure proper operation. Tire pressures of the SmartTrailer were set to 30 psi, the ride height of each Noggin 1000 was set to 0.75cm, and the floating suspension of each Noggin assembly was adjusted to an optimum level. A common, accurate odometer calibration value was set on each GPR system.
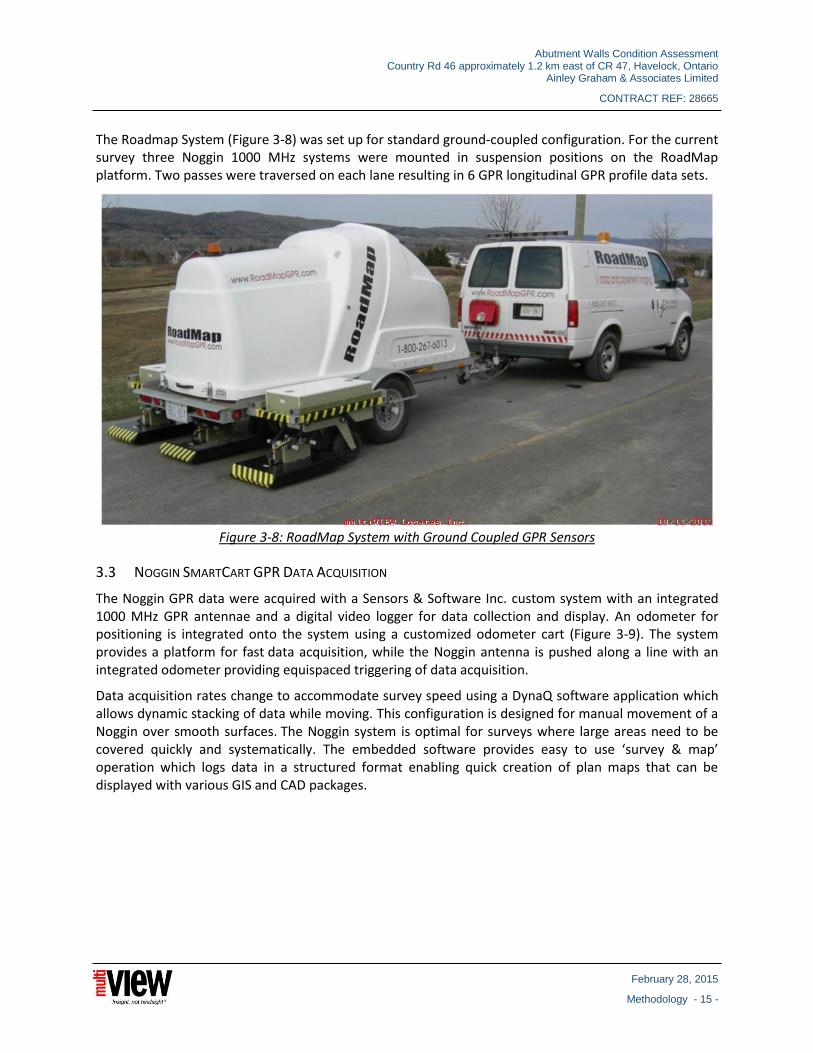
Abutment Walls Condition Assessment Country Rd 46 approximately 1.2 km east of CR 47, Havelock, Ontario
Ainley Graham & Associates Limited
CONTRACT REF: 28665
February 28, 2015
Methodology - 15 -
The Roadmap System (Figure 3-8) was set up for standard ground-coupled configuration. For the current survey three Noggin 1000 MHz systems were mounted in suspension positions on the RoadMap platform. Two passes were traversed on each lane resulting in 6 GPR longitudinal GPR profile data sets.
Figure 3-8: RoadMap System with Ground Coupled GPR Sensors
3.3 NOGGIN SMARTCART GPR DATA ACQUISITION
The Noggin GPR data were acquired with a Sensors & Software Inc. custom system with an integrated 1000 MHz GPR antennae and a digital video logger for data collection and display. An odometer for positioning is integrated onto the system using a customized odometer cart (Figure 3-9). The system provides a platform for fast data acquisition, while the Noggin antenna is pushed along a line with an integrated odometer providing equispaced triggering of data acquisition.
Data acquisition rates change to accommodate survey speed using a DynaQ software application which allows dynamic stacking of data while moving. This configuration is designed for manual movement of a Noggin over smooth surfaces. The Noggin system is optimal for surveys where large areas need to be covered quickly and systematically. The embedded software provides easy to use ‘survey & map’ operation which logs data in a structured format enabling quick creation of plan maps that can be displayed with various GIS and CAD packages.
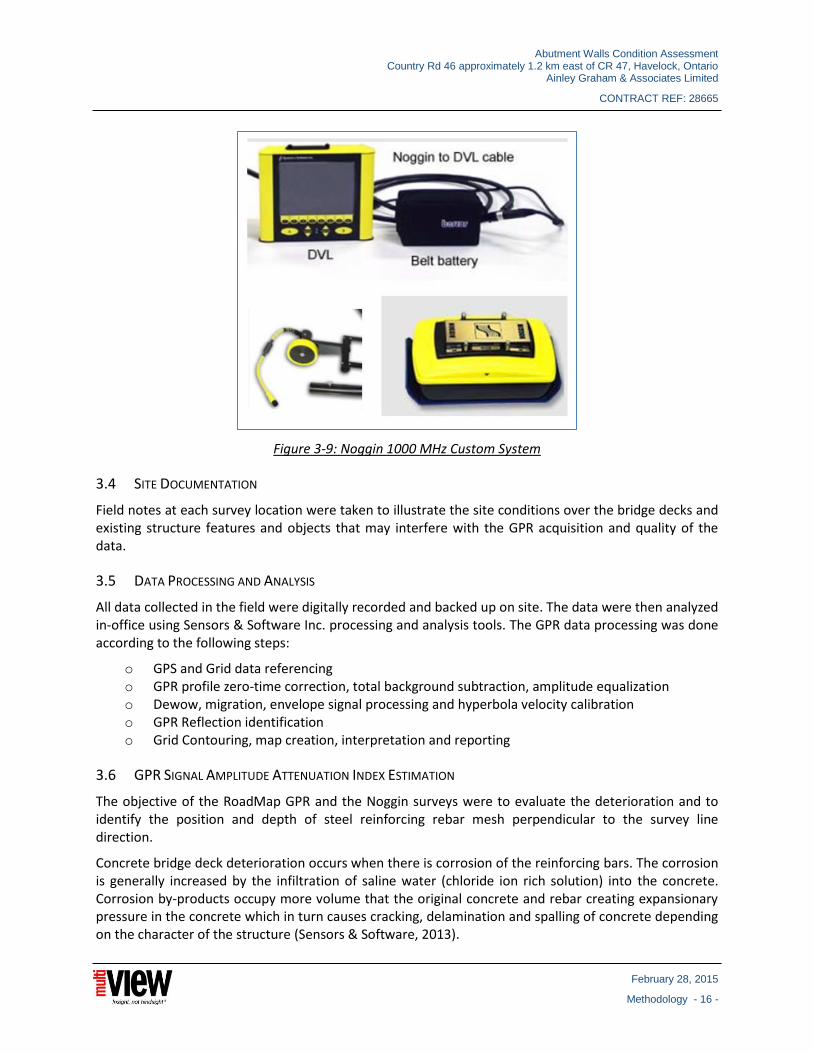
Abutment Walls Condition Assessment Country Rd 46 approximately 1.2 km east of CR 47, Havelock, Ontario
Ainley Graham & Associates Limited
CONTRACT REF: 28665
February 28, 2015
Methodology - 16 -
Figure 3-9: Noggin 1000 MHz Custom System
3.4 SITE DOCUMENTATION
Field notes at each survey location were taken to illustrate the site conditions over the bridge decks and existing structure features and objects that may interfere with the GPR acquisition and quality of the data.
3.5 DATA PROCESSING AND ANALYSIS
All data collected in the field were digitally recorded and backed up on site. The data were then analyzed in-office using Sensors & Software Inc. processing and analysis tools. The GPR data processing was done according to the following steps:
o GPS and Grid data referencing o GPR profile zero-time correction, total background subtraction, amplitude equalization o Dewow, migration, envelope signal processing and hyperbola velocity calibration o GPR Reflection identification o Grid Contouring, map creation, interpretation and reporting
3.6 GPR SIGNAL AMPLITUDE ATTENUATION INDEX ESTIMATION
The objective of the RoadMap GPR and the Noggin surveys were to evaluate the deterioration and to identify the position and depth of steel reinforcing rebar mesh perpendicular to the survey line direction.
Concrete bridge deck deterioration occurs when there is corrosion of the reinforcing bars. The corrosion is generally increased by the infiltration of saline water (chloride ion rich solution) into the concrete. Corrosion by-products occupy more volume that the original concrete and rebar creating expansionary pressure in the concrete which in turn causes cracking, delamination and spalling of concrete depending on the character of the structure (Sensors & Software, 2013).

Abutment Walls Condition Assessment Country Rd 46 approximately 1.2 km east of CR 47, Havelock, Ontario
Ainley Graham & Associates Limited
CONTRACT REF: 28665
February 28, 2015
Methodology - 17 -
The propagation speed of GPR signals correlates directly with water content, and signal attenuation is directly influenced by water salinity. By analyzing the GPR response from localized targets embedded in concrete (rebar, post-tension cables, or similar items), estimates of velocity and attenuation can be derived. GPR estimations of velocity, depth and attenuation are used to form a logarithmic deterioration indication created for each target. Measuring with GPR over bridge structures and analyzing many targets provides means of creating bridge deck signal amplitude attenuation index maps.
Steel reinforcing bar perpendicular to the line direction produce a characteristic scattering hyperbola in the GPR cross-section. Lower amplitudes are indicative of higher deterioration. The reflection amplitude is controlled by the properties of the concrete and of the rebar. Increased attenuation in the concrete related to higher chloride content and/or moisture, result in greater signal loss between the surface and rebar resulting in lower amplitudes. The higher chloride and moisture zones are indicative of probable areas of current or incipient delamination induced by rebar corrosion processes (Sensors & Software, 2013).
The rebar reflection amplitude data are presented in decibels (dB) of attenuation relative to the reference amplitude, defined as the median of the top 10% of the rebar amplitudes. The reference amplitude is considered to be representative of a minimal deterioration. The computed signal attenuation level based on the measured rebar reflection amplitude and reference amplitude is referred to as the Signal Amplitude Attenuation Index.
The methodology for estimating the deterioration index is referred to in ASTM D 6087–08. The ASTM standard provides guide on what level of deterioration index (similar to multiVIEW’s Signal Amplitude Attenuation Index) is a suitable threshold for indicating the presence of deterioration. Best practice suggests that using the initial map result to do confirmatory intrusive sampling at several areas of differing deterioration index are the best manner in selecting this threshold.
Following ASTM D 6087–08, the areas with a Signal Amplitude Attenuation Index above 6-8 dB are considered to be potentially deteriorated (ASTM, 2008). When available, other intrusive deterioration assessment techniques shall be used to statically correlate and predict the Signal Amplitude Attenuation Index threshold value with the actual deterioration level. This analysis assumes that bridge construction practices and asphalt overlay are uniform over each bridge.
3.7 REBAR IDENTIFICATION AND INTERPRETATION
The Noggin GPR survey data was acquired for estimating the position and depth of rebar mesh. GPR measures the travel time of a transmitted pulse to subsurface interfaces and features. To determine depths to these interfaces and features it is necessary to determine the velocity of GPR pulses within the concrete.
GPR reflection identification was accomplished by examining the subsurface electromagnetic responses such as high amplitude hyperbolic reflections. The GPR lines that run transverse to the structure generally provide the best information on the location and depth of the rebar. GPR signal amplitude slices at various depths were utilized for enhancing the spatial location and depth of the identified reflectors.

Abutment Walls Condition Assessment Country Rd 46 approximately 1.2 km east of CR 47, Havelock, Ontario
Ainley Graham & Associates Limited
CONTRACT REF: 28665
February 28, 2015
Results - 18 -
4 RESULTS
The raw data and survey results presented as digital plan maps and sections are:
GPR Signal Amplitude Attenuation Index colour contoured maps.
GPR reflection sections along scanned profile lines.
Ground penetrating radar survey data and interpretation results are presented in plan maps of GPR Signal Amplitude Attenuation Index at scale adequate for the data interpretation and visualization. Example of plan maps illustrating the estimated GPR Signal Amplitude Attenuation Index associated with each bridge structure are presented in the following sections. The figures in the body of the report are scaled to fit the page size. For details on the GPR raw data and scaled interpretation maps refer to the digital archive.
For the Signal Amplitude Attenuation Index colour contoured maps the background GPR response is represented by blue to white colours (cool colours); and the anomalous responses are denoted by green to red colour contours representing potential deterioration. Example of GPR cross-sections are shown in Figure 4-1 to Figure 4-7. The inverted “V” features in the cross-sections are the characteristic scattering hyperbolas seen in GPR data for profiles collected perpendicular to long linear features such as rebar reinforcement and void tubes.
Plan map images of the bridge Signal Amplitude Attenuation Index for the bridge deck and abutment walls are shown from Figure 4-8 to Figure 4-14. The Signal Amplitude Attenuation contour grid for the bridge deck was calculated from the RoadMap measurement points collected on each survey line above each of the transverse rebar in the upper rebar mat. Note that the Signal Amplitude Attenuation Index was estimated using a Kriging interpolation method based on the locations where rebar amplitudes could be measured.
In the Bridge Deck Condition Survey report for year 2014, MacDonald, 2014 states that the corrosion potential readings range from -0.309V to -0.530V with an average reading of -0.438V. Approximately 93% of the deck riding surface has a 90% probability that corrosion of the reinforcing steel is occurring. The remaining 7% of the deck riding surface has uncertain corrosion activity (M. MacDonald. 2014). The abutment and wingwalls walls are in fair condition with narrow to medium width stained and unstained cracks and light to moderate scaling (M. MacDonald. 2014).
A Half-Cell Corrosion Potentials contour grid map was created from the data available in the Bridge Deck Condition Survey (MacDonald, 2014). The Corrosion Potential grid map and sawn/core sample results for the bridge deck were used to predict the Signal Amplitude Attenuation Index threshold value with the actual deterioration level. This analysis assumes that bridge construction practices and asphalt overlay are uniform over each bridge.
The compilation map presented on Figure 4-15 indicates that the Half-Cell corrosion potential contour of “-0.450” volts correlates with the 6db Signal Amplitude Attenuation Index contour level. The ASTM standard also suggests that areas with Signal Amplitude Attenuation Index above 6-8 dB level (red colour series) are associated with deterioration. Profile correlation between Half-Cell Corrosion Potentials and Signal Amplitude Attenuation Index are shown in Figure 4-17 to Figure 4-20.
According to “MacDonald, 2014”, the concrete deck was observed at the sawn sample locations and found to be in poor condition with apparent defects at all locations. The concrete deck at the sawn

Abutment Walls Condition Assessment Country Rd 46 approximately 1.2 km east of CR 47, Havelock, Ontario
Ainley Graham & Associates Limited
CONTRACT REF: 28665
February 28, 2015
Results - 19 -
sample locations was found to be delaminated, scaled, spalled with some cracks. Excluding “C6”, the remaining sawn and core samples are located within 8db contour levels indicating that higher deterioration of the bridge deck and abutment walls is expected above 8db contour levels. The Signal Amplitude Attenuation Index is represented with contour leveled lines and colour grid on the plan map images from Figure 4-8 to Figure 4-14.
The spatial position and depth estimates of the longitudinal reinforcement and rebar are summarized in the Microsoft Excel tables available in the digital archive. Contour grid map of the bridge deck rebar depths is presented in Figure 4-16. For details on position and depth estimate of bridge structure components refer to the drawings and figures supplied in the digital archive. All plan map images have been presented with indicated scale for longitudinal and cross line positioning.
The GPR SA Index level that represents significant deterioration (ASTM deterioration threshold level) was established at 6db for the bridge deck and abutment structures. Areas of the bridge structure with an index lower than 6 dB (blue to white colour series) is considered to be not deteriorated.
The estimated Signal Amplitude Attenuation Index level that represents deterioration is relative for each of the analyzed bridge structure. The GPR signal amplitude threshold level depends on the survey grid conditions during the data acquisition; therefore the Signal Amplitude Attenuation Index for the bridge deck should be estimated from data acquired over clean and dry bridge deck surface. The following Table 4 to Table 9 illustrate the GPR Signal Amplitude Attenuation Index summary with percent of area.
Table 3: Bridge Deck GPR SA Index Summary Table
Threshold Level (dB) Number of Points Percent (%)
16db 30 19
12db 56 36
8db (ASTM) 85 54
6db (ASTM deterioration threshold level) 110 70
4db 120 76
2db 138 88
Total Reflection Points 157 100
Table 4: Grid1 (East Abutment Wall) GPR SA Index Summary Table
Threshold Level (dB) Number of Points Percent
16db - -
12db 4 1
8db (ASTM) 41 12
6db (ASTM deterioration threshold level) 81 24
4db 154 46
2db 250 75
Total Reflection Points 332 100
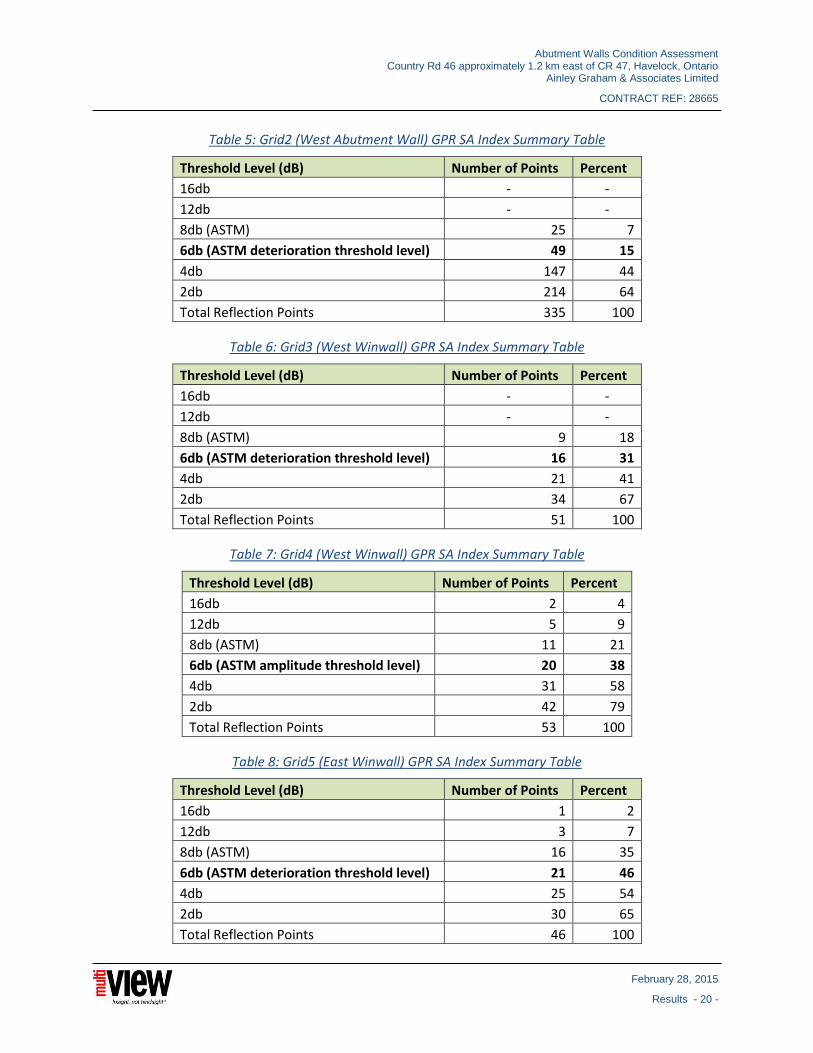
Abutment Walls Condition Assessment Country Rd 46 approximately 1.2 km east of CR 47, Havelock, Ontario
Ainley Graham & Associates Limited
CONTRACT REF: 28665
February 28, 2015
Results - 20 -
Table 5: Grid2 (West Abutment Wall) GPR SA Index Summary Table
Threshold Level (dB) Number of Points Percent
16db - -
12db - -
8db (ASTM) 25 7
6db (ASTM deterioration threshold level) 49 15
4db 147 44
2db 214 64
Total Reflection Points 335 100
Table 6: Grid3 (West Winwall) GPR SA Index Summary Table
Threshold Level (dB) Number of Points Percent
16db - -
12db - -
8db (ASTM) 9 18
6db (ASTM deterioration threshold level) 16 31
4db 21 41
2db 34 67
Total Reflection Points 51 100
Table 7: Grid4 (West Winwall) GPR SA Index Summary Table
Threshold Level (dB) Number of Points Percent
16db 2 4
12db 5 9
8db (ASTM) 11 21
6db (ASTM amplitude threshold level) 20 38
4db 31 58
2db 42 79
Total Reflection Points 53 100
Table 8: Grid5 (East Winwall) GPR SA Index Summary Table
Threshold Level (dB) Number of Points Percent
16db 1 2
12db 3 7
8db (ASTM) 16 35
6db (ASTM deterioration threshold level) 21 46
4db 25 54
2db 30 65
Total Reflection Points 46 100

Abutment Walls Condition Assessment Country Rd 46 approximately 1.2 km east of CR 47, Havelock, Ontario
Ainley Graham & Associates Limited
CONTRACT REF: 28665
February 28, 2015
Results - 21 -
Table 9: Grid6 (East Winwall) GPR SA Index Summary Table
Threshold Level (dB) Number of Points Percent
16db 1 2
12db 5 12
8db (ASTM) 12 29
6db (ASTM deterioration threshold level) 18 43
4db 20 48
2db 30 71
Total Reflection Points 42 100

Abutment Walls Condition Assessment Country Rd 46 approximately 1.2 km east of CR 47, Havelock, Ontario
Ainley Graham & Associates Limited
CONTRACT REF: 28665
February 28, 2015
Results - 22 -
The GPR survey interpretation results are presented digitally in scaled geo-referenced map drawings as follow:
…\GEO\Maps\DWG-01 Bridge Deck SA Attenuation Index.
…\GEO\Maps\DWG-02 East Abutment Wall SA Attenuation Index.
…\GEO\Maps\DWG-03 East Wingwalls SA Attenuation Index.
…\GEO\Maps\ DWG-04 West Abutment Wall SA Attenuation Index.
…\GEO\Maps\ DWG-05 West Wingwalls SA Attenuation Index.
Figure 4-1: Example of Interpreted Bridge Deck GPR Cross-sections
Figure 4-2: Example of GPR Cross-section on the East Abutment Wall- Grid 1
Figure 4-3: Example of GPR Cross-section on the East (Southeast) Winwall – Grid 5

Abutment Walls Condition Assessment Country Rd 46 approximately 1.2 km east of CR 47, Havelock, Ontario
Ainley Graham & Associates Limited
CONTRACT REF: 28665
February 28, 2015
Results - 23 -
Figure 4-4: Example of GPR Cross-section on the East (Northwest) Winwall – Grid 6
Figure 4-5: Example of GPR Cross-section on the West Abutment Wall - Grid 2
Figure 4-6: Example of GPR Cross-section on the West (Southeast) Winwall – Grid 3
Figure 4-7: Example of GPR Cross-section on the West (Northwest) Winwall – Grid 4
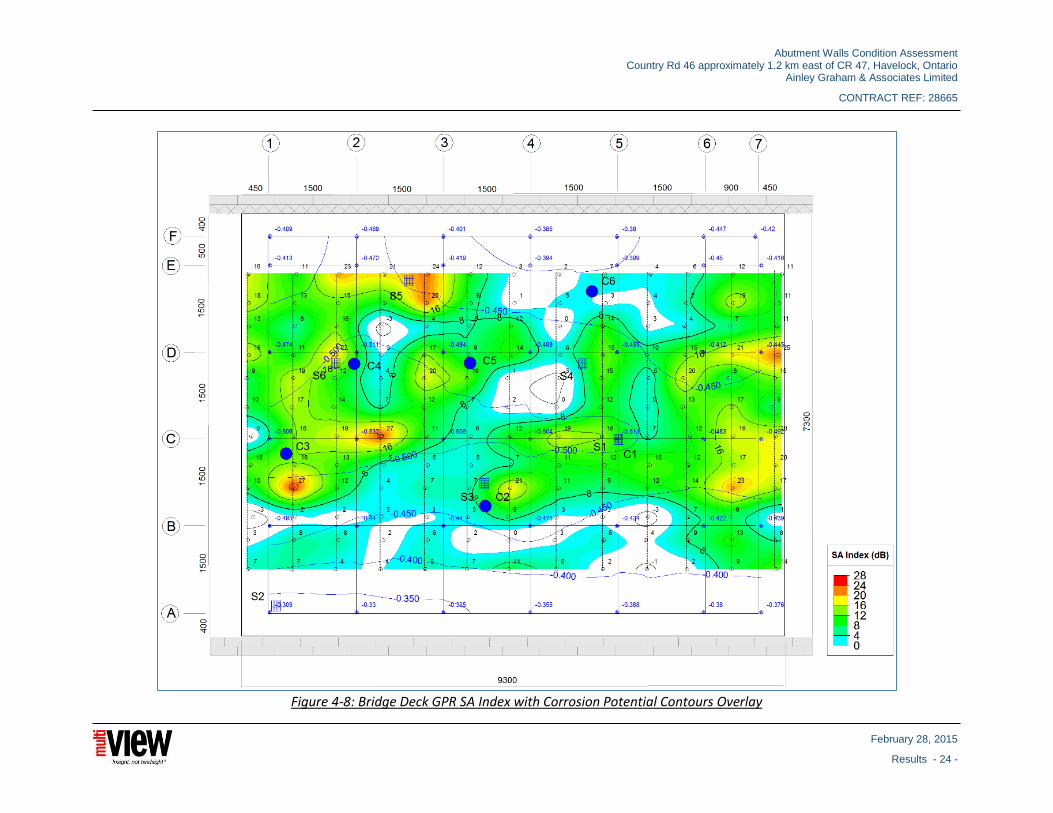
Abutment Walls Condition Assessment Country Rd 46 approximately 1.2 km east of CR 47, Havelock, Ontario
Ainley Graham & Associates Limited
CONTRACT REF: 28665
February 28, 2015
Results - 24 -
Figure 4-8: Bridge Deck GPR SA Index with Corrosion Potential Contours Overlay

Abutment Walls Condition Assessment Country Rd 46 approximately 1.2 km east of CR 47, Havelock, Ontario
Ainley Graham & Associates Limited
CONTRACT REF: 28665
February 28, 2015
Results - 25 -
Figure 4-9: East Abutment Wall Signal Amplitude Attenuation Index
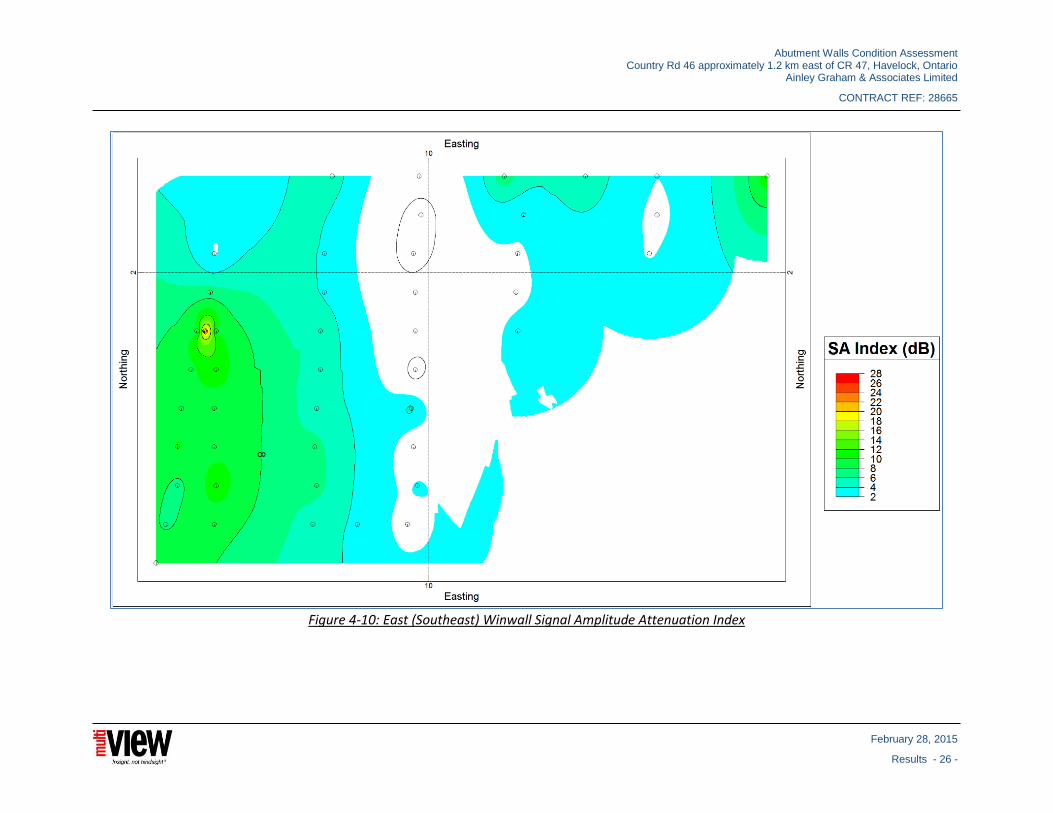
Abutment Walls Condition Assessment Country Rd 46 approximately 1.2 km east of CR 47, Havelock, Ontario
Ainley Graham & Associates Limited
CONTRACT REF: 28665
February 28, 2015
Results - 26 -
Figure 4-10: East (Southeast) Winwall Signal Amplitude Attenuation Index

Abutment Walls Condition Assessment Country Rd 46 approximately 1.2 km east of CR 47, Havelock, Ontario
Ainley Graham & Associates Limited
CONTRACT REF: 28665
February 28, 2015
Results - 27 -
Figure 4-11: East (Northwest) Winwall Signal Amplitude Attenuation Index
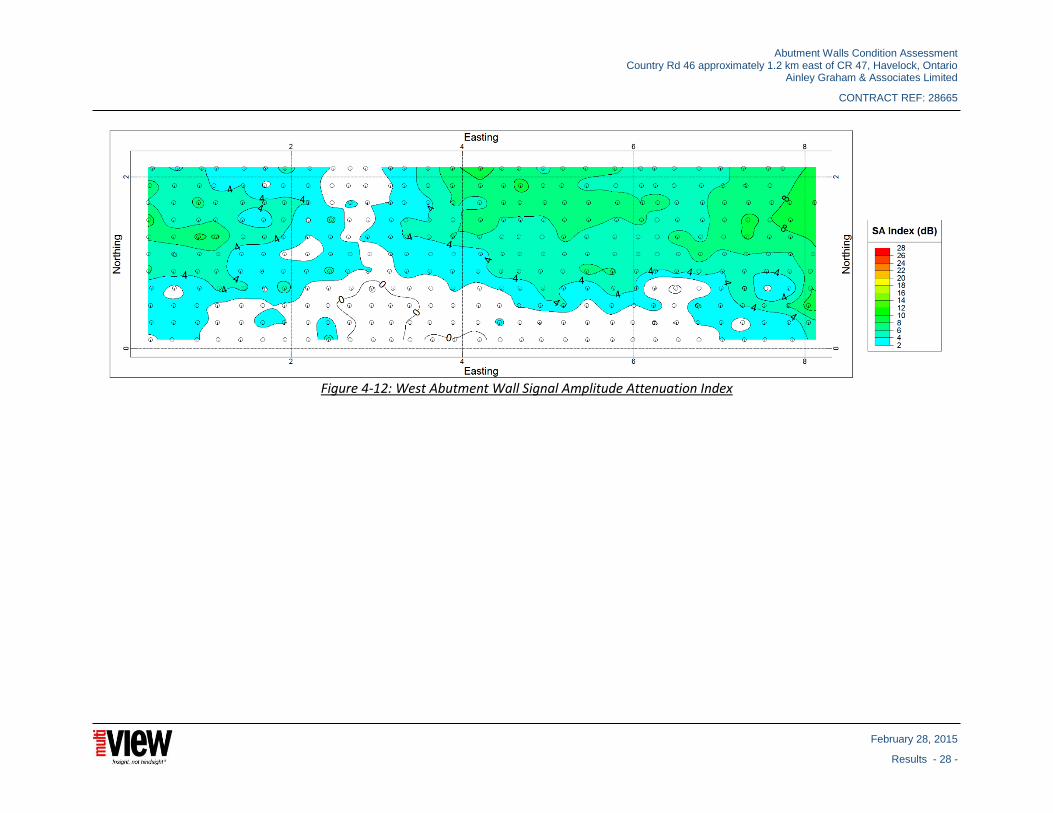
Abutment Walls Condition Assessment Country Rd 46 approximately 1.2 km east of CR 47, Havelock, Ontario
Ainley Graham & Associates Limited
CONTRACT REF: 28665
February 28, 2015
Results - 28 -
Figure 4-12: West Abutment Wall Signal Amplitude Attenuation Index

Abutment Walls Condition Assessment Country Rd 46 approximately 1.2 km east of CR 47, Havelock, Ontario
Ainley Graham & Associates Limited
CONTRACT REF: 28665
February 28, 2015
Results - 29 -
Figure 4-13: West (Southeast) Winwall Signal Amplitude Attenuation Index

Abutment Walls Condition Assessment Country Rd 46 approximately 1.2 km east of CR 47, Havelock, Ontario
Ainley Graham & Associates Limited
CONTRACT REF: 28665
February 28, 2015
Results - 30 -
Figure 4-14: West (Northwest) Winwall Signal Amplitude Attenuation Index
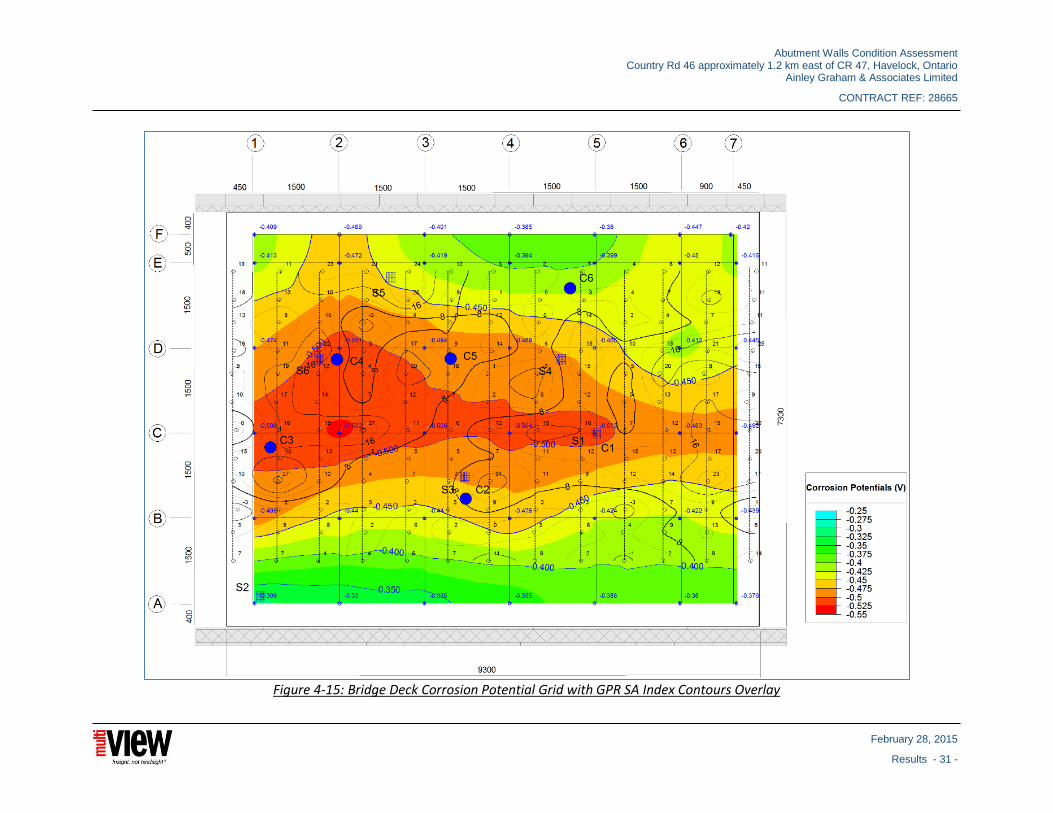
Abutment Walls Condition Assessment Country Rd 46 approximately 1.2 km east of CR 47, Havelock, Ontario
Ainley Graham & Associates Limited
CONTRACT REF: 28665
February 28, 2015
Results - 31 -
Figure 4-15: Bridge Deck Corrosion Potential Grid with GPR SA Index Contours Overlay

Abutment Walls Condition Assessment Country Rd 46 approximately 1.2 km east of CR 47, Havelock, Ontario
Ainley Graham & Associates Limited
CONTRACT REF: 28665
February 28, 2015
Results - 32 -
Figure 4-16: Bridge Deck Rebar Depth Contour Grid Map

Abutment Walls Condition Assessment Country Rd 46 approximately 1.2 km east of CR 47, Havelock, Ontario
Ainley Graham & Associates Limited
CONTRACT REF: 28665
February 28, 2015
Results - 33 -
Figure 4-17: Profile E – Half-Cell Corrosion Potential vs GPR SA Index

Abutment Walls Condition Assessment Country Rd 46 approximately 1.2 km east of CR 47, Havelock, Ontario
Ainley Graham & Associates Limited
CONTRACT REF: 28665
February 28, 2015
Results - 34 -
Figure 4-18: Profile D – Half-Cell Corrosion Potential vs GPR SA Index

Abutment Walls Condition Assessment Country Rd 46 approximately 1.2 km east of CR 47, Havelock, Ontario
Ainley Graham & Associates Limited
CONTRACT REF: 28665
February 28, 2015
Results - 35 -
Figure 4-19: Profile C – Half-Cell Corrosion Potential vs GPR SA Index

Abutment Walls Condition Assessment Country Rd 46 approximately 1.2 km east of CR 47, Havelock, Ontario
Ainley Graham & Associates Limited
CONTRACT REF: 28665
February 28, 2015
Results - 36 -
Figure 4-20: Profile B – Half-Cell Corrosion Potential vs GPR SA Index
Abutment Walls Condition Assessment Country Rd 46 approximately 1.2 km east of CR 47, Havelock, Ontario
Ainley Graham & Associates Limited
CONTRACT REF: 28665
February 28, 2015
Conclusion and Recommendations - 37 -
5 CONCLUSION AND RECOMMENDATIONS
RoadMap and Noggin GPR data acquisition and analysis was conducted over the bridge structure located at Country Rd 46 approximately 1.2 km east of CR 47, Havelock, Ontario for condition assessment and structure imaging.
The RoadMap GPR data was useful for evaluating the condition of the concrete bridge decks using the ASTM D 6087–08 standards. Potential deck and abutment wall deterioration was inferred based on the GPR Signal Amplitude Attenuation estimation using multiVIEW processing platforms and methodology. The relative attenuation of the GPR electromagnetic signal over the rebar mesh was used for estimating the deterioration over the analysed structure. The Noggin GPR data conducted over the abutment winwalls served for imaging the position and depth of reinforcement and longitudinal rebar.
Low amplitude of the GPR signal amplitude and high Signal Amplitude Attenuation Index are indicative of higher deterioration potentially related to chloride and moisture content, delamination and rebar corrosion. The inferred deteriorated areas and structure interpretation presented in this assessment report will assist the bridge engineer to effectively conduct rehabilitation and maintenance activities over the analysed grids.
The following summarises the GPR survey results:
6db SA Index contour level (and higher) represents significant deterioration (ASTM deterioration threshold level) of the bridge deck and abutment structures. The 8db contour indicates high deterioration level.
Areas of the bridge structure with an index lower than 6 dB (blue to white colour series) is considered to be not deteriorated.
The estimated Signal Amplitude Attenuation Index threshold level depends on the survey grid conditions during the data acquisition; therefore deterioration of the bridge deck should be estimated from data acquired over clean and dry deck surface.
The percentage of the scanned surfaces with SA Index above 6db, potentially related to deterioration are:
o Bridge Deck = 70%. o Grid1 (East Abutment Wall) = 24%. o Grid2 (West Abutment Wall) = 15%. o Grid3 (West Winwall) = 31%. o Grid4 (West Winwall) = 38%. o Grid5 (East Winwall) = 46%. o Grid6 (East Winwall) = 43%.
Further analysis of the data collected in context with all available information, structural documents and results from other exploration techniques should be consulted in order to corroborate the interpretation (position and depth estimate) of the bridge deck structure components and structure deterioration degree presented in this assessment report.
When physically locating the interpreted GPR responses over the bridge structure for testing, coring or repair it is recommended to properly correlate the referenced grid stations marked-up over the scanned grids with the stations presented on the digital maps. Additional information regarding advantages and

Abutment Walls Condition Assessment Country Rd 46 approximately 1.2 km east of CR 47, Havelock, Ontario
Ainley Graham & Associates Limited
CONTRACT REF: 28665
February 28, 2015
Conclusion and Recommendations - 38 -
limitations of this geophysical technique is provided in Appendix A: Terms and Conditions for Ground Penetrating Radar Survey.
Respectfully Submitted,
Evelio Martinez, M.Sc., P.Geo
multiVIEW Locates Inc.

Abutment Walls Condition Assessment Country Rd 46 approximately 1.2 km east of CR 47, Havelock, Ontario
Ainley Graham & Associates Limited
CONTRACT REF: 28665
February 28, 2015
References - 39 -
6 REFERENCES
o ASTM. 2008. “Standard Test Method for Evaluating Asphalt-Covered Concrete Bridge Decks Using Ground Penetrating Radar”. Designation D 6087-08. ASTM International, West Conshohocken. PA. 2008.
o Lisa Dojack. 2012. Ground Penetrating Radar Theory, Data Collection, Processing, and Interpretation: A Guide for Archaeologists.
o M. MacDonald. 2014. Detailed Bridge Deck Condition Survey North River Bridge County of Peterborough. G.D. Jewell Engineering Inc. September 2014.
o Sensors & Software. 2007. EKKO Mapper User’s Guide. Sensors & Software, Mississauga. o Sensors & Software. 2007. GFP View & GFP Edit User’s Guide. Sensors & Software,
Mississauga. o Sensors & Software. 2007. EKKO View Enhanced & EKKO View Deluxe User’s Guide. Sensors &
Software, Mississauga. o Sensors & Software. 2007. Ground Penetrating Radar Survey Design. Sensors & Software,
Mississauga. o Sensors & Software. 2007. Velocity Analysis. Sensors & Software, Mississauga. o Sensors & Software. 2008. Post-tension Cable Locating and Bridge Deck Condition Assessment
Using Ground Penetrating Radar. Sensors & Software, Mississauga.
Abutment Walls Condition Assessment Country Rd 46 approximately 1.2 km east of CR 47, Havelock, Ontario
Ainley Graham & Associates Limited
CONTRACT REF: 28665
February 28, 2015
Statement of Qualifications - 40 -
7 STATEMENT OF QUALIFICATIONS
I, Evelio Martinez del Pino, declare that:
I am a Senior Geophysicist with residence in Hamilton, Ontario and presently employed in this capacity with multiVIEW Locates Inc., Mississauga, Ontario.
I obtained an Engineer’s Degree (B.Sc.) in Geophysical Exploration at Gornii Mining Institute in St. Petersburg, Russia and at ISPJAE University in La Habana, CUBA in 1993, and obtained a Master’s Degree in Applied Geophysics (M.Sc.) at International Institute for Geo-Information Science and Earth Observation (ITC) in Delft, The Netherlands, in 2000.
I am a registered geoscientist, since 2004, with license to practice in the Province of Ontario, (APGO License # 1058), and registered geoscientist, since 2010, with license to practice in the Province of Saskatchewan, (APEGS License # 20431).
I am a member of the American Geophysical Union (AGU), and a member of Canadian Exploration Geophysicists Society (KEGS).
I have practiced my profession continuously since September 1993 in Canada, The Netherlands, Portugal, Botswana, DRC, Russia, Peru and Cuba.
I am the Professional Geophysicist responsible for this project. I have authored this NDT Assessment Report and executed the Quality Control and Assurance of the acquired data, results and interpretation. I have compiled the final processed data and can attest that the information in this report accurately and faithfully reflect the data acquired on site.
The statements made in this report represent my professional opinion based on the consideration of the information and professional experience available at the time of executing this project.
Toronto, Ontario February 28, 2015
[signature and date]
Evelio Martinez del Pino, M.Sc., P.Geo
multiVIEW Locates Inc.

APPENDICES

Abutment Walls Condition Assessment Country Rd 46 approximately 1.2 km east of CR 47, Havelock, Ontario
Ainley Graham & Associates Limited
CONTRACT REF: 28665
February 28, 2015
Appendix A: Terms and Conditions for Ground Penetrating Radar Survey - 42 -
APPENDIX A: TERMS AND CONDITIONS FOR GROUND PENETRATING RADAR SURVEY
Data Presentation
1. The Ground Penetrating Radar (“GPR”) data were acquired at the station spacing and on the date as defined in the letter report attached to the original copy of this document.
2. If an interpretation is presented on site, paint marks and a sketch will be provided. 3. GPR data is presented in a profile format along a survey line, displayed from left to right. The
GPR data is a representative image of the GPR signal amplitude and is not an accurate image of the subsurface.
4. GPR data recorded on site is re-examined after the completion of the survey and the interpretation is outlined in the letter report.
Technical Limitations
The interpretation of the geophysical data obtained during this investigation is intended for the guidance of the environmental engineer/excavation contractor only. Should this interpretation of the data be used during any subsequent programs, the user must be aware of the following interpretive restrictions:
1. The Client acknowledges that the laws of fundamental physics apply and do not enable multiVIEW Locates Inc. (multiVIEW) locating equipment to detect all utilities, objects, features and structures or to provide all coordinates of the position thereof. Pipe, cable, conduit, utilities, objects, features or structures which are not detectable (i.e. not “Locatable”) because of the laws of fundamental physics cannot be located by multiVIEW and are not the subject of the provision of the “Service” pursuant to this contract.
2. The “Service” provided to this contract is the location, laterally and longitudinally, of utilities, objects, features or structures and the subsequent marking of the site according to standard subsurface utility locating industry practice. The depth and/or size of pipe, cable, conduits, utilities, objects, features and structures is recorded only if the client has requested prior to the start of the survey.
3. A ‘detectable feature’ defined by this investigation may consist of a cable, wire, pipe, conduit, structure or other object contained within the subsurface. Differentiation between these types of features is not promised nor guaranteed. A feature is only detectable if the subsurface allows the GPR signal to propagate deep enough to define the feature. GPR penetration into the subsurface varies depending upon the subsurface conditions and is not controlled by the radar equipment or the technician’s ability. Limited penetration is caused by snow, dissolved solids, moisture, voids and features having a significant electromagnetic variance.
4. Accuracy of inferred buried detectable features will vary due to subsurface soil conditions and surface conditions (i.e. loose dirt, ice, snow, tall grass and water.)
5. multiVIEW Locates Inc. is not liable for damages, if any, resulting from physical exposure of any ‘detectable feature’ by the Client, or their representatives, or their sub-contractors, or any other person, or corporation, based on the information provided.
6. Areas considered to be inaccessible (an “Inaccessible Area”) for the Service include, but are not limited to, the following: those of physically restricted access; those covered by a structure or

Abutment Walls Condition Assessment Country Rd 46 approximately 1.2 km east of CR 47, Havelock, Ontario
Ainley Graham & Associates Limited
CONTRACT REF: 28665
February 28, 2015
Appendix A: Terms and Conditions for Ground Penetrating Radar Survey - 43 -
object (i.e. building walls, vehicles, equipment, debris, stockpiles of material or snow, etc.); those covered by open water; those covered by woods or vegetation too thick to permit easy walking; those with surface terrain slopes steeper than 1:3; and, those where the safety of the operator is jeopardized (i.e. unstable footing, environmental hazards, uncontrolled roads, etc.). The judgment of the multiVIEW operator will prevail on accessibility decisions.
7. It is the responsibility of the Client to provide direct and simple access free from surface objects to any and all survey areas. multiVIEW accepts no responsibility for surveying in any areas where the client does not provide access and/or appropriate workplace safety measures. Areas considered to be inaccessible for scanning and marking, aside from restricted access, include the following: covered or within 80cm of a structure or object (i.e. walls, vehicles, equipment, debris, stockpiles of material, etc.).
Limits on multiVIEW Liability
1. Any information provided by multiVIEW regarding the location of underground utilities by a GPR survey does not substitute for a full private utility locate performed by multiVIEW Locates Inc. and an authorized location by the owners of the underground facilities. The Service is provided to assist with excavation planning only. The Client is always responsible for obtaining sanctioned locates from the owners of underground plant such as hydroelectric, natural gas, telecommunications, cable TV, fibre-optics, water, sewer, oil, steam, etc. The Client must contact the utility owners directly, or their call-centre, to facilitate these locates.
2. multiVIEW's marking of underground features is only for the convenience of the Client, and this does not relieve the Client, or any other person, or corporation, from liability for damages for personal injury including death, or for property damage or liability caused to or from any underground utility, within the area on the property where the underground utility and/or clearance was marked, or any other property, by reason of the Client, its representatives, or any other person, or corporation having relied upon the surface marking provided by multiVIEW.
3. multiVIEW is not liable for damages resulting from physical exposure of any underground features by the Client, its representatives, their sub-contractors or any other person or corporation.
4. The Service completed by multiVIEW is based on information provided by the Client at or prior to the earlier of the time when the Service is described in this contract or the performance of the Service. The Service provided by multiVIEW regarding the location of any underground utility, object or structure, is on a best effort and best practices basis.
5. A re-mark of surficial markings placed on the site by multiVIEW must be obtained prior to any excavation if: a. markings become unclear, disappear, are disturbed or displaced; b. the sketch and site markings do not coincide; c. the work location has changed; d. if anything occurs which may indicate that a new or better or different locate service is
needed. 6. If the Client excavates outside the limit of the survey area or any of the circumstances identified
in Section B.6, multiVIEW accepts no responsibility. 7. The Client warrants that multiVIEW Locates Inc. is not liable for any claims for damages to any
underground plant where multiVIEW Locates Inc. was not notified of such damage within a
Abutment Walls Condition Assessment Country Rd 46 approximately 1.2 km east of CR 47, Havelock, Ontario
Ainley Graham & Associates Limited
CONTRACT REF: 28665
February 28, 2015
Appendix A: Terms and Conditions for Ground Penetrating Radar Survey - 44 -
reasonable time such that multiVIEW Locates Inc. can complete a damage investigation to physically view any such damaged underground plant whether or not any such damage may be attributed to errors or omissions committed by multiVIEW Locates Inc. in performing this work.
8. multiVIEW shall not be liable for any amount in excess of the fees paid by the Client to multiVIEW for the Service on account of any loss, injury, death or damage whether resulting directly or indirectly to a person or property irrespective of the cause or origin of such loss, injury, death or damage including, without limitation, loss, injury, death or damage attributable to the negligence of multiVIEW, its employees and agents in the performance or non-performance of the Service.

Abutment Walls Condition Assessment Country Rd 46 approximately 1.2 km east of CR 47, Havelock, Ontario
Ainley Graham & Associates Limited
CONTRACT REF: 28665
February 28, 2015
Appendix B: Instrument Specifications- 45 -
APPENDIX B: INSTRUMENT SPECIFICATIONS
GPR Instrumentation
Abutment Walls Condition Assessment Country Rd 46 approximately 1.2 km east of CR 47, Havelock, Ontario
Ainley Graham & Associates Limited
CONTRACT REF: 28665
February 28, 2015
Appendix C: Ground Penetrating Radar Theory and Application - 46 -
APPENDIX C: GROUND PENETRATING RADAR THEORY AND APPLICATION
Ground Penetrating Radar (GPR) is the general term applied to techniques which employ radio waves, typically in the 1 to 1000 MHz frequency range, to map structures and features buried in the ground (or in man-made structures). Historically, GPR was primarily focused on mapping structures in the ground; more recently GPR has been used in non-destructive testing of non-metallic structures.
The concept of applying radio waves to probe the internal structure of the ground is not new. Without doubt the most successful early work in this area was the use of radio echo sounders to map the thickness of ice sheets in the Arctic and Antarctic and sound the thickness of glaciers. Work with GPR in non-ice environments started in the early 1970s. Early work focused on permafrost soil applications. GPR applications are limited only by the imagination and availability of suitable instrumentation. These days, GPR is being used in many different areas including locating buried utilities, mine site evaluation, forensic investigations, archaeological digs, searching for buried landmines and unexploded ordnance, and measuring snow and ice thickness and quality for ski slope management and avalanche prediction, to name a few.
Signal propagation*
The strong relationship between the physical properties of materials (including water) and their electromagnetic properties enables the identification of physical structures in the subsurface using electrical methods (Davis & Annan, 1989; Dallimore & Davis, 1987; Delaney & Arcone, 1982; Scott et al., 1978).
Most geologic materials (in bulk form) are considered as semi-conductors, or dielectrics, thus they can be characterized by three electromagnetic properties: electrical conductivity, electric permittivity, and magnetic permeability. The electrical conductivity of a material is a measure of its ability to transmit a DC current and is inversely proportional to the voltage drop experienced across a given distance for a given DC current.
Magnetic permeability is defined as the ratio of the magnetic flux induction to the magnetizing force. The magnetic susceptibility of a material is a function of the permeability. Electrical permittivity is the ratio of the capacitance of an electrical condenser filled with a dielectric to the capacitance of the same condenser when evacuated. The movement of electromagnetic energy within the subsurface is governed by the propagation constant of the material it travels through.
Signal reflection*
Ground penetrating radar principles are similar to those of reflection seismic, in that a pulse of energy is sent into the subsurface, and a portion of it is reflected back to the surface by interfaces between different materials. In contrast to seismic, GPR energy is electromagnetic, not vibrational, and the interfaces are dielectric, not sonic velocity interfaces. In water, the energy is transmitted with a near radial geometry (Davis & Annan, 1989). These results in several simple ray paths which the energy tends to follow, travelling between the transmitter and the receiver.
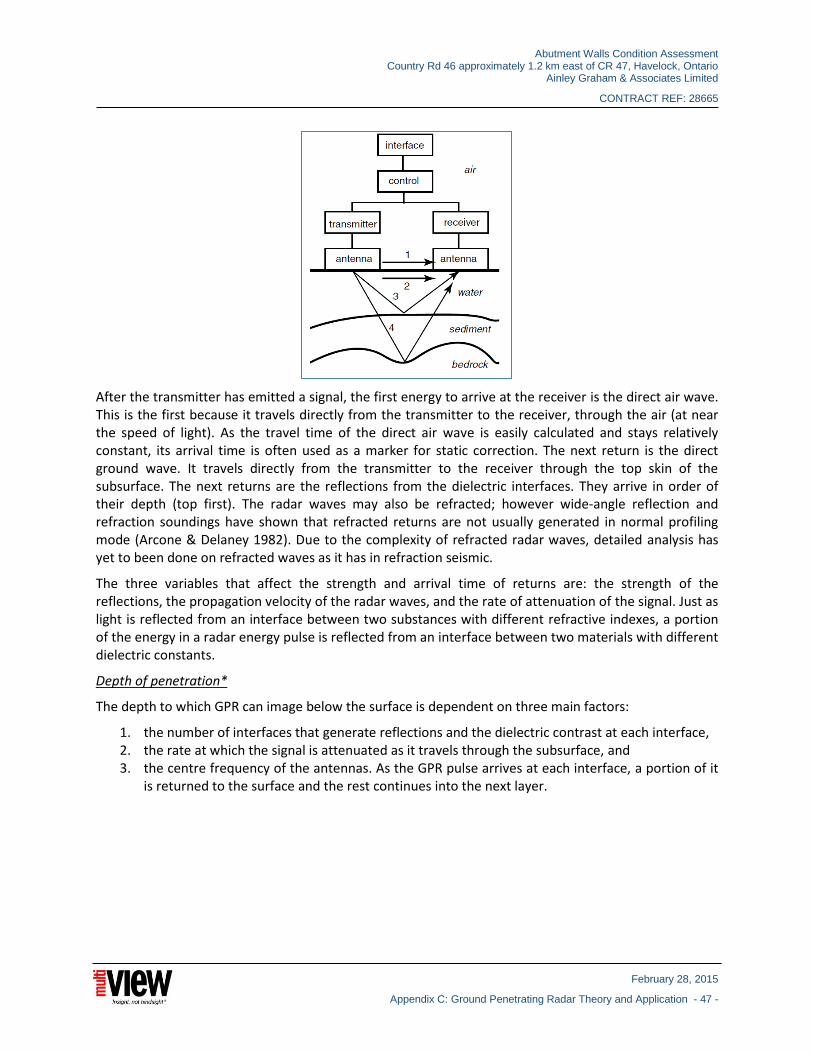
Abutment Walls Condition Assessment Country Rd 46 approximately 1.2 km east of CR 47, Havelock, Ontario
Ainley Graham & Associates Limited
CONTRACT REF: 28665
February 28, 2015
Appendix C: Ground Penetrating Radar Theory and Application - 47 -
After the transmitter has emitted a signal, the first energy to arrive at the receiver is the direct air wave. This is the first because it travels directly from the transmitter to the receiver, through the air (at near the speed of light). As the travel time of the direct air wave is easily calculated and stays relatively constant, its arrival time is often used as a marker for static correction. The next return is the direct ground wave. It travels directly from the transmitter to the receiver through the top skin of the subsurface. The next returns are the reflections from the dielectric interfaces. They arrive in order of their depth (top first). The radar waves may also be refracted; however wide-angle reflection and refraction soundings have shown that refracted returns are not usually generated in normal profiling mode (Arcone & Delaney 1982). Due to the complexity of refracted radar waves, detailed analysis has yet to been done on refracted waves as it has in refraction seismic.
The three variables that affect the strength and arrival time of returns are: the strength of the reflections, the propagation velocity of the radar waves, and the rate of attenuation of the signal. Just as light is reflected from an interface between two substances with different refractive indexes, a portion of the energy in a radar energy pulse is reflected from an interface between two materials with different dielectric constants.
Depth of penetration*
The depth to which GPR can image below the surface is dependent on three main factors:
1. the number of interfaces that generate reflections and the dielectric contrast at each interface, 2. the rate at which the signal is attenuated as it travels through the subsurface, and 3. the centre frequency of the antennas. As the GPR pulse arrives at each interface, a portion of it
is returned to the surface and the rest continues into the next layer.

Abutment Walls Condition Assessment Country Rd 46 approximately 1.2 km east of CR 47, Havelock, Ontario
Ainley Graham & Associates Limited
CONTRACT REF: 28665
February 28, 2015
Appendix C: Ground Penetrating Radar Theory and Application - 48 -
As the number of interfaces increases, the proportion of energy that propagates to depth is reduced. In addition, the greater proportion of energy that is reflected back to the surface at each interface, the less energy that is available to propagate deeper into the ground.
The conductivity of the material that a GPR signal is travelling through has a major influence on the depth to which the signal will penetrate. As the conductivity increases, the material acts more like a conductor than a semi-conductor. The conductive currents in a material are an energy dissipating mechanism for an EM field. In this case, energy is irreversibly extracted from the EM field and transferred to the medium it is in.
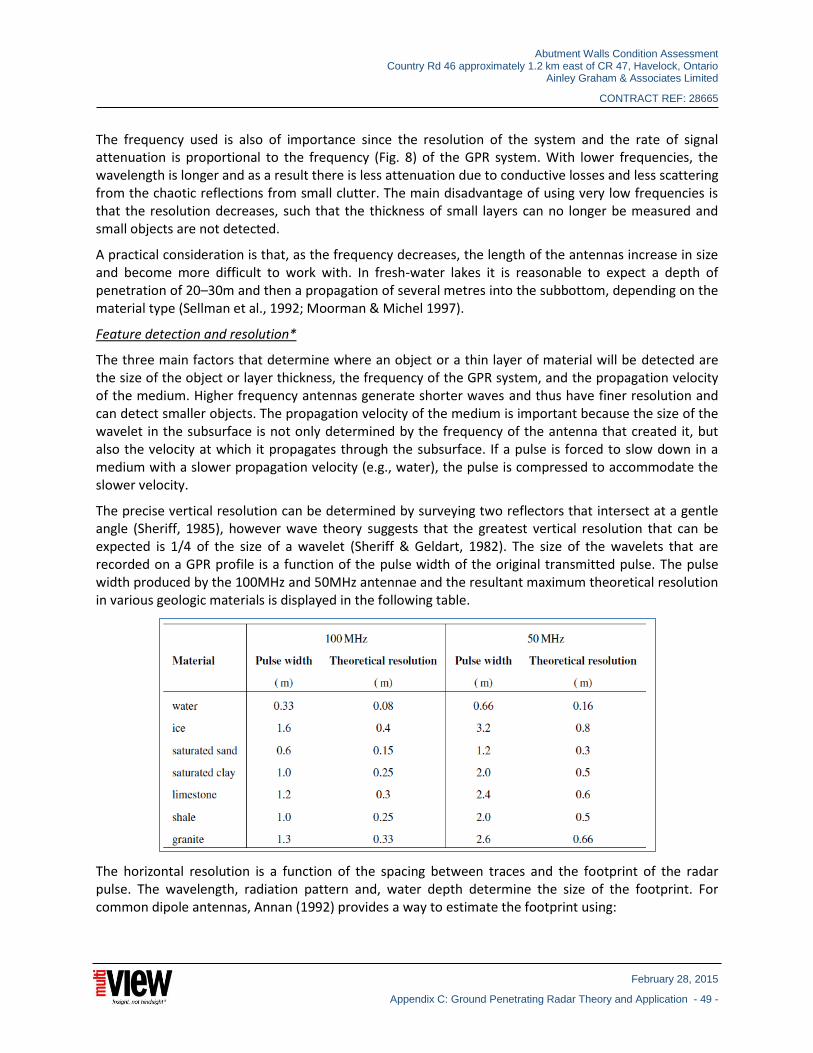
Abutment Walls Condition Assessment Country Rd 46 approximately 1.2 km east of CR 47, Havelock, Ontario
Ainley Graham & Associates Limited
CONTRACT REF: 28665
February 28, 2015
Appendix C: Ground Penetrating Radar Theory and Application - 49 -
The frequency used is also of importance since the resolution of the system and the rate of signal attenuation is proportional to the frequency (Fig. 8) of the GPR system. With lower frequencies, the wavelength is longer and as a result there is less attenuation due to conductive losses and less scattering from the chaotic reflections from small clutter. The main disadvantage of using very low frequencies is that the resolution decreases, such that the thickness of small layers can no longer be measured and small objects are not detected.
A practical consideration is that, as the frequency decreases, the length of the antennas increase in size and become more difficult to work with. In fresh-water lakes it is reasonable to expect a depth of penetration of 20–30m and then a propagation of several metres into the subbottom, depending on the material type (Sellman et al., 1992; Moorman & Michel 1997).
Feature detection and resolution*
The three main factors that determine where an object or a thin layer of material will be detected are the size of the object or layer thickness, the frequency of the GPR system, and the propagation velocity of the medium. Higher frequency antennas generate shorter waves and thus have finer resolution and can detect smaller objects. The propagation velocity of the medium is important because the size of the wavelet in the subsurface is not only determined by the frequency of the antenna that created it, but also the velocity at which it propagates through the subsurface. If a pulse is forced to slow down in a medium with a slower propagation velocity (e.g., water), the pulse is compressed to accommodate the slower velocity.
The precise vertical resolution can be determined by surveying two reflectors that intersect at a gentle angle (Sheriff, 1985), however wave theory suggests that the greatest vertical resolution that can be expected is 1/4 of the size of a wavelet (Sheriff & Geldart, 1982). The size of the wavelets that are recorded on a GPR profile is a function of the pulse width of the original transmitted pulse. The pulse width produced by the 100MHz and 50MHz antennae and the resultant maximum theoretical resolution in various geologic materials is displayed in the following table.
The horizontal resolution is a function of the spacing between traces and the footprint of the radar pulse. The wavelength, radiation pattern and, water depth determine the size of the footprint. For common dipole antennas, Annan (1992) provides a way to estimate the footprint using:

Abutment Walls Condition Assessment Country Rd 46 approximately 1.2 km east of CR 47, Havelock, Ontario
Ainley Graham & Associates Limited
CONTRACT REF: 28665
February 28, 2015
Appendix C: Ground Penetrating Radar Theory and Application - 50 -
Where A is the long axis diameter of the oval footprint, d is the distance (or depth), and κ is the dielectric constant of the medium (80 for water). The short axis of the oval footprint is roughly half the length of the long axis. For example, at a depth of 20 m, in water, the effective footprint of a 50MHz pulse has a mean diameter of approximately 10 m. This is a little smaller than the footprint of an acoustic subbottom profiler (Sellmann et al., 1992).
Survey design-system parameters*
Most of the GPR systems currently on the market allow for the adjustment of many of the system parameters enabling the optimization of the system for the specific survey environment.
The main system parameters that can be adjusted include: operating frequency, time window, sampling interval, stacking, antenna spacing, antenna orientation. The frequency of antennas chosen influence the exploration depth that is possible, the resolution of the data, and the amount of clutter that is present on the profiles. As the frequency is lowered, the depth of penetration is increased and the amount of clutter present of the profiles decreases; however, the ability to detect and resolve smaller objects decreases.
Survey design-profile parameters*
The profile parameters that need to be taken into consideration when designing a GPR survey include station spacing along the survey profile, spacing between profiles, and the type of survey grid desired. Ensuring that the station spacing is close to enable interpretation of the profile is very important when designing a survey. Station spacing is a function of the frequency used, the dielectric constant of the material, and the complexity of the subsurface. The profiles should be close enough that the footprint of the GPR overlaps from one profile to the next.
Data processing and interpretation*
Compared to seismic data, relatively little processing is generally done to GPR data. A gain function is usually applied to the data to emphasize the weaker returns. There are a number of gain functions that can be applied depending of the data quality and the profile elements that you want to emphasize (e.g., automatic gain control (AGC), spherical and exponentially compensation (SEC) gain, user defined gain function). An example of the effects of different gain functions are displayed in Moorman & Michel (1997).
Temporal filtering involves filtering along the time axis of each trace. This can involve high-pass, low-pass filters or frequency filters such as Fourier analysis. These filters involve reduction or elimination of certain unwanted returns along each trace. For example by running mean along each trace, high frequency noise can be reduced (see Moorman & Michel, 1997).
As with temporal filtering, spatial filtering is employed to remove unwanted spatial variations. One technique is to perform a running mean of data points at the same time across traces. This type of trace to trace running mean is used to emphasize horizontal reflections while de-emphasizing sloping returns. Other types of spatial filters can be applied to emphasize sloping reflections such as trace-to-trace differential filters.

Abutment Walls Condition Assessment Country Rd 46 approximately 1.2 km east of CR 47, Havelock, Ontario
Ainley Graham & Associates Limited
CONTRACT REF: 28665
February 28, 2015
Appendix C: Ground Penetrating Radar Theory and Application - 51 -
There are also a number of more advanced filtering techniques such as migration that are occasionally employed to solve a specific problem with the data set. However, these more complicated filtering techniques are generally too time consuming to be regularly applied to all data sets.
Feature identification*
Feature identification is primarily accomplished by examining the reflection characteristics (e.g., continuous line, hyperbola, or multiple discontinuous chaotic reflections). By comparing the reflection character to known examples, one can construct a radar stratigraphic facies interpretation of the data. Radar stratigraphic examples have been published from a few environments to date (e.g., Beres&Haeni, 1991; van Heteren et al., 1994; Smith & Jol, 1997).
In some applications by studying the pulse polarity you can determine relative magnitude of the dielectric constant on either side of an interface (Arcone et al., 1995; Moorman & Michel, in press). However, this probably has limited use in studying lake basin sediments.
Along with identifying features of interest, the interpreter must be alert to the potential for the incorporation of unwanted returns into the GPR profile. Because the energy is being radially emitted from the antenna, in areas of very uneven topography there is the potential to recording a reflection from a feature that is not beneath the antennas, but off to the side or even nearby on the surface. These are called offline reflections. This is most evident when the profile is parallel to a very steep lake bottom
slope (i.e., greater than 45◦). When the slope is greater than 45◦, reflections will not be directed back to the receiver, but off to the side. Similarly, if the profile runs near to a steep slope, unwanted offline reflections may be recorded from the slope off to the side.
Applications*
Since the early work of Annan & Davis (1977) and Kovacs (1978), it has been apparent that GPR is an effective tool for mapping the depth of fresh water lakes. Using a 120MHz system, Trumen et al. (1991) found that water depth in a reservoir could be mapped with confidence. When the GPR profiles were correlated to measured depths, an R2 value was calculated to be 0.989. Kovacs (1991) showed that GPR was more effective at mapping bathymetry than sonar when the water depth was shallow and when the weed concentration is high. Sellman et al. (1992) & Delaney et al. (1992) demonstrated that 100MHz GPR has a resolution similar to a 7 kHz acoustic survey for measuring water depth, and that the GPR was far superior for imaging the bedding structure. Using 50MHz antennas, up to 30m of water can be mapped, with up to 7m of penetration into the bed (Sellman et al., 1992).
A number of authors have reported mapping the distribution and thickness of lacustrine sediments (Delaney et al. 1992; Moorman & Michel, 1997). Smith & Jol have under taken extensive work on mapping the structure of modern and ancient deltaic deposits (e.g., Jol & Smith, 1991, 1992; Smith & Jol, 1997). Lowe (1985) reported being able to discern multiple layers of lacustrine sediments and tephra up to 10m depth.
Various trials have been undertaken showing the capabilities of GPR for mapping the thickness and stratigraphy of organic deposits in ponds and bogs (Worsfold et al., 1986; Warner et al., 1990; Hanninen, 1992; Doolittle et al., 1992; Mellett, 1995).
Depending on how many the physical properties vary with depth, GPR results varied from just detecting the bottom of the peat to differentiating the actual peat stratigraphy. As ice enables radar pulses to propagate with little attenuation, GPR has been shown effective for imaging the thickness of lake, sea and river ice (Arcone et al., 1997; Kovacs, 1978; Kovacs & Morey, 1979, 1985, 1992). As the dielectric
Abutment Walls Condition Assessment Country Rd 46 approximately 1.2 km east of CR 47, Havelock, Ontario
Ainley Graham & Associates Limited
CONTRACT REF: 28665
February 28, 2015
Appendix C: Ground Penetrating Radar Theory and Application - 52 -
contrast between ice and water is much greater than that of ice and air, O’Niell &Arcone (1991) found that lake ice thickness could be detected from a helicopter.A number of technical issues complicate the collection of good quality data, however, in some situations, it is feasible.
(*information captured from Brian J. Moorman, Ground-Penetrating Radar Applications, In Paleolimnology, 2001)
North River Bridge Final Preliminary Design Report and MCEA
County Rd. 46, Havelock, Ontario
Agreement No. P-10-2014
AG File No. 14562-1
APPENDIX D: GENERAL ARRANGEMENT OF PREFERRED REHABILITATION/REPLACEMENT
ALTERNATIVE