Embed Size (px)
Citation preview

IR·91·02
PRELIMINARY ESTIMATING MODELS FOR BRIDGE REPAIR PROJECTS
Prepared by
Steve R. Sanders Department of Civil Engineering
Auburn University
August 1991

Preliminary Estimating Models
for Bridge Repair Projects
steve R. Sanders
A Report to the
Highway Research center
Auburn University
Auburn, AL
August 1991
IR-91-02


--- -------------
TABLE OF CONTENTS
LIST OF TABLES
I.
II.
III.
IV.
V.
VI.
VII.
VIII.
INTRODUCTION Needs Objectives Definitions Accuracy Principles
PROPOSED MODEL
LITERATURE REVIEW ...........•......•......•... Bridge Management Systems Federal Highway Administration Publications Highway Construction Estimating Model Other Publications Lessons Learned
DATA COLLECTION •.......•..•......•.•.......... Alabama Highway Department Data Information From Other States
SELECTION OF MODEL VARIABLES Data Analysis Selection of Work Items
CREATING THE MODEL ....•......•.•...•••.•...••. Model Form Removal of Old Bridge Steel Reinforcement Steel Piling structural Steel Superstructure Plant Mix Bituminous Base Reinforced Cement Concrete Pavement Reinforced Cement Concrete Bridge End Slab Safety/Traffic Control Reinforced Bridge Concrete Superstructure
TESTING AND USE OF THE MODEL
Model Testing Use of the Model
CONCLUSION AND RECOMMENDATIONS Conclusion Recommendations
I
III
1
10
13
20
23
30
43
49


............................................. BIBLIOGRAPHY
APPENDIX A ................................................
II
54
56


LIST OF TABLES
1. Example of a Alabama Highway Department Summary of Bids .................. 0 • • • • • • • • • • • • • • • • • • • • 5
2. Example of Database Structure and Records Using dBase III Plus ..•..........••.•....•.•.. 21
3. preliminary List of Work Items Considered for the Model, Expressed as a Percentage of Total Bid Price ................................... 26
4. Final List of Work Items Included in the Model with their Corresponding AHD Code Number •••.....•••....••.....••..•••••••..... 29
5. Model Equation Summary 33
6. Factor to Account for Items Not in the Model and the Corresponding Test Error .••.. .......•.... 46
7. Estimated Bids Compared to Actual Low Bids Received ..... 0 • • • • • • • • • • • • • • • • • • • • • • • • • • • • • • • • •• 46
\
III

I

I. INTRODUCTION
The condition of concrete bridges in the state of Alabama
today is a cause of great concern for public officials. In
these days of limited funding and increasing maintenance and
construction costs, it is critical to maximize the use of
available funds. In 1987 and 1988 the Alabama Highway
Department (AHD) spent a total of over $75 million on urban
highway bridge widening projects.
NEEDS
Each year senior AHD officials (Chief Engineer, Bureau
Chiefs, and Division Engineers) meet to examine potential
proj ects that are in various stages of development. These
projects are reviewed with regard to actual needs, available
funding, long range plans, and compliance with federal funding
programs. From this assessment, the officials decide which
proj ects to develop, delay, or continue. This procedure is very
complex and critical to ensure the best use of available funds.
Throughout the decision making process, it is imperative
that officials have accurate estimates of a proposed project's
cost. A decision based on an estimate which is too high would
prohibit the maximum number of projects from being started, and
therefore increase the backlog of projects.
1
----------- ----------------- ----
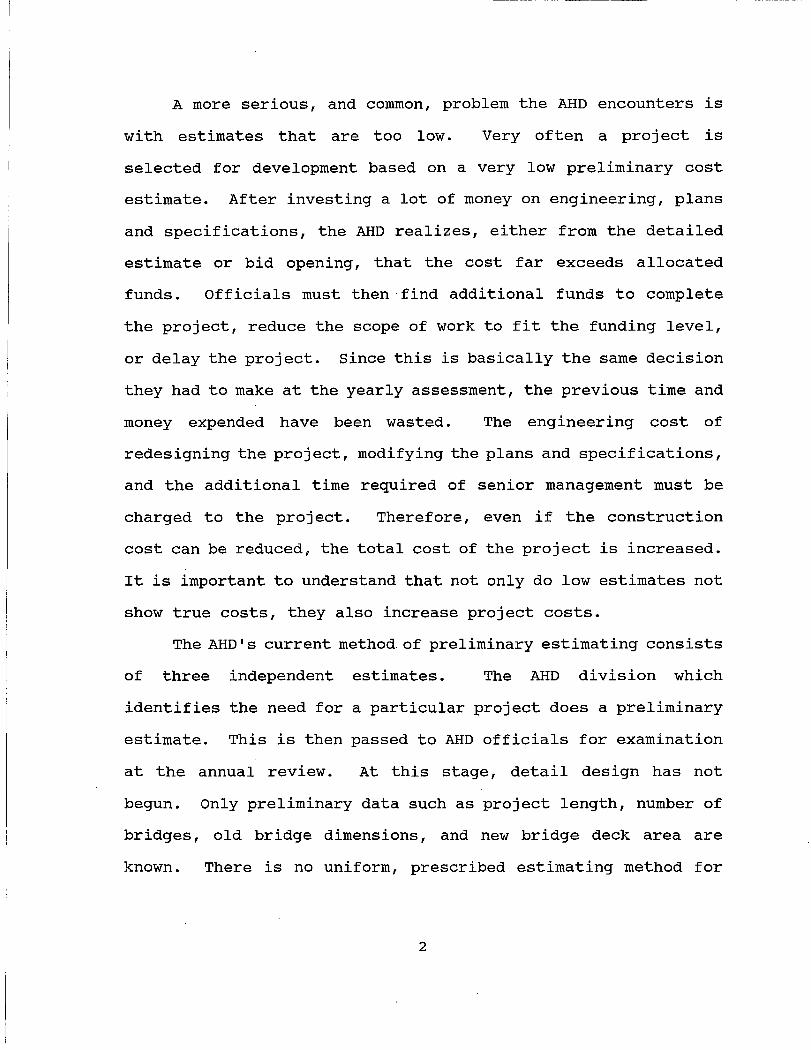
A more serious, and common, problem the AHD encounters is
wi th estimates that are too low. Very often a proj ect is
selected for development based on a very low preliminary cost
estimate. After investing a lot of money on engineering, plans
and specifications, the AHD realizes, either from the detailed
estimate or bid opening, that the cost far exceeds allocated
funds. Officials must then-find additional funds to complete
the project, reduce the scope of work to fit the funding level,
or delay the project. Since this is basically the same decision
they had to make at the yearly assessment, the previous time and
money expended have been wasted. The engineering cost of
redesigning the project, modifying the plans and specifications,
and the additional time required of senior management must be
charged to the project. Therefore, even if the construction
cost can be reduced, the total cost of the project is increased.
It is important to understand that not only do low estimates not
show true costs, they also increase project costs.
The AHDls current method_of preliminary estimating consists
of three independent estimates. The AHD division which
identifies the need for a particular project does a preliminary
estimate. This is then passed to AHD officials for examination
at the annual review. At this stage, detail design has not
begun. Only preliminary data such as project length, number of
bridges, old bridge dimensions, and new bridge deck area are
known. There is no uniform, prescribed estimating method for
2

divisions. Each has its own technique for developing
preliminary estimates.
If, at the yearly review, the project is forwarded for
development, the location section at AHD headquarters does an
independent estimate. The location section uses an estimating
system which includes unit prices for various project types. To
estimate a bridge widening project, a factor of $75 per square
foot of widened deck area is used. This is added to the cost of
other parts of the project such as base and pavement to get the
total estimated price. This technique has only recently been
employed by the location section and its accuracy has not been
tested.
The location section forwards the project to the office
engineer for the third independent estimate. The estimating
method used by this section is based on historical data. Bids
previously received for a project of similar scope are examined.
The proposed project is then compared to those let earlier. The
estimate is a modification of the previous bid with the
modifications being based on the knowledge and experience of the
estimator instead of statistical data. The accuracy of this
method depends on the ability of the estimator, and past results
have varied greatly.
To increase the accuracy, detailed estimates could be used.
Detailed estimates, however, are expensive to produce in terms
of time and manpower, and require a complete set of plans and
specifications. The average bid documents for a urban highway
3

bridge widening project contain approximately 140 to 180 line
items, each with a unit price. This unit price is multiplied by
the quantity to get the total, or extended price of that work
item (see Table 1). The extended price of all work items are
added together to form the total bid price. The cost of doing
a detailed estimate for every project being considered would be
far greater than the savings. produced. Therefore, this is not
a feasible solution.
OBJECTIVES
The primary objective of this report is to provide the AHD
with a statistical model, based on AHD historical data of actual
projects, for creating preliminary cost estimates of urban
highway bridge widening projects. This model will allow the
estimator to apply easily determined project information and
produce a viable estimate before the plans and specifications
are started. This will complement the procedures now used and
improve the effectiveness of the system.
The secondary objective is to develop a methodology for
creating preliminary estimating models for bridge and other
heavy construction proj ects. The same steps used to develop the
model presented here could be used for other similar projects.
4

SUMMARY OF BIDS
PROJECT NUMBER DESCRIPTION LOCATION
ITEM NO
206AOOO 206AOOl 206A002 206C003 206D001 206EOOO 210DOOl 215AOOO 224AOOO 224DOOO 327AOOO 401AOOO 416BOOO 450AOOO 450BOOO 455AOOO 502AOOO 505COOO 508AOOO
QUANTITY
1 1 1
1034 767
18 10150
684 200 100
11634 54461
600 31820
5272 2000
210718 2760 2890
Table 1
Example of an Alabama Highway Department Summary of Bids
ALABAMA HIGHWAY DEPARTMENT
ITEM
LUMP SUM REMOVAL OF OLD BRIDGE LUMP SUM REMOVAL OF OLD BRIDGE LUMP SUM REMOVAL OF OLD BRIDGE SQ YD REMOVING CONCRETE FLUMES
LIN FT REMOVING CURB EACH REMOVING HEADWALLS
CYIP BORROW EXCAVATION CU YD UNCLASSIFIED BRIDGE EXCAVA
CU YD LIME SINK EXCAVATION CU YD CONCRETE SEAL FOR LIME SINK
TONS PLANT MIX BITUMINOUS BASE SYCIP BITUMINOUS TREATMENT A
TONS BITUMINOUS CONCRETE PLANT MIX SQ YD REINFORCED CEMENT CONC PAVE
SQ YD REINFORCED CEMENT CONC END S SQ YD GRINDING CONCRETE PAVEMENT
POUNDS STEEL REINFORCEMENT LIN FT STEEL PILING (HP 10X42)
POUNDS STRUCTURAL STEEL
5
BIDDER 1
UNIT PRICE
LUMP LUMP LUMP
2.00 3.00
350.00 6.00
15.00 9.00
110.00 22.30
0.33 43.20 29.05 68.40 10.55
0.25 29.50
2.10
EXT PRICE
65000.00 74000.00 141000.00 2068.00 2301.00 6300.00 60900.00 10260.00 1800.00 11000.00 259438.20 17972.13 25920.00 924371.00 360604.80 21100.00 52679.50 81420.00 6069.00
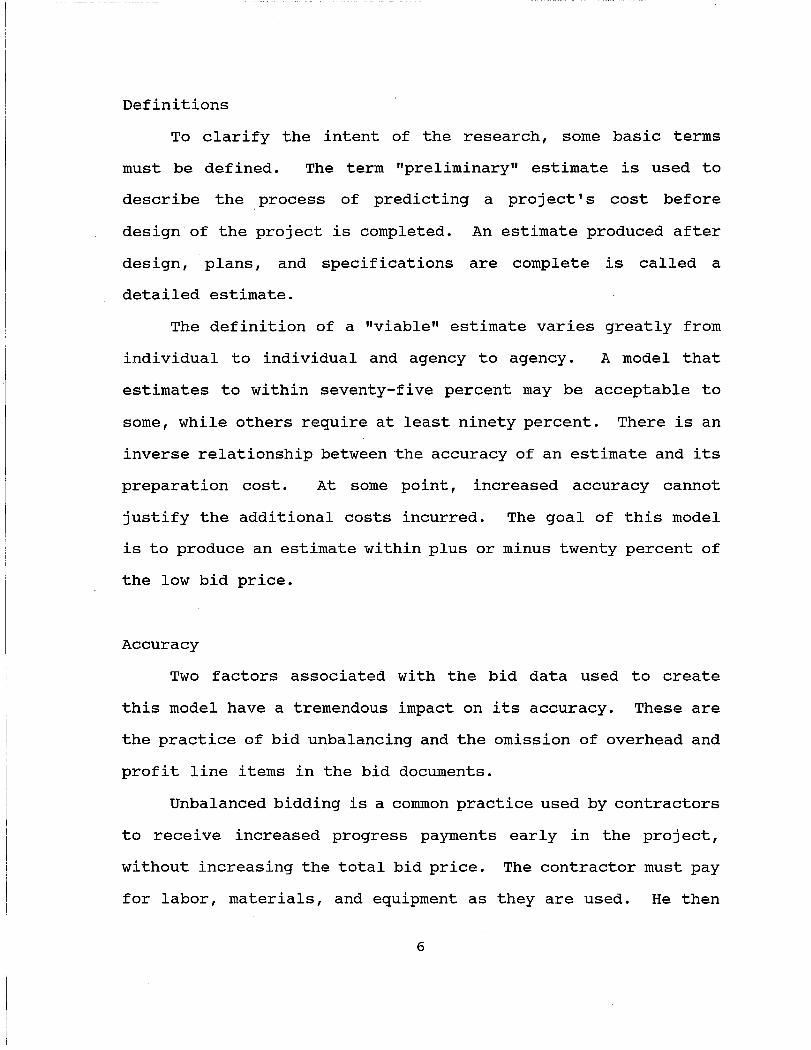
Definitions
To clarify the intent of the research, some basic terms
must be defined. The term "preliminary" estimate is used to
describe the process of predicting a project's cost before
design of the project is completed. An estimate produced after
design, plans, and specifications are complete is called a
detailed estimate.
The definition of a "viable" estimate varies greatly from
individual to individual and agency to agency. A model that
estimates to within seventy-five percent may be acceptable to
some, while others require at least ninety percent. There is an
inverse relationship between the accuracy of an estimate and its
preparation cost. At some point, increased accuracy cannot
justify the additional costs incurred. The goal of this model
is to produce an estimate within plus or minus twenty percent of
the low bid price.
Accuracy
Two factors associated with the bid data used to create
this model have a tremendous impact on its accuracy. These are
the practice of bid unbalancing and the omission of overhead and
profit line items in the bid documents.
Unbalanced bidding is a common practice used by contractors
to receive increased progress payments early in the project,
without increasing the total bid price. The contractor must pay
for labor, materials, and equipment as they are used. He then
6

bills the owner, and is reimbursed approximately thirty to sixty
days after paying for the work. Since most contractors must
borrow money during this lag period, the total bid price
includes money for the interest costs. To be more competitive,
and to keep the total cost low, some contractors increase the
unit price of work items that will be performed and paid for
early in the project, and decrease the price of work to be done
at the end of the job. This allows the contractor to receive
money early to cover the overdraft time between billing and
payment, eliminating the cost of borrowing money. While this
practice keeps the total cost of the project down, it hides from
the owner the true cost of a work item. Since this research is
based on individual line item bid data, instead of total cost,
bid unbalancing affects the accuracy of the model. Efforts to
compensate for bid unbalancing will be discussed in detail
later.
Bid documents do not include line items for every cost
incurred by the contractor. Money for overhead and profit must
be included somewhere since there is no line item for them.
Some contractors distribute this money over all work items, and
others put the money in only a few. This is another example of
how work item costs are hidden and can vary tremendously between
contractors and between projects.
7

Principles
This research was guided by two principles to meet the
stated objectives: to keep the model as simple as possible and
to require only information that is known or can be estimated
before design is complete. These principles determine the model
form and content.
The estimators who use this model should be experienced and
knowledgeable in bridge construction and repair, but need not
have any experience with statistical models. A straightforward,
easy-to-use model would meet the needs of estimators and improve
their performance. If complex mathematical operations or new
computer systems were required, the model would require
extensive and costly training or quickly be rejected and prove
to be a waste of time and money. Also, the model needs to be
relatively simple to use, so the estimators will update the
estimate as the scope of the. project changes. A model that is
difficult to use might be utilized to create an initial
estimate, but not to continually update as needed.
Since the estimate is produced before design is complete,
it is imperative that the quantities be measured in a unit that
is known or can be obtained without complete plans and
specifications. The quantities used to develop the model come
from actual bid quanti ties, but these quanti ties could be
estimated prior to the final design by an experienced estimator.
Most of the quantities are a function of the length and width of
8

the existing bridge(s) to be repaired, so the dimensions are
relatively easy to determine.
9

II. PROPOSED MODEL
INTRODUCTION
This report describes a method for estimating the total bid
price of urban highway bridge widening projects, based on the
quantities of nine work items. The proposed model is the result
of a statistical analysis of past bids received by the AHD for
similar projects. It consists of nine separate simple
regression models, each of which predicts the cost of one of the
work items. The simplicity of this model allows it to be
executed on a calculator, or by writing a simple computer
program. This method will be discussed in greater detail in
subsequent chapters.
This model was designed to be used by the AHD to create
preliminary cost estimates for urban highway bridge widening
projects. It is applicable to projects which also include
additional lanes, concrete pavement rehabilitation, and signing.
It is not intended for use on projects in which another type
work is more prominent than widening. A viable preliminary
estimate can be produced with the assistance of this model.
However, the limi tat ions of the model must be understood to
prevent it from being used in a manner leading to reduced
accuracy.
This model cannot provide a viable preliminary estimate if
the scope of the work changes after the estimate is made.
10

Preliminary estimates are made while the project is still in the
conceptual planning stage. Too often, as the project develops,
the scope changes, but the estimate does not. No model can read
the mind of the designer and adjust its price to his design
changes. However, the makeup of this model as nine separate
sub-models allows the estimate to be easily changed. For
example, if during development it became necessary to double the
amount of steel reinforcement, the estimate can be changed with
a single keyboard entry.
Each of the nine sub-models are computed independently of
the others before being summed. However, none of these are
designed to be used as stand alone models of that particular
work item cost, and should not be used in conjunction with other
models.
DEVELOPMENT METHODOLOGY
The following list summarizes the steps used to develop the
estimating model. Each of these is discussed in detail in the
following sections.
1. Collect and record data from previous projects.
2. Identify line items that constitute more than 1% of
the total bid.
3. Develop a regression equation for each of the selected
line items.
11

4. Total the estimated cost modeled by the regression
equations.
5. Determine the cost not modeled by the regression
equations.
6. Develop a procedure to model the cost not included in
the regression equations.
APPLICABILITY TO OTHER TYPES OF PROJECTS
The model presented in this report applies strictly to
urban highway bridge widening proj ects . However, the same
development methodology used for this model could be used for
creating other preliminary· estimating models for heavy and
highway work. All of these types of work use unit price
contracts with 100+ line items, just as were used for the
projects included in this study.
12

III. LITERATURE REVIEW
A literature review was conducted in an effort to
incorporate findings of research done by others into the
construction of this model. This review included a search of
the Ralph B. Draughon Library at Auburn Uni versi ty , other
uni versi ties, and state and federal agencies. The conclusion of
this search was that practically no published research has been
done on the topic of predicting the cost of urban highway bridge
widening projects.
BRIDGE MANAGEMENT SYSTEMS
The only related subject found was predicting the life
cycle cost of bridges using Bridge Management Systems (BMS).
Numerous studies have been conducted on this topic. The center
for Transportation Engineering Studies at North Carolina state
University and the North Carolina Department of Transportation
have done much research in this area. The BMS is a
comprehensive, long-term management tool used to control bridge
rehabilitation, repair, and replacement at an optimum
cost/benefit ratio. Highway department officials record all
costs associated with a bridge throughout the bridge's life span
into a database. This information is then analyzed to compare
bridge strategies and determine the most efficient program of
bridge repair, rehabilitation, and replacement.
13

Most states that use BMS employ a "condition rating" or an
"urgency of need" designator system to describe the physical
condition of the bridge. 1 The condition rating is depicted by
a number, which represents a level of maintenance. Every dollar
that is spent on a particular bridge is recorded in a database
which includes the condition rating of the bridge when the
project began, and the condition rating when work was completed.
Cost estimates are then developed by adding the total cost of
all projects of a particular type, i. e., deck repair, and
dividing by the unit of measure of that type (for deck repair
the unit of measure would be square feet of deck area). The
resulting model shows the cost of improving a bridge from one
condition rating to another. Highway department officials can
then consider these costs to develop the optimal bridge
maintenance strategy.
A common example of where a BMS would be used is in
determining when to replace a bridge deck. Is it better to
repair the deck now and replace it in 25 years? Would it cost
less in the long term to replace the bridge now and do deck
repairs later? A tremendous amount of money rests on this
decision, and the purpose of BMS is to ensure the most
economical use of these dollars.
1Farid, et. ale "Feasibility of Incremental Benefit-Cost Analysis for Optimal Allocation of Limited Budgets to Maintenance, Rehabilitation, and
·Replacement of Bridges"
14

Bridge Management Systems are very complex and address many
issues affecting bridge costs. While systems vary from state to
state, common features incorporated into the model include user
costs and benefits; a method of treating all costs in constant
dollars; and repair, rehabilitation, and replacement cost
categories. A BMS is used to assist in making state-wide
policies, not produce a specific estimate. ~herefore, it is
designed to systematically model the data, and ignores cost
factors that affect individual projects.
While this approach works very well in a BMS, it is not
sufficient for this research. The object of this work is to
develop a model which will predict the cost of an individual
bridge widening project within 20 percent. This is not what a
BMS is designed or expected to do. Only by applying the BMS
model to numerous projects· would an accurate estimate be
reached, and this would still not meet the purpose of the model.
FEDERAL HIGHWAY ADMINISTRATION PUBLICATIONS
The Federal Highway Administration annually publishes a
document, "unit Costs and Productivity Standards", listing unit
prices for various types of highway maintenance projects. This
is a compilation of data submitted by state departments of
transportation. The state departments develop a unit price in
their state by adding the total amount spent on all projects of
a particular type, and dividing that sum by the total affected
15

amount of that unit of measure. The only apparent use of these
data is by FHWA officials comparing costs between states.
Little value is placed on this document because too many factors
are not addressed, and the data are not validated.
Cost for each repair activity is broken into the categories
of labor, material, and equipment. This standard cost is listed
by state, but is still just the average cost of projects, broken
down by type, done in that state for that year. The only bridge
related categories are bridge deck repair and bridge railing
repair. The wide variance of costs between states demonstrates
the effect of just one factor (location) being considered in
estimating the cost of a future project. Simply averaging the
cost of all work done is acceptable if applying that factor to
numerous jobs. However, to predict the cost of a single
project, the data must be examined more closely.
The FHWA also publishes a list of "bridge construction unit
costs".2 This includes a section on rehabilitation costs. The
unit price is developed by adding the cost of all rehabilitation
projects and dividing by the total area of all bridges, thus
giving an average rehabilitation cost per square foot of deck
area.
When totaling the proj ects, the FHWA directs that only
bridge related work be included. Work items such as
mobilization, slope paving, clearing and grubbing, and utility
2FHWA Memorandum, (Jan 1990) "Bridge Construction unit Cost"
16

relocation are excluded. Detailed guidelines address methods
for handling phased construction, special condition work and
unusually high or low prices. Again, the general nature of
these data preclude them from being used in this research.
HIGHWAY CONSTRUCTION ESTIMATING MODEL
In his research of "Preliminary Cost Estimating for Highway
Construction Proj ects" , 3 Kaminsky created a microcomputer
database of historical unit-price bid data. He then researched
the factors most directly impacting project cost and what caused
them to vary. His model predicted the quantity of materials
required, and their costs, for different type projects such as
resurfacing or bridge replacement. The results were expressed
in cost per mile.
There are many similarities between Kaminsky's work and the
research presented in this paper. The database Kaminsky used
was developed from Alabama Highway Department bid summary
sheets, and contained the quantity and unit price associated
with each work item of a given project. This format allowed him
the flexibility to efficiently sort records. To incorporate
this efficiency, the data base of this study was structured in
a similar manner. Also incorporated were the basic procedures
3Kaminsky, (1986) "Preliminary Cost Estimating for Highway Construction Projects"
17
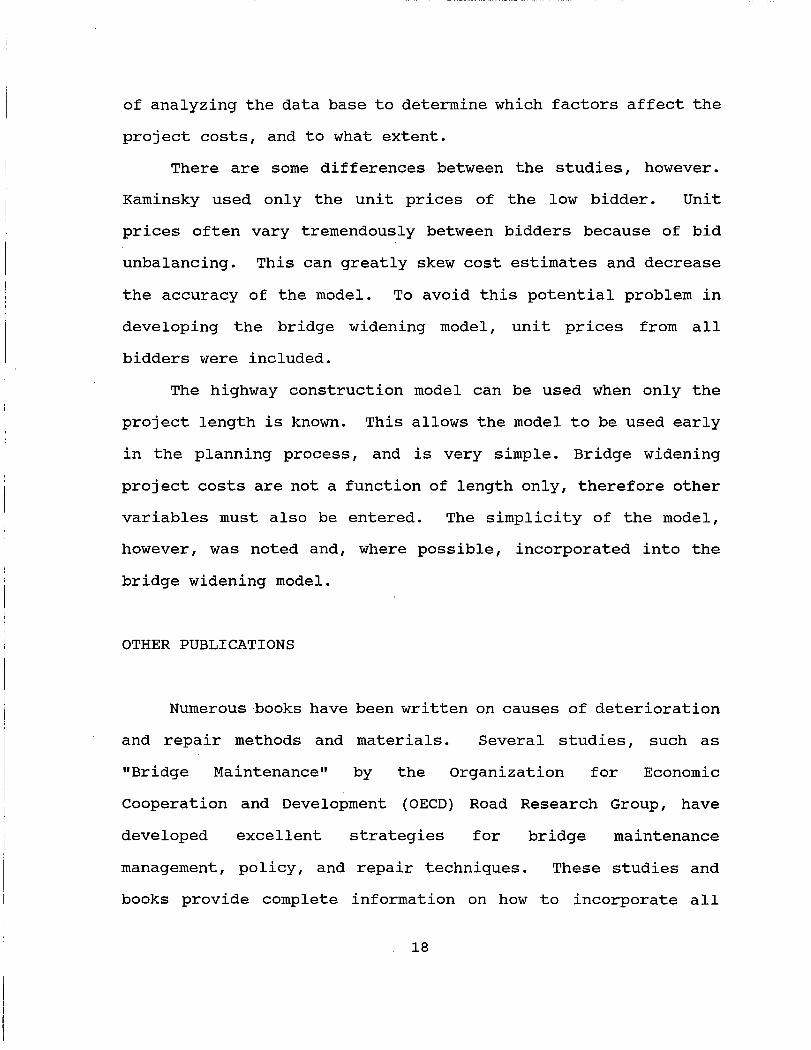
of analyzing the data base to determine which factors affect the
project costs, and to what extent.
There are some differences between the studies, however.
Kaminsky used only the unit prices of the low bidder. unit
prices often vary tremendously between bidders because of bid
unbalancing. This can greatly skew cost estimates and decrease
the accuracy of the model. To avoid this potential problem in
developing the bridge widening model, unit prices from all
bidders were included.
The highway construction model can be used when only the
project length is known. This allows the model to be used early
in the planning process, and is very simple. Bridge widening
project costs are not a function of length only, therefore other
variables must also be entered. The simplicity of the model,
however, was noted and, where possible, incorporated into the
bridge widening model.
OTHER PUBLICATIONS
Numerous books have been written on causes of deterioration
and repair methods and materials. Several studies, such as
"Bridge Maintenance" by the organization for Economic
Cooperation and Development (OECD) Road Research Group, have
developed excellent strategies for bridge maintenance
management, policy, and repair techniques. These studies and
books provide complete information on how to incorporate all
18

costs into determining the life-cycle cost, and the best
techniques to get the lowest life-cycle cost. However, they do
not provide the detailed data necessary to accurately predict
the cost of one bridge rehabilitation project.
LESSONS LEARNED
Some valuable lessons were learned from the Ii terature
review. One of the most important was that statistical models
do work. Computer based models are being used in several states
as part of a BMS to determine the optimum bridge maintenance
strategy. These models meet the need for which they were
designed, and save the taxpayers money. Much of the database
structure and methodology used by Kaminsky was of assistance in
conducting this research.
Although much information was gained from this literature
review, some outstanding issues remained. The selection of work
items which significantly affect the total bid, and determining
what percentage of the bid they represent, were not addressed in
the literature. These questions, and the selection of variables
for the statistical models,' remained to be answered by this
research.
19

IV. DATA COLLECTION
ALABAMA HIGHWAY DEPARTMENT DATA
In 1987 and 1988 the Alabama Highway Department (AHD)
received bids for eleven urban highway bridge widening projects.
The bidding format used was the AHD's standard competitive unit
price bidding system. Bid summary sheets from each project were
created after bids were opened. These contain information on the
project, each bidder's total bid, and the unit price per work
item. This model is based on data from the bid summary sheets
of these eleven projects.
In the initial phase of this research, data from these bid
sheets were entered into a database using the dBase III Plus
computer software package (see Table 2). A preliminary list of
43 work items to be included in the data base was developed in
consultation with the AHD. The list of bridge widening related
work items will be discussed in detail in subsequent chapters of
this paper. Records were entered into the data base for each
work item and bidder on each of the eleven projects.
INFORMATION FROM OTHER STATES
Several surrounding states (Georgia, Mississippi, and
Florida) were contacted for information on bridge widening
20

Table 2 Example of Database structure and Records
Using dBase III Plus
ITEM NO QTY UOM UNIT PRICE EXT PRICE PROJECT NO BIDDER 206AOOO 170.00 FT 526.47 89500.00 I-IR-59-1(144)118 HARDAWAY 206AOOO 170.00 FT 494.12 84000.00 I-IR-59-1(144)118 HARDAWAY 206AOOO 294.67 FT 410.63 121000.00 I-IR-59-1(144)118 HARDAWAY 206AOOO 406.48 FT 453.16 184200.00 I-IR-59-1(144)118 HARDAWAY 206AOOO 170.00 FT 317.65 54000.00 I-IR-59-1(144)118 DEMENT 206AOOO 170.00 FT 364.71 62000.00 I-IR-59-1(144)118 DEMENT 206AOOO 294.67 FT 319.00 94000.00 I-IR-59-1(144)118 DEMENT 206AOOO 406.48 FT 307.52 125000.00 I-IR-59-1(144)118 DEMENT 206AOOO 170.00 FT 475.36 80811.72 I-IR-59-1(144)118 DUNN 206AOOO 170.00 FT 475.36 80811.72 I-IR-59-1(144)118 DUNN 206AOOO 294.67 FT 293.83 86583.98 I-IR-59-1(144)118 DUNN 206AOOO 406.48 FT 340.81 138534.37 I-IR-59-1(144)118 DUNN 206C002 1130 SQYD 1.00 1130.00 I-IR-59-1(144)118 HARDAWAY 206COO2 1130 SQYD 4.00 4520.00 I-IR-59-1(144)118 DEMENT 206C002 1130 SQYD 11.54 13040.20 I-IR-59-1(144)118 DUNN 214AOOO 670 CUYD 7.35 4924.50 I-IR-59-1(144)118 HARDAWAY 214AOOO 670 CUYD 10.00 6700.00 I-IR-59-1(144)118 DEMENT 214AOOO 670 CUYD 8.66 5802.20 I-IR-59-1(144)118 DUNN
21

proj ect costs. The minimal information received from these
states was of little assistance because of differences in the
system each state uses. For example, several work items used by
the AHD are combined to form "a single work item in Mississippi.
The Georgia Department of Transportation uses a single "bridge
rehabilitation" work item. This includes work AHD breaks down
into several work items and is also different from the
Mississippi work item. The differences are significant enough
to prevent direct comparisons. Any attempt to modify these work
items to allow for comparison would necessitate too many
assumptions for the results to be valid. Because of this high
probabili ty of error, data from other states were not used. The
Georgia DOT, however, does use heuristic values to estimate
broad areas of bridge repair. This information was recorded and
used to assist in model validation.
22
V. SELECTION OF MODEL VARIABLES
DATA ANALYSIS
The primary objective of the preliminary data analysis was
to determine which work items have the most impact on project
cost, and what factors cause these work item costs to vary. In
consultation with the Alabama Highway Department (AHD), a list
of work items believed to significantly impact the total project
cost was developed. Bid data concerning these work items were
taken from every bidder on each of the eleven bridge widening
projects used in this research. Data from each item was placed
in a dBase record as previously discussed (Table 2). The
resulting dBase file contained over 1700 records.
A dBase program was-written to put the data in a format
which showed the total work item cost as a percentage of the
total bid amount. For example, consider a project which
includes complete removal of three bridges, where each bridge is
a separate line item. One contractor bids $78,000, $23,000, and
$89,000 for these line items and has a total bid of $10,000,000.
Another contractor, for the same project, bids $87,000,
$40,000, and $100,000 for the bridge removal and has a total bid
of $11,750,000. Summing the three bridge removal line items and
dividing by the total bid for each contractor shows that bridge
removal was 1.9 percent of each contractor's bid. Again, this
was done for every bidder on each of the eleven projects. Bid
23

amounts varied between bidders on individual projects, sometimes
over 40 percent, but using the work item cost as a percentage
allowed the data to be compared directly. These percentages
were used only in the work item selection process, not in model
development.
Other models based on historical bid data have generally
used only the data from the lowest bidder because they wanted to
predict the amount of the lowest bid. Applying this procedure
to this research would allow data from only eleven of the 37
bidders to be included. Increasing the amount of data used to
create the model improves the accuracy. Using data from all
bidders also helps reduce the effect of unbalanced bidding. A
low bidder, for example, bids steel reinforcement at half its
actual cost. This will skew a model with eleven data points
much more than a model with 37 data points.
Data from low and high bidders cannot be used directly to
predict a low bid. The models created from high and low bid
data will obviously be higher than the lowest bid. However, it
is believed that the advantages of including all bidders in the
study outweigh the disadvantages. The method used to adjust to
the lowest bid will be discussed in Chapter VII.
SELECTION OF WORK ITEMS
The ini tial phase of work item selection consisted of
reviewing the list of items believed to significantly impact the
24

total project cost (see Table 3). This list contained 43 work
items. Closer review of this list revealed that only ten work
items individually made up greater than one percent of the total
proj ect cost. For a preliminary estimate, work items which
account for less than one percent cannot be considered to
"significantly" impact the total bid amount. To estimate each
of these 33 work items would increase the complexity and
preparation cost of the model, but not increase the accuracy.
Therefore, they were removed from the list.
Two work items which represent a significant percentage of
the total bid were later deleted from the model. These are
mobilization (ARD Code 600A) and bridge substructure concrete
(ARD Code 510A). Mobilization is traditionally the work item
most affected by bid unbalancing. The mobilization work item is
designed to pay for expenses such as moving equipment to the job
site and establishing field offices. The nature of these
expenses practically prohibit a bid from being declared non
responsive due to mobilization costs. This, coupled with the
fact that it is the first pay item received by the contractor,
makes the mobilization work item amount vary much more than any
other. On one project, mobilization varied over 400 percent
between bidders. This variance, coupled with the lack of a
quantifiable unit of measure, prohibits the modeling of this
work item.
25

AHD CODE
206A 206C012 206C014 206D 207B 207E 215A 327A 450A 450B 490A 490B 502A 502B 505A 505B 505C 508A 508B 508C 508G 508H 510A SlOB 510C 510D SlOE 511A 511B 513A 513B 514A 520A 520B 520C 520D 520E 520F 522A 522B
Table 3
Preliminary List of Work Items Considered for the Model, Expressed as a Percentage of Total Bid Price.
WORK ITEM DESCRIPTION
Removal of Old Bridge (lump sum) Removal of Bridge Deck Removal of Bridge End Slab (sq yd) Removing Loose Bridge Joint Angle Removal of Old Bridge (each) Removal of Bridge End Slab (each) Unclassified Bridge Excavation Plant Mix Bituminous Base Reinforced Cement Conc Pavement Reinforced Cement Conc Bridge E S Blast Cleaning Concrete Overlay, Polymer Concrete Steel Reinforcement Epoxy Coated Steel Reinforcement Steel Test Piles, Concrete Test Pile Loading Tests Steel Piling, Concrete Piling Structural Steel Structural Steel Superstructure Bearing Plates Bronze Elastomeric Bearing Pads Steel Finger Expansion Joints Bridge Substructure Concrete Bridge Concrete, Class D Reinforced Bridge Conc Superstr Bridge Substructure Conc, Class E Grooving Concrete Bridge Decks Elastomeric Bearing Pads (lx12x12) Elastomeric Bearing Pads (1/8x12x15) PT/PS Concrete Griders (each) PT/PS Concrete Girders (l.f.) Bridge Surface Protective Coat Repairs to Existing Bridge Raising Existing Bridge Raising Portion of Existing Bridge Concrete for Slab Repair Sand Blast Slab Epoxy Coat Slab F/I Bridge Inter Joint Seal System F/Partial Inst Bridge End J S Sys
26
AVG % OF TOTAL COST
5.6 0.6 0.6 0.1 N/A N/A 0.6 4.1 14.1 3.3 N/A N/A 1.6 N/A 0.7 0.4 2.1 0.3 13.7 0.2 N/A N/A 4.7 N/A 11.2 N/A N/A N/A N/A N/A N/A 0.1 N/A N/A N/A N/A N/A N/A 0.2 N/A

In an attempt to offset this large variance, mobilization
was combined with bridge removal to form a work item group.
This would allow the large amount of money represented by
mobilization to be included .in the model. Bridge removal was
chosen for the work item group because it too is greatly
affected by unbalanced bidding. This attempt, however, was not
successful. The variance of the two work items did not offset
each other as anticipated, and a viable model could not be
developed. The mobilization work item was therefore deleted
from the model. This cost will be included with the other work
items that are part of the project, but are not modeled.
Bridge substructure
bridge widening project.
concrete is not required for every
only eight of the eleven proj ects
reviewed for this study included this work item. The reason for
the large cost variance of this work item could not be
determined. A scatter diagram indicated no discernible pattern.
Since no viable model could be produced from the data available
from these projects, the work item was deleted from the model.
It will also be included with the work items included in the
project but not modeled.
Further analysis revealed that safety and traffic control
costs were a significant part of the total bid amount. If there
were a safety/traffic control work item it would certainly need
to be included on the list. Instead, this cost is spread over
many different work items. A "work item group" was formed to
allow these costs to be examined in the same manner as the other
27

work items. .See Table 4. This work item group consists of
thirteen separate work items which are related to safety/traffic
control and are included in most bridge widening projects. This
addition brought the number of work items on the final list to
nine.
28

Table 4
Final List of Work Items Included in the Model with their Corresponding AHD Code Number.
WORK ITEM DESCRIPTION
Removal of Old Bridge Plant Mix Bituminous Base Reinforced Cement Concrete Pavement Reinforced Concrete Bridge End Slab Steel Reinforcement Steel Piling Structural Steel Superstructure Reinforced Concrete Superstructure Safety/Traffic Control
Broken Temporary Traffic Stripe Temporary Traffic Control Markings Portable Concrete Safety Barriers Portable Impact Attenuator Truck Mounted Impact Attenuator Unit Construction Signs Special Construction Signs Channelizing Drums Cones Warning Lights Vertical Panel Weight for Cone Sequential Arrow & Chevron Sign Unit
29
AHD CODE
206A 327A 450A 450B 502A 50SC S08B SlOC
701C 703D 726A 726D 728A 740B 740C 740D 740E 740I 740L 740M 741C

VI. CREATING THE MODEL
The creation of the model is obviously the most critical
phase of this research. Therefore, the work in this phase was
guided by the objectives of simplicity and use of easily
determined project information. To ensure ease of use by the
estimator, only simple regression analysis was performed.
Analysis was done on a personal computer, using the computer
software package STATGRAPHICS.
MODEL FORM
To create the model a simple regression analysis was done
for each of the nine work items selected as model variables.
Bid data from all bidders on each of the eleven projects were
used except those that were obviously unbalanced. If the bid
was 100 percent or more off from the other bids, it was deleted.
For example, on one project the bids for reinforced concrete
superstructure (AHD Code 510C) were $49,000, $40,000, $54,000,
and $117,225. The $117,225 bid was deleted. All models use a
95 percent confidence level and are in the slope-intercept
equation form (y = a + bx). Models which had an intercept
significance level of greater than 0.05 where recalculated with
the intercept being zero.
One of the most important aspects of developing a viable
model is the selection of variables. The first iteration of
30

regression analysis was done using the work item's unit price as
the dependent variable. The resulting R-square values and
correlation coefficients were generally low. Another iteration
of regression analysis was done using the extended price of the
work item as the dependent variable. In each model this
increased the R-square value and the correlation coefficient.
It also made the model simpler for the user by eliminating the
need to multiply the value from the model by the quantity. For
these reasonsi each model produces the estimated extended price
of that particular work item.
Ideally the independent variable would be a value that is
known, and would be the same for each model. Unfortunately,
this is not possible. Analysis of each model was done using
proj ect length, then quantity, as the independent var iable.
Project length is known early in the planning process and does
not require extensive estimates. However, it is so general it
does not produce the accuracy required of the model. Work item
costs depend on more factors than just project length. The
width of the project is also a factor, as is whether the work is
done in one specif ic area, or throughout the proj ect area.
Quantity accounts for these factors. Quantity requires more
effort to estimate but it is the only value, for most work
items, that will produce a viable model. Therefore, the
independent variable used in eight of the nine models is the
quantity of the work item. Quantity would not be practical for
the safety/traffic control work item group. It would require
31

the user to estimate another thirteen work item quantities which
would be too expensive and time consuming. Also, the cost of
each safety work item in the group is almost purely a function
of length. Since items such as temporary traffic striping,
cones, and safety barriers are placed linearly, they vary little
wi th proj ect width. The length of the proj ect, however, greatly
affects this cost. Therefore, the safety/traffic control model
uses project length. Each work item is examined in detail in
the following sections. Model equations are summarized in Table
5. Regression plots (scatter diagrams) of each work item model
are included in Appendix A.
REMOVAL OF OLD BRIDGE
Removal of old bridges (AHD Code 206A) is a necessary, and
costly, requirement of bridge widening projects. Sometimes only
one side needs to be removed so that the bridge can be widened
on that side. This is called partial bridge removal.
Approximately 40 percent of the projects, however, require
complete removal. Because of the cost variance between these
two procedures, separate models were developed for each. To
estimate the bridge removal cost the user must first determine
whether the project calls for partial or complete removal and
the length of the bridge. Bridge removal is bid lump sum, but
the cost is a function of the length. Therefore, the model uses
linear feet as the unit of measure. This can be done without
32

ABD CODE
206A(Part)
206A(Comp)
327A
450A
450B
502A
505C
508B
510C
Table 5
Model Equation Summary
DESCRIPTION
Old Bridge Removal
Old Bridge Removal
Plant Mix Bituminous Base
Reinforced Cement Concrete Pavement
Reinforced Cement Concrete Bridge End Slab
Steel Reinforcement
Steel Piling
Structural Steel Superstructure
Reinforced Bridge Concrete superstructure
Safety/Tr Cont
33
INDEP VARIABLE
Qty
Qty
Qty
Qty
Qty
Qty
Qty
Qty
Qty
Project length
DEPEN VARIABLE EQUATION
Ext price 16846.7+(55.1919~y)
Ext price 35904. 7+(235. 386*Qty)
Ext price 24443. 8+(22. 3699*Qty)
Ext price 29.92*Qty
Ext price 58.17*Qty
Ext price 0.41*Qty
Ext price 23. 71*Qty
Ext price -10208+(779.212*Qty)
Ext price 21949. 6+(439. 604*Qty)
Total cost 278380+(171294*Length)

drawings by simply measuring·the length of the existing bridge.
Partial bridge removal cost is estimated by the equation
P = 16846.7 + (55.1919 * Q)
where P = Extended price
Q = Quantity, in linear feet.
This model has an R-square of 43.94 percent,
coefficient of 0.662909, and an F-ratio of
a correlation
61. 93. The
significance level of the intercept and slope are 0.00000 each.
Complete bridge removal cost is estimated by the equation
P = 35904.7 + (235.386 * Q)
where P = Extended price
Q = Quantity, in linear feet.
This model has an R-square of 51.11 percent, a correlation
coefficient of 0.714916, and an F-ratio of 93.04. This model
also has a significance level of 0.00000 for both the intercept
and slope.
Bridge removal costs vary much more than other work items,
because of such variables as removal techniques used and
unbalanced bidding. Therefore, when the data are plotted it
appears as a cluster of dots with a few points outside the
cluster. From these plots it would seem that an average cost,
instead of a model, may be a more accurate predictor for this
work item. Testing, as described in Chapter VI, revealed that
the models were actually more accurate than the average cost.
Therefore, despite the appearance of the regression plots, the
bridge removal models were accepted.
34

The low R-square values and correlation coefficients
indicate these models may not provide the accuracy required for
this research. An R-square of 43.94 percent may seem low, and
it would be for a detailed estimate requiring exact precision.
However, it should be remembered that the goal of this research
is to develop a model for preliminary estimating. considering
the amount of observational data, the many causes for its
variance, and that it has a significance level of 0.0000, these
models are the best available and acceptable for the purpose.
STEEL REINFORCEMENT
The steel reinforcement work item (AHD Code 502A) is
estimated by the equation
p = 0.4142 * Q
where P = Extended price
Q = Quantity, in pounds.
This model was created using 36 data points. Using the
standard regression equation, the significance level of the
intercept was 0.86357. Therefore the model was recalculated
with the intercept being zero. This yielded a model with an R
square of 98.3 percent and a t-value of 45.05.
Since quantity is estimated in pounds, this model is very
dependent on the ability and experience of the estimator. The
user must estimate the pounds of steel required based on
experience or from comparisons to data of similar projects.
35
This quantity should be updated throughout the design process to
correct possible mistakes in the estimated quantity.
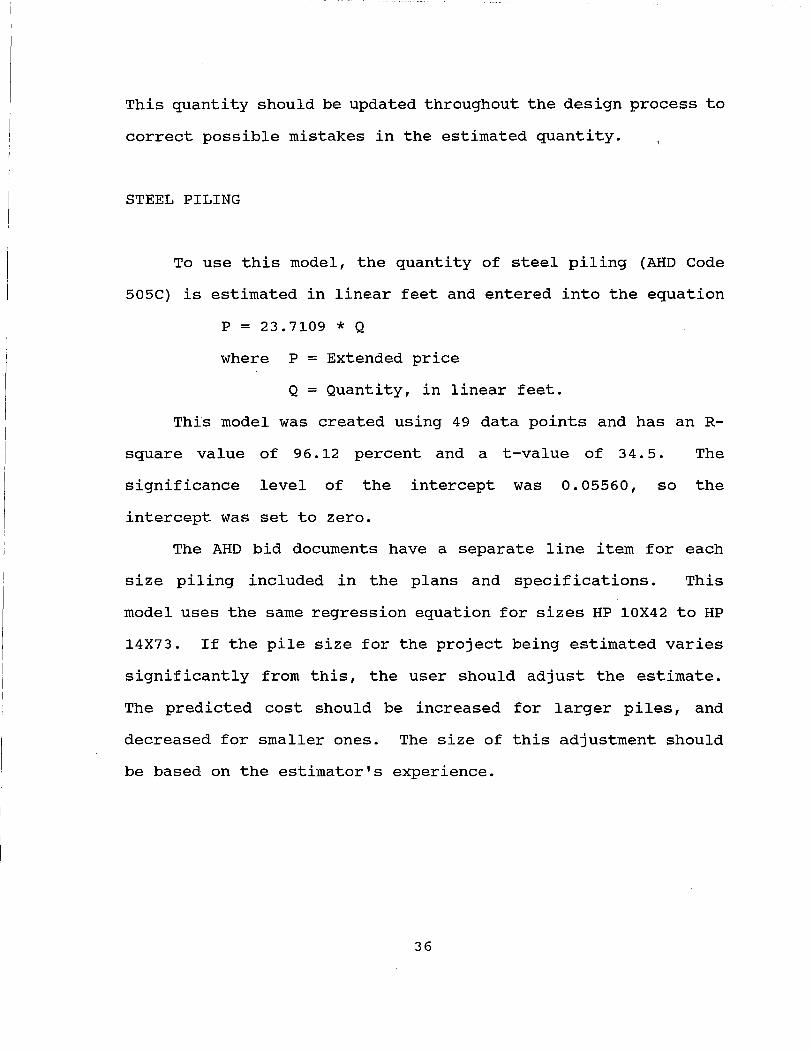
STEEL PILING
To use this model, the quantity of steel piling (AHD Code
505C) is estimated in linear feet and entered into the equation
P = 23.7109 * Q
where P = Extended price
Q = Quantity, in linear feet.
This model was created using 49 data points and has an R
square value of 96.12 percent and a t-value of 34.5. The
significance level of the intercept was 0.05560, so the
intercept was set to zero.
The AHD bid documents have a separate line item for each
size piling included in the plans and specifications. This
model uses the same regression equation for sizes HP 10X42 to HP
14X73. If the pile size for the project being estimated varies
significantly from this, the user should adjust the estimate.
The predicted cost should be increased for larger piles, and
decreased for smaller ones. The size of this adjustment should
be based on the estimator's experience.
36

STRUCTURAL STEEL SUPERSTRUCTURE
The structural steel superstructure (AHD Code 508B) work
item cost is estimated by the equation
P = -10208 + (779.212 * Q)
where P = Extended price
Q = Quantity, in linear feet of bridge.
This differs from the AHDls unit of measure (each), but linear
feet is easy to estimate and produces a much better model. The
R-square of this model is 73.14 percent. The correlation
coefficient is 0.855217, the F-ratio is 1334, and it is based on
492 data points. Note that the intercept term is negative.
This may seem a bit incongruous, but this best modeled the data.
The significance level was 0.00002 for the intercept, and
0.00000 for the slope. The value for P would be negative only
if Q is less than 13, which would never occur.
This work item includes both simple span and continuous
span structures. The continuous span bridges are, as a rule,
longer and therefore more expensive than the simple spans. This
is very obvious from the scatter diagram produced from the
extended price versus quantity plot. It appeared as if there
were two models on the same graph. The regression analysis was
performed again to model simple and continuous spans
independently. Even though the scatter diagram indicated
separate models may be more accurate, this was not true. The
simple span model had an R-square of 32.95 percent, a
37
correlation coefficient of 0.574015, and an F-ratio of 204.9.
The continuous span model an R-square of 60.98 and a correlation
coefficient of 0.780891. The obvious decision then was to keep
the two span types combined to produce the strongest model.
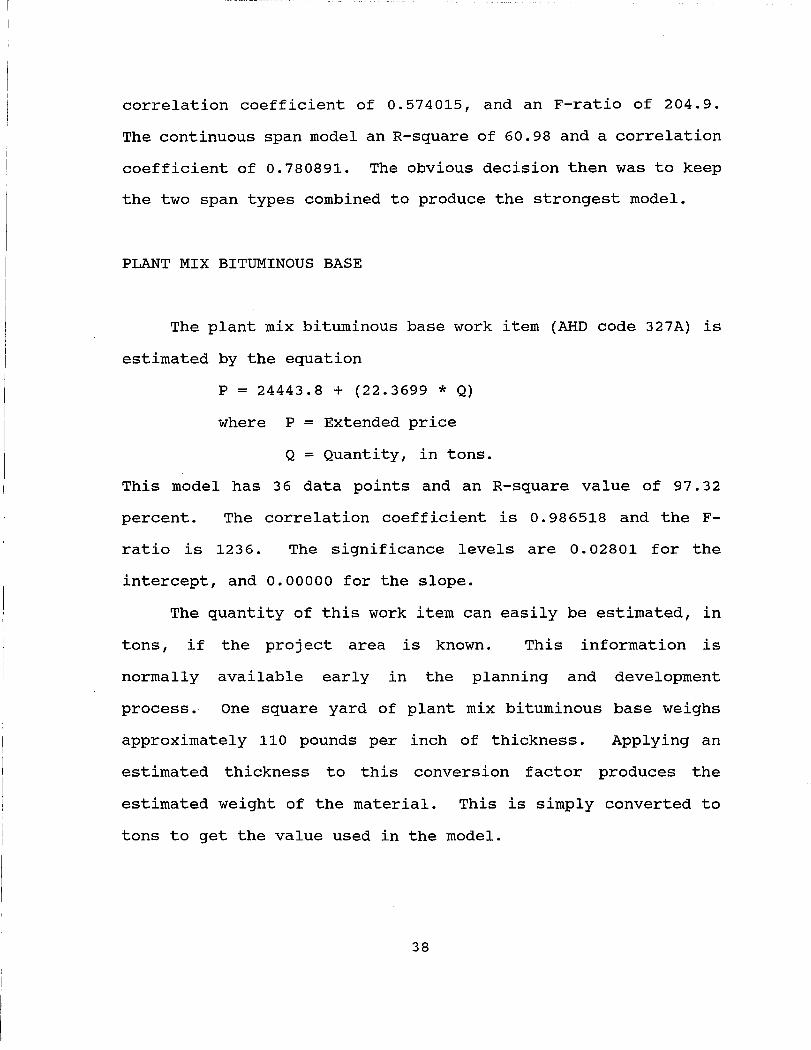
PLANT MIX BITUMINOUS BASE
The plant mix bituminous base work item (AHD code 327A) is
estimated by the equation
P = 24443.8 + (22.3699 * Q)
where P = Extended price
Q = Quantity, in tons.
This model has 36 data points and an R-square value of 97.32
percent. The correlation coefficient is 0.986518 and the F-
ratio is 1236. The significance levels are 0.02801 for the
intercept, and 0.00000 for the slope.
The quantity of this work item can easily be estimated, in
tons, if the proj ect area is known. This information is
normally available early in the planning and development
process. One square yard of plant mix bituminous base weighs
approximately 110 pounds per inch of thickness. Applying an
estimated thickness to this conversion factor produces the
estimated weight of the material. This is simply converted to
tons to get the value used in the model.
38

REINFORCED CEMENT CONCRETE PAVEMENT
A concrete bridge is widened, obviously, because lanes are
being added to the highway and the bridge must be modified to
accept the wider highway. The concrete for the additional
highway lanes is bid as work item 450A. The quantity of
concrete is measured in square yards. It can be estimated,
wi thout drawings, by measuring the area of the lanes to be
added. The cost of this work item (AHD Code 450A) is estimated
by the equation
P = 29.9234 * Q
where P = Extended price
Q = Quantity, in square yards.
This model was created from 37 data points and has an R-square
of 98.38 percent and a t-value of 46.76. The significance level
of the intercept was 0.33084, so here again the intercept was
set to zero.
REINFORCED CEMENT CONCRETE BRIDGE END SLAB
The quantity of this work item (AHD Code 450B) is also
measured in square yards. It is estimated by the equation
P = 58.1671 * Q
where P = Extended price
Q = Quantity, in square yards.
39

The R-square value is 95.9 and the t-value is 29.01. As with
work items 502A and 450A, the best model for this data has an
extremely high significance level for the intercept. This one
is 0.88947, so the intercept was set to zero.
SAFETY/TRAFFIC CONTROL
The cost of work items in this group are almost purely a
function of project length. Since safety barriers, cones,
traffic striping, etc. are placed linearly along the work site,
their cost can be estimated from the length of the project area.
This length is established very early in the planning and
development process and would be known when preliminary
estimates are made.
This is the only model which uses project length, in miles,
as the independent variable. Since this model estimates the
cost of all 13 work items in the group, instead of a single work
item cost, the term "total cost" is used instead of extended
price. Total cost is the sum of the extended price of each of
the 13 work items. This is estimated by the equation
P = 278380 + (171294 * L)
where P Extended price
L = Project length, in miles.
The model's R-square value is 53.39 percent.
coefficient is 0.730709 and the F-ratio
40
The correlation
is 37.81. The

significance levels of the intercept and slope are 0.00002 and
0.00000 respectively.
REINFORCED BRIDGE CONCRETE SUPERSTRUCTURE
Reinforced bridge concrete superstructure (AHD Code 510C)
is estimated by the equation
P = 21949.6 + (439.604 * Q)
where P = Extended price
Q = Quantity, in cubic yards.
The R-square is 82.99 percent. The correlation coefficient is
0.910965 and the F-ratio is 882.8. The significance level of
the intercept is 0.00002, and 0.00000 for the slope.
AHD bid documents require a lump sum for this work item.
Since lump sum is not an acceptable unit of measure to produce
a model, the cubic yardage of concrete is used. This quantity
is not difficult to estimate and produces a good model. Later
in the planning process the required cubic yards must be
estimated and included in the plans and specifications. This
number can then be used in the equation to update the estimate.
Once the work items were selected and modeled, the next
step was to determine how much of the total project cost these
work items represent. A spreadsheet was generated showing the
work items, as a percentage of the total bid amount, for each
bidder on each project. Summing the percentage costs by bidder
and project showed that the nine work items together average
41
63.3 percent of the total project cost, with a standard
deviation of 4.1 percent. From this information a factor must
be determined.to account for the work items that are not on the
list, but are included in the project. Initially it was thought
that if the items in the model account for 63.3 percent of the
costs, the remaining items must account for 36.7 percent. This
was the factor first used in model testing.
42

VII. TESTING AND USE OF THE MODEL
MODEL TESTING
The best testing method available is to use the model to
estimate past proj ects and compare the resul ts to the bids
received. The following procedure was used to estimate each
project. The regression equation for each of the nine work item
models were utilized, using work item quantities taken from the
plans and specifications. The sums of each equation were then
totaled for a project. To account for mobilization, bridge
substructure concrete, and other items included in the project
but not modeled, this total was divided by 0.633. This factor
was used because the nine work items modeled constitute, on the
average, 63.3 percent of the total project cost. This estimated
bid (sum of the models divided by 0.633) was compared to the
actual low bid received for that project. The estimates were
generally higher than expected. The desired accuracy of the
model required the estimate to be between 80 and 120 percent of
the actual low bid. Estimates from the test ranged from 92 to
130 percent of the low bid.
Each model in this project was created using data from all
bidders. However, the intent of the study is to predict the
lowest bidder. A model created with data from low and high
bidders will obviously predict amounts higher than the lowest
bid. Some conversion process or factor must be applied.
43

One method attempted to alleviate this problem by adjusting
all bids on each project to the lowest bidder. For example, if
the second lowest bidder's total was five percent higher than
the low bid, each line item of the second lowest bidder was
reduced by five percent. After further investigation this
method was rejected. Because of differing bid strategies
between contractors, the lowest total bidder does not
necessarily have the lowest bid on each line item. Adjusting
bids would, in many cases,· not normalize the data but only
increase the variance and weaken the model.
The method used to solve this problem was to combine this
adjustment with the factor which accounts for work items not
estimated in the model. Originally, the sum of the nine models
was divided by 0.633 to account for items such as mobilization,
bridge substructure concrete, and low cost work items. The
0.633 value was used because the nine modeled work items account
for 63.3 percent of the project costs. Combining the factor
which adjusts for using all bidders with the factor to adjust
for work items not modeled would also simplify the procedure for
the user. The problem now was that the adjustment for items not
modeled was 0.633, but the adjustment for all bidders was
unknown. To determine the optimum value of this combined factor
the projects were again estimated using the model. This time
the difference between the estimated total bids and actual low
total bids were squared and summed. This procedure was
repeated, increasing the factor by one percent on each
44

iteration, until the sum of squares reached its lowest point and
began increasing. The factor which had the smallest sum of
squares, and therefore the optimal value, was 0.7.
This factor was accepted and is used in the model as the
only adjustment that must be applied to the sum of the nine
models . Results of each iteration are shown in Table 6.
Estimates produced using the model and 0.70 factor are compared
to actual bids received, and shown in Table 7.
The model form was also tested using the following
sequence:
1. Remove all data relating to Project 1.
2. Recalculate the model without the data from Project 1.
3. Estimate the cost of Project 1 based on the revised model.
4. Replace the data relating to Project 1.
5. Remove all data relating to project 2.
6. Perform steps 2 4 for Project 2 and all remaining
projects.
This eliminates the problem of estimating the cost of a
project based on a model created with data from that project.
The results of this procedure are given in Table 7. All of the
proj ects but Proj ect 8 are wi thin the 20% interval. The average
of estimated/actual is 94%. There was no single discernible
factor that caused these estimates to be consistently lower than
the ones created when using all of the data.
45

Table 6
Factor to Account for Items Not in the Model and the Corresponding Test Error.
FACTOR SUM OF SQUARES FACTOR
Project Number
1 2 3 4 5 6 7 8 9
10 11
.633 0.246364 .683
.643 0.210872 .693
.653 0.182580 .703
.663 0.160892 .713
.673 0.145260 .723
Table 7
Estimated Bids compared to Actual Low Bids Received
Estimated Cost and Percent of Cost Using Data From All Projects
$6,253,855 91 $4,724,381 117 $7,299,101 106 $7,828,645 98 $9,222,218 99 $7,198,999 96 $2,994,247 89 $9,438,345 82 $6,446,814 113 $5,519,750 85 $6,309,906 105
Average 98
Estimated Cost and Percent of Cost With Project Data Removed
$6,129,619 89 $4,672,899 116 $6,473,715 94 $7,013,856 88 $9,496,700 102 $6,727,566 90 $2,966,986 88 $8,760,833 77 $6,493,882 113 $5,232,540 80 $6,122,662 102
94
46
SUM OF SQUARES
0.135184
0.130206
0.129905
0.133898
0.141831
Actual Cost
$6,885,768 $4,025,352 $6,914,660 $7,972,837 $9,314,527 $7,494,374 $3,375,290
$11,446,382 $5,731,481 $6,531,286 $6,021,695

USE OF THE MODEL
This model is designed to provide a preliminary cost
estimate of urban highway bridge widening projects in 1988
dollars. Inflation would need to be accounted for by using an
acceptable construction cost index. The model is in a format
that requires only basic mathematical operations and can be
executed on a hand calculator. It also may be used on a
computer by writing a simple program in practically any
language, including BASIC, dBase, and LOTUS 123.
The model was tested using actual, not estimated, work item
quantities. Inaccurate quantity estimates would of course lead
to inaccurate bid estimates. It is important to identify
inaccurate estimates as early as possible to allow management
time to react. Throughout the development phase of a project
the scope and quantity of work changes. The cost estimate must
change also. Periodically during the development phase, the
estimated work item quantities should be compared to the latest
design data and revised. Revisions which can be made easily
with one calculation or keyboard entry can save a lot of time
and money later.
Work items included in the model which are bid as several
line items must be entered into the model individually. For
example, if several bridges are to be removed as part of a
project, each bridge will be listed as a separate line item and
bid as a lump sum for each bridge to be removed. In these
47

instances each line item must be entered into the model
individually. If the length of all bridges in the project were
totaled and the sum used in the model, the results of the model
would not be as accurate because the intercept term must be
included for each bridge that is removed.
If a project being estimated does not include one of the
modeled work items, the model is not affected. The model would
be used in the same manner as if all work items were included.
In none of the projects examined were two or more of the modeled
work items excluded. Therefore, the validity of the model in
this situation is unknown. Many projects similar to this one
develop large multi-factor models instead of estimating
individual work items as is done here. The multi-factor models
are created to incorporate the interactions between work items.
When such interactions exist, the multi-factor model is
generally stronger than individual simple regression models.
The data for this project indicates that interactions between
work items do not exist. Therefore, each work item is estimated
individually.
This model is designed to estimate the lowest bid for an
urban highway bridge widening project. This should not be
confused with total cost. The cost of engineering, inspections,
right-of-way, and other items normally associated with total
cost are not included.
48
VIII. CONCLUSION AND RECOMMENDATIONS
CONCLUSIONS
Use of the Model
Alabama Highway Department officials have a difficult task
in determining which proj ects to develop and fund. This problem
is compounded when bids received and actual costs are
significantly more than the amount used during planning. This
results in last minute scrambles for more money and sometimes a
waste of limited resources. To facilitate the best use of
available funds officials need accurate preliminary cost
estimates. The AHD method of producing multiple estimates from
different departments helps solve these problems by providing a
checks and balances system. The accuracy of the techniques now
being used is unknown. Since the model described in this paper
has been tested to be accurate to within 20 percent, it could
complement the methods currently being used and improve the
checks and balances system.
This model could possibly be used at many levels, including
estimators (at division and headquarters level), designers, and
managers. The primary users, however, will be estimators.
These people are very experienced at estimating all aspects of
bridge construction and repair projects. They are more skilled
at estimating work item quantities than at performing complex
mathematical operations. Therefore, the model was designed to
49

require only basic arithmetic, but relies heavily on the user's
ability to accurately estimate work item quantities. Tests of
the model used actual quantities, producing estimates within a
range of 80 to 120 percent of the actual low bid. If the
estimated quantities varied significantly from actual quantities
required, this range could be much greater.
One of the major causes of inaccuracy of AHD estimates has
been that the estimate does not change with the scope.
Throughout the development stage, the scope of the proj ect
changes. As more detailed information is known the cost
estimate must be updated. For this model to be used for its
intended purpose it is imperative that it be reviewed and
updated at each stage of development and design. This will
alert officials of the changed cost earlier, and allow them time
to react. It will also show what caused the estimate to change.
Failure to revise the estimate will negate any improvement of
the estimating process and bring AHD officials back to the
original problem: how to make the best use of available funds.
This model was developed to estimate urban highway bridge
widening projects. It is also applicable to projects which
include additional lanes, concrete pavement rehabilitation, and
signing. It should not be used to estimate other type projects,
nor should individual work item models be used independently.
The data on which the study is based are from 1987 and 1988
projects. Therefore, the estimates produced from this model
must be adjusted to present day dollars. The Engineering News
50

Record Construction Cost Index could be used to adjust the
estimate to current dollars.
Bridge widening costs, as with all construction costs, vary
between states. This is due to such factors as different labor
rates, weather conditions, and material costs. Since this model
is based on projects done in the state of Alabama, its validity
in other locations is unknown.
Application to Other Types of Projects
The estimating model presented in this report obviously has
very limited application. The data used for the model came only
from interstate bridge widening projects in urban areas.
Therefore, using the model to predict the cost of other types of
projects would yield unreliable results. The purpose of the
study was not just to create this model, but to develop a
methodology that could be applied to a number of project types.
The data consisted of unit price bids, with more than a 100 line
items on each bid. A small percentage (5 - 10%) of these items
accounted for the majority of the cost, so a reasonable total
cost could be estimated by calculating the cost of the few major
items. Other proj ects with the same characteristics, which
would include most heavy and highway work, could be estimated
using this methodology.
51

RECOMMENDATIONS
As subsequent bridge widening projects are let by the AHD,
the bid data should be added to this database to update and
improve the existing models. Also, attention should be given to
new technologies and construction methods used in bridge
widening. If a new technology or method that affects a work
item price is used, that work item model should be modified to
reflect the new development.
Additional testing of the model should also be conducted.
Bridge widening projects in other states could be estimated and
compared to the actual bids received. Because of differing work
item descriptions, bid data from other states could not be
included in the development of this model. However, careful
examination of the plans and specifications of projects outside
Alabama could produce the quantity information required for the
model. This additional testing would provide a better analysis
of the accuracy of the model.
Research comparing the cost of the nine modeled work items
to their cost in other type projects should be considered. This
would determine whether work item cost is affected by project
type. Results of these studies could possibly then be
incorporated into a comprehensive preliminary estimating system
for all types of AHD construction and repair projects.
This procedure could also be used to estimate costs for
other types of bridge projects. A similar analysis could be
52

conducted to determine the major cost items and models developed
to aid in calculating a preliminary estimate.
53

BIBLIOGRAPHY
AASHTO committee on Maintenance, (1977), "Productivity standards and unit costs for Highway and Bridge Maintenance Activities", Maintenance Aid Digest, American Association of state Highway and Transportation Officials, Washington, D.C.
Chen, C., Johnston, D.W., Center for Transportation Engineering Studies, (1987), "Bridge Management Under a Level of Service Concept Providing Optimum Improvement Action, Time, and Budget Prediction", North Carolina Department of Transportation and Federal Highway Administration, Raleigh, North Carolina.
Cifelli, N.J., New Jersey Department of Transportation, (1979), "Value Engineering Study of Bridge Painting", Federal Highway Administration, Department of Transportation, Washington, D.C.
Farid, F., Johnston, D.W., Chen, C., Laverde, M.A., Rihani, B.S., (1988), "Feasibility of Incremental Benefit-Cost Analysis for optimal Allocation of Limited Budgets to Maintenance, Rehabilitation, and Replacement of Bridges", Federal Highway Administration, Department of Transportation, Washington, D.C.
Federal Highway Administration, (1977), Productivity Standards", Department of washington, D.C.
"unit Cost and Transportation,
Federal Highway Administration, (1987), "Bridge Management Systems", Department of Transportation, Washington, D.C.
Federal Highway Administration, (1987), "Bridge Management Systems", Report FHWA-DP-71-01, Department of Transportation, Washington, D.C.
Federal Highway Administration, (1988), "summary of New Bridge Construction and Bridge Rehabilitation with participation· of Federal Funds", FHWA Summary, Department of Transportation, Washington, D.C.
Federal Highway Administration, (1990), "Bridge Construction unit Cost", FHWA Memorandum, Department of Transportation, Washington, D.C.
Hudson, S.W., Carmichael, R.F., Hudson, W.R., Moser, L.O., Wilkes, W.J., (1987), "Bridge Management Systems", National Cooperative Highway Research Program Report, Transportation Research Board, National Research Council, Washington, D.C.
Hyman, W.A., Hughes, D.J., (1983), "Computer Model for LifeCycle Cost Analysis of Statewide Bridge Repair and Replacement
54

Needs", Transportation Research Record 899, Transportation Research Board, National Academy of Sciences, Washington, D.C.
Isa Al-Subhi, K.M., Johnston, D.W., Farid, F., Center for Transportation Engineering Studies, (1989), "Optimizing SystemLevel Bridge Maintenance, . Rehabilitation, and Replacement Decisions", North Carolina Department of Transportation and Federal Highway Administration, Raleigh, North Carolina.
Kaminsky, A.F., (1986), "Preliminary Highway Construction Projects", thesis University in partial fulfillment of the degree of Master of Science.
Cost Estimating for presented to Auburn requirements for the
Minor, J., White, K.R., Busch, R.S., (1988), "Condition Surveys of Concrete Bridge Components", National Cooperative Highway Research Program Report, Transportation Research Board, National Research Council, Washington,D.C.
Nash, S.C., Johnston, D.W., Center for Transportation Engineering studies, (1985), "Level of Service Analysis for Bridge Maintenance Activities in North Carolina", North Carolina Department of Transportation and Federal Highway Administration, Raleigh, North Carolina.
National Cooperative Highway Research Program, (1981), "Underwater Inspection and Repair of Bridge Substructures", Report Number 88, Transportation Research Board, National Research council, Washington, D.C.
Park, Sung H. (1984), "Bridge Rehabilitation and Replacement", S.H. Park, Trenton, New Jersey.
Road Research Group, (1981), "Bridge Maintenance", Organization for Economic Cooperation and Development, Paris, France.
state of Alabama Specifications for Montgomery, Alabama.
Highway Highway
Department, (1990) , " construction", 1989
Standard Edition,
Walpole, R.E., Myers, R.H., (1972), "Probability and statistics for Engineers and Scientists", Macmillan Publishing Company, New York, New York.
White, K. R., Minor, J., Derucher, K. N. , (1981), "Bridge Maintenance, Inspection, and Evaluation", Marcel Dekker, Inc., New York, N.Y.
55

APPENDIX A SCATTER DIAGRAMS OF WORK ITEMS
SELECTED AS MODEL VARIABLES
56

ru u
·ri s... a. 1] ru
1] c ru
..JJ x W
120000
100000
80000
60000
40000
20000
o
... ~ ...................................... ~ ...................................... ~ .................................. ' ... !......................... ............ . ................................. Q. ••
l REGRESSION ~QUATION! ! i EXTENDED PRfCE = 16846.7t(66.19*QUANT~TY) ill 1
Irl' iI,1"
~ f ~ :'~:-l ~ ~ ~ : . a: :: ~ raa ~ ~ 1 ··l··· .. ···· .. ······ .. ····· .. ···· .. ··~t····~··············· ................. i ·········· .. ····· .... ······~····I·:···················· .. · ............. ( ................................... 1".
~ DaJ l ~ l ~ a ~ ~ ~
... ~..... . ................ D .... D"t .. a ................................ 'j' ..................................... [ ..................................... j- ..................................... j .. .
,1::., o 200 400 600 800 1000
Quantity, in Linear Feet
Figure A.l .. Item 206A Partial Bridge Removal

OJ U
·ri to. II OJ II C OJ
-I-l X W
300000 ... ~ .... '" ................. " ..... ~ .... " ..... " .... " .... " ..... '1' .......... " .......... " ....... ~. . . . . . . . . . . . . . . . . . . . . . . . . . . . . . . . .............................. ~ .......... " ................. " .. 1 REGRESSIO~ EQUATION :: i
I EXTENDED tRICE = 359~4.7+(235.'9*QUANTITY ~ 250000
200000 ~ ....................... ········i····· ........................ ··1········· ........... .
I ! r 150000 ~ ................................ ~ ............ , .................. ~ ........... .
: : :a : ~~
100000 r D a :
a :
50000
o +;1,;;;
o 200 400 600 800 aee 120e
Quantity, J.n Linear Feet
Figure A.2 Item 206A Complete Bridge Removal

QJ U
.--1 s.... 0.
1] QJ
1] C QJ
4J X W
seeeee ................................. \ ............................... j ............................... "1" ............................................................................................ , .. .
REGRESSIO~ EQUATION 1
EXTENDED rRICE = 244r3.S+<22.31*QUANTITY)
seeeee : :: ,:
.............m .. , ..
4eeeee , .................•. ..............................,
a : 2eeeee
e
............. ~............................... .............................. . ............................................................. ~ .. .
,t! a seea 10aee lseee 2eee 2seea 3eeee
Quantity, in Tons
Figure A.3 Item 327A Plant Mix Bituminous Base

Q) U ..... Sa. 11 Q) 11 C Q)
4J X ill
(X 1eee)
3eee ... ; ...................................... ; .................................... ,.( ........................................................................... ; ...................................... ( .. .
1 REGRESSION ~QUATION 1 i ~ i EXTENDED PRICE = 29. 92 l1C QUANTITY 0 :
26ee : : / : ~ ~ 1 ............................. ~ ...
2eee
16ee
1eee
6ee
e
e 2eeee 4aeee saeee aeeee aaaea
Quantity, in Square Yards
Figure A.4 Item 450A Reinforced Cement Concrete Pavement

OJ U
. ..f s...
D..
1l OJ 1l C OJ
-4J X
UJ
6eeeee .... ········ .... ·································1· .. ·· .. ···· .................................... '/' .............................................................................................. , .. .
REGRESSION EQ~ATION ! a
EXTENDED PRICe = 6S.17*QUANTIT:y
4eeeee . z, ................ .. a ~ ./
3eeeee 7· .......... · ...... ··· .. · .. ·· .......... · .......... ······ .. ··· .. ·
B
2eeeee
:'-1 1eeeee 11
e .. . ... '" ..................................... ,.~ ............................................... -:- ............................................... : ............................................... ~ .. . iii
o 2000 4000 seee seee
Quantity, in Square Yards
Figure A.5 Item 450B Reinforced Concrete Bridge End Slab

w u .~
So.. 0.
"'0 W "'0 C W
+J X W
aeeeee
2seeee
2eeeee
lseeee
leeeee
seeee
e
13 1eeeee 2eeeee aeeeee 4eeeee seeeee seeeee
Quantity, in Pounds
Figure A.6 Item 502A Steel Reinforcement

Q) u ..... s... D.
1J Q)
1J C Q)
.JJ x ill
240000
20eeee
1seeee
12eeee
ae0ee
4eeee
e
... ; ...................................... : ...................................... ( .......................................................................... ···················.············.····i··.
! REGRESSION! EQUATION i . I EXTENDED PrICE = 23.71*rUANTITY
ill ···!·····································t·····································l· ........ ······· .. ········Q·:····.... . ..................................... .
! ! ! ~ D
~ ~ ~ a ~ ... t ..................................... .: ...................................... ; ... 0 ................................ : ....••••• !I! .•..•...•..••...........•.•....•..••.........••...•.......•••.•. o.
I I I D I ~ ; a: 1
.. .1 ..................................... 1. ............ :......... . .................................... l ........................................................................... . I I r I D ! !
III e 2eee 4eee seee eeee 1eeee
Quantity, in Linear Feet
Figure A.7 Item sose steel Piling

Ol U ..... Sa. 1] Ol
1] C Ol ~ X
UJ
600000 .. ···············································1················································I··········· ..................................................................................... . REGRESSION EQU~TION
400000
300000
EXTENDED PRICE!= -1.2 ••• (779.2"QUANTITY)
II. ! i
~ D til
: .:~:-4
200000 ......... 1' ..................................... ,
B i : B~. B ~ a
B.
100000 n ..........•••••.•.••.•••...............•.........••..............................
l1li - a til
,0
o .......................... E;J, ••••••••••• i'" .................................... ........ . ............................................................................................. ~ ... .
o 100 200 300 400
Quantity, in Linear Feet
Figure A.S Ite~ 50SB structural Steel superstructure

m u .~
Sa. 1] m 1] c OJ
.fJ X W
(X 1eee)
12ee ., ...................................... ~ ................................... ,.. . .................................... ~........... .......................... ..................................... ..
REGRESSXON ~QUATXON ~ EXTENDED PRICE = 21949.S (439.se*QUANTXTY)
1eee ·····································1
see cd see ........................... j ........................... ······ ...... i···
~:-!
4ee .................... o a :
o ~
2ee a ~ g ................................ ! ....... . 4 0
e . I 0 : • • • ... : ..................................... : ..................................... : ...................................... : ...................................... ; ..................................... : .. .
e 4ee see 12ee 1see 2eee
Quantity, in Cubic Yards
Figure A.9 Item 510C Reinforced Concrete Superstructure

~ lJl o
(.)
0.. :J o $...
CJ
E QJ ~ H
.::L SO 3
...... m ~ o r-
<x 1eee)
15ee
12ee
see
see
:3ee
e
... ! ............................................... ~ ............................................... + .............................................................................................. o.
f REGRESSION EQU4TION 1
I TOTAL OROUP COlT = 27.3.'+(171j04<LENOTH)
Irr iii
: : .: a
.. j ............................................... 1 .................................. ~~~..... ..l ... ' , ..................... 8 .................... ? .............................. : ............... I. ..
I 1 : , i ~ ~ ~ j .,"
... : ............................................................................................. : ............................................... : ............................................... : .. .
e 1 2 :3 4
Project Length, in Miles
Figure .. A.l0 Safety/Traffic Control

r-I
n n n n 11
I-I
f1
[ I
[ 1
II
[ I
II
U
U IJ
~J
J U