Embed Size (px)
Citation preview

NONRESPONSE IN HOUSEHOLD TRAVEL SURVEYS
Michele Zimowski,Roger Tourangeau,
Rashna Ghadialy, andSteven Pedlow
Prepared for: NORCFederal Highway Administration 1155 60 Streetth
October, 1997 Chicago, IL 60615
(773) 753-7500

TABLE OF CONTENTS
PREFACE . . . . . . . . . . . . . . . . . . . . . . . . . . . . . . . . . . . . . . . . . . . . . . . . . . . . . . . . . . . . . i
1.1. MMEASURING AND EASURING AND RREPORTING EPORTING NNONRESPONSEONRESPONSE . . . . . . . . . . . . . . . . . . . . . . . . . . . . . . . .. . . . . . . . . . . . . . . . . . . . . . . . . . . . . . . . 1-11-1
1.1 CHAPTER SUMMARY . . . . . . . . . . . . . . . . . . . . . . . . . . . . . . . . . . . . . . . . 1-1Main Recommendations . . . . . . . . . . . . . . . . . . . . . . . . . . . . . . . . . . . . 1-1
1.2 INTRODUCTION . . . . . . . . . . . . . . . . . . . . . . . . . . . . . . . . . . . . . . . . . . . 1-2Selecting a Survey Sample . . . . . . . . . . . . . . . . . . . . . . . . . . . . . . . . . . . 1-2Recording the Outcomes of the Field Effort . . . . . . . . . . . . . . . . . . . . . . . 1-4
1.3 MEASURING THE LEVEL OF NONRESPONSE IN A SURVEY . . . . . . . . . . . . 1-81.4 SELECTING THE UNIT OF MEASUREMENT . . . . . . . . . . . . . . . . . . . . . . . . 1-91.5 CLASSIFYING UNITS INTO CATEGORIES . . . . . . . . . . . . . . . . . . . . . . . . . 1-9
Classification Levels and Categories . . . . . . . . . . . . . . . . . . . . . . . . . . . . 1-9Classification Rules . . . . . . . . . . . . . . . . . . . . . . . . . . . . . . . . . . . . . . . 1-15An Application of the Classification System to Travel Data . . . . . . . . . . . 1-19
1.6 CALCULATING RESPONSE RATES . . . . . . . . . . . . . . . . . . . . . . . . . . . . . 1-24Calculating Component Response Rates . . . . . . . . . . . . . . . . . . . . . . . . 1-24Calculating the Overall Response Rate . . . . . . . . . . . . . . . . . . . . . . . . . 1-25Weighted vs. Unweighted Rates . . . . . . . . . . . . . . . . . . . . . . . . . . . . . . 1-28
2. R2. REDUCING EDUCING NNONRESPONSEONRESPONSE . . . . . . . . . . . . . . . . . . . . . . . . . . . . . . . . . . . . . . . . . . . . . .. . . . . . . . . . . . . . . . . . . . . . . . . . . . . . . . . . . . . . . . . . . . . . 2-12-1
2.1 CHAPTER SUMMARY . . . . . . . . . . . . . . . . . . . . . . . . . . . . . . . . . . . . . . . . 2-1Major Recommendations . . . . . . . . . . . . . . . . . . . . . . . . . . . . . . . . . . . . 2-1Organization of the Chapter . . . . . . . . . . . . . . . . . . . . . . . . . . . . . . . . . 2-3
2.2 RESPONDENT CHARACTERISTICS . . . . . . . . . . . . . . . . . . . . . . . . . . . . . . 2-4The Mentally and Physically Handicapped . . . . . . . . . . . . . . . . . . . . . . . . 2-5Individuals with Limited Literacy Skills . . . . . . . . . . . . . . . . . . . . . . . . . . . 2-5Individuals with Language Barriers . . . . . . . . . . . . . . . . . . . . . . . . . . . . . 2-6The Less Well Educated . . . . . . . . . . . . . . . . . . . . . . . . . . . . . . . . . . . . . 2-6The Elderly . . . . . . . . . . . . . . . . . . . . . . . . . . . . . . . . . . . . . . . . . . . . . . 2-7Urban Dwellers . . . . . . . . . . . . . . . . . . . . . . . . . . . . . . . . . . . . . . . . . . . 2-7Other Groups of Nonrepondents in Travel Surveys . . . . . . . . . . . . . . . . . 2-8
2.3 INTERVIEWER CHARACTERISTICS . . . . . . . . . . . . . . . . . . . . . . . . . . . . . . . 2-9Interviewer Experience . . . . . . . . . . . . . . . . . . . . . . . . . . . . . . . . . . . . . . 2-9Interviewer Gender . . . . . . . . . . . . . . . . . . . . . . . . . . . . . . . . . . . . . . . 2-10

TABLE OF CONTENTS (Continued)
Interviewer Expectations . . . . . . . . . . . . . . . . . . . . . . . . . . . . . . . . . . . . 2-10Interviewer Style of Interaction . . . . . . . . . . . . . . . . . . . . . . . . . . . . . . . 2-10Interviewer Vocal Characteristics . . . . . . . . . . . . . . . . . . . . . . . . . . . . . 2-11Other Interviewer Characteristics . . . . . . . . . . . . . . . . . . . . . . . . . . . . . 2-11
2.4 METHODS FOR REDUCING UNIT NONRESPONSE . . . . . . . . . . . . . . . . 2-12Interviewer Selection and Training . . . . . . . . . . . . . . . . . . . . . . . . . . . . 2-12Design of Survey Instruments . . . . . . . . . . . . . . . . . . . . . . . . . . . . . . . . 2-14Number and Type of Contacts . . . . . . . . . . . . . . . . . . . . . . . . . . . . . . . 2-16Timing of the Contact Calls . . . . . . . . . . . . . . . . . . . . . . . . . . . . . . . . . 2-19Pretesting Field Procedures and Instruments . . . . . . . . . . . . . . . . . . . . . 2-25Proxy Respondents . . . . . . . . . . . . . . . . . . . . . . . . . . . . . . . . . . . . . . . . 2-30Special Methods for Reducing Nonresponse . . . . . . . . . . . . . . . . . . . . . 2-32Subsampling Nonrespondents . . . . . . . . . . . . . . . . . . . . . . . . . . . . . . . 2-33
2.5 ITEM NONRESPONSE . . . . . . . . . . . . . . . . . . . . . . . . . . . . . . . . . . . . . . 2-34Questionnaire Design . . . . . . . . . . . . . . . . . . . . . . . . . . . . . . . . . . . . . 2-34Retrieval of Missing Items . . . . . . . . . . . . . . . . . . . . . . . . . . . . . . . . . . . 2-36
2.6 CURRENT PRACTICE FOR REDUCING NONRESPONSE IN TRAVEL SURVEYS . . . . . . . . . . . . . . . . . . . . . . . . . . . . . . . . . . . . . . . . . . . . . . . . 2-37
Pretests . . . . . . . . . . . . . . . . . . . . . . . . . . . . . . . . . . . . . . . . . . . . . . . . 2-37Incentives . . . . . . . . . . . . . . . . . . . . . . . . . . . . . . . . . . . . . . . . . . . . . . 2-38Follow-up Reminders . . . . . . . . . . . . . . . . . . . . . . . . . . . . . . . . . . . . . . 2-38
REFERENCES . . . . . . . . . . . . . . . . . . . . . . . . . . . . . . . . . . . . . . . . . . . . . . . . . . . . . . . . 2-40
3.3. SSTATISTICAL TATISTICAL MMETHODS FOR ETHODS FOR RREDUCING EDUCING TTHE HE IIMPACT OF MPACT OF NNONRESPONSEONRESPONSE . . . . . . . . . . . .. . . . . . . . . . . . 3-13-1
3.1 CHAPTER SUMMARY . . . . . . . . . . . . . . . . . . . . . . . . . . . . . . . . . . . . . . . . 3-1Statistical Methods . . . . . . . . . . . . . . . . . . . . . . . . . . . . . . . . . . . . . . . . . 3-1
3.2 TYPES OF NONRESPONSE . . . . . . . . . . . . . . . . . . . . . . . . . . . . . . . . . . . 3-2Unit Nonresponse . . . . . . . . . . . . . . . . . . . . . . . . . . . . . . . . . . . . . . . . . 3-2Item Nonresponse . . . . . . . . . . . . . . . . . . . . . . . . . . . . . . . . . . . . . . . . . 3-3
3.3 IMPACT OF NONRESPONSE . . . . . . . . . . . . . . . . . . . . . . . . . . . . . . . . . . 3-3Reduced Sample Size . . . . . . . . . . . . . . . . . . . . . . . . . . . . . . . . . . . . . . . 3-4Introduction of Bias . . . . . . . . . . . . . . . . . . . . . . . . . . . . . . . . . . . . . . . . 3-4
3.4 SURVEY METHODS . . . . . . . . . . . . . . . . . . . . . . . . . . . . . . . . . . . . . . . . . 3-7Averting Nonresponse . . . . . . . . . . . . . . . . . . . . . . . . . . . . . . . . . . . . . . 3-7
TABLE OF CONTENTS (Continued)
Following up with a Subsample of Nonrespondents . . . . . . . . . . . . . . . . . 3-83.5 STATISTICAL METHODS . . . . . . . . . . . . . . . . . . . . . . . . . . . . . . . . . . . . . 3-10
Weighting . . . . . . . . . . . . . . . . . . . . . . . . . . . . . . . . . . . . . . . . . . . . . . 3-10Calculating Weights . . . . . . . . . . . . . . . . . . . . . . . . . . . . . . . . . . . . . . 3-11Alternative Methods for Weighting . . . . . . . . . . . . . . . . . . . . . . . . . . . . 3-18Editing and Imputation . . . . . . . . . . . . . . . . . . . . . . . . . . . . . . . . . . . . . 3-22
AAPPENDICESPPENDICES . . . . . . . . . . . . . . . . . . . . . . . . . . . . . . . . . . . . . . . . . . . . . . . . . . . . . . . . . . . . . . .. . . . . . . . . . . . . . . . . . . . . . . . . . . . . . . . . . . . . . . . . . . . . . . . . . . . . . . . . . . . . . . A-1A-1Appendix 1: Questions and Answers to Avert Nonresponse . . . . . . . . . . . . . . . . A-2Appendix 2: Examples of Good and Bad Questionnaire Design . . . . . . . . . . . . . A-5
GGLOSSARY OF LOSSARY OF TTERMSERMS . . . . . . . . . . . . . . . . . . . . . . . . . . . . . . . . . . . . . . . . . . . . . . . . . . . . . . .. . . . . . . . . . . . . . . . . . . . . . . . . . . . . . . . . . . . . . . . . . . . . . . . . . . . . . . G-1G-1References . . . . . . . . . . . . . . . . . . . . . . . . . . . . . . . . . . . . . . . . . . . . . . . . . . . . G-6

-i-
PREFACE
Response rates for household travel surveys conducted within the United States havedeclined substantially over the past few decades. In recent years, household travel surveysconducted by a combination of telephone and mail have typically obtained rates in therange of 25 to 40 percent. However, some travel surveys have reported response rates aslow as 5 percent. In many other parts of the world even the "typical" response rates forU.S. travel surveys would be considered low if not unacceptable.
Nonresponse is of major concern to transportation planners for three reasons. First, oftenthere is a perception that data collected in a survey with low response rates are of a poorquality regardless of the sample’s representativeness of the population. Second, for anygiven method of data collection, the costs of obtaining quality data increase as it becomesmore difficult to secure the cooperation of sample members. Finally, if nonrespondentshave different travel characteristics than the population as a whole, then data from thesurvey will be biased.
In response to those concerns, nonresponse was one of five major topics addressed at the1995 Transportation Research Board (TRB) conference on household travel surveys. Inworkshops held at that conference, participants developed a research agenda and a setof research problem statements for each topic area. Several of the recommended researchprojects have since been funded under the Department of Transportation andEnvironmental Protection Agency’s Travel Model Improvement Program (TMIP). Thisreport is one example and is the first in a series of initiatives focusing on nonresponse inhousehold travel surveys. The purpose of this report and the other projects is to improvethe quality of survey data gathered by MPOs and state DOTs, and to promote efficientutilization of data collection resources. To accomplish these goals, this report used athree-pronged approach as described in the chapter summaries below.
Chapter 1. Measuring and reporting nonresponse: A standard approach to reportingresponse rates is recommended. A standard approach, used consistently, can help assessthe quality of survey data. Standard reporting also allows users to evaluate differenttechniques for implementing surveys, thus building a coherent body of knowledge onmethods for household travel surveys.
Chapter 2. Reducing nonresponse: To reduce nonresponse, characteristics ofrespondents and interviewers must be understood. Characteristics of typicalnonrespondents to travel surveys are discussed. Procedures to improve response rates arerecommended.
Chapter 3. Statistical methods for reducing the impact of nonresponse: Despite our bestefforts, all travel surveys are likely to have nonrespondents. Specific methods to adjustsurvey results to better represent the population are recommended.

-ii-
This project benefited from the advice and experience of many people outside of NORCand FHWA. We would especially like to thank the members of our advisory panel:
Ed Christopher, Chicago Area Transportation SurveyBob Griffiths, Metropolitan Washington COGRyuichi Kitamura, Kyoto UniversityArnim Meyburg, Cornell UniversityPaul Moore, Research Triangle InstituteEric Pas, Duke UniversityCheryl Stecher, Applied Management and Planning Group
Peter Stopher, Louisiana State UniversityJohanna Zmud, NuStats

NONRESPONSE IN HOUSEHOLD TRAVEL SURVEYS 1–1
1.MEASURING AND REPORTING
NONRESPONSE
1.1 CHAPTER SUMMARY
This report is written for designers, analysts, and sponsors of household travelsurveys, and all other persons who find themselves involved, in one way oranother, with the collection, reporting, or interpretation of travel survey data. Its objective is to provide a set of guidelines for measuring and reportingnonresponse in household travel surveys and for reducing the level and impactof nonresponse.
This chapter focuses on the measurement and reporting of nonresponse. Itdiscusses the background for a number of recommendations on how responserates should be calculated and reported in household travel surveys. Therecommendations are based on standards established in the survey researchliterature.
MAIN RECOMMENDATIONS
The main conclusions of this chapter are as follows:
1) Response rates should be reported for each phase of data collection in amulti-phase effort and an overall response rate should be reported thatreflects the cumulative effects of nonresponse at each phase.
2) Overall response rates should be calculated using the Council ofAmerican Survey Research Organizations (CASRO) definition, whichtakes into account cases whose eligibility was never determined.
3) Response rates should be reported for both households and persons.
4) A household should be classified as complete when data are obtainedfor the majority of the eligible persons; a person should be classified ascomplete if data are obtained for a designated set of critical items.
Two-phase surveys. The first recommendation applies to surveys thatinclude a preliminary phase of data collection during which sample householdsare contacted to determine their eligibility and to enlist their cooperation in themain data collection effort. In many travel surveys, the preliminary phase iscarried out by telephone, and the main phase is carried out through somecombination of mail and telephone. It is important in such two-phase studiesto report separate response rates for each phase of data collection. In addition,

CHAPTER 1
1–2 NONRESPONSE IN HOUSEHOLD TRAVEL SURVEYS
however, a cumulative response rate should be reported that reflects thecombined impact of nonresponse at both phases of data collection.
The formula. The second recommendation concerns the formula by whichoverall response rates should be calculated and the treatment of cases whoseeligibility is unknown. Below we describe the recommended procedure forcalculating response rates in detail.
The unit of measurement. The third recommendation concerns the unit formeasuring response rates. In many travel surveys, data are to be collected forall eligible persons within a sample household. In such cases, response ratesshould be reported for both households and persons. We describe theprocedures for doing so in detail below.
Standards for completed cases. The final recommendation concernsstandards for treating households or persons as completed cases. When dataare to be collected for several persons within a sample household, thehousehold should be treated as complete if data are obtained for the majority ofeligible persons in the household. Similarly, a person should be counted ascomplete only if data are obtained for all critical items sought.
1.2 INTRODUCTION
SELECTING A SURVEY SAMPLE
The objective of a sample survey is to obtain information on the behavior orattitudes of an entire population of units by gathering information on arepresentative sample of units drawn from that population. The process ofdrawing a representative sample consists of three main steps:
identifying the target population (the collection of units of interest to the survey),
selecting or developing a sampling frame (a listing of units that includesthe target population), and
drawing a representative sample of units from that frame.
Target population. In surveys of travel behavior, there are often two relatedtarget populations. The first usually consists of all persons residing within aspecified set of geographic boundaries who meet the age requirements of thesurvey. The second typically includes all households located within thoseboundaries with one or more age-eligible persons. Households are generallydefined as groups of people who live together in a housing unit. In most

MEASURING AND REPORTING NONRESPONSE
NONRESPONSE IN HOUSEHOLD TRAVEL SURVEYS 1–3
definitions, including that of the U.S. Bureau of the Census, group quarters,such as dormitories and nursing homes, do not qualify as housing units.
Some travel surveys adopt the Census Bureau definition of a household. Others rely on slightly different criteria to determine the eligibility of a housingunit. Travel surveys should, however, adopt the same definition to the extentpossible to ensure comparability of results across surveys. The Census Bureaudefinition is the recommended convention for these purposes since it is themostly widely used definition and its use will allow for accurate comparisonswith Census data.
According to that definition, a housing unit is a house, apartment, mobilehome, group of rooms, or single room that is occupied (or if vacant, isintended for occupancy) as a separate living quarter. To qualify as a housingunit, the occupants must live and eat separately from other persons in thebuilding and have direct access to their unit from the outside of the building orthrough a common hallway. A family, one person living alone, two or morefamilies living together, and any other group of related or unrelated personssharing such living arrangements qualify as households. Travel surveys shouldrely on this definition unless other criteria are necessary to meet the objectivesof the study.
Sampling frame. Once the target population is identified, the next step in theprocess is to select or develop a sampling frame. The sampling frame for asurvey will depend on such factors as the target population, the mode of datacollection, and the sampling unit. When data are collected by telephone andthe sampling unit is the household or persons living within households, thesampling frame often consists of all listed residential numbers within the surveyarea or all telephone numbers within exchanges in that area. When data arecollected by personal interview, the frame often consists of a listing ofresidential units within the survey area.
Sample selection. The final step of the process is the selection of arepresentative sample from the sampling frame. The procedures used in thisstep will depend on the goals of the survey. Smaller subpopulations may beoversampled, for example, if a goal of the survey is to carry out analyses withineach subpopulation.
Documentation. Since the procedures adopted in the various steps of thesample selection process will affect interpretation of the survey data and theresponse rates, the documentation for a survey should include information onthe target population, the sampling frame, and the sampling procedures,including any information relevant to the interpretation of the data or theresponse rates. In a telephone survey, for example, the documentation should

CHAPTER 1
1–4 NONRESPONSE IN HOUSEHOLD TRAVEL SURVEYS
Recommendation
indicate whether the sampling frame included business or unassigned numbersand whether such numbers were eliminated through some method ofprescreening before the sample was fielded.
RECORDING THE OUTCOMES OF THE FIELD EFFORT
Response Rates
Response rates measure a survey’s level of success in obtaining informationfrom all eligible units in the sample. Invariably, some members of the sampledo not provide the desired information. There are many reasons why therelevant information may not be obtained.
Typically, some members of the sample are ineligible for the study. In fact,some of the sample selections may turn out not to exist! For example, in atelephone sample, some of the randomly generated numbers that make up thesample may not be actual telephone numbers at all; these are commonlyreferred to as unassigned or nonworking numbers. Other numbers may bethe numbers of fax machines. Still others may be linked to households thatfall outside the survey area.
Other reasons for failing to obtain complete data include the refusal by somemembers of the sample to take part in the study, failure to locate or contactsample members, and language barriers or physical limitations.
Given the wide range of potential outcomes of a data collection effort, it isimportant to establish rules for tracking and summarizing the success of asurvey in collecting data from the members of the sample.
TRACKING THE OUTCOMES OF A FIELD EFFORT—Establish a system of result codes for trackingthe outcomes of the field effort.
Result Codes/Screening Phase. To illustrate the range of possibleoutcomes for an individual member, we display in Table 1.1 typical “result”or “disposition” codes from surveys relying on randomly generated telephonenumbers for their samples. These codes are for the initial, or “screening,”phase of a survey conducted to identify households eligible to receive a moredetailed questionnaire or travel diary in the second phase of data collection.
Codes 01 to 08 cover situations in which a screening interview isnever attempted. The first five codes are assigned to different types ofnonworking or nonresidential numbers; the remainder cover othersituations in which the screening interview was never started.

MEASURING AND REPORTING NONRESPONSE
NONRESPONSE IN HOUSEHOLD TRAVEL SURVEYS 1–5
Codes 09 to 11 cover what are commonly called “screener refusals.” Screener refusals are telephone numbers that may be attached to ahousehold with one or more eligible members, but no one is willing toprovide the information to complete the screener.
Codes 12 to 15 describe four scenarios in which the screener iscompleted. Code 12 is for cases in which all members of the householdare ineligible for the main questionnaire. The final three codes (13 to15) cover situations in which the screener is completed and an eligiblemember is identified.
Table 1.1Result Codes for Households in a Telephone Survey Sample
DISPOSITION CODE
NO SCREENER ATTEMPTED NO SCREENER ATTEMPTED Business/government number 01 Institutional residence 02 Other non-residence 03 Verified fax/modem line 04 Nonworking telephone number 05 Number changed to new number 06 Closed out after multiple attempts to contact 07 Other 08
SCREENER REFUSALSSCREENER REFUSALS
Refused screening Hang up prior to screening Screening terminated before completion
091011
SCREENER COMPLETEDSCREENER COMPLETED
No eligible household members Eligible members consent Eligible members refuse Eligible members with language barriers, or physical or mental limitations
12131415
Table 1.2 (below) displays a similar set of outcome codes for householdsscreened by personal interview. As in the previous example, the first set ofcodes, codes 01 to 06, cover situations in which a screening interview is neverattempted. Codes 01 to 02 are for sample addresses that turn out to benonresidential, while codes 03 to 05 cover vacant and inaccessible dwellings,and households where no one is home at the time of the interviewer’s visit. Asin the earlier example, the second set of outcome codes are for screenerrefusals, and the last set covers households completing the interview.

CHAPTER 1
1–6 NONRESPONSE IN HOUSEHOLD TRAVEL SURVEYS
Table 1.2Result Codes for Households Screened by Personal Interview
DISPOSITION CODE
NO SCREENER ATTEMPTED NO SCREENER ATTEMPTED
Business address
Other non-residence
Household not accessible
Vacant dwelling
Closed out after multiple attempts to contact (not at home)
Other
01
02
03
04
05
06
SCREENER REFUSALSSCREENER REFUSALS
Refused screening
Screening terminated before completion
07
08
SCREENER COMPLETEDSCREENER COMPLETED
No eligible household members
Eligible members consent
Eligible members refuse
Eligible members with language barriers, or physical or mental limitations
09
10
11
12
Table 1.3 summarizes the procedures used to report outcomes andnonresponse rates in a number of recent personal travel surveys. Each of theorganizations carrying out the surveys uses its own system of outcome codesand its own method for computing response rates. Since the systems andmethods vary from organization to organization, the response rates cannot becompared in a meaningful way. As a result, it is impossible to evaluate therelative effectiveness of the data collection procedures used by the differentorganizations, and the relative quality of the data collected. Such evaluationsrequire use of standard reporting procedures.

CHAPTER 1 MEASURING AND REPORTING
NONRESPONSE
Table 1.3Methods for Reporting Nonresponse in Some Recent Travel Surveys
SURVEY FIRM STUDY TYPE OF SAMPLE RESPONSE RATE REPORTED COMMENTS
E.H. White & Co. 1990 Bay Area Travel Surveys RDD Final resp rate=C/Rec Rec = Recruited
Total resp rate=C/Elig + Inadequate Completes
Elig = Eligible
C = Completes
= Completes +
= Final Refusals
Recruited + Initial Refusals
Not clear about UK (unknowns)
NuStats Eugene/Springfield Area Study RDD Recruitment rate=Rec/E Rec = Recruited
Medford Completion rate=C/Rec Elig = Known Eligible
ODOT Salem/Portland Resp rate=C/E + Final Refusals
Salem/Keizer = Elig + e * UK
C = Completes
E = Estimated Eligible
= Rec + C + Breakoffs
Portland eligibility
Vancouver = Elig/Inelig
Triangle Travel Behavior Survey = Disconnects+
where UK = Unknown
e = Eligibility rate
Inelig = Ineligibles
Deaf/Language+ Business/gov’t + out of area
AMPG 1991 Southern California RDD Participation rate=Rec/HH HH = number of householdsOrigin-Destination Survey Completion rate=C/Rec Rec = Recruited
C = Completes
Barton-Ashmon MAG Regional Planning Survey RDD Completion Rate=C/SC C = Useable CompletesSC = Initial Screening Contacts
MEASURING AND REPORTING NONRESPONSE
NONRESPONSE IN HOUSEHOLD TRAVEL SURVEYS 1–9
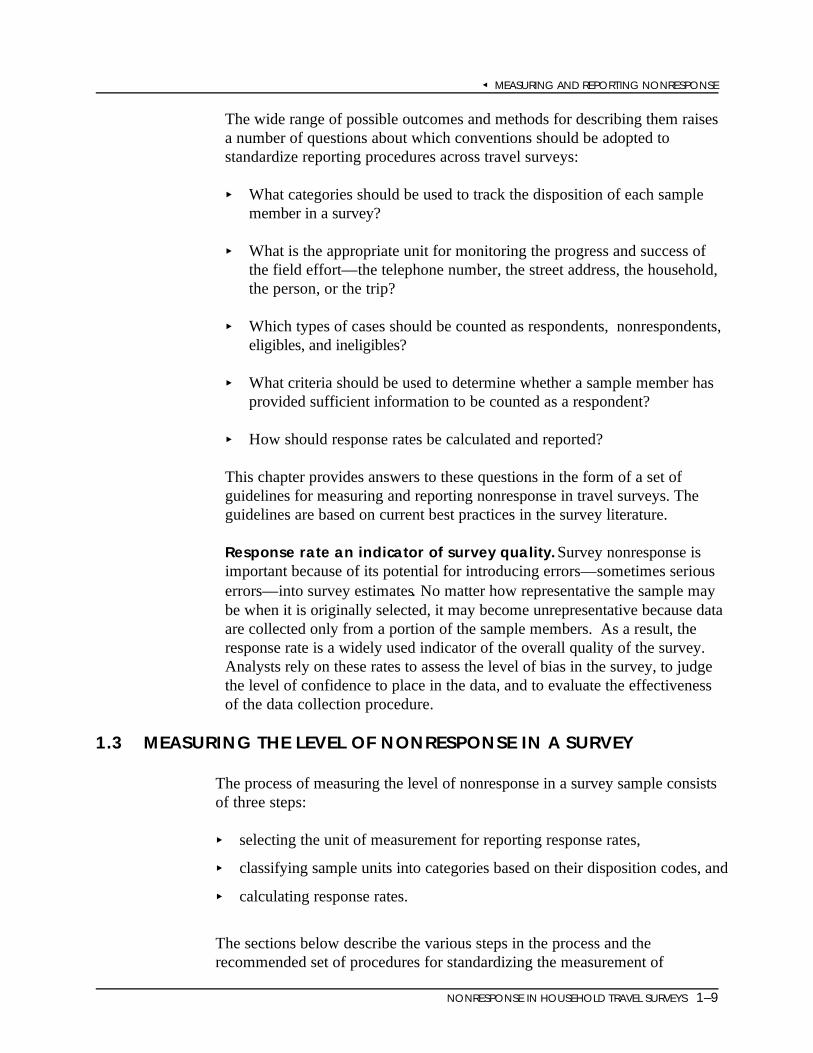
The wide range of possible outcomes and methods for describing them raisesa number of questions about which conventions should be adopted tostandardize reporting procedures across travel surveys:
What categories should be used to track the disposition of each samplemember in a survey?
What is the appropriate unit for monitoring the progress and success ofthe field effort—the telephone number, the street address, the household, the person, or the trip?
Which types of cases should be counted as respondents, nonrespondents,eligibles, and ineligibles?
What criteria should be used to determine whether a sample member hasprovided sufficient information to be counted as a respondent?
How should response rates be calculated and reported?
This chapter provides answers to these questions in the form of a set ofguidelines for measuring and reporting nonresponse in travel surveys. Theguidelines are based on current best practices in the survey literature.
Response rate an indicator of survey quality. Survey nonresponse isimportant because of its potential for introducing errors—sometimes seriouserrors—into survey estimates. No matter how representative the sample maybe when it is originally selected, it may become unrepresentative because dataare collected only from a portion of the sample members. As a result, theresponse rate is a widely used indicator of the overall quality of the survey. Analysts rely on these rates to assess the level of bias in the survey, to judgethe level of confidence to place in the data, and to evaluate the effectivenessof the data collection procedure.
1.3 MEASURING THE LEVEL OF NONRESPONSE IN A SURVEY
The process of measuring the level of nonresponse in a survey sample consistsof three steps:
selecting the unit of measurement for reporting response rates,
classifying sample units into categories based on their disposition codes, and
calculating response rates.
The sections below describe the various steps in the process and therecommended set of procedures for standardizing the measurement of

CHAPTER 1
1–10 NONRESPONSE IN HOUSEHOLD TRAVEL SURVEYS
Recommendation
nonresponse across travel surveys. If these guidelines are routinely followed,they will allow for meaningful comparisons of response rates from survey tosurvey and from organization to organization.
1.4 SELECTING THE UNIT OF MEASUREMENT
Most personal transportation surveys attempt to collect travel data for alleligible persons within sample households. The travel data sought from eachperson may encompass multiple trips. As a result, response rates can bereported for any of several units of measurement--the household, the person,the trip or activity. At each level, the response rates can reflect any of severalstandards for defining a unit as a responding unit. At the household level, forexample, one could count the household as complete if data are obtained for atleast one person in the household; at the other extreme, one could count thehousehold as complete if data are obtained for every eligible person. (TheNational Personal Transportation Survey adopts a middle position, counting ahousehold as complete if data are obtained for the majority of eligible persons.)
When data are to be collected from all eligible household members, responserates should be reported for two units of measurement—the person and thehousehold. The sections below describe how this should be done.
UNITS OF MEASUREMENT FOR RESPONSE RATES—When data are collected from multiple householdmembers, track and report response rates for both households and persons.
1.5 CLASSIFYING UNITS INTO CATEGORIES
Once the unit of measurement has been selected, the next step in the process isto classify all units in the sample into a set of categories based on theirdispositions at the close of the field period. The counts of units in the variouscategories serve as the data for computing response rates in the final step ofthe process.
CLASSIFICATION LEVELS AND CATEGORIES
Figure 1.1 shows the various categories required for response ratecomputations. The categories correspond to four levels of classification,identified by Roman numeral in Figure 1.1. The first two levels apply to allunits in a sample. The third and fourth level are reserved for units who wereeligible to participate in the survey. Information from the first three levels isused to compute response rates. Information from the fourth level is oftenused to evaluate how various aspects of the survey’s design contribute to the

ELIGIBILITYUNKNOWN
CompleteUnits
ESTIMATEDELIGIBLEUNITS
ELIGIBLEUNITS
IncompleteUnits
INELIGIBLEUNITS
ESTIMATEDINELIGIBLE
UNITS
BreakoffsRefusals Noncontacts Others
ELIGIBILITYKNOWN
TOTALUNITS IN
THE SAMPLE
I
II
III
IVEligible Ineligible
MEASURING AND REPORTING NONRESPONSE
NONRESPONSE IN HOUSEHOLD TRAVEL SURVEYS 1–11
overall level of nonresponse in the sample. The categories in all four levels aredescribed below.
Figure 1.1Required Categories for Response Rate
Computations

CHAPTER 1
1–12 NONRESPONSE IN HOUSEHOLD TRAVEL SURVEYS
The classification process begins with all units in the sample. The total units inthe sample is defined as the number of units fielded, or in other words, thenumber of units where attempts to collect data are made. In some cases, thisnumber will be less than the number of units drawn from the sampling frame. In telephone surveys, for example, the numbers are often prescreened forbusiness numbers before they are released to the field. In this case, the totalunits in the sample refers to all numbers remaining in the sample afterprescreening. In many surveys, extra units are drawn from the sampling frameand held in reserve to ensure the availability of a sufficient number of units tosatisfy the sample size requirements of the survey. The extra units are releasedto the field only if the yield from the base sample is less than expected. Again,the total units in the sample refers to the number of units released to the field.
In transportation surveys with two phases of data collection—an initialscreening and recruitment phase, and a subsequent phase for collecting detailedtravel data—the total units in the sample will differ across the two phases. Inthe initial phase, the total units will include all cases fielded during screening; inthe second phase, it will include all cases eligible for follow-up. In suchdesigns, the classification of units detailed below is carried out separately forthe two phases of data collection. Thus, a household that completes the initialscreener (and is classified as a respondent in the initial phase) may decline tocomplete the detailed travel diary (and be classified as a nonrespondent in thesecond phase).
LEVEL I: Eligibility Known vs. Eligibility Unknown
Some travel surveys, such as intercept studies of transit use, select theirsamples directly from the target population. Since all units in these samplesbelong to the population under study, the eligibility of the individual units isknown before data collection begins.
But more often than not, travel surveys select their samples from populationsand sampling frames that include units that do not belong to the targetpopulation. The eligibility of selected units must then be determined as part ofthe data collection process. Most surveys rely on a “screening” interview toidentify the subset of units who qualify, but, as a rule, not all units in thesample are successfully screened in the process. Some units are never reached,despite repeated attempts. Others refuse to complete the screening interview. As a result, the eligibility of some units remains unknown at the close of thefield period. The first level of the classification system distinguishes betweenthose units and all other units whose eligibility is known by the end of thesurvey.

MEASURING AND REPORTING NONRESPONSE
NONRESPONSE IN HOUSEHOLD TRAVEL SURVEYS 1–13
The relative number of units in the eligibility unknown category will depend onsuch factors as the length of the field period, the callback limit (maximumnumber of contact attempts per sample unit), the efficiency of the contactingprocedures, and the properties of the sampling frame. Longer field periods,higher callback limits, and efficient calling protocols tend to reduce the relativesize of this category.
LEVEL II: Eligible vs. Ineligible Units
The second level of classification draws the distinction between units that areeligible to participate in the survey and units that are not. A unit’s eligibility fora particular survey depends on the survey’s definition of the target population. Units satisfying that definition are eligible, while all others are not. Travelsurveys, like most other surveys, tend to include units of both types.
The relative number of eligible and ineligible units in a travel survey willdepend on the properties of the sampling frame and on the relative size of thetarget population. Samples of randomly generated telephone numbers, forexample, tend to yield higher proportions of ineligible units than other types ofsamples. Ineligible units in telephone samples typically include nonworkingnumbers, business and government numbers, numbers outside the survey area,and numbers for households with no eligible members. Ineligible units insamples based on household listings, on the other hand, tend to includedemolished or unoccupied dwellings and households whose members fail tomeet the eligibility requirements.
When a survey includes both a screening step and a more detailed datacollection step, eligibility is usually defined differently for the two steps. If thescreening is done by telephone, an unit eligible for the screening interview isany working residential number in the exchanges that define the samplingframe. If the screening is done in person, an eligible unit is any occupieddwelling unit in the designated areas. More stringent criteria may apply to thedetailed data collection. Units may have to meet geographical or otherrequirements to be retained for the collection of detailed travel data.
Some travel surveys report the number of units in each ineligibility category forpurposes of evaluating the quality and properties of the sampling frame. Because response rate calculations treat all ineligibles the same, that level ofdetail is unnecessary for purposes of measuring nonresponse.
Estimated Eligibles vs. Estimated Ineligibles
The second level of classification also breaks down the eligibility unknowncategory into estimated eligibles and estimated ineligibles. The estimates are
CHAPTER 1
1–14 NONRESPONSE IN HOUSEHOLD TRAVEL SURVEYS
typically based on the relative proportion of eligible and ineligible units in therest of the sample.
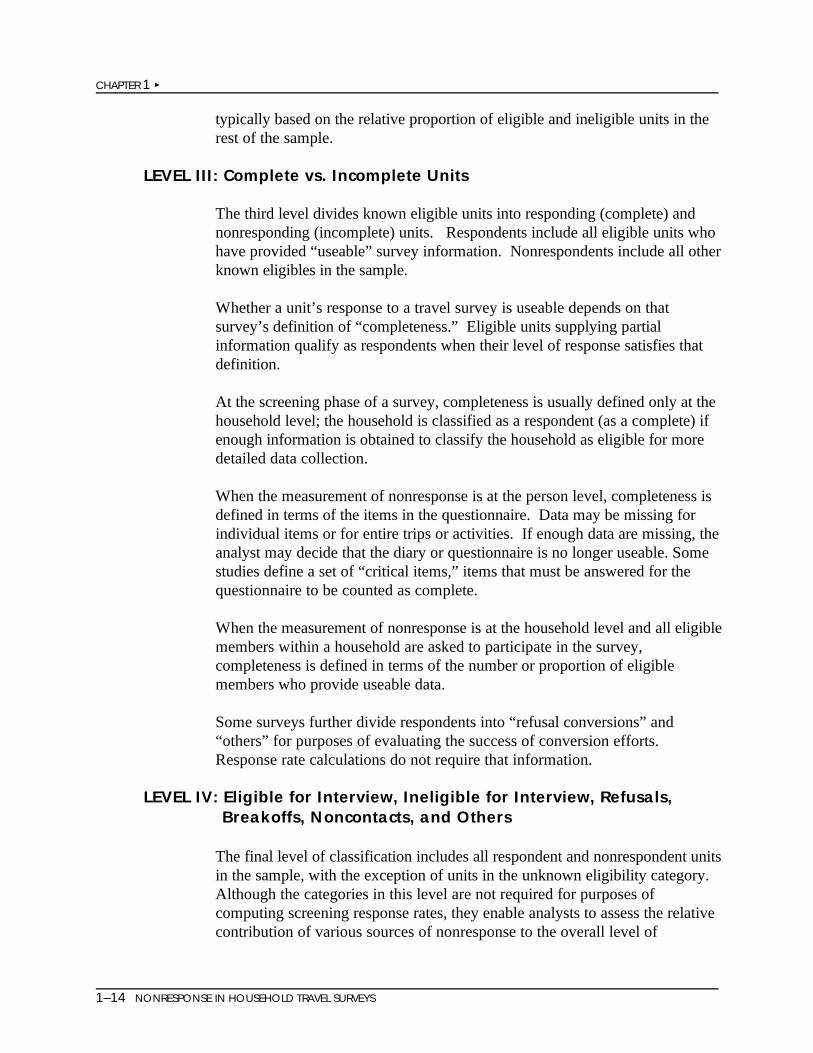
LEVEL III: Complete vs. Incomplete Units
The third level divides known eligible units into responding (complete) andnonresponding (incomplete) units. Respondents include all eligible units whohave provided “useable” survey information. Nonrespondents include all otherknown eligibles in the sample.
Whether a unit’s response to a travel survey is useable depends on thatsurvey’s definition of “completeness.” Eligible units supplying partialinformation qualify as respondents when their level of response satisfies thatdefinition.
At the screening phase of a survey, completeness is usually defined only at thehousehold level; the household is classified as a respondent (as a complete) ifenough information is obtained to classify the household as eligible for moredetailed data collection.
When the measurement of nonresponse is at the person level, completeness isdefined in terms of the items in the questionnaire. Data may be missing forindividual items or for entire trips or activities. If enough data are missing, theanalyst may decide that the diary or questionnaire is no longer useable. Somestudies define a set of “critical items,” items that must be answered for thequestionnaire to be counted as complete.
When the measurement of nonresponse is at the household level and all eligiblemembers within a household are asked to participate in the survey,completeness is defined in terms of the number or proportion of eligiblemembers who provide useable data.
Some surveys further divide respondents into “refusal conversions” and“others” for purposes of evaluating the success of conversion efforts. Response rate calculations do not require that information.
LEVEL IV: Eligible for Interview, Ineligible for Interview, Refusals, Breakoffs, Noncontacts, and Others
The final level of classification includes all respondent and nonrespondent unitsin the sample, with the exception of units in the unknown eligibility category. Although the categories in this level are not required for purposes ofcomputing screening response rates, they enable analysts to assess the relativecontribution of various sources of nonresponse to the overall level of

MEASURING AND REPORTING NONRESPONSE
NONRESPONSE IN HOUSEHOLD TRAVEL SURVEYS 1–15
nonresponse in the sample. This information is often used to identify strengthsand weaknesses in the data collection procedures.
The number of categories in this level depends on the design and reportingrequirements of the particular survey. In travel surveys consisting of twophases of data collection, for example, respondents who have completed thescreening process are divided into two groups, those eligible for the maininterview and those not eligible for the main interview. It is often desirable todivide nonrespondents into “refusals to participate,” “breakoffs,” and “failuresto contact” for purposes of evaluating the effectiveness of recruitment andcontacting procedures.
Although the classification in Figure 1.1 includes four categories at Level IV,the number of categories may be expanded or collapsed to meet the evaluativeand reporting needs of the survey. The categories in Figure 1.1 are defined asfollows:
refusals are eligible units who declined to participate;
breakoffs are eligible units who began to provide data but failed tocomplete the survey;
noncontacts are eligible units who could not be reached;
others includes all other nonrespondents not included in the categoriesabove.
These same categories are suitable for survey designs that include a screeningand a main interview conducted at different points in time. Units included inthe sample for both phases of data collection would be classified in both datacollection efforts. For example, a case could complete the screener but refuseto take part in the main interview. Generally, of course, cases that werenonrespondents or ineligibles at the screening phase are not included in thesample for the main data collection.
The distinctions among categories in this level also depend on the conventionsadopted by the particular survey. In the next section, we provide guidelines forassigning units to categories in travel surveys.

CHAPTER 1
Many surveys subject such numbers to a verification process in which each number is called at various1
times during the day and evening on weekdays and weekends. If the number is consistently answered by fax ormodem, it is assigned to the ineligible category. If the number turns out to be a non-dedicated residential line,the household is screened in the normal way. If the verification process is still in progress at the end of the fieldperiod, the number is assigned to the eligibility unknown category.
1–16 NONRESPONSE IN HOUSEHOLD TRAVEL SURVEYS
Recommendation
Recommendation
CLASSIFICATION RULES
RULES FOR CLASSIFYING UNITS—The rules for assigning units to categoriesshould be consistent across travels surveys toallow for meaningful comparisons of responserates.
Unless the rules for assigning units to categories are consistent across surveys,the measures of nonresponse obtained in the studies will have differentmeanings. Below we discuss the set of recommended conventions forstandardizing the assignment of units to categories in travel surveys. Althoughthe examples are largely drawn from surveys in which the data are collected bytelephone, the rules are suitable for all types of travel surveys and for all modesof data collection, including mail, telephone, personal interview, and mixed-mode designs.
In a survey with an initial screening phase followed by the collection of detailedtravel data, the assignment of cases to categories must be carried out twice,once during each phase. Since the main data collection is generally restrictedto cases whose eligibility has been established, the steps dealing with thetreatment of cases whose eligibility is unknown may be irrelevant (or greatlysimplified) during the main data collection phase.
SURVEYS WITH A SCREENING PHASE—Units should be assigned two disposition codes when there is both a screening and main data collection phase.
1. During Screening, Assign Noncontacts to the Eligibility UnknownCategory (Level I)
Cases never contacted during screening should be assigned to the eligibilityunknown category, unless the eligibility of the unit can be reliably determinedin some other way. Numbers answered by a fax or modem, for example,belong in this category, unless their status as dedicated fax/modem or businesslines is established with some degree of certainty, in which case they belong inthe ineligible category. 1

MEASURING AND REPORTING NONRESPONSE
The household inaccessible disposition covers situations where the interviewer is unable to gain access2
to the housing unit most commonly because the unit is part of a secure building. Other cases that fall in thiscategory include units that are inaccessible due to natural disasters, such as floods and earthquakes.
NONRESPONSE IN HOUSEHOLD TRAVEL SURVEYS 1–17
Examples of noncontact dispositions typically reported in telephone travelsurveys are shown in Table 1.4.
Table 1.4Dispositions in the Eligibility Unknown Category
in Surveys Conducted by Telephone
DISPOSITIONS
NONCONTACTS DURING SCREENING Rings, no answer Busy signal Closed out after repeated attempts to contact Non-verified fax/modem line
Table 1.5 displays similar types of dispositions for surveys conducted bypersonal interview. Because cases whose eligibility is undetermined are not2
usually fielded for the main data collection, the eligibility unknown category islikely to be nonexistent or small during the main data collection.
Table 1.5Dispositions in the Eligibility Unknown Category
in Surveys Conducted by Personal Interview
DISPOSITIONS
NONCONTACTS DURING SCREENING No one at home Household inaccessible
2. Assign All Units Belonging to the Target Population to the EligibleCategory (Level II)
The assignment of units to the eligibility category should be based on thedefinition of the target population, rather than on the ability of the survey toaccommodate the special needs of persons within that population. Forexample, if the target population for a survey consists of all householdslocated within a one mile radius of a railway station, households that satisfythat definition but are unable to participate in the survey because of languagebarriers or other limitations should be assigned to the eligible category. Theineligible category should be reserved for units who do not belong to the targetpopulation. Examples of dispositions from the screening phase for personal

CHAPTER 1
1–18 NONRESPONSE IN HOUSEHOLD TRAVEL SURVEYS
travel surveys that belong in the ineligible category are shown in Table 1.6. Examples of units ineligible for the main data collection are also shown there.
Table 1.6Ineligible Units in Telephone Surveys
DISPOSITIONS
SCREENING PHASESCREENING PHASE Nonworking/Unassigned telephone number Number changed to new number Institutional residence/Group quarters Business/government number Other non-residence Disconnected number Verified fax/modem line
MAIN DATA COLLECTION PHASEMAIN DATA COLLECTION PHASE Screened residence, out of study area Screened residence, unit does not qualify
3. Define Respondents in Terms of a Set of “Critical Items” (Level III)
During the screening phase, households are defined as respondents (completes)according to whether they provide enough information to classify thehousehold as eligible for the main data collection.
During the main data collection, both persons and households may be classifiedas respondents according to whether they provide useable information. At theperson level completeness should be defined in terms of a set of critical itemsthat must be answered for a case to be classified as a respondent. The set ofcritical items should include all questions that are essential to accomplishingthe major goals of the survey. In travel surveys, critical items typically includequestions about travel behavior and questions about the determinants of thatbehavior.
Although the items designated as critical will depend in part on the goals of theparticular survey, all travel surveys should include the following set as coreitems for defining completeness at the person level, unless they play only aminor role in the survey:
Employment status (employed full-time, part-time, or not employed)
A geocodable home address
Total number of trips during the survey period
Information on each trip:

MEASURING AND REPORTING NONRESPONSE
NONRESPONSE IN HOUSEHOLD TRAVEL SURVEYS 1–19
Recommendation
a) purpose of the trip, b) addresses or identifiable place names for theorigin and destination of the trip, c) travel time, d) mode of transportation,e) names of all household members on the trip, and f) number of non-household members on the trip.
In recent years, there has been a growing trend towards conducting activity-based surveys. In such surveys, the critical items would include a set ofessential items for each activity rather than for each trip.
Items that typically play a less central role in analysis of travel data, such as themake and model of the automobile, and fees paid for parking, should not beused to establish completeness at the person level unless they are an integralpart of the particular survey. In that case, they should be added to the listabove as should any other items that are critical to accomplishing the goals ofthe survey.
The purpose of these rules for defining completeness at the person level is toensure comparability of response rates across surveys. They are not intended toset a standard for how the data should be analyzed. In some situations, thecriteria for determining which cases to include in an analysis may differ fromthose discussed above.
SURVEYS WITH A SCREENING PHASE—Units should be assigned two disposition codes when there is both a screening and main data collection phase.
4. During the Main Data Collection, Classify Households asRespondents If Useable Data Are Obtained from the Majority ofEligible Members and for All Critical Items Sought at the HouseholdLevel (Level III)
When multiple persons within a household are asked to provide detailed data,completeness at the household level can be defined in at least three distinctways: 1) households could be counted as respondents if useable data areobtained from all eligible members, 2) households could be counted asrespondents if useable data are obtained from the majority of eligible members,and 3) households could be counted as respondents if useable data are obtainedfrom at least one eligible member. The definition used can make a substantialdifference in the reported response rate. For example, the NationwidePersonal Transportation Survey (NPTS) uses the second criterion treatinghouseholds as complete when data are obtained for most of the eligiblehousehold members. Within those households, however, data are not obtainedfor some 7 to 10 percent of the eligible persons. If the NPTS adopted the firstcriterion instead of the second, the reported household response rate would be

CHAPTER 1
1–20 NONRESPONSE IN HOUSEHOLD TRAVEL SURVEYS
lower by 5 percent or more. The second definition—that is, countinghouseholds in which useable data are obtained for the majority of eligiblemembers—is the recommended procedure. However, data obtained fromhouseholds in which the majority of members did not respond should not bediscarded. Those data may be useful for some analytical purposes.
For a household to be classified as a respondent, the following critical itemsmust also be obtained:
Total number of persons in the household
Number of vehicles
Number of workers in household
Household composition (age, sex, and relation to head of each person, pluswhether each person has a driver’s license)
A mailing address if diaries will be sent to the household.
This requirement is in addition to the requirement that a majority of householdmembers provide useable information at the person level.
5. Assign Nonrespondents to Categories According to the Reason forTheir Nonparticipation (Level IV)
During each phase of data collection, all eligible units who declined toparticipate should be assigned to the refusal category. Units who providedpartial information but did not complete the interview should be classified asbreakoffs for that phase of data collection. Eligible cases that could not bereached (including answering machines that were determined to be ofhouseholds) should be classified as noncontacts.
6. Assign Nonrespondents with Language Barriers or OtherLimitations to the “Others” Category (Level IV)
All nonrespondents who were unable to participate because of languagebarriers or other limitations should be assigned to the “others” category.
AN APPLICATION OF THE CLASSIFICATION SYSTEM TO TRAVEL DATA
In this section, we apply the classification system to data from a fictitiousstudy—the Anytown, USA Travel Survey—to illustrate how units are assignedto categories based on their disposition codes. In the next section, we use thecounts in the various categories to illustrate the calculation of response rates. We begin by describing the design and purpose of the Anytown, USA TravelSurvey.

MEASURING AND REPORTING NONRESPONSE
NONRESPONSE IN HOUSEHOLD TRAVEL SURVEYS 1–21
The Anytown, USA Travel Survey. The Anytown Travel Survey (ATS)was designed to provide up-to-date information on travel activities andpatterns in the Anytown area. The target population for the survey consistedof households in three counties—K, L, and M. A household was definedaccording to the U.S. Bureau of the Census definition.
The sampling frame for the study consisted of listed and unlisted telephonenumbers in the survey area. The numbers were generated using a random-digitdialing (RDD) procedure and drawn in proportion to their concentration in thevarious parts of the survey area. The survey also included an oversample oftransit users. The oversample was drawn from telephone numbers collectedduring an intercept survey of that subpopulation.
Data collection consisted of two phases, a preliminary screening/recruitmentinterview and a data retrieval interview. Both interviews were conducted bytelephone. The purpose of the screening interview was to determine theeligibility of the household, to secure the cooperation of eligible members, andto collect background information on the household. The purpose of theretrieval or main interview was to collect travel and activity information fromthe eligible units who agreed to participate during the screening interview. Inbetween the first and second interviews, all cooperating households wereassigned activity and travel days and provided with diaries for recording theirbehavior.
Classification of Units in the Anytown, USA Travel Survey. The finaldispositions of all 12,568 units in the screening sample are shown in Table 1.7. The unit of measurement is the household. The units are sorted into three broadcategories—eligible ( A ), ineligible ( B ), and eligibility unknown ( C )—based ontheir final dispositions. The eligible category for the screening phase includes sixdifferent dispositions:
eligible completes ( a ) are households who provided useableinformation for the screening phase and met the eligibility requirements forthe main data collection phase;
ineligible completes ( b ) are households who completed the screeninginterview, but failed to qualify for the main data collection phase becausethey lived outside of the study area, etc.;
refusals ( c ) are households who refused to complete the screeninginterview;
terminations/breakoffs ( d ) are households who terminated thescreening interview sometime after their eligibility was determined, butbefore the interview was completed;

CHAPTER 1
1–22 NONRESPONSE IN HOUSEHOLD TRAVEL SURVEYS
respondents not reached, including residential answeringmachines ( e ) are households who could not be reached during thescreening phase either because no one was ever at home or because thephones were consistently answered by machine or voice mail;
deaf or language barriers ( f ) includes households who were eligiblebut unable to participate in the survey because of language barriers or otherlimitations.
Table 1.7Sample Dispositions in the Screening Phase for Households
in the Anytown, USA Travel Survey
DISPOSITION FREQUENCYELIGIBLE UNITS Complete Units 2,777 (a) Eligible completes 329 (b) Ineligible completes (outside of study area, other) Incomplete Units Refusals 4,078 (c) Terminations/breakoffs 60 (d) Respondent not reached (including household answering 300 (e) machines) Deaf or language barriers 213 (f) TOTAL 7,757 (A)
INELIGIBLE UNITS Unassigned/Nonworking numbers 2,000 Disconnected numbers/Number changed 1,902 Business/Government numbers 455 Institutional/Group quarter/Other non-household residence 100
TOTAL 4,457 (B)
ELIGIBILITY UNKNOWN UNITS No answer after repeated callbacks 256 Busy signal on every call 98 TOTAL 354 (C)
TOTAL NUMBER OF UNITS IN THE SAMPLE 12,568 (D)
The ineligible category, on the other hand, includes: unassigned or nonworkingnumbers; disconnected, business, and government numbers; numbers thatchanged or were out of the survey area; numbers of institutional, groupquarters, or other non-household residences; and non-household numberswhere answering machines were reached. The unknown eligible categoryincludes units that were never contacted.

MEASURING AND REPORTING NONRESPONSE
NONRESPONSE IN HOUSEHOLD TRAVEL SURVEYS 1–23
Figure 1.2 shows how the screening dispositions in Table 1.7 translate intothe categories of the classification system. The number of units in the eligibleand ineligible categories in Table 1.7 have been summed to yield the count ofunits in the eligibility known category ( A + B ) in Figure 1.2. The eligibilityunknown category ( C ) has been divided into estimated eligible ( CE ) andestimated ineligible units ( CI ) by multiplying the count in the unknowncategory by the proportion of eligible units in the eligibility known part of thesample.
Units in the eligible category ( A ) have been divided into completes ( a + b )and incompletes ( c + d + e + f ) according to whether they completed thescreening phase of the survey. Incompletes have been further divided intorefusals ( c ), breakoffs ( d ), respondents not reached ( e ), and others ( f ). Units who terminated the interview before completion were placed in the“breakoffs” category. Units who were unable to participate in the first phaseof the survey because of language barriers or deafness were assigned to the“others” category.
(Figure 1-2 on following page.)

EligibilityUnknown
(C)354
CompleteUnits(a+b)3,106
EstimatedEligible Units
(CE)225
Eligible Units(A)
7,757
IncompleteUnits
(c+d+e+f)4,651
IneligibleUnits(B)
4,457
EstimatedIneligible
Units(CI)129
Breakoffs(d)60
Refusals(c)
4,078
Noncontacts(e)300
Others(f)
213
EligibilityKnown(A+B)12,214
Total Units inthe Sample
(D)12,568
I
II
III
IVEligible
(a)2,777
Ineligible(b)329
CHAPTER 1
1–24 NONRESPONSE IN HOUSEHOLD TRAVEL SURVEYS
Figure 1-2Classification of Units in the Screening Phase
of the Anytown USA Travel Survey
Table 1.8 shows the outcomes of the main data collection phase of the study. The 2,777 eligible households who completed the screening interview areretained for the main data collection effort. Of these, 1,716 completed themain data collection. Fewer categories are required to summarize the outcomeof the field effort for the main data collection phase because the eligibility ofthe households in the main sample was established in the first phase of datacollection. Of course, it is possible that some of the households retained forthe second phase of data collection could have been ineligible (because theywere misclassified during screening or because their eligibility changedbetween the completion of the screening interview and main data collection).

MEASURING AND REPORTING NONRESPONSE
NONRESPONSE IN HOUSEHOLD TRAVEL SURVEYS 1–25
Recommendation
Table 1.8Sample Dispositions in the Main Data Collection Phase
for Households in the Anytown, USA Travel Survey
DISPOSITION FREQUENCY
ELIGIBLE UNITS Respondents 1,716 (a) Refusals 776 (c) Breakoffs/Partial data 115 (d) Household not reached 75 (e) Other 95 (f )
TOTALTOTAL 2,777 (A)
INELIGIBLE UNITS Screened out 329 Other ineligibles 0
TOTALTOTAL 329 (B)
1.6 CALCULATING RESPONSE RATES
FORMULA FOR COMPUTING RESPONSE RATES—Travel surveys should follow the CASRO standards forcomputing response rates.
Once all units have been classified, it is relatively easy to calculate componentresponse rates for each phase of data collection and an overall response ratefor the survey as a whole. The procedures recommended by the Council ofAmerican Survey Research Organizations (CASRO) are described below [1]. The formulas are suitable for all modes of data collection, including telephone,mail, and personal interview.
CALCULATING COMPONENT RESPONSE RATES
The recommended procedures for reporting response rates in two-phasesurveys consisting of a screening and a main interview follow the CASROstandard for breaking down the overall response rate into two componentparts, one for each phase of data collection. To avoid confusion between thetwo phases of data collection, we will use the subscript 1 to indicate countsfrom the screening phase of the study (e.g, a , b , A ) and the subscript 2 to1 1 1
indicate those from the main interview phase. In terms of our classificationscheme of Table 1.7, the response rate for the preliminary or screening phase

RR1
a1 b1
A1 CE1
.
RR2
a2
A2
.
RR RR1 x RR2 .
ER1
A1
A1 B1
,
RR1
CHAPTER 1
In telephone surveys relying on randomly generated telephone numbers this method will tend to3
overestimate the number of eligibles in the eligibility unknown category. Nonetheless, CASROrecommends this method in the absence of any better method for providing comparable estimates acrosssurveys.
1–26 NONRESPONSE IN HOUSEHOLD TRAVEL SURVEYS
( ) is defined as the number of respondent units ( a + b ) over the total1 1
number of eligible units in the sample (A + CE ):1 1
The response rate for the main interview or second phase of the survey issimilarly defined as the number of units completing the interview ( a ) over the2
number of known eligibles units ( A ) in the sample:2
The first response rate measures the survey’s success in screening the entiresample. The second reflects the survey’s success in interviewing all knowneligible units in the sample. When the two rates are multiplied together, theyyield the overall response rate, an indicator of the survey’s success inmeasuring the entire sample:
CALCULATING THE OVERALL RESPONSE RATE
The overall response rate is generally defined as the proportion of eligiblemembers in the sample for whom complete data are obtained. This is thewidely cited definition recommended by CASRO and the standard that shouldbe followed in travel surveys.
One difficulty arises in applying this definition—how to deal with units whoseineligibility was never determined. When there are cases of unknowneligibility, CASRO recommends estimating the total number of eligible unitsbased on the proportion found to be eligible among those units whoseeligibility was determined. First, the eligibility rates ( ER ) must be found. 3
For the first stage of data collection, the eligibility rate is:
ER2
A2
A2 B2
.
RRa2
ER2 x ER1 x D1a2
ER2 x [A1 (ER1 x C1)],
a2
ER2 (A1 CE1),
MEASURING AND REPORTING NONRESPONSE
NONRESPONSE IN HOUSEHOLD TRAVEL SURVEYS 1–27
Recommendation
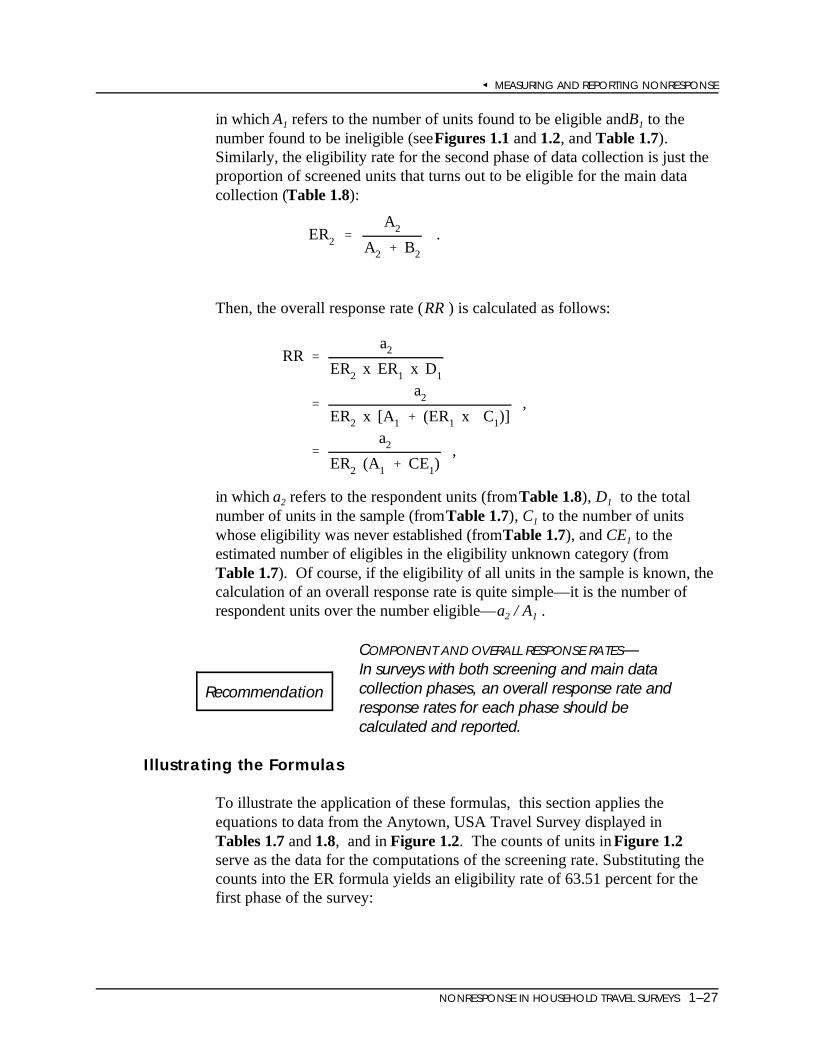
in which A refers to the number of units found to be eligible and B to the1 1
number found to be ineligible (see Figures 1.1 and 1.2, and Table 1.7). Similarly, the eligibility rate for the second phase of data collection is just theproportion of screened units that turns out to be eligible for the main datacollection (Table 1.8):
Then, the overall response rate ( RR ) is calculated as follows:
in which a refers to the respondent units (from Table 1.8), D to the total2 1
number of units in the sample (from Table 1.7), C to the number of units1
whose eligibility was never established (from Table 1.7), and CE to the1
estimated number of eligibles in the eligibility unknown category (from Table 1.7). Of course, if the eligibility of all units in the sample is known, thecalculation of an overall response rate is quite simple—it is the number ofrespondent units over the number eligible— a / A .2 1
COMPONENT AND OVERALL RESPONSE RATES—In surveys with both screening and main datacollection phases, an overall response rate andresponse rates for each phase should be calculated and reported.
Illustrating the Formulas
To illustrate the application of these formulas, this section applies theequations to data from the Anytown, USA Travel Survey displayed in Tables 1.7 and 1.8, and in Figure 1.2. The counts of units in Figure 1.2serve as the data for the computations of the screening rate. Substituting thecounts into the ER formula yields an eligibility rate of 63.51 percent for thefirst phase of the survey:

ER1known eligibles
known eligibles known ineligibles
A1
A1 B1
7,75712,214
63.51% .
ER2
A2
A2 B2
2,7773,106
89.41% .
RR final completesestimated total number of eligibles
a2
ER2 x (A1 CE1)1,716
89.41% x (7,757 225)24.04% .
RR1total number of respondent units
estimated total number of eligible sample unitsa1 b1
A1 (C1 ER1)3,1067,982
38.91% ,
CHAPTER 1
1–28 NONRESPONSE IN HOUSEHOLD TRAVEL SURVEYS
That is, an estimated 63.51 percent of the numbers in the sample were working residentialnumbers. Similarly, the eligibility rate for units that were screened is:
Multiplying the screening eligibility rate ( ER ) by the number of units in the1
eligibility unknown category ( 354 ) provides the estimate of the total numberof eligible units in the unknown category. Note the 225 shown in Figure 1.2refers to the total number of units eligible to be screened.
The overall response rate for the survey (RR) can then be computed in thefollowing way:
Since the overall rate can also be derived from the component rates, thecalculations above are unnecessary when separate response rates are computedfor the screening and retrieval phases of the survey.
From the counts in Figure 1.2 and Table 1.7, the response rate for thescreening phase is 38.91 percent,
while the response rate for the main phase of data collection is 61.79 percent(see Table 1.8):

RR2respondents
known eligibles
a2
A2
1,7162,777
61.79%.
MEASURING AND REPORTING NONRESPONSE
NONRESPONSE IN HOUSEHOLD TRAVEL SURVEYS 1–29
Recommendation
Multiplying these component rates together ( 38.91 x 61.79 ) yields 24.04 percent,the overall response rate for the survey as a whole.
WEIGHTED VS. UNWEIGHTED RATES
WEIGHTING—When the units in a sample have been drawn withunequal probabilities, it is necessary to weight the data in computing response rates.
One complication arises when the units in the sample are not selected with the sameprobability of selection. Some personal transportation surveys use samples in whichall of the units are selected with the same probability. It is not generally necessaryto weight the data from such samples. However, most travel surveys use designs inwhich members of different subgroups are selected at different sampling rates [2]. For example, in a multi-county survey, households from one county may beselected at a higher rate than households in the other counties. Similarly, the NPTSoversamples certain types of telephone numbers to increase the proportion that areworking residential numbers. When the sample is not selected with equalprobabilities, the data must be weighted to produce accurate estimates for thewhole population of interest. In such designs, the cases may be weighted by thereciprocals of their selection probabilities. For example, a case with a selectionprobability of 1/1000 would receive a weight of 1000. (Chapter 3 discusses theweighting process in greater detail.)
Tables 1.9 and 1.10 below illustrate how weights can be calculated and why theyshould be used. In this fictitious example, the survey area encompasses threecounties, one of them urban (County Y) and two of them rural (Counties X and Z). The sample includes a higher proportion of numbers from the rural counties thanfrom the urban county.
Table 1.9Hypothetical Sample Selected with Unequal Probabilities
SAMPLE POPULATION SELECTION AVERAGE RESPONSECOUNT SIZE SIZE PROBABILITY DAILY TRIPS RESPONDENTS RATES
Y
X X 220 55,000 1/250 3.25 132 60.0%
Y Y 700 350,000 1/500 2.80 350 50.0%
ZZ 300 75,000 1/250 3.20 195 65.0%

CHAPTER 1
1–30 NONRESPONSE IN HOUSEHOLD TRAVEL SURVEYS
In this simplified example, we assume that residents of Counties X and Z weresampled at twice the rate as the residents of County Y . (It is common to“oversample” smaller population subgroups in this way, so that there areenough cases to carry out separate analyses for each subgroup.) Theresponse rates differed in the three counties, with a lower response rate in themore urban County Y area. In addition, residents of the two rural countiesappear to make more trips per day on average than their counterparts inCounty Y. Unless weights are applied to the data, the estimates will be biasedin the direction of the rural areas.
The data in Table 1.10 illustrate how weights can be calculated to compensatefor the oversampling of the rural counties relative to County Y. In the firststep, we calculate an initial weight for each case that is the reciprocal of theselection probability. For example, cases in County Y were selected with aprobability of 1/500; as a result, these cases receive an initial weight of 500. Then, in the next step, the weights are adjusted to compensate for differencesacross counties in the response rates. The initial weight is divided by theresponse rate to produce this adjusted weight. In County X, for instance, casesreceive an adjusted weight of 416.67 (=250/.60). Notice that the sums of theweights are close to the population sizes. (In the example, the onlydiscrepancy arises from rounding error.) The 350 cases in County Y each geta weight of 1000, for a total of 350,000. Collectively, the cases in each countynow receive a weight proportional to—in fact, equal to—the countypopulation.
Table 1.10Weights for Hypothetical Sample
COMPLETED POPULATION INITIAL ADJUSTED SUM OFCOUNT CASES SIZE WEIGHT WEIGHT WEIGHTY S
X X 132 55,000 250 416.67 55,000
Y Y 350 350,000 500 1000.0 350,000
ZZ 195 75,000 250 384.62 75,001
The weighted and unweighted statistics generally differ. In this example, therespondents from County X reported a total of 429 trips (132 respondents x anaverage of 3.25 trips). Similarly, those from County Y reported 980 trips (350 x2.80) and those from County Z reported 624 trips (195 x 3.20). In total, then,there were 2,033 trips reported by the 677 respondents, for an unweightedaverage of about 3.00. By contrast, the weighted average is given by

VWiVi
Wi
,
53.5% (132x250) (350x500) (195x250)(220x250) (700x500) (300x250)
.
MEASURING AND REPORTING NONRESPONSE
NONRESPONSE IN HOUSEHOLD TRAVEL SURVEYS 1–31
where V is the value of the variable of interest—in this case the number ofi
daily trips—for respondent i -- and W is that respondent’s adjusted weight. i
The weighted average comes to 2.91, a number that is closer to the average forCounty Y than the unweighted average. This reflects the fact that the CountyY cases had the largest weights.
When the data are weighted, it raises the issue of whether to use weighted orunweighted data in calculating the response rates. Most statisticians agreethat weighted rates give a better indication of the likely impact of nonresponseon the final survey estimates.
To calculate weighted response rates, the sum of the weights for the cases in agiven category is used in place of the raw count. For example, a in theresponse rate formula would be the sum of the weights for the respondentunits, rather than the raw number. The initial weight (prior to the adjustmentfor nonresponse) must be used to calculate the weighted response rate.
We can illustrate the computation of a weighted response rate using the datafrom Table 1.10. In this example, the overall unweighted response rate is 55.5percent (677 respondents over 1220 selections). The weighted rate issomewhat lower at 53.5 percent: The numerator represents the sum of theweights for the respondents in each county (there were, for example, 132respondents from County X, each with an initial weight of 250); thedenominator represents the sum of the weights for the eligible selections.

NONRESPONSE IN HOUSEHOLD TRAVEL SURVEYS 2–1
2.
REDUCING NONRESPONSE
2.1 CHAPTER SUMMARY
This chapter describes the potential consequences of nonresponse in householdtravel surveys and recommends methods for reducing the level of nonresponse. It covers three main topics:
Respondent and interviewer characteristics associated with nonresponse;Procedures that can reduce the level of nonresponse; andProcedures that can reduce the level of missing data in otherwise completequestionnaires.
As is customary, we distinguish between two forms of nonresponse—unitnonresponse and item nonresponse. Unit nonresponse refers to the failure toobtain questionnaires or data collection forms (such as the travel diaries used inmany household travel surveys) for a member of the sample. Item nonresponserefers to the failure to obtain a specific piece of information from a respondingmember of the sample. Item nonresponse is often used interchangeably withthe term missing data. This chapter contains recommendations for reducingthe levels of both forms of nonresponse. Because most household travelsurveys use some combination of telephone and mail data collection, it focuseson nonresponse issues for those modes of data collection.
MAJOR RECOMMENDATIONS
The chapter includes a large number of major recommendations based onresearch findings in the survey and transportation literatures, and on expertopinion in those fields. We summarize them here, grouping them by topic.
Interviewer Recruitment and Training
Identify and utilize those interviewers and field supervisors who areespecially good at converting reluctant participants.
Use bilingual interviewers when the sample includes a substantial portion ofnon-English speakers.
Questionnaire Design

CHAPTER 2
2–2 NONRESPONSE IN HOUSEHOLD TRAVEL SURVEYS
Make the flow of questions in a self-administered questionnaire or diaryclear by following the natural inclination of the respondents (e.g., to readfrom left to right) and by using graphical devices to emphasize the intendedpath.
Field Work
Whenever possible, send out an advance letter to members of the sample,explaining the purpose of the study.
Carry out multiple follow-ups—at least eight calls per number in atelephone survey and at least three follow-ups in a mail survey.
Select a schedule that optimizes the timing of the contact calls given thelength of the field period and the characteristics of the sample. Wheneverthe length of the field period is relatively short, select a schedule thatattempts to produce an early contact through an intensive calling effort.
Vary the appeals in a mail survey, using a special appeal on the thirdfollow-up attempt.
Use small prepaid monetary incentives, unless participation is especiallyburdensome, in which case use larger monetary incentives conditional onparticipation and commensurate with the level of burden.
Sampling
Allow proxy respondents if they are likely to have the information sought.
Subsample the remaining cases if the response rate is unsatisfactory and thebudget is running out.
In addition, the report mentions several valuable procedures that are oftenconsidered standard survey practice. These include:
Training interviewers about the purpose and sponsorship of the study, andproviding prescripted answers to common questions about the survey;
Including a brief description of the study in introduction to thequestionnaire;
Translating the questionnaire and all other survey materials when asubstantial portion of the sample speaks a language besides English;

REDUCING NONRESPONSE IN TRAVEL SURVEYS
NONRESPONSE IN HOUSEHOLD TRAVEL SURVEYS 2–3
Pretesting the field procedures;
Pretesting the questionnaire to improve its clarity and estimate its length; and
Placing sensitive questions at the end of the questionnaire.
Although all these procedures are effective for improving response rates, thequestion arises as to whether they are cost-effective. In some cases, studieshave examined the impact of a particular procedure—such as the use ofincentives—on the total costs of the study. The results suggest that incentivesreduce costs by increasing the proportion of the sample responding to earlycontacts. In other cases, cost data are not available. Still, many of theprocedures we recommend are quite inexpensive. An advance letter, forinstance, is unlikely to add much to the total cost of data collection, but canhave a substantial effect on response rates. Moreover, if the goal is to gatherdata for a fixed number of persons or households, it may be cheaper to followup more extensively with fewer sample members than to start with a largersample but accept a lower response rate. The recruitment of bilingualinterviewers, the translation of questionnaires when a large proportion of thetarget population does not speak English, the design of user-friendly datacollection forms, multiple follow-ups by mail or telephone, and the use ofproxies (when they are likely to have the information being sought) are allrelatively inexpensive steps that are likely to produce a reasonable payoff interms of reduced nonresponse rates. Adopting special methods to converthard-core nonrespondents, on the other hand, will also improve response rates,but it is likely to be costly if the number of nonrespondents in the sample islarge. In such situations, a more cost-effective approach is to subsamplenonrespondents and use special methods to obtain a high response rate in thesubsample.
ORGANIZATION OF THE CHAPTER
The chapter begins by describing the characteristics of sample members whotend to be nonrespondents in travel and other surveys. As part of thatdiscussion, it offers specific recommendations for improving their participationrates. The next section discusses characteristics of effective interviewers andstrategies for selecting interviewers with desirable characteristics. Theremainder of the chapter is devoted to a more general discussion of the variousmethods for reducing unit and item nonresponse.
Throughout the chapter recommended procedures for reducing nonresponseare enclosed within boxes following the text that discusses them. Whether aprocedure applies to face-to-face, mail, or telephone surveys is indicated by thesymbols, , , or , respectively.

CHAPTER 2
2–4 NONRESPONSE IN HOUSEHOLD TRAVEL SURVEYS
2.2 RESPONDENT CHARACTERISTICS
Certain sample members are less likely than others to take part in a survey. Intravel and other surveys, these individuals tend to include:
the mentally and physically handicapped,
individuals with language barriers,
individuals with limited literacy skills,
the less well educated,
the elderly, and
urban dwellers.
The reasons for the lower participation rates of some of these groups are clear. Individuals with visual difficulties, for example, are unlikely to complete a self-administered questionnaire if the print is too small for them to see. Individualswith language barriers, on the other hand, are unlikely to participate in a surveyunless it is conducted in their native language. But apart from such obviousrelationships, very little is known about the ways in which, and the extent towhich, membership in these groups affects participation largely because directinformation on nonrespondents is difficult to obtain.
Information on nonrespondents is important for three reasons. First, it can beused to assess the level of bias in the data due to the exclusion orunderrepresentation of certain segments of the population. Second, it can beused to reduce nonresponse to the extent that the survey can be tailored toaddress the needs and concerns of the nonrespondent groups. Enlarging theprint size of a self-administered questionnaire, for example, is likely to increasethe participation rate of elderly individuals who often fail to completequestionnaires because they have difficulty reading small print. Third, it canbe used to assess the potential payoff of tailoring the survey to specific groups.If the group represents a small portion of the population, the cost of thetailoring effort may outweigh the benefits. However, if the group includes asignificant portion of the population, the benefits are likely to be substantial.
The sections below discuss what is currently known about nonrespondents and,on the basis of that information, offer specific recommendations for improvingtheir response rates.
THE MENTALLY AND PHYSICALLY HANDICAPPED

REDUCING NONRESPONSE IN TRAVEL SURVEYS
NONRESPONSE IN HOUSEHOLD TRAVEL SURVEYS 2–5
Recommendation
A significant portion of the U.S. population have mental or physical handicapsthat may prevent them from participating in a survey depending on what itrequires of them [1]. About 7 percent of the adult population report troubleseeing standard newspaper print even with corrective lenses, a factor that islikely to affect their participation in surveys involving self-administered questionnaires. Roughly the same percent have trouble hearing what anotherperson says in a normal conversation, and, as a result, may have difficultyparticipating in surveys conducted by telephone. Another 3 percent indicatethey have a learning disability. As discussed below, these individuals are likelyto have difficulty completing a self-administered questionnaire.
REDUCING NONRESPONSE DUE TO VISUAL DIFFICULTIES —Use of a font size of 12 points or more for all writtenrespondent materials if the sample is likely to includeelderly individuals or persons with visual difficulties.
INDIVIDUALS WITH LIMITED LITERACY SKILLS
According to the National Adult Literacy Survey, the English literacy skills ofnearly one-fourth of the U.S. adult population are extremely limited [1]. Thisportion of the population is able, at best, to read and understand writteninformation when it is brief and uncomplicated. About 19 percent of theseindividuals who are at the lowest level of literacy report visual difficulties thatinterfere with their ability to read printed material. Nearly 25 percent ofindividuals with poor literacy skills are immigrants who may have limited skillsin English. Almost two-thirds have less than a high school education. Another9 percent report having a learning disability. As a whole, individuals at thislevel of literacy are likely to have difficulty completing all but the simplestquestionnaires and, in some cases, even that will be beyond their ability to readand process material written in English.

CHAPTER 2
2–6 NONRESPONSE IN HOUSEHOLD TRAVEL SURVEYS
Recommendation
Recommendation
REDUCING NO NRESPONSE DUE TO LIMITED LITERACY SKILLSIN ENGLISH—Prepare all written respondent materials at the lowestreading grade level possible. Ask all questions as simplyas possible, make instructions easy to understand, andfollow recommended procedures for questionnaire design(page 2-14). Have a group of experts evaluate thereadability of all documents, including self-administeredquestionnaires, travel diaries, advance letters,correspondence, and all other materials read byrespondents.
INDIVIDUALS WITH LANGUAGE BARRIERS
The ethnic and racial composition of the U.S. population has changed rathermarkedly in recent years [1]. The portion of the population who are of Hispanicorigin, for example, grew from about 6 to 9 percent over the past decade, whilethe percent of individuals of Asian or Pacific Islander descent rose from about 1to 2 percent in the same period. Recent data also indicate that nearly 10 percentof adults in the U.S. were born in other countries or in U.S. territories, and thatroughly 17 percent speak a language other than English. With these changes inthe composition of the population, surveys are likely to encounter even largernumbers of individuals with limited proficiencies in English who are unable toparticipate unless the survey is conducted in their native language.
REDUCING NONRESPONSE DUE TO LANGUAGE BARRIERS—Whenever the size of a non-English-speaking subgroup isexpected to exceed 5 percent of the population understudy and the sample is expected to include 150 or moremembers of the subgroup, translate the survey instrumentsand materials into the appropriate language. Whetherthe interview is conducted in person or by telephone, usebilingual interviewers who are fluent in English and in theother language.
THE LESS WELL EDUCATED
Individuals with fewer years of formal schooling tend to participate in surveys atlower rates than the rest of the population [2]. That the less well educated tendto be less proficient in English is likely to contribute to their lower participationrates.

REDUCING NONRESPONSE IN TRAVEL SURVEYS
NONRESPONSE IN HOUSEHOLD TRAVEL SURVEYS 2–7
Recommendation
Recommendation
IMPROVING THE RESPONSE RATE OF THE LESS WELLEDUCATED—Follow the recommended guidelines for persons withlimited literacy skills in English.
THE ELDERLY
There is considerable evidence in the literature that elderly individuals participatein surveys at lower rates than individuals in other age groups [2,3]. There issome support in the literature that visual and hearing problems, which tend to bemore prevalent in the elderly, account for the lower response rates of this group.The lower participation rates may also be related to years of formal educationand literacy level, both of which tend to be lowest in the elderly population.
In transportation studies, the lower completion rates of the elderly are probablydue, at least in part, to their lower rates of travel. Anecdotal informationsuggests that the elderly frequently fail to fill out or return travel diaries becausethey either have no trips to report or feel that the survey is not relevant to them.
IMPROVING THE RESPONSE RATE OF THE ELDERLY —Follow the guidelines for persons with limited literacy skillsand persons with visual difficulties. In contacts withrespondents, stress the importance of collectinginformation from everyone in the sample, includingpersons with no or few trips to report.
URBAN DWELLERS
Individuals living in densely populated areas are less likely to participate insurveys than individuals living in rural and other less populated areas regardlessof whether the survey is conducted by mail or telephone [2]. This pattern isclearly reflected in data from the 1995 Nationwide Personal TransportationSurvey shown in Table 2.1. In that survey, which was conducted by telephone,response rates in smaller, less densely populated areas—such as Utica andElmira, New York—were about three times as high as rates in denselypopulated areas—such as the New York City boroughs of Queens andManhattan. As a whole, response rates exhibited a linear relationship withpopulation density. As density decreased, the relative proportion of samplemembers taking part in the survey increased.

CHAPTER 2
2–8 NONRESPONSE IN HOUSEHOLD TRAVEL SURVEYS
Recommendation
Table 2.1Response Rate by Population Density for Selected Areas
in the States of New York, Massachusetts, and Oklahoma
DENSITY * RESPONSE RATE
20239 14.512594 23.311058 25.0 6887 21.9 2496 24.7 1733 27.5 780 30.5 629 30.8 560 33.6 332 32.6 106 44.4 103 35.1 90 50.9 87 42.1 83 49.0 57 38.8 54 43.0 46 51.1 38 44.4
*Number of persons per square kilometer
IMPROVING THE RESPONSE RATE OF URBAN DWELLERS —In addition to following the general guidelines for interviewertraining and selection, instrument design, and fieldprocedures: (1) delay rostering household members untilthe end of the screening interview (page 2-14), (2) acceptproxy reports of basic background information (page 2-31), (3) use interviewers especially good at converting thereluctant, (4) optimize timing of contact calls, and (5)allow for multiple follow-up attempts (page 2-17).
OTHER GROUPS OF NONRESPONDENTS IN TRAVEL SURVEYS
In addition to the groups above, nonrespondents in travel surveys tend to include [4]:
couples with young children, single parents, individuals who hold multiple jobs,and other busy or hard-to-reach individuals, such as 18 to 24 year-olds, and

REDUCING NONRESPONSE IN TRAVEL SURVEYS
NONRESPONSE IN HOUSEHOLD TRAVEL SURVEYS 2–9
Recommendation
individuals who lack the community or civic ties (e.g., renters), which oftenmotivate participation in travel surveys.
The participation of these and the other nonrespondent groups can often beimproved through use of special methods, such as increased incentive amountsand special appeals. Such methods are discussed in “Special Methods forReducing Nonresponse,” pages 32-33 of this chapter.
2.3 INTERVIEWER CHARACTERISTICS
In most surveys, some interviewers are more successful than others in securingthe cooperation of sample members. The extent of these differences varies fromsurvey to survey depending on the group of interviewers included in the effort. In one telephone survey, for example, the most successful interviewer achieveda response rate of 94 percent while the least successful interviewer achieved arate of 58 percent. In two other telephone surveys, response rates for individualinterviewers ranged from about 72 to 90 percent and from about 63 to 95percent. While response rates vary considerably among interviewers, ratesachieved by individual interviewers tend to be remarkably consistent acrosssurveys; interviewers with certain characteristics tend to be more effective thanothers at recruiting sample members.
This section summarizes what is known about the relationship betweeninterviewer characteristics and response rates. This information is important forpurposes of reducing nonresponse to the extent that interviewers can be selectedor trained to have characteristics associated with high response rates.
INTERVIEWER EXPERIENCE
One of the most consistent findings in the literature is that more experiencedinterviewers achieve higher response rates than less experienced interviewers. Since better interviewers typically stay at their jobs longer than poorerinterviewers, part of this effect is due to self-selection. However, noviceinterviewers tend to improve over time as they gain more experience in recruitingsample members, suggesting that effective strategies for recruiting samplemembers can be learned [2,5].
INTERVIEWER EXPERIENCE —To the extent possible, use experienced interviewers withstrong track records in recruiting sample members.

CHAPTER 2
2–10 NONRESPONSE IN HOUSEHOLD TRAVEL SURVEYS
Recommendation
INTERVIEWER GENDER
A number of studies in the survey research literature report a gender differencein response rates favoring female interviewers. A variety of explanations havebeen offered to account for this result. The explanation receiving the mostsupport is that males attain lower response rates because they have lessinterviewing experience, on average, than their female counterparts; male andfemale interviewers with the same level of experience tend to be equallyeffective in securing the cooperation of sample members [6].
INTERVIEWER EXPECTATIONS
Interviewer expectations appear to contribute to an interviewer’s level of successin securing the cooperation of sample members. Interviewers who perceive thetask of recruiting sample members as “moderately easy” are more successful atgaining cooperation than interviewers who believe the task is “moderatelydifficult ” [7]. That the task is probably easier for better interviewers could, however, account for this relationship between expectations and response rates.
INTERVIEWER STYLE OF INTERACTION
Other research indicates that successful interviewers tend to be more responsiveand adaptive than less successful interviewers. They are likely to address arespondent’s reluctance to participate in a survey in a confident and professionalmanner, and to adapt their approach to the situation as unexpected issues andproblems arise [8,9].
STYLE OF INTERACTION —Train interviewers in effective procedures for persuadingreluctant participants and averting nonresponse. Stressthe importance of using an adaptive approach thataddresses the concerns and objections of individualsample members.
INTERVIEWER VOCAL CHARACTERISTICS

REDUCING NONRESPONSE IN TRAVEL SURVEYS
NONRESPONSE IN HOUSEHOLD TRAVEL SURVEYS 2–11
Recommendation
The vocal characteristics of a telephone interviewer can have an impact onresponse rates. Research examining this relationship reveals the followingpatterns:
Interviewers who speak loudly, at a fast pace, and with a standard Americanaccent are likely to achieve higher response rates than interviewers withoutthose vocal characteristics [10].
Interviewers who use falling intonations (that is, a deeper pitch) on importantwords in the introductory statement are likely to achieve higher cooperationrates than interviewers who use rising intonations (a higher pitch) [10].
Interviewers who speak loudly and at a rapid pace with a standard accent andfalling intonations are perceived as being more competent and confident thaninterviewers with less effective vocal attributes [10].
These results are in accord with psycholinguistic research indicating thatindividuals who talk loudly and rapidly are thought to be more persuasive,confident, and credible than individuals who speak more slowly and softly. Astandard American accent may not be preferable for every sample; if the localpopulation has a special accent, interviewers who have the same accent mayachieve the highest levels of cooperation.
VOCAL CHARACTERISTICS —Consider the vocal characteristics of the candidate whenrecruiting interviewers for a telephone survey.
OTHER INTERVIEWER CHARACTERISTICS
Personal characteristics such as motivation, tenacity, and self-confidence are alsolikely to contribute to an interviewer’s level of success in securing samplemembers, but little research has been done in these areas.

CHAPTER 2
2–12 NONRESPONSE IN HOUSEHOLD TRAVEL SURVEYS
2.4 METHODS FOR REDUCING UNIT NONRESPONSE
This section of the report examines different steps in the conduct of a survey thatwill effect the final response rate obtained. It covers:
interviewer selection and training,
the design of the survey questionnaire,
the number of attempts made to contact members of the sample,
the timing of contact attempts,
pretesting the questionnaire and field procedures,
rules for selecting the respondent,
the use of respondent incentives,
proxy respondents,
special methods for converting nonrespondents, and
subsampling of nonrespondents.
Each section discusses practical measures that can be taken at each step toreduce the level of nonresponse.
INTERVIEWER SELECTION AND TRAINING
Interviewer selection. In both telephone and face-to-face surveys, theinterviewer plays a crucial role in contacting and enlisting the cooperation ofsample members. As a result, most survey organizations attempt to recruit asinterviewers persons who are likely to achieve high response rates. It is oftenthought to help, for example, if the interviewers are drawn from the samepopulation as persons from whom they will be trying to collect information. Insome surveys, the interviewers assigned to a specific member of the sample maymatch that member on race, sex, or other readily apparent demographiccharacteristics. The rationale for matching the interviewer and sample persons isnot always clear, but at least in one instance matching is likely to yield a highpayoff—when the sample includes a large proportion of members who are notnative speakers of English. In these cases, it is often essential to recruit bilingualinterviewers. Even when a translation of the questionnaire is available, abilingual interviewer is likely to be more successful at contacting and winning thecooperation of sample members who do not speak English well than aninterviewer who speaks only English.

REDUCING NONRESPONSE IN TRAVEL SURVEYS
NONRESPONSE IN HOUSEHOLD TRAVEL SURVEYS 2–13
Recommendation
Recommendation
Aside from the demographic characteristics of the interviewers, surveyorganizations may seek to recruit experienced interviewers or interviewers with aproven track record for achieving high response rates. In fact, some surveyorganizations maintain rosters of experienced interviewers who are especiallysuccessful at persuading reluctant sample members to take part in surveys. Suchspecialists are sometimes referred to as “converters;” they can play an importantpart in achieving a high overall response rate.
INTERVIEWER SELECTION —Identify and utilize those interviewers and field supervisors whoare especially good at converting reluctant participants.
Interviewer training. Interviewers must be thoroughly conversant with thestudy’s sponsor, aims, and purposes. They must be trained on these topics inorder to respond knowledgeably and confidently to the questions and objectionsof reluctant respondents. For this reason, most survey organizations train bothnew and experienced interviewers for each survey. The survey-specific trainingis likely to cover several topics related to nonresponse such as the following:
the purpose and sponsorship of the study,
the provisions for maintaining the confidentiality of the data,
relevant statutes authorizing the study,
answers to commonly-raised questions about the study and commonly-citedobjections to participation (see Appendix 1 for an example of such questionsand answers).
Sample members are more likely to agree to be interviewed when the topic isinteresting to them, the study is important, the sponsor is prestigious or is seenas a legitimate authority [10,11]. Aside from covering these basic topics, thetraining may explicitly describe techniques for averting nonresponse or forpersuading reluctant sample members to cooperate.
INTERVIEWER TRAINING —Train interviewers about the purpose and sponsorship ofthe study. Provide them with prescripted answers tocommon questions about the survey and to commonobjections to participating in a survey.

CHAPTER 2
2–14 NONRESPONSE IN HOUSEHOLD TRAVEL SURVEYS
Recommendation
DESIGN OF SURVEY INSTRUMENTS
The design of the questionnaires can have a large impact on the final responserates. In mail surveys, the questionnaire may be crucial in shaping samplemembers’ impressions of the study and thus play a major role in determiningwhether they take part. Even in a telephone interview, where the questionnaireis not visible to the respondent, the design of the questionnaire may still affectthe response rates.
Screening and recruitment scripts. In telephone screening and recruitmentinterviews, nonresponse often occurs within the first few seconds of theinteraction. Thus, the key questionnaire design variables may involve theintroduction to the questionnaire, the description of the study (including itspurpose and sponsorship), and whether a translation of the questionnaire isavailable for sample members who have difficulty with English. Most surveyorganizations use brief introductions that cover such information as the name ofthe survey interviewer, the company for which he or she works, the name of theagency sponsoring the survey, and the study’s purpose. In screening interviews(intended to identify persons eligible for more detailed data collection later on), itmay be necessary to obtain a roster listing all household members and to gatherinformation about each person. Respondents may be reluctant to give outdetailed information about each family member in the first few minutes of theinterview. In fact, some respondents may be reluctant even to list each person byname [13]. It may, therefore, be helpful to defer the rostering of householdmembers to the end of the screening interview, after a modicum of trust has beenestablished.
ROSTER OF HOUSEHOLD MEMBERS —Postpone the rostering of individual household membersuntil the end of the screening interview.
Self-Administered questionnaires and diaries. Additional design featuresare likely to become important with self-administered questionnaires and traveldiaries. Among these are the apparent length and difficulty of the questionnaires[11,14]. Aside from the actual number and content of the questions, severalfactors may affect the potential respondent’s estimate of the level of effortneeded to complete the instrument:
the sample members’ level of interest in the topic;
the use of photo reduction or other methods for reducing the apparent lengthof the questionnaire;

REDUCING NONRESPONSE IN TRAVEL SURVEYS
NONRESPONSE IN HOUSEHOLD TRAVEL SURVEYS 2–15
whether or not the questionnaire is attractively designed;
the flow and ease of following the instructions in the questionnaire;
the logical grouping and sequencing of questions by topic or chronology.
According to many survey experts, sample members are more likely to completethe questionnaire if the topic is interesting and if the questionnaire is short,attractive, and easy to follow [15]. The findings on the impact of the length ofthe questionnaire are, however, not completely consistent. According to onestudy, adding 20 questions to a questionnaire reduces response rates only by anaverage of 1 percent [11]; according to another study, questionnaires longer thanfour pages are likely to produce worse response rates—about 8 percentlower—than questions under four pages in length [14]. Another study comparingtravel diaries of different lengths found inconclusive results regarding the lengthof the diary [16]. In addition, efforts to make the questionnaire appear shortmay create problems. Reducing the type size used in the questionnaire maymake it difficult for some members of the sample to read; a substantial portion ofthe adult population reports difficulty in reading standard news print.
These and other results suggest that respondents are sensitive to a number offeatures of self-administered questionnaires, all of which contribute to their senseof the overall level of effort needed. If the questions are simple and theinstructions are easy to follow, respondents may be more willing to complete along questionnaire than a short, but difficult one [17]. Unfortunately, whatdesign features make it easy for respondents to complete a questionnaire is notwell-established. The design of survey questionnaires is still more of an art thana science. Survey designers have proposed a number of principles for the designof self-administered questionnaires [17]:
The questions should follow the natural reading order of the respondents(that is, in English, questions should flow from top to bottom and from leftto right);
Questionnaires should use familiar and easily-understood graphicalconventions (such as arrows indicating the next question), in which the samedesign element always cues the same action by the respondent;
The questionnaire should call attention to key information (via boldfacingand similar methods);
There should be a clear path for respondents to follow through thequestionnaire, and the graphical features should emphasize this path.
CHAPTER 2
2–16 NONRESPONSE IN HOUSEHOLD TRAVEL SURVEYS
Recommendation
Recommendation
Appendix 2 contains contrasting examples of sections from two versions of aquestionnaire. One version illustrates the application of the recommendedprinciples. The other version does not follow those principles.
Once again, if language barriers are likely to be an obstacle to participation,questionnaires in the appropriate languages should be used.
DESIGN OF SELF -ADMINISTERED QUESTIONNAIRES —Ask the questions as simply as possible and make theinstructions easy to follow. Use boldfacing and similarmethods to highlight key information. Use easily-understoodgraphic conventions to direct respondents, adopting areading path that follows established customs for thelanguage in which the questionnaire is written. In English,for example, make questions flow from top to bottom.
NUMBER AND TYPE OF CONTACTS
One of the clearest findings in the literature on nonresponse to surveys is theimportance of repeated contacts with sample members. In general, fewer thanhalf of all sample members return a questionnaire after the first mailing in a mailsurvey. Each additional follow-up contact is likely to yield additional returns[18]. Similarly, in the best telephone surveys, interviewers may attempt 8 to 10callbacks before giving up on a sample telephone number. One study estimatedthat more than 10 percent of the telephone sample was reached only after theeighth call [19]. We recommend allowing for at least eight calls in planning atelephone survey.
CALLBACK LIMIT—Allow for at least eight (8) callbacks per sample telephonenumber when conducting a telephone survey.
Advance letters. Many face-to-face and telephone surveys begin by sendingmembers of the sample prenotification, or advance, letters. Such letters aretypically signed by a non-controversial government official or some otherprestigious source; they explain the purpose of the study, describe theconfidentiality measures to be employed, and alert the sample member that he orshe will be contacted shortly by an interviewer. Advance letters accomplishseveral useful purposes. They help establish the legitimacy of the survey, inform potential respondents about the study’s purposes, allay concernsabout confidentiality, and serve as an introduction to the interviewer.

REDUCING NONRESPONSE IN TRAVEL SURVEYS
At the national level, about 70 percent of all residential numbers are listed in telephone directories. The1
percent of listed numbers tends to be lowest in urban areas (about 50 percent) and highest in rural areas.
NONRESPONSE IN HOUSEHOLD TRAVEL SURVEYS 2–17
Recommendation
Advance letters have also proved valuable in both mail and telephone studies. With mail surveys, studies suggest that an advance letter can be quite useful inobtaining cooperation, increasing response rates by an average of about 17percent [14]. Even with a telephone sample, it is possible to use advance lettersto boost response rates. If the sample is selected from residential lists ofnumbers, address information usually accompanies the sample telephonenumbers. If the telephone numbers are randomly generated, the sample ofnumbers can be matched to data bases with address information and advanceletters can be sent to numbers for which addresses are found. 1
Because of their proven success, advance letters have become common practicein household travel surveys in recent years.
ADVANCE LETTERS —Send out advance letters to sample members explaining thesponsorship, purpose, and relevance of the study. Stress theimportance of participation and the confidentiality of theresults.
Follow-up contacts. For mail surveys, some experts have recommendedspecific regimes of follow-up contact efforts. Dillman’s Total Design Method,for example, calls for an initial mailing and three follow-ups spread over a seven-week period [20]:
a reminder postcard after one week has elapsed;
a replacement questionnaire after four weeks; and
a second replacement questionnaire sent by certified mail.
Although it is not clear that this exact schedule must be followed, the literaturedoes indicate that multiple follow-ups can have a dramatic impact on the finalresponse rates obtained. One study concluded that each contact in a mail survey(including an advance letter) increased response rates by an average of about 11percent [11]. In line with Dillman’s prescriptions, the literature also suggeststhat a special third follow-up contact—such as a mailing by certified mail or atelephone contact—does boost the final response rates, with an estimated effect

CHAPTER 2
2–18 NONRESPONSE IN HOUSEHOLD TRAVEL SURVEYS
Recommendation
Recommendation
of about 7 percent [11]. In addition, first class mail and prepaid return postagemay increase response rates relative to bulk mail.
FOLLOW-UP CONTACTS IN MAIL SURVEYS —Allow for at least three follow-up contact attempts in amail survey. Change the appeal on each contract. Use aspecial procedure, such as a certified mailing, on the lastfollow-up attempt.
Length of the field period. One implication of the findings on the number ofcallbacks is that a high response rate will take time to achieve. Multiplecallbacks are only possible (and will only be productive) if the data collectionperiod is long enough. For example, the Total Design Method requires a fieldperiod of at least eight or nine weeks. Telephone surveys with eight or morecallbacks require a field period of similar length. Surveys that must becompleted too quickly to allow sufficient follow-up work are likely to have lowresponse rates.
LENGTH OF THE FIELD PERIOD —Whenever possible, make the field period long enough topermit multiple contact attempts for each member in thesample.
Respondent-initiated contacts. During the course of any survey, somerespondents inevitably have questions about the data collection instruments orother aspects of the survey. It is therefore good survey practice to provide atelephone hot line, toll free if possible, that respondents can call at most anytimeto obtain timely answers to their questions. The line should be answered bypersons who are fully conversant with the purpose and design of the survey, andespecially knowledgeable about the content of the questionnaires. A call-inservice of this type helps improve response rates and data quality by eliminatingmisunderstandings, resolving ambiguities, and allaying respondents’ concerns. It also helps establish the legitimacy of the survey. A website or e-mail addresscan serve a similar function for respondents with on-line capabilities.

REDUCING NONRESPONSE IN TRAVEL SURVEYS
For a discussion of how failures to screen sample members affect the overall response rate for a survey2
see the first chapter of this report.
NONRESPONSE IN HOUSEHOLD TRAVEL SURVEYS 2–19
RecommendationRESOURCES FOR RESPONDENTS —Establish a telephone hot line that respondents can callalmost anytime to obtain timely answers to their questionsabout the survey and its instruments.
TIMING OF THE CONTACT CALLS
Rationale. In telephone screening efforts, attempts to contact and determinethe eligibility of sample members usually reach a point of diminishing returnsafter which additional callbacks no longer produce significant gains in thenumber of sample members screened. The previous section offers someguidelines for determining the optimal number of callbacks for contacting samplemembers in travel surveys conducted by telephone. More often than not, otherconsiderations, such as the length of the field period and the availability ofresources, determine the callback limit adopted by a survey.
Whenever resources are limited, the survey’s level of success in screening theentire sample will largely depend on the timing of the contact calls. The mosteffective timing for a particular survey will depend on such factors as thesampling frame, the population under study, the length of the field period, andwhether the call is the first or a subsequent attempt to make contact with thesample member [21,22]. In most situations, and especially when resources arevery limited, the strategy that will lead to the highest response rate for thescreening phase is one in which the timing of the contact calls is designed tominimize the overall level of effort required to successfully screen samplemembers [23,24,25]. In calling protocols of this type, the times are selected to2
maximize the chances of a successful outcome such that the overall number ofcalls required to complete the screening effort is kept at a minimum. Examplesof such protocols are described below.
In situations where the length of the field period is especially short and there isnot enough time to contact sample members at optimal times, the callingprotocols must rely on other methods to maximize the response rate for thescreening phase. The most effective protocols for situations of this type attemptto produce an early contact through intensive calling efforts [26]. Usually theinitial contact call is scheduled for the first available time slot and followed up asquickly as possible with as many callbacks as time and resources allow. The

CHAPTER 2
2–20 NONRESPONSE IN HOUSEHOLD TRAVEL SURVEYS
Recommendation
most efficient protocols of this type attempt to optimize the timing of the firstand subsequent calls to the extent possible within the time constraints of thesurvey. At a minimum, they vary the times at which callbacks are attempted fora given case. An example of such a protocol is presented below.
TIMING OF THE CONTACT CALLS —Optimize the timing of the contact calls to the extentpossible, given the length of the field period and thecharacteristics of the sample.
Optimizing the Timing of Calls. Protocols that optimize the timing of thecontact calls vary in their complexity. Some are based on mathematical modelsor complex rules that require computer algorithms for their use. Others aredesigned for manual tracking and scheduling of calls. All are based on rulesintended to increase the efficiency of the screening phase by minimizing thenumber of calls required to successfully screen sample members.
Table 2.2 summarizes some of the most effective rules for optimizing the timingof contact calls in household telephone surveys. The extent to which these rulescan be applied in practice will depend on the resources and staffing capabilities ofthe survey organization, and on the amount of time available for the screeningphase of the survey.
The first entry in the table refers to situations where the sample is drawn from a framethat consists mostly or entirely of household telephone numbers. Since all or most ofthe units in the sample will be residential units, the optimal times to initiate contact insamples of this type are days and hours when adult household members are likely to beat home. Research findings confirm the commonly held belief that the likelihood ofreaching an adult member at home is highest on weekday evenings and weekends, andlowest on weekdays during daytime hours. Overall, weekday evenings tend to bemore productive than weekends. The relative productivity of the individual weekdayevenings tends to vary from study to study as does the relative productivity ofweekend mornings, afternoons, and evenings.

REDUCING NONRESPONSE IN TRAVEL SURVEYS
NONRESPONSE IN HOUSEHOLD TRAVEL SURVEYS 2–21
Table 2.2General Rules for Optimizing the Timing of Contact Calls
SAMPLE FRAME COLLECTION INITIAL CONTACT CALLBACKS
MODE OF DATA TIMING OF TIMING OF
Listed residential Telephone First available weekday evening First callback on a weekdaytelephone numbers or weekend time slot (defined evening or during a weekend
as a weekend morning, time slot, preferably on aafternoon, or evening) different evening or during a
different weekend time slot thanthe initial call.
Other callbacks may occur atany time.
Randomly Telephone First available weekday evening First callback on a weekdaygenerated or weekend time slot evening or during a weekendtelephone numbers time slot, preferably on a
different evening or during adifferent weekend time slot thanthe initial call.
Other callbacks may occur atany time.
At least one callback isscheduled during weekdaybusiness hours to screen outbusiness numbers remaining inthe sample
Randomly Telephone First available weekday First callback during eveninggenerated business hour time slot (defined hours on the day following thetelephone numbers Two-week field as a morning or afternoon) initial call.
period Second callback duringbusiness hours on the dayfollowing the first contact.
Subsequent callbacks rotatebetween evening and daytimeshifts.
Each unresolved case is calleddaily until the field period isalmost over.
Field period ends in anintensified effort to screen allremaining noncontacts.

CHAPTER 2
2–22 NONRESPONSE IN HOUSEHOLD TRAVEL SURVEYS
Recommendation
Recommendation
TIMING OF THE CONTACT CALLS FOR RESIDENTIALTELEPHONE NUMBERS —When the sample consists largely of residential telephonenumbers, schedule the contact calls for evenings andweekends.
The best time to schedule the second contact attempt in samples of this type isalso during evening and weekend hours, preferably in a different time slot (adifferent weekday evening or weekend morning, afternoon, or evening) than thefirst attempt. Subsequent callbacks can be scheduled for any available time slotsince the timing of calls appears to have little effect on the chances of asuccessful contact at this point in the screening process. When differences aredetected they favor evenings and weekends as the most productive calling times,and methods that vary the timing of the calls as the most productive protocols.
The productivity of these protocols, and those discussed below, can be improvedby using information collected during previous calls to optimize the timing ofsubsequent calls. In telephone surveys, for example, the person who answersthe phone may be able to provide information about when adult members of thehousehold are likely to be at home. To maximize the chances of a successfuloutcome, the next call should be scheduled accordingly.
USING INFORMATION COLLECTED DURING PREVIOUS CALLS —Use information collected during previous calls to optimizethe timing of subsequent calls.
Determining the optimal times for initial calls and callbacks for samples drawnfrom frames that include a relatively large number of nonresidential and otherout-of-scope units is more complicated since the optimal times for screening thevarious types of units in the sample will usually differ, and the effectiveness ofany given strategy will depend in part on the relative proportion of residentialand out-of-scope units in the sample. A variety of protocols have beendeveloped to handle samples of this type. Some protocols are clearly moreeffective than others, but research in this area is rather limited and the mosteffective methods for such samples have yet to be identified.
To illustrate the type of rules associated with the more effective methods in theliterature, Table 2.2 shows two protocols developed for screening samples ofrandomly generated telephone numbers. Both protocols were developed for thesame type of sample, but the rules they apply to control the timing of the callsare quite different. The first protocol gives priority to optimizing the times forhousehold units in the sample. It assumes that the field period is of sufficient

REDUCING NONRESPONSE IN TRAVEL SURVEYS
NONRESPONSE IN HOUSEHOLD TRAVEL SURVEYS 2–23
Recommendation
length to successfully apply this procedure. The second protocol gives priority toidentifying out-of-scope numbers. It attempts to optimize the timing of all callsto the extent possible in an intensive effort to screen all cases within a two-weektime frame. The protocol assumes that all telephone numbers identified asnonresidential numbers will be replaced with other randomly selected numbers,which must then be screened before the field period ends.
As mentioned above, the first protocol gives priority to screening the householdsin the sample. For the most part it follows the rules for screening samples ofhousehold units. It schedules the first and second calls for times when householdmembers are likely to be at home. At least one of the remaining callbacks isscheduled during business hours to screen out any business numbers remaining inthe sample.
The rationale behind this approach is threefold. First, priority should be givento contacting households in the sample since they are the units of primaryinterest. Second, most business and nonresidential numbers can be screened outby matching sample numbers against published business directories or throughrecorded messages or operator intercepts when calls are placed duringnonbusiness hours. Third, screening out nonresidential and nonworking numbersduring weekend and evening hours reduces the cost of the survey sincetelephone tolls tend to be lowest during those hours.
The second protocol, on the other hand, schedules initial calls during businesshours to expedite the identification of out-of-scope units so that interviewers willhave as much time as possible to screen replacement numbers. It schedules thefirst callback for the evening shift of the day following the initial contact toincrease the chances of finding household members at home during the secondcall. Subsequent callbacks rotate between daytime and evening shifts. Eachcase is called once daily until the end of the field period approaches. At that timethe field effort is intensified. Noncontacts are called more than once daily,sometimes within the same shift.
TIMING OF CONTACT CALLS FOR RANDOMLY GENERATEDTELEPHONE NUMBERS —Select a calling protocol that is likely to lead to the highestscreener response rate given the characteristics of thesample and the length of the field period.
If resources are available, response rates obtained with other protocols forrandomly generated numbers can be improved by ending the field period with anintensive calling effort of this type. Some methods used for this purpose include:1) rotating the case through all available shifts (weekday and weekend, daytimeand evening shifts) until a successful contact is made or the callback limit is

CHAPTER 2
Even though 20 to 30 percent of households within the United States have answering machines or3
voice mail attached to their telephone numbers, only a small percent of these households consistently usethe devices to screen unwanted calls.
2–24 NONRESPONSE IN HOUSEHOLD TRAVEL SURVEYS
Recommendation
Recommendation
reached, and 2) rotating the case through various time slots (morning,afternoon, and evening hours) within a particular shift, and continuing theprocedure in other shifts until the callback limit is reached or the eligibility of thecase is resolved [22]. In some protocols, the case may be called as often asevery hour.
ENDING THE FIELD PERIOD —When resources are available, end the field period with anintensive calling effort.
Special rules for telephone samples. To increase the efficiency andproductivity of the calling effort, protocols for telephone samples often adoptspecial rules for certain types of numbers answered by machine or voice mail,and numbers resulting in a busy signal.
Since the majority of numbers answered by machine or voice-mail eventuallyresult in a contact after repeated call attempts, most protocols treat such calls 3
as “no answers” and call the numbers again until the callback limit is reached. The exception to this rule is when the recorded message indicates that they arebusinesses, other non-residences, or non-working telephone numbers, in whichcase they are classified as such and no further attempts are made [27,28].
The optimal number of callbacks for numbers answered by recorded messagetends to be higher than that for other numbers and, as a result, some callingprotocols adopt a higher callback limit for these numbers. The optimal limit isabout ten calls, after which the chances of reaching a person are very small. Some protocols also adopt a special callback schedule that eliminates Saturdayhours from the calling routine since Saturdays are particularly poor days to reachhouseholds with answering machines [27,28].
CALLBACK LIMIT FOR NUMBERS ANSWERED BY MACHINE OR VOICE MAIL —Extend the callback limit to 10 when a number is consistentlyanswered by machine or voice mail. Schedule callbacks tothose numbers for days other than Saturdays.

REDUCING NONRESPONSE IN TRAVEL SURVEYS
NONRESPONSE IN HOUSEHOLD TRAVEL SURVEYS 2–25
Recommendation
Some protocols incorporate special rules for handling calls resulting in busysignals. The rules differ depending on whether a fast or regular busy signal isencountered. Callbacks for regular busy signals—tones that are interrupted at arate of 60 times per minute and indicate that the line is in use—are usuallyscheduled for 15 to 60 minutes after the signal is encountered since the chancesof reaching someone at home are typically highest during that period [29]. Callbacks for numbers resulting in a fast busy signal—tones that are interruptedat a rate of 120 times per minute and indicate difficulties due to storms or otherproblems, busy circuits in the calling area, or nonworking telephonenumbers—are usually scheduled at varying times during business and eveninghours over a period of days or weeks to determine the working or nonworkingstatus of the number [22,29].
CALLBACK PROCEDURES FOR BUSY NUMBERS —Whenever possible, call back numbers with regular busysignals within 15 to 60 minutes after the signal isencountered.
PRETESTING FIELD PROCEDURES AND INSTRUMENTS
Whether the survey is to be done over the telephone or by mail, pretesting thequestionnaire itself and the field procedures to be used in the main datacollection will almost always improve the response rates ultimately obtained. These pretests can take several forms. Many survey firms carry out a smallnumber of interviews (10 to 20) using the proposed questionnaire and attempt toprobe for specific problems in the questions, such as comprehension difficulties. In our discussion of techniques for reducing item nonresponse, we describe avariation on this procedure called the cognitive interview. Apart from leading toimprovement in the questionnaire, a small-scale pretest can serve a secondfunction, that of providing a realistic estimate of the time needed to complete thequestionnaire.
In addition to small-scale pretests of the questionnaire, other types of pretestsare useful as well. It is often worthwhile to conduct a dress rehearsal for themain study. Such dress rehearsals are useful for detecting problems in theplanned procedures, for estimating the likely response rate in the main datacollection, and for experimenting with procedural variations (such as the formatof the questionnaire or the amount of incentive to offer). The size of thesamples for such field tests often vary widely, depending on such factors aswhether multiple procedures are being compared. A review of 55 recenttransportation surveys indicated that more than 90 percent used pretest samplesof 100 or fewer cases [30].

CHAPTER 2
2–26 NONRESPONSE IN HOUSEHOLD TRAVEL SURVEYS
Recommendation
PRETESTING FIELD PROCEDURES AND INSTRUMENTS—Conduct a small-scale pretest to test the survey instruments andthe field procedures.
INCENTIVES
In many surveys, members of a survey sample are offered some form of incentivein an effort to gain their cooperation. In some surveys, the incentiveaccompanies the request for cooperation and consists of a small nonmonetarygift, such as a pen or a poster, or a small monetary gift of a dollar or two. Inothers, the incentive is substantially larger, conditional on participation, andoffered as compensation for the respondent’s time and trouble. The use ofincentives is a widespread practice within survey research, especially for mailsurveys (where incentives of a dollar or two are commonly employed) and inface-to-face surveys that make particularly onerous demands on the respondents,such as providing a biological specimen (where much larger incentives are therule). This section provides guidelines for selecting effective incentives for travelsurveys based on research in the survey and transportation literatures.
Offering incentives to sample members is one of the most effective proceduresfor reducing nonresponse in surveys. The effectiveness of a particular offeringwill depend on such factors as: 1) the monetary value of the incentive, 2) whether the incentive is paid in advance or upon completion of the survey, 3)whether the incentive is monetary or nonmonetary, 4) the mode of datacollection—mail, telephone, or personal interview, and 5) the burden the surveyplaces on the respondent [31, 33]. In situations where sample members arerecruited by mail or telephone and asked to complete relatively brief self-administered questionnaires—as is the case in many travel surveys, the mosteffective incentives are usually:
small in value,
paid in advance, and
monetary.
The sections below discuss these research findings in greater detail.

REDUCING NONRESPONSE IN TRAVEL SURVEYS
NONRESPONSE IN HOUSEHOLD TRAVEL SURVEYS 2–27
RecommendationINCENTIVES—Provide sample members with small prepaid monetaryincentives of $2 or less, unless participation is especiallyburdensome. In that case, offer larger monetary incentives of$10 or more conditional on participation and commensuratewith the level of burden placed on the respondent.
Effect of incentives on participation rates. Most research on incentives hasfocused on evaluating the effectiveness of small monetary offerings, typically $2or less, or small gifts, such as a pen or a lottery voucher, in surveys wheresample members are recruited by mail and asked to complete a self-administeredquestionnaire, or recruited by telephone and asked to complete a self-administered questionnaire at some later point in time. Surveys of this typegenerally place a low to moderate level of burden on the respondents; theamount of time respondents are asked to commit to the survey is relatively small,and their participation does not involve threatening or demanding tasks.
The effects of offering small incentives in such surveys have been evaluatedunder a variety of conditions, including situations where the incentive is paid inadvance and sent to the respondent along with the survey materials, orconditional on participation and sent to the respondent after completion of thesurvey. In cases where respondents are recruited by mail, advance incentivesare typically enclosed in the initial packet along with the request for cooperationand the survey questionnaire. In cases where respondents are recruited bytelephone and asked to complete a self-administered survey as part of the study, advance incentives are usually sent along with the survey packet afterrespondents have agreed to participate, typically without knowledge of theincentive. Under these conditions:
incentives paid in advance are generally more effective in gaining thecooperation of sample members than conditional incentives paid aftercompletion of a survey, even when the promised amount is larger than theprepaid amount.
incentives paid in advance typically increase response rates about 15 to 20percentage points, even when the value of the incentive is 50 cents or less.
monetary incentives are usually more effective than small gifts in gaining thecooperation of sample members.
incentives conditional on participation often have a negligible or negativeeffect on response rates.
In situations where the survey places a higher burden on the respondent, largerincentives are often effective, if not required, for gaining the cooperation ofcertain sample members. Surveys belonging in this category typically placeunusual or time-consuming demands on the respondent. They may, for instance,

CHAPTER 2
2–28 NONRESPONSE IN HOUSEHOLD TRAVEL SURVEYS
require the respondent to travel to a specific location, to submit to a physicalexamination, or to complete a battery of tests. In most surveys of this type, theincentives are offered as compensation in return for the respondent’s time andeffort. In the National Assessment of Educational Progress household survey,for example, youth were asked to complete a battery of four tests and offered $0,$10, $15, or $20 for finishing one, two, three, or four tests. The incentivesincreased response rates from about 71 percent (no incentive) to 83 percent [33]. Other surveys placing similar demands on respondents show comparable gainsin response rates associated with incentives conditional on survey participation. In the 1971 National Health and Nutrition Examination Survey, whererespondents were asked to submit to a physical examination, a conditionalincentive of $10 increased the response rate from 70 to 82 percent.
Effect of incentives on data quality. Most studies examining the impact ofincentives on data quality report a positive effect. Respondents who are offeredincentives tend to provide more complete data than other respondents; itemnonresponse is usually lower and answers to open-ended questions morecomplete. Moreover, respondents receiving a prepaid incentive are also morelikely to provide complete data than respondents receiving a conditionalincentive [32].
Effect of incentives on survey costs. The few studies in the literatureevaluating the impact of incentives on survey costs report reductions in theaverage cost per case when incentives are used [32]. In the field test for theNational Adult Literacy Survey, for example, the average cost per case forsample members offered conditional incentives was less than that for members inthe no incentive treatment condition (see Table 2.3). Participants who wereoffered incentives also required fewer interviewer contacts on average thanparticipants in the no incentive condition [34]. Other studies report similarreductions in the average number of contacts due to incentives.
Table 2.3Incentive Amount, Number of Contacts, and Cost Per Case
in the Field Test for the National Adult Literacy Survey
INCENTIVE AMOUNT CONTACTS PER CASE (INCLUDING INCENTIVE)AVERAGE NUMBER OF AVERAGE COST PER CASE
$ 0 6.7 $130
$20 5.3 $119
$35 5.0 $129
Incentives in transportation studies. Table 2.3, adopted in part from areport by Melissa Tooley [35], summarizes the results of some recent studies

REDUCING NONRESPONSE IN TRAVEL SURVEYS
NONRESPONSE IN HOUSEHOLD TRAVEL SURVEYS 2–29
designed to evaluate the impact of incentives on response rates in householdtravel surveys. Overall, the results of this work support the conclusions drawnabove, which were based on findings in the survey literature as a whole.
In accord with the survey literature, Table 2.3 shows that promised incentives oflarger value tend to yield mixed results in travel surveys. In the San FranciscoStudy, for example, a conditional incentive of $10 reduced the response rate byabout 6 percentage points. In the Houston-Galveston Study, on the other hand, aconditional incentive of $10 increased response rates, but only by 6 percentagepoints.
Travel studies also support the general finding that small prepaid incentives areusually more effective than promised incentives. In the Puget Sound TransportationPanel, for example, a prepaid incentive of $1 yielded a higher response than apromised incentive of greater value ($10). The prepaid incentive increasedresponse rates by about 15 percentage points, while the conditional incentive of $10increased participation by 11 percentage points. The results from the Pretest of the Dallas-Fort Worth Household Travel Survey,also shown in Table 2.4, support the general finding that monetary incentives areusually more effective than nonmonetary gifts in improving response rates. In thatstudy, a prepaid incentive of $2 led to higher response rates than a gift of a pen inthree out of four cases. The differences in participation favoring the $2 incentiveranged from about 8 to 18 percentage points.

CHAPTER 2
2–30 NONRESPONSE IN HOUSEHOLD TRAVEL SURVEYS
Table 2.4Response Rates by Incentive Condition Comparisons
in Five Transportation Studies
STUDY YEAR ADVANCE FOLLOW- RETRIEVAL INCENTIVES RESPONSE LETTER UP RATES
Puget Sound 1989 Y — Mailback None 49%TransportationPanel $1 (pre) 64%
$10 (post) 60%
San Francisco 1990 Y — Telephone None 47%Study $10 (post) 41%
San Antonio Y Y Mixed None 28-39% Bexar County, 1990 Amarillo, and 1990 Brownsville 1991
$5 (post) 40%
Houston/Galveston 1984 Y Y Mailback None 32%(Multiple) $10 (post) 38%
Dallas-Fort Worth 1995 N Y Telephone Pen (pre) 35%-48%Pretest $2 (pre) 45%-60%
Note: “Pre” incentives are those included with the initial survey packet; “post” incentives are those offered uponcompletion of the questionnaires. Response rates may not conform to the recommended procedure for reportingresponse rates and may vary across the studies. However, comparisons among incentive conditions within a studyare valid indicators of the potential effect of incentives on response rates.
PROXY RESPONDENTS
Different surveys impose different rules regarding whom is allowed to supplysurvey data for a sample member. In some surveys, any adult member of thehousehold is permitted to provide information about other individuals in thehousehold. In other surveys, the acceptability of data from proxy respondentsdepends on the information sought. In any case, the rules adopted by aparticular survey will have an impact on the response rate obtained.
Proxy reporting of basic background information. When the surveyrequires only basic demographic information about each member of a household,it is common practice to gather this information from any adult member in thehousehold. Proxy reporting of this type is frequently used in travel and othersurveys to collect demographic and other background data on householdmembers during the screening interview. This information is usually used todetermine the eligibility of household members and to roster individuals withinthe household. Obtaining screener information in this way usually increases theefficiency and completeness of the screening effort without significantly reducing

REDUCING NONRESPONSE IN TRAVEL SURVEYS
NONRESPONSE IN HOUSEHOLD TRAVEL SURVEYS 2–31
Recommendation
Recommendation
the accuracy of the information obtained. It enables interviewers to determinethe eligibility of household members who are not home at the time of the contactand to collect information on members who are unable to respond for themselvesbecause of mental or physical handicaps, or language barriers. In most cases, the gains in efficiency and response rates outweigh the small losses in accuracyassociated with collecting screener information by proxy.
PROXY REPORTING OF BASIC BACKGROUNDINFORMATION—During the screening interview, allow for proxy reportingof basic demographic and background information.Whenever possible, verify the accuracy of the informationduring the main interview. Resolve any discrepancies thatoccur.
Proxy reporting of travel behavior and attitudes. The practice ofaccepting proxy reports of attitudes and behaviors, on the other hand, is lesscommon largely because the gains in response rates are frequently offset bylosses in reporting accuracy. In most situations, attitudinal and behavioralinformation provided by proxy respondents tends to be less accurate thaninformation supplied by the actual respondents. In the 1990 NationwidePersonal Transportation Survey (NPTS), for example, proxy respondentsreported, on average, about 25 percent fewer trips per travel day, and about 20percent fewer miles traveled and driven than persons responding for themselves,suggesting that proxy reports underestimate actual travel behavior [36]. Datafrom the 1995 NPTS Pretest exhibited a similar pattern; proxy respondentsreported fewer trips and fewer miles traveled than self respondents. They werealso more likely to respond with “I don’t knows.”
PROXY REPORTING OF TRAVEL BEHAVIOR AND ATTITUDES —Avoid using proxy reports, unless the accuracy of theinformation can be assured in one of two ways: 1) the proxyaccompanied the actual respondent on the trip or in theactivity, or 2) the respondent recorded the information in atravel diary or similar instrument. Always attempt to collectinformation from the actual respondent. When these attemptsfail and it is more than three days since the travel behavioroccurred, accept proxy datum when it satisfies at least one ofthe conditions above.

CHAPTER 2
2–32 NONRESPONSE IN HOUSEHOLD TRAVEL SURVEYS
SPECIAL METHODS FOR REDUCING NONRESPONSE
In any survey, no matter how well it has been conducted, there is usually a groupof hard-core nonrespondents who are very difficult to contact, very reluctant toparticipate, or simply unable to take part in the survey. In travel surveys thisgroup of sample members tends to include [36]:
the elderly,
the less well-educated,
urban dwellers,
individuals with physical limitations or language barriers,
couples with young children, single parents, individuals who hold multiplejobs, and other busy or hard-to-reach individuals, such as 18 to 24 year-olds,and
individuals who lack community or civic ties that often motivate participationin travel surveys.
The number of nonrespondents remaining in these groups at the end of thesurvey can often be reduced by tailoring the survey materials and methods toovercome the obstacles standing in the way of their participation. In Section2.2, we discussed some general methods for improving the response rates of theelderly, the less-well educated, individuals with poor literacy skills, andindividuals with physical limitations or language barriers. The response rates ofthese and other nonrespondent groups can often be further improved through useof special methods that make participation particularly attractive (or moredifficult to avoid), address specific concerns or objections, or call attention to thesurvey. Some examples of special methods of this type are:
large incentives conditional on participation,
persuasive calls from the most successful interviewers or field supervisors,
special appeals and mailings,
artfully constructed conversion letters, and
in-home visits, if the addresses of the sample members are known.
The method selected for a particular group should be tailored to that group. Most 18 to 24 year-olds, for example, are unlikely to be moved by appeals tocivic duty, but will often take the time to complete a survey if they are offered alarge incentive. Single parent families and families with young children, on the

REDUCING NONRESPONSE IN TRAVEL SURVEYS
NONRESPONSE IN HOUSEHOLD TRAVEL SURVEYS 2–33
Recommendation
other hand, are often more willing to take part in a study if the sponsor offers tocover babysitter costs while they complete the survey.
While some of these methods for improving response rates can be relativelyinexpensive—special mailings and artfully constructed conversion letters, forexample, others—such as in-home visits and large incentives, may be tooexpensive to apply on a frequent basis.
TAILORING THE SURVEY —To the extent possible, tailor the survey to address thespecial needs, concerns, and objections of subgroups ofindividuals unwilling to take part.
SUBSAMPLING NONRESPONDENTS
When it is not possible to adopt special methods for all reluctant samplemembers, one alternative to simply writing off the final group of nonrespondentsis to select a subsample and use special methods to achieve a high response rateamong the subsample.
Although formulas have been derived for determining the best point at which tobegin subsampling the remaining nonrespondents, subsampling is typicallyundertaken only when all sample members have been contacted repeatedly, theresponse rate remains unsatisfactory, and the data collection budget is nearingexhaustion. To illustrate the use of subsampling, consider a hypothetical surveywhich has achieved only a 50 percent response rate after spending 75 percent ofthe data collection budget. If a subsample of one in five of the remainingnonrespondents is chosen, the budget level of effort per case can be increasedsubstantially, making it possible to achieve a relatively high response rate amongthe subsample. For example, if even 40 percent of the subsample provide therequired data, the weighted response rate will be 70 percent—that is, within thefirst half of the sample, 100 percent of the cases are respondents and, within thesubsample representing the second half of the cases, 40 percent are respondents. The important point is that the sample respondents include some representativesof the hard-to-complete group.

CHAPTER 2
2–34 NONRESPONSE IN HOUSEHOLD TRAVEL SURVEYS
RecommendationSUBSAMPLING OF NONRESPONDENTS —When the data collection budget is almost exhausted,response rates are unacceptably low, and all cases in thesample have been fielded, subsample nonrespondents toboost response rates and to improve therepresentativeness of the sample.
2.5 ITEM NONRESPONSE
Even if the overall response rate is high, many respondents may be missing datafor specific items. The statistical consequences of unit and item nonresponse areidentical. Fortunately, the level of item nonresponse tends to much lower thanthe level of unit nonresponse. In this section, we describe some methods forlowering the rate of item nonresponse.
QUESTIONNAIRE DESIGN
The same questionnaire design features that help reduce unit nonresponse tend toreduce item nonresponse as well. Short questionnaires with clear instructionsare easier to complete and more likely to be completed correctly than longquestionnaires with difficult to follow instructions. The clarity and appearanceof the questionnaire is likely to be particularly important with self-administeredquestions. Respondents are about twice as likely to incorrectly skip items whenthey complete the questionnaire themselves than when the questionnaire isadministered by an interviewer [37]. This differential can be reduced if theinstructions for filling out the questionnaire are clear and simple and if graphicsare used to indicate the flow of questions [16].
With a self-administered questionnaire sent to the respondent by mail, therespondent must be able to figure out how to complete the questions without thehelp of an interviewer. It is, therefore, especially important that the respondentsunderstand the questions and any accompanying instructions. The questions andthe instructions must be clearly stated and easily understood.
Techniques for developing questionnaires. There are several commonly-used techniques for developing questionnaires, including focus groups, expertreviews, cognitive interviews, and small pilot studies (typically with fewer than100 respondents). We especially recommend expert reviews and cognitiveinterviews as inexpensive but effective means for improving draft questionnaires.
In an expert review, three or four specialists in questionnaire design review thedraft, point out problems with it, and suggest improvements. The questionnaire

REDUCING NONRESPONSE IN TRAVEL SURVEYS
NONRESPONSE IN HOUSEHOLD TRAVEL SURVEYS 2–35
Recommendation
and background information about the study (describing the study’s purposesand the analyses in which the data are likely to be used) are typically sent out tothe experts prior to a face-to-face or telephone review session. The reviewsession may last 2 to 8 hours depending on the length of the questionnaire.
It is also important to try out the questions with persons drawn from the samepopulation as the sample for the main study. Cognitive interviews may be aparticularly valuable tool for detecting respondent problems in understanding thequestions or in performing the other cognitive operations (such as retrieval andjudgment) that are required to answer accurately. In a cognitive interview,respondents are encouraged to think aloud as they attempt to answer thequestions [38]. For example, they may be instructed to:
Please tell me what you are thinking about as you answer the nextfew questions. This will help us understand whether the questionswe are asking are being understood as intended and whether theyhave any other problems. Remember to think out loud as youanswer. Let’s try an example before we turn to the main questions. Tell me what you are thinking as you answer the question Howmany windows are there in your home?
In addition, the respondents in a cognitive interview may be asked to:
point out unfamiliar terms (Are you familiar with [the term]?);
paraphrase a question or set of instructions (Can you say in your own wordswhat that last question was asking?);
describe their thought processes after having answered a question (Please tellme how you arrived at that last answer); and
rate their confidence in their answers (Are you very sure, somewhat sure, ornot too sure about that last answer?).
All these techniques are intended to reveal the cognitive processes through whichrespondents arrive at their answers and to identify any problems with thequestions. Typically, interviews are completed with 10 to 15 respondents and ashort report is produced that highlights any problems detected with specific itemsand suggests modifications.

CHAPTER 2
2–36 NONRESPONSE IN HOUSEHOLD TRAVEL SURVEYS
Recommendation
DEVELOPING QUESTIONNAIRES —Whenever possible, use expert review and cognitiveinterviews to improve the quality of items in thequestionnaire.
Sensitive questions. Aside from comprehension errors or other cognitiveproblems, other factors may contribute to high levels of missing data. Forexample, respondents may refuse to answer questions they regard as toopersonal. Many surveys ask for the annual income of the respondent or therespondent’s family, and often this item has higher levels of missing data thanany question in the survey. The best that can be done is to ask such sensitivequestions toward the end of the questionnaire after the respondent has completedthe bulk of the questions. Training interviewers to explain why the question isneeded and how the information will be used may also help to reducenonresponse to sensitive questions.
SENSITIVE QUESTIONS —Place sensitive questions towards the end of thequestionnaire. Train interviewers to explain theimportance of the question and how the information willbe used.
RETRIEVAL OF MISSING ITEMS
The most direct method for reducing the number of items that are missing is torecontact the respondent and obtain any information omitted from thequestionnaire. This procedure is called “retrieval” by many survey researchers. Generally, retrieval is reserved for a small number of especially important items,which are predesignated beforehand. Often the “retrievable” items are the sameones used to define whether a questionnaire is regarded as complete. (See thediscussion of “critical items” in Chapter 1.)
The recontact is usually made by telephone (if a telephone number is available). The retrieval interviewer explains that an important piece of information has beenomitted from the questionnaire and asks the respondent to provide it. If theinitial interview was conducted by telephone and the respondent refused toprovide the information in the first place, the retrieval interviewer explains theimportance of the missing data and points out that the rest of the informationthat the respondent did provide cannot be used without the missing items.

REDUCING NONRESPONSE IN TRAVEL SURVEYS
NONRESPONSE IN HOUSEHOLD TRAVEL SURVEYS 2–37
Recommendation
Retrieval is generally a cost-effective method for salvaging cases that wouldotherwise be difficult or impossible to include in the analysis.
RETRIEVAL OF MISSING ITEMS —Recontact respondents who failed to provide a few piecesof key data. This recontact can be made through a lessexpensive method of contact, such as telephone.
2.6 CURRENT PRACTICE FOR REDUCING NONRESPONSEIN TRAVEL SURVEYS
Current practice for reducing nonresponse in household transportation surveysdiffers widely across survey firms and particular studies. Some studiesincorporate many of the recommended procedures for reducing nonresponse. Others rely on just one or two procedures or employ less than optimal methods.
A recent review of household travel surveys by Peter Stopher and Helen Metcalf[29] reveals the extent to which current practice varies among travel surveys. Their analysis, based on a review of 55 household travel surveys conducted from1988 to 1994, shows how recent surveys made use of three methods forreducing nonresponse: pretests, incentives, and follow-up reminders. Theresults of the review are described below.
PRETESTS
About 74 percent of the surveys included in the analysis carried out a pretestprior to the conduct of the main survey. The samples in the studies ranged insize from fewer than 25 to over 500 respondents; the most common size wasbetween 26 and 50 respondents. The objectives of the pretests varied fromstudy to study. All were designed to test the survey instruments. Some were fulldress rehearsals for the main survey. Others evaluated particular aspects of thesurvey’s design or its procedures. Table 2.5 shows the percent of pretestsevaluating various aspects of the survey.
Table 2.5

CHAPTER 2
2–38 NONRESPONSE IN HOUSEHOLD TRAVEL SURVEYS
A Summary of Pretest Objectives
ASPECTASPECT EACH ASPECTEACH ASPECT
PERCENT OFPERCENT OFPRETESTSPRETESTS
EVALUATING EVALUATING
Instrument 100
Management 58
Training of Survey 48Personnel
Sampling Procedures 40
Data Keying 28Procedures
Geocoding Procedures 25
Analysis 23
Effectiveness of 10Incentives
INCENTIVES
Only about twenty percent of the surveys included in the review used some formof incentive to encourage participation. Of the studies employing incentives,nearly half relied on a cash incentive. Of the surveys using cash or lotteries,about half distributed the incentive in advance, while the other half usedconditional incentives.
FOLLOW-UP REMINDERS
According to the review, the use of follow-up reminders, that is, contacts toremind sample members to complete their questionnaires after they had receivedthem in the mail, has become common practice in household travel surveys. Nearly 80 percent of the surveys employed this method for reducingnonresponse. Nonetheless, the studies differed in the type, and especially in thenumber, of contacts used for this purpose (see Table 2.6). About 93 percent ofthe studies contacted the respondents by telephone to remind them to completethe questionnaires or travel diaries. More than half relied on a single reminder,while a good portion, 20 percent, used as many as four or more follow-upreminders.
Table 2.6
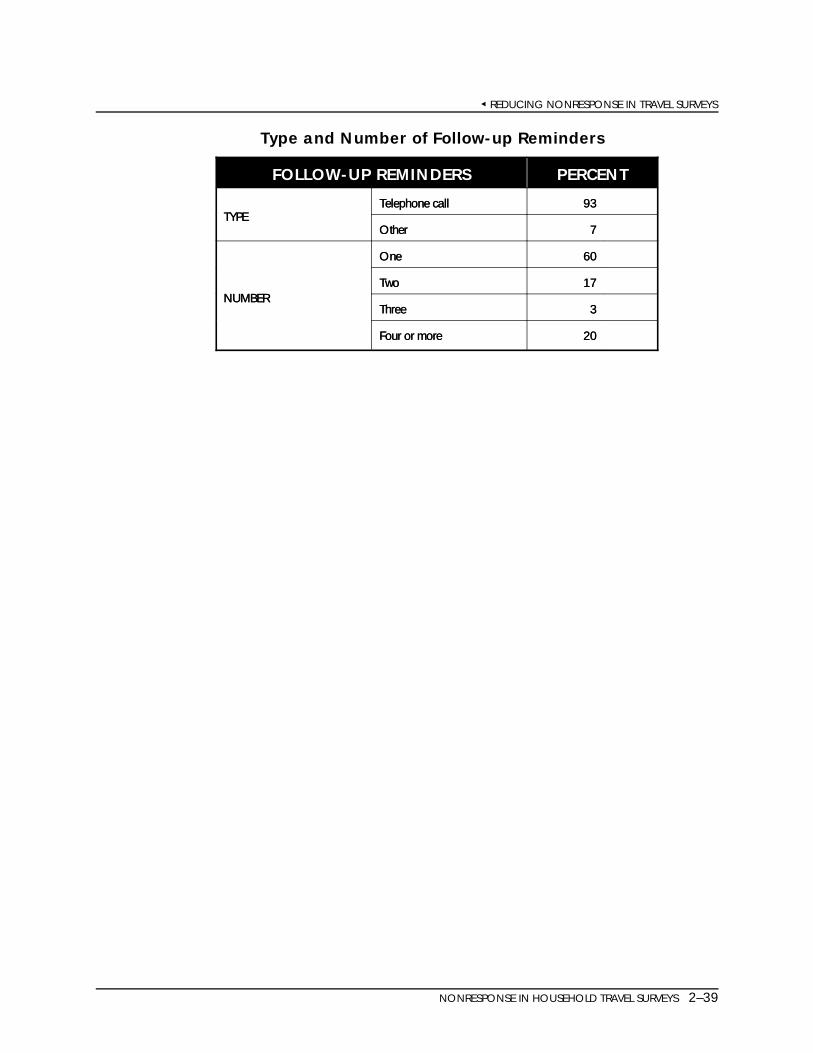
REDUCING NONRESPONSE IN TRAVEL SURVEYS
NONRESPONSE IN HOUSEHOLD TRAVEL SURVEYS 2–39
Type and Number of Follow-up Reminders
FOLLOW-UP REMINDERS PERCENT
TYPETYPETelephone callTelephone call 9393
OtherOther 7 7
NUMBERNUMBER
OneOne 6060
TwoTwo 1717
ThreeThree 3 3
Four or moreFour or more 2020

CHAPTER 2
2–40 NONRESPONSE IN HOUSEHOLD TRAVEL SURVEYS
References
1. Kirsh, I.S., Jungeblut, A., Jenkins, L., & Kolstad, A. (1993). Adult Literacy in America:A First Look at the Results of the National Adult Literacy Survey. Washington, D.C.: National Center for Education Statistics.
2. Groves, R.M. & Lyberg, L.E. (1988). An overview of nonresponse issues in telephonesurveys. In R.M. Groves, P.P. Biemer, L.E. Lyberg, J.T. Massey, W.L. Nicholls II, and J.Waksberg (Eds.) , Telephone Survey Methodology. New York: John Wiley.
3. Herzog, A.R. & Kulka, R.A. Telephone and mail surveys with older populations: amethodological overview.
4. Couper, M.P. & Groves, R.M. (1992). The role of the interviewer in survey participation. Survey Methodology, 18, 263-277.
5. Groves, R.M. & Fultz, N.H. (1985). Gender effects among telephone interviewers in asurvey of economic attitudes. Sociological Methods and Research, 14, 31-52.
6. Singer, E., Frankel, M.R., & Glassman, M.B. (1983). The effect of interviewercharacteristics and expectation on response. Public Opinion Quarterly, 47, 68-83.
7. Morton-Williams, J. & Young, P. (1986). Obtaining the survey interview: an analysis oftape-recorded doorstep introductions. Journal of the Market Research Society, 27, 35-53.
8. Collins, M., Sykes, W., Wilson, P., & Blackshaw, N. (1988). Nonresponse: The UKExperience. In R.M. Groves, P.P. Biemer, L.E. Lyberg, J.T. Massey, W.L. Nicholls II,and J. Waksberg (Eds.) , Telephone Survey Methodology. New York: John Wiley.
9. Oksenberg, L. & Cannell, C. (1988). Effects of interviewer vocal characteristics onnonresponse. In R.M. Groves, P.P. Biemer, L.E. Lyberg, J.T. Massey, W.L. Nicholls II,and J. Waksberg (Eds.) , Telephone Survey Methodology. New York: John Wiley.
10. Heberlein, T.A., & Baumgartner, R. (1978). Factors affecting response rates to mailedquestionnaires: A quantitative analysis of the published literature. American SociologicalReview, 43, 447-462.
11. Groves, R., Cialdini, R., & Couper, M. (1992). Understanding the decision to participatein a survey. Public Opinion Quarterly, 56, 475-495.
12. Tourangeau, R., Shapiro, G., Kearney, A., & Ernst, L. (In press). "Who lives here?Survey undercoverage and household roster questions." Journal of Official Statistics.
REDUCING NONRESPONSE IN TRAVEL SURVEYS
NONRESPONSE IN HOUSEHOLD TRAVEL SURVEYS 2–41
13. Yammarino, F.J., Skinner, S.J., & Childers, T.L. (1991). Understanding mail surveyresponse behavior. Public Opinion Quarterly, 55, 613-639.
14. Dillman, D.M. (1991). The design and administration of mail surveys. Annual Review ofSociology, 17, 225-249.
15. Applied Management & Planning Group. (1995). Dallas-Ft. Worth household travelsurvey: Pretest report. Los Angeles, CA: Applied Management & Planning Group.
16. Jenkins, C., & Dillman, D. (1997). Towards a theory of self-administered questionnairedesign. In L. Lyberg, P. Biemer, M. Collins, E. DeLeeuw, C. Dippo, N. Schwarz, & D.Trewin (Eds.), Survey measurement and process quality. New York: Wiley.
17. Richardson, A.J., Ampt, E.S., & Meyburg, A.H. (1995). Survey Methods for TransportPlanning. Parkville, Vic: Eucalyptus Press.
18. Groves, R., & Kahn, R. (1979). Surveys by telephone: A national comparison withpersonal interviews. New York: Academic Press.
19. Dillman, D.M. (1978). Mail and telephone surveys: The Total Design Method. NewYork: JohnWiley.
20. Sebold, J. (1988). Survey period length, unanswered numbers, and nonresponse intelephone surveys. In R.M. Groves, P.P. Biemer, L.E. Lyberg, J.T. Massey, W.L.Nicholls II, and J. Waksberg (Eds.) , Telephone Survey Methodology. New York: JohnWiley.
21. Weeks, M.F. (1988). Call scheduling with CATI: Current capabilities and methods. InR.M. Groves, P.P. Biemer, L.E. Lyberg, J.T. Massey, W.L. Nicholls II, and J. Waksberg(Eds.), Telephone Survey Methodology. New York: John Wiley.
22. Weeks, M.F., Jones, B.L., Folsom, R.E., & Benrud, C.H. (1980). Optimal times tocontact sample households. Public Opinion Quarterly, 44, 100-114.
23. Weeks, M.F., Kulka, R.A., & Pierson, S.A. (1987). Optimal call scheduling for atelephone survey. Public Opinion Quarterly, 51,540-549.
24. Kulka, R.A. & Weeks, M.F. (1988). Toward the development of optimal callingprotocols for telephone surveys: a conditional probabilities approach. Journal of OfficialStatistics, 4, 319-332.
25. Greenberg, B.S. & Stokes, S.L. (1990). Developing an optimal call scheduling strategyfor a telephone survey. Journal of Official Statistics, 6, 421-435.

CHAPTER 2
2–42 NONRESPONSE IN HOUSEHOLD TRAVEL SURVEYS
26. Tuckel, P.S. & Feinberg, B.M. (1990). The answering machine poses many questions fortelephone survey researchers. Public Opinion Quarterly, 55, 200-217.
27. Oldendick, R.W. (1993). The effect of answering machines on the representativeness ofsamples in telephone surveys. Journal of Official Statistics, 9, 663-672.
28. Hoagland, R.J., Warde, W.D., & Payton, M.E. (1988). Investigation of the optimumtime to conduct telephone surveys. Proceedings of the Survey Research Methods Section, American Statistical Association, 755-760.
29. Stopher, P.R. & Metcalf, H (1996). Methods for Household Travel Surveys: A Synthesisof Highway Practice. Washington, DC: National Academy Press.
30. Kulka, R.A. (1994). The use of incentives to survey “hard-to-reach” respondents: a briefreview of empirical research and current practice. Paper prepared for the Seminar on NewDirections in Statistical Methodology, sponsored by the Council of ProfessionalAssociations on Federal Statistics (COPAFS), Bethesda, Maryland, May 25-26.
31. Kulka, R.A. (1992). A brief review of the use of monetary incentives in federal statisticalsurveys. Paper prepared for the Symposium on Providing Incentives to Respondents,convened by the Council of Professional Associations on Federal Statistics (COPAFS) forthe Office of Management and Budget, John F. Kennedy School of Government, HarvardUniversity, Cambridge, MA., October 1-3.
32. Chromy, J.R. & Horvitz, D.G. (1978). The use of monetary incentives in nationalassessment household surveys. Journal of the American Statistical Association, 73, 473-478.
33. Berlin, M., Mohadjer, L., Waksberg, J., Kolstad, A., Kirsch, I., Rock, D., & Yamamoto,K. (1992). An experiment in monetary incentives. Proceedings of the Survey ResearchMethods Section, American Statitical Association, 393-398.
34. Tooley, M. (1996). Incentives and rate of return for travel surveys. Paper presented atthe Conference of the Transportation Research Board.
35. Moore, P.A. (1995). Using proxy interviews in a nationwide travel survey. Paperpresented at the Annual Conference of the American Association of Public OpinionResearch, Fort Lauderdale, Florida, May 18-21.
36. Johanna Zmud (1997). Personal communication.
37. Tourangeau, R., Rasinski, K., Jobe, J., Smith, T., & Pratt, W. (In press). Sources of errorin a survey of sexual behavior. Journal of Official Statistics.

REDUCING NONRESPONSE IN TRAVEL SURVEYS
NONRESPONSE IN HOUSEHOLD TRAVEL SURVEYS 2–43
38. Willis, G., Royston, P. & Bercini, D. (1991). The use of verbal report methods in thedevelopment and testing of survey questionnaires. Applied Cognitive Psychology, 5, 251-267.

NONRESPONSE IN HOUSEHOLD TRAVEL SURVEYS 3–1
3.STATISTICAL METHODS FOR REDUCING
THE IMPACT OF NONRESPONSE
3.1 CHAPTER SUMMARY
This chapter describes statistical methods for reducing the impact ofnonresponse on survey estimates. Although the best method for reducing theimpact of nonresponse is to achieve high response rates in the first place, themethods described here can help reduce the effects of any remainingnonresponse. Unless post-survey adjustments are made, estimates from thesurvey are likely to be distorted by nonresponse. The magnitude of the biasintroduced by nonresponse depends on the proportion of the sample for whomdata are not obtained and the amount of difference between the respondentsand the nonrespondents. Two forms of nonresponse are usually distinguished-unit nonresponse (in which no data are obtained at all) and item nonresponse(in which one or more items are missing from an otherwise completedinterview or questionnaire). The statistical consequences of unit and itemnonresponse are the same; both forms of nonresponse can reduce the samplesize and introduce bias. However, the most effective methods forcompensating for the two forms of nonresponse are different.
STATISTICAL METHODS
Two statistical methods can be used to reduce the effects of unit nonresponse:
The weights assigned to each case can be adjusted for nonresponse (that is,the weights initially assigned to nonrespondents can be reallocated torespondents with similar characteristics);
The weights can be post-stratified (i.e., the survey weights can be adjustedto agree with independent population figures).
Nonresponse adjustments should always be made. Post-stratification should beused when accurate population figures are available.
The main tool for reducing the effects of item nonresponse is imputation. It isuseful to distinguish “logical” imputation (in which the value of a missing itemis inferred from other data) and statistical imputation (in which a statisticalprocedure is used to predict a value for the missing item). Logical imputation,or editing, should be carried out before statistical imputation is used. “Hotdeck” imputation is an especially useful statistical method for imputing missingvalues in travel surveys. In this form of imputation, similar cases are groupedinto cells. Missing values are replaced using the value provided by a “donor”

CHAPTER 3
3–2 NONRESPONSE IN HOUSEHOLD TRAVEL SURVEYS
from the same cell; the donor is simply another sample member who providedan answer to the relevant item.
3.2 TYPES OF NONRESPONSE
As we noted in Chapter 1, most discussions of nonresponse distinguishbetween two forms of nonresponse—unit nonresponse and item nonresponse. [1] Unit nonresponse refers to the failure to obtain questionnairesor data collection forms (such as the travel diaries used in many personaltransportation surveys) for a member of the sample. Item nonresponse refersto the failure to obtain a specific piece of information from a respondingmember of the sample. Item nonresponse is often used interchangeably withthe term “missing data.”
Although their causes are different, unit and item nonresponse have identicalstatistical consequences. Unless adjustments are made to the data, the level ofnonresponse bias will depend only on two factors—the proportion of thesample for whom data were not obtained and how much the respondents differfrom the nonrespondents. It does not matter whether the data are missingbecause a sample member never responded to the survey at all or because therespondent failed to answer a specific question. However, different methodsare typically used to reduce the impact of the two different forms ofnonresponse.
UNIT NONRESPONSE
Unit nonresponse refers to complete nonparticipation by a member of thesample. In travel surveys, data are usually collected for both households andpersons. There are, therefore, two types of unit nonresponse:
household-level nonresponse, in which an entire household cannot becontacted or refuses to participate;
person-level nonresponse, in which one or more persons in the householddo not take part but at least one member does.
These two types of unit nonresponse are equivalent for surveys that only selectone individual from each sample household. Because most personaltransportation surveys collect data on every household member, in the rest ofthis report we assume that all eligible household members are asked toparticipate.
For many variables, person-level analyses are appropriate. This results in astraightforward pattern of unit nonresponse, since it is relatively easy to decidewhether a person is to be considered a respondent. However, if household-

STATISTICAL METHODS FOR REDUCING THE IMPACT OF NONRESPONSE
NONRESPONSE IN HOUSEHOLD TRAVEL SURVEYS 3–3
level variables are of interest, it may be unclear how to treat the household ifsome but not all persons from that household provide data. In Chapter 1, werecommend treating the household as a respondent if the majority of its eligiblemembers are classified as respondents and if a set of critical items are availableabout the household. Even if the household is considered a respondent, someitems could still be missing due to item nonresponse.
ITEM NONRESPONSE
The second type of nonresponse is item nonresponse. This is when there aremissing items in an interview or questionnaire that is otherwise completed by arespondent. The data could be missing because the respondent refused toanswer (e.g., a question on income), the interviewer failed to ask the question(e.g., he or she may have skipped a question accidentally), or the respondentsimply missed the question (e.g., he or she may have forgotten to complete theback of one page of a diary).
Missing trips. When data on one or more trips or activities are excludedfrom a travel diary, these trips can be treated as missing data. It is oftendifficult to spot these missing trips or activities unless the previous and nexttrip or activity form a chain of trips. If this is the case, the ending point for onetrip and the starting point for the next trip may be different, suggesting thatthere is at least one missing trip between them. If undetected, this type of itemnonresponse will result in underestimates of the number and distance of trips.
Missing items about a trip or activity. Items missing could include traveltimes, trip purpose, or the mode of transportation. It may be possible to fill insome or all of the missing information through careful editing of the data. Such editing involves looking at the context in which the trip occurred. Editing will, however, often fail to remove all of the item nonresponse within areported trip or activity.
3.3 IMPACT OF NONRESPONSE
Nonresponse has two negative consequences for the quality of the estimatesderived from the survey. First, it can reduce the number of cases for whomdata are available. As a result, the survey statistics will not be as precise. Inmany surveys, however, the sample size is fixed. Additional cases may befielded to compensate for those lost through nonresponse. Second, and moreimportant, substantial bias can occur if the nonrespondents are different fromthe respondents on the characteristics of interest. This bias cannot be correctedwith additional cases.

CHAPTER 3
3–4 NONRESPONSE IN HOUSEHOLD TRAVEL SURVEYS
REDUCED SAMPLE SIZE
Reductions in sample size due to nonresponse have a direct effect on thevariability in the statistics derived from the survey data. Unit nonresponserates are as a rule higher than item nonresponse rates. But the effects of thetwo compound in reducing the sample sizes. This point is illustrated in Table3.1. For example, if 1000 responses were sought and there was nononresponse at all, the standard error for a proportion with a mean of 50percent would be 0.0158. However, if the unit response rate were 70 percentand item response rate were 90 percent, we would only have 630 completeresponses for a particular item (variable), giving a standard error of 0.0199, anincrease of 26.0 percent. If the item response rate were to further fall to 80percent, the standard error for the same variable would be higher, 0.0211,which is an increase of 33.6 percent due to nonresponse. Thus both unitnonresponse and item nonresponse contribute to higher standard errors—thatis, decreased precision in the estimates from the survey.
Table 3.1 Impact of Nonresponse on Sample Size and Standard Errors
INITIAL n RESPONSE RESPONSE FINAL n S.E. ON 50%UNIT ITEM
RATE RATE ESTIMATE
1000 1.0 1.0 1000 0.0158
1000 0.9 0.9 810 0.0176
1000 0.9 0.8 720 0.0186
1000 0.8 0.9 720 0.0186
1000 0.8 0.8 640 0.0198
1000 0.7 0.9 630 0.0199
1000 0.7 0.8 560 0.0211
1000 0.6 0.9 540 0.0215
1000 0.6 0.8 480 0.0228
Note: S.E. refers to the standard error of an estimate.
INTRODUCTION OF BIAS
The most important effect of nonresponse is the bias it produces. Nonresponse has an impact similar to that of excluding a portion of thepopulation from the sampling frame. In both cases, a possibly nonrandom

B (1 RR) (XR XNR).
STATISTICAL METHODS FOR REDUCING THE IMPACT OF NONRESPONSE
NONRESPONSE IN HOUSEHOLD TRAVEL SURVEYS 3–5
portion of the population is omitted from the study. This creates the potentialfor bias, and the effects of this bias can be substantial. Because of theomission of the nonrespondents, the sample no longer represents the entirepopulation of interest. If the analysis ignores the effects of nonresponse, itimplicitly assumes that nonrespondents do not differ systematically from therespondents on any characteristic of interest. To the extent that thenonrespondents do differ from the respondents, the results will be biased.
Differences between respondents and nonrespondents. Nonrespon-dents are rarely randomly distributed in the survey population. As we saw inChapter 2, response rates vary widely across population subgroups and thesurvey variables are often associated with the characteristics of thesesubgroups. For example, nonresponse rates are usually much higher in citiesthan in the suburbs and preferred modes of transportation can differ in the twotypes of settings. Because they underrepresent city dwellers, travel surveysmay underestimate the number of trips made by bus or subway. In one study,nonresponse led to the underestimation of the size of certain segments of thestudy population by 50 percent.2
Nonrespondents in transportation surveys. In some respects,nonrespondents in transportation surveys have similar characteristics tononrespondents in other national surveys. They are more likely thanrespondents to live in densely populated areas, to have low levels of education,to be elderly, and to have visual or hearing difficulties which prevent them fromcompleting surveys. In addition, language barriers for those whose nativelanguage is not English, mental and physical handicaps, and poor literacy skillscan contribute to nonresponse. The 1995 NPTS pretest found 4 percent of theage 18 and older respondents used a proxy because of language problems.
In addition, members of other groups may be more prone to becomenonrespondents in transportation surveys than in other surveys. For example,the elderly may feel that because they leave the house less frequently thanyounger persons, their data are not needed for transportation surveys (seeChapter 2).
Level of nonresponse bias. For means (and proportions), the magnitudeof the bias resulting from nonresponse depends on the response rate (R, asR
defined in Chapter 1) and the difference in the means (or proportions) for therespondents X̄ ) and nonrespondents (X̄ ) :R NR
1,1
Although there is no hard-and-fast rule about when nonresponse biasrepresents a serious threat to a survey, many national surveys carried out for

CHAPTER 3
3–6 NONRESPONSE IN HOUSEHOLD TRAVEL SURVEYS
the federal government achieve response rates of 80 percent or higher. Thus,when the response rate is low (e.g., less than 60 to 70 percent), the potentialfor bias is high; the mean for the respondents will be a good estimate for themean of the whole population only if the respondents and nonrespondents aresimilar. If this assumption is wrong, then the unadjusted mean will producebiased estimates for the whole population.
It is important to realize that the validity of doing nothing at all aboutnonresponse rests on the (often implausible) assumption that the respondentsand nonrespondents do not differ. Every compensation procedure—includingdoing nothing—rests on assumptions about the characteristics of thenonrespondents, but some assumptions are more reasonable than others. Inestimating means or totals, the simplest assumption is that the mean for therespondents is equal to the mean for the nonrespondents. An alternativeassumption is that the missing data are missing at random. Under thisassumption, the respondents and nonrespondents may differ in any givensample, but across all possible samples the means for the two groups are thesame. Unfortunately, these simple assumptions are rarely tenable in practice. When they are incorrect, even relatively low levels of nonresponse (10 percentto 20 percent) can produce significant bias. Table 3.2 illustrates how the biasarises. It shows how the proportion estimated from survey data (e.g., theproportion of the study population using public transportation regularly) can bedistorted by nonresponse.
When 20 percent of the sample become nonrespondents, and 20 percent of therespondents have some characteristic of interest versus 50 percent of thenonrespondents, the sample estimate will be 20 percent (based on therespondents) but the unbiased estimate (based on both the respondents andnonrespondents) will be 26 percent—a difference of 6 percent. (The unbiasedestimate for the entire population is .20 for the 80 percent of the populationrepresented by the respondents and .50 for the 20 percent of the populationrepresented by the nonrepondents. Combining the two groups yields .80 x .20plus .20 x .50, or 0.26). This margin of error—reflecting the nonresponsebias—is likely to be several times larger than random sampling error. Moreimportant, the error produced by nonresponse will not be random.
Table 3.2 Nonresponse Bias, by Level of Nonresponse

STATISTICAL METHODS FOR REDUCING THE IMPACT OF NONRESPONSE
NONRESPONSE IN HOUSEHOLD TRAVEL SURVEYS 3–7
NONRESPONSE RATE BIAS PROPORTION WITH CHARACTERISTIC OF INTEREST
Among Respondents AmongNonrespondents
.10 0.2 0.3 .01
.10 0.2 0.4 .02
.10 0.2 0.5 .03
.20 0.2 0.3 .02
.20 0.2 0.4 .04
.20 0.2 0.5 .06
.40 0.2 0.3 .04
.40 0.2 0.4 .08
.40 0.2 0.5 .12
Note: Bias is the difference between the expected value of a sample statistic andthe population characteristic it is intended to estimate.
3.4 SURVEY METHODS
This section discusses various survey procedures intended to minimize theimpact of nonresponse.
AVERTING NONRESPONSE
The best single method for reducing the effects of nonresponse is to have aslittle nonresponse as possible in the first place. The methods recommended inChapter 2 all help achieve high response rates, thus minimizing the potentialeffects of nonresponse bias on survey estimates. Still, every survey incurssome nonresponse and the effects of nonresponse at the different stages of datacollection cumulate. For example, if 90 percent of the sample households aresuccessfully screened, 90 percent of those return a completed diary, and thediaries include information about 90 percent of the trips on average, then thecumulative response rate across all three stages is only about 73 percent (.9 x.9 x .9 = .729). Despite high response rates at each stage, there is still roomfor considerable bias. Thus, other procedures are likely to be useful inreducing the impact of nonresponse even when the response rate is quite high.
KEEP NONRESPONSE RATES AS LOW AS POSSIBLE —

CHAPTER 3
3–8 NONRESPONSE IN HOUSEHOLD TRAVEL SURVEYS
Recommendation
Use the methods discussed in Chapter 2 to keepnonresponse to a minimum. The bias fromnonresponse is related to the cumulative nonresponserate, taking into account both unit and itemnonresponse.
FOLLOWING UP WITH A SUBSAMPLE OF NONRESPONDENTS
One way to reduce the bias resulting from unit nonresponse is to achieve a highresponse rate among a subsample of the cases who remain nonrespondentsnear the end of the regular data collection period. This approach gives somerepresentation in the final sample to the pool of potential nonrespondents.
For example, suppose some combination of callbacks, follow-up letters, andincentives has produced a 60 percent response rate. This means that 40percent of the cases are, at this point in the data collection effort, stillnonrespondents. Within the remainder, it may be better to select a subsampleof one case out of four and subject this subsample—representing 10 percent ofthe original cases—to more intensive follow-up efforts than would be possibleif all of the nonrespondents were retained for further follow-up efforts. These“more intensive” follow-up efforts might include:
Sending specially tailored or personalized follow-up letters designed topersuade reluctant sample members to take part;
Using more experienced or specially trained data collection staff to“convert” subsample members;
Moving to more expensive methods of follow-up, such as registered lettersor even in-person contacts;
Offering much larger incentives for participation (e.g., $20 to $50); and
Greatly increasing the number of callbacks for difficult to reach householdsor individuals (from, say, 6 or 8 callbacks to 20).
Suppose for the sake of illustration that 60 percent of the subsample selectedfor additional follow-up ultimately provide data. From a statistical point ofview, this is equivalent to achieving a response rate of 84 percent within theentire sample. To understand why this is so, let us consider the initial sample asconsisting of two strata, or subgroups. The first stratum, encompassing 60percent of the cases fielded originally, includes those members of thepopulation who require only standard efforts to be reached and persuaded totake part in the survey. The second stratum, encompassing the remaining 40percent of the population, includes all of those who require additional efforts.

STATISTICAL METHODS FOR REDUCING THE IMPACT OF NONRESPONSE
NONRESPONSE IN HOUSEHOLD TRAVEL SURVEYS 3–9
The response rate within the first stratum was 100 percent and the responserate within the second stratum was 60 percent; thus, the final samplerespondents represent 84 percent of the population that the original samplewas selected to represent (.60 x 1.00 plus .40 x .60). This calculation assumesthat the subsample is a random sample of the initial nonrespondents and thatthe remainder of this group—that is, the portion not selected for furtherfollow-up—is dropped.
Subsampling of nonrespondents is complicated and it means that the final dataset must be weighted. Because of these added costs, the strategy is only usefulwhen two conditions are met.
First, because subsampling may reduce the total number of cases that areultimately available for analysis, the projected impact of nonresponse bias must be large enough to make subsampling worthwhile. A large impactreflects either a low response rate (say, 60 percent or less) or largedifferences between respondents and nonrespondents (i.e., a difference of10 percent or more in the means of the two groups). Differences betweenrespondents and nonrespondents are sometimes apparent from thescreening data. If the standard follow-up procedures are likely to yieldeither low response rates or large differences between respondents andnonrespondents, subsampling the nonrespondents may yield substantialgains.
Second, subsampling must be expected to increase the response rate amongthose who are retained for follow-up. The procedure produces no gain ifthe response rate for the subsample is 50 percent and 50 percent of all theremaining nonrespondents would have taken part in the survey evenwithout subsampling (had they been pursued using the standardprocedures). To be worthwhile, subsampling should produce an increase inthe response rate among the outstanding cases of at least 20 percentrelative to simply continuing with further follow-up efforts for the entiresample.
It may be difficult to tell whether these conditions are met. If standard follow-up efforts are yielding few additional cases and the projected final responserate is low, subsampling may be worth trying.
CONCENTRATE RESOURCES ON A SUBSAMPLE —

CHAPTER 3
3–10 NONRESPONSE IN HOUSEHOLD TRAVEL SURVEYS
Recommendation
When the potential nonresponse bias is large(because response rates are low or respondents andnonrespondents differ sharply), select a subsample ofnonrespondents for intensive follow-up efforts. Thismethod is useful when response rates can beincreased by concentrating resources.
3.5 STATISTICAL METHODS
This section describes the three main procedures used to compensate fornonresponse in surveys—nonresponse weighting, post-stratification, andimputation.1,3
WEIGHTING
Need for weights. Data from surveys often require the use of weights toproduce unbiased population estimates. The weights are typically applied forthree main purposes. First, weights are often needed to compensate fordifferences in the selection probabilities of individual cases. Such differencescan arise by design—a specific study may deliberately overrepresent one ormore subgroups of a population in order to provide enough cases for separateanalyses of the oversampled subgroups. For example, a regional transportationstudy may oversample a smaller jurisdiction to provide enough cases to allowseparate estimates to be made for that jurisdiction. Or differences in selectionprobabilities may arise as an unintended byproduct of the sampling strategy. For example, in telephone samples, households with multiple telephone lineshave more chances of being selected into the sample than households with asingle line. Either way, estimates for the entire sample will be biased unless thedata are appropriately weighted. Weights are needed to compensate for bothdeliberate and inadvertent departures from equal probability sampling. In thetransportation literature, weighting is sometimes referred to as factoring.
Another purpose for weighting is to compensate for subgroup differences inresponse rates. Even if the sample as selected represents the larger populationperfectly, differences in response rates can introduce systematic discrepanciesbetween the population and the sample. For example, in personaltransportation surveys, household size may be related to the probability thathouseholds will provide the required information (see Section 2.2 in Chapter 2for a detailed discussion of characteristics related to nonresponse). Differencesin response rates across subgroups of the sample can introduce bias into theresults. Weighting adjustments can reduce such biases.
A final purpose for weights is to compensate for fluctuations from knownpopulation totals. For instance, if one area were overrepresented in a travel

W1i 1/Pri .
STATISTICAL METHODS FOR REDUCING THE IMPACT OF NONRESPONSE
NONRESPONSE IN HOUSEHOLD TRAVEL SURVEYS 3–11
survey sample purely by chance, it would be possible to use data from thedecennial census or the Current Population Survey (CPS) to adjust for thisdeparture from the population distribution. In addition, adjusting the data toknown population totals can help reduce the impact of undercoverage (e.g., theomission of persons in households without telephones) on survey estimates.
CALCULATING WEIGHTS
Weights are often calculated in three steps.4 The first compensates fordifferences in selection probabilities; the second for differences by subgroup inresponse rates; the third for differences between the composition of the sampleand the composition of the population.
Step 1: the base weight. Typically, the initial, or base, weight (W ) for a1i
case (e.g., a sample household) is calculated as the inverse of that case’sselection probability (Pr):i
All eligible selections—whether they complete the survey or not—shouldreceive a base weight. The selection probability (or sampling rate) is theproportion of the population selected for the study. In a full random-digit dial(RDD) sample survey, the sampling unit is a telephone number and theselection probability is the percentage of possible numbers within the studyarea that were actually included in the sample. This total will include bothnonworking and nonresidential numbers. Consider, for example, a study ofQueens, New York. Suppose Queens encompasses 150 distinct exchanges(e.g., 753-xxxx). Since each exchange includes 10,000 possible numbers (thenumbers 0000 through 9999), the total population of possible numbersincludes 1,500,000. If 1,500 of these numbers are selected (each with the sameprobability), then each would have a selection probability of .001(1,500/1,500,000).
Both the sample and the population from which it was drawn includenonworking and nonresidential numbers, besides the residential numbers thatare actually eligible for the study. The sampling rate is the same for the subsetof residential numbers as for overall set of possible numbers; it is 1 in 1000, or.001. The presence of ineligible units (such as nonworking numbers) in thesample does not affect the calculation of the weights for the eligible units. Insome types of telephone sampling, sampling is restricted to certain subgroupsof the possible telephone numbers. When the sample is restricted in this way,the size of the population of possible numbers will be smaller than 10,000 timesthe number of exchanges in the study area.

CHAPTER 3
3–12 NONRESPONSE IN HOUSEHOLD TRAVEL SURVEYS
In stratified sample designs, the population is first divided into subgroupscalled “strata” and separate samples are selected within each one. Oftendifferent sampling probabilities are used within the different strata. Forexample, the study area might be divided into areas where different modes oftransportation are used more often. High density urban areas might be sampledat a higher rate to increase the number of persons who make trips by walking,riding a bicycle, or taking public transit. Or the sampling rates may be set toensure that separate estimates can be made for different jurisdictions. If thetelephone numbers linked to different areas are subject to different rates ofsampling, then the separate selection probabilities will have to be computed foreach area. Table 3.3 shows an example of how this might be done.
Table 3.3Calculation of Initial Weights in a Stratified RDD Sample
AREA NUMBER OF SIZE OF SELECTION WSELECTIONS POPULATION PROBABILITY
1
New York County 1,500 1,510,000 .00099 1006.7
Kings County 1,500 1,750,000 .00086 1166.7
Queens County 1,500 1,500,000 .00100 1000.0
Bronx County 1,200 880,000 .00136 733.3
Richmond County 800 280,000 .00286 350.0
Note: Both selections and population represent telephone numbers. W1represents the initial weight for sample cases.
Table 3.3 displays a stratified sample of telephone numbers in New York City,with separate sampling rates in each of the five boroughs. Continuing ourearlier example, we have assumed that, in Queens County, 1,500 numbers wereincluded out of 1.5 million possible numbers in the exchanges that serveQueens. That gives a selection probability of .001 for each number and a baseweight of 1,000.
In an RDD survey, this base weight should then be adjusted to compensate forthe fact that people in households with multiple telephones have more than one

W1i1
Pr1i ti
.
W1i1
Pr1i Pr2i
,
STATISTICAL METHODS FOR REDUCING THE IMPACT OF NONRESPONSE
NONRESPONSE IN HOUSEHOLD TRAVEL SURVEYS 3–13
Recommendation
chance of being selected into the sample. The standard adjustment is quitesimple; it is the base weight for household i (1/Pr ) divided by the number of1i
distinct telephone lines (t) in the household:i
To carry out this adjustment, it is necessary to add questions to the interviewto determine how many distinct telephone lines the household has (excludingthose dedicated to faxes or modems). For example, if a household in QueensCounty reports 3 telephone lines, then the adjusted weight will be 333.33 (= 1over 0.001 x 3). In a survey in which households are first screened and then subsampled for themain data collection, the base weight should reflect the selection probabilitiesat both phases of selection—selection into the screening sample and retentionfor the main sample:
in which Pr represents the case’s probability of inclusion in the screening1i
sample and Pr its probability of retention in the main sample.2i
If the weights have been properly calculated, their sum represents an estimateof the size of the population from which the sample is selected. For example,in each stratum in Table 3.3, the weights sum to the stratum population size.
COMPENSATE FOR DIFFERENCES
IN SELECTION PROBABILITIES BY WEIGHTING THE DATA —Each case should receive a base weight equal to theinverse of its selection probability. In a telephonesample, the weight should also reflect the number oflines to which a household is linked.
Step 2: compensating for nonresponse. The base weight (W or W ')1 1
should then be adjusted to compensate for the effects of nonresponse. Nonresponse adjustments ensure that the sum of the weights is unaffected bynonresponse; they do this by reallocating the weights assigned to thenonrespondents among the respondents. In addition, the nonresponse

Rj
nrj
1W1ij
nej
1W1ij
,
W2ij
W1ij
Rj
.
CHAPTER 3
3–14 NONRESPONSE IN HOUSEHOLD TRAVEL SURVEYS
adjustments can reduce the bias introduced by nonresponse by compensatingfor differences in nonresponse rates across subgroups of the sample.
Nonresponse adjustments are calculated by grouping cases into nonresponseadjustment cells and finding the (weighted) response rates for cases in that cell. In our hypothetical survey of New York City, the adjustment cells might be thefive boroughs. For each cell, the weighted response rate is computed using theprocedures described in the first chapter of this report. For cases in cell j (e.g.,telephone numbers in exchanges linked to the Bronx), the weighted responserate (R) is:j
in which the numerator is the sum of the weights for the respondents in cell j(and n is the number of respondents in that cell) and the denominator is therj
sum of the weights for all eligible cases in that cell (and n is the number ofej
eligible cases in the cell). As we noted in Chapter 1, the number of eligiblesmay have to be estimated if there are cases for whom eligibility could not beascertained.
The adjusted weight (W ) is the base weight divided by the weighted response2
rate (R):j
For nonrespondents and ineligible cases, the adjusted weight is set to zero. The sum of the adjusted weights for the respondents in cell j should equal thesum of the base weights for the eligible cases in that cell.
Table 3.4 illustrates the calculation of adjusted weights for our hypotheticalsample in New York City. The table shows the weighted number of eligiblesand respondents in each borough, the response rate, and the adjusted weight,which incorporates an adjustment for nonresponse. For example, in QueensCounty, 700 of the selected telephone numbers turned out to be eligible for thestudy. The sum of the weights for these cases was 700,000 (700 cases, eachwith a weight of 1,000). The sum of the weights for the 560 respondents was560,000. The weighted response rate was, therefore, 0.8 (560,000/700,000). The adjusted weight for each respondent from Queens is 1,250 (= 1,000/0.8);each of the nonrespondents receives a weight of 0. The adjusted weights sum

W2ijk
W1ijk
R1j R2k
STATISTICAL METHODS FOR REDUCING THE IMPACT OF NONRESPONSE
NONRESPONSE IN HOUSEHOLD TRAVEL SURVEYS 3–15
to the same total as the initial weights for the eligible cases (700,000 = 700 x1,000 = 560 x 1,250). In this example, all the cases in each adjustment cellhave the same initial weight. In most surveys, different cases would begin withdifferent initial weights.
Table 3.4Calculation of Adjusted Weights in a Stratified RDD Sample
AREA NUMBER OF NUMBER OF RESPONSE W WELIGIBLE SELECTIONS RESPONDENTS RATE
1 2
New York County 604,000 (600) 483,200 (480) .80 1006.7 1258.3
Kings County 787,500 (675) 583,350 (500) .74 1166.7 1575.0
Queens County 700,000 (700) 560,000 (560) .80 1000.0 1250.0
Bronx County 352,000 (480) 228,800 (312) .65 733.3 1128.2
Richmond County 112,000 (320) 67,200 (192) .60 350.0 583.3
Note: The numbers given in the second and third columns are weighted (using W , the initial1 weight for sample cases); the parenthetical entries in those columns are raw numbers ofeligible and responding cases, respectively. W is the adjusted weight. 2
Ideally, adjustment cells should be formed using variables that are related bothto the likelihood of nonresponse and to the substantive variables of interest inthe survey (such as travel behavior). Often, however, the choices are quitelimited because so little is known about the nonrespondents and because bothrespondents and nonrespondents must be classified into adjustment cells. Forexample, in a telephone survey, the only information available for thenonrespondents may be their area code and exchange (and any geographicinformation that can be inferred from these). Thus, the nonresponseadjustment cells have to be formed using whatever information happens to beavailable for the nonrespondents.
When there are two phases of data collection—a screening phase and a maininterview phase—separate nonresponse adjustments should be calculated foreach phase. The same adjustment cells need not be used in both phases. Infact, the screening data are generally useful for forming adjustment cells tocompensate for nonresponse to the main data collection. If R denotes the1j
weighted response rate in the first phase of data collection and R the response2k
rate in the second phase, then the adjusted weight would be:

W3ij W2ij
Nj
W2ij
.
CHAPTER 3
3–16 NONRESPONSE IN HOUSEHOLD TRAVEL SURVEYS
Recommendation
for the respondents and zero for the nonrespondents.
COMPENSATE FOR DIFFERENCESIN NONRESPONSE RATES BY ADJUSTING THE BASE WEIGHT —The base weights should be adjusted for nonresponse. If data are collected in two phases, separately calculatenonresponse adjustments for each phase.
Step 3: post-stratifying to population estimates. As we noted, the sumof the weights represents an estimate of the size of the survey population. Sometimes independent estimates of the size of the population are available(for example, from decennial census data). A technique called post-stratification can be used to bring the survey weights into agreement with theoutside population figures. Post-stratification is used to correct for two typesof errors in survey estimates—random sampling error and coverage error. Random sampling error refers to chance departures of the sample from thepopulation it is selected to represent. Post-stratification can be expected toreduce random sampling error when a population estimate is derived from thedecennial census or from a survey with a much larger sample than one used inthe transportation survey being weighted. Coverage errors refer to systematicproblems regarding who is included or excluded from the sample. Post-stratification can be expected to reduce the effects of coverage error when thepopulation estimate gives better coverage of the population than thetransportation survey sample does. For example, if a telephone survey wasused to collect the data, the sample will necessarily exclude households withouttelephones. The two most frequent sources of figures for post-stratificationare the decennial census and the Current Population Survey; these are thoughtto achieve much higher levels of coverage of the general population than othersurveys do.
Post-stratification involves comparing the sum of the weights (i.e., W) for a2
given subgroup with the population estimate for that group. For example,decennial census figures are available for age-race-sex groupings at the level ofcounties and minor civil divisions. The post-stratification adjustment iscalculated by multiplying the adjusted weight of cases in a subgroup, saysubgroup j, by the ratio between the population estimate for that subgroup (N)jand the sum of the weights for sample cases in that subgroup:
The adjustment cells are typically defined in terms of areas (such as townships)and one or more demographic variables (such as household size). Forexample, in weighting the data from a household travel survey carried out in alarge metropolitan area, the analysts took into account household size, the

STATISTICAL METHODS FOR REDUCING THE IMPACT OF NONRESPONSE
NONRESPONSE IN HOUSEHOLD TRAVEL SURVEYS 3–17
number of vehicles available, and zones (defined by response rates) withintownships in the sample area 2 .
Table 3.5 illustrates the calculation of post-stratified weights with the datafrom our hypothetical survey of New Yorkers. The sum of the adjustedweights (W ) for Queens is 700,000; according to the 1990 census, the total2
number of households was about 720,149. This produces a post-stratificationadjustment factor of approximately 1.029 and a final weight (W) of 1285.983
(=1,250 x 1.029).
Table 3.5Calculation of Post-Stratified Weights
AREA WEIGHTED NUMBER POPULATION ADJUSTMENT W WOF RESPONDENTS ESTIMATE FACTOR
2 3
New York County 604,000 (480) 716,422 1.186 1258.3 1492.55
Kings County 787,500 (500) 828,199 1.052 1575.0 1656.40
Queens County 700,000 (560) 720,149 1.029 1250.0 1285.98
Bronx County 352,000 (312) 424,112 1.205 1128.2 1359.33
Richmond County 112,000 (192) 130,519 1.165 583.3 679.77
Note: Population estimates are from the 1990 census and represent the number ofhouseholds in each county. W is the adjusted weight; and W , the post-2 3 stratified weight.
Population figures for poststratification adjustments (the values for N in thej
equation) can be obtained from decennial census data, the CPS, or otherCensus Bureau estimates. Which source to use will depend on how recent thedata are, whether they are based on sufficient sample sizes (in the case of theCPS), and whether they provide appropriate grouping variables.
So far, we have emphasized the calculation of household weights. But in manytransportation both household-level and person-level weights should becalculated. Typically, the same initial weights would be used (since everyhousehold member is selected within sample households). The two sets ofweights would, however, incorporate different nonresponse and post-stratification adjustments.

Wij
Nj
nj
.
CHAPTER 3
3–18 NONRESPONSE IN HOUSEHOLD TRAVEL SURVEYS
Recommendation
IMPROVE THE ESTIMATES BY ADJUSTING WEIGHTS TO KNOWN POPULATION TOTALS —Multiply the weights for the cases in a cell by the ratiobetween the population estimate for the cell to thesum of the weights for that cell.
ALTERNATIVE METHODS FOR WEIGHTING
Factoring to population totals. In some cases, it is possible to skip thisthree-step process and simply to weight up to population figures instead:
In this equation, N represents the population total for weighting cell j and nj j
the number of completed cases in that cell. The population figures could bebased on decennial census data, the CPS, or some other reliable source. Touse this method, it is important that the sample be selected with equalprobabilities within each group. Suppose, for example, in our hypotheticalsurvey of New York City, we had used this method of weighting. If the cellsused for weighting were the different boroughs, then this method wouldgenerally yield the same result as the three-step method described earlier. Note, however, that within each borough the sample would overrepresenthouseholds with multiple telephone lines. In general, this simple method ofweighting ignores any differences in selection probabilities within a weightingcell. Thus, we cannot recommend this approach unless the sample wasselected with equal probabilities within each cell.
More complex schemes for weighting. The method of post-stratificationdescribed earlier assumes that population estimates are available for eachweighting cell. Sometimes data are available for each variable used in definingthe cells but not for every combination of these variables. Figures may beavailable for the total number of households in each township in a county andfor each household size by number of vehicle combination but not for thethree-way combination of township by household size by number of vehicles. It is still possible for the weights to take all three variables into account using atechnique known variously as multidimensional raking, iterative proportionalfitting, or the Deming-Stephan procedure. A very similar procedure—theFratar method—has been used in transportation planning to project the growthin the number of trips over time 5 .
The basic principle behind the procedure is simple. The weights are adjustedto bring the survey figures into line with one set of population figures; thenthey are adjusted to agree with the other set of population figures. They are

STATISTICAL METHODS FOR REDUCING THE IMPACT OF NONRESPONSE
NONRESPONSE IN HOUSEHOLD TRAVEL SURVEYS 3–19
then readjusted to agree with the first set of figures, and so on, until the surveyweights agree with both sets of population estimates.
An example will make the method clearer. Suppose we have populationfigures for each of four classes of household and for each of two geographiczones, but not for the cells formed by crossing the household classes with thezones. The goal is to bring the sums of the sample weights into agreementwith these figures. The census figures indicate an overall total of 200,000households in the study area.
Table 3.6Population Data Available for Weighting Adjustment
SUBGROUP POPULATION FIGURE
HOUSEHOLD CLASSES
No available vehicles 25,000 One person in hh/one available vehicle 50,000 Two persons in hh/one available vehicle 75,000 Two or more available vehicles 50,000
GEOGRAPHICAL CLASSES Low response rate townships 120,000 High response rate townships 80,000
The preliminary weights prior to any post-stratification total 180,000,distributed as shown in Table 3.7.
Table 3.7Sums of Sample Weights by Weighting Class
SUBGROUPTOWNSHIP GROUP TOTAL
Low Response Rate High ResponseRate
HOUSEHOLD CLASSESHOUSEHOLD CLASSES
No available vehicles 12,000 8,000 20,000 One person in hh/one available vehicle 40,000 20,000 60,000 Two persons in hh/one available vehicle 28,000 32,000 60,000 Two or more available vehicles 20,000 20,000 40,000

W1,rijk W0
ijk
Nj
T 0j
.
CHAPTER 3
3–20 NONRESPONSE IN HOUSEHOLD TRAVEL SURVEYS
TOTALTOTAL 100,000 80,000
Not only is the grand total off (180,000 vs. 200,000), but the row and columntotals do not match the corresponding figures in Table 3.6.
The process of bringing the two sets of numbers into line starts with anadjustment to the row totals. Let T designate the sum of the weights for ajk
given cell, T the sum across the cells in row j, and T the total across thej+ +k
cells in column k. We will use superscripts to denote the different iterations ofthe process, with 0 representing the initial weights and totals before anyadjustment to population figures. The new weight adjusted to the rowpopulation figures will simply be the old, unadjusted weight times anadjustment factor:
The adjustment factor (N /T ) is the ratio between the population figure forj+ j+0
row j and the sum of the current weights in that row. For example, all theweights in the cell for households with no available vehicles are increased by1.25 (=25,000/20,000). After the application of the adjustment factor, the sumof the weights in each row equals the population figure for the row (N). Thisj+
is shown in Table 3.8. Unfortunately, the column totals are still off.
Table 3.8Sums of Sample Weights after Initial Adjustment to Row Targets
SUBGROUP TOWNSHIP GROUP TOTAL
Low Response Rate High ResponseRate
HOUSEHOLD CLASSESHOUSEHOLD CLASSES
No available vehicles 15,000 10,000 25,000 One person in hh/one available vehicle 33,333 16,667 50,000 Two persons in hh/one available vehicle 35,000 40,000 75,000 Two or more available vehicles 25,000 25,000 50,000
TOTALTOTAL 108,333 91,667
Thus, the next step is to adjust the new weights to the column totals. Onceagain, this is done by multiplying the current weights by an adjustmentfactor—the ratio between the population figure for the column and the sum ofthe current weights for that column:

W1,cijk W1,r
ijk
N k
T 1,rk
.
Wm 1,rijk Wm,c
ijk
Nj
T m,cj
Wm 1,cijk Wm 1,r
ijk
N k
T m 1,rk
STATISTICAL METHODS FOR REDUCING THE IMPACT OF NONRESPONSE
NONRESPONSE IN HOUSEHOLD TRAVEL SURVEYS 3–21
That is, the weights of cases in the first column will be adjusted by a factor ofabout 1.11 ( 120,000/108,333) and those of cases in the second column willbe adjusted by a factor of about 0.87 ( 91,667 / 80,000). Table 3.9 showsthe results. The column totals match the targets (except for rounding error)but now the row totals are off.
Table 3.9Sums of Sample Weights after Adjustment to Column Targets
SUBGROUP TOWNSHIP GROUP TOTAL
Low Response Rate High ResponseRate
HOUSEHOLD CLASSESHOUSEHOLD CLASSES
No available vehicles 6,615 8,727 25,342 One person in hh/one available vehicle 36,923 14,546 51,469 Two persons in hh/one available vehicle 38,769 34,909 73,678 Two or more available vehicles 27,692 21,818 49,510
TOTALTOTAL 119,999 80,000
The whole process is now repeated, starting with the sums in Table 3.9(instead of those in Table 3.7). More generally, the weights produced in oneiteration (iteration m+1) adjust those produced in the previous iteration(iteration m):
For example, the weights in the first row of Table 3.9 would be adjusted by afactor of 1.01 ( 25,342 / 25,000); those in the second row would be adjustedby a factor of 1.03 ( 51,469 / 50,000); and so on.

CHAPTER 3
3–22 NONRESPONSE IN HOUSEHOLD TRAVEL SURVEYS
Recommendation
The process generally produces only small changes after three or fouriterations. This method can be used with three or more dimensions as well aswith two, as in our illustration.
ADJUST WEIGHTS TO POPULATION TOTALS , EVENWHEN TOTALS ARE AVAILABLE ONLY FOR INDIVIDUAL VARIABLES —Iterative proportional fitting (also known as frataring orraking) can be used when independent populationestimates are not available for every weighting cell,but are available for row and column totals.
EDITING AND IMPUTATION
We have recommended both nonresponse weighting and post-stratification asmethods for reducing the impact of unit nonresponse on survey results. Whenindividual data items are missing, we recommend a different approach—theimputation of missing values. With imputation, information that is obtainedfor a case is used to make a guess about the information that is missing.
Statistical imputation should be distinguished from editing of the data or“logical” imputation. It is sometimes possible to figure out what the missingvalue should be from an examination of the data that were obtained. Forexample, the destination for a trip may be missing in the diary for one familymember but included in the diary for another. Under these circumstances, itmay be reasonable to infer, or “logically impute,” the missing destination. Similarly, when a respondent’s sex is missing but she is listed as the mother ofanother household member, it is reasonable to fill in her sex as female. Suchediting procedures are outside the scope of this report but they can also helpreduce the amount and impact of missing data.
Three Statistical Techniques. Three statistical techniques are commonlyused to impute missing values 6 :
Hot deck imputation, in which the missing value is replaced by the valueobtained from another case (the “donor”) with similar characteristics;
Regression-based imputation, in which the missing value is replacedby the value predicted from a regression model;
Cell mean imputation, in which the missing value is replaced by themean of the values obtained from all other cases that provided data.
With both hot deck and cell mean imputation, cases are first grouped into cellsbased on variables that are obtained for all (or nearly all) of the cases. Theimputation cells serve a function similar to the one played by the adjustment

STATISTICAL METHODS FOR REDUCING THE IMPACT OF NONRESPONSE
NONRESPONSE IN HOUSEHOLD TRAVEL SURVEYS 3–23
cells in nonresponse weighting. Cases with similar values on the surveyvariables of interest are placed together in a cell, and the data for therespondents within the cell (or those with complete data) are used to representthe nonrespondents (or those with missing data).
Cell mean imputation is rarely used in surveys, because (except in a fewinstances) it leads to biased estimates—by replacing each missing value withthe cell mean, this method of imputation leads to serious underestimates of thevariance of the survey statistics.
Regression-based methods also have problems:
Unless a “residual” is added to the imputed value, the variance of surveystatistics will be underestimated;
Different models have to be developed for each variable with missingvalues, and this model-building can be difficult and time-consuming;
Missing values in the predictors can greatly complicate the imputationprocess.
Both cell-mean and regression-based imputation have their place. But for mostsurveys, the hot deck approach will be the most practical method.
It is worth noting that new methods of imputing missing values are beingdeveloped all the time. The new methods include multiple imputation (in whicheach missing value is replaced repeatedly, yielding multiple imputed values)and more sophisticated methods of single imputation. Multiple imputation hasthe advantage that, when done correctly, it does not underestimate the varianceintroduced by the imputation process 7 . All the other methods tend, to somedegree, to lead to underestimation of the variance of the estimates (with cell-mean imputation producing the worst underestimation). However, software isonly now being developed for these new methods; as a result, hot deckimputation, which can be carried out with widely available software, remainsthe most practical method for general use.
Using hot deck imputation. Hot deck imputation is carried out in foursteps:
1) Group cases into imputation cells. The goal here is to group caseslikely to have similar values on the variable in question. Depending on thevariable, the imputation cells might take into account household size andcomposition, the predominant mode of transportation, and the age and sexof the respondent.

CHAPTER 3
3–24 NONRESPONSE IN HOUSEHOLD TRAVEL SURVEYS
2) Sort the cases within cells. Often cases are then sorted within theimputation cells. For example, cases may be sorted by the total number oftrips they made during the survey period. The sorting allows theimputation to take into account continuous variables as well as thecategorical variables used in forming the imputation cells. The final sortmay also be done randomly.
3) Replace the missing values. The value imputed to a case is just theactual value for the preceding case (the “hot deck” or record) in the cellthat has a non-missing value for the variable in question. For example, ifthe third case in the imputation cell had a valid value for a variable and thefourth case was missing that variable, then the value for the third case (the“donor”) would be used as the imputed value for the fourth. Sometimes, alimit is imposed on the number of times a given case can serve as a donor(for example, no more than three times). This limits the impact of anysingle case on the final survey statistics.
4) Edit the imputed values. Imputation can produce values that areinconsistent with other information about the case. As a result, the imputedvalues should undergo the same editing and consistency checks as othervalues. Inconsistent or out-of-range values should be reimputed.
As this description makes clear, hot deck imputation is not a simple process. Moreover, it may be useful to form different imputation cells for differentvariables, making the process even more complex. Several computer programsare available for carrying out imputation and may simplify the work involved.
Still, it is worth bearing in mind the following principles about hot deckimputation:
1) It is a statistical procedure and it works well on the average. Itshould not be used to impute data that are unique to an individual case. Forexample, it would not usually make sense to use hot deck imputation toimpute a purpose for a specific trip.
2) The more data that are imputed for a given case, the lessaccurate the imputed values are likely to be. It makes sense toimpute one or two key missing values for a case. It makes far less sense toimpute all of the data for a missing person within an otherwise completehousehold, or to impute all of the data for a missing trip in an otherwisecompleted diary.

STATISTICAL METHODS FOR REDUCING THE IMPACT OF NONRESPONSE
NONRESPONSE IN HOUSEHOLD TRAVEL SURVEYS 3–25
Recommendation
IMPUTE MISSING VALUES FOR KEY SURVEY VARIABLES —Use hot deck imputation to replace missing values ona few key survey variables. Statistical imputationshould not be used to impute all the data for a personor all the data regarding a trip.

CHAPTER 3
3–26 NONRESPONSE IN HOUSEHOLD TRAVEL SURVEYS
1. For an introduction to the statistical treatment of nonresponse, see Lessler, J.T., &Kalsbeek, W.D. (1992). Nonsampling Error in Surveys. New York: John Wiley & Sons.
2. Kim, H., Li, J., Roodman, S., Sen, A.., Sööt, S., & Christopher, E. (1993). Factoringhousehold travel surveys. Transportation Research Record, 1412, 17-22.
3. Kalton, G. (1983). Compensating for Missing Survey Data. Ann Arbor: Institute forSocial Research.
4. Kish, L. (1992). Weighting for unequal P . Journal of Official Statistics, 8, 183-200.i
5. Fratar, T., Brant, A.E., & Buttz, C.W. (1962). Estimating traffic patterns in urban areas.Paper presented at the International Road Federation, Ivth World Meeting, Madrid Spain,October 14-20.
6. Little, R.J., & Rubin, D.B. (1987). Statistical Analysis with Missing Data. New York:John Wiley & Sons.
7. Rubin, D. (1986). Basic ideas of multiple imputation for nonresponse. SurveyMethodology, 12, 37-47.

APPENDICES
NONRESPONSE IN HOUSEHOLD TRAVEL SURVEYS A–1
APPENDICES

A–2 NONRESPONSE IN HOUSEHOLD TRAVEL SURVEYS
APPENDIX 1: QUESTIONS AND ANSWERS TO AVERT NONRESPONSE
Q1. I’m too busy.
a. We can reschedule the interview for a time that’s more convenient for you.b. Let’s start the interview now and see how far we can get.
Q2. What’s the purpose of this call?
a. [If an advance letter has been sent] I’m [NAME] from [FIRM NAME]. This isabout the letter you should have received in the past few days.
b. We’re conducting research for [AGENCY NAME]. c. This is not market research, we are not selling anything, and I’m not soliciting
money.d. [If necessary, give the respondent the name and number of someone they can
call to verify your name and affiliation.]
Q3. How long will this take?
a. On the average, the interview takes about [AVERAGE LENGTH] minutes.
Q4. How did you get my name/number?
a. Your household was selected as part of a scientific sample of [AREA NAME].
Q5. What’s the purpose of this study?
a. We are gathering data on transportation. This information is important toarea transportation planners.
b. The study is sponsored by [AGENCY NAME]. c. The information from the study will be used by local governments to make
plans for new roads, improve commuter services, and for other planningpurposes.

APPENDICES
NONRESPONSE IN HOUSEHOLD TRAVEL SURVEYS A–3
Q6. How can I be assured of confidentiality?
a. Before processing the information, we remove any connection between yourname or that of your family from the questionnaire.
b. The data are for statistical purposes only. That’s why it’s not necessary toconnect your name with the information you provide.
c. All people working on the study are required to sign forms pledging to keepthe data confidential. They will be fired if they violate this pledge.
Q7. I don’t do surveys.
a. This is not market research. It is a study sponsored by [AGENCY NAME],which is responsible for transportation planning in this area.
b. Your name will not be sold to any mailing lists.
Q8. Can’t someone else do it? There are plenty of other people withmore time.
a. You were chosen through a scientific sampling procedure. You cannot bereplaced.
b. We can’t replace you with anyone else. We need your personal knowledge. c. You represent many other people. It is important that you be included in the
survey.
Q9. I’m not representative of other people.
a. Exactly, and other people cannot speak for you. That’s why you areinvaluable to our study.
Q10. Why is [AGENCY NAME] interested in this?
a. They are responsible for transportation planning in this region of the country.
Q11. Who’s paying for this?
a. This study is being funded by [AGENCY NAME].
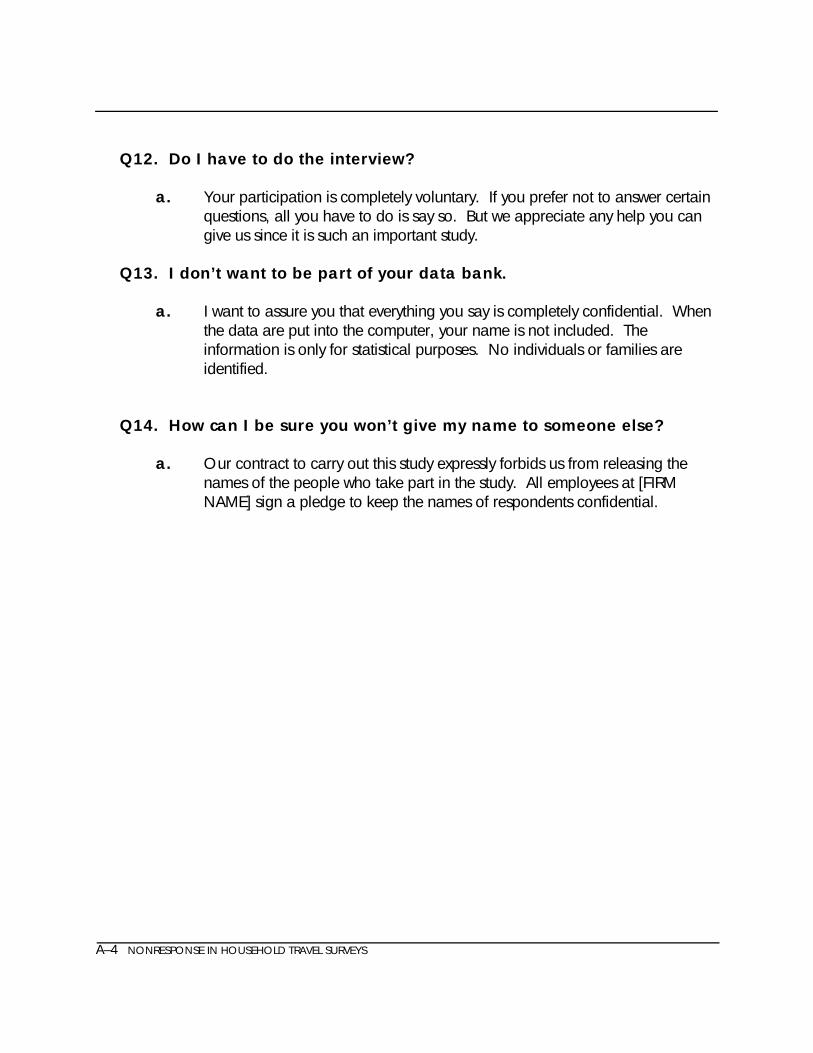
A–4 NONRESPONSE IN HOUSEHOLD TRAVEL SURVEYS
Q12. Do I have to do the interview?
a. Your participation is completely voluntary. If you prefer not to answer certainquestions, all you have to do is say so. But we appreciate any help you cangive us since it is such an important study.
Q13. I don’t want to be part of your data bank.
a. I want to assure you that everything you say is completely confidential. Whenthe data are put into the computer, your name is not included. Theinformation is only for statistical purposes. No individuals or families areidentified.
Q14. How can I be sure you won’t give my name to someone else?
a. Our contract to carry out this study expressly forbids us from releasing thenames of the people who take part in the study. All employees at [FIRMNAME] sign a pledge to keep the names of respondents confidential.

APPENDICES
NONRESPONSE IN HOUSEHOLD TRAVEL SURVEYS A–5
APPENDIX 2: EXAMPLES OF GOOD AND BAD QUESTIONNAIRE DESIGN

A–6 NONRESPONSE IN HOUSEHOLD TRAVEL SURVEYS
Example of poor information organization—a trial version of the U.S. Decennial Census questionnaire using a matrix format.

APPENDICES
NONRESPONSE IN HOUSEHOLD TRAVEL SURVEYS A–7
A revision of the same questionnaire that retains the matrix organization but offers improved navigational aids. The white answer spaces stand out against the shaded background (blue in the original); in addition, the arrows at the top of each column and the white borders between the columns guide the respondent through the questions in the intended order.

NONRESPONSE IN HOUSEHOLD TRAVEL SURVEYS G–1
GLOSSARY OF TERMS
ACTIVITY: The main business or undertaking engaged in by an individual, alone or with others.Activities include: work and work-related, school, shopping, personal business,preparing a meal, cleaning the home, athletics/exercise, visiting, etc. Activities havethe following associated attributes: type, duration, start time, end time, location, andmode of travel to get to the activity location (in the case of an activity that takes placeat a location that is different from the previous activity). Participation in activities atdifferent locations is the underlying reason for trip-making. Trip purpose is associatedwith the main activity type at the destination, for those activities requiring a trip.
ADVANCE LETTER: A letter sent to a sample member (household or person) via mail in advanceof the interviewer’s attempt to contact the member. An advance letter is meant to“warm-up” the member to the forthcoming call from the interviewer.
CALLBACKS: The re-approach of a sample member after previous contact attempts have beenunsuccessful. Callbacks reduce the likelihood of nonresponse error by improving thecontact rate.
CALLING PROTOCOL: A calling schedule for contacting sample members. Most calling protocols take into account the outcomes and times of previous calls in an attempt toimprove the chances of reaching sample members.
COGNITIVE INTERVIEW: A technique for developing survey questionnaires that focuses on thethought processes respondents go through as they arrive at answers to surveyquestions. In a cognitive interview, respondents are asked to think out loud as theyanswer draft survey questions. They may also be asked to respond to a number offollow-up probes to reveal how they arrived at their answers and whether the contentor wording of the items should be improved.
COMPUTER ASSISTED PERSONAL INTERVIEWING (CAPI): Face-to-face interviewingperformed with the assistance of a computer. In a CAPI interview, the interviewerreads the questionnaire items from a computer screen and records the respondent’sanswers by entering them into the computer. CAPI systems may also form andmanage the sample, display the introductory script, control the wording of the items,check for internal consistency among the respondent’s answers, and perform anynumber of other operations associated with the collection or management of the data.
COMPUTER ASSISTED TELEPHONE INTERVIEWING (CATI): Telephone interviewingperformed with the assistance of a computer. CATI systems are similar to CAPIsystems in that the questionnaire items are displayed on line and the interviewer entersthe respondent’s answers with the keyboard or mouse. Most CATI systems perform

GLOSSARY OF TERMS
G–2 NONRESPONSE IN HOUSEHOLD TRAVEL SURVEYS
other operations related to the management or collection of data by telephone. Theymay, for example, supply the interviewers with instructions, manage the samplingpool, schedule call attempts, record the outcomes of the calling effort, and/ormonitor the progress of the interviewers.
CONVERTING: Recontacting initial refusals one or more times in an attempt to persuade them toparticipate in the survey.
CRITICAL ITEMS: A set of questions that must be completed by the sample member to classify thecase as a respondent. The set typically includes all items that are essential toaccomplishing the major goals of the survey.
DISPOSITION CODE: A code assigned to each case (member) in the sample that records themost recent or final outcome (e.g., ring-no-answer, nonworking number, respondentrefusal, etc.) of the data collection effort. Disposition codes are used to track thestatus of each sample member, to monitor and manage the field effort, and to computeresponse rates.
ELIGIBLE UNITS (ELIGIBLES): Sample units who are eligible to participate in the survey becausethey are part of the target population.
FIELD PERIOD: The time period during which data are collected from sample members.
HOUSEHOLD: The U.S. Bureau of the Census defines a household as all persons who occupy thesame housing unit. A household may consist of a family, one person living alone, twoor more families living together, or any other group of related or unrelated personswho share living arrangements.
HOUSING UNIT: The U.S. Bureau of the Census defines a housing unit as a house, apartment,mobile home, group of rooms, or single room that is occupied (or if vacant, is intendedfor occupancy) as separate living quarters. To qualify as a housing unit, the occupantsmust live and eat separately from other persons in the building and have direct accessto their unit from the outside of the building or through a common hall.
IMPUTATION: A statistical or logical technique by which missing data are inferred from otherinformation provided by the respondent and/or other respondents.
INCENTIVE: A monetary or nonmonetary gift or payment offered to sample members in an effortto gain their cooperation.
INELIGIBLE UNITS (INELIGIBLES): Sample units who are not qualified to participate in a surveybecause they do not belong to the target population.

GLOSSARY OF TERMS
NONRESPONSE IN HOUSEHOLD TRAVEL SURVEYS G–3
ITEM NONRESPONSE (MISSING DATA): The failure to obtain a specific piece of data from aresponding member of the sample.
LANGUAGE BARRIERS: Language difficulties that prevent or hinder a sample member fromparticipating in a survey. Such difficulties typically arise when the native language of a sample member is something other than the language(s) used in the survey.
LOGICAL IMPUTATION/EDITING: Techniques by which missing data are logically (rather thanstatistically) deduced from known information about the respondent.
MISSING DATA: See item nonresponse.
NONRESPONSE: Failure of the survey to obtain the desired information from eligible samplemembers.
NONRESPONSE WEIGHTING: Postsampling statistical adjustment (weighting) to partiallycompensate for possible nonresponse error. Nonresponse weighting is different fromthe postsampling weighting that is routinely performed to adjust for unequalprobabilities of selection.
NONWORKING NUMBER: A telephone number that has not been assigned to a unit by thetelephone company.
OPEN-ENDED QUESTION: A survey question that asks the respondent to phrase the answer inhis or her own words.
PAPER-AND-PENCIL INTERVIEWING (PAPI): An interview in which the interviewer reads thequestions from a printed questionnaire and records the answers directly onto thequestionnaire.
POSTSTRATIFICATION: When case weights are adjusted to agree with independent estimates ofpopulation totals. Poststratification compensates for differences between thedistribution of characteristics in the sample and the distribution of characteristics in thetarget population.
PRETEST (PILOT TEST): A relatively small number of practice interviews used to test and refinethe survey materials and/or the field procedures before the conduct of the main survey.
PROXY: Someone other than the selected sample member who answers survey questions onbehalf of that member.
RANDOM DIGIT DIALING (RDD): Techniques that form samples by adding random digits to

GLOSSARY OF TERMS
G–4 NONRESPONSE IN HOUSEHOLD TRAVEL SURVEYS
the telephone prefixes that fall within the sampling area so as to include listed(published) and unlisted numbers in the sample.
REFUSALS: Sample members who refuse to participate in the screening or main data collectionphase of a survey.
RESPONDENT RULES (RESPONDENT SELECTION): Rules that are used by the interviewers tochoose a respondent from all eligible members within a sampling unit.
RESPONSE RATE: A measure of a survey’s level of success in obtaining measurements for alleligible units in the sample; the number of respondents divided by the total number ofeligible units in the sample.
RESULT CODE: See disposition code.
SAMPLING FRAME: A list of units that includes the target population from which the surveysample is drawn.
SCREENING INTERVIEW: A preliminary interview used to determine the eligibility of samplemembers. Sample members who meet the eligibility requirements are often recruitedfor more detailed data collection during this interview.
SELF-ADMINISTERED QUESTIONNAIRE: A questionnaire that is completed by the samplemember without the assistance of an interviewer. Respondents to self-administeredquestionnaires are asked to read the questions and record the answers on their own.
STATISTICAL IMPUTATION: Statistical technique by which missing data for questions are inferredfrom information provided by the respondent and/or other respondents. In hot deckimputation, data are taken from another case (the donor) similar to the case with themissing data. In regression-based imputation, the imputed value is predicted fromother information provided by the same case.
STRATIFICATION: Process in which units with similar characteristics are divided into groupscalled strata before the sampling process begins. Each unit is assigned to one and onlyone stratum based on prior knowledge about the unit. Separate samples are thenselected within each stratum.
STRATIFIED SAMPLE: The sample that is formed when independent random samples are selectedfrom each stratum (or cell) of a stratified sampling design. (Also see stratification.)
TARGET POPULATION: The finite population the survey intends to cover.

GLOSSARY OF TERMS
NONRESPONSE IN HOUSEHOLD TRAVEL SURVEYS G–5
TERMINATIONS/BREAKOFFS: Sample members who begin but terminate a interview before theyprovide enough information to be classified as respondents.
TRIP: One-way travel from one address (place) to another by any means of transportation (e.g., private motor vehicle, public transportation, bicycle, or walking). When thetravel includes more than one destination and the travel time between destinationsexceeds five minutes, or the purpose for travel to one location differs from that of theother, the travel between locations is counted as a separate trip.
UNIT NONRESPONSE: The failure to obtain questionnaires or data collection forms from aneligible sample member.
WEIGHTED RESPONSE RATE: A response rate that is calculated using the inverse of theselection probabilities as the weight. The weighted response rate is an estimate of theproportion of the target population represented by the respondents to the survey.
WORKING RESIDENTIAL NUMBER (WRN): Telephone numbers that have been assigned toresidential housing units by the telephone company.

GLOSSARY OF TERMS
G–6 NONRESPONSE IN HOUSEHOLD TRAVEL SURVEYS
REFERENCES
Henry, Gary T. (1990). Practical Sampling. Newbury Park, CA: Sage.
Lavrakas, Paul J. (1993). Telephone Survey Methods: Sampling, Selection, and Supervision. 2nded. Newbury Park, CA: Sage.
U.S. Department of Commerce. (1992). Bureau of the Census. 1990 Census of Population andHousing . Technical Documentation: Summary Tape File 3 on CD-ROM
U.S. Department of Transportation. Federal Highway Administration. User’s Guide for thePublic Use Tapes: 1990 National Personal Transportation Survey. Publication No. FHWA-PL-92-007 Henry, Gary T. (1990). Practical Sampling. Newbury Park, CA: Sage.