Embed Size (px)
Citation preview
Response Rates and Nonresponse in Establishment Surveys – BLS and Census Bureau
Rita Petroni, Richard Sigman, Diane Willimack (Census Bureau) Steve Cohen, Clyde Tucker (Bureau of Labor Statistics)
This paper has been prepared for presentation to the Federal Economic Statistics Advisory Committee (FESAC) on December 14, 2004. It represents work in progress and does not represent any agency’s final positions on issues addressed. The FESAC is a Federal Advisory Committee sponsored jointly by the Bureau of Labor Statistics of the U.S. Department of Labor and by the Bureau of Economic Analysis and the Bureau of the Census of the U.S. Department of Commerce.
The authors wish to thank subject matter specialists and program managers who provided information reported in this paper. We also express our gratitude for many helpful comments from agency reviews.
2
I. Introduction This paper supplements and extends information on response provided by the Interagency Group on Establishment Nonresponse (IGEN) for the Bureau of Labor Statistics (BLS) and the U.S. Census Bureau. IGEN was formed in 1998 to examine nonresponse issues in establishment surveys. The group presented papers at the 1998 Council of Professional Associations on Federal Statistics (COPAFS) Conference, the 2000 International Conference on Establishment Surveys (ICES-2), and the 2000 COPAFS conference. (Interagency Group on Establishment Nonresponse, 1998 (IGEN98); Shimizu, 2000; Ramirez, et al., 2000). The Bureau of Labor Statistics (BLS) is the main collector and provider of data for the Federal Government in the broad field of labor economics and statistics. BLS conducts a wide variety of establishment surveys to produce statistics on employment, unemployment, compensation, employee benefits, job safety, and prices for producers, consumers, and U.S. imports and exports. Data are collected from the full spectrum of establishments including manufacturers, retailers, services, state employment agencies, and U.S. importers and exporters of goods and services. The Census Bureau is the Federal Government's main collector and provider of data about the people and economy of the United States. It conducts over 100 different establishment surveys and censuses that measure most sectors of the nation's economy, with the exception of agriculture. These surveys collect a wealth of general statistics such as sales, shipments, inventories, value of construction, payroll, and employment. The Census Bureau also conducts about 30 establishment surveys sponsored by other government agencies that collect specialized establishment data from manufacturers, educational institutions, hospitals, prisons, and other establishments. After providing a literature review, we consider survey response measurement for BLS and Census Bureau surveys. We discuss each agency’s approach to defining and measuring response rates, and provide examples of response rates and trends. In Section IV, we examine methods that the BLS and Census Bureau have used to encourage response. We follow with a discussion of nonresponse reduction research that the two agencies have conducted before concluding with future plans. II. Literature Review IGEN98 provides an excellent literature review of nonresponse for both household and establishment surveys and censuses. The following summarizes the IGEN98 literature review of establishment nonresponse:
• In an international survey of statistical agencies (Christianson and Tortora, 1995), about half reported declines in establishment survey response rates for the previous 10 years. Steady or increasing response rates were attributed to increased effort and resources devoted to nonresponse follow-up, automation, improved pre-notification, reductions in the amount of data collected, and other changes to data collection procedures.
3
• Hidiroglou, Drew, and Gray (1993) offer a “conceptual framework for the definition of response and nonresponse that is suitable for both business and social surveys.” They provide an extensive list of terms and definitions to support response and nonresponse measurement, along with descriptions of both business and social survey procedures to reduce nonresponse. The authors recognize several characteristics unique to businesses that impact nonresponse in establishment surveys.
• Tomaskovic-Devey, et al. (1994), in a study of North Carolina businesses, found that
several characteristics of businesses not relevant in household surveys affected survey participation. For example, some types of establishments were more likely than others to respond (e.g. manufacturing versus retail trade), larger establishments were less likely to respond, and establishments in industries with high profits were less likely to respond.
• Paxson, Dillman and Tarnai (1995), Osmint, McMahon and Martin (1994), and Edwards
and Cantor (1991) also discuss establishment nonresponse in the context of the differences between establishment and household surveys.
• One body of literature on establishment survey nonresponse tests the application or
adaptation of household survey methods to establishment surveys. Jobber (1986) looked at surveys that included industrial populations and found mixed results for pre-survey notifications, monetary and non-monetary incentives, degree of personalization of survey mailings and other factors. James and Bolstein (1992) successfully used monetary incentives to increase response rates in collecting employee health insurance information among small construction subcontractors. Walker, Kirchmann, and Conant (1987) used a number of elements from Dillman’s Total Design Method (Dillman, 1978) to increase response to an establishment mail survey. Paxson, Dillman and Tarnai (1995) found that mandatory reporting and telephone follow-ups in establishment surveys did produce high response rates. Each of these studies had shortcomings.
• Werking and Clayton (1995) discuss the use of automated data collection methods in the
Current Employment Statistics (CES) survey, including use of facsimile machines (FAX), electronic data interchange, touch tone data entry and others. Many of these techniques require that respondents have (or have access to) office machines (such as FAX or personal computer). Data are primarily quantitative in nature and respondents must be in the survey on repeated occasions with sufficient frequency to warrant the initial training required to provide data in these nontraditional ways.
• Changes in the sample design have been explored to help increase business survey
response. Permanent random numbers and rotational designs (Ohlsson, 1995; Srinath and Carpenter, 1995) have been used to minimize the amount of overlap in establishment survey samples and resulting respondent burden over time. Survey data imputation and the particular problems unique to business survey data are discussed by Kovar and Whitridge (1995).
IGEN98 focuses on unit nonresponse in establishment surveys where unit nonresponse refers to a complete failure to obtain information for a sample unit. A respondent who fails to provide
4
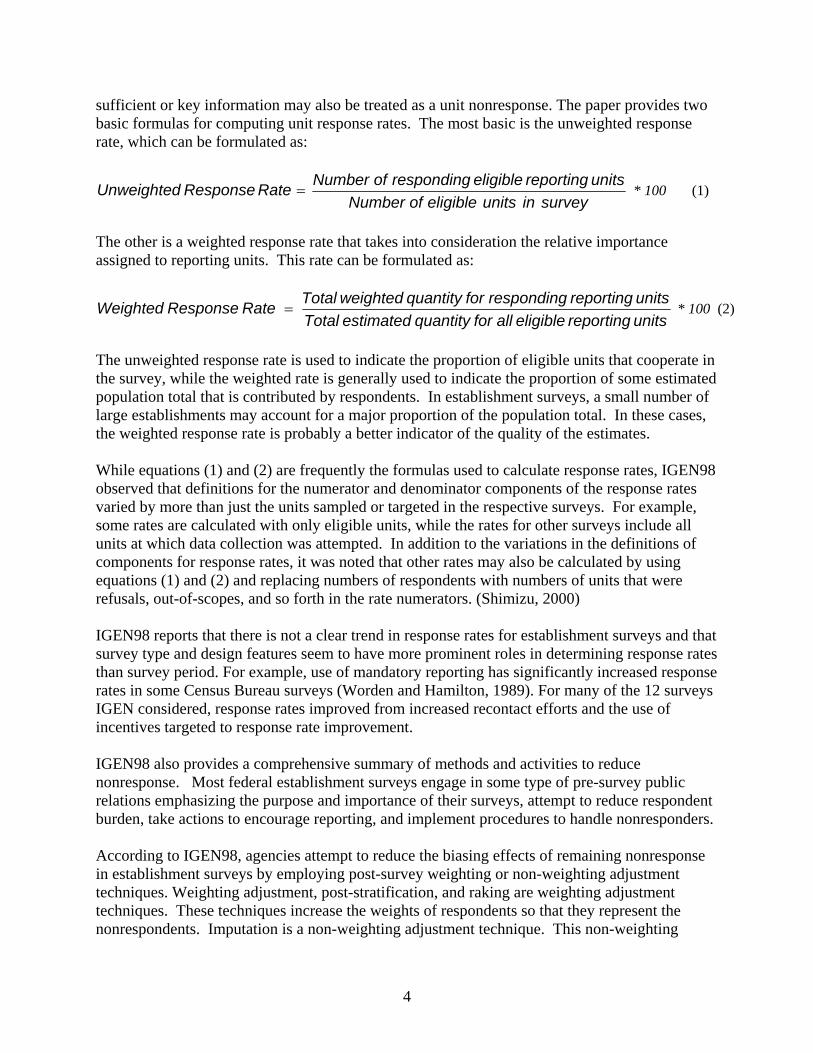
sufficient or key information may also be treated as a unit nonresponse. The paper provides two basic formulas for computing unit response rates. The most basic is the unweighted response rate, which can be formulated as:
surveyinunitseligibleofNumberunitsreportingeligiblerespondingofNumberRateResponseUnweighted = * 100 (1)
The other is a weighted response rate that takes into consideration the relative importance assigned to reporting units. This rate can be formulated as:
unitsreportingeligibleallforquantityestimatedTotalunitsreportingrespondingforquantityweightedTotalRate ResponseWeighted = * 100 (2)
The unweighted response rate is used to indicate the proportion of eligible units that cooperate in the survey, while the weighted rate is generally used to indicate the proportion of some estimated population total that is contributed by respondents. In establishment surveys, a small number of large establishments may account for a major proportion of the population total. In these cases, the weighted response rate is probably a better indicator of the quality of the estimates. While equations (1) and (2) are frequently the formulas used to calculate response rates, IGEN98 observed that definitions for the numerator and denominator components of the response rates varied by more than just the units sampled or targeted in the respective surveys. For example, some rates are calculated with only eligible units, while the rates for other surveys include all units at which data collection was attempted. In addition to the variations in the definitions of components for response rates, it was noted that other rates may also be calculated by using equations (1) and (2) and replacing numbers of respondents with numbers of units that were refusals, out-of-scopes, and so forth in the rate numerators. (Shimizu, 2000) IGEN98 reports that there is not a clear trend in response rates for establishment surveys and that survey type and design features seem to have more prominent roles in determining response rates than survey period. For example, use of mandatory reporting has significantly increased response rates in some Census Bureau surveys (Worden and Hamilton, 1989). For many of the 12 surveys IGEN considered, response rates improved from increased recontact efforts and the use of incentives targeted to response rate improvement. IGEN98 also provides a comprehensive summary of methods and activities to reduce nonresponse. Most federal establishment surveys engage in some type of pre-survey public relations emphasizing the purpose and importance of their surveys, attempt to reduce respondent burden, take actions to encourage reporting, and implement procedures to handle nonresponders. According to IGEN98, agencies attempt to reduce the biasing effects of remaining nonresponse in establishment surveys by employing post-survey weighting or non-weighting adjustment techniques. Weighting adjustment, post-stratification, and raking are weighting adjustment techniques. These techniques increase the weights of respondents so that they represent the nonrespondents. Imputation is a non-weighting adjustment technique. This non-weighting
5
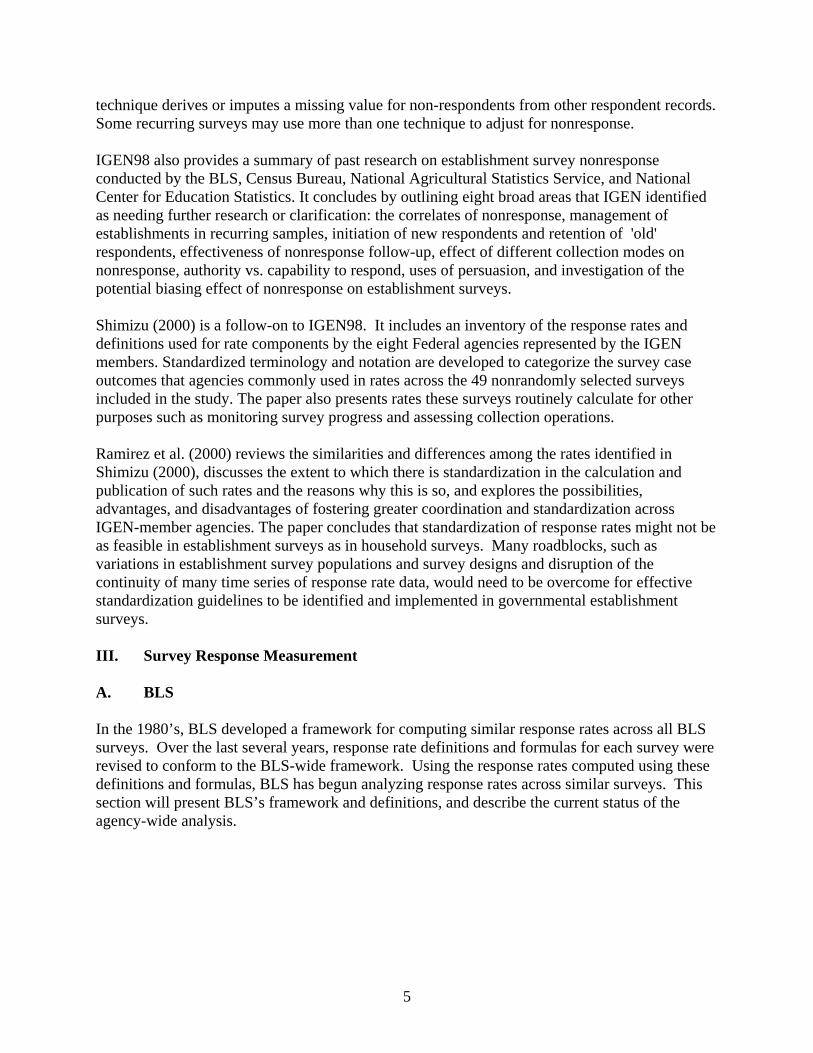
technique derives or imputes a missing value for non-respondents from other respondent records. Some recurring surveys may use more than one technique to adjust for nonresponse. IGEN98 also provides a summary of past research on establishment survey nonresponse conducted by the BLS, Census Bureau, National Agricultural Statistics Service, and National Center for Education Statistics. It concludes by outlining eight broad areas that IGEN identified as needing further research or clarification: the correlates of nonresponse, management of establishments in recurring samples, initiation of new respondents and retention of 'old' respondents, effectiveness of nonresponse follow-up, effect of different collection modes on nonresponse, authority vs. capability to respond, uses of persuasion, and investigation of the potential biasing effect of nonresponse on establishment surveys. Shimizu (2000) is a follow-on to IGEN98. It includes an inventory of the response rates and definitions used for rate components by the eight Federal agencies represented by the IGEN members. Standardized terminology and notation are developed to categorize the survey case outcomes that agencies commonly used in rates across the 49 nonrandomly selected surveys included in the study. The paper also presents rates these surveys routinely calculate for other purposes such as monitoring survey progress and assessing collection operations. Ramirez et al. (2000) reviews the similarities and differences among the rates identified in Shimizu (2000), discusses the extent to which there is standardization in the calculation and publication of such rates and the reasons why this is so, and explores the possibilities, advantages, and disadvantages of fostering greater coordination and standardization across IGEN-member agencies. The paper concludes that standardization of response rates might not be as feasible in establishment surveys as in household surveys. Many roadblocks, such as variations in establishment survey populations and survey designs and disruption of the continuity of many time series of response rate data, would need to be overcome for effective standardization guidelines to be identified and implemented in governmental establishment surveys. III. Survey Response Measurement A. BLS In the 1980’s, BLS developed a framework for computing similar response rates across all BLS surveys. Over the last several years, response rate definitions and formulas for each survey were revised to conform to the BLS-wide framework. Using the response rates computed using these definitions and formulas, BLS has begun analyzing response rates across similar surveys. This section will present BLS’s framework and definitions, and describe the current status of the agency-wide analysis.
6
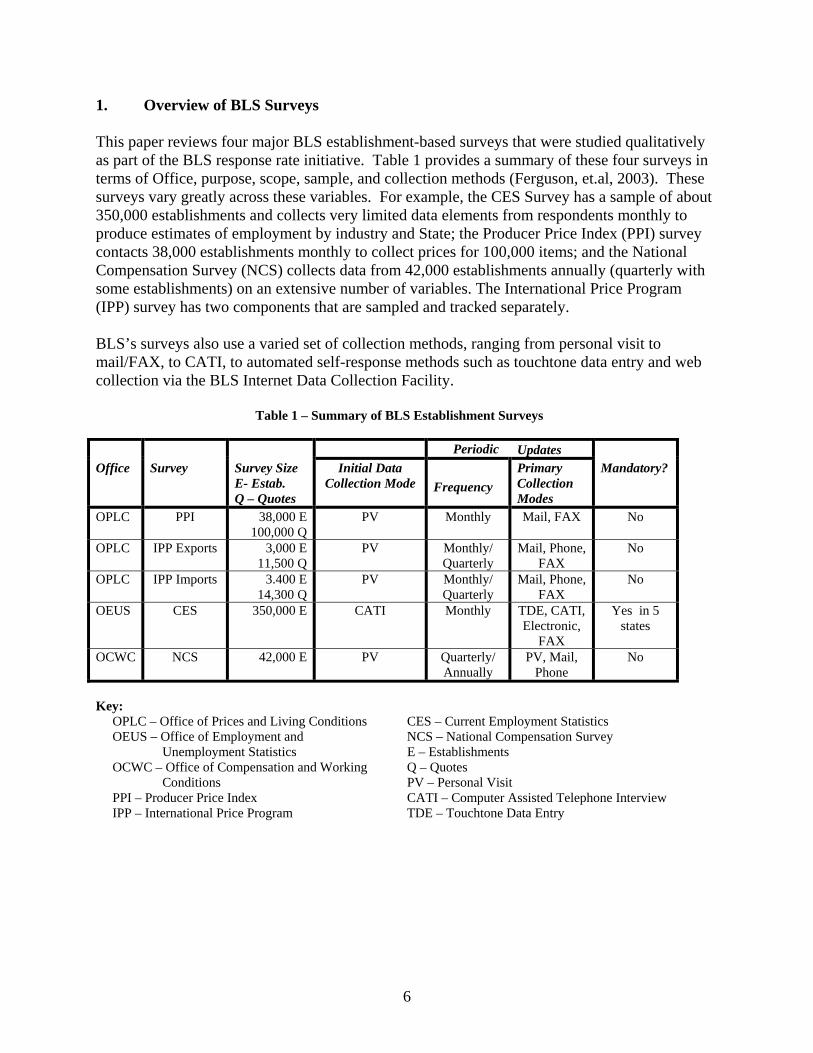
1. Overview of BLS Surveys This paper reviews four major BLS establishment-based surveys that were studied qualitatively as part of the BLS response rate initiative. Table 1 provides a summary of these four surveys in terms of Office, purpose, scope, sample, and collection methods (Ferguson, et.al, 2003). These surveys vary greatly across these variables. For example, the CES Survey has a sample of about 350,000 establishments and collects very limited data elements from respondents monthly to produce estimates of employment by industry and State; the Producer Price Index (PPI) survey contacts 38,000 establishments monthly to collect prices for 100,000 items; and the National Compensation Survey (NCS) collects data from 42,000 establishments annually (quarterly with some establishments) on an extensive number of variables. The International Price Program (IPP) survey has two components that are sampled and tracked separately. BLS’s surveys also use a varied set of collection methods, ranging from personal visit to mail/FAX, to CATI, to automated self-response methods such as touchtone data entry and web collection via the BLS Internet Data Collection Facility. Table 1 – Summary of BLS Establishment Surveys Periodic Updates Office Survey Survey Size
E- Estab. Q – Quotes
Initial Data Collection Mode
Frequency
Primary Collection Modes
Mandatory?
OPLC PPI 38,000 E 100,000 Q
PV Monthly Mail, FAX No
OPLC IPP Exports 3,000 E 11,500 Q
PV Monthly/ Quarterly
Mail, Phone, FAX
No
OPLC IPP Imports 3.400 E 14,300 Q
PV Monthly/ Quarterly
Mail, Phone, FAX
No
OEUS CES 350,000 E CATI Monthly TDE, CATI, Electronic,
FAX
Yes in 5 states
OCWC NCS 42,000 E PV Quarterly/ Annually
PV, Mail, Phone
No
Key: OPLC – Office of Prices and Living Conditions CES – Current Employment Statistics OEUS – Office of Employment and NCS – National Compensation Survey Unemployment Statistics E – Establishments OCWC – Office of Compensation and Working Q – Quotes Conditions PV – Personal Visit PPI – Producer Price Index CATI – Computer Assisted Telephone Interview IPP – International Price Program TDE – Touchtone Data Entry
7
2. Historical Response Rate Computations within Each Program Like most large survey organizations, for administrative and operational reasons BLS has organized its survey operations into several offices as shown in Table 1. Each office is thus responsible for the surveys within their domain. Given the separation of survey operation between the offices, the scope/size of the survey, and modes of collection, each office has historically worked independently; that is, developing their own internal procedures for survey operations without a lot of direct contact with their counterparts from the other program offices. This philosophy also extended to calculation of response rates. In addition to the nature of BLS survey operations, there are a number of pragmatic reasons for development of separate and perhaps distinct response measures for each program/survey. Many of BLS's surveys have a separate “field” component for initiation, relying on other methods for ongoing collection. As a result, for the update surveys, each program broke down operations by “stage” of processing (i.e. initiation vs. ongoing collection). This often involved establishment of separate databases for field tracking and update collection. Once these separate databases were in place, each survey could calculate response rates for each “stage”; however, it was more difficult to calculate response rates across the entire survey. Once periodic update survey operation was ongoing, it became more efficient to track the “update” or “repricing” rate for each survey. From an operational standpoint, tracking this rate provided managers with an accurate and consistent measure of how the monthly or quarterly collection was going. For many of the price programs there are other complexities that dictated a separate stage of processing response computation. These primarily relate to the difference between the number of establishments in the survey versus the number of “quotes” obtained from each. For example, the PPI samples 38,000 outlets but obtains price quotes for over 100,000 commodities. Thus, the initiation rate measures what percent of the 38,000 outlets agree to provide price quotes. However, we may not receive complete price information for all desired commodities. Should the response rate look only at what percent of the 38,000 outlets provide all quotes? What if we ask for ten quotes but only receive data for five of them? Once in the monthly repricing cycle, it is more important to track collection at the quote level rather than at the outlet level, since the quotes are the actual inputs into the index calculation. In the mid 1980’s, the BLS Commissioner became concerned about the effect increased telephone collection had on data quality. The Mathematical Statistics Research Center (MSRC), formerly the Division of Statistical Research and Evaluation, set out to develop tests that might be performed to investigate the effects of alternative modes of data collection. The Commissioner wanted suggestions for areas for program improvement. MSRC found that surveys did not fully document the modes used in their data collection methodology making evaluations of mode effect on quality almost impossible to pursue. MSRC recommended that BLS embark on an effort to document and standardize the data collection process at BLS. With this standardization in place, the Bureau could develop a framework for evaluating and testing its data collection modes to determine the trade-offs with respect to cost, time and quality.

8
In March 1985, the BLS formed a Data Collection Task Force (DCTF) to develop a system for compilation of standardized information on data collection across programs. The task force (Bureau of Labor Statistics, 1985) recommended a framework of accountability codes that met the following criteria: 1. At any level, the classes should be mutually exclusive and exhaustive subsets of the next higher level; 2. The framework should be flexible enough to be applicable to any BLS establishment or housing unit survey; 3. The framework should reflect the longitudinal nature of most BLS surveys; 4. The framework should allow for the differentiation of two basic survey operations: data collection and estimation; 5. The framework should be consistent with the standard definition of a response rate; 6. The framework should allow for the computation of field collection completion rates; and 7. The framework should provide for capability of mapping all current BLS classification schemes into it. The task force developed the following data collection and estimation phase classification schemes: Data Collection/Accountability Status
Codes Eligible
10 Responding 20* Refusal 21 Refusal – Date Absent -
Unable to Cooperate 22 Refusal – Unwilling to
Cooperate Eligibility not Determined
23 Eligibility Not Determined Ineligible
30* Ineligible 31 Existent – Out of Scope 32 Nonexistent
* Use these codes only if data are not available for subclasses.
Data Collection/Estimation Accountability Codes
Eligible for Estimation
10 Eligible for Estimation Included in Estimation
11* Included in Estimation Scheduled for Inclusion in a Previous Period 12* Scheduled for Inclusion in a Previous Period 13 Included in a Previous Estimation Period 14 Excluded from Previous Estimation Period
Not Scheduled for Inclusion in Previous Estimation Period
15 Not Scheduled for Inclusion Previous Estimation Period –
Exclusion for Estimation 19* Exclusion for Estimation
20 Not Responding at Data Collection 23 Eligibility Not Determined at Data Collection 25 Failed to Meet Prescribed Criteria
Ineligible for Estimation 30 Ineligible for Estimation
* Use these codes only if data are not available for subclasses.
This proposed framework supports the following definition of an unweighted response rate: U Number of responding units . U Number of eligible units + Number of sample units with eligibility not determined
9
Each survey can also use this strategy to compute weighted response rates by summing the appropriate weight across all units in the category. For a weighted response rate, the numerator would be the sum of the weights for all responding units, while the denominator would include the sum of the weights for all eligible or eligibility not determined units. Depending on the survey, the weight may be the inverse of the probability of selection while it may be the current employment or volume of trade for other surveys. Over the nineties, BLS staff initiated efforts to ensure that all surveys were collecting response codes that could support this framework. There was no funding to move all programs over to this taxonomy. Managers supported the taxonomy by ensuring that revisions to the processing systems and collection protocols would be consistent as surveys modernized and updated their methodologies and computer systems. Over the late nineties, response rates in general were declining. Most survey managers reported that maintaining good response rates was becoming more difficult. Program managers routinely only monitored response of active sample members, generating a survey specific stage of processing response rates. Even though individual programs could aggregate their response codes into a compatible taxonomy, the response codes differed from program to program because of different internal monitoring requirements. Thus, the BLS could not use the individual response codes monitored by each survey to identify systematic problems across surveys. 3. Current Practices In early 2000, a team was formed to compile response rates based upon the DCTF methodology in order to develop a BLS-wide strategy for improvement initiatives. This team generated its first report in October 2000, including response rates from 14 household and business surveys. The team updates the report every three months to include as much data as possible from as many surveys as possible. Some surveys provide stage of processing rates as well as overall survey response rates while other surveys provide only an overall rate or only one or more stage of processing rates. Table 2 shows a recent summary of the unweighted response rates that appear in this quarterly report (Bureau of Labor Statistics, 2003) for the four surveys in this paper. All surveys studied in this paper except NCS have multiple closings. The CES, PPI, and IPP are monthly surveys that have short data collection periods to meet tight release dates. Due to unavailability of data in a reporting period, sampled establishments can report data in a later period for a scheduled revision. For surveys with multiple closings, we are presenting the response rates for first closing in Table 2. The table, as described below Table 2, contains five columns to include space for reporting the individual stage of processing rates and the overall survey response rate.
10
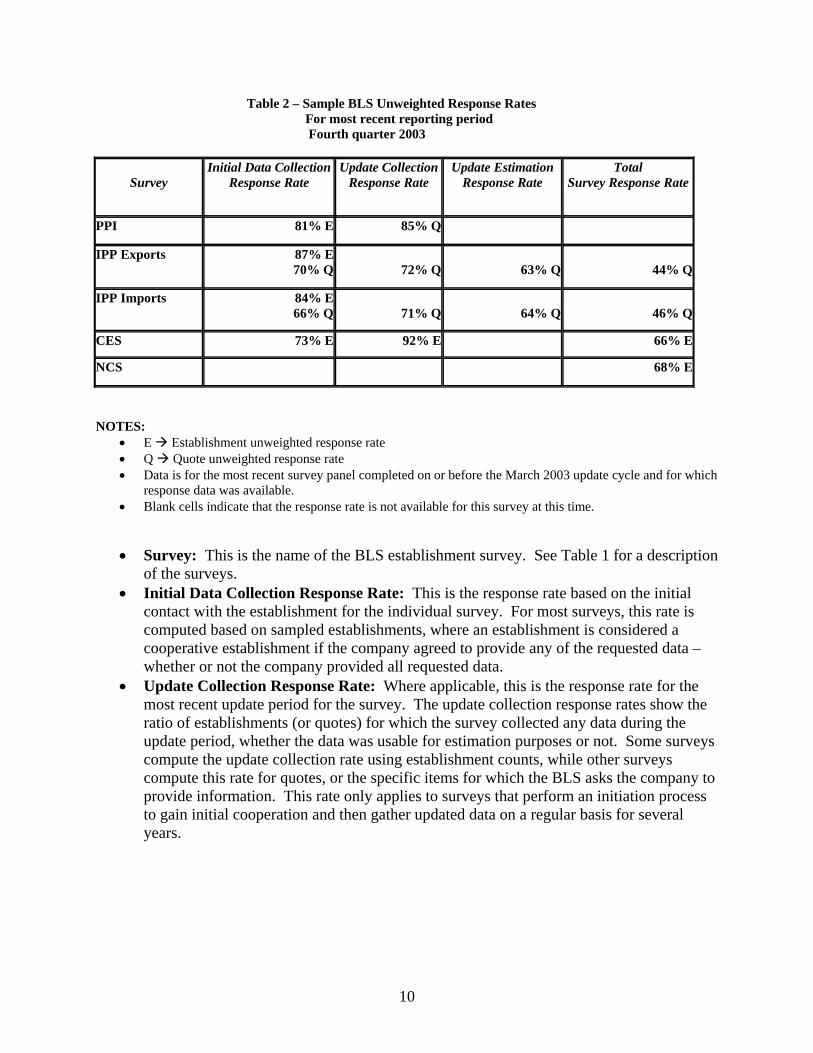
Table 2 – Sample BLS Unweighted Response Rates For most recent reporting period Fourth quarter 2003
Survey
Initial Data Collection Response Rate
Update Collection Response Rate
Update Estimation Response Rate
Total Survey Response Rate
PPI 81% E 85% Q
IPP Exports 87% E70% Q 72% Q 63% Q 44% Q
IPP Imports 84% E66% Q 71% Q 64% Q 46% Q
CES 73% E 92% E 66% E
NCS 68% E
NOTES:
• E Establishment unweighted response rate • Q Quote unweighted response rate • Data is for the most recent survey panel completed on or before the March 2003 update cycle and for which
response data was available. • Blank cells indicate that the response rate is not available for this survey at this time. • Survey: This is the name of the BLS establishment survey. See Table 1 for a description
of the surveys. • Initial Data Collection Response Rate: This is the response rate based on the initial
contact with the establishment for the individual survey. For most surveys, this rate is computed based on sampled establishments, where an establishment is considered a cooperative establishment if the company agreed to provide any of the requested data – whether or not the company provided all requested data.
• Update Collection Response Rate: Where applicable, this is the response rate for the most recent update period for the survey. The update collection response rates show the ratio of establishments (or quotes) for which the survey collected any data during the update period, whether the data was usable for estimation purposes or not. Some surveys compute the update collection rate using establishment counts, while other surveys compute this rate for quotes, or the specific items for which the BLS asks the company to provide information. This rate only applies to surveys that perform an initiation process to gain initial cooperation and then gather updated data on a regular basis for several years.
11
• Update Estimation Response Rate: This rate includes only establishments/quotes for which the company provided enough data for the survey to include the establishment/quote in the actual survey estimates. Both the Update Collection and Update Estimation response rates are processing rates where the denominator includes only those items that were cooperative at the initiation contact with the establishment. This rate only applies to surveys that perform an initiation process to gain initial cooperation and then gather updated data on a regular basis for several years.
• Total Survey Response Rate: The last column shows the overall survey response rate, when available. For this rate, the numerator includes all sample units with usable reports while the denominator includes all in-scope sample units. This rate applies to all BLS surveys. The PPI cannot estimate the rate at this time.
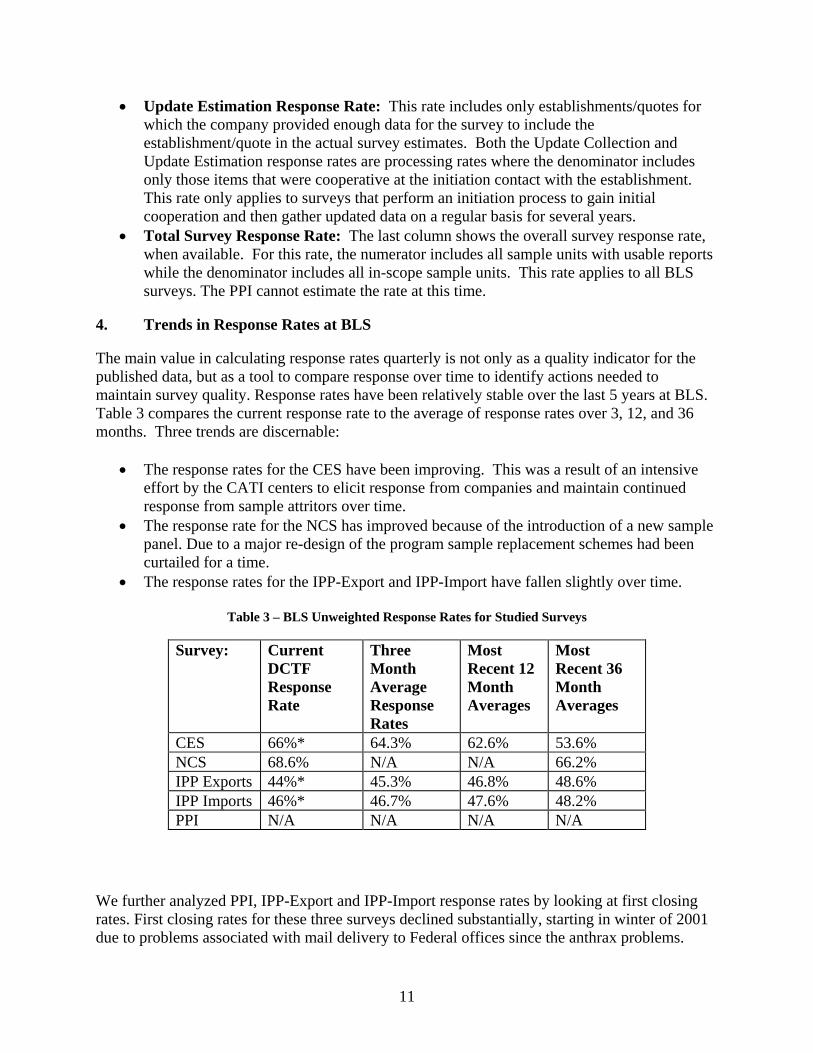
4. Trends in Response Rates at BLS
The main value in calculating response rates quarterly is not only as a quality indicator for the published data, but as a tool to compare response over time to identify actions needed to maintain survey quality. Response rates have been relatively stable over the last 5 years at BLS. Table 3 compares the current response rate to the average of response rates over 3, 12, and 36 months. Three trends are discernable:
• The response rates for the CES have been improving. This was a result of an intensive effort by the CATI centers to elicit response from companies and maintain continued response from sample attritors over time.
• The response rate for the NCS has improved because of the introduction of a new sample panel. Due to a major re-design of the program sample replacement schemes had been curtailed for a time.
• The response rates for the IPP-Export and IPP-Import have fallen slightly over time.
Table 3 – BLS Unweighted Response Rates for Studied Surveys
Survey: Current DCTF Response Rate
Three Month Average Response Rates
Most Recent 12 Month Averages
Most Recent 36 Month Averages
CES 66%* 64.3% 62.6% 53.6% NCS 68.6% N/A N/A 66.2% IPP Exports 44%* 45.3% 46.8% 48.6% IPP Imports 46%* 46.7% 47.6% 48.2% PPI N/A N/A N/A N/A
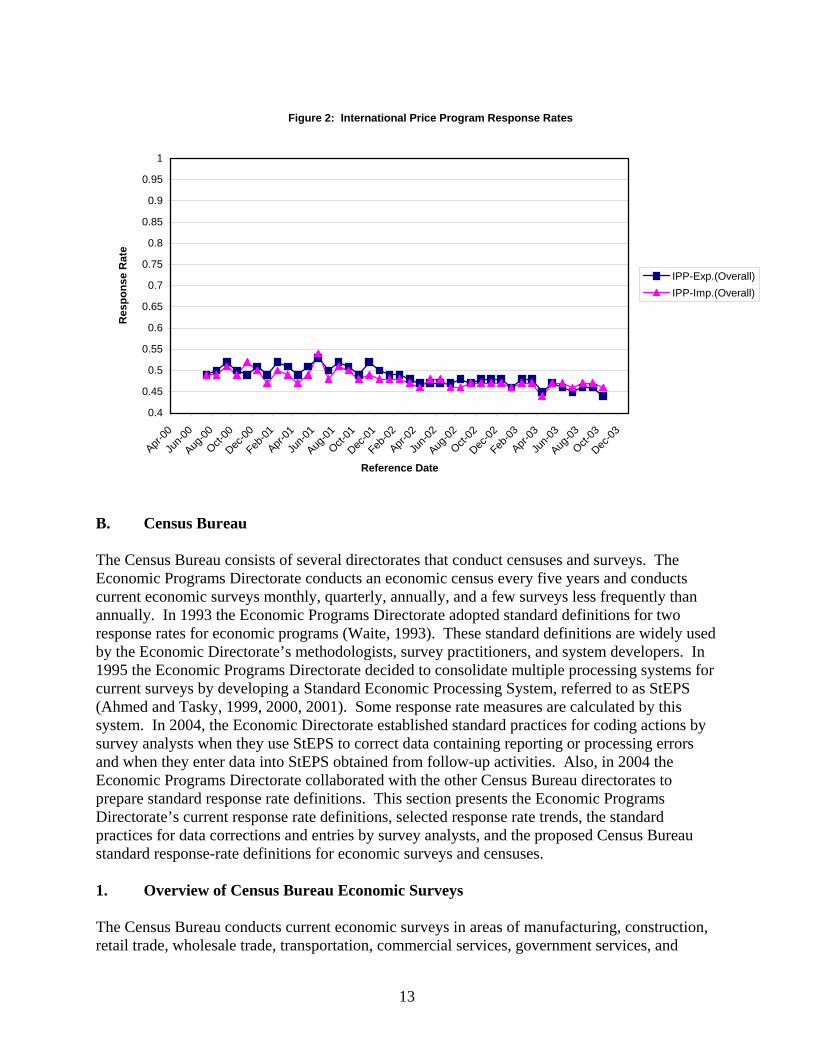
We further analyzed PPI, IPP-Export and IPP-Import response rates by looking at first closing rates. First closing rates for these three surveys declined substantially, starting in winter of 2001 due to problems associated with mail delivery to Federal offices since the anthrax problems.

12
However, by the final closing enough additional response is obtained to improve the final response rates based on DCTF methodology. This is graphically displayed in Figures 1 and 2 below. It should be noted that the response rates in Figure 1 are for quotes that are scheduled for monthly repricing. These rates are higher than response based on the DCTF methodology in Figure 2.
Figure 1: Index Programs -- Usable Repricing at 1st Release
0.45
0.5
0.55
0.6
0.65
0.7
0.75
0.8
0.85
0.9
Jul-00
Oct-00
Jan-01
Apr-01
Jul-01
Oct-01
Jan-02
Apr-02
Jul-02
Oct-02
Jan-03
Apr-03
Jul-03
Reference Date
Res
pons
e R
ate
PPI - Repr, 1st close
IPP-EXP--Usable Response Rate at 1stReleaseIPP-IMP--Usable Response Rate at 1stRelease
13
Figure 2: International Price Program Response Rates
0.4
0.45
0.5
0.55
0.6
0.65
0.7
0.75
0.8
0.85
0.9
0.95
1
Apr-00
Jun-0
0
Aug-00
Oct-00
Dec-00
Feb-01
Apr-01
Jun-0
1
Aug-01
Oct-01
Dec-01
Feb-02
Apr-02
Jun-0
2
Aug-02
Oct-02
Dec-02
Feb-03
Apr-03
Jun-0
3
Aug-03
Oct-03
Dec-03
Reference Date
Res
pons
e R
ate
IPP-Exp.(Overall)IPP-Imp.(Overall)
B. Census Bureau The Census Bureau consists of several directorates that conduct censuses and surveys. The Economic Programs Directorate conducts an economic census every five years and conducts current economic surveys monthly, quarterly, annually, and a few surveys less frequently than annually. In 1993 the Economic Programs Directorate adopted standard definitions for two response rates for economic programs (Waite, 1993). These standard definitions are widely used by the Economic Directorate’s methodologists, survey practitioners, and system developers. In 1995 the Economic Programs Directorate decided to consolidate multiple processing systems for current surveys by developing a Standard Economic Processing System, referred to as StEPS (Ahmed and Tasky, 1999, 2000, 2001). Some response rate measures are calculated by this system. In 2004, the Economic Directorate established standard practices for coding actions by survey analysts when they use StEPS to correct data containing reporting or processing errors and when they enter data into StEPS obtained from follow-up activities. Also, in 2004 the Economic Programs Directorate collaborated with the other Census Bureau directorates to prepare standard response rate definitions. This section presents the Economic Programs Directorate’s current response rate definitions, selected response rate trends, the standard practices for data corrections and entries by survey analysts, and the proposed Census Bureau standard response-rate definitions for economic surveys and censuses. 1. Overview of Census Bureau Economic Surveys The Census Bureau conducts current economic surveys in areas of manufacturing, construction, retail trade, wholesale trade, transportation, commercial services, government services, and

14
foreign trade. Though a few of these surveys allow respondents to provide data over the internet, these surveys are primarily mail surveys with telephone follow-up. The Census Bureau’s current economic surveys are diverse in terms of size, frequency, and type of reporting units. Reporting units for current economic surveys include business establishments, divisions of companies, entire companies, and construction projects. This section will review the response rate trends for three monthly Census Bureau establishment surveys, summarized in Table 4. The sampling units for these surveys are aggregates of establishments. We selected these surveys because they have maintained records of their response rates over a twelve-year period.
Table 4 – Summary of Selected Census Bureau Establishment Surveys Survey Name
Survey Size (# of sample units)
Data Collection Method
Mandatory?
Monthly Retail Sales 12,000 Monthly Retail Inventories
4,000
Monthly Wholesale 4,000
Mail with telephone follow-up
No
2. Response Rate Computations -- Current Practices The Census Bureau’s Economic Programs Directorate adopted two standard definitions for response rates in 1993. The first response rate measures the proportion of attempted cases that provide a response, where an attempted case is a case for which data collection has been attempted. It is defined as follows: Response rate #1 = R / M, where R = the number of units that provide a response, and M = the number of units for which one attempts to obtain a response. The definition of this first response rate includes the following comments:
• All modes of response prior to publication are included, including last minute phone calls.
• Partial responses (defined as one or more data items reported) are Uincluded U in the numerator and denominator.

15
• Administrative records used in place of a planned attempt to collect data are excluded from the numerator and the denominator.
• Whole form imputes are UexcludedU from the numerator and UincludedU in the denominator.
• Postmaster returns (undeliverable as addressed) are UexcludedU from the numerator and denominator.
• Refusals are UexcludedU from the numerator and UincludedU in the denominator.
• This measure is easy to understand and compute but may not be suitable as a measure across widely differing surveys.
• This measure is useful for survey managers in controlling and monitoring operations and permits them to know what proportion of forms have been received at any point in time.
• This measure can be misleading in an environment where the underlying population is very skewed. For example, one could measure 92 percent response but only have 50 percent of the values of sales covered.
The second response rate measures the proportion of an estimated UtotalU (not necessarily the published total) that is contributed by respondents for an individual variable. It is defined as follows:
Response rate # 2 = T/tw i
R
1ii∑
=
where wBi B = the design weight of the iPU
thUP unit before adjustments for nonresponse,
t Bi B = the reported value for the iPU
thUP unit of variable t for which the response rate is to be
computed, and T = the estimated (weighted) total of the variable t over the entire population represented
by the sampling frame. The definition of this second response rate includes the following comments:
• Imputed values are UexcludedU from the numerator but included in the denominator.
• Administrative records used in place of a planned attempt to collect data are UexcludedU from the numerator and the denominator.
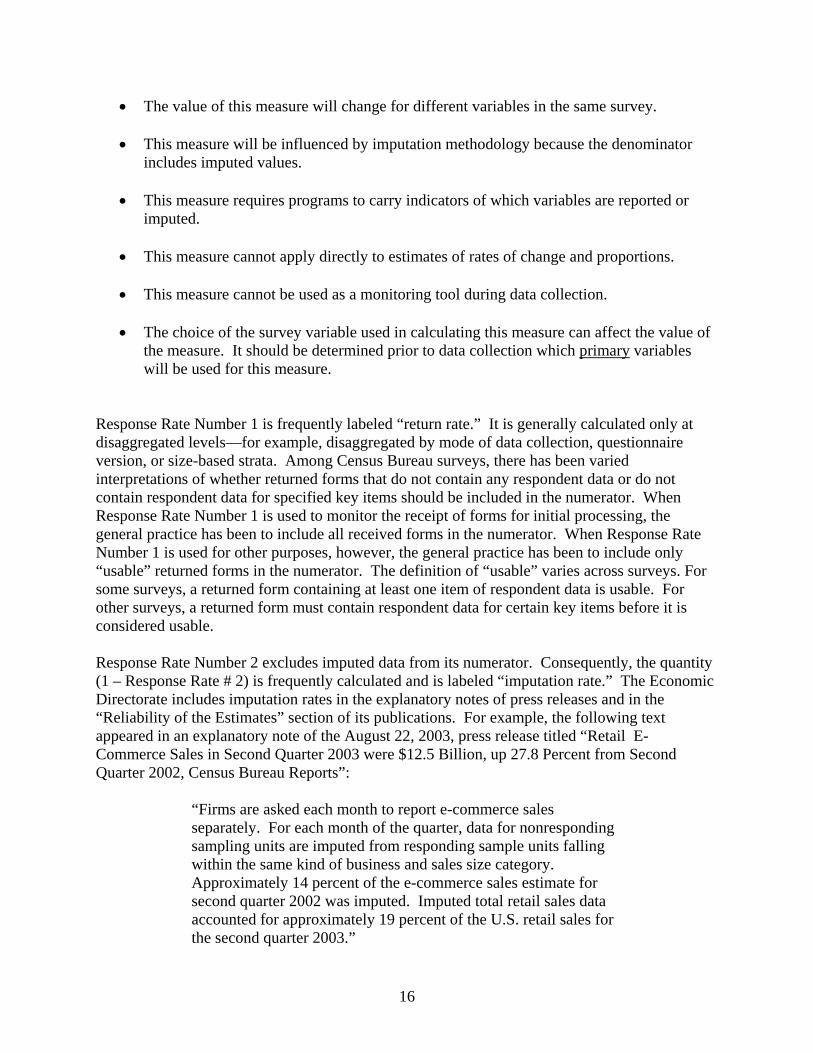
16
• The value of this measure will change for different variables in the same survey.
• This measure will be influenced by imputation methodology because the denominator includes imputed values.
• This measure requires programs to carry indicators of which variables are reported or imputed.
• This measure cannot apply directly to estimates of rates of change and proportions.
• This measure cannot be used as a monitoring tool during data collection.
• The choice of the survey variable used in calculating this measure can affect the value of the measure. It should be determined prior to data collection which UprimaryU variables will be used for this measure.
Response Rate Number 1 is frequently labeled “return rate.” It is generally calculated only at disaggregated levels—for example, disaggregated by mode of data collection, questionnaire version, or size-based strata. Among Census Bureau surveys, there has been varied interpretations of whether returned forms that do not contain any respondent data or do not contain respondent data for specified key items should be included in the numerator. When Response Rate Number 1 is used to monitor the receipt of forms for initial processing, the general practice has been to include all received forms in the numerator. When Response Rate Number 1 is used for other purposes, however, the general practice has been to include only “usable” returned forms in the numerator. The definition of “usable” varies across surveys. For some surveys, a returned form containing at least one item of respondent data is usable. For other surveys, a returned form must contain respondent data for certain key items before it is considered usable. Response Rate Number 2 excludes imputed data from its numerator. Consequently, the quantity (1 – Response Rate # 2) is frequently calculated and is labeled “imputation rate.” The Economic Directorate includes imputation rates in the explanatory notes of press releases and in the “Reliability of the Estimates” section of its publications. For example, the following text appeared in an explanatory note of the August 22, 2003, press release titled “Retail E-Commerce Sales in Second Quarter 2003 were $12.5 Billion, up 27.8 Percent from Second Quarter 2002, Census Bureau Reports”:
“Firms are asked each month to report e-commerce sales separately. For each month of the quarter, data for nonresponding sampling units are imputed from responding sample units falling within the same kind of business and sales size category. Approximately 14 percent of the e-commerce sales estimate for second quarter 2002 was imputed. Imputed total retail sales data accounted for approximately 19 percent of the U.S. retail sales for the second quarter 2003.”
17
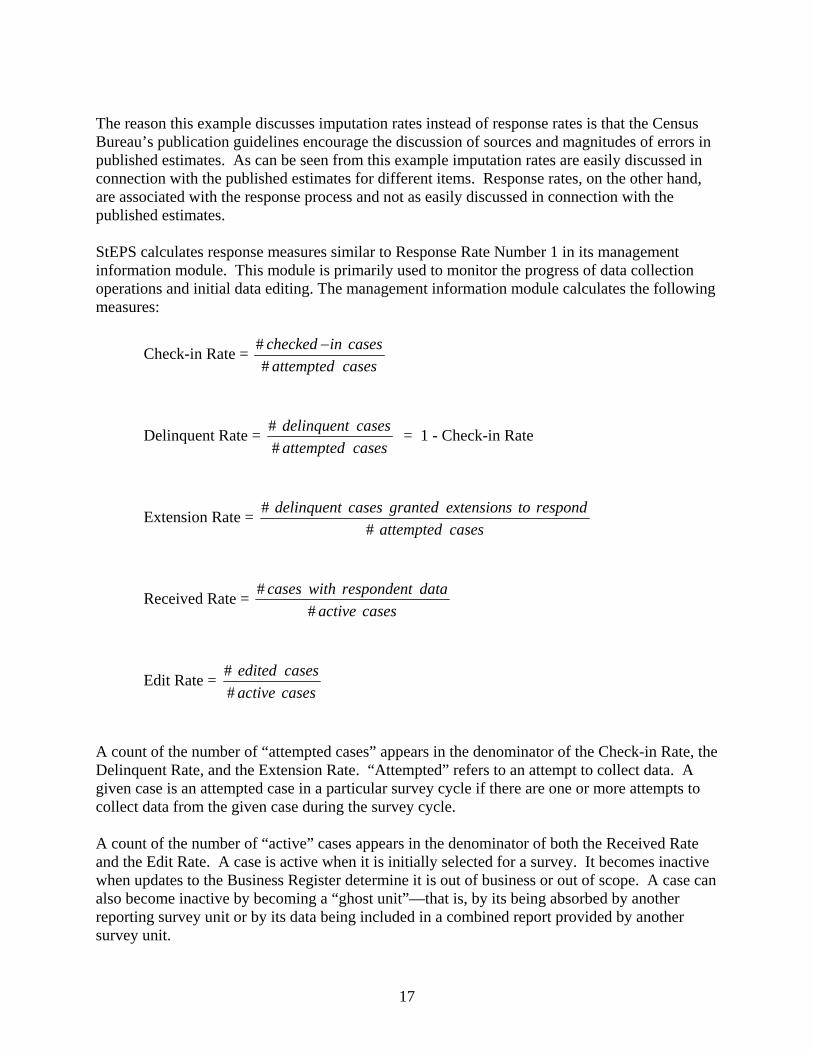
The reason this example discusses imputation rates instead of response rates is that the Census Bureau’s publication guidelines encourage the discussion of sources and magnitudes of errors in published estimates. As can be seen from this example imputation rates are easily discussed in connection with the published estimates for different items. Response rates, on the other hand, are associated with the response process and not as easily discussed in connection with the published estimates. StEPS calculates response measures similar to Response Rate Number 1 in its management information module. This module is primarily used to monitor the progress of data collection operations and initial data editing. The management information module calculates the following measures:
Check-in Rate = casesattemptedcasesinchecked
## −
Delinquent Rate = casesattemptedcasesdelinquent
## = 1 - Check-in Rate
Extension Rate = casesattempted
respondtoextensionsgrantedcasesdelinquent#
#
Received Rate = casesactive
datarespondentwithcases#
#
Edit Rate = casesactivecasesedited
##
A count of the number of “attempted cases” appears in the denominator of the Check-in Rate, the Delinquent Rate, and the Extension Rate. “Attempted” refers to an attempt to collect data. A given case is an attempted case in a particular survey cycle if there are one or more attempts to collect data from the given case during the survey cycle. A count of the number of “active” cases appears in the denominator of both the Received Rate and the Edit Rate. A case is active when it is initially selected for a survey. It becomes inactive when updates to the Business Register determine it is out of business or out of scope. A case can also become inactive by becoming a “ghost unit”—that is, by its being absorbed by another reporting survey unit or by its data being included in a combined report provided by another survey unit.

18
StEPS calculates imputation rates similar to (1- Response Rate Number 2) in its estimates and variances module. The definition of Response Rate Number 2 excludes from the denominator “administrative records used in place of a planned attempt to collect data.” The StEPS imputation rate, however, includes administrative data in the denominator when administrative data are included in the published estimate. For surveys that use weight adjustment to handle unit nonresponse, StEPS treats this as a type of imputation because the adjusted weights allow units that report to represent both reporting and non-reporting units. For surveys that use imputation to handle unit nonresponse or item nonresponse, StEPS calculates imputation rates based on the outcomes of processing performed in the StEPS general-imputation module. The general-imputation module imputes data using estimator type techniques (Giles and Patrick, 1986) and adjusts data items associated with additive relationships so that detail items sum to total items (Sigman and Wagner, 1997). With one exception, all reported item data changed by the imputation module are flagged as being imputed item data. This includes (1) items for which no data were reported, and the general-imputation module creates data; and (2) reported data that fail defined edits, and as a result the general-imputation module changes some of the data. The one exception is when reported or missing data are replaced by administrative data that are considered to be equivalent in quality to respondent-provided data. In this case, the changed data are treated neither as imputed data (used to calculate the imputation-rate numerator) nor as reported data (used to calculate the numerator of Response Rate Number 2) but are used to calculate the numerator of an associated administrative-data rate. StEPS uses the following formula to calculate imputation rates:
imputation rate = ( )w y w w y
w y w y
i i i i iAdjI
i inot Adj
i iAdj
+ ′ −
+ ′
∑∑
∑ ∑mp
where
wBi B = sampling weight for the iPU
thUP unit not adjusted for nonresponseU,
w’ Bi B = sampling weight for the iPU
thUP unit adjusted for nonresponse (If nonresponse
adjustment is UnotU used, then w’ Bi B = wBi B.), y Bi B = unweighted data (reported, imputed, or administrative) for the iPU
thUP unit,
Imp = imputed cases,
Adj = respondents in those sub-domains that use weight adjustment to handle unit nonresponse, and
19
not Adj = active cases not in sub-domains using weight adjustment to handle unit nonresponse.
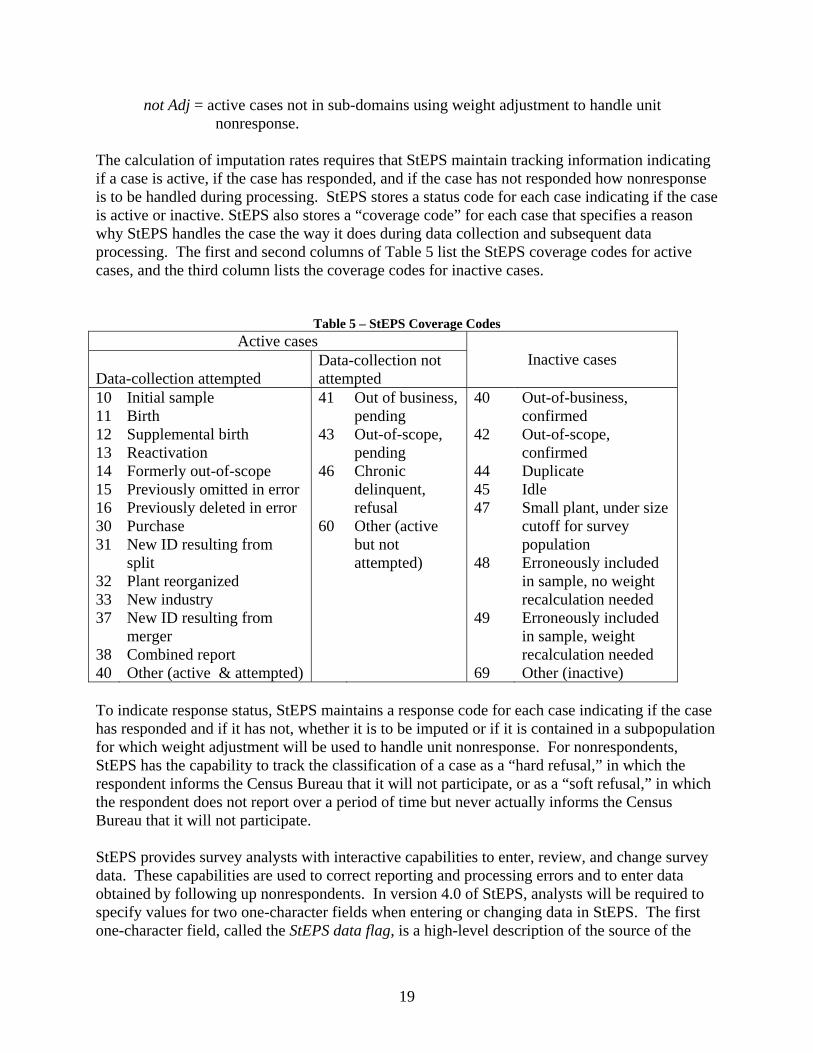
The calculation of imputation rates requires that StEPS maintain tracking information indicating if a case is active, if the case has responded, and if the case has not responded how nonresponse is to be handled during processing. StEPS stores a status code for each case indicating if the case is active or inactive. StEPS also stores a “coverage code” for each case that specifies a reason why StEPS handles the case the way it does during data collection and subsequent data processing. The first and second columns of Table 5 list the StEPS coverage codes for active cases, and the third column lists the coverage codes for inactive cases.
Table 5 – StEPS Coverage Codes Active cases
Data-collection attempted
Data-collection not attempted
Inactive cases
10 11 12 13 14 15 16 30 31 32 33 37 38 40
Initial sample Birth Supplemental birth Reactivation Formerly out-of-scope Previously omitted in error Previously deleted in error Purchase New ID resulting from split Plant reorganized New industry New ID resulting from merger Combined report Other (active & attempted)
41 43 46 60
Out of business, pending Out-of-scope, pending Chronic delinquent, refusal Other (active but not attempted)
40 42 44 45 47 48 49 69
Out-of-business, confirmed Out-of-scope, confirmed Duplicate Idle Small plant, under size cutoff for survey population Erroneously included in sample, no weight recalculation needed Erroneously included in sample, weight recalculation needed Other (inactive)
To indicate response status, StEPS maintains a response code for each case indicating if the case has responded and if it has not, whether it is to be imputed or if it is contained in a subpopulation for which weight adjustment will be used to handle unit nonresponse. For nonrespondents, StEPS has the capability to track the classification of a case as a “hard refusal,” in which the respondent informs the Census Bureau that it will not participate, or as a “soft refusal,” in which the respondent does not report over a period of time but never actually informs the Census Bureau that it will not participate. StEPS provides survey analysts with interactive capabilities to enter, review, and change survey data. These capabilities are used to correct reporting and processing errors and to enter data obtained by following up nonrespondents. In version 4.0 of StEPS, analysts will be required to specify values for two one-character fields when entering or changing data in StEPS. The first one-character field, called the StEPS data flag, is a high-level description of the source of the
20
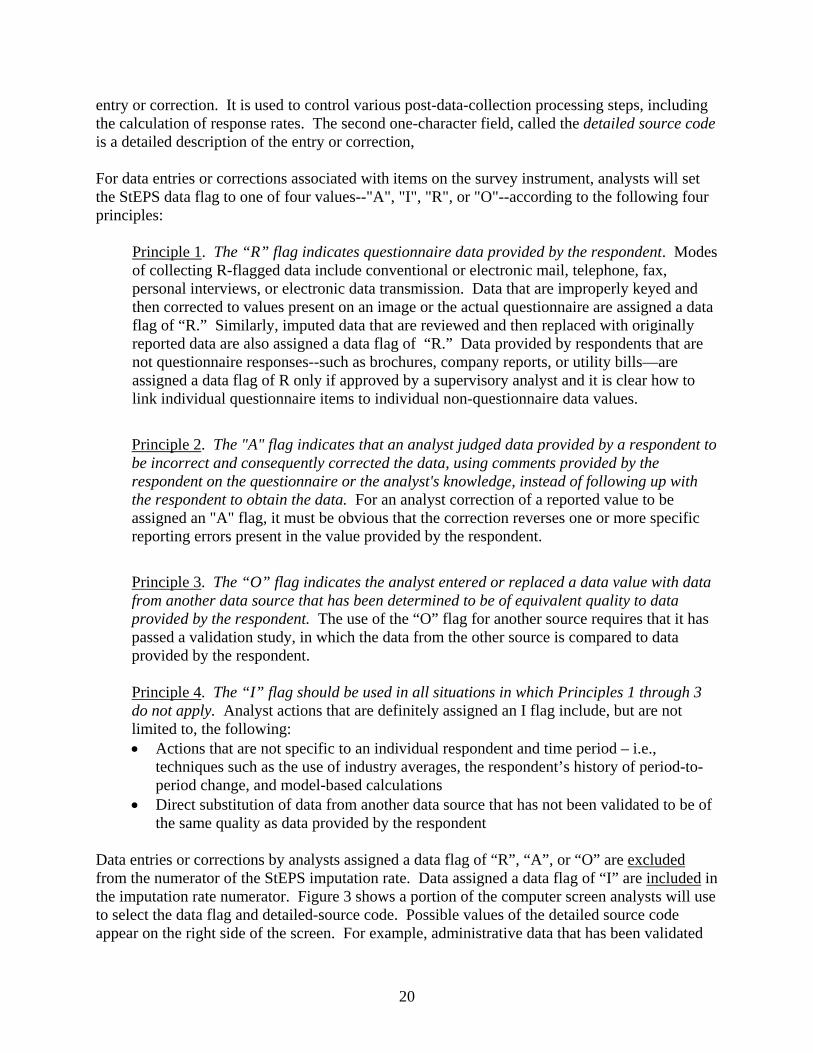
entry or correction. It is used to control various post-data-collection processing steps, including the calculation of response rates. The second one-character field, called the detailed source code is a detailed description of the entry or correction, For data entries or corrections associated with items on the survey instrument, analysts will set the StEPS data flag to one of four values--"A", "I", "R", or "O"--according to the following four principles:
UPrinciple 1U. The “R” flag indicates questionnaire data provided by the respondent. Modes of collecting R-flagged data include conventional or electronic mail, telephone, fax, personal interviews, or electronic data transmission. Data that are improperly keyed and then corrected to values present on an image or the actual questionnaire are assigned a data flag of “R.” Similarly, imputed data that are reviewed and then replaced with originally reported data are also assigned a data flag of “R.” Data provided by respondents that are not questionnaire responses--such as brochures, company reports, or utility bills—are assigned a data flag of R only if approved by a supervisory analyst and it is clear how to link individual questionnaire items to individual non-questionnaire data values.
UPrinciple 2U. The "A" flag indicates that an analyst judged data provided by a respondent to be incorrect and consequently corrected the data, using comments provided by the respondent on the questionnaire or the analyst's knowledge, instead of following up with the respondent to obtain the data. For an analyst correction of a reported value to be assigned an "A" flag, it must be obvious that the correction reverses one or more specific reporting errors present in the value provided by the respondent.
UPrinciple 3U. The “O” flag indicates the analyst entered or replaced a data value with data from another data source that has been determined to be of equivalent quality to data provided by the respondent. The use of the “O” flag for another source requires that it has passed a validation study, in which the data from the other source is compared to data provided by the respondent.
UPrinciple 4U. The “I” flag should be used in all situations in which Principles 1 through 3 do not apply. Analyst actions that are definitely assigned an I flag include, but are not limited to, the following: • Actions that are not specific to an individual respondent and time period – i.e.,
techniques such as the use of industry averages, the respondent’s history of period-to-period change, and model-based calculations
• Direct substitution of data from another data source that has not been validated to be of the same quality as data provided by the respondent
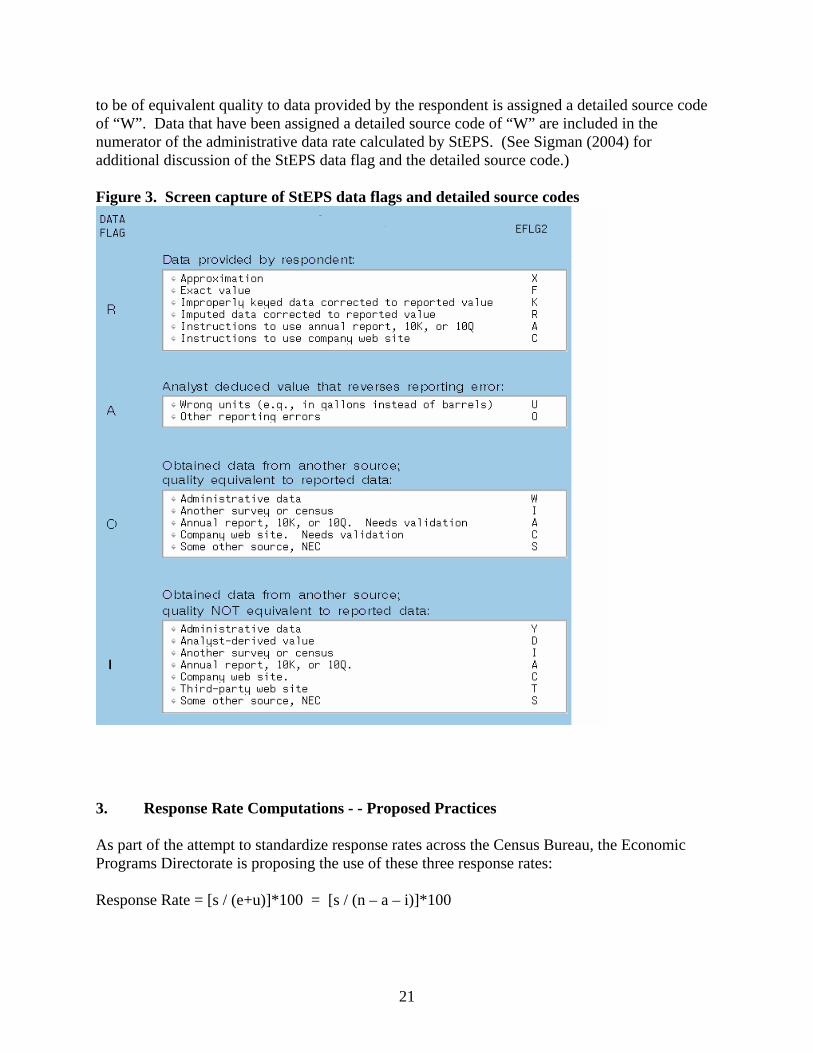
Data entries or corrections by analysts assigned a data flag of “R”, “A”, or “O” are UexcludedU from the numerator of the StEPS imputation rate. Data assigned a data flag of “I” are UincludedU in the imputation rate numerator. Figure 3 shows a portion of the computer screen analysts will use to select the data flag and detailed-source code. Possible values of the detailed source code appear on the right side of the screen. For example, administrative data that has been validated
21
to be of equivalent quality to data provided by the respondent is assigned a detailed source code of “W”. Data that have been assigned a detailed source code of “W” are included in the numerator of the administrative data rate calculated by StEPS. (See Sigman (2004) for additional discussion of the StEPS data flag and the detailed source code.) Figure 3. Screen capture of StEPS data flags and detailed source codes
3. Response Rate Computations - - Proposed Practices As part of the attempt to standardize response rates across the Census Bureau, the Economic Programs Directorate is proposing the use of these three response rates: Response Rate = [s / (e+u)]*100 = [s / (n – a – i)]*100
22
Quantity Response Rate = ⎥⎦
⎤⎢⎣
⎡∑ T/tw iS
i * 100
Total Quantity Response Rate = ⎥⎦
⎤⎢⎣
⎡∑+
T/tw iAS
i * 100
where S = the set of eligible cases with successful data-collections—that is, the set of units for which
an attempt was made to collect data, it is known that the unit belongs to the target population, and the unit provided sufficient data to be considered a report.
s = number of units in S. e = number of eligible units for which data collection was attempted—that is, the number of
units for which an attempt has been made to collect data and it is known that the unit belongs to the target population. (Includes set S, plus eligible units that participated but did not provide sufficient data to be considered a report.)
u = number of units of unknown eligibility⎯that is, the number of survey units for which there
is an unsuccessful attempt to collect data and no information is available about whether or not the unit is a member of the target population. (Includes refusals.)
n = number of units in the sample or census. A = the set of units belonging to the target population for which it was decided that data would
be obtained from sources determined to be of equivalent quality as data provided by respondents.
a = number of units belonging to the target population for which it was decided to not collect
survey data, for reasons other than that the unit had been a refusal in the past, but to instead obtain data from sources determined to be of equivalent quality as data provided by respondents.
i = number of ineligible units—that is, units for which data collection was attempted and it is
known these units do not belong to the target population. wBi B = the sampling weight for the ith unit. t Bi B= the quantity of a key variable for the ith unit. T = the estimated (weighted) total of the variable t over the entire population represented by the frame. T is based on actual data (and administrative data for some surveys) and on imputed data or nonresponse adjustment.
23
The proposed reponse rate differs from the STEPS check-in rate, which using the above notation is given by StEPS checked-in rate = (e + iB cB) / (e + u + i) = (e + iB cB) / (n - a) , where i B c B= checked-in ineligible cases—that is, units for which data collection was attempted, after
which the cases were checked-in, but it is known that these units do not belong to the target population. (The check in process also checks in cases that do not possess sufficient data to be considered a response.)
The proposed Total Quantity Response Rate is equal to 1.0 minus the StEPS Impuation Rate, and the proposed Quantity Response rate is equal to the Total Quantity Response Rate minus the StEPS Administrative Data Rate. 4. Trends in Response Rates at the Census Bureau Figures 4 through 7 display response rates (i.e., Response Rate # 2 = 1- Imputation Rate) for the three Census Bureau surveys summarized in Table 4.
24
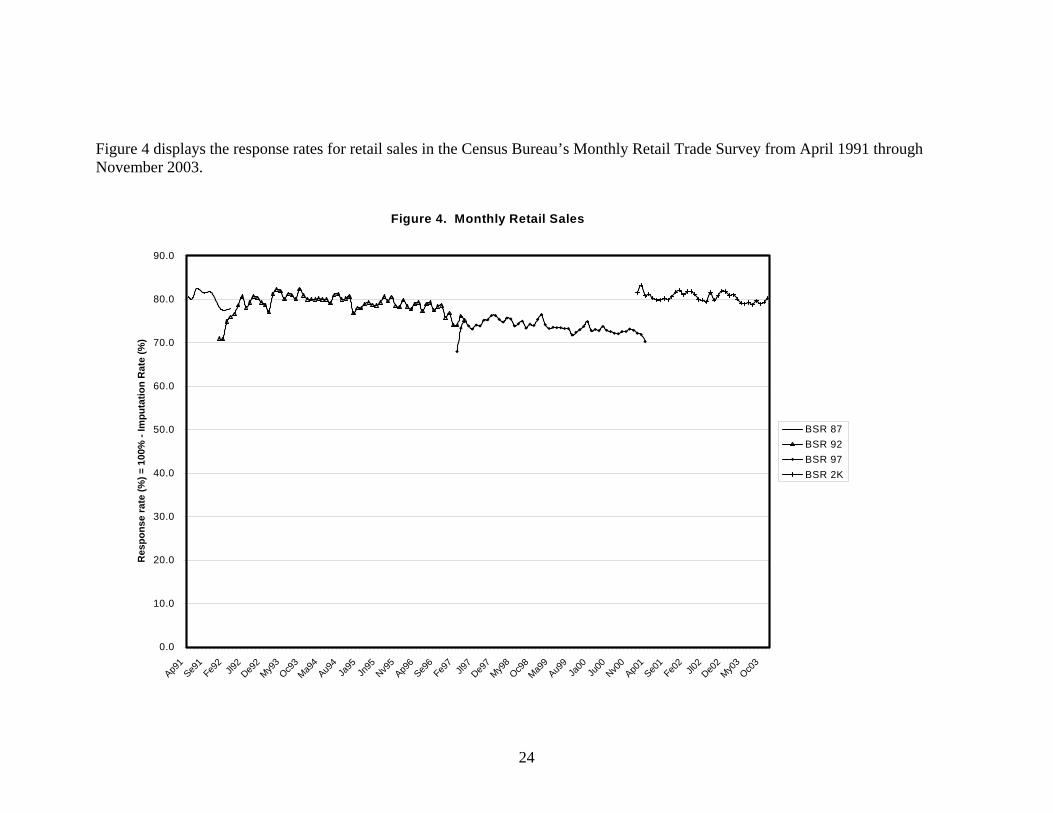
Figure 4 displays the response rates for retail sales in the Census Bureau’s Monthly Retail Trade Survey from April 1991 through November 2003.
Figure 4. Monthly Retail Sales
0.0
10.0
20.0
30.0
40.0
50.0
60.0
70.0
80.0
90.0
Ap91
Se91
Fe92
Jl92
De92
My93
Oc93
Ma94
Au94
Ja95
Jn95
Nv95
Ap96
Se96
Fe97
Jl97
De97
My98
Oc98
Ma99
Au99
Ja00
Ju00
Nv00
Ap01
Se01
Fe02
Jl02
De02
My03
Oc03
Res
pons
e ra
te (%
) = 1
00%
- Im
puta
tion
Rat
e (%
)
BSR 87BSR 92BSR 97BSR 2K
25
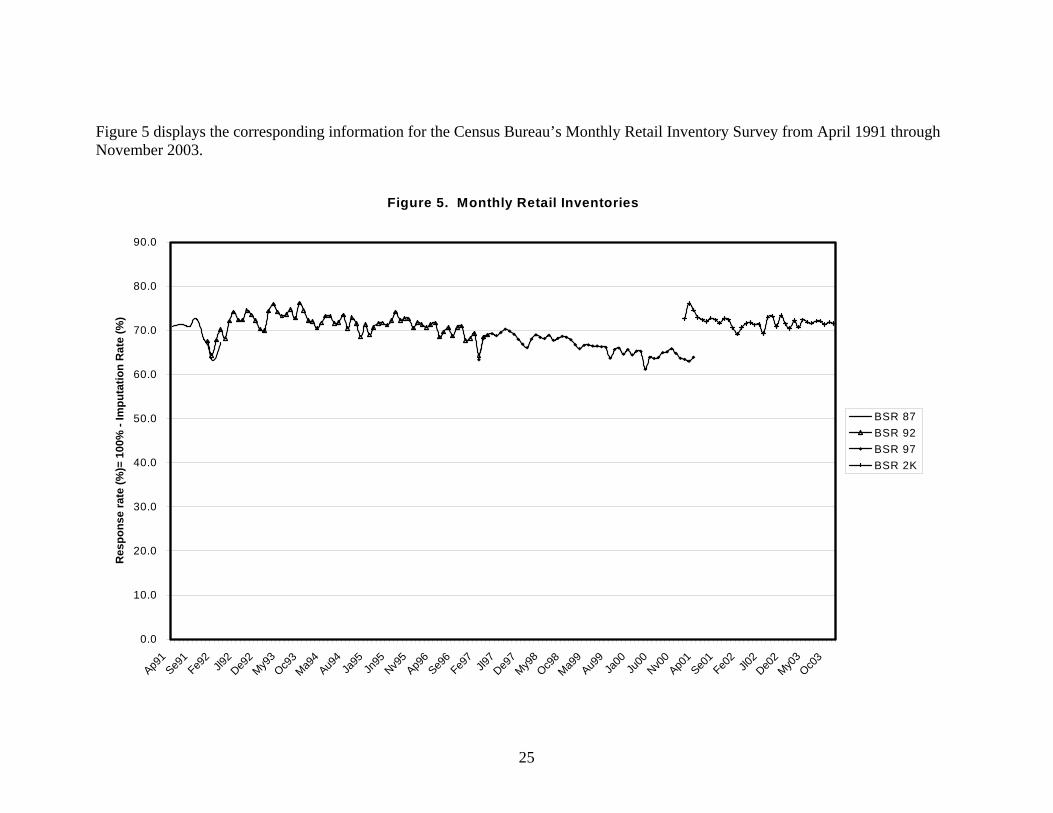
Figure 5 displays the corresponding information for the Census Bureau’s Monthly Retail Inventory Survey from April 1991 through November 2003.
Figure 5. Monthly Retail Inventories
0.0
10.0
20.0
30.0
40.0
50.0
60.0
70.0
80.0
90.0
Ap91
Se91
Fe92
Jl92
De92
My93
Oc93
Ma94
Au94
Ja95
Jn95
Nv95
Ap96
Se96
Fe97
Jl97
De97
My98
Oc98
Ma99
Au99
Ja00
Ju00
Nv00
Ap01
Se01
Fe02
Jl02
De02
My03
Oc03
Res
pons
e ra
te (%
)= 1
00%
- Im
puta
tion
Rat
e (%
)
BSR 87BSR 92BSR 97BSR 2K
26
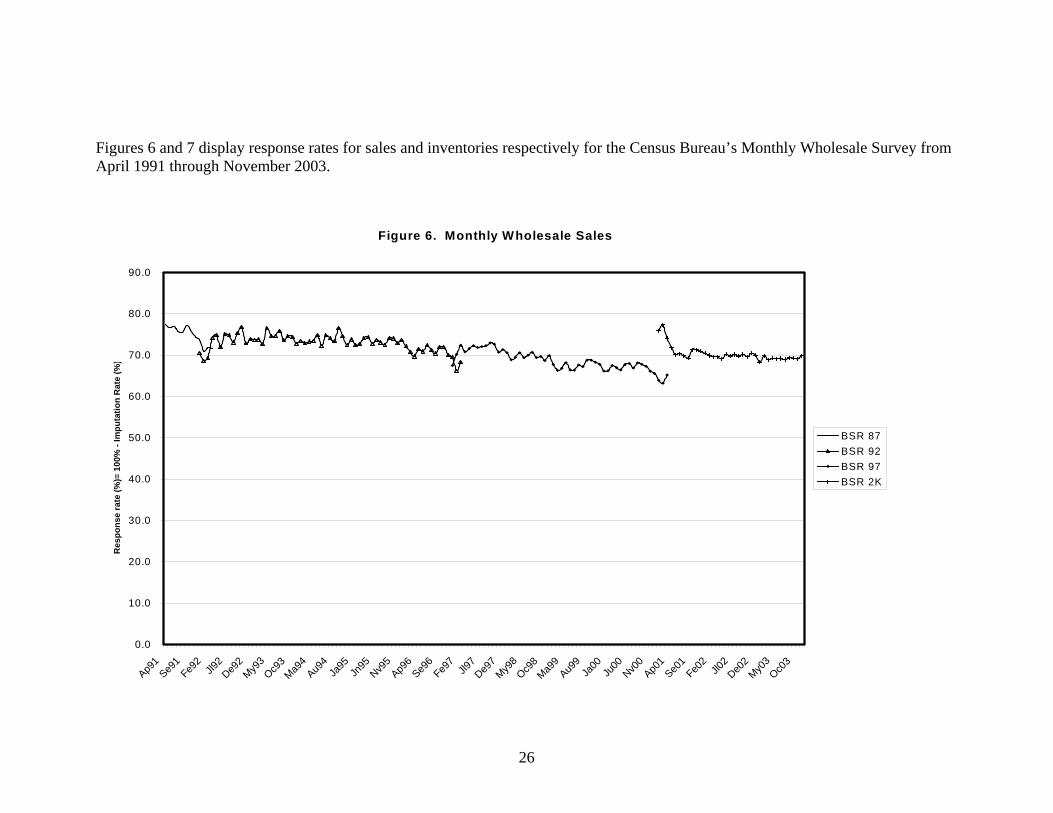
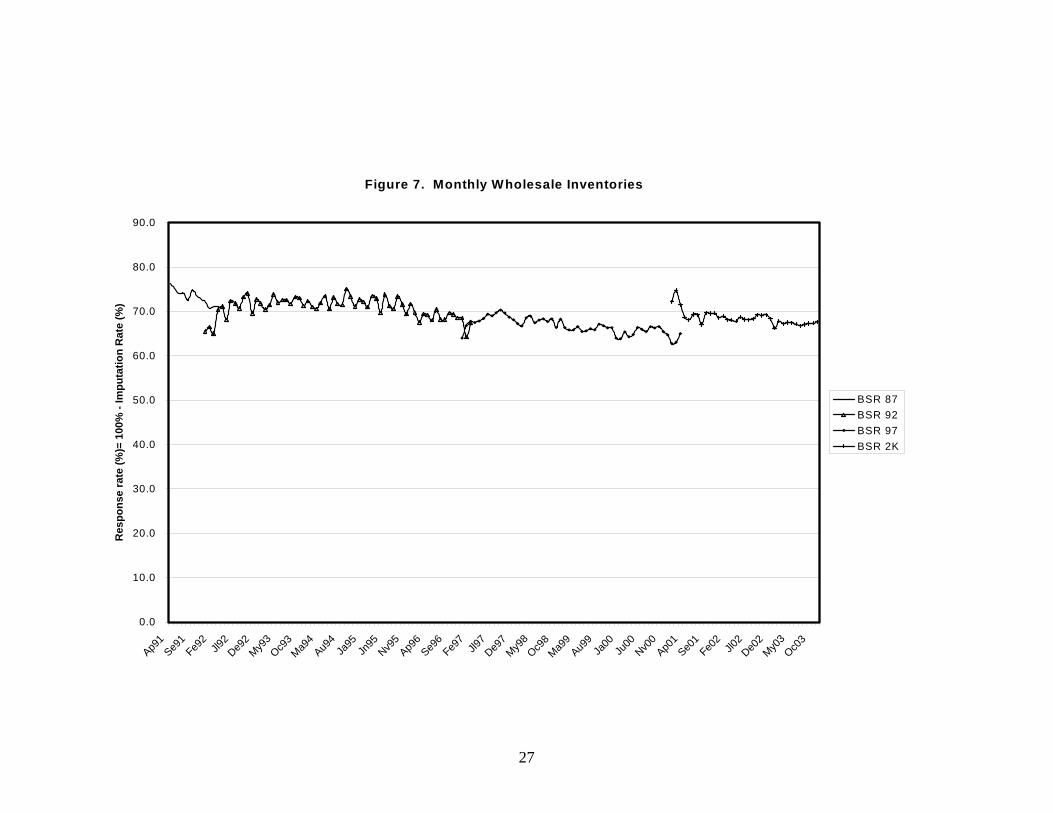
Figures 6 and 7 display response rates for sales and inventories respectively for the Census Bureau’s Monthly Wholesale Survey from April 1991 through November 2003.
Figure 6. Monthly Wholesale Sales
0.0
10.0
20.0
30.0
40.0
50.0
60.0
70.0
80.0
90.0
Ap91
Se91
Fe92
Jl92
De92
My93
Oc93
Ma94
Au94
Ja95
Jn95
Nv95
Ap96
Se96
Fe97
Jl97
De97
My98
Oc98
Ma99
Au99
Ja00
Ju00
Nv00
Ap01
Se01
Fe02
Jl02
De02
My03
Oc03
Res
pons
e ra
te (%
)= 1
00%
- Im
puta
tion
Rat
e (%
)
BSR 87BSR 92BSR 97BSR 2K
27
Figure 7. Monthly Wholesale Inventories
0.0
10.0
20.0
30.0
40.0
50.0
60.0
70.0
80.0
90.0
Ap91
Se91
Fe92
Jl92
De92
My93
Oc93
Ma94
Au94
Ja95
Jn95
Nv95
Ap96
Se96
Fe97
Jl97
De97
My98
Oc98
Ma99
Au99
Ja00
Ju00
Nv00
Ap01
Se01
Fe02
Jl02
De02
My03
Oc03
Res
pons
e ra
te (%
)= 1
00%
- Im
puta
tion
Rat
e (%
)
BSR 87BSR 92BSR 97BSR 2K
28
These three surveys are redesigned approximately every five years. Between April 1991 and November 2003, new samples for these surveys were introduced at the beginning of the years 1987, 1992, 1997, and 2000. In the figures, the different samples are labeled “BSR” (for “Business Sample Redesign”) followed by the year that the new sample is introduced. The new sample and old samples overlap for three months. Response rates tend to increase for a short period of time after a new sample is introduced, but then they tend to decrease. The BSR 97 eliminated rotating panels and implemented a design with a single fixed panel. Under the rotating-panel design, respondents were asked to respond every third month with two months of data. Under the BSR 97 fixed-panel design, respondents were asked to respond every month. Cantwell and Caldwell (1998) describe the survey research supporting the BSR 97. The BSR 2K produced large increases in response rates. A possible reason for this is that in order to decrease respondent burden, small and medium size firms that were in the BSR 97 sample were not selected for the BSR 2K sample. This procedure had not been used in earlier sample revisions. Possible additional reasons for the increases in response rates with the introduction of the BSR 2K sample include that for the first time ever the mandatory annual survey was mailed prior to the voluntary monthly surveys and extra resources were devoted to training clerical staff to increase response and to monitor response progress. Cantwell and Black (1998) and Kinyon, et al. (2000) provide additional details about the BSR 2K. C. BLS vs Census Bureau Differences in Response Rates In addition to design and content differences in surveys conducted by the two agencies, differences in response rates may be due to differences in authority and data collection mode. Many Census Bureau surveys are mandatory and as a result obtain high response rates. Respondents may also think of the Census Bureau nonmandatory surveys as mandatory, resulting in higher response rates. On the other hand, except for the annual refiling survey for a few states and one national survey, the BLS surveys are voluntary. To compensate for the voluntary nature of the BLS surveys, BLS uses interviewers in the initiation process, if not also for routine data collection. BLS turns to self-administered modes only after sample initiation and/or indoctrination, while the Census Bureau relies on self-administration alone for nearly all of its survey or census programs, using personal intervention (usually by telephone) only for nonresponse reminders or follow-up. IV. Methods to Encourage Response Many methods used by the BLS and Census Bureau to reduce nonresponse on their establishment surveys run the gamut of traditional survey nonresponse reduction strategies, while some methods reflect characteristics more unique to establishment surveys. Both BLS and the Census Bureau conduct pre-survey notification activities, providing advance notification to respondents of upcoming survey contacts. BLS Regional Offices
29
have begun tailoring their contacts to characteristics of the establishment, especially when they deal with large establishments, and advance letters and other pre-survey information have been altered to fit the establishment. Both BLS and the Census Bureau tailor their questionnaires by industry, to the extent practical, and both offer multiple reporting modes simultaneously, including touch-tone data entry/voice recognition entry (TDE/VRE), fax and electronic options. While electronic reporting via the Web and computerized self-administered questionnaires (CSAQs) have become more prevalent in recent years, electronic reporting remains an alternative reporting mode offered along with traditional paper forms. Since electronic reporting has not yet become the predominant or sole collection mode, resources are not saved or traded-off in data collection; rather additional resources and survey coordination are required to maintain multiple reporting modes. Both BLS and the Census Bureau conduct outreach and survey promotion through trade shows and contact with industry organizations. BLS notes that sample establishments often lack awareness of the agency and its data, and so its Regional Offices have created outreach efforts to publicize BLS surveys and to broaden knowledge of BLS data, their uses, and their sources. For example, regional staff members attend meetings of industry associations, where they make presentations about BLS surveys and data products and advertise BLS data products through exhibits. The regions also hold open houses to make potential respondents more aware of BLS survey programs. While the Census Bureau may enjoy wider name recognition, the agency is known best for conducting the decennial population census. Like BLS, the economic area of the Census Bureau finds value in promotional and outreach activities with industry associations and their trade shows in order to raise awareness of its economic surveys and data products. Both BLS and the Census Bureau focus the most intensive levels of outreach or nonresponse follow-up activities on selected cases, usually very large businesses, having the greatest potential impact on statistical survey estimates. Both agencies undertake personalized contact with selected companies to encourage response. At BLS, senior managers and branch chiefs now participate more actively when their data collectors encounter refusals or reluctant respondents, especially in large establishments. Managers may directly contact senior officials of the firm to gain cooperation by explaining the importance of the firm’s data to BLS estimates. Several BLS regional managers have visited certainty unit establishments in a number of BLS programs. Higher-level regional managers identify and contact users of BLS data within a firm, and involve those users in efforts to gain their establishment’s cooperation. Economic analysts in BLS Regional Offices provide data collectors with background information on firms that are likely to be reluctant respondents, a list of possible contacts, and a better understanding of how the company works. Analysts also inform data collectors about BLS data products to increase their leverage when making contacts. Data collectors may also be rotated through the economic analysis office, so they can have a better grounding in BLS statistical work. At the Census Bureau, similar personal contacts with large companies were formalized into a Customer Relationship Manager (CRM) program in 1999 to re-engineer
30
relationships with very large companies that participate in Census Bureau surveys and censuses. CRMs take a “company-centric” approach and act as liaisons with company contacts, to aid reporters with understanding and coordinating multiple Census Bureau surveys that ask for information at various organizational levels and for various activities. The CRM unit also helps the Census Bureau respond to swift changes occurring in large business organization and record keeping. CRMs focus on a core portfolio of more than 60 companies for current surveys, some recommended by Census Bureau subject divisions, some selected by virtue of their complexity or historic response problems, and some self-selected. Anecdotal evidence suggests the value of this strategy to companies -- company contacts look to their CRMs because they can get quick, accurate answers about any of their surveys. Within the Census Bureau, CRMs bring together company experts from each survey program and use a team approach to develop strategies that address complex company reporting issues. CRMs have also developed an internal repository of company and survey information to facilitate information sharing across survey programs. Analysts find that having access to information about surveys and contacts across the Census Bureau helps them make sense of the entire response burden for companies, and results in better response. Like the Census Bureau, BLS has been working to reduce bureaucratic barriers (“stove pipes”) between survey programs and to create an integrated approach to nonresponse reduction across survey programs. Regional Offices coordinate contacts with large or multi-unit firms across surveys, an essential step in minimizing the reporting burden on these units. These coordinated efforts include the design of promotional materials that highlight all BLS products. Refusal avoidance and reluctance training may be provided to groups of data collectors working on different BLS programs, allowing the staff to share insights from different surveys. BLS differs greatly from the Census Bureau in its ability to use data collectors of various types, particularly interviewers, to intervene with nonresponse reduction efforts. Training plays a critical role in gaining and maintaining cooperation. A strong training effort currently underway at BLS teaches data collectors how to use the concept of “reciprocal value” to obtain respondent cooperation. This type of training focuses on how establishments can use survey data, and on how those same data can impact the establishment’s industry. Data collectors are also taught how to describe BLS data that might benefit the establishment or the industry, the assumption being that respondents will be more likely to cooperate if they believe their data will have some benefit for their establishment or industry. Program-specific training also helps BLS data collectors teach respondents how to complete the survey during the initial contact, and emphasizes how to avoid overwhelming respondents with the survey task. After several months of experience, BLS data collectors are also trained in avoiding refusals (Groves and McGonagle, 2001), by preparing them to react positively to potential objections from respondents. The course also addresses navigating the company to find the correct informant. Refusal avoidance training is typically a mix of activities rather than being survey-specific, allowing field staff from different programs to learn from each other and share ideas across survey programs.
31
At BLS, classroom training and on-the-job training rely increasingly on the knowledge of senior data collection staff. Rather than limit classroom training to new data collectors, senior staff participate and offer the benefits of their experience, especially regarding difficult respondents. Senior staff also assist new interviewers with their first assignments, provide advice, and monitor trainee progress. The Census Bureau, on the other hand, must take advantage of different techniques to encourage and maintain response on its many self-administered surveys. According to Monsour (1998), most economic surveys conducted by the Census Bureau 1) used one to four follow-up mailings, with or without a replacement questionnaire, and 2) switched modes from mail to telephone for selected chronic nonrespondents; however, use of personal visits for data collection was rare. Besides strategies that the Census Bureau has in common with BLS, other nonresponse reduction methods used by various Census Bureau economic programs include:
• Stronger appeals in successive follow-up mailings • Enclosure of promotional materials with pre-survey and survey mailings • Toll-free telephone helplines to provide assistance to respondents completing
forms • Collecting minimal data requirements in lieu of total nonresponse • Searching for a specific or alternative informant to report the desired company or
establishment data • Preprinting previously reported data to ease respondent burden • Explicit indication on survey forms that estimates are acceptable for requested
data items • Working with selected sample units to establish reporting parts, facilitating
response • Accepting data in alternative forms (that is, data that are not recorded on the questionnaire), including spreadsheets of internal company summary reports or printouts from records, such that data may not map exactly to requested items, requiring analysts (rather than respondents) to determine item responses.
The Census Bureau uses the most intricate and aggressive nonresponse reduction strategies for its economic census. Although mandatory, the economic census remains a response challenge. Additional methods used to reduce nonresponse on the recent 2002 Economic Census, for example, included:
• Offering electronic reporting to all establishments included in the 2002 Economic Census
• Pre-survey notification to large multi-unit companies, requesting they identify a “point person” to serve as recipient and coordinator of economic census response for the company
• Mailing subsets of establishments to different company reporters, per advance arrangement with the company
• Advance information and reporting instructions supplied to Certified Public Accountants
32
• Public relations activities and materials highlighting endorsements from notable public or industry figures, such as the Chairman of the President’s Council of Economic Advisors
• Substantial personalized assistance with the electronic reporting options provided to selected large companies, including acceptance of alternative electronic formats, such as data reported in spreadsheets, which were converted to acceptable electronic formats by Census Bureau staff
• Respondent self-help via a Web-based Business Help Site • Mandatory authority exercised in late nonresponse follow-up via the threat of
prosecution • Courtesy calls to selected large businesses prior to alerting the Commerce
Department’s Office of the Inspector General (OIG) of the company’s noncompliance
• OIG letters threatening prosecution for noncompliance In addition, the Census Bureau’s CRM unit directed additional response promotion activities at some of the largest companies during the 2002 Economic Census. Advance information was sent to thousands of large companies, enabling them to anticipate resource requirements. For the very largest companies, about 1,000 in all, an Account Manager was assigned to establish and maintain contact with the company. The Account Manager identified a company contact to be primarily responsible for coordinating or completing the forms, worked out reporting arrangements with the company, and provided or obtained whatever assistance was necessary to facilitate company cooperation. The Account Manager was responsible for the entire company, across all industry sectors, and was called on to assist with other economic surveys in addition to the 2002 Economic Census. The role played by the Account Managers during past economic censuses was effective. Comparison of response to the 1997 and 1992 Economic Censuses showed that companies with Account Managers for 1997 reported better and earlier than they did for the 1992 census, before the Account Manager program existed. Initial analysis of 2002 Economic Census response shows similar results. For example, 54 very large companies returned just 5.5 percent of their 1997 Economic Census forms by October of the collection year for the 2002 Economic Census; these same companies returned 75 percent of their forms in the same amount of time. Other factors may have contributed to the timeliness of reporting, such as the widespread availability of electronic reporting. Nevertheless, the personalized assistance with the electronic reporting system provided to client companies by Account Managers likely played an enabling role as well. V. Research on Nonresponse Reduction A. Survey Participation Decisions 1. A Conceptual Framework for Business Survey Participation
Recent qualitative research at the Census Bureau provides some insights and suggests some hypotheses regarding businesses’ motivations for responding to surveys.
33
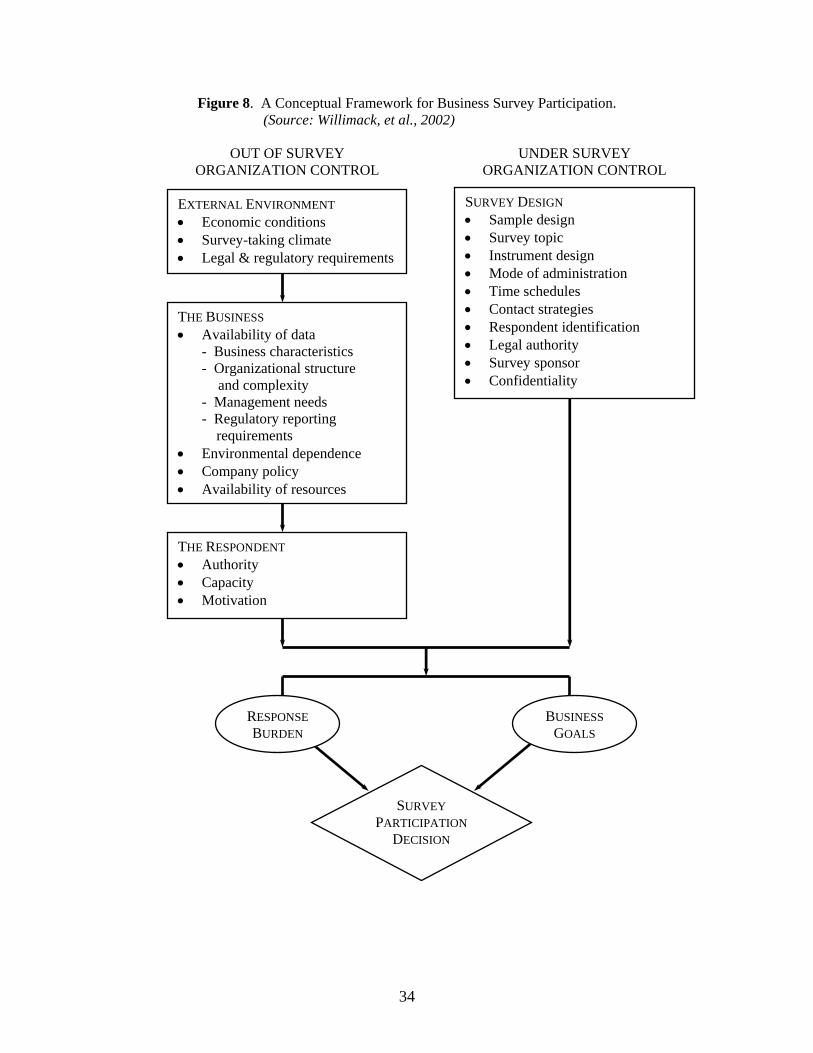
(Willimack et al. 2002). Researchers conducted exploratory unstructured interviews during group meetings with company staff responsible for government reporting during site visits to thirty large multi-unit companies. The selected companies varied along a number of dimensions: industry type, degree of industry diversity, public versus private ownership, degree of foreign involvement, and cooperation rates on various Census Bureau surveys and censuses. Meetings, which lasted three hours or more, covered a variety of topics, including company organization and information system structure, availability of data, respondent selection and response strategies, and perceptions of confidentiality and burden. The findings led Willimack et al. to formulate a conceptual framework for business survey participation. Their model, shown in Figure 8, postulates that businesses weigh response burden against business goals when considering the decision to participate in a survey. Both burden and goals may be impacted by factors relating to the external environment, the business, and the respondent – which are not under the control of the survey organization – as well as survey design features – which are under the survey organization’s control. The Willimack et al. model and qualitative research results suggest several hypotheses. Nonresponse would be expected to rise with increases in the following variables:
• Response burden • Difficulty of retrieving data • Disparity between internal company data summaries and requested survey data • Complexity of organizational structure • Staff turnover • Existence across companies of policies about responding to surveys
Nonresponse might also be expected to increase as the availability of data and/or company staff resources decrease. On the other hand, evidence of the sponsor’s authority to collect and make legitimate use of the data would be expected to reduce nonresponse. In addition, this research found that businesses desire advance notification of upcoming surveys, possibly in the form of an annual reporting calendar. Business respondents said this would help them plan for and integrate survey completion tasks with other work, implying that survey nonresponse would be reduced. However, based on study participants’ reports, many of the conditions listed above appeared to be more likely to affect the timeliness of response than to result in total unit nonresponse. Moreover, respondent’s capacity to retrieve and gather company data is not, by itself, a sufficient condition for survey response. Respondent capacity plus respondent authority to release data is necessary. This authority tends to reside in mid-level managers, who also have the authority to delegate the data retrieval and response tasks to subordinate staff. This implies that sending a survey form to the mid-level manager may lead to nonresponse reduction.
34
Figure 8. A Conceptual Framework for Business Survey Participation.
(Source: Willimack, et al., 2002)
SURVEY DESIGN • Sample design • Survey topic • Instrument design • Mode of administration • Time schedules • Contact strategies • Respondent identification • Legal authority • Survey sponsor • Confidentiality
EXTERNAL ENVIRONMENT • Economic conditions • Survey-taking climate • Legal & regulatory requirements
OUT OF SURVEY ORGANIZATION CONTROL
UNDER SURVEY ORGANIZATION CONTROL
THE BUSINESS • Availability of data
- Business characteristics - Organizational structure
and complexity - Management needs - Regulatory reporting requirements
• Environmental dependence • Company policy • Availability of resources
THE RESPONDENT • Authority • Capacity • Motivation
RESPONSE BURDEN
BUSINESS GOALS
SURVEY PARTICIPATION
DECISION
35
The survey participation model also suggests linkages related to the survey-taking climate and the multitude of data requests for legal and regulatory purposes which primarily emanate from government agencies. The availability of resources and respondent motivation are impacted. Research findings corroborate this view. Study participants failed to distinguish among the various government agencies that request data, with the exception of the Internal Revenue Service. Instead, from the perspective of business respondents, data requests come from, simply and solely, “the federal government” as a whole. As a result, data requests appear duplicative to respondents, adding respondent burden (Nichols and Willimack, 2001; Sudman et al., 2000). Results of the research reported by Willimack et al. (2002) led to several initiatives in an attempt to improve response to economic surveys at the Census Bureau (Sudman, et al., 2000). A number of activities were directed to reducing respondent burden, which economic programs at the Census Bureau consider to be directly associated with nonresponse. These include the following:
• A new staff was created to provide expert assistance in questionnaire development and testing to individual program areas, so that forms design is improved and cognitive response burden is reduced. Since 1999, this staff has conducted cognitive testing to support development or redesign of questionnaires for more than a dozen economic programs, as well as the 2002 Economic Census. They have provided numerous expert reviews to improve the design of survey forms. They have also conducted usability testing on electronic instruments for two current economic indicator surveys and the Business Help Site on the Census Bureau’s Website, as well as conducting research to support design of the 2002 Economic Census computerized self-administered questionnaires.
• Since networked industries in the services sector, such as communication, transportation and finance, have difficulty with establishment-level reporting, alternative reporting units were defined to ease data retrieval for companies in these industries. Research was conducted to identify the types of data kept at various levels of companies in these industries. Research results were used to redesign data collection methodology in networked industries for the 2002 Economic Census.
The goal of other initiatives has been to improve services offered to respondents, so that businesses’ reporting activities are supported, in an attempt to maintain or improve response. Such activities include:
• The CRM program described earlier was founded to address issues raised in the Sudman et al. (2000) and Willimack et al. (2002) research. CRMs focus on selected large companies, improving communication and helping them plan resource use related to survey response. They prepare and administer an annual reporting calendar, which provides companies with advance notice of upcoming surveys so they can plan internal resource commitments. CRMs also take a “company-centric” approach, coordinating numerous survey requests from individual Census Bureau programs. The goal of these liaison activities and the individualized attention is to maintain or enhance response from these key data providers.
36
• The Census Bureau has also expanded the availability of electronic data collection, providing another reporting mode alternative for respondents to choose from. Several current economic programs already offer electronic reporting options, and every business in the 2002 Economic Census was offered the opportunity to report electronically. Improving the behavior, functionality and usability of electronic instruments through ongoing research and development remains a priority.
As the Census Bureau has proceeded to add electronic reporting options to selected business surveys, its effectiveness has been evaluated. In a split sample experiment on the 1999 Computer Network Use Supplement to the Annual Survey of Manufactures (Dodds, 2001), half the sample received a paper questionnaire and a URL and password for a Web-based instrument at initial mailout. The other half-sample also received a letter with the URL and password, but no paper questionnaire. Both half-samples received paper forms in follow-up mailings. When the Web-based survey was initially offered without the paper form, uptake of the electronic option was significantly greater – 39% versus 9%. However, the overall multi-mode response rate was lower by five percentage points than when paper forms were provided with the initial Web request. In a mode conversion study (Hak et al., 2003) on the Manufacturers’ Shipments, Inventories and Orders (M3) Survey, a brief monthly economic indicator survey, company reporters for 77 of the largest cases in the survey were personally asked via telephone to switch to Web reporting. Of the 44 cases that initially converted to the Web, 84% remained Web reporters after 6 months. When a flyer was subsequently sent to the remaining sample cases notifying them of the Web option, only 3% converted and remained Web reporters after 6 months. Clearly, providing more personal attention to respondents was the more effective conversion strategy, although very costly. Reasons respondents gave for not converting related primarily to the straightforward nature of the survey and the ease of using competing modes, primarily fax. Findings also suggest that reasons for converting were less related to reporting burden than to respondents’ personal preferences and company goals to achieve a paperless workplace. Ten percent of the total response to the 2002 Economic Census was received electronically. Nearly all of the electronic reporters were multi-unit companies, accounting for nearly one-third of the multi-unit response to the economic census. In addition, the 1000 largest companies in the U.S. were strongly encouraged to report electronically, and data for three out of four of their establishments were received via electronic means (Marske, 2004a). However, the electronic return rate lagged behind the return rate of establishments reporting via paper questionnaires (Marske, 2000b). This may be explained in part by the fact that the electronic instrument was posted several weeks after paper forms were mailed, and companies encouraged to report electronically were automatically offered due date extensions.
2. A BLS Case Study The framework proposed by Willimack and her colleagues was adopted as the point of departure for a BLS (Fisher, et al., 2003; Fox, et al., 2002) study designed to learn more about the nature of establishment survey nonresponse. It focused specifically on nonresponse trends, causes of nonresponse, patterns in nonresponse, and possible
37
solutions to nonresponse. The ultimate outcome of this research is the identification and implementation of improved data collection procedures that will address establishment survey nonresponse problems. Data collection for this research was carried out over a 10-month period and took several different forms. It included personal interviews with managers in the national office and four of the six BLS regional offices. The research team also conducted focus groups in the four regions and contacted sample establishments from the four programs (i.e., CES, NCS, PPI, and IPP) by telephone. Team members were trained moderators and interviewers and were also well-informed about objectives of the study. 2.1 BLS Personal Interviews Protocol Development. The BLS team developed interview protocols to be administered to different BLS groups-- national office senior managers, national office mid-level managers, regional office managers, national office managers for regional data collection staff. The final versions of the four survey protocols included the following general topics: measurement of nonresponse and trends; problematic aspects of non-response; reducing nonresponse; staffing issues and nonresponse; training and its relationship to nonresponse; procedures for communication about nonresponse among different organizational units; use of technology in data collection; use of incentives with both respondents and interviewers as a means of reducing nonresponse; possible improvements if additional resources were devoted to non-response; and any other thoughts, opinions, and suggestions participants offered. Data Collection Procedures. Twenty-nine personal interviews were conducted with BLS personnel from the national office and four of the six BLS regional offices. The interview participants represented one, sometimes two, of the four surveys of interest. Interviewers used the protocols described above and incorporated flexible interviewing and probing techniques to address participants’ questions and comments. 2.2 BLS Focus Groups Protocol Development. The focus group protocols were developed using procedures similar to those described earlier for the BLS personal interview protocols. The first protocol was used with data collectors from the four regional offices involved in this study and focused on approaches used to secure cooperation during initial and follow-up interviews on three of the surveys. A second protocol was designed for national office staff who collect updated data on two of those surveys. A third protocol focused on issues related to moving respondents from CATI to self-reporting via touch-tone data entry (TDE), and included issues related to non-response. Major topics addressed by the protocols included strategies used by data collectors to develop rapport with establishment respondents, characteristics commonly found in “good” versus “poor” respondents and in nonrespondents, training and job-related issues, and program-specific questions (e.g., transitioning CES respondents from CATI to TDE; delinquent IPP reporters, etc.). Data Collection Procedures. Trained focus-group moderators from the BLS team conducted the focus groups. A total of 14 focus groups were conducted with regional
38
office data collection staff from the NCS, IPP and PPI; national office industry analysts from the IPP program; CES CATI interviewers in two regional offices; and the managers of the centralized telephone data collection facilities that are responsible for CATI interviewing in the CES. 2.3 Results of Personal Interviews and Focus Groups External Factors That Influence Nonresponse As posited by the Willimack, et al. conceptual framework for business survey participation, three groups of factors outside of BLS control influence survey nonresponse: external environmental attributes, features of the sample unit (i.e., the business), and characteristics of the designated respondent. External environmental factors: Willimack et al. (2002) posit the survey-taking climate, the economic environment, and legal and regulatory requirements as relevant attributes of the external environment. Indeed, the survey-taking climate surfaced repeatedly during this study, particularly with reference to accessing the sample unit and actually requesting the data. The importance of current economic conditions was also documented. The team heard frequently about the effect on survey response of downsizing, mergers, and acquisitions. Often BLS respondents are administrative personnel in Human Resources departments. Many of these departments have experienced reductions in staff, which leave remaining staff with less time for their daily tasks and, consequently, with less time to provide data for government surveys. Similarly, the economic climate has generated an increasing number of mergers and acquisitions, which can affect nonresponse in several ways. Former reporters may be acquired by and integrated into larger firms, thereby increasing the amount of data reported for the combined firm. At least partly due to mergers and acquisitions, employees at the combined firms are increasingly busy and unwilling or unable to accept additional tasks. Finally, either the acquiring or acquired organization may refuse to participate, thereby eliminating a former respondent. Another factor affecting response involves legal and regulatory requirements. Most BLS surveys are voluntary, and the effect of voluntary collection on BLS establishment nonresponse is generally negative. While mandatory reporting has been shown to reduce nonresponse, even mandatory surveys may have few or no enforcement provisions or penalties to encourage reporting. This effect operates through characteristics of the sampled businesses, particularly policies against participating in voluntary surveys. The establishment’s policy regarding voluntary surveys is often driven by burden and resource issues (Willimack et al. 2002), but may also result from anti-government perspectives on the part of the business owner or manager, or management concerns about data confidentiality and fears that competitors will acquire sensitive information. Business factors: The second general external factor affecting establishment survey nonresponse, as identified in the Willimack et al. (2002) model, is the business, i.e. the sample unit. These authors consider the availability of data (dependent on business characteristics and other variables), the extent to which an organization interacts with outside organizations (a concept described as “environmental dependence” by
39
Tomaskovic-Devey et al. 1994), company policy, and availability of resources as factors in the decision to participate in a survey or not. The BLS team’s findings support the importance of several of these variables. Getting past a gatekeeper has become more challenging for data collection staff. Call screening, voice mail, and automated call systems requiring a specific telephone extension increase time needed to reach the correct person, particularly in larger firms. Occasionally, a data collector may make an unannounced personal visit to a respondent who does not return calls, and may be rewarded with an interview⎯or unceremoniously shown the door. Data collectors report the latter outcome has become more common since many companies began instituting more extensive security measures. Data availability is another case in point. Whether a business can supply the data requested by BLS, in the format requested, and within the specified time frame, depends to some extent on the size and complexity of the organization, which influences the location and content of records. The frequency and timing of data requests are also factors in availability, as BLS deadlines may not coincide with the respondent’s record-keeping procedures. Establishment size is another consideration, both at first contact and during later data collection cycles. The use of third parties to maintain and prepare records is another factor affecting the availability of data that can contribute to nonresponse. Many establishments turn to service bureaus or accountants to maintain administrative records containing information needed for some BLS survey requests, and do not have that data immediately at hand. Third parties may bill the sample establishment for providing data, which tends to be a barrier to survey participation. Meeting survey deadlines may also be problematic given a respondent’s need to contact a third party. The decision to participate is affected by several factors, including the respondent’s attitudes towards the government, whether the establishment recognizes the existence and value of a survey’s products, and the source of the data. According to data collectors, some respondents perceive duplication among data requested for different surveys. In addition, some respondents who could use BLS data actually obtain data from other sources. The overall effect of these factors is to discourage response. Respondent factors: The third group of external factors that shapes survey response is respondent-specific. The individual respondent’s position in the organization will vary from establishment to establishment. As described initially by Tomaskovic-Devey et al. (1994), the respondent must have the authority, capacity (knowledge and access to data), and motivation to participate in a survey. Authority is definitely a factor in refusals. Data collectors for all of the surveys noted that hearing a “no” from the president, CEO, or from the company’s lawyers was a “hard” refusal and not one that was likely to be reversed. Discussions with data collectors identified a number of characteristics that can be attributed to capacity to respond. Good respondents say they can produce data for a survey, often asking questions or seeking clarification to ensure they are reporting correctly. They may be at larger companies with more sophisticated information systems. Respondents who are timely reporters and prepared for an interviewer
40
demonstrate a high level of motivation, while those who work in establishments where staff resources are limited, who report concerns about additional work, or who need to be “prodded” by an interviewer, tend to be less motivated to respond and are not very good reporters. Data collectors tell us that motivation is often negatively affected by burden, especially after respondents have been in sample for some period of time. While businesses do not always refuse outright, some respondents use voice mail and other means to avoid the interviewer. They may promise to call the interviewer back, but fail to do so. Many data collectors believe that reluctant respondents at some firms agree to participate in a survey just to get the data collector to stop bothering them. Therefore, they may report during an initial contact and stop reporting after one or two data collection cycles. Internal Factors That Influence Nonresponse Internal factors refer to those features of the survey process that are largely under the control of BLS, including the survey instrument itself, associated data collection processes and procedures, internal efforts to communicate information about policy and procedures, and agency-driven efforts to market BLS products to users and respondents. Response mode. To encourage response, BLS surveys have increasingly offered establishments multiple modes of reporting, and are moving toward offering electronic reporting options as well. While respondents can then participate as they choose, there is some evidence that increased reliance on respondent-initiated reporting has a negative effect on overall response rates. For example, the CES Program offers respondents CATI, fax, Touch-tone Data Entry (TDE), mail, and the Internet, while other surveys offer electronic file reporting options as well as e-mail. CES was originally based on a quota sample, where nonrespondents were simply replaced and no true response rate measures were possible. With the recent switch to a probability-based sample, managers discovered nonresponse among TDE reporters was 30 percentage points higher than for CATI, even after numerous reminders to prompt reporters to call in their data. Switching these cases back to CATI addressed the problem, but added dramatically to data collection costs. Marketing. On some surveys, field staff work with specially-trained regional office staff to develop customized BLS data products that can be offered to prospective respondents during the initial contact. This provides establishments with an incentive to participate and offers a concrete example of how the data are used. Generally, a simple principle applies. The more timely the data, the more useful and relevant to the user, and the greater the motivational value. Response burden. The perception of burden may be as important as the actual level of burden itself. Respondents’ perception of burden can be affected by many things but time in sample (some establishments are in a survey for years), the length of the interview (or number of separate reporting items), and apparent duplication across BLS and other government agency surveys seem to be the most critical factors for determining initial and continued participation.
41
In addition, differences in what is asked initially of potential respondents can affect willingness to cooperate. For example, the first CES contact is a request to participate, while in other programs, the respondent has to produce something (e.g. product descriptions) or participate in some type of probability selection activity. Data collectors are given leeway to negotiate with respondents over what data are collected during initiation. There are also differences in degree of burden associated with BLS data requests. Some data are much simpler to provide than others. There seems to be a relationship between burden and establishment size, such that small establishments may stop responding because they have limited staff and time to report. They also are more likely to believe their small numbers will not affect survey estimates. Accordingly, small firms or firms where the data rarely change were identified as difficult respondents, because field staff have difficulty persuading respondents that “no change” is an important economic outcome that needs to be measured. By contrast, large establishments and those reporting for multiple work units, have additional burden because they must compile data across units, but they also have more complex information systems to better access their data. Furthermore, establishments that are dominant within an industry often face a significant burden from a number of survey organizations that tap them for information. A special concern is reserved for certainty units in establishment samples. Certainty units are business entities that represent a significant portion of the economic activity in an industry or geographic area. Because of their importance, certainty units tend to be sampled for many surveys at BLS and other government agencies. Burden is a major concern for these businesses. The survey programs have initiated new and expensive procedures to introduce the survey to these establishments and to obtain their cooperation (e.g., personal visits instead of telephone contact, or communications from BLS managers). These procedures are likely to be more effective if they are accompanied by a formal endorsement of the survey by an industry association. Arrangements such as electronic data interchange may be offered for some surveys instead of more traditional data collection procedures. In addition, some burdensome surveys such as NCS go the “extra mile” by having the data collectors do much of the drudgery of looking up and recording the data if the company will give them access to “the books” and a quiet place to work. Nature of data requested. The nature of the data being requested is another factor associated with data availability; sometimes surveys ask for information not present in employer records. For example, the CES requests counts, work hours and payroll for production and nonsupervisory workers, but many respondents do not identify production workers or nonsupervisory workers in their records. Communications. Efforts to reduce nonresponse can be facilitated by communications between program offices and the field offices. Program offices, working closely with National Office of Field Operations (OFO), inform the field not only about upcoming changes in survey design but also any specific concerns about nonresponse. Communication takes place through telephone and video conference, visits by program staff to field offices, training sessions for interviewers and supervisors held in Washington.

42
B. Reasons for Nonresponse 1. Manufacturing Energy Consumption Survey Study The Energy Information Administration (EIA) studied reasons for nonresponse after a major redesign of the Manufacturing Energy Consumption Survey (MECS), which is collected by the Census Bureau. When the 1998 MECS questionnaire redesign increased the number of pages from 12 (in the 1994 MECS) to 56, maintaining response rates was of grave concern. Ware-Martin et al. (2000) report that response rates for this mandatory survey fell by only three percentage points from the 1994 collection, and noted that the Census Bureau’s Annual Survey of Manufactures suffered a similar response decline over the same period. In addition, Ware-Martin et al. conducted a nonresponse follow-up with a small non-statistical subsample of MECS nonrespondents. Although the goal was to complete 50 interviews for the study, only 35 cases could be contacted, resulting in only 24 completed interviews. The main reasons for noncontacts were 1) difficulty finding the individual within an establishment who was responsible for completing MECS (suggesting the original mail contact may have never found the desired respondent either), and 2) non-working telephone numbers. The main reasons given by MECS nonrespondents for not returning their forms are listed below, along with their relationship to hypotheses set forth by the Willimack et al. model.
1. Low priority given to completing government forms (motivation, according to the Willimack et al. survey participation model)
2. Lack of time (resource availability) 3. Difficulty gathering information from records and various data sources
throughout the establishment (data availability and retrievability) Although nonresponse was rarely attributed to the physical redesign of the form, a few nonrespondents did mention the intimidating length of the questionnaire, as indicated by the number of pages. 2. 1994 Research & Development Survey Study Nonresponse on the 1994 Survey of Industrial Research and Development (R&D survey) was evaluated (U.S. Bureau of the Census, 1997) in a telephone follow-up of 50 short form and 230 long form nonrespondents. Just as in the MECS study, the R&D survey experienced a large number of out-of-date addresses or contact names, particularly among the small companies receiving the short form. Many of these small companies had not been surveyed previously, so up-to-date information was lacking. Even the large companies noted that, although the address was sufficient to reach them, the contact information was insufficient for directing the survey to the appropriate person. The main reasons given for not responding to the 1994 R&D survey were:
43
1. The form was perceived as too burdensome or time-consuming to complete with limited or reduced staff (instrument design and resource availability, according to the Willimack et al. survey participation model)
2. The data were not available (availability of data) 3. Other reasons included staff cutbacks and reorganization (resource
availability), problems identifying the appropriate respondent, or the need to compile data from different departments (organizational complexity).
Since the R&D Survey contains both mandatory items and non-mandatory items, 205 respondents completing only the mandatory items were re-contacted for the nonresponse study as well. Other than a company policy to complete only the mandatory items, the main reason for not completing the voluntary items was that the form was too burdensome or time-consuming, or companies had insufficient staff. An interesting component of the 1994 R&D Survey nonresponse study was a question that asked companies about strategies to “make it easier for them to report”:
• Clarifying instructions; • Providing toll-free assistance; • Mailing the form at a different time of the year; • Allowing more time to report; • Using an electronic reporting format.
Most of the study participants said that none of these methods would likely encourage their response to the R&D Survey. Some short form nonrespondents indicated that providing toll-free assistance and allowing more time to report may increase response, at about 30 percent each. Likewise, long form nonrespondents indicated that allowing more time and mailing at a different time of year might improve response. The most frequent responses to a closed question about strategies to encourage response to the voluntary items were 1) making the survey mandatory and 2) limiting the amount of data requested or simplifying the form. 3. BLS Case Study: Establishment Interviews The third part of BLS study from Section A consisted of telephone interviews with establishments from each of the four BLS surveys under study. The primary objectives of these interviews were to learn (1) why some establishments comply with BLS requests for data, whereas others do not and (2) why some establishments simply stop providing data, or provide data less often than the survey’s prescribed data collection cycle. Because of the small sample sizes, the intention was not to generate conclusions that could be applied to all nonrespondents in the different groups. Instead, this was simply an attempt to identify some issues or themes related to nonresponse.
Protocol Development. Interview protocols were developed for the following groups of establishments:
• Cooperative Respondents: establishments that have reported regularly and consistently since enrollment in the survey sample;
44
• Intermittent Responders: establishments that reported for a while, stopped, then resumed reporting (e.g., they may have been converted from “refusal” status to active reporting status after an interval of time).
• Dropouts: establishments that reported for a number of data collection cycles, then stopped reporting before their period in the sample ended; and
• Nonrespondents: establishments that declined to participate in the survey when initially contacted by the survey program.
All of the protocols focused on the following issues:
• Company policies about participation in government surveys • Company decision-making about government survey participation • Concerns about confidentiality • Clarity of data requests • Relationship of frequency and timing of data requests to nonresponse • Availability of requested data in establishment records and respondent access to
those data • Preparation required to provide requested data • Perceived relevance of collected survey data • Experiences with BLS personnel and effect on survey participation • Suggestions to improve BLS relations with respondents in the future • Strategies BLS can undertake to promote future respondent participation.
Other questions were tailored to each category of establishment respondents. Data Collection Procedures. Personnel from the research office, who are not affiliated with the survey programs, conducted the interviews. Program offices provided samples of each of the four types of establishments, which included a contact name who would serve as the respondent for the purposes of this study. A total of 32 interviews were completed, with 8 interviews completed with each type of respondent across the four study surveys. Interviewers began by explaining to respondents that BLS was conducting a study to improve procedures used in establishment surveys. All of the participants allowed the interview to be taped. Everyone interviewed was assured of confidentiality, that their name or company would not appear in any final report, and that this was not an effort to recruit them for a survey. Factors that Influence Participation Although limited in scope, the results from these interviews have several implications. One is that familiarity with BLS and its products is important to gaining cooperation in BLS surveys. Another is that personal contact seems to be very helpful in building the initial relationship between the respondent and the survey. A third is that establishments with easy access to appropriate data are more likely to report, while those who perceive a request as burdensome or time-consuming are less likely to participate. A fourth is that respondents need to be educated about specific BLS surveys and, where relevant, how

45
those surveys differ from other data requests (e.g. monthly CES versus quarterly submissions to state Unemployment Insurance programs). A somewhat surprising finding is that burden was not necessarily the most important factor distinguishing respondents from nonrespondents. All of the interviewees mentioned they were busy and do not have time to spare; yet some comply, while others do not. Many (but not all) also reported that BLS data requests were relatively easy to fulfill and did not require too much time or effort. Nonrespondents were an exception to this group, expressing greater concerns about their availability to complete surveys. A more common complaint was how long respondents were expected to remain in sample and provide data – this was a bigger concern for all interviewees than any single survey task. Overall, the data requests do not seem to be difficult, but rather, are seen as a nuisance. By contrast, time in sample may be the most important source of perceived burden. VI. Conclusions The BLS has developed a corporate approach to measuring survey response that relies on standard definitions and formulas ensuring that rates can be compared across the various establishment surveys. It has also begun to implement this approach and is now computing some type of survey response rates for each survey on a regular basis. However, ensuring that all rates are in complete conformance with the corporate approach and are available at all levels of desired detail will take several more years to complete. The process of changing the disparate survey processing systems to collect all the needed data is complex and time consuming. However, BLS is optimistic that development of a BLS-wide system will enable them to compute and compare response rates across surveys in the not too distant future, so that trends in the rates across all surveys can be examined. In order to develop a corporate strategy to improve response rates, the BLS has adopted a proposal for computing disaggregated response rates across all programs. This effort should enable BLS to compare similar respondents and nonrespondents to identify BLS-wide response problem areas. Where appropriate, the hope is to begin computing disaggregated response rates by collection area/region, size of sample unit, industry classification, and survey mode (i.e. mail, fax, telephone, internet, etc.). Most surveys are collecting the data necessary to compute these disaggregated rates. Plans have been proposed to collect some additional company demographics that would also help explain survey response above what is currently collected. BLS's priorities for reducing nonresponse include increasing BLS visibility with respondents, accelerating the introduction of additional data reporting options (including Internet reporting), evaluating existing contact and initiation strategies, producing more relevant and timely BLS publications, and bringing users and providers together. Other areas for future BLS research include ways to reduce burden, ways to enhance utility of BLS data for respondents, ways to increase BLS visibility, ways to improve contact and initiation strategies, and ways to improve the cost-effectiveness of data collection procedures (including methods of non-response followup).
46
Currently the Census Bureau widely uses two standard definitions of response rates for their establishment surveys that have migrated to StEPS. The actual definition of components that define the rates can vary from survey to survey, depending on the intended use of the rate. Rates are typically obtained from the StEPS processing system, which has increased standardization in the way response rates are calculated. The Census Bureau is currently reviewing whether these definitions should continue to serve as the Census Bureau standard for establishment surveys. The philosophy of the Census Bureau’s economic area is that issues related to response/nonresponse can and should be addressed through reducing respondent burden, providing better customer service, and adopting a “company-centric” point of view which recognizes all aspects of company reporting burden, resources, and organization during interactions with a company and during survey design to leverage Census Bureau and company resources and maximize each company’s ability to respond. The agenda for continued research and development reflects these priorities. VII. Questions 1. Unweighted response rates measure the response process, whereas weighted
response rates measure the quality of published estimates. What type of response rates are of interest to data users? To survey practitioners in other organizations? To survey researchers?
2. Should the calculation of response rates be tailored to how calculated response
rates will be used – possibly resulting in different variations of a calculated response rate – or should just a few different types of response rates be calculated, e.g., weighted and unweighted?
3. Should surveys standardize what is considered a useable report? How should
partial reports be categorized with respect to calculating unweighted response rates?
4. Which sample designs are best for achieving high response rates for production of
cross-sectional data? Which sample designs are best for acceptable participation levels for long-term panel studies? Which sample designs are best for providing high quality data for both cross-sectional data and panel data?
5. Where should we focus our response research efforts? 6. What additional methods of response encouragement should we consider? References: Ahmed, S., and Tasky, D., (1999), “The Standard Economic Processing System: A
Generalized Integrated System for Survey Processing.” Proceedings of the Section on Government Statistics and Section on Social Statistics, American Statistical Association, pp. 205-210.
47
Ahmed, S., and Tasky, D., (2000), “Standardized Economic Processing System,” Proceedings of the International Conference on Establishment Surveys, American Statistical Association, pp. 633-642.
Ahmed, S., and Tasky, D., (2001), “Are Generalized Processing Systems the Way of the
Future: A Case Study on the Standard Economic Processing System (StEPS),” Proceedings of the Survey Research Methods Section, American Statistical Association.
Atrostic, B. K., Bates, N., Burt, G., Silberstein, A., and Winters, F., (1999),
“Nonresponse in U.S. Government Household Surveys: Consistent Measures and New Insights,” Presented at the International Conference on Survey Nonresponse, Portland, Oregon.
Bureau of Labor Statistics (1985), "Interim Report of Data Collection Task Force," Internal Report. Bureau of Labor Statistics (2003), "Response Rate Status Report - An Update," Internal Report. Cantwell, P., and Black, J., (1998), “Redesigning the Monthly Surveys of Retail and
Wholesale Trade for the Year 2000,” Proceedings of the Survey Research Methods Section, American Statistical Association, pp. 481-486.
Cantwell, P., and Caldwell, C., (1998). “Examining the Revisions in Monthly Retail and
Wholesale Trade Surveys Under a Rotating Panel Design,” Journal of Official Statistics, 14, No. 1, pp. 47-59.
Christianson, A., and Tortora, R. D., (1995), “Issues in Surveying Businesses: An
International Survey,” Chapter 14 in Business Survey Methods, edited by Cox, B. G., Binder, D. A., Chinnappa, B. N., Christianson, A., Colledge, M. J., and Kott, P. S., New York: John Wiley and Sons.
Dillman, D. A., (1978), “Mail and Telephone Surveys: The Total Design Method,” New
York: John Wiley and Sons. Dodds, J., (2001), “Response to the 1999 Annual Survey of Manufactures: Computer
Network Use Supplement,” unpublished report, Washington DC: U.S. Census Bureau.
Edwards, W. S., and Cantor, D., (1991), “Toward a Response Model in Establishment
Surveys,” Chapter 12 in Measurement Errors in Surveys, edited by Biemer, P. B., Groves, R. M., Lyberg, L. E., Mathiowetz, N. A., and Sudman, S., New York: John Wiley and Sons.
Ferguson, G. R., Cohen, S. H., and Rosen, R. J., (2003), “Survey Response Measurement
at the Bureau of Labor Statistics,” Proceedings of the Section on Survey Methods Research, American Statistical Association.
48
Fisher, S., Bosley, J., Goldenberg, K., Mockovak, W., and Tucker, C., (2003), “A Qualitative Study of Nonresponse Factors Affecting BLS Establishment Surveys: Results,” Presented at The 163rd Annual Joint Statistical Meetings.
Fox, J. E., Fisher, S. K., Tucker, N. C., Sangster, R. L., and Rho, C., (2003), “A
Qualitative Approach to the Study of BLS Establishment Survey Nonresponse,” Presented at The 163rd Annual Joint Statistical Meetings.
Giles, P., and Patrick, C., (1986), “Imputation Options in a Generalized Edit and
Imputation System,” Survey Methodology, v. 12, pp. 49-60. Groves, R., and McGonagle, K. A., (2001), “A Theory-Guided Interviewer Training
Protocol Regarding Survey Participation,” Journal of Official Statistics, v. 17(2), 249-265.
Hak, T., Anderson, A.E., and Willimack, D.K., (2003), “Determinants of Web
Reporting: A Qualitative Study of Mode Selection,” Proceedings of the Federal Committee on Statistical Methodology Research, Washington, D.C.: Office of Management and Budget.
Hidiroglou, M. A., Drew, J. D., and Gray, G. B., (1993), “A Framework for Measuring
and Reducing Nonresponse in Surveys.” Survey Methodology, v. 19(1):81-94. Interagency Group on Establishment Nonresponse (1998), “Establishment Nonresponse:
Revisiting the Issues and Looking to the Future,” Presented at the 1998 Council of Professional Associations on Federal Statistics Conference.
James, J. M., and Bolstein, R., (1992), “Large Monetary Incentives and Their Effect on
Mail Survey Response Rates,” Public Opinion Quarterly, 56:442-453. Jobber, D., (1986), “Improving Response Rates in Industrial Mail Surveys,” Industrial
Marketing Management, 15:183-195. Kinyon, D., Glassbrenner, D., Black, J., Detlefsen, R., (2000), “Designing Business
Samples Used for Surveys Conducted by the United States Bureau of the Census,” Proceedings of the Second International Conference on Establishment Surveys, American Statistical Association, pp. 1325-1330.
Kovar, J. G., and Whitridge, P. J., (1995), “Imputation of Business Survey Data,”
Chapter 22 in Business Survey Methods, edited by Cox, B. G., Binder, D. A., Chinnappa, B. N., Christianson, A., Colledge, M. J., and Kott, P. S., New York: John Wiley and Sons.
Marske, R., (2004a), E-mail communication to R. Petroni, U.S. Census Bureau, April 14,
2004. Marske, R., (2004b), E-mail communication to R. Petroni, U.S. Census Bureau, April 15,
2004.
49
Monsour, N., (1998), untitled unpublished summary of response/nonresponse in censuses and surveys conducted by the Economic Programs Directorate of the U.S. Census Bureau, presented to the Interagency Group on Establishment Nonresponse, Washington, D.C.: U. S. Bureau of the Census.
Nichols, E., and Willimack, D. K., (2001), “Balancing Confidentiality and Burden
Concerns in Censuses and Surveys of Large Businesses,” Presented at the 2001 Federal Committee on Statistical Methodology Research Conference, November, 2001, Arlington, VA.
Ohlsson, E., (1995), “Coordination of Samples Using Permanent Random Numbers,”
Chapter 9 in Business Survey Methods, edited by Cox, B. G., Binder, D. A., Chinnappa, B. N., Christianson, A., Colledge, M. J., and Kott, P. S., New York: John Wiley and Sons.
Osmint, J. B., McMahon, P. B., and Martin, A. W., (1994), “Response in Federally
Sponsored Establishment Surveys.” Proceedings of the Section on Survey Research Methods, Vol. II, American Statistical Association, pp. 977-982.
Paxson, M. C., Dillman, D. A., and Tarnai, J., (1995), “Improving Response to Business
Mail Surveys,” Chapter 17 in Business Survey Methods, edited by Cox, B. G., Binder, D. A., Chinnappa, B. N., Christianson, A., Colledge, M. J., and Kott, P. S., New York: John Wiley and Sons.
Ramirez, C., Fisher, S., McCarthy, J. S., Shimizu, I., (2000), “Examining
Standardization of Response Rate Measures in Establishment Surveys,” Presented at the 2000 Council of Professional Associations on Federal Statistics Conference.
Shimizu, I., (2000), “Response in Federal Establishment Surveys,” Presented at the
International Conference on Establishment Surveys - II. Sigman, R., (2004), “Recommendations of the Flag Practices Team,” unpublished
document, Washington, D. C.: U. S. Census Bureau, Hummingbird Document #1313, August 11, 2004.
Sigman, R., and Wagner, D., (1997), “Algorithms for Adjusting Survey Data that Fail
Balance Edits,” Proceedings of the Survey Research Methods Section, American Statistical Association, pp. 576-581.
Smith, T. W., (1995), “Trends in Non-response Rates,” International Journal of Public
Opinion Research, 57(7): 157-171. Srinath, K. P., and Carpenter, R. M., (1995), “Sampling Methods for Repeated Business
Surveys,” Chapter 10 in Business Survey Methods, edited by Cox, B. G., Binder, D. A., Chinnappa, B. N., Christianson, A., Colledge, M. J., and Kott, P. S., New York: John Wiley and Sons.
50
Sudman, S., Willimack, D.K., Nichols, E., and Mesenbourg, T.L.Jr., (2000), “Exploratory Research at the U.S. Census Bureau on the Survey Response Process in Large Companies,” ICES II, Proceedings of the Second International Conference on Establishment Surveys, American Statistical Association, pp.327-337.
Tomaskovic-Devey, D., Leiter, J., and Thompson, S., (1994), “Organizational Survey
Nonresponse,” Administrative Science Quarterly, 39, 439-457. U.S. Bureau of the Census (1997), “Survey of Nonrespondents in the 1994 Survey of
Industrial Research and Development,” unpublished report prepared for the National Science Foundation by the Manufacturing and Construction Division, Washington, D.C.: U.S. Bureau of the Census.
Waite, C. A., (1993), “Standard Definitions,” Unpublished Memorandum, Office of the
Director, U.S. Census Bureau, Washington D.C., January 29, 1993. Walker, B. J., Kirchmann, W., and Conant, J. S., (1987), “A Method to Improve
Response to Industrial Mail Surveys,” Industrial Marketing Management, 16: 305-314.
Ware-Martin, A., Adler, R.K., and Leach, N.L., (2000), “Assessing the Impact of the
Redesign of the Manufacturing Energy Consumption Survey,” Proceedings of the Second International Conference on Establishment Surveys, American Statistical Association, pp. 1488-1492.
Werking, G. S., and Clayton R. L., (1995), “Automated Telephone Methods for Business
Surveys,” Chapter 18 in Business Survey Methods, edited by Cox, B. G., Binder, D. A., Chinnappa, B. N., Christianson, A., Colledge, M. J., and Kott, P. S., New York: John Wiley and Sons.
Willimack, D.K., Nichols, E., and Sudman, S., (2002), “Understanding Unit and Item
Nonresponse in Business Surveys,” in Survey Nonresponse, Groves et al. (eds.) New York, NY: Wiley.
Worden, G., and Hamilton, H. H., (1989), "The Use of Mandatory Reporting Authority to
Improve the Quality of Statistics," Working Papers of Industrial and Construction Statistics, Washington, DC: Bureau of the Census.