Embed Size (px)
Citation preview

Nonresponse in Sample Surveys
Professor Ron FrickerNaval Postgraduate School
Monterey, California
1
Goals for this Lecture
• Define nonresponse– Unit nonresponse and item nonresponse– Ignorable vs. nonignorable
• Define nonresponse bias • Discuss explanatory theories of nonresponse
and strategies to minimize nonresponse bias• Define how to calculate response rates,
including complications • Discuss trends in nonresponse rates
2
Nonresponse: What’s the Big Deal?
• The issue is nonresponse bias– Nonrespondents have systematically different
view/answers to the survey than respondents • Response rates often used as a measure of
the likelihood of nonresponse bias– But low response rates do not necessarily mean
there is nonresponse bias– Conversely, high response rates do indicate smaller
chance of nonresponse bias• Really a function of both proportion of
nonrespondents and difference between the statistics of respondents and nonrespondents
3

Terminology
• Item nonresponse: Respondent refuses to answer one or more survey questions– Interviewer: “What was your total family income
last year?”– Response: “I don’t know, my spouse keeps those
records.”• Unit nonresponse: Respondent refuses to
take the survey at all– Sampled person: “I don’t take surveys – please do
not contact me again.”
4
Type of Unit Nonresponse
• Unit: The element of analysis– E.g., household, person
• Types of nonresponse– Failure to deliver the survey request
• I.e., failure to locate the sampled unit– Refusal to participate
• I.e., person contacted declines the survey– Inability to participate
• I.e., respondent does not speak the language the instrument is written/given in
5
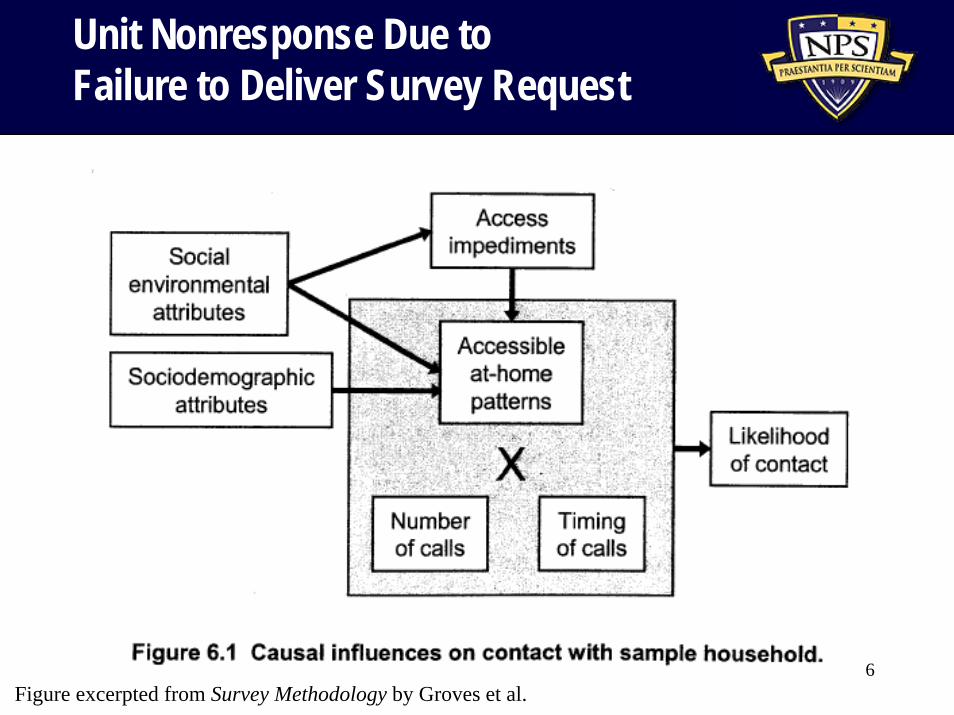
Unit Nonresponse Due to Failure to Deliver Survey Request
6Figure excerpted from Survey Methodology by Groves et al.
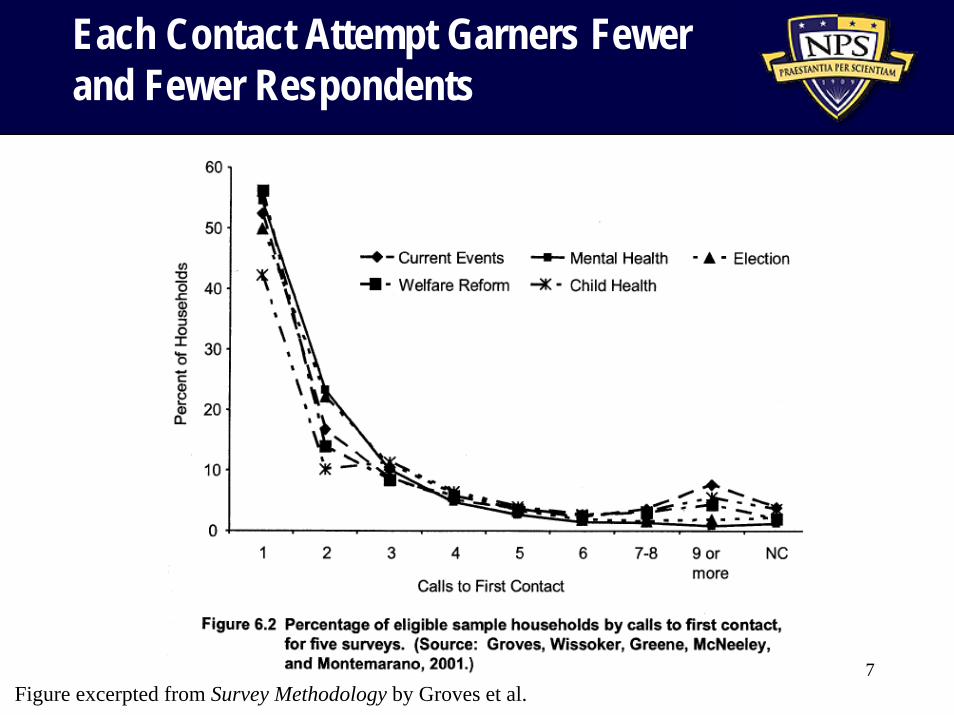
Each Contact Attempt Garners Fewer and Fewer Respondents
7Figure excerpted from Survey Methodology by Groves et al.
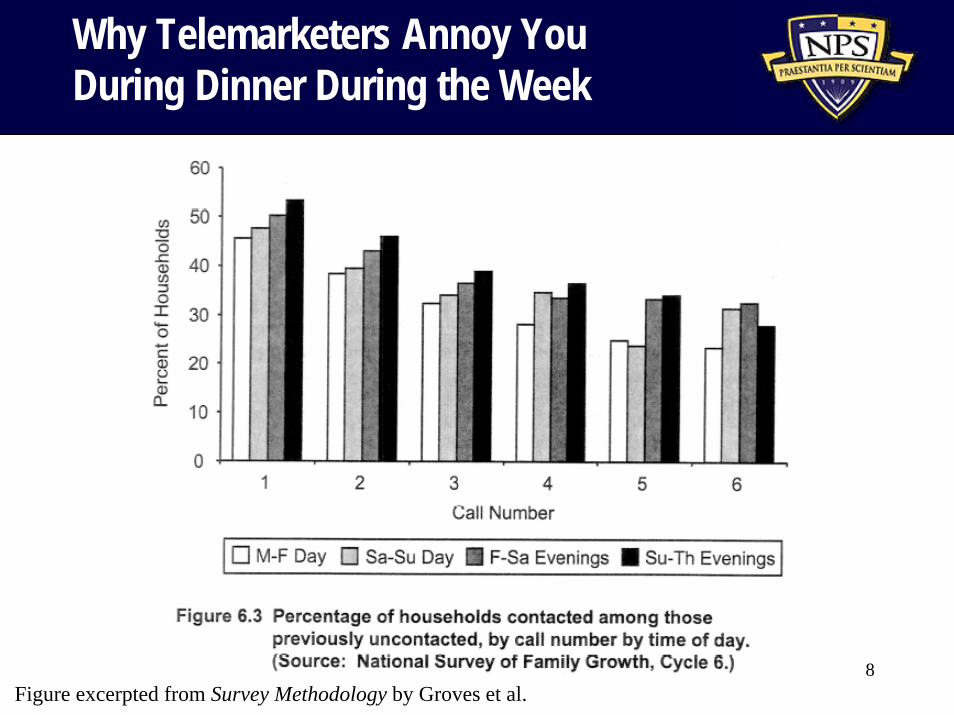
Why Telemarketers Annoy You During Dinner During the Week
Figure excerpted from Survey Methodology by Groves et al.8
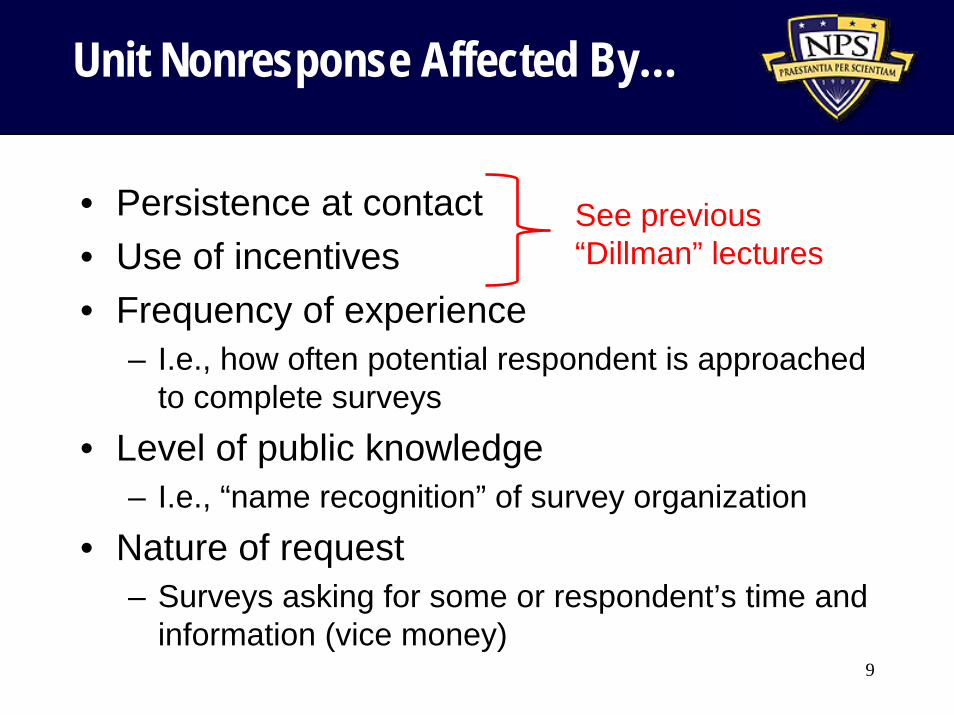
Unit Nonresponse Affected By…
• Persistence at contact• Use of incentives• Frequency of experience
– I.e., how often potential respondent is approached to complete surveys
• Level of public knowledge– I.e., “name recognition” of survey organization
• Nature of request– Surveys asking for some or respondent’s time and
information (vice money)
See previous “Dillman” lectures
9
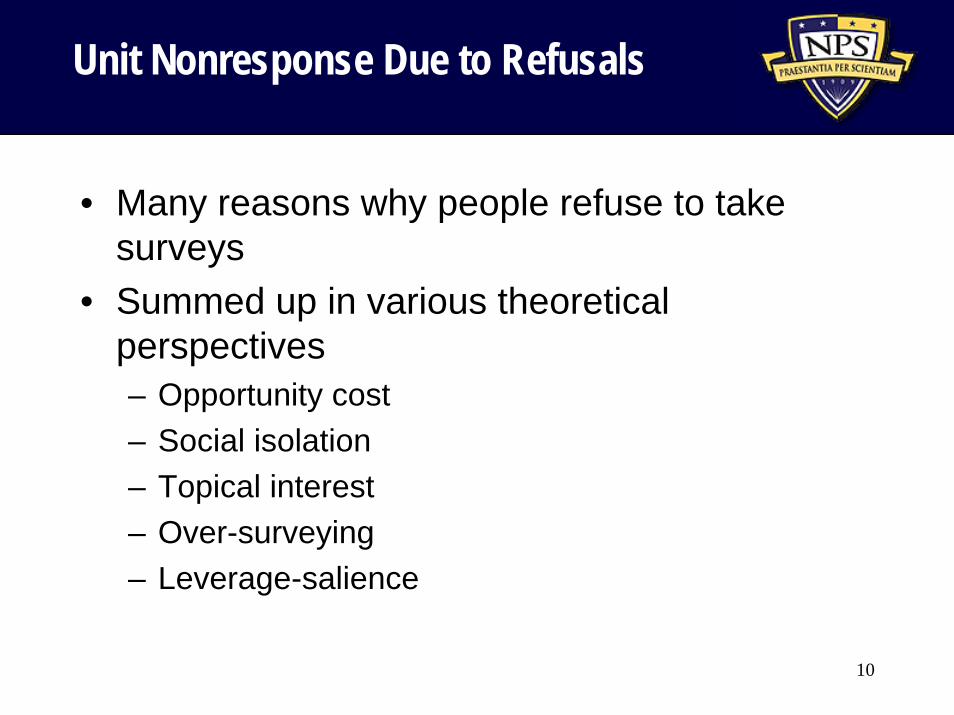
Unit Nonresponse Due to Refusals
• Many reasons why people refuse to take surveys
• Summed up in various theoretical perspectives– Opportunity cost– Social isolation– Topical interest– Over-surveying– Leverage-salience
10
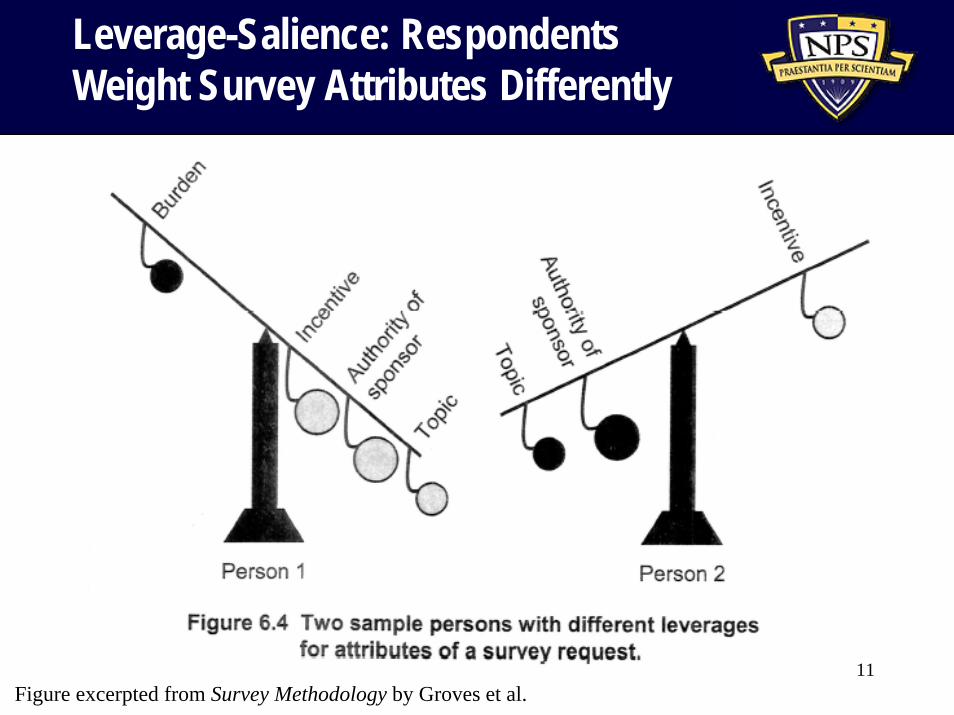
Leverage-Salience: Respondents Weight Survey Attributes Differently
11Figure excerpted from Survey Methodology by Groves et al.
Unit Nonresponse Due to Inability to Provide Requested Data
• Able to contact a potential respondent, but they cannot provide the data– E.g., language barrier
• As long as these effects are random, little to worry about
• But if systematically related to survey topic(s), potential response bias– E.g., A survey on immigration reform given only in
English
12

How Does Nonresponse Affect the Quality of Survey Statistics?
13Figure excerpted from Survey Methodology by Groves et al.
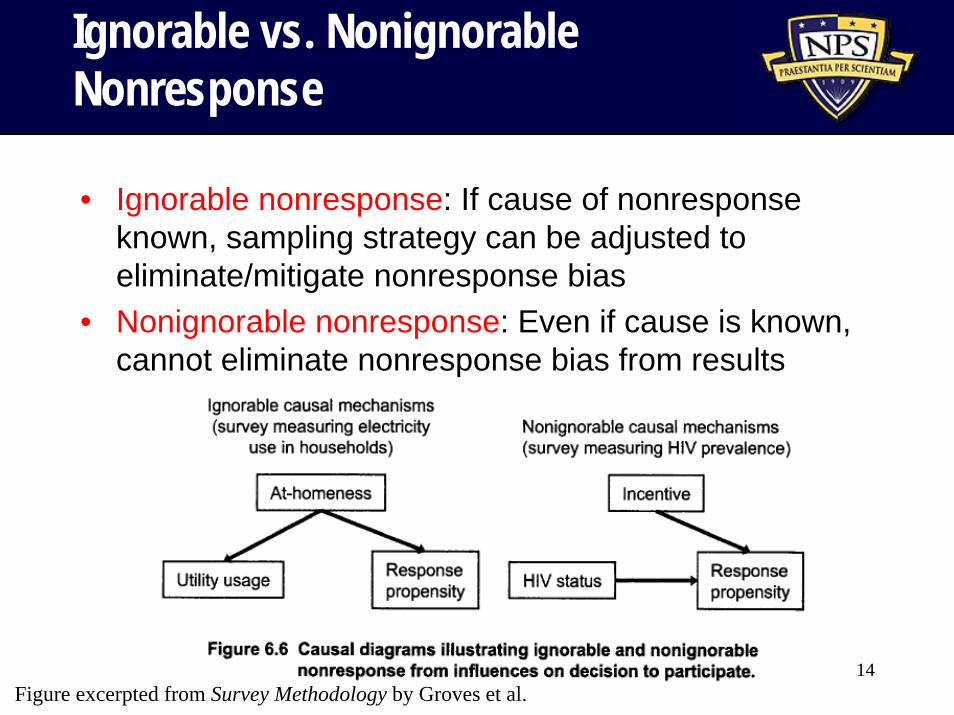
Ignorable vs. NonignorableNonresponse
• Ignorable nonresponse: If cause of nonresponseknown, sampling strategy can be adjusted to eliminate/mitigate nonresponse bias
• Nonignorable nonresponse: Even if cause is known, cannot eliminate nonresponse bias from results
14Figure excerpted from Survey Methodology by Groves et al.
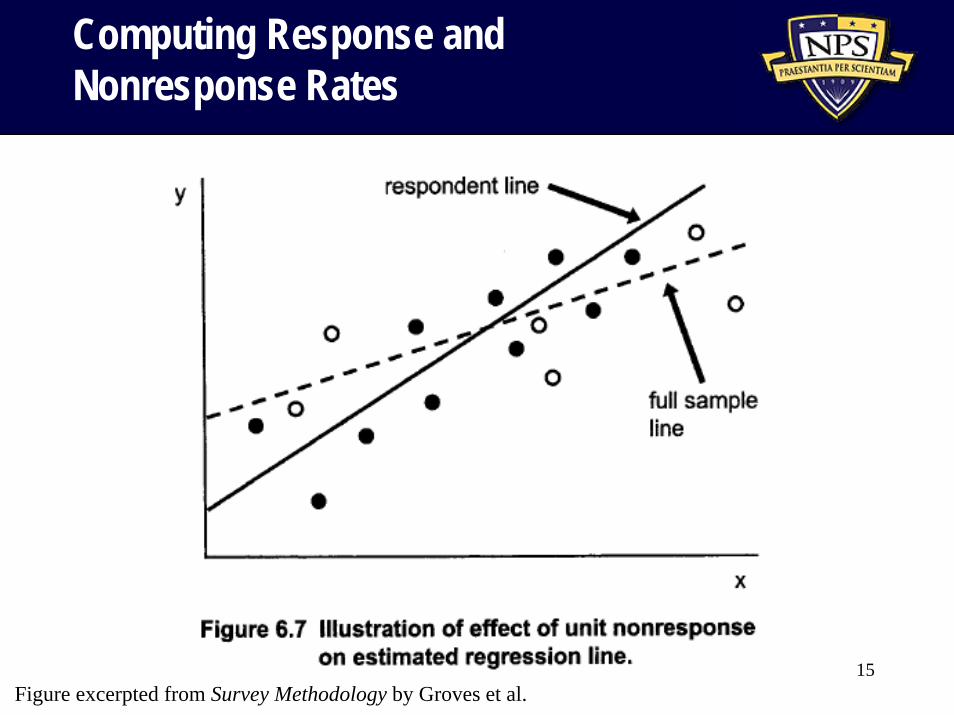
Computing Response and Nonresponse Rates
15Figure excerpted from Survey Methodology by Groves et al.
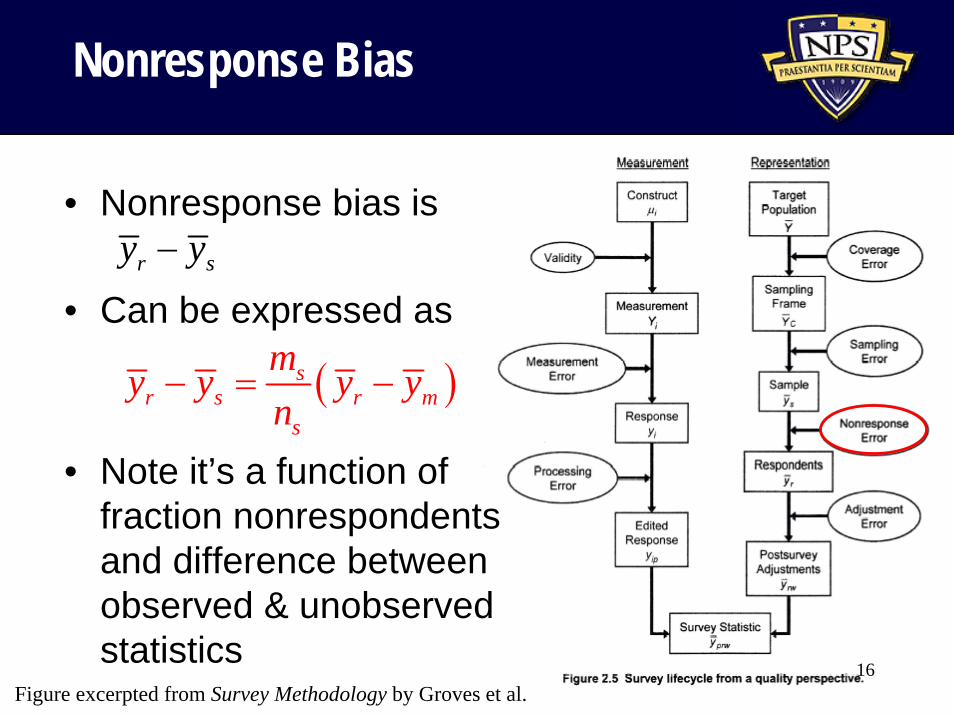
Nonresponse Bias
• Nonresponse bias is
• Can be expressed as
• Note it’s a function of fraction nonrespondentsand difference between observed & unobserved statistics
16
r sy y−
( )sr s r m
s
my y y yn
− = −
Figure excerpted from Survey Methodology by Groves et al.
Possible Response Rate Calculation Complications
• When must screen frame members to determine sample eligibility– Hard then to determine denominator for response
rate calculation• When sample frame consists of clustered
elements and full cluster nonrespondent– Unclear how many sample elements were really
nonrespondent• When using unequal sampling probabilities
– Unclear whether to use weights in response rate calculation 17
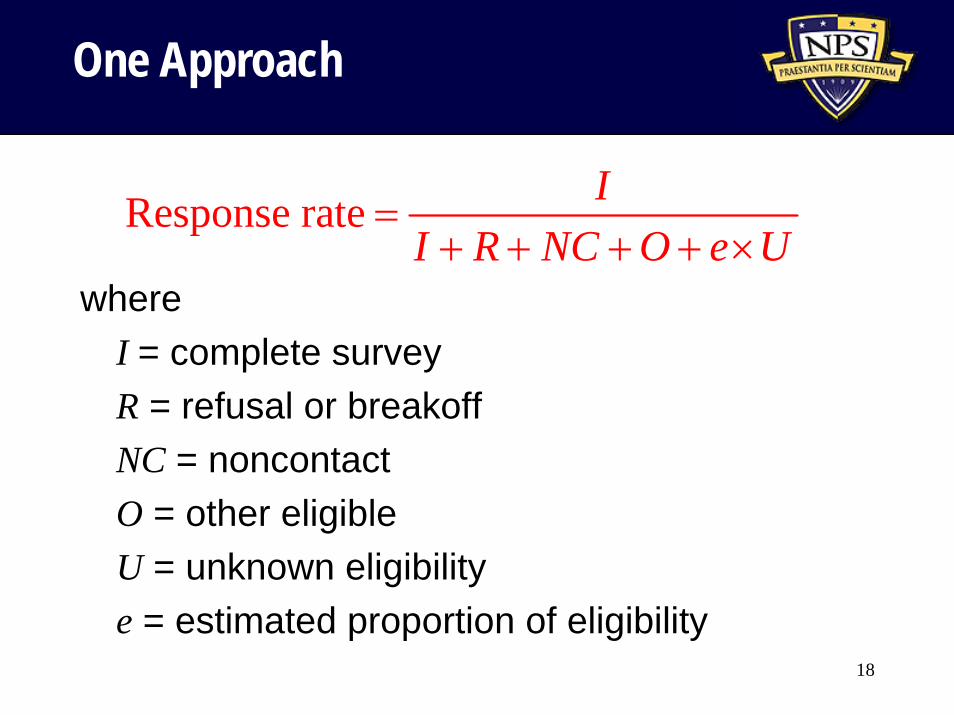
One Approach
Response rate II R NC O e U
=+ + + + ×
where I = complete surveyR = refusal or breakoffNC = noncontactO = other eligibleU = unknown eligibilitye = estimated proportion of eligibility
18
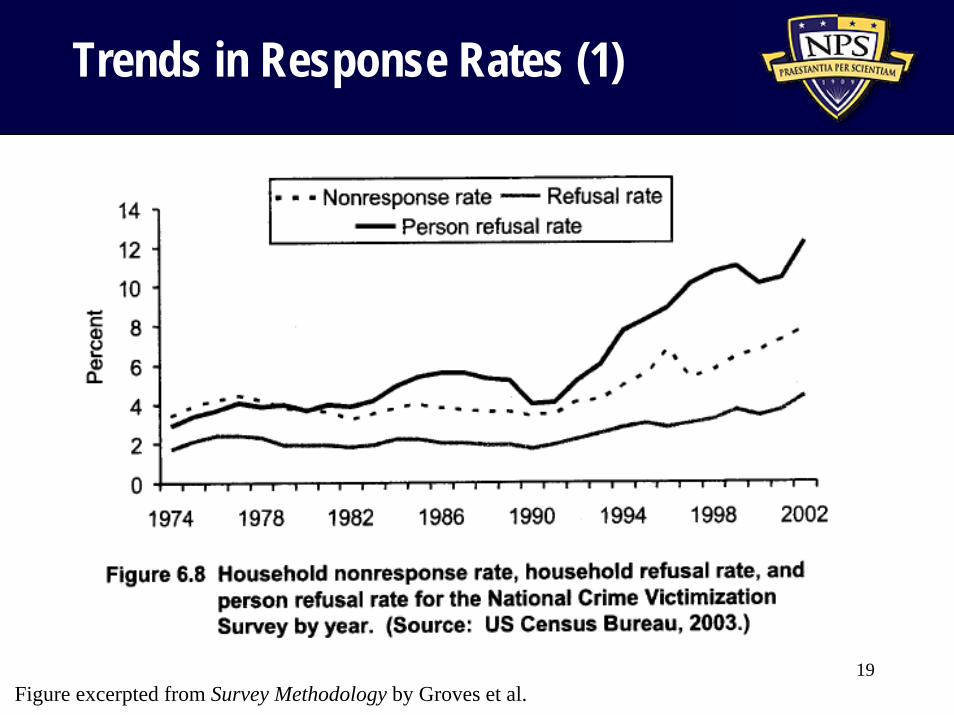
Trends in Response Rates (1)
19Figure excerpted from Survey Methodology by Groves et al.
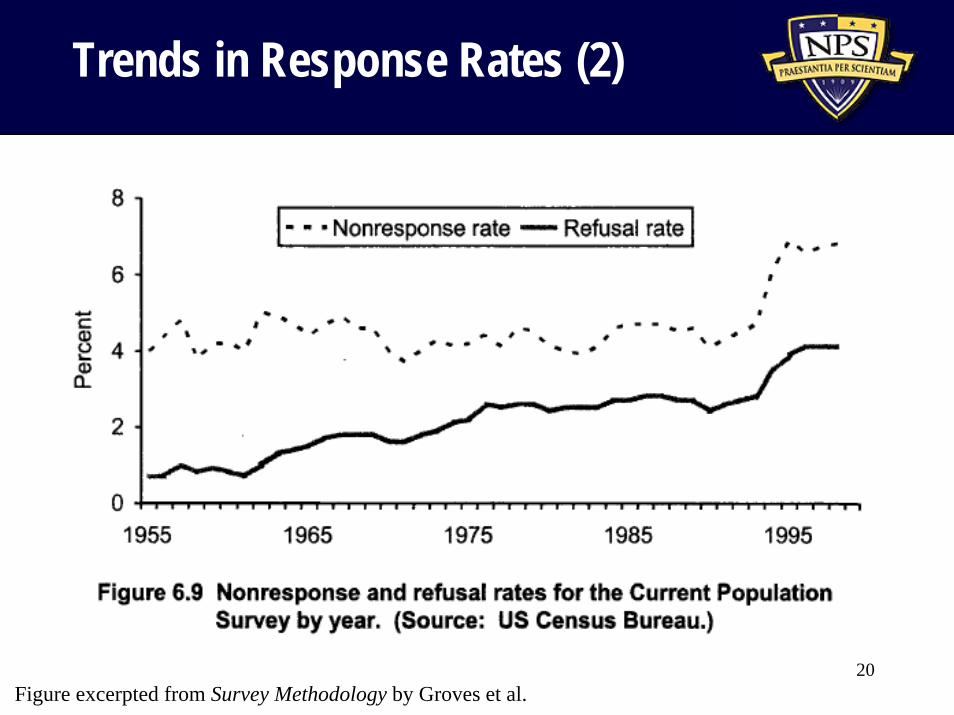
Trends in Response Rates (2)
20Figure excerpted from Survey Methodology by Groves et al.
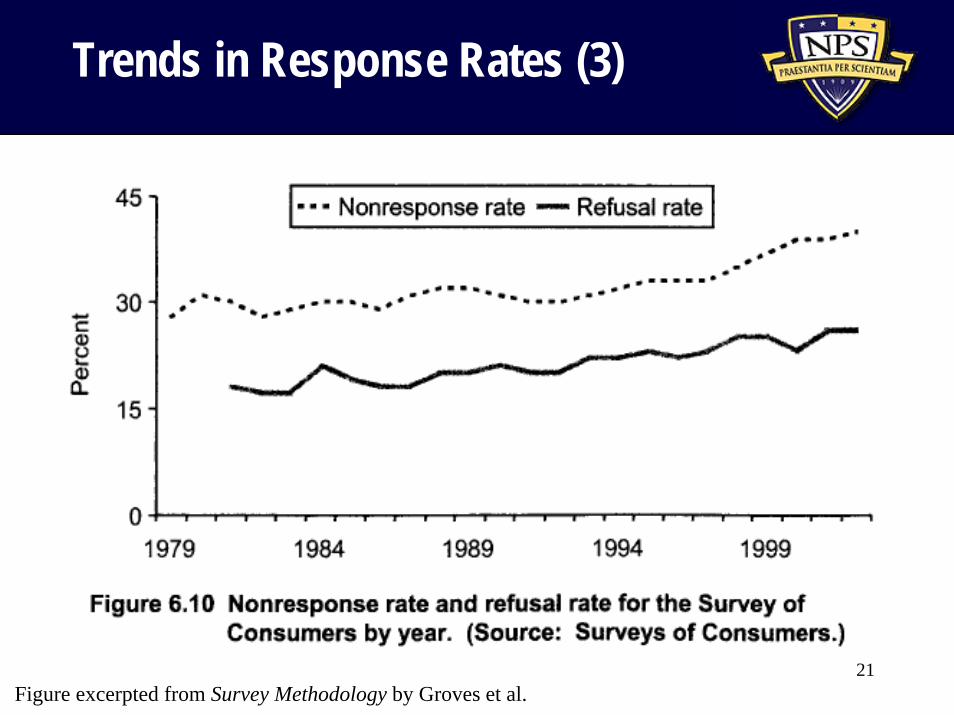
Trends in Response Rates (3)
21Figure excerpted from Survey Methodology by Groves et al.
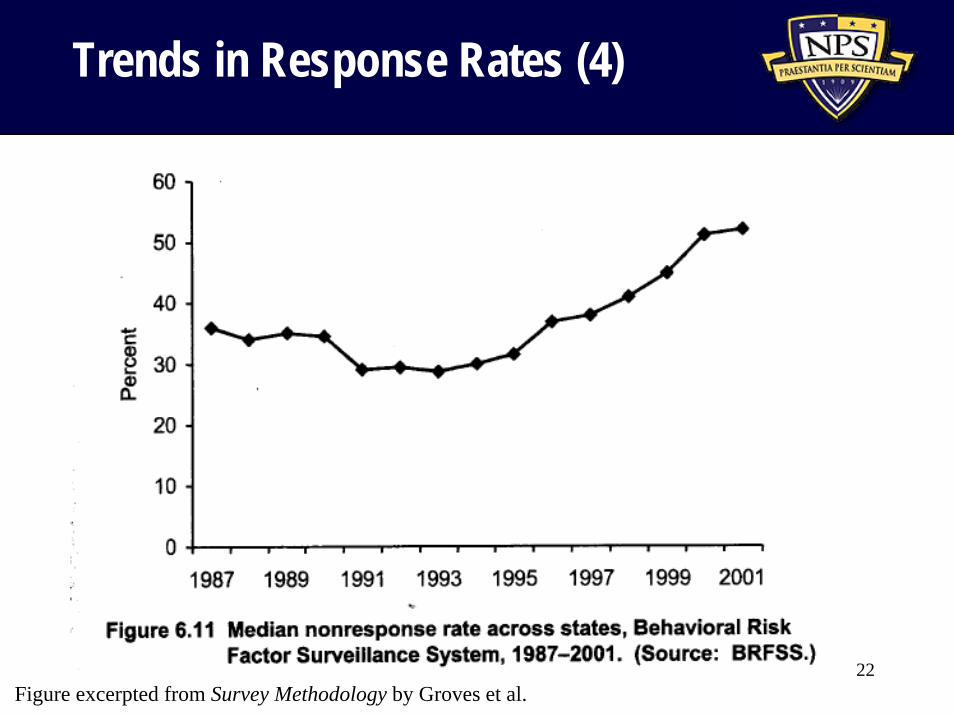
Trends in Response Rates (4)
22Figure excerpted from Survey Methodology by Groves et al.
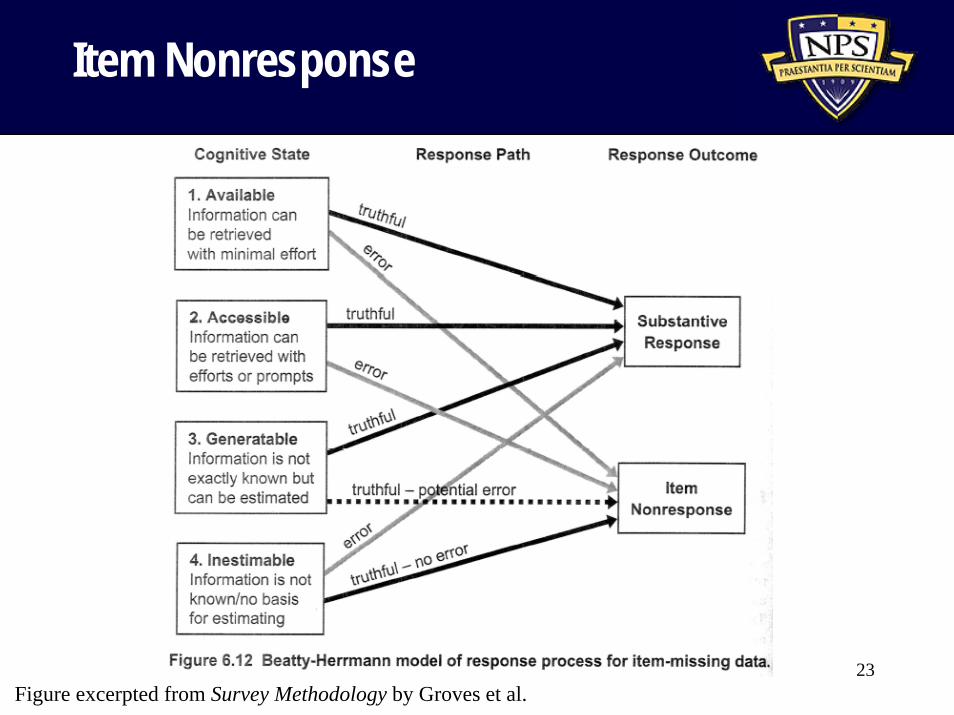
Item Nonresponse
23Figure excerpted from Survey Methodology by Groves et al.
Design Features to Reduce Unit Nonresponse (1)
• In general, as in Dillman:– Number and timing of attempts– Prenotification– Incentives– Persuasion letters
• Also:– Data collection period– Mode switches– Survey burden– Respondent rules
24
Design Features to Reduce Unit Nonresponse (2)
• For interviewer-assisted surveys:– Interviewer workload– Interviewer observations– Interviewer introductory behavior– Interviewer/household matching– Interviewer switches
25
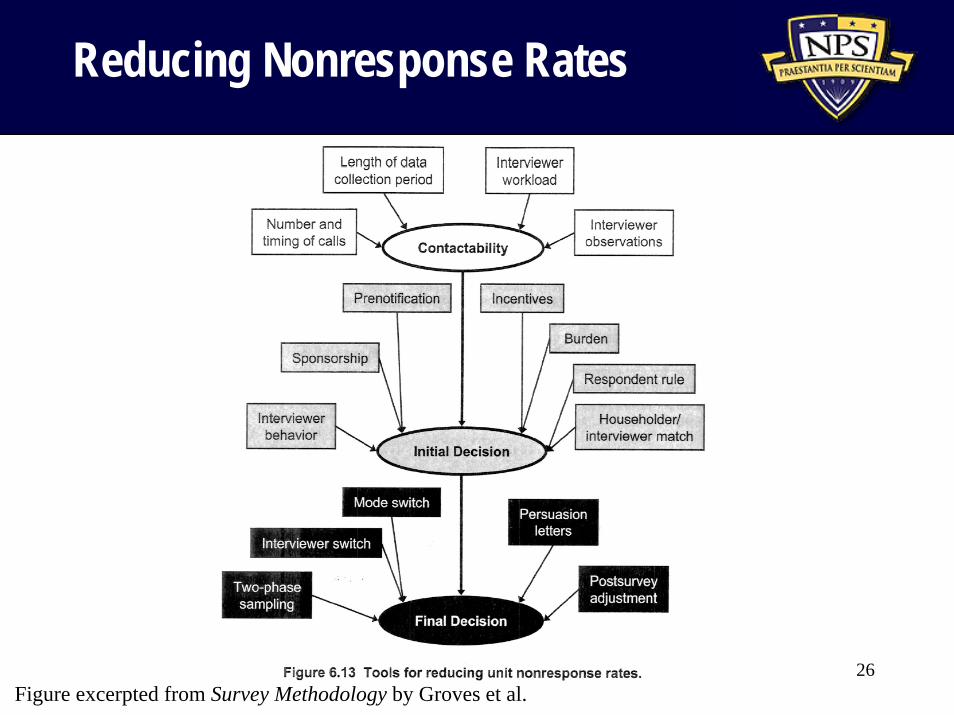
Reducing Nonresponse Rates
Figure excerpted from Survey Methodology by Groves et al.26
What We Have Covered
• Defined nonresponse– Unit nonresponse and item nonresponse– Ignorable vs. nonignorable
• Defined nonresponse bias • Discussed theories of nonresponse and
strategies to minimize nonresponse bias• Defined how to calculate response rates,
including complications • Discussed trends in nonresponse rates
27