Embed Size (px)
Citation preview
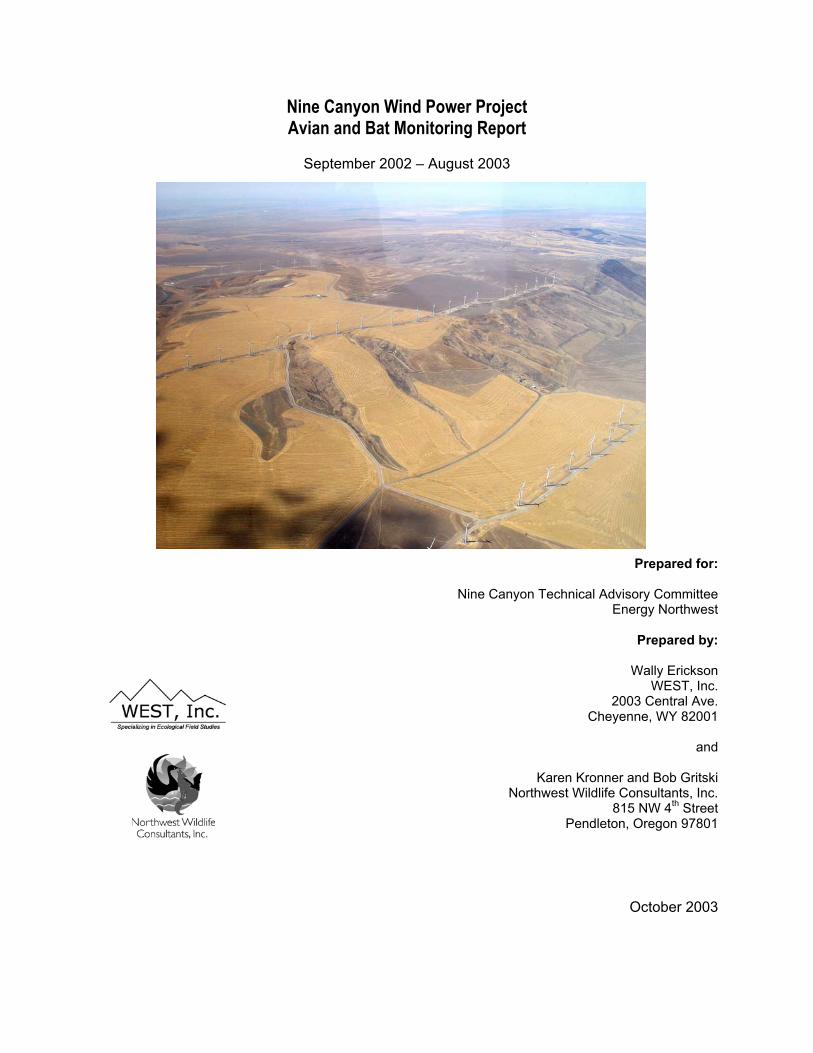
Nine Canyon Wind Power Project Avian and Bat Monitoring Report
September 2002 – August 2003
Prepared for:
Nine Canyon Technical Advisory Committee Energy Northwest
Prepared by:
Wally Erickson
WEST, Inc. 2003 Central Ave.
Cheyenne, WY 82001
and
Karen Kronner and Bob Gritski Northwest Wildlife Consultants, Inc.
815 NW 4th Street Pendleton, Oregon 97801
October 2003
Nine Canyon Avian and Bat Monitoring Report October 2003 i
Executive Summary
We conducted studies of bird and bat mortality at the Nine Canyon Wind Energy Project
located in Benton County, Washington. Fatality searches were conducted between September 2002
and August 2003, with a search conducted approximately every two weeks during spring, summer and
fall (March – October), and once a month during the winter (November – February). A total of 19
searches were conducted at each of the 37 Nine Canyon turbines and the one unguyed permanent
meteorological tower. Experimental trials were conducted to estimate searcher efficiency and carcass
removal (scavenging, etc.). Mean searcher efficiency was 44% for small-sized casualties and 78% for
large-sized casualties. These rates are very similar to those observed from on-going monitoring at the
Stateline Wind Power Project located approximately 12 miles southeast of Nine Canyon. Mean
carcass removal time, the average time it takes for a scavenger or other measure to remove a carcass,
was estimated to be approximately 11 days for small birds and 33 days for large-sized birds. The
carcass removal rates are higher at Nine Canyon than at Stateline. The observed number of fatalities
and the results of the experimental bias trials were used to estimate mortality. Thirty-six bird and 27
bat fatalities for which collision with turbines or vehicles could not be ruled out, were found within or
very near the search plots. Some of these may not have been killed by turbines or vehicles, but are
conservatively included. Horned larks comprised 47% of the fatalities, ring-necked pheasants
comprised 14% of the fatalities and western meadowlarks comprised 6% of the fatalities. No other
individual species was documented more than once. Two raptor fatalities (American kestrel and short-
eared owl) were discovered within the search plots. Estimated mortality was 3.59 bird and 3.21 bat
fatalities per turbine per year. Cause of fatalities could have been strikes with turbine towers or
blades, collision vehicles traveling along project roads or other non-project related causes. When
standardized to the area swept by rotors of the individual turbines, per turbine fatality estimates are
within the range observed at other wind projects in the west and mid-west. These results provide an
estimate of the mortality expected at the Nine Canyon Wind Power Project or at future wind
developments with similar characteristics.
Nine Canyon Avian and Bat Monitoring Report October 2003 ii
PARTICIPANTS Personnel Duties Western EcoSystems Technology Wallace Erickson Project Manager, TAC Coordinator and Statistician Kimberly Bay Data Technician Sean Morrison Field Technician Nancy LaFramboise Field Technician Nicholas Griffin Field Technician Northwest Wildlife Consultants Inc. Karen Kronner Project Biologist, Field Project Manager for NWC Bob Gritski Team Leader, Field Supervisor and Field Biologist Laurie Ness Assistant Team Leader and Field Biologist Jerry Baker Field Technician Julie Miller Field Technician Jane Holmes Field Technician Cindy Wood Field Technician Michele Talley Field Technician Lorie Emert Field Technician Riley Hall Field Technician Report Reference: Erickson, W.P., B. Gritski, and K. Kronner, 2003. Nine Canyon Wind Power Project Avian and Bat
Monitoring Report, September 2002 – August 2003. Technical report submitted to Energy Northwest and the Nine Canyon Technical Advisory Committee.
Nine Canyon Avian and Bat Monitoring Report October 2003 iii
TABLE OF CONTENTS
INTRODUCTION ...................................................................................................................................... 1 STUDY AREA AND PROJECT DESCRIPTION................................................................................... 1 FIELD METHODS..................................................................................................................................... 2
Standardized Carcass Searches ................................................................................................................. 2 Energy Northwest’s Wildlife Reporting and Handling System for Incidental Fatality and Injured Bird Discoveries ....................................................................................................................................... 3 Experimental Searcher Efficiency Trials .................................................................................................. 3 Experimental Carcass Removal Trials...................................................................................................... 4 Raptor Nest Monitoring ............................................................................................................................ 5
STATISTICAL METHODS ...................................................................................................................... 5
Observed Number of Carcasses ................................................................................................................ 5 Estimation of Searcher Efficiency Rates .................................................................................................. 5 Estimation of Carcass Removal Rates ...................................................................................................... 5 Estimation of Facility-Related Fatality Rates ........................................................................................... 6 Statistical Comparisons of Observed Mortality ........................................................................................ 6
RESULTS .................................................................................................................................................... 7
Bird Casualties.......................................................................................................................................... 7 Bat Casualties ........................................................................................................................................... 8 Experimental Searcher Efficiency Bias Trials .......................................................................................... 8 Experimental Carcass Removal Bias Trials.............................................................................................. 8 Fatality Estimates...................................................................................................................................... 8 Small Birds .............................................................................................................................................. 8 Large Birds .............................................................................................................................................. 9 All Birds.. ................................................................................................................................................ 9 Raptors..................................................................................................................................................... 9 Bats......... ................................................................................................................................................. 9
Raptor Nest Monitoring ............................................................................................................................ 9 SUMMARY/DISCUSSION........................................................................................................................ 10 ACKNOWLEDGEMENTS ....................................................................................................................... 12 REFERENCES ........................................................................................................................................... 12 APPENDIX A.............................................................................................................................................. 31
Nine Canyon Avian and Bat Monitoring Report October 2003 iv
LIST OF TABLES AND FIGURES Table 1. Bird fatalities found within carcass search plots at the Nine Canyon Wind Project for the
one-year monitoring period........................................................................................................... 14 Table 2. Distribution of observed bird and bat fatalities among turbines.................................................... 15 Table 3. Bat fatalities found within carcass search plots at the Nine Canyon Wind Project for the one
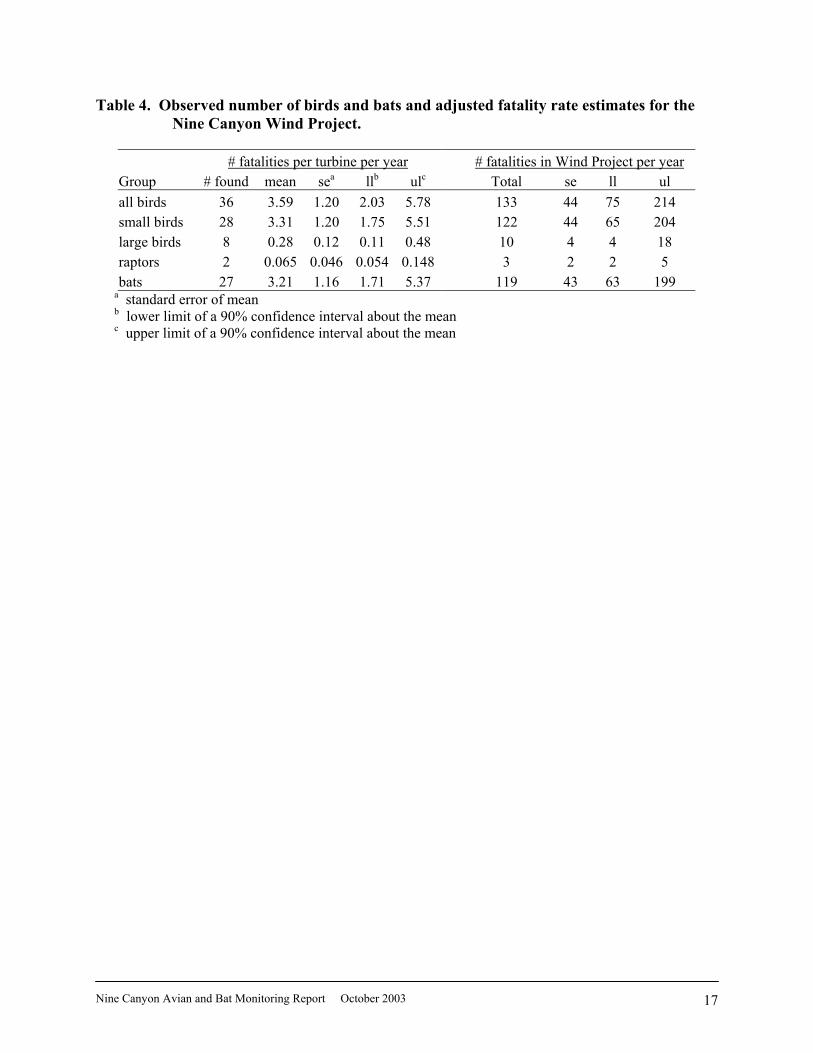
year monitoring period.................................................................................................................. 16 Table 4. Observed number of birds and bats and adjusted fatality rate estimates for the Nine Canyon
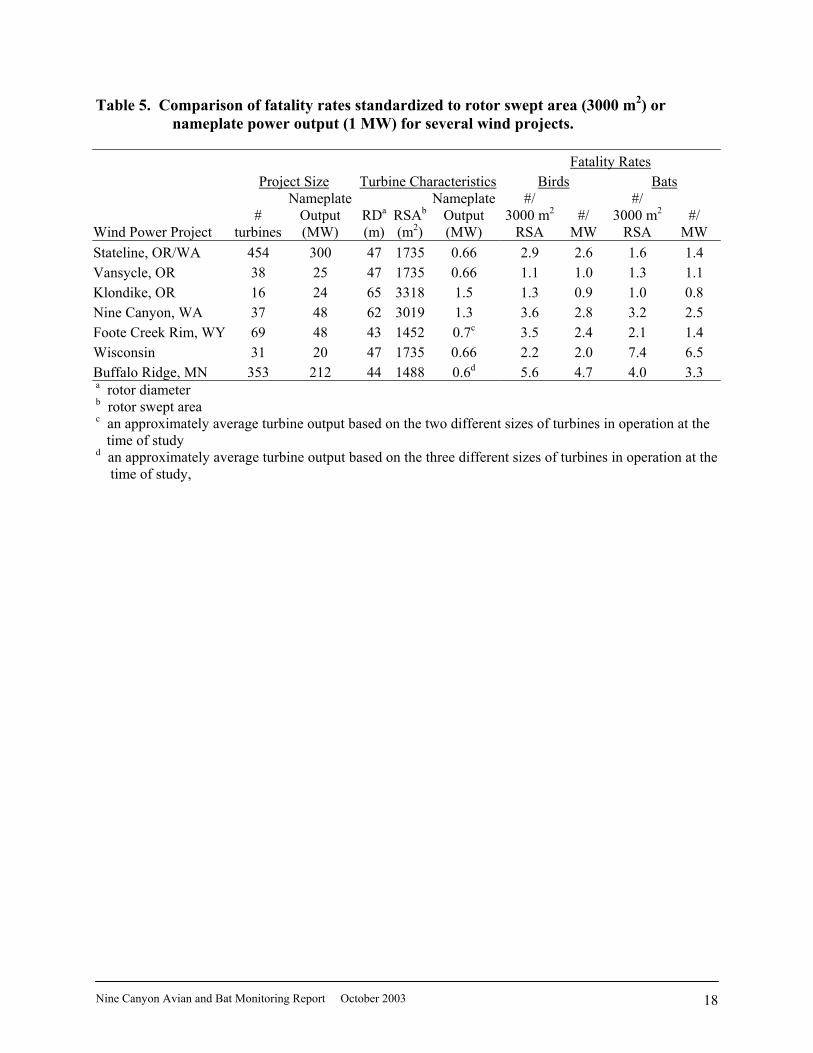
Wind Project. ................................................................................................................................ 17 Table 5. Comparison of fatality rates standardized to rotor swept area (3000 m2) or nameplate power
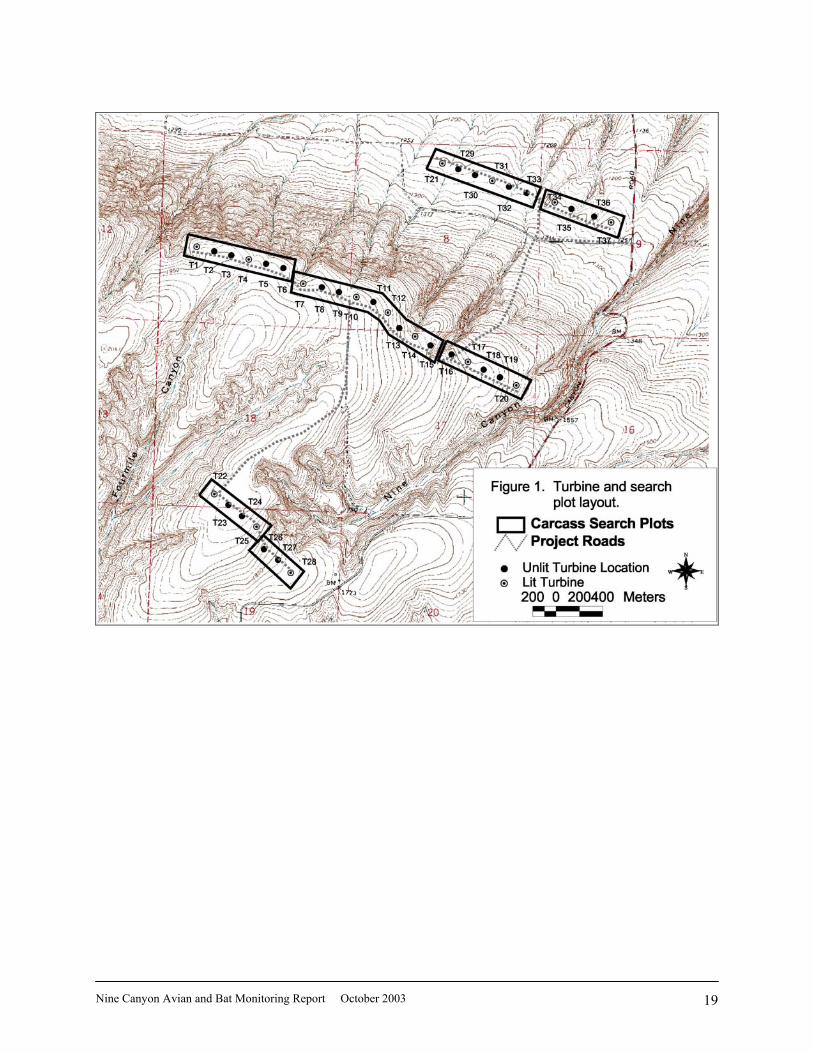
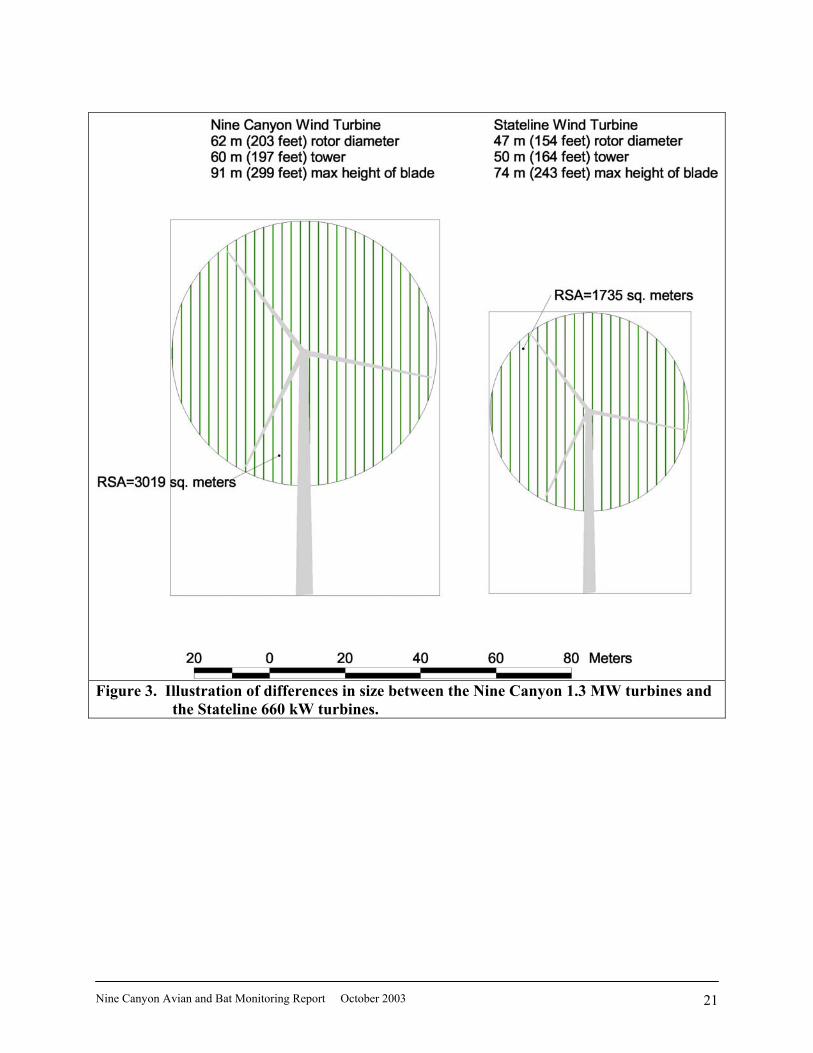
output (1 MW) for several wind projects. ..................................................................................... 18 Figure 1. Turbine and search plot layout. .................................................................................................... 19 Figure 2. Aerial photograph of the Nine Canyon Wind Project. ................................................................. 20 Figure 3. Illustration of differences in size between the Nine Canyon 1.3 MW turbines and the
Stateline 660 kW turbines. ............................................................................................................ 21 Figure 4. Lattice unguyed meteorological tower at the Nine Canyon Wind Project. .................................. 22 Figure 5. Distribution of fatalities. .............................................................................................................. 23 Figure 6. Number of fatalities by species. ................................................................................................... 24 Figure 7. Timing of bird and bat mortality (September 2002 – August 2003)........................................... 25 Figure 8. Carcass removal rates by size class of trial carcasses................................................................... 26 Figure 9. Distribution of distances (m) fatalities were observed from turbines........................................... 27 Figure 10. Observed fatality rates and 95% confidence intervals for all birds and bats at end row and
mid-row turbines. .......................................................................................................................... 28 Figure 11. Observed fatality rates and 95% confidence intervals for all birds and bats at strings A, B
and C. ............................................................................................................................................ 29 Figure 12. Observed fatality rates and 95% confidence intervals for all birds and bats at lit (Y) and
unlit (N) turbines. .......................................................................................................................... 30
Nine Canyon Avian and Bat Monitoring Report October 2003 1
INTRODUCTION The Nine Canyon Wind Project (referred to as the “Project”) developed by Energy Northwest
consists of 37 1.3-MW Bonus turbines on privately owned land in Benton County, Washington (Figure
1). The conditional use permit for the project, granted by the county on June 7, 2001, required, among
other items, the development and implementation of an avian and bat monitoring program (“the
Monitoring Plan”) for the operations phase. The monitoring program follows the protocol document
"Avian and Bat Monitoring Plan for the Nine Canyon Wind Project". Operational monitoring for the
Nine Canyon Wind Project began in September 2002, and the first year of monitoring was completed at
the end of August 2003.
Avian and bat fatality monitoring for the Project consisted of the following components: 1)
fatality monitoring involving standardized carcass searches, scavenging and searcher efficiency trials, and
a protocol for handling and reporting of fatalities and injured wildlife found by maintenance personnel,
and 2) formation of a Technical Advisory Committee comprised of stakeholders for review of monitoring
protocols and results, and discussion of mitigation measures (if needed), and for making
recommendations to Benton County, the permitting agency. Mitigation measures already agreed upon
include a $75 per turbine per year fee for the life of the project for benefits to shrub-steppe and grassland
habitats and associated wildlife species potentially impacted by the project. This fund is managed by
Washington Department of Fish and Wildlife.
The number of avian and bat fatalities attributable to the Project was estimated based on the
number of avian and bat fatalities found within the search plots whose death appeared to be related to the
facility. All carcasses located within areas surveyed, regardless of species, were recorded. An estimate of
the total number of avian and bat mortalities within the search areas was made by adjusting for "removal
bias" (scavenging) and searcher efficiency (observer detection) bias. For carcasses where the cause of
death was not apparent, the fatality was conservatively attributed to the facility. This report contains
results from a full year of monitoring.
STUDY AREA AND PROJECT DESCRIPTION The Project is located approximately 5 miles south of the town of Finley. Turbines are located at
elevations ranging from approximately 380 – 594 m (1250 – 1950 feet) above sea level. The Project is
located within the Columbia Basin Physiographic Province. The original vegetation of the project area
was a bluebunch wheatgrass-Idaho fescue zonal association, which was predominately grassland and
shrub-steppe with deciduous riparian forest and scrub along drainages (Franklin and Dyrness 1973).
Agriculture and livestock grazing have converted the area to a mosaic of cultivated wheat fields, grazed
Nine Canyon Avian and Bat Monitoring Report October 2003 2
shrub-steppe, and Conservation Reserve Program (CRP) grasslands (Figure 2).
Wind turbines at the facility are Bonus 1.3 MW three-bladed horizontal axis turbines mounted on
a 60 m (200 feet) tubular tower (Figure 3). The rotor diameter of the turbine is approximately 62 m (203
feet) so the rotor swept area ranges from 29 m to 91 m (95 to 299 feet) above ground level. There are 37
turbines in the facility. Fifteen of the turbines are equipped with FAA required airplane warning lights1.
Turbine towers within a string are approximately 150 m (492 feet) apart. We also monitored the permanent
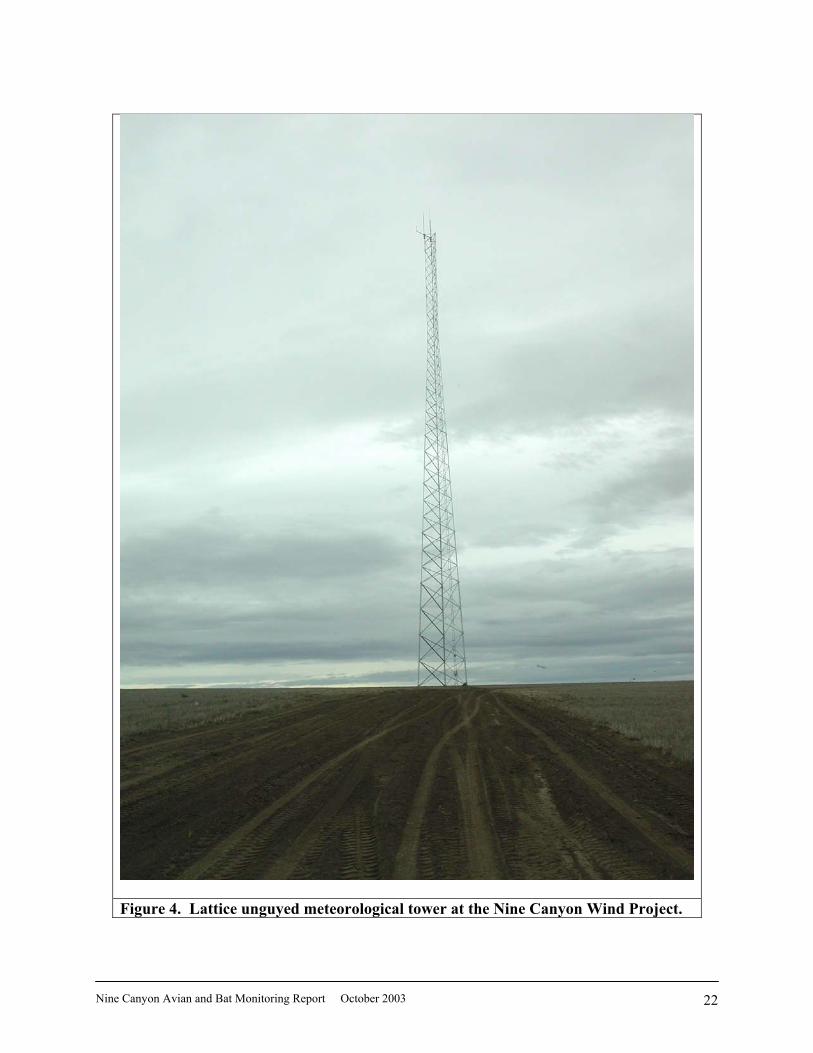
meteorological tower, an unguyed lattice structure approximately 60 m (200 feet) in height (Figure 4).
Thirty-one of the 37 turbines are located in wheat fields, and the remaining 6 (T-22, T-23, T-34,
T-35, T-36 and T-37) are located in CRP grassland. Small areas of grassland/shrub steppe habitats exist
within the northern portion of search plots along string B (T-1 through T-6).
FIELD METHODS
The fatality monitoring study began once all the turbines were constructed and operational (early
September). The following dates were used to define seasons: (1) spring migration (March 16 - May 15);
(2) breeding season (May 16-August 15); (3) fall migration (August 16-October 31) and (4) winter
(November 1-March 15).
Standardized Carcass Searches
Personnel trained in proper search techniques conducted the carcass searches at the turbines and
the permanent meteorological tower. Boundaries of rectangular plots were delineated along each turbine
string. All areas within a minimum of 90-m from turbines were searched2. Transects were set at 6 m (20
feet) apart, and searchers walked at a rate of approximately 45 to 60 m (148 to 197 feet) a minute along
each transect searching both sides out to 3 m (10 feet) for casualties (Johnson et al. 1993). Search area
and speed were adjusted by habitat type. It took approximately 1.5 to 2 hours to search each turbine
depending on the habitat type. Searches were conducted twice monthly in the spring, summer and fall and
once monthly in the winter, resulting in 19 searches at each of the 37 turbines. A complete round of
searches (all turbines searched) took approximately 4 to 5 days to complete, depending on the number of
searchers.
The condition of each carcass found was recorded using the following condition categories: (1)
Intact – a completely intact carcass that is not badly decomposed, and showing no sign of being fed upon
by a predator or scavenger; (2) Scavenged – an entire carcass which shows signs of being fed upon by a
1 white strobe lights during the day, and red pulsating lights at night 2 the search area was expanded from 70 m (230 feet) to 90 m (295 feet) in November 2002
Nine Canyon Avian and Bat Monitoring Report October 2003 3
predator or scavenger, or a portion(s) of a carcass in one location (e.g., wings, skeletal remains, legs,
pieces of skin, etc.), and (3) Feather Spot - 10 or more feathers, or two primary feathers at one location
indicating predation or scavenging.
All carcasses found were uniquely labeled, bagged and frozen for future reference and possible
necropsy. A copy of the data sheet for each carcass was stored with the carcass at all times. Data recorded
included species, sex and age (when possible), date and time collected, location, condition, and any
comments that may indicate cause of death. All casualties were photographed as found. Casualties or
fatalities found incidentally and not during formal searches were documented using a wildlife incidental
reporting system (see next section). When non-study personnel discovered wildlife carcasses, a biologist
was contacted to identify and collect the casualty. Appropriate wildlife salvage permits were obtained
from the Washington Department of Fish and Wildlife and the U.S. Fish and Wildlife Service.
Energy Northwest’s Wildlife Reporting and Handling System for Incidental Fatality and Injured Bird Discoveries
Energy Northwest’s Wildlife Reporting and Handling System (WRHS) is a monitoring program
for reporting and handling avian and bat casualties or injured wildlife found by maintenance personnel
(Energy Northwest 2003). Construction and maintenance personnel were trained in the methods. This
monitoring program includes reporting of carcasses discovered incidental to construction and
maintenance operations. This system will be in place for the life of the project.
Any carcass discovered by maintenance personnel was recorded, photographed and reported to
the designated Primary Respondent. The Primary Respondent contacted a Project Biologist to have the
fatality identified and collected.
Experimental Searcher Efficiency Trials Searcher efficiency studies were conducted throughout the year in the carcass search areas.
Estimates of searcher efficiency were used to adjust the number of carcasses found, correcting for
detection bias. Search personnel did not know when efficiency trials were to be conducted. Before the
beginning of a standardized carcass search, observer detection trial carcasses were placed at random
locations. Each carcass was discretely marked so that it could be identified as an efficiency trial carcass
after it was found. The number and location of the trial carcasses found during the carcass search were
recorded. Each carcass was discretely secured to its location to discourage removal by scavengers. The
number and location of the detection carcasses found during the carcass search were recorded. The
number of carcasses available for detection during each trial was verified immediately after the trial to
ensure that between the time they were placed and the carcass search on that day no carcasses were
Nine Canyon Avian and Bat Monitoring Report October 2003 4
removed by scavengers. Carcasses not found by the searcher were removed following the carcass search
effort for that day.
Nine searcher efficiency trials were conducted (trial dates 2002: September 26, October 22,
December 16; trial dates 2003: February 19, April 7, May 6, June 24, July 8, August 7). Outcome
(detected or not detected) was determined for 34 small and 37 large sized carcasses placed in the field
prior to carcass searches. Carcasses used to represent large birds included ring-necked pheasant, great
horned owl, red-tailed hawk (Buteo jamaicensis), Canada goose, mallard, rock dove, and barn owl.
Carcasses used to represent small birds and bats included coturnix quail, house sparrow, American robin,
white-crowned sparrow, killdeer, silver-haired bat (Lasionycterus noctivagans), warbling vireo (Vireo
gilvus), juvenile ring-necked pheasant and red-winged blackbird.
Experimental Carcass Removal Trials
Experimental carcass removal trials were conducted throughout the year near the carcass search
plots using planted carcasses. Estimates of carcass removal were used to adjust carcass counts for
removal bias. Carcass removal includes removal by predation or scavenging, or removal by other means
such as being plowed into a field. The planted carcasses were located randomly within the carcass
removal trial plots. Carcass removal trial plots were located outside the carcass search areas to avoid
confusing trial carcasses with actual wind plant related fatalities.
Two trials were conducted each season (start dates 2002: Sept 23, Dec 16; start dates 2003:
January 13, March 19, April 7, May 19, June 23, August 18). Eight carcasses, 4 large and 4 small, were
used in each trial, for a total of 32 small and 32 large carcasses for the entire trial. Carcasses were placed
in the field (day 0) and typically checked on days 1, 2, 3, 4, 7, 14, 20, and 30. At the end of the 30-day
period any remaining carcasses or feathers were removed.
Carcasses used to represent medium to large birds included ring-necked pheasant (Phasianus
colchicus), ring-billed gull (Larus delawarensis), American kestrel (Falco sparverius), mallard (Anas
platyrhynchos), rock dove (Columba livia), great horned owl (Bubo virginianus), Canada goose (Branta
canadensis), gray partridge (Perdix perdix), and barn owl (Tyto alba). Carcasses used to represent small
birds and bats included juvenile ring-necked pheasant, western meadowlark (Sturnella neglecta), red-
winged blackbird (Agelaius phoeniceus), song sparrow (Melospiza melodia), mourning dove (Zenaida
macroura), horned lark (Eromophila alpestris), cliff swallow (Petrochelidon pyrrhonota), white-crowned
sparrow (Zonotrichia leucophrys), American robin (Turdus migratorius), coturnix quail (Coturnix
coturnix), house sparrow (Passer domesticus), killdeer (Charadrius vociferous), northern rough-winged
swallow (Stelgidopteryx serripennis), red-breasted nuthatch (Sitta canadensis), house finch (Carpodacus
mexicanus) and vesper sparrow (Pooecetes gramineus).

Nine Canyon Avian and Bat Monitoring Report October 2003 5
Raptor Nest Monitoring Three historic raptor nests near the project were checked for occupancy on June 22 and 23, 2003. STATISTICAL METHODS Observed Number of Carcasses
The observed fatality rate was expressed as the mean number of carcasses ( c ) observed per
turbine per year.
Estimation of Searcher Efficiency Rates
Searcher efficiency rates are expressed as p, the proportion of trial carcasses that are detected by
searchers.
Estimation of Carcass Removal Rates
Estimates of carcass removal were used to adjust carcass counts for removal bias. Mean carcass
removal time ( t ) is the average length of time a carcass remains at the site before it is removed:
1
s
ii
c
tt
s s==−
∑, where ti is the removal time of the ith carcass, s is the number of carcasses used in the trials,
and sc is the number of carcasses remaining at day 30 of the trial.
This estimator is the maximum likelihood estimator assuming the removal times follow an
exponential distribution and there is right-censoring of data (Barnard 2000). In our application, any trial
carcasses still remaining at 30 days were collected, yielding censored observations at 30 days.

Nine Canyon Avian and Bat Monitoring Report October 2003 6
Estimation of Facility-Related Fatality Rates We estimate the facility-related fatality rates by dividing the observed number of fatalities by an
estimate of the probability a casualty is available to be picked up during a fatality search (probability it is
not removed by a scavenger or by other methods), and is observed (probability of detection). This
estimator (m1) has been applied at other wind facilities, and was the estimator proposed in the Stateline
Protocols (FPL Energy et al., 2001, Oregon Energy Facility Siting Council 2001 and 2002) and the Nine
Canyon Protocol. The estimated per turbine annual fatality rate (m1) is calculated by:
1 ^
1
cmπ
= ,
where
^
1if I>t
if I t
t pI
pπ
⋅ = ≤
, p is the estimated searcher efficiency rate, t is the estimated carcass
removal time, and I is the average interval between searches (approximately 19 days).
We calculated fatality estimates for 1) all birds, 2) small birds, 3) large birds, 4) raptors, and 5)
bats. The final reported estimate of m1 and associated standard errors and 90% confidence intervals were
calculated using bootstrapping (Manly 1997).
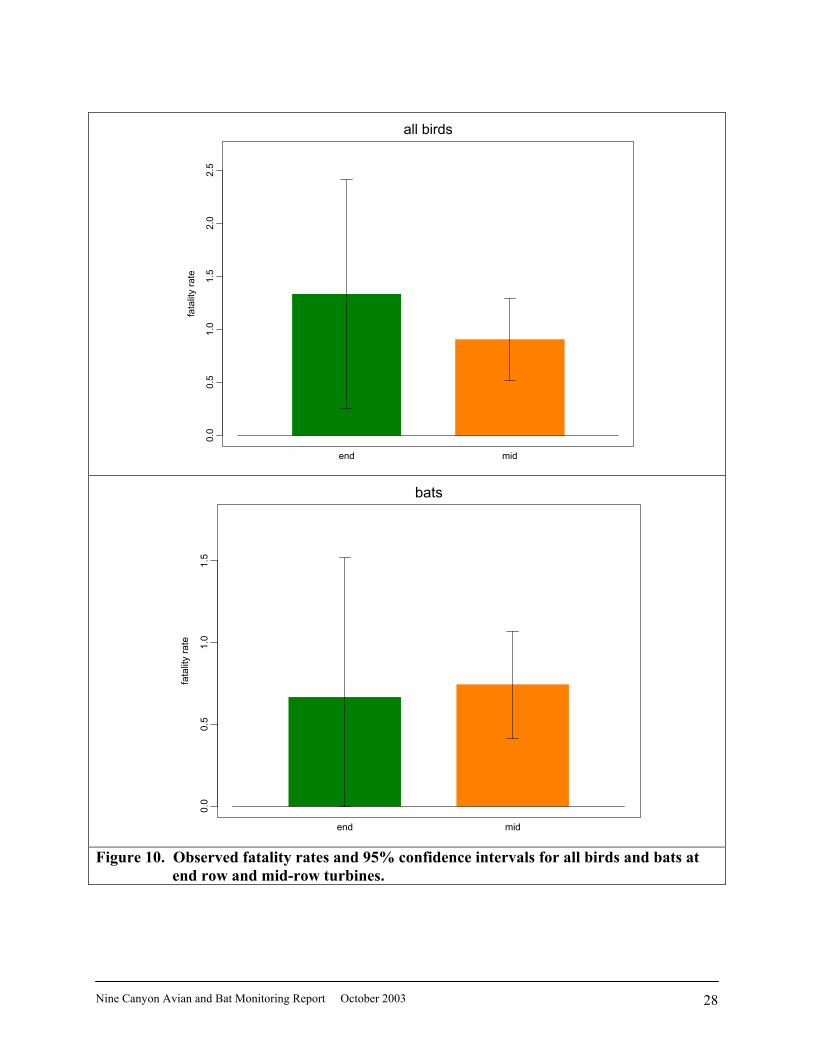
Statistical Comparisons of Observed Mortality Observed bird and bat mortality (unadjusted for biases) was compared among several factors for the
purpose of understanding whether these factors influenced the mortality rates. Factors included:
1) Juxtaposition within the Project (String A, String B and String C);
2) Juxtaposition within a string (end row versus mid-row);
3) Lighting (lit versus unlit turbines);
Means and limits of 95% confidence intervals for levels of each factor were presented in graphs.
Nine Canyon Avian and Bat Monitoring Report October 2003 7
RESULTS Bird Casualties
No casualties of federal or state-listed species were found during the study. Thirty-eight avian
casualties representing 13 species3 were found within search plots during the study (Table 1). Six
casualties were non-native species. One heavily scavenged avian carcass (rough-legged hawk) was found
a long distance (200 m) from the turbines, and was excluded from the analysis. Two of the 38 casualties
were flightless young found away from the roads, and were therefore not considered collision fatalities.
Only the remaining 36 were used in subsequent analyses. Eight of the 36 fatalities were intact, 13 were
dismembered and scavenged, and the remaining 15 were feather spots. No fatalities were observed at the
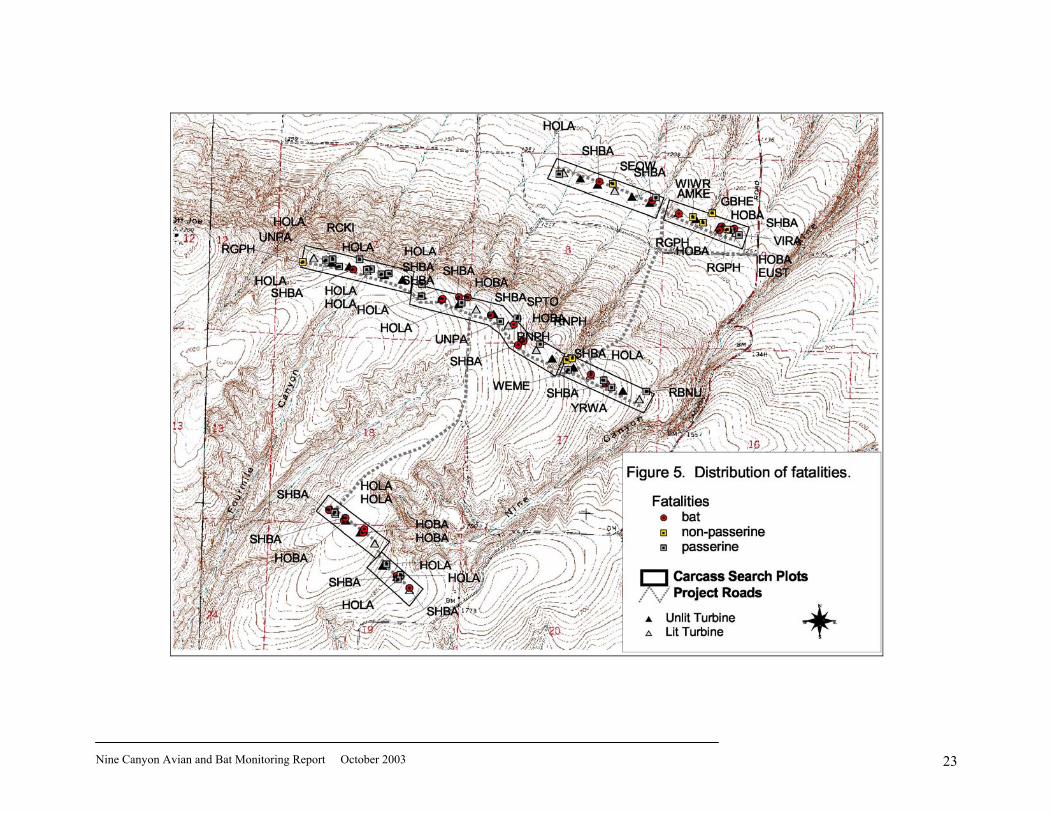
permanent meteorological tower. The thirty-six fatalities were observed at 21 different turbines (Table 2,
Figure 5). The maximum number of fatalities observed during this period nearest any one turbine was 3
(Turbines 2, 4, 16 and 37). Two fatalities were found at 7 different turbines, and one fatality was
observed at 10 different turbines. It was assumed that the fatalities occurred at the turbine nearest the
carcass.
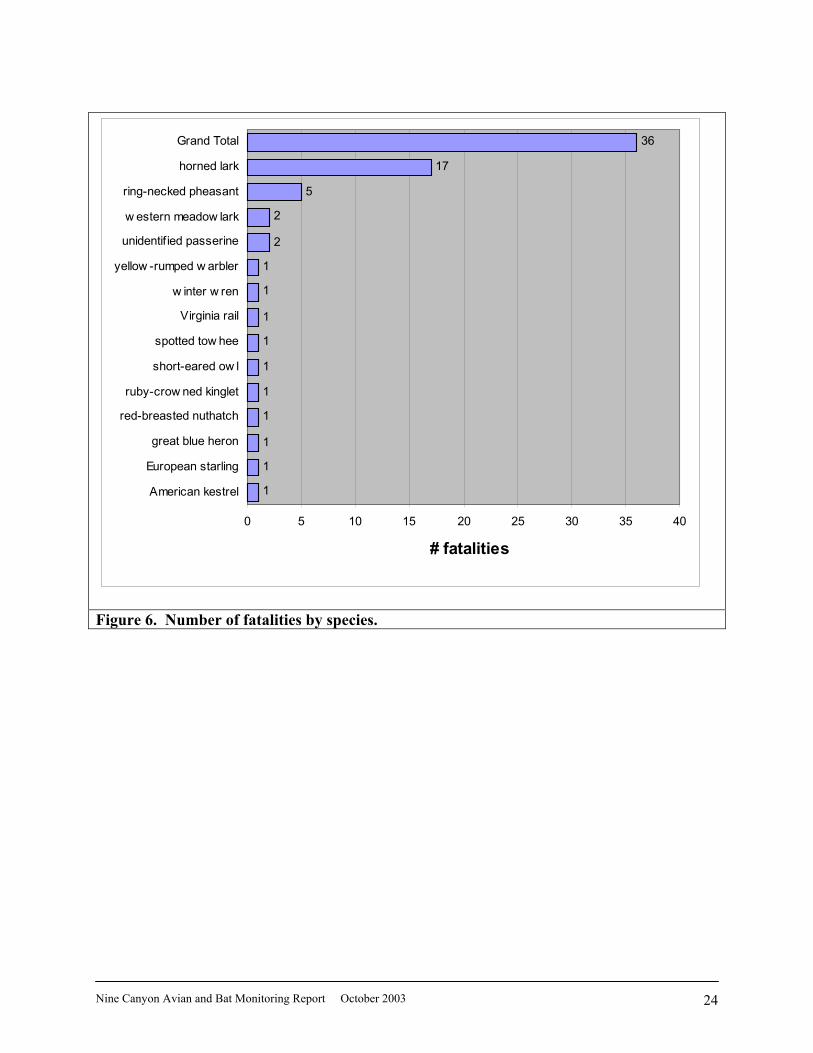
The most common fatality was horned lark (17 fatalities, 47% of total), which is a very common
resident bird (Figure 6). Horned larks are also the most common fatality observed at the Stateline Wind
Project, which is located approximately 12 miles southeast of the Nine Canyon Wind Project area
(Erickson et al. 2003). Ring-necked pheasant (5 fatalities, 14% of total) and western meadowlark (2
fatalities, 6% of total) were the only other species with multiple fatality records. All five ring-necked
pheasant casualties were feather spots. Two of the five feather spots were found at a potential roost site,
which suggests they may not have been fatalities. Other fatalities found were one American kestrel,
European starling (Sturnus vulgaris), great blue heron (Ardea herodias), red-breasted nuthatch, ruby-
crowned kinglet (Regulus calendula), short-eared owl (Asio flammeus), spotted towhee (Pipilo
maculates), Virginia rail (Rallus limicola), winter wren (Troglodytes troglodytes), and yellow-rumped
warbler (Dendroica coronata). There were also two unidentified passerine feather spots observed within
search plots.
The winter wren, yellow-rumped warbler, spotted towhee, ruby-crowned kinglet, and red-
breasted nuthatch were most likely migrants. Virginia rails are found year-round in the Tri-Cities area in
wetland habitats. It is unclear whether the rail was migrating through the project area, or a local resident
that was moving between suitable habitat. There is no suitable habitat for this species near the project
site. The American kestrel found in the middle of November had been heavily scavenged and scattered
suggesting it was possibly dragged by farm equipment. The short-eared owl was intact. The average
3 13 identifiable species and four unidentified passerine feather spots

Nine Canyon Avian and Bat Monitoring Report October 2003 8
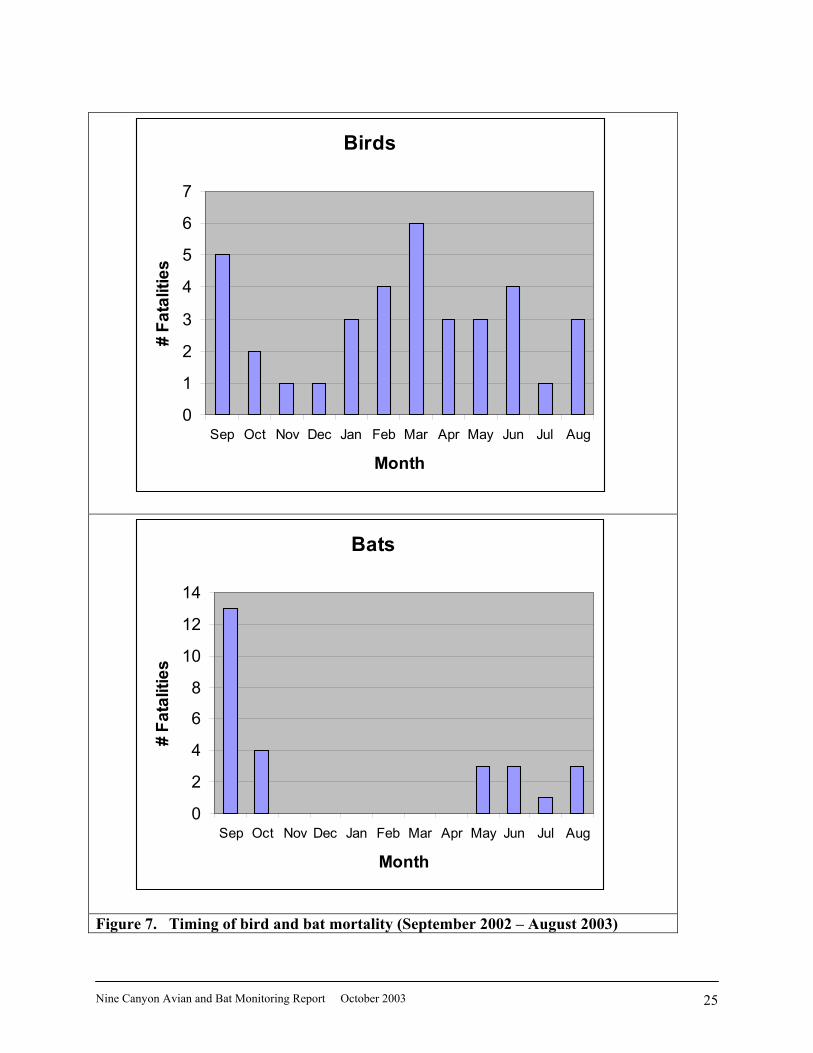
distance from turbines to fatalities was 50 m (164 feet). Bird casualties were discovered during all but
two search periods (late July and early August, Figure 7).
Bat Casualties
Twenty-seven dead bats were found during the study (Table 3). Silver-haired bat (15) and hoary
bat (Lasiurus cinereus) (12) were the only two species observed. Both these species are likely migrants at
this project site. Twenty of the bat fatalities were found during the period August 5 through October 24,
during the apparent fall migration period for these bat species. Seven of the fatalities were found from
May 6 through July 8 (Figure 7). These 27 fatalities were observed at 18 different turbines (Table 2,
Figure 5). The maximum number of fatalities observed at any one turbine was 3 (Turbine 24). The
average distance from turbines to fatalities was 29 m (95 feet).
Experimental Searcher Efficiency Bias Trials
The estimated observer detection rate was 44% for small birds (n=34), and 78% for medium to
large birds (n=37).
Experimental Carcass Removal Bias Trials
Some evidence of scavenging of trial carcasses was often documented a day after the carcasses
were placed in the field, although removal of the carcass typically did not occur on this first day. On
average, small carcasses lasted approximately 11 days before they were removed (n=32), with 94% of
trial carcasses removed at day 30 of the trial (Figure 8). Large carcasses averaged approximately 33 days
before they were removed (n=32), with 57% removed at the end of the trial period (day 30).
Fatality Estimates
Fatality estimates, standard errors and 90% confidence intervals for (1) all birds, (2) small birds,
(3) large birds, (4) raptors, and (5) bats are found in Table 4.
Small Birds Twenty-eight small bird fatalities were found on search plots during the monitoring period. The
estimated average probability a small bird casualty remained until a scheduled search was initiated
(monthly or every 2 weeks) and was found was 0.246. The estimated number of small bird fatalities per
turbine per year for the Nine Canyon Wind Power Project is 3.31 (1.75, 5.51)4. We estimate an average of
4 upper and lower limits of 90% confidence intervals (bootstrapping)

Nine Canyon Avian and Bat Monitoring Report October 2003 9
122 small bird fatalities each year for the 37 wind turbines.
Large Birds
Eight large birds were found on search plots during the monitoring period. The estimated average
probability a large bird casualty remained until a scheduled search and was found was 0.780. The
estimated number of large bird fatalities per turbine per year for the Nine Canyon Wind Power Project is
0.28 (0.11, 0.48). We estimate an average of 10 large bird fatalities each year for the 37 wind turbines.
All Birds The all bird fatality estimate was obtained by summing the estimates for small and large birds.
Based on the 36 bird casualties found on the search plots, we estimate 3.59 bird fatalities occur per
turbine per year (2.03, 5.78) for the Nine Canyon Wind Power Project. We estimate an average of 133
bird fatalities each year for the 37 wind turbines.
Raptors Among of the eight large bird casualties discovered on standardized search plots were two
raptors. We estimate 0.065 raptor fatalities occur per turbine per year (0.054, 0.148) for the Nine Canyon
Wind Power Project. We estimate an average of 3 raptor fatalities each year for the 37 wind turbines.
Bats Twenty-seven bat fatalities were observed on search plots during the study. We estimate 3.21 bat
fatalities occur per turbine per year (1.71, 5.37) for the Nine Canyon Wind Power Project. We estimate
an average of 119 bat fatalities each year for the 37 wind turbines.
Raptor Nest Monitoring
Three historically active nests of raptor species of interest (Swainson’s hawk and ferruginous
hawk) exist within approximately four miles of the Nine Canyon Project. The nearest historic ferruginous
hawk nest is located approximately 3 miles southeast of the project. This nest site was not active in 2000,
2001 and 2002. The site was used by common ravens in 2003. Another historic ferruginous hawk nest is
located approximately 3.8 miles southwest of the project. This site was occupied by ferruginous hawks in
2001 and 2002 before operation began and again in 2003 during operations of the wind project. One
historic Swainson’s hawk nest is located along Beck Rd. and approximately 1.8 miles from Nine Canyon
wind turbines. This nest site was occupied by Swainson’s hawks in 2001 and 2002 and again in 2003.
Nine Canyon Avian and Bat Monitoring Report October 2003 10
SUMMARY/DISCUSSION
With the exception of the two flightless young, all bird casualties observed within the search plots
were included in the fatality estimates. There were no other casualties where the cause of death could be
definitively attributed to factors not related to the wind facility, although true cause of death is unknown
for most of the fatalities. Some of the fatalities may have been killed by means not associated with wind
facility operations (e.g., kills by raptors or other predators). A maintenance person reported hitting a
pheasant with a vehicle near a turbine where a pheasant fatality was found during a search around the
same time. Two other pheasant feather spots were found near a potential roost site and may have been
predator kills, excessive molting or were injured birds. Several of the horned lark fatalities are suspected
to be vehicle kills occurring along turbine string roads and not wind turbine strikes, given the locations of
the finds (e.g., recently fledged juveniles near or along the road). TAC members previously agreed that
all fatalities would be attributable to the wind project operations (inclusive of turbine strikes and vehicle
impacts) unless cause of death not related to the operations could be determined.
There is likely some background5 mortality that is included in the fatality rate estimates. To the
best of our knowledge, reference or background mortality has been estimated only once during baseline
studies of new wind projects. During a four-year study at Buffalo Ridge (MN), 2,482 fatality searches
were conducted on study plots without turbines to estimate reference mortality in the study area, and 31
avian fatalities comprised of 15 species were found (Johnson et al. 2002). Reference mortality consisted
of eight upland gamebirds, seven doves, five sparrows, three waterfowl, three raptors, two blackbirds, one
waterbird, one shorebird, and one unidentified bird. The exact cause of death of many birds found in
reference plots could not be determined; however, most birds appeared to have been killed by predators or
vehicles. Reference mortality was estimated to average 1.1 per plot per year, compared to 0.98, 2.27 and
4.45 fatalities per turbine search plot per year in the Phase 1, 2 and 3 wind plants, respectively (Johnson et
al. 2002). These numbers indicate that estimates of turbine mortality likely include some fatalities not
related to project operations.
Although background mortality is likely one of the largest sources of bias in the bird estimates,
other factors may have caused an overestimate of the number of fatalities. Searcher efficiency trials are
conducted with intact carcasses, while some of the casualties were found as feather spots or scattered
body parts. These feather spots sometimes involve numerous feathers spread over a large area, and are
therefore likely easier to detect than an intact carcass. If this bias exists, it would contribute to an
underestimate of bird detection rates and an overestimate of fatality rates. Carcasses found incidentally6
5 fatalities that were caused by factors unrelated to the Wind Project (e.g., predator kills, farm equipment collisions) 6 not found during formal searches

Nine Canyon Avian and Bat Monitoring Report October 2003 11
(approximately 6% of total bird finds) were included in the calculation of fatality estimates, also possibly
contributing to an overestimate of the fatality rates. These fatalities may or may not have been found
during scheduled searches. One other possible negative bias in the estimate relates to the carcass search
plot area. The average distance from a turbine to a bird fatality was 50 m (164 feet). We searched out a
minimum distance of 90 m (295 feet) to each turbine, but given the distribution of fatalities as a function
of distance to turbine, a small percentage of fatalities may have landed outside the search plots (Figure 9).
This bias appears to be extremely small for bats, since only one fatality was observed more than 50 m
(164 feet) from a turbine.
Approximately 50% of the bird fatalities were horned larks, a very common yearlong resident
songbird within the project and the geographic area that comprised over 50% of the bird observations
from pre-construction point counts at the Nine Canyon Project (Erickson et al. 2001). Five pheasants
feather spots were found and were included in the fatality estimates, although some of these feather spots
may not have been casualties. If they were casualties and not excessive molting at roost sites, we also
believe wind turbines were likely not the cause of death. One of the pheasants founds was apparently
killed by a maintenance vehicle. We believe vehicles (part of wind plant operations) or raptors were the
probable cause of death for the other pheasant fatalities. Two western meadowlark fatalities were also
found, and western meadowlarks were the 2nd most commonly observed species observed during pre-
construction point counts (Erickson et al. 2001). No other individual species was documented more than
once as a fatality. One European starling, which is not protected under the Migratory Bird Treaty Act
(MBTA), was included in the fatality estimate.
Comparisons of fatality rates among wind projects should account for factors such as operation
time of the wind project, rotor swept area of the turbines, and nameplate power output of the turbines.
When adjusted fatality rates are standardized to 3000 m2 rotor swept area or to 1 MW of nameplate power
output, bird and bat fatality rates at Nine Canyon are in the range of observed at other new generation
wind projects (Table 5).
Studies at the Foote Creek Rim Wind Project (Young et al. 2003) showed 3 to 4 times higher per
structure fatality rates at the guyed meteorological towers compared to the wind turbines. The higher
fatality rates were likely caused by the wires associated with the structure. In response to those results,
Energy Northwest agreed to use an unguyed meteorological tower, and no fatalities were observed at this
structure.
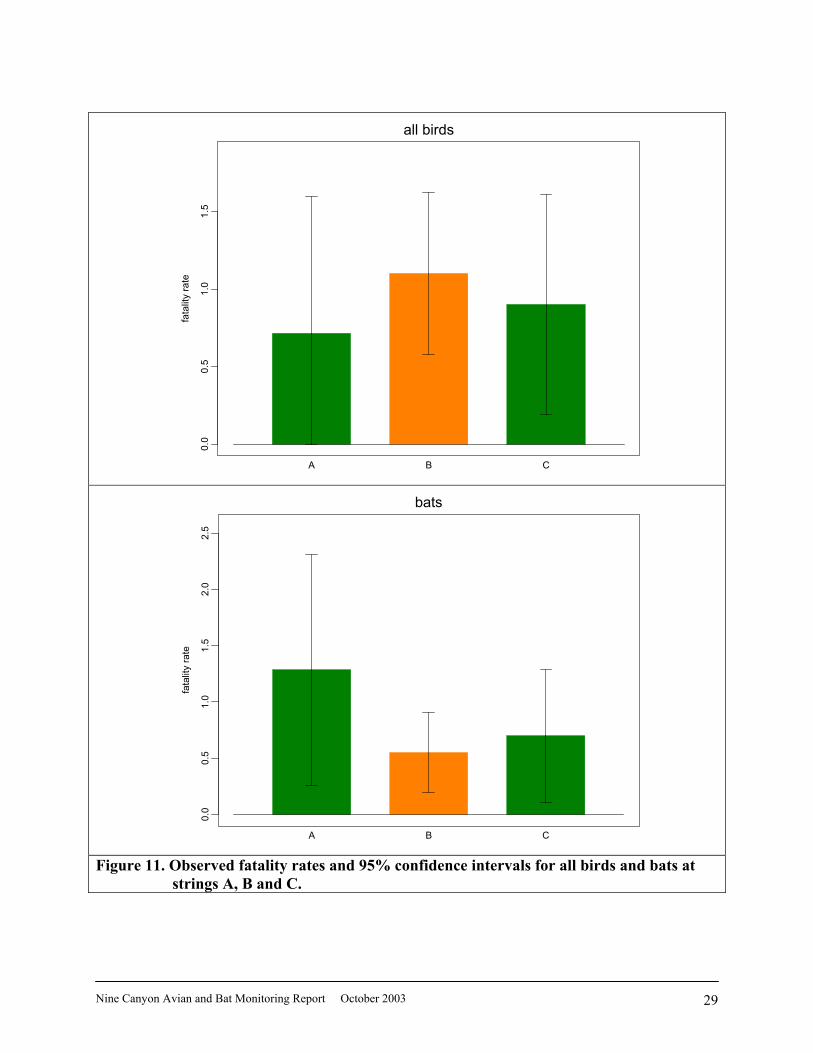
We compared observed fatality rates among levels of three primary factors, juxtaposition of
turbines within a turbine string, juxtaposition of turbine strings within the wind project and lighting of
turbines. These were not experiments, so cause of significant differences cannot be inferred from this
observation data. No statistically significant differences in fatality rates were observed for any of the

Nine Canyon Avian and Bat Monitoring Report October 2003 12
factors (Figures 10-12). Observed fatality rates for birds and bats combined were very similar comparing
end row turbines to mid-row turbines. One earlier study of raptor mortality suggested higher mortality
rates for end row turbines (Orloff and Flannery 1992 and 1996), but other more recent studies have
suggested higher raptor mortality rates at mid-row turbines (Anderson et al. 2000).
Tall structures that are lighted are suspected of attracting nocturnal migrating birds, especially
during inclement weather (Kerlinger 2000). High intensity continuously lit red lights are believed to be
more of an attractant than other types, although very few studies have investigated this. We investigated
whether the annual observed fatality rates tended to differ for lit turbines compared to unlit turbines.
Observed fatality rates at lit turbines were higher than at unlit turbines for passerines and lower at lit
turbines for bats, although none of the differences were statistically significant (p>0.10). These observed
differences in fatality rates were not consistent with observed differences from monitoring of the
Stateline Wind Project (Erickson et al. 2003).
ACKNOWLEDGEMENTS We would like to thank Energy Northwest Energy for funding and other support for this project.
We would also like to thank the Blair and the Bateman families for their cooperation. We want to
acknowledge the field personnel who conducted the carcass searches, often under very difficult
environmental conditions (see page ii for the list of project participants).
REFERENCES Anderson, R.L., D. Strickland, J. Tom, N. Neumann, W. Erickson, J. Cleckler, G. Mayorga, G. Nuhn, A.
Leuders, J. Schneider, L. Backus, P. Becker and N. Flagg. 2000. Avian monitoring and risk
assessment at Tehachapi Pass and San Gorgonio Pass wind resource areas, California: Phase 1
preliminary results. Proceedings of the National Avian-Wind Power Planning Meeting 3:31-46.
National Wind Coordinating Committee, Washington, D.C.
Barnard, D. 2000. Statistical properties of an avian fatality estimator. Thesis, University of Wyoming,
Laramie, Wyoming, USA.
Erickson, W.P., J. Jeffrey, K. Kronner, and K. Bay. 2003. Stateline Wind Project Wildlife Monitoring
Annual Report, Results for the Period July 2001 – December 2002. Technical report submitted to
FPL Energy, the Oregon Office of Energy, and the Stateline Technical Advisory Committee.
Erickson, W.P., E. Lack, M. Bourassa, K. Sernka, and K. Kronner. 2001. Wildlife baseline study for the
Nine Canyon Wind Project. Technical report prepared for Energy Northwest.
Energy Northwest. 2003. Nine Canyon Wind Project Wildlife Reporting And Handling System.
Technical Manual.
Nine Canyon Avian and Bat Monitoring Report October 2003 13
FPL Energy Inc., W.P. Erickson and K. Kronner. 2001. Avian and bat monitoring plan for the
Washington portion of the Stateline Wind Project. Technical Report prepared for Walla Walla
Regional Planning Department. May, 2001.
Franklin, J. F. and C. T. Dyrness. 1973 (1988 reprint with new bibliographic supplement). Natural
Vegetation of Oregon and Washington. Oregon State University Press, Corvallis, OR. 452 pp.
Johnson, G.D., W.P. Erickson, and J. White. 2003. Avian and bat mortality at the Klondike, Oregon
Phase I Wind Plant. Technical report prepared for Northwestern Wind Power by WEST, Inc.
Johnson, G.D., W.P. Erickson, M.D. Strickland, M.F. Shepherd, D.A. Shepherd, and S.A. Sarappo. 2002.
Collision mortality of local and migrant birds at a large-scale wind power development on
Buffalo Ridge, Minnesota. Wildlife Society Bulletin 30:879-887.
Johnson, G.D., H.O. Krueger, and R.T. Balcomb. 1993. Effects on wildlife of Brace® 10G applications to
corn in south-central Iowa. Environmental Toxicology and Chemistry 12:1733-1739.
Kerlinger, P. 2000. Avian mortality at communication towers: a review of recent literature, research, and
methodology. Unpublished report prepared for the U.S. Fish and Wildlife Service, Office of
Migratory Bird Management.
Manly, B.F.J. 1997. Randomization, Bootstrap and Monte Carlo Methods in Biology. 2nd edition.
Chapman and Hall, New York. pp 399.
Oregon Energy Facility Siting Council. 2001. Final Order for the Stateline Wind Facility. September
2001. Attachment A. Stateline Wind Project: Oregon Wildlife Monitoring Plan.
Oregon Energy Facility Siting Council. 2002. Final Order on Stateline Amendment #1. May 17, 2002.
Attachment A. Stateline Wind Project: Oregon Wildlife Monitoring Plan.
Orloff, S. and A. Flannery. 1992. Wind turbine effects on avian activity, habitat use, and mortality in
Altamont Pass and Solano County Wind Resource Areas, 1989-1991. Final Report to Alameda,
Costra Costa and Solano Counties and the California Energy Commission by Biosystems
Analysis, Inc., Tiburon, CA.
Orloff, S. and A. Flannery. 1996. A continued examination of avian mortality in the Altamont Pass
Wind Resource Area. Final Report to the California Energy Commission by Biosystems
Analysis, Inc., Tiburon, CA.
Young, D. P. Jr., W. P. Erickson, R. E. Good, M. D. Strickland, and G.D. Johnson. 2003. Avian and bat
mortality associated with the initial phase of the Foote Creek Rim Windpower Project, Carbon
County, Wyoming: November 1998 - June 2002. Technical Report prepared by WEST, Inc. for
Pacificorp, Inc., SeaWest Windpower, Inc. and Bureau of Land Management. 35 pp.
Nine Canyon Avian and Bat Monitoring Report October 2003 14
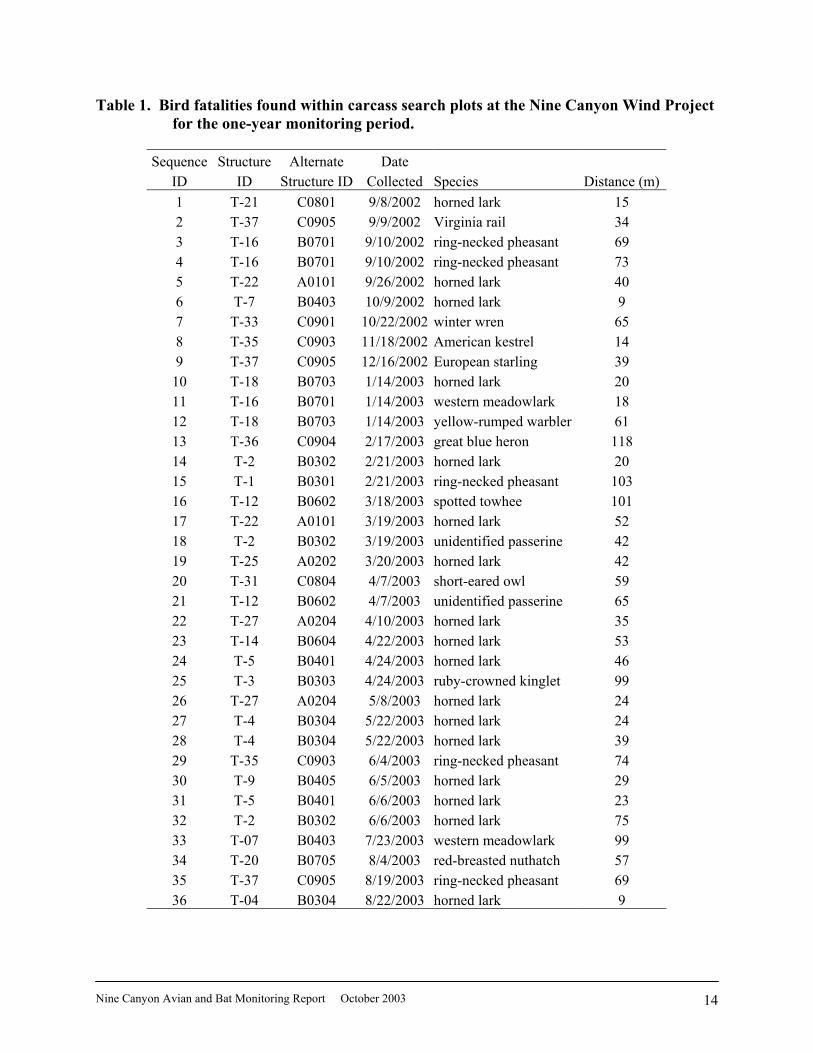
Table 1. Bird fatalities found within carcass search plots at the Nine Canyon Wind Project for the one-year monitoring period.
Sequence Structure Alternate Date
ID ID Structure ID Collected Species Distance (m)1 T-21 C0801 9/8/2002 horned lark 15 2 T-37 C0905 9/9/2002 Virginia rail 34 3 T-16 B0701 9/10/2002 ring-necked pheasant 69 4 T-16 B0701 9/10/2002 ring-necked pheasant 73 5 T-22 A0101 9/26/2002 horned lark 40 6 T-7 B0403 10/9/2002 horned lark 9 7 T-33 C0901 10/22/2002 winter wren 65 8 T-35 C0903 11/18/2002 American kestrel 14 9 T-37 C0905 12/16/2002 European starling 39
10 T-18 B0703 1/14/2003 horned lark 20 11 T-16 B0701 1/14/2003 western meadowlark 18 12 T-18 B0703 1/14/2003 yellow-rumped warbler 61 13 T-36 C0904 2/17/2003 great blue heron 118 14 T-2 B0302 2/21/2003 horned lark 20 15 T-1 B0301 2/21/2003 ring-necked pheasant 103 16 T-12 B0602 3/18/2003 spotted towhee 101 17 T-22 A0101 3/19/2003 horned lark 52 18 T-2 B0302 3/19/2003 unidentified passerine 42 19 T-25 A0202 3/20/2003 horned lark 42 20 T-31 C0804 4/7/2003 short-eared owl 59 21 T-12 B0602 4/7/2003 unidentified passerine 65 22 T-27 A0204 4/10/2003 horned lark 35 23 T-14 B0604 4/22/2003 horned lark 53 24 T-5 B0401 4/24/2003 horned lark 46 25 T-3 B0303 4/24/2003 ruby-crowned kinglet 99 26 T-27 A0204 5/8/2003 horned lark 24 27 T-4 B0304 5/22/2003 horned lark 24 28 T-4 B0304 5/22/2003 horned lark 39 29 T-35 C0903 6/4/2003 ring-necked pheasant 74 30 T-9 B0405 6/5/2003 horned lark 29 31 T-5 B0401 6/6/2003 horned lark 23 32 T-2 B0302 6/6/2003 horned lark 75 33 T-07 B0403 7/23/2003 western meadowlark 99 34 T-20 B0705 8/4/2003 red-breasted nuthatch 57 35 T-37 C0905 8/19/2003 ring-necked pheasant 69 36 T-04 B0304 8/22/2003 horned lark 9
Nine Canyon Avian and Bat Monitoring Report October 2003 15
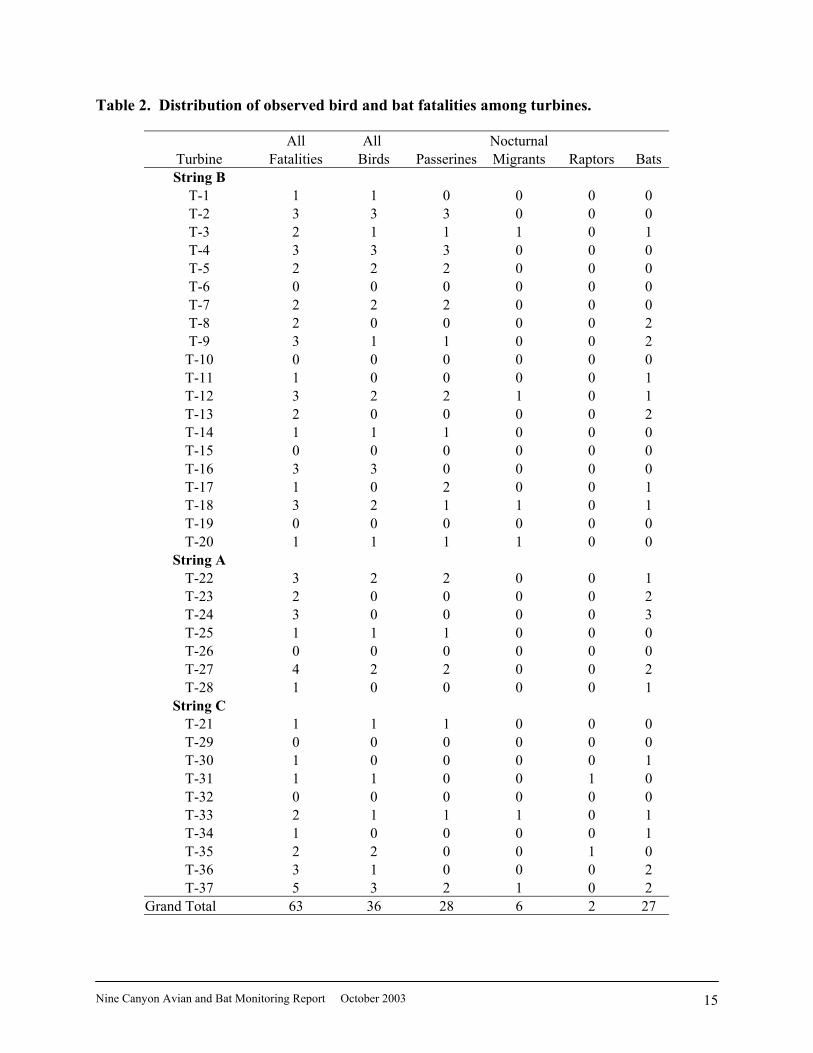
Table 2. Distribution of observed bird and bat fatalities among turbines.
All All Nocturnal Turbine Fatalities Birds Passerines Migrants Raptors BatsString B
T-1 1 1 0 0 0 0 T-2 3 3 3 0 0 0 T-3 2 1 1 1 0 1 T-4 3 3 3 0 0 0 T-5 2 2 2 0 0 0 T-6 0 0 0 0 0 0 T-7 2 2 2 0 0 0 T-8 2 0 0 0 0 2 T-9 3 1 1 0 0 2
T-10 0 0 0 0 0 0 T-11 1 0 0 0 0 1 T-12 3 2 2 1 0 1 T-13 2 0 0 0 0 2 T-14 1 1 1 0 0 0 T-15 0 0 0 0 0 0 T-16 3 3 0 0 0 0 T-17 1 0 2 0 0 1 T-18 3 2 1 1 0 1 T-19 0 0 0 0 0 0 T-20 1 1 1 1 0 0
String A T-22 3 2 2 0 0 1 T-23 2 0 0 0 0 2 T-24 3 0 0 0 0 3 T-25 1 1 1 0 0 0 T-26 0 0 0 0 0 0 T-27 4 2 2 0 0 2 T-28 1 0 0 0 0 1
String C T-21 1 1 1 0 0 0 T-29 0 0 0 0 0 0 T-30 1 0 0 0 0 1 T-31 1 1 0 0 1 0 T-32 0 0 0 0 0 0 T-33 2 1 1 1 0 1 T-34 1 0 0 0 0 1 T-35 2 2 0 0 1 0 T-36 3 1 0 0 0 2 T-37 5 3 2 1 0 2
Grand Total 63 36 28 6 2 27
Nine Canyon Avian and Bat Monitoring Report October 2003 16
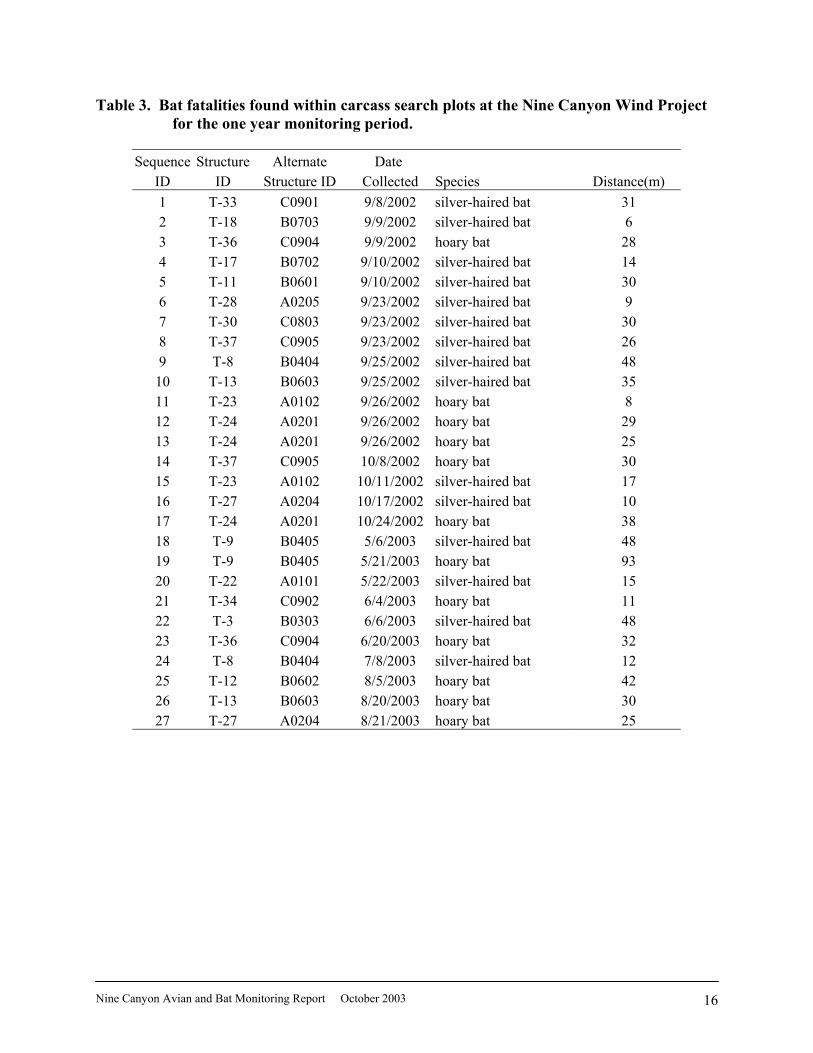
Table 3. Bat fatalities found within carcass search plots at the Nine Canyon Wind Project for the one year monitoring period.
Sequence Structure Alternate Date
ID ID Structure ID Collected Species Distance(m) 1 T-33 C0901 9/8/2002 silver-haired bat 31 2 T-18 B0703 9/9/2002 silver-haired bat 6 3 T-36 C0904 9/9/2002 hoary bat 28 4 T-17 B0702 9/10/2002 silver-haired bat 14 5 T-11 B0601 9/10/2002 silver-haired bat 30 6 T-28 A0205 9/23/2002 silver-haired bat 9 7 T-30 C0803 9/23/2002 silver-haired bat 30 8 T-37 C0905 9/23/2002 silver-haired bat 26 9 T-8 B0404 9/25/2002 silver-haired bat 48
10 T-13 B0603 9/25/2002 silver-haired bat 35 11 T-23 A0102 9/26/2002 hoary bat 8 12 T-24 A0201 9/26/2002 hoary bat 29 13 T-24 A0201 9/26/2002 hoary bat 25 14 T-37 C0905 10/8/2002 hoary bat 30 15 T-23 A0102 10/11/2002 silver-haired bat 17 16 T-27 A0204 10/17/2002 silver-haired bat 10 17 T-24 A0201 10/24/2002 hoary bat 38 18 T-9 B0405 5/6/2003 silver-haired bat 48 19 T-9 B0405 5/21/2003 hoary bat 93 20 T-22 A0101 5/22/2003 silver-haired bat 15 21 T-34 C0902 6/4/2003 hoary bat 11 22 T-3 B0303 6/6/2003 silver-haired bat 48 23 T-36 C0904 6/20/2003 hoary bat 32 24 T-8 B0404 7/8/2003 silver-haired bat 12 25 T-12 B0602 8/5/2003 hoary bat 42 26 T-13 B0603 8/20/2003 hoary bat 30 27 T-27 A0204 8/21/2003 hoary bat 25
Nine Canyon Avian and Bat Monitoring Report October 2003 17
Table 4. Observed number of birds and bats and adjusted fatality rate estimates for the Nine Canyon Wind Project.
# fatalities per turbine per year # fatalities in Wind Project per year Group # found mean sea llb ulc Total se ll ul all birds 36 3.59 1.20 2.03 5.78 133 44 75 214 small birds 28 3.31 1.20 1.75 5.51 122 44 65 204 large birds 8 0.28 0.12 0.11 0.48 10 4 4 18 raptors 2 0.065 0.046 0.054 0.148 3 2 2 5 bats 27 3.21 1.16 1.71 5.37 119 43 63 199
a standard error of mean b lower limit of a 90% confidence interval about the mean c upper limit of a 90% confidence interval about the mean
Nine Canyon Avian and Bat Monitoring Report October 2003 18
Table 5. Comparison of fatality rates standardized to rotor swept area (3000 m2) or nameplate power output (1 MW) for several wind projects.
Fatality Rates Project Size Turbine Characteristics Birds Bats
Wind Power Project #
turbines
NameplateOutput (MW)
RDa
(m) RSAb
(m2)
NameplateOutput (MW)
#/ 3000 m2
RSA #/
MW
#/ 3000 m2
RSA #/
MW Stateline, OR/WA 454 300 47 1735 0.66 2.9 2.6 1.6 1.4 Vansycle, OR 38 25 47 1735 0.66 1.1 1.0 1.3 1.1 Klondike, OR 16 24 65 3318 1.5 1.3 0.9 1.0 0.8 Nine Canyon, WA 37 48 62 3019 1.3 3.6 2.8 3.2 2.5 Foote Creek Rim, WY 69 48 43 1452 0.7c 3.5 2.4 2.1 1.4 Wisconsin 31 20 47 1735 0.66 2.2 2.0 7.4 6.5 Buffalo Ridge, MN 353 212 44 1488 0.6d 5.6 4.7 4.0 3.3 a rotor diameter b rotor swept area c an approximately average turbine output based on the two different sizes of turbines in operation at the time of study d an approximately average turbine output based on the three different sizes of turbines in operation at the time of study,
Nine Canyon Avian and Bat Monitoring Report October 2003 19
Figure 1. Turbine and search plot layout.

Nine Canyon Avian and Bat Monitoring Report October 2003 20
Figure 2. Aerial photograph of the Nine Canyon Wind Project.
Nine Canyon Avian and Bat Monitoring Report October 2003 21
Figure 3. Illustration of differences in size between the Nine Canyon 1.3 MW turbines and the Stateline 660 kW turbines.
Nine Canyon Avian and Bat Monitoring Report October 2003 22
Figure 4. Lattice unguyed meteorological tower at the Nine Canyon Wind Project.
Nine Canyon Avian and Bat Monitoring Report October 2003 23
Figure 5. Distribution of fatalities.
Nine Canyon Avian and Bat Monitoring Report October 2003 24
Figure 6. Number of fatalities by species.
1
1
1
1
1
1
1
1
1
1
2
2
5
17
36
0 5 10 15 20 25 30 35 40
American kestrel
European starling
great blue heron
red-breasted nuthatch
ruby-crow ned kinglet
short-eared ow l
spotted tow hee
Virginia rail
w inter w ren
yellow -rumped w arbler
unidentif ied passerine
w estern meadow lark
ring-necked pheasant
horned lark
Grand Total
# fatalities
Nine Canyon Avian and Bat Monitoring Report October 2003 25
Figure 7. Timing of bird and bat mortality (September 2002 – August 2003)
Birds
0
1
2
3
4
5
6
7
Sep Oct Nov Dec Jan Feb Mar Apr May Jun Jul Aug
Month
# Fa
talit
ies
Bats
0
2
4
6
8
10
12
14
Sep Oct Nov Dec Jan Feb Mar Apr May Jun Jul Aug
Month
# Fa
talit
ies

Nine Canyon Avian and Bat Monitoring Report October 2003 26
Figure 8. Carcass removal rates by size class of trial carcasses.
0
10
20
30
40
50
60
70
80
90
100
1 2 3 4 7 10 14 20 30Trial Day
% R
emov
ed
largesmall

Nine Canyon Avian and Bat Monitoring Report October 2003 27
Figure 9. Distribution of distances (m) fatalities were observed from turbines.
Nine Canyon Avian and Bat Monitoring Report October 2003 28
end mid
0.0
0.5
1.0
1.5
2.0
2.5
fata
lity
rate
all birds
end mid
0.0
0.5
1.0
1.5
fata
lity
rate
bats
Figure 10. Observed fatality rates and 95% confidence intervals for all birds and bats at
end row and mid-row turbines.
Nine Canyon Avian and Bat Monitoring Report October 2003 29
A B C
0.0
0.5
1.0
1.5
fata
lity
rate
all birds
A B C
0.0
0.5
1.0
1.5
2.0
2.5
fata
lity
rate
bats
Figure 11. Observed fatality rates and 95% confidence intervals for all birds and bats at
strings A, B and C.

Nine Canyon Avian and Bat Monitoring Report October 2003 30
N Y
0.0
0.5
1.0
1.5
2.0
fata
lity
rate
passerines
N Y
0.0
0.5
1.0
1.5
fata
lity
rate
bats
Figure 12. Observed fatality rates and 95% confidence intervals for all birds and bats at lit
(Y) and unlit (N) turbines.
Nine Canyon Avian and Bat Monitoring Report October 2003 31
APPENDIX A NINE CANYON TECHNICAL ADVISORY COMMITTEE Voting Membership Primary Alternate Daniel Porter Energy Northwest PO Box 968 (MD-1035) Richland, WA 99352-0968 509-372-5531 [email protected]
David Kobus Energy Northwest PO Box 968 (Mail Drop 1035) Richland, WA 99352-0968 509-372-5087 [email protected]
Paul LaRiviere WDFW, Habitat Management 2620 North Commercial Avenue Pasco, WA 99301 509 545-2014 fax: 509 545-2229 [email protected]
Mike Livingston WDFW 2620 North Commercial Avenue Pasco, WA 99301 [email protected]
Skip Stonesifer US Fish & Wildlife Service 215 Melody Lane Suite 119 Wenatchee, WA 98801 509-665-3508 [email protected]
Richard Leaumont (LCBAS) 9016 Sunset Trail Pasco, WA 99301-1675 509-547-4815 [email protected]
Tom Clarke Lower Columbia Basin Audubon PO Box 1900 Richland, WA 99353 509-588-3362 [email protected]
Jan Blair 121 South Wamba Rd. Prosser, WA 99350 509-786-3411
Gail, Jeff or Jerry Blair
Wendell Bateman 6029 W. Quinalt Ave. Kennewick, WA 99336 509-783-2202 [email protected]
Pearl, Larry or Lynn Bateman

Nine Canyon Avian and Bat Monitoring Report October 2003 32
Distribution - Nine Canyon TAC Advisory Members Wally Erickson WEST, Inc. 2003 Central Ave. Cheyenne, WY 82001 307-634-1756 [email protected]
Karen Kronner Northwest Wildlife Consultants, Inc. 815 NW 4th St. Pendleton, OR 97801 541-278-2987 [email protected] Phillip Knudsen USFWS Law Enforcement 14852 NE 95th St. Redmond, WA 98052 425-883-8122 [email protected]
Michael Shuttleworth Benton County Planning Dept. PO Box 910, 1002 Dudley Ave. Prosser, WA 99350 509-786-5612 [email protected]
Bill LaFramboise Energy Northwest PO Box 968 (Mail Drop PE24) Richland, WA 99352-0968 509-377-4679 [email protected] Carl Van Hoff Energy Northwest PO Box 968 (Mail Drop PE05) Richland, WA 99352-0968 509-372-5565 [email protected]