Embed Size (px)
Citation preview

Multiagency Avian-Solar Collaborative Working Group:
Stakeholder Workshop
Welcome and Overview of Workshop Objectives
Dan Boff
U.S. Department of Energy
SunShot Initiative
May 10-11, 2016
Sacramento, California

energy.gov/sunshot energy.gov/sunshot
SunShot Initiative
SunShot Goal: 5 - 6¢/kWh without subsidy.
A 75% cost reduction by 2020. Pri
ce
SunShot

energy.gov/sunshot energy.gov/sunshot
The Falling Cost of Residential PV The Falling Cost of Commercial PV
The Falling Cost of Utility PV The Falling Cost of Concentrating Solar Power

energy.gov/sunshot energy.gov/sunshot energy.gov/sunshot
SunShot Program Structure
SunShot 2020 Goal

energy.gov/sunshot
Balance of Systems (Soft Costs)

Objectives of this Meeting
Bring together CWG members and stakeholders to:
Share information about the CWG objectives, scope, activities, and timeline
Provide a forum for stakeholders to provide comments relevant to the CWG efforts: – Concerns about avian-solar issues – Relevant existing data and studies – Understanding of avian-solar interactions – Focus of future research – Priorities for research needs – Future activities of the CWG
6 Multiagency CWG Stakeholder Workshop, May 2016

Agenda – Day 1
7
Time Slot Topic
9:30-10:00 Welcome & Workshop Objectives
10:00-10:30 Information About the Multiagency CWG
10:30-10:45 Break
10:45-11:00 Summary of Available Avian-Solar Information
11:00-12:30 Lunch
12:30-2:15 Ongoing Related Initiatives
2:15-2:30 Break
2:30-4:30 Break-out Discussions
4:30-5:00 Wrap Up
Multiagency CWG Stakeholder Workshop, May 2016

Agenda – Day 2
8
Time Slot Topic
9:00-9:15 Recap of Day 1
9:15-9:45 Conceptual Framework of Avian-Solar Interactions
9:45-10:15 Agency Management Questions & Related Research Needs
10:15-10:30 Break
10:30-12:30 Break-out Discussions
12:30-1:00 Wrap Up & Next Steps
Multiagency CWG Stakeholder Workshop, May 2016

Logistical Details
All handouts and presentations will be available on the CWG webpage: http://blmsolar.anl.gov/program/avian-solar/
If you want to continue to receive information about the CWG efforts, subscribe for email updates – Send request to [email protected]
Using the microphone ensures everyone can hear you
Identify yourself and your affiliation when you speak
Please mute or turn off cell phones
9 Multiagency CWG Stakeholder Workshop, May 2016

Information About the Multiagency Avian-Solar
Collaborative Working Group (CWG)
Greg Helseth
Bureau of Land Management
Multiagency CWG Stakeholder Workshop
May 10-11, 2016

Background
Avian-solar concerns that have emerged in the past 2-3 years present potential barriers to utility-scale solar development
Existing data are inadequate to define the magnitude and extent of potential avian impacts and causal factors
Research is underway by multiple parties, including federal and state agencies, industry, and academics
There is a growing consensus regarding the value of collaborating on defining research objectives and data needs, and on allocation of funding
11 Multiagency CWG Stakeholder Workshop, May 2016

Goal and Objectives
To develop better information to support future agency decisions regarding potential avian impacts at utility-scale solar facilities
OBJECTIVES
Establish collaborative working group among federal and state agencies
Develop multiagency avian-solar science plan – Document current and planned research activities – Identify cost implications and information gaps – Identify agency roles in funding and oversight – Develop feasible mitigation measures, if warranted
Prepare education and outreach materials
12 Multiagency CWG Stakeholder Workshop, May 2016

CWG Members
Representatives of federal and state agencies with relevant missions and/or project authorization responsibilities
Federal Agencies State Wildlife and Energy Agencies *
DOE Solar Energy Technologies Office
AZ Game and Fish Dept.
Bureau of Land Management CA Dept. Fish and Wildlife
U.S. Fish and Wildlife Service CA Energy Commission
U.S. Geological Survey NV Dept. Wildlife
DOI Solicitor’s Office
U.S. Department of Defense
* Other state energy agencies have been invited to participate
13 Multiagency CWG Stakeholder Workshop, May 2016

Scope and Organization of the CWG
Scope
Utility-scale solar technologies – All technologies – All facility components
Initial geographic focus: Arizona, California, and Nevada
Organization
CWG is led by a chair and co-chair
Technical support and facilitation is provided by Argonne National Laboratory and the National Renewable Energy Laboratory
14 Multiagency CWG Stakeholder Workshop, May 2016

CWG Tasks, Deliverables, and Timeline
Task Activities Milestone(s) / Deliverable(s)
1 Establish the CWG and conduct meetings
Formalize CWG. Conduct quarterly CWG and stakeholder meetings.
Establish CWG charter, quarterly CWG meetings, and stakeholder events
2 Develop an Avian-Solar Science Plan
Summarize current activities, information gaps, and research needs; consolidate data and mitigation measures/BMPs. Develop hypothesis-based science plan applicable to all solar technologies and sites.
Avian-solar science plan by end of Oct. 2016
3 Prepare education and outreach materials
Prepare fact sheets or news items to inform the public of CWG activities, avian-solar data, and clarify information.
At least two in FY16: Fact sheet News item Public webinar
15 Multiagency CWG Stakeholder Workshop, May 2016

January
• Recruited agency participation
• Held CWG kickoff meeting
February
• Finalized Charter
• Assembled existing information
March
• Published 1st fact sheet
• Launched CWG website
• Developed conceptual framework
April
• Finalized workshop agenda
• Developed CWG MQs
May
• Hold 1st public workshop
• Incorporate stakeholder input
• Finalize MQs & research needs
June
• Draft science plan
July-Oct
• Revise & finalize science plan
• Hold public workshop or webinar
• Release final public outreach publication
Timeline & Progress in 2016
Red – complete; Black - anticipated
CWG = collaborative working group, MQ = management question
16 Multiagency CWG Stakeholder Workshop, May 2016

Avian-Solar Science Plan
Kirk LaGory, Argonne National Laboratory
17 Multiagency CWG Stakeholder Workshop, May 2016
Purpose: Provide a consistent framework for research and monitoring of avian-solar interactions
Objectives
Define research questions and future research needs;
Support development of monitoring protocols, evaluation of avian risk, and development of effective mitigation measures;
Qualitatively discuss potential associated costs; and
Define agency roles and processes for implementation.

Elements of an Avian-Solar Science Plan
18 Multiagency CWG Stakeholder Workshop, May 2016
Executive Summary
Introduction – Describe current solar energy development and trends, observed
avian-solar interactions
– Describe objectives of the plan, desired outcomes, CWG
– Identify agency-specific management questions
Conceptual Framework of Avian-Solar Interactions – Provides framework for science plan
– Impacting factors
– Technology-specific impacts
– Direct, indirect, and cumulative effects
– Factors that contribute to risk, including location, seasonality, type of birds
– Local and population-level effects

Elements of an Avian-Solar Science Plan (Cont.)
19 Multiagency CWG Stakeholder Workshop, May 2016
Summary of Existing Information – High-level summary with focus on published DOE “rapid report” and
subsequent findings, technical reports, and communications with researchers
– Which portions of the conceptual model are best understood?
Information Gaps Related to Avian-Solar Interactions – Identify the information gaps that impede development of effective
avoidance, minimization, and mitigation strategies
– Which portions of the conceptual model are poorly understood?

Elements of an Avian-Solar Science Plan (Cont.)
20 Multiagency CWG Stakeholder Workshop, May 2016
Research and Monitoring Needs – Based on management questions, conceptual model, and information gaps,
identify research and monitoring that is needed to understand avian-solar interactions
– Identify priorities for research and monitoring activities based on relative risk to birds
Program Implementation – Identify best approaches to research and monitoring
– Agency roles
– Collaboration with ASWG and other stakeholders to ensure consistency and complementary activities
– Role of adaptive management
– Tiering from the plan
– Approximate costs of activities

Stakeholder Engagement
Agencies are seeking input from stakeholders on all matters relevant to the CWG objectives:
– Concerns about avian-solar issues – Relevant existing data and studies – Understanding of avian-solar interactions – Focus of future research – Priorities for research needs – Future activities of the CWG
Stakeholders can comment during this meeting and/or in writing following the workshop (target due date of June 1, 2016)
A stakeholder webinar will be hosted to present and take comments on the draft avian-solar science plan (late summer 2016)
For more information: – Subscribe for email updates: send request to [email protected] – CWG webpage: http://blmsolar.anl.gov/program/avian-solar/
21 Multiagency CWG Stakeholder Workshop, May 2016

QUESTIONS?
22 Multiagency CWG Stakeholder Workshop, May 2016

A Review of Avian Monitoring and Mitigation
Information at Existing Utility-Scale Solar Facilities
Lee Walston*, Katherine Rollins,
Karen Smith, and Kirk LaGory
Environmental Science Division
Argonne National Laboratory
Karin Sinclair, Craig Turchi,
Tim Wendelin, and Heidi Souder
National Renewable Energy Laboratory

24
What is Utility-Scale Solar Energy Development?
Multiagency CWG Stakeholder Workshop, May 2016
Large solar fields – 10+ megawatt (MW); requires 5-10 acres per MW
Three main technologies: 1) photovoltaic (PV) and concentrated solar power (CSP) technologies – 2) parabolic trough and 3) power tower
Desert Sunlight Solar Farm (PV)
• 550-MW project on over 4,000 acres of public land in southern California

25
What is Utility-Scale Solar Development? (cont’d)
Multiagency CWG Stakeholder Workshop, May 2016
250 MW Genesis Parabolic Trough Facility

26
What is Utility-Scale Solar Development? (cont’d)
Multiagency CWG Stakeholder Workshop, May 2016
Ivanpah Solar Energy Generation Station (SEGS)
3 Solar power towers (377 MW)
>3,400 acres of public land

27
>14 GW utility-scale solar capacity (in operation or under construction)
>1,200 facilities (>1 MW)
>50% of this electric capacity in southern CA, NV, and AZ.
Source: Walston et al. 2015
Utility-Scale Solar Energy Development in the U.S.
Multiagency CWG Stakeholder Workshop, May 2016

Avian Impacts of Solar Development
28
2 direct sources of solar-avian fatalities
– Collision-related: documented at solar projects of all technology types.
– Solar flux-related: resulting from the burning/singeing effects of exposure to concentrated sunlight. Observed only at facilities employing power tower technologies. Photo Credit: Robert Sullivan, Argonne National Laboratory
Multiagency CWG Stakeholder Workshop, May 2016

Factors that Affect Mortality Risk
29
Project location – Near aquatic/riparian areas, stopover sites, etc.
Project size
Project technology / design – PV vs CSP
– Evaporation ponds
– Ancillary infrastructure
Copper Mountain PV facility in southern Nevada. Example for the “lake effect” hypothesis. Photo Credit: Robert Sullivan, Argonne National Laboratory
Multiagency CWG Stakeholder Workshop, May 2016

“A Review of Avian Monitoring and Mitigation
Information at Existing Utility-Scale Solar Facilities”
30
Objectives: – Summarize avian fatality
issues at solar facilities
– Summarize current monitoring and reporting activities
– Evaluate mitigation measures and BMPs used for other industries
– Examine solar technology-specific aspects of avian fatality
– Identify information gaps and next steps
Multiagency CWG Stakeholder Workshop, May 2016

31
Avian Fatality Information at Solar Facilities (updated)
16 Facilities with available avian monitoring information.
Collection of avian fatality information:
– Incidental or unknown survey effort at 6 facilities
– Systematic survey effort at 10 facilities
Multiagency CWG Stakeholder Workshop, May 2016

Avian Monitoring at Solar Facilities
32
Fatality monitoring (and reporting) at very few solar facilities
– Not required at all facilities
Differences in monitoring designs and survey effort
– Affects the ability to compare and integrate data
Systematic vs. incidental fatality information
– Systematic information allows hypothesis testing
– Incidental observations may still be useful in understanding patterns of fatalities
Barn swallow with singed feathers observed at the California Solar One demonstration facility (Source: McCrary et al. 1986).
Multiagency CWG Stakeholder Workshop, May 2016
Avian Monitoring at Solar Facilities, Cont’d
33
Variation in factors influencing mortality rate estimation and evaluation
– Search effort and searcher efficiency
– Feather spots
– Predation and scavenging • Potential for predators to influence mortality rates by transporting carcasses to the
project footprint from offsite locations
– Background mortality • Mortality estimates at some solar facilities include adjustments for background mortality
Multiagency CWG Stakeholder Workshop, May 2016

Conclusions & Recommendations
34
Avian monitoring – Not all utility-scale solar facilities are required to prepare and comply with
project-specific avian monitoring protocols
Existing avian fatality data – Standardization is important for integration and comparison
Flux-related factors (power tower technologies) – Various approaches to heliostat standby aiming could significantly reduce
flux levels and their impact on avian fatality
Better collaboration among agencies, industry, and stakeholders to (1) collect scientifically rigorous and comparable data; (2) identify research priorities; and (3) identify appropriate mitigation measures.
Multiagency CWG Stakeholder Workshop, May 2016

Questions?
35 Multiagency CWG Stakeholder Workshop, May 2016
Photo Credit: http://cleaneasyenergy.com/

Presentations on Ongoing Related Initiatives
1. Tom Dietsch – U.S. Fish and Wildlife Service 2. Mona Kahlil – U.S. Geological Survey 3. Avian Solar Work Group Representatives: Julie Falkner, Defenders of Wildlife and Laura Abram, First Solar 4. Tim Wendelin – National Renewable Energy Laboratory (NREL) 5. Elise DeGeorge - NREL

Update on Solar-Avian Interactions in Southern California
Thomas Dietsch Migratory Bird Division US Fish and Wildlife Service CWG Public Meeting Sacramento, CA May 10, 2016
1

2
Objectives for Presentation • Provide a review of solar-avian
interactions in Southern California
• Discuss hypotheses for avian interactions
• Provide update on actions being taken

Avian Impacts
3
Direct Effects: Collisions

Collisions with panels are common
4

Concentrated Solar Technologies
Direct Effects
Solar Flux (power tower)
5

Cause of Death from National Fish and Wildlife Forensics Lab Report (Kagan et al. 2014)
6 From 3 solar projects, 233 carcasses from 71 species.

7
Data for Today’s Presentation • Mortality monitoring and reporting is required
by lead agencies on many projects.
• Data from 7 projects in Southern California (4 Photovoltaic, 2 Solar Trough, 1 Power Tower)
• Data reported from 2012-April 2016.
• Each species was categorized by habitat, migratory group, and foraging guild.

Caveats on Solar Avian Mortality data
• Data are from a mix of incidental reports and systematic surveys on several projects.
• Magnitude of mortalities are not reported here. • Only projects in Southern California are included
in this presentation. • Data can provide information on which species
or taxonomic groups may be at risk. • Project features and types of injuries also
indicated.
8

Initial Findings • National Fish and Wildlife Forensics Lab Report (Kagan
et al. 2014) – “Significant Bat and Insect Mortality, including Monarch
Butterflies”.
• 3545 mortalities from 183 species (2012-April 2016) – Only mortalities found and reported included, no estimation. – Mix of reports from incidental finds and systematic surveys. – Many mortalities occur due to dehydration/heat stress after initial
injury/stranding.
• Birds of Conservation Concern
9

Species of Concern • Federal Endangered/Threatened
– Yuma Ridgeway’s (Clapper) Rail – Willow Flycatcher – Yellow-billed Cuckoo
• State-listed/Fully Protected – Peregrine Falcon – Bank Swallow
• 19 Birds of Conservation Concern – Western Grebe – Horned and Eared Grebes – American White Pelican – Burrowing Owl – Calliope Hummingbird
10

Hypotheses • Mortalities represent background mortality.
• Mortalities occur during normal bird movements (Anthropogenic, no landscape-scale attraction).
• Polarized light may attract birds and insects to solar projects in the Mojave Desert (Horvath et al. 2009).
• Other resources attract birds to solar projects (Insects and Ponds).
11

Habitat/Migratory Status of Birds found injured on Solar Projects
12
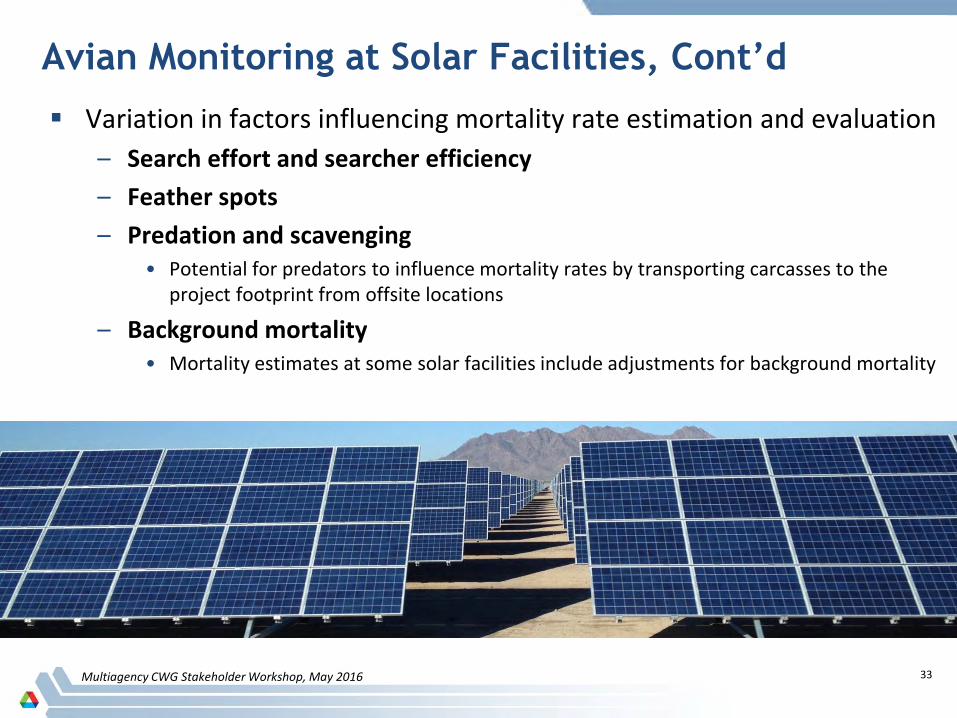
Regional Differences for Photovoltaic
13

Solar Project Features Associated with Mortalities
14

Foraging Guilds of Birds with Solar Flux Injuries
15
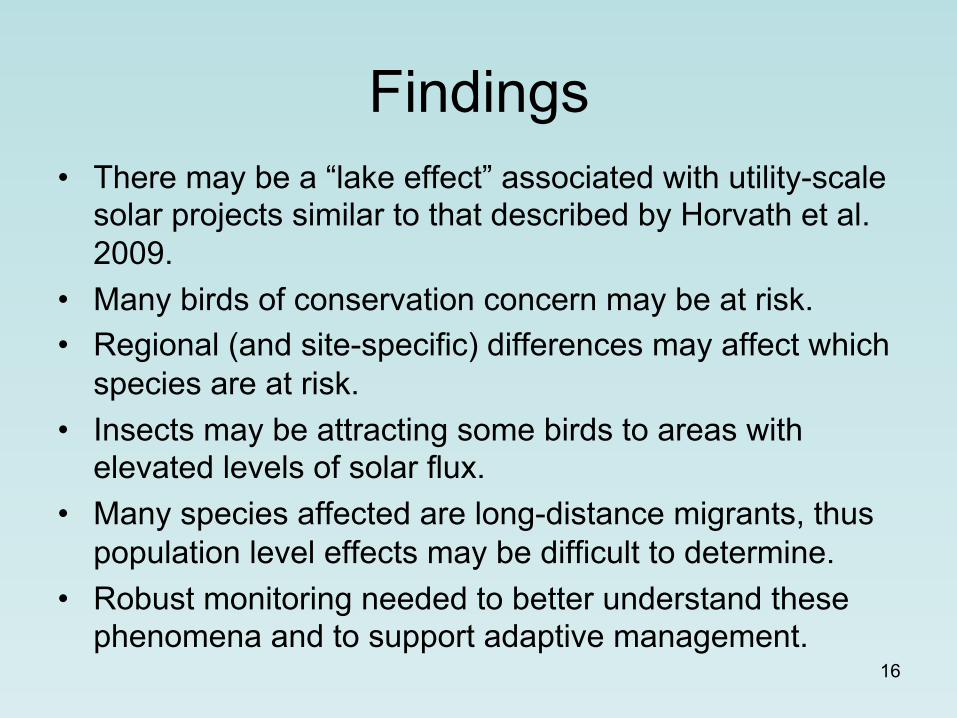
Findings • There may be a “lake effect” associated with utility-scale
solar projects similar to that described by Horvath et al. 2009.
• Many birds of conservation concern may be at risk. • Regional (and site-specific) differences may affect which
species are at risk. • Insects may be attracting some birds to areas with
elevated levels of solar flux. • Many species affected are long-distance migrants, thus
population level effects may be difficult to determine. • Robust monitoring needed to better understand these
phenomena and to support adaptive management. 16

• Estimate the total number of birds and bats killed at a facility within a specified time period.
• Determine whether there are spatial or temporal/seasonal patterns of total bird fatality.
• Evaluate species composition and which taxonomic groups may be at risk.
• Provide results that allow comparisons with other solar sites and to evaluate changes in fatality due to adaptive management.
17
Mortality Monitoring Objectives

Research Needs • Project-scale information needs • Mojave and Sonoran Desert Migratory Pathways • Migratory Connectivity Research to identify populations
affected – Populations affected may be distant from the source of mortalities – Stable Isotopes (USGS) – Genotypes (UCLA) – Telemetry of appropriate-sized birds
• Avian Behavior related to projects – Perception and Settling Response – Technological Fixes
• Identify Best Management Practices and Deterrent Methods 18

Update on actions being taken • Working with solar industry to implement robust mortality
monitoring. – Searcher Efficiency and Carcass Persistence Trials.
• Solar Bird and Bat Conservation Strategy Guidelines in development. – Public meeting on June 22nd in Sacramento.
• Collaborated with USGS to develop Mortality Monitoring Protocols for Solar – Protocols for monitoring at each technology type.
• Coordinating with other agencies to find ways to avoid and minimize avian mortalities.
• Coordinating with Avian Solar Working Group (industry and other stakeholders)
• Supporting ongoing research efforts by USGS and UCLA
19

Questions?
20

Research to Address Wildlife Interactions with Solar Energy
Facilities
Avian-Solar Collaborative Working Group
May 10, 2016
USGS Ecosystems Mission Area

U.S. Geological Survey
Provide the scientific information required for sound natural resource management and conservation decisions
Water
Natural Hazards Energy and Minerals
Climate and Land Use Change Environmental Health
Core Science Systems
Ecosystems

USGS Ecosystems Mission Area 17 Science Centers
+ 40 Cooperative Research Units
FRESC
WERC Patuxent
SBSC
NOROCK
FORT
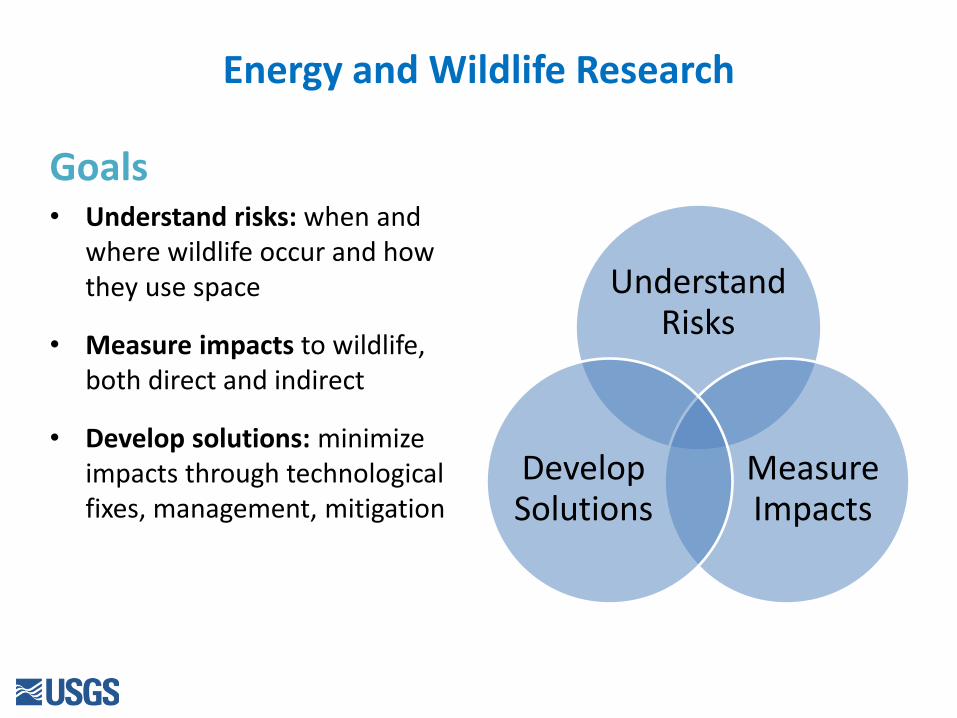
Energy and Wildlife Research
Goals • Understand risks: when and
where wildlife occur and how they use space
• Measure impacts to wildlife, both direct and indirect
• Develop solutions: minimize impacts through technological fixes, management, mitigation
Understand Risks
Measure Impacts
Develop Solutions
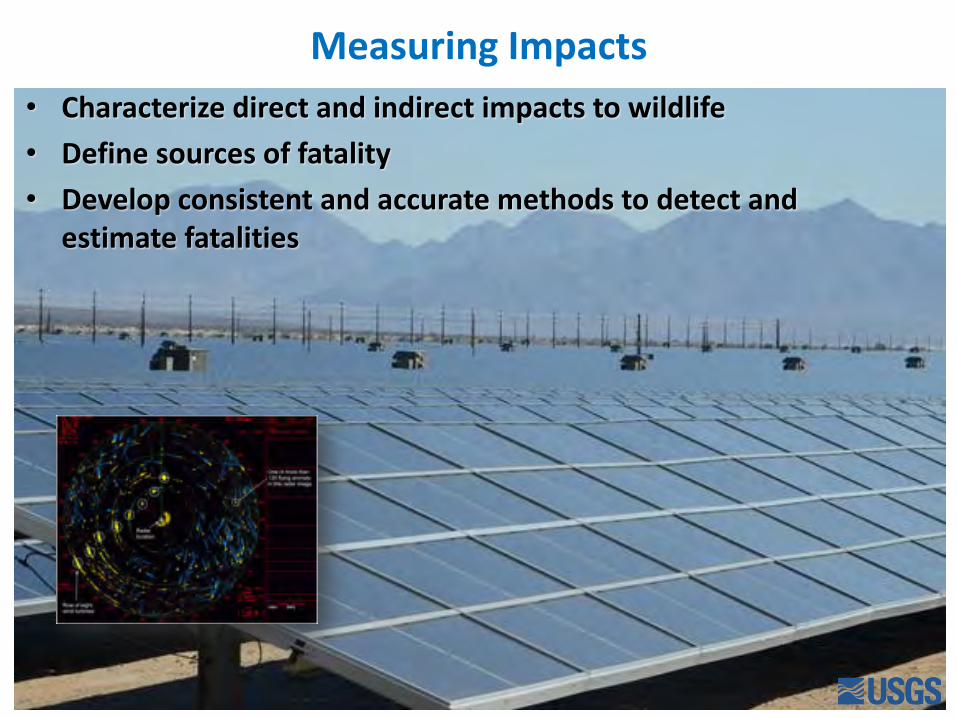
Measuring Impacts • Characterize direct and indirect impacts to wildlife • Define sources of fatality • Develop consistent and accurate methods to detect and
estimate fatalities

Objective: • Evaluate efficacy of monitoring technologies to
detect birds, bats, and insects flying in the vicinity of flux fields produced at the ISEGS
• Tested technologies concurrently (portable radar, surveillance video, thermal video). Also performed invertebrate sampling
• Monitoring period covered ~20 days in May and September 2014 during bird migration season
• Developing data handling and analysis software (presence/absence, speed, direction, abundance)
PIs: Robb Diehl (NRMSC), Paul Cryan & Ernie Valdez (FORT) Status: In review. Full data release will accompany publication
Efficacy of Wildlife Monitoring Technologies at the Ivanpah Solar Electric Generating System
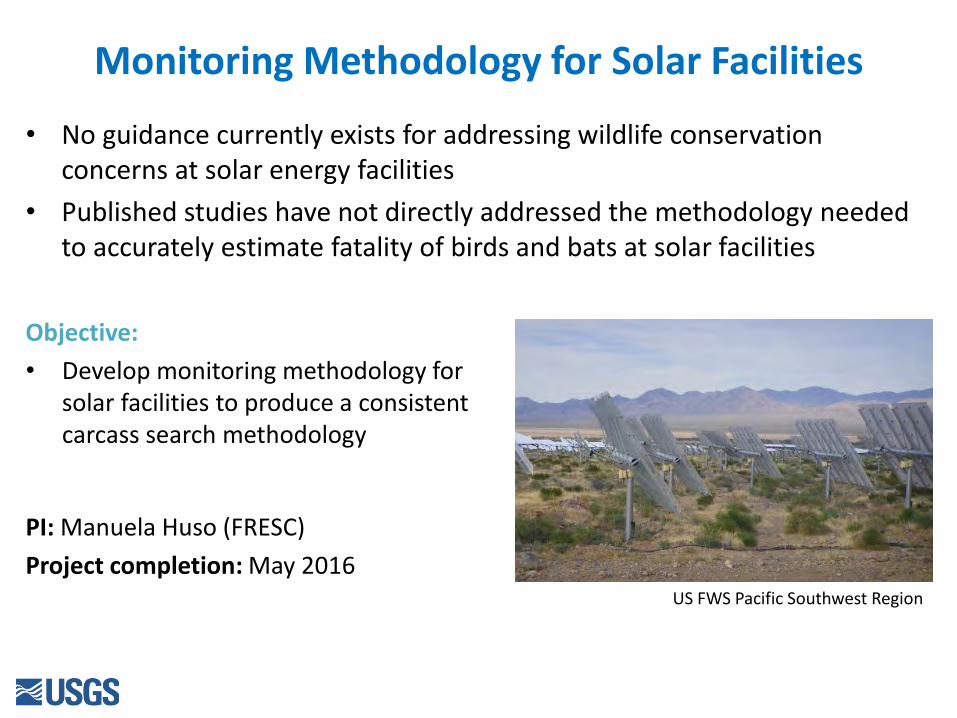
Monitoring Methodology for Solar Facilities
• No guidance currently exists for addressing wildlife conservation concerns at solar energy facilities
• Published studies have not directly addressed the methodology needed to accurately estimate fatality of birds and bats at solar facilities
Objective: • Develop monitoring methodology for
solar facilities to produce a consistent carcass search methodology
PI: Manuela Huso (FRESC) Project completion: May 2016
NASA US FWS Pacific Southwest Region

Solar Fatality Estimator and “Evidence of Absence” Software
Need consistent and accurate methods to detect and estimate fatalities from carcass searches at solar facilities Objective: • Modify existing software to produce
unbiased estimates of fatalities at utility-scale solar facilities and “Evidence of Absence” software for rare species
• Define sources of fatality
• Estimate searcher efficiency and carcass persistence
• Determine when thresholds have likely been exceeded and mitigation might be considered
PI: Manuela Huso (FRESC) Anticipated completion: April 2017
Ivanpah Solar Electric Generating System
Golden eagle at wind farm in CA. Credit: Jeff Lovich

Assess Energy Development Impacts to Sensitive Bird and Bat Species and Populations
Need to more accurately estimate fatality rates and effectiveness of mitigation techniques
Project Objective: • Estimate geographic scope of species
impacted • Use demographic modeling to assess how
fatalities affect population increases or declines
• Determine best practices for conducting risk assessments and predicting mitigation outcomes
PI: Todd Katzner (FRESC) Project period: 2015-2018
NASA

• Occurrence, population status, demography
• Habitat and prey availability
• Monitoring and analysis
• Mitigation and adaptive management
Understanding Risks
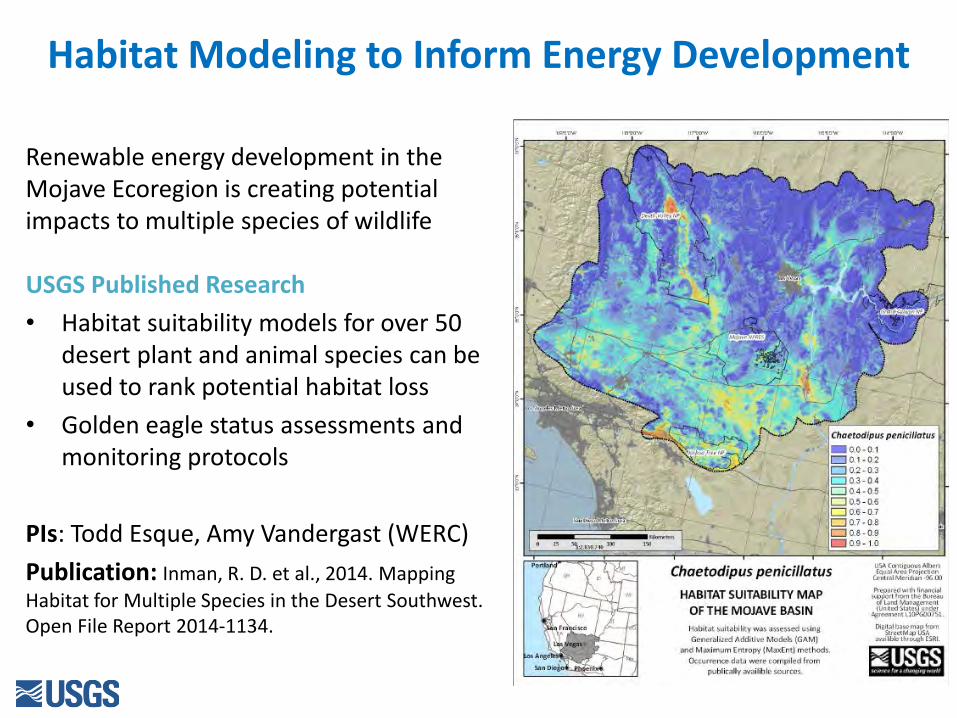
Habitat Modeling to Inform Energy Development
USGS Published Research • Habitat suitability models for over 50
desert plant and animal species can be used to rank potential habitat loss
• Golden eagle status assessments and monitoring protocols
PIs: Todd Esque, Amy Vandergast (WERC) Publication: Inman, R. D. et al., 2014. Mapping Habitat for Multiple Species in the Desert Southwest. Open File Report 2014-1134.
Renewable energy development in the Mojave Ecoregion is creating potential impacts to multiple species of wildlife

Linking Habitat and Prey Availability to Golden Eagle Ecology and Solar Energy in the Mojave
Inform energy and land-use planning ; assist with delineating conservation and development zones Objectives:
• Assess food habits, reproductive success and prey availability of nesting golden eagles in the Mojave
• Synthesize and review rabbit distribution and abundance in the Western US
• Develop a regional prey database for rabbit populations across 17 western states
PIs: Kathleen Longshore & Todd Esque (WERC)
Product completion: Spring/Summer 2016
Kathy Longshore
Golden Eagle. Credit: USFWS

Surveying and Monitoring Golden Eagles and Other Raptors in the DRECP Area
Effective surveys for eagles and status monitoring and mapping are needed to meet DRECP objectives Objective: • Develop survey designs and field procedures
to determine the distribution of golden eagles • Assess their occurrence and nesting success in
the DRECP area • Compile and analyze eagle population data for
CA & NV, and the larger context of their full migratory range into a geospatial database
PI: David Wiens (FRESC) Project Completion: Summer 2016

Helping Inform Siting Decisions What are regional golden eagle nesting and foraging behaviors that
may lead to eagle – infrastructure interactions?
Jeff A. Tracey, USGS
Objectives:
• Population surveys, biotelemetry and genetics
• Focus on occupancy and movement
• Abundance and survival in relation to prey dynamics
• Regional understanding
PIs: Jeff Tracey & Robert Fisher (WERC)
Products: Biotelemetry data for 24 eagles released May 2016
Needs and Future Directions
• Expand research on wildlife interactions with large scale solar power facilities
• Understand direct and indirect effects on species and landscapes
• Expand knowledge of where species are on the landscape • Continue efforts to develop deterrents to minimize
interactions of wildlife with facilities and effective mitigation strategies

USGS Energy and Wildlife Contacts
Mona Khalil Energy & Wildlife Specialist Ecosystems Mission Area
U.S. Geological Survey (703) 648-6499 [email protected]
Todd Esque
Research Ecologist Western Ecological Research Center
(702) 564-4506 [email protected]
Manuela Huso
Biological Statistician Forest and Rangeland Ecosystem
Science Center (541) 750-0948

Recent USGS Publications of Relevance to Solar Energy Development
• Braham, M.E., Miller, T.A., Duerr, A., Lanzone, M., Fesnock, A., Lapre, L., Driscoll, D., Katzner, T.E., 2015, Home in the heat- Dramatic seasonal variation in home range of desert golden eagles informs management for renewable energy development. DOI- 10.1016/j.biocon.2015.03.020: Biological Conservation, v. 186, p. 225-232.
• Duerr, A., Miller, T.A., Duerr, K.C., Lanzone, M., Fesnock, A., Katzner, T.E., 2015, Landscape-scale distribution and density of raptor populations wintering in anthropogenic-dominated desert landscapes. DOI- 10.1007/s10531-015-0916-6: Biodiversity and Conservation, v. 24, no. 10, p. 2365-2381.
• Simes, M.T., K.M. Longshore, K.E. Nussear, G.L. Beatty, D.E. Brown, and T.C. Esque, 2015, Black-tailed and white tailed jackrabbits in the American West: History, ecology, significance, and survey methods. Submitted to Western North American Naturalist 75(4):491-521. DOI: 10.3398/064.075.0406
• Simes, M.T., K.M. Longshore, K.E. Nussear, G.L. Beatty, D.E. Brown, and T.C. Esque. In Review. An annotated bibliography for the black-tailed jackrabbit (Lepus californicus) and white-tailed jackrabbit (Lepus townsendii). Prepared and submitted as a USGS Open-File Report
• Dilts, T. E., Weisberg, P. J., Leitner, P., Matocq, M. D., Inman, R. D., Nussear, K. E. and Esque, T. C. (2016), Multi-scale connectivity and graph theory highlight critical areas for conservation under climate change. Ecol Appl. Accepted Author Manuscript. doi:10.1890/15-0925
• Tracey, J.A., Madden, M.C., Sebes, J.B., Bloom, P.H., Katzner, T.E., and Fisher, R.N., 2016, Biotelemetry data for golden eagles (Aquila chrysaetos) captured in coastal southern California, November 2014–February 2016: U.S. Geological Survey Data Series 994, 32 p., http://dx.doi.org/10.3133/ds994.

ASWG Mission
The ASWG is a collaborative group of environmental organizations, academics, solar companies, and solar industry representatives that will advance coordinated scientific research to better understand how birds interact with solar facilities. Given the threat that climate change poses to avian species, participants will work with the shared interests of protecting avian species and developing solar projects in an environmentally responsible and a commercially viable manner.

Participants and Roles • Convener: Large-scale Solar Association • Facilitation team: Pivot Point • Decision-making members:
– Audubon California – Defenders of Wildlife – Duke Energy – First Solar – Large-scale Solar Association – Natural Resources Defense Counsel – NextEra Energy Resources – Recurrent Energy – SunEdison – SunPower

Progress to Date
January
• ASWG meeting with Research Panel (1/13)
• Finalizing Terms of Reference
• Multiagency CWG meeting
February
• Research panel works independently
• ASWG call with research panel
March
• ASWG meeting
• Progress report on Research Panel from Science Advisors
April
• Research Panel develops draft report
2016
Ongoing Engagement with Multiagency Avian-Solar Collaborative Working Group

ASWG Next Steps
May
•Multiagency CWG meeting (Week of 5/9)
• Research panel shares draft report with ASWG
June
•ASWG meeting with research panel (6/1-2)
•ASWG discussion of priorities
July-August
•ASWG and agency observers to meet to discuss final report
• Finalize priorities after agency input
2016
Ongoing Engagement with Multiagency Avian-Solar Collaborative Working Group

Research Panelists Science Advisors
Thomas Smith UCLA Director, Center for Tropical Research
Kristen Ruegg UCLA / UCSC Institute for the Environment and Sustainability, Center for Tropical Research
Research Panelists
Steve Beissinger UC Berkeley Professor of Conservation Biology
Wally Erickson WEST Consulting CEO / Senior Statistician
Vasilis Fthenakis Brookhaven National Lab Principal Investigator
Luke George Colorado State University Senior Research Associate
Rodney Siegel Institute for Bird Populations Executive Director

ASWG Research Questions I. Siting 1) Do avian mortality rates at PV solar power plants differ from background rates at control sites? 2) What is the relationship of mortality rates to site characteristics (e.g., panels, fence lines, overhead transmission lines, scale/configuration of installations, proximity to other solar facilities or other natural or human landscape features such as levels of fragmentation and loss of habitat, migratory flyways and stop over sites, etc.)? 3) How might siting be optimized to reduce potential impacts on vulnerable bird populations in a cost-effective manner?

ASWG Research Questions II. Population level effects 1) Are solar sites causing avian mortality that is significant at the scale of the population for individual species? a) How should populations be defined in this context? b) What research and data would be required to determine if mortality associated with solar sites is additive or compensatory? c) How do population impacts differ by species, guild, migratory pathway, taxonomic unit and classification (threatened versus non-threatened), etc.?

ASWG Research Questions III. Lake Effect 1) Are water or other birds attracted to solar panels because they
perceive them as water bodies (i.e., a “Lake Effect”)? 2) Is a possible Lake Effect related to geographic and
environmental/infrastructure characteristics of sites? 3) Do birds show evidence of attraction to large solar arrays (e.g. show
changes in flight direction or behavior as they approach arrays)? 4) What types of birds are affected? 5) Is possible mortality due to stranding, strikes or some other process? 6) If the Lake Effect is demonstrated, what cues are causing the birds to
mistake the solar array as a water body (e.g., what wavelength of reflected light are they responding to)?
7) If a Lake Effect can be demonstrated, how might the threat be mitigated or eliminated?

ASWG Research Questions IV. Avian attraction/mitigation/deterrents 1) What are the avian risk-reduction options that might lower avian mortality? V. Feather spots 1) What do feather spots represent? Can feather spots be better defined and quantified? a) What methods can be used to identify the species and number of individuals that comprise feather spots? Are feather spots a reliable indicator of avian strikes and/or fatalities. b) Do feather spots from larger carcasses persist in the environment longer than spots from smaller ones?

ASWG Research Questions VI. Climate change and other broader impacts 1) What demographic effects may result from climate change in the absence of large-scale solar development, and how do these compare with the impacts of solar facilities for specific bird populations? 2) Using historical and contemporary data on the abundance and distribution of avian species with future climate projections, what are the predictions for the future avian distribution and population trends in California? a) How can this be used to mitigate the impacts of PV facilities?

Achieving Mutual Goals
• Understanding common research interests • Identifying key priorities • Identifying funding mechanisms • Continued collaboration to drive short and
long term results

NREL is a national laboratory of the U.S. Department of Energy, Office of Energy Efficiency and Renewable Energy, operated by the Alliance for Sustainable Energy, LLC.
Development of Tools, Training, and
Outreach to Address Solar Glare and Flux-Related Avian Impacts
Multiagency Avian-Solar Collaborative Working Group Public Workshop
Timothy Wendelin National Renewable Energy Laboratory
Clifford K. Ho Sandia National Laboratories
Cianin Sims
Sims Industries
May 10, 2016

2
Goals • DOE is funding work to address
avian flux hazards o Develop models and tools to
quantify flux (power/unit area) from heliostat aiming strategies
o Mitigate impacts of avian (and glare) hazards
o Optimize operational performance
2.5
2.5
2.5
2.5
2.52.5
2.5
2.5
2.5
2.5
2.5 2.5
2.5
2.5 2.5
5
5
5
5
5
5
5
5
5 5
5
10
10
10
10
25
50
Distance North (m)
Z(m
)
-400 -300 -200 -100 0 100 200 300 400
50
100
150
200
250
300FLUX (KW/M2)
15050251052.5
View From the East - Full Standby - Centerline Aiming
Photo and model of high-flux regions causing solar glare and avian hazards at Ivanpah Solar Electric Generating System
5 5
5
10
10
10
10
10
50 50
100
100150
Distance East (m)
Dis
tanc
eN
orth
(m)
-400 -300 -200 -100 0 100 200 300 400-400
-300
-200
-100
0
100
200
300
400
Max Flux (kW/m2)
150100501052.5
View From Above - Full Load - Image Priority Aiming
~130 m

3
Previous Work
2.5
2.5
2.5
2.5
2.52.5
2.5
2.5
2.5
2.5
2.5 2.5
2.5
2.5 2.5
5
5
5
5
5
5
5
5
5 5
5
10
10
10
10
25
50
Distance North (m)
Z(m
)
-400 -300 -200 -100 0 100 200 300 400
50
100
150
200
250
300FLUX (KW/M2)
15050251052.5
View From the East - Full Standby - Centerline Aiming
5 5
5
10
10
10
10
10
50 50
100
100150
Distance East (m)
Dis
tanc
eN
orth
(m)
-400 -300 -200 -100 0 100 200 300 400-400
-300
-200
-100
0
100
200
300
400
Max Flux (kW/m2)
150100501052.5
View From Above - Full Load - Image Priority Aiming
~130 m
• Argonne/NREL Study “A Summary Review of Issues Related to Avian Mortality at Utility-Scale Solar Facilities” o Preliminary results compare well with previous analyses o Various approaches to standby aiming can significantly reduce flux levels
and their impact on avian mortality. o Future work recommended to determine the impact of alternative aiming
strategies which simultaneously minimize impacts to plant operations and avian health.
4
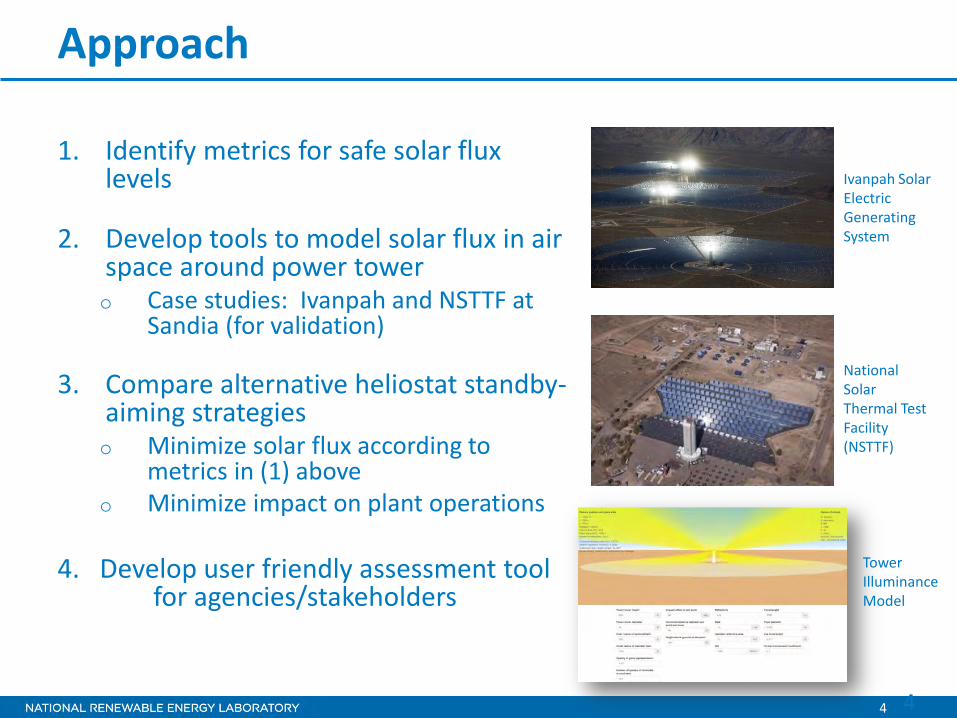
Approach
1. Identify metrics for safe solar flux levels
2. Develop tools to model solar flux in air space around power tower o Case studies: Ivanpah and NSTTF at
Sandia (for validation)
3. Compare alternative heliostat standby-aiming strategies o Minimize solar flux according to
metrics in (1) above o Minimize impact on plant operations
4. Develop user friendly assessment tool for agencies/stakeholders
4
Tower Illuminance Model
Ivanpah Solar Electric Generating System
National Solar Thermal Test Facility (NSTTF)

5
Solar Energy Development Center (Negev Desert, Southern Israel)
• Tests conducted with bird carcasses exposed to different flux levels (Santolo, 2012) o “no observable effects on feathers
or tissue were found in test birds where solar flux was below 50 kW/m2 with exposure times of up to 30 seconds.”
o California Energy Commission analytical study found that “a threshold of safe exposure does not exist above a solar flux density of 4 kW/m2 for a one-minute exposure”

6
Crescent Dunes (SolarReserve) (Tonopah, Nevada)
• 110 MWe molten-salt power tower
• In January 2015, 3,000 heliostats were aimed at standby points above receiver o 115 bird deaths in 4 hours o SolarReserve spread the
aim points to reduce peak flux to < 4 kW/m2
– Reported zero bird fatalities in months following change
6
Images from http://cleantechnica.com

7
Ivanpah Solar Electric Generating System (Ivanpah, California)
• 390 MWe direct steam power-tower plant (3 towers)
• Kagan et al. (2014) found 141 bird fatalities Oct 21 – 24, 2013 o 33% caused by solar flux o 67% caused by collisions or
predation • H.T. Harvey and Associates found
703 bird fatalities in first year at ISEGS o Study estimated 3500 bird
fatalities accounting for search efficiency and scavengers removing carcasses
• ISEGS has since implemented new heliostat aiming strategies and bird deterrents
7
Ryan Goerl, NRG
H.T. Harvey and Associates, 2013 - 2014

8
Gemasolar Thermosolar Plant (Andalusia, Spain)
8
• 20 MWe molten-salt power tower plant
• 14-month study revealed no avian fatalities in vicinity of tower (Dept. of Zoology, U. Granada)

9
Levelized Avian Mortality for Energy (LAME)
9
0
1
2
3
4
5
6
Fossil Fuels* NuclearPower*
WindEnergy*
CSP(Ivanpah)**
Leve
lized
Avi
an M
orta
lity
(fata
litie
s/G
Wh)
*Sovacool (2009) **During first year of operation at Ivanpah (2013 – 2014) before mitigation measures and deterrents were implemented

10
Feasibility of Bird Vaporization
10
0.1
1
10
100
0.1 1 10 100 1000
Min
imum
Irra
dian
ce R
equi
red
to V
apor
ize a
Pr
escr
ibed
Mas
s of W
ater
(MW
/m2 )
Mass (g)
Yellow-Rumped Warbler(~12 g)
Mourning Dove(~130 g)
Common Raven(~700 - 2000 g)
Hummingbird(~2 - 5 g)
House Finch(~20 - 30 g)
Dragonfly(~0.003 - 3 g)
Peak Receiver Flux at Ivanpah (600 kW/m2 or 0.6 MW/m2)
2 - 3 second exposure during free-fall through beam (height of the receiver = 22 m)
10 second exposure

11
Deterrents
• Acoustic o Painful or predatory sounds
• Visual o Intense lights and decoys
• Tactile o Bird spikes, anti-perching devices
• Chemosensory o Grape-flavored powder drinks (methyl anthranilate)
11

12
Conclusions from prior studies
• The large number of “streamers,” or smoke plumes, observed and attributed to vaporization of birds is likely caused by insects flying into the concentrated flux
• Complete vaporization of birds flying into concentrated solar flux is highly improbable
• Safe irradiance levels for birds have been reported to range from 4 kW/m2 to 50 kW/m2
• Mitigation measures and bird deterrents can and are being used

13
Flux Hazard Analysis
o Create computer model of baseline power tower design (Ivanpah Unit #2) in SolarPILOT / SolTrace. o Heliostat geometry, positions
and tower height from NRG.
o Create computer model of National Solar Thermal Test Facility in SolarPILOT / SolTrace. o Validate model using flux
measurement tools

14
Flux Hazard Analysis
o Obtain/establish relevant information/parametric data from industry/stakeholder workshop o Baseline/novel aiming
strategies. o Heliostat control
capabilities (slew rates, aiming algorithms/capabilities)
o Metrics for safe solar flux levels (Ihaz, V > Ihaz)
o Performance metrics
15
Flux Hazard Analysis
o Apply methodology to Ivanpah and NSTTF fields for analyzing baseline and alternative cases for standby conditions. o Generate volumetric flux maps for standby aim-point strategies for representative
times and days of the year. o For representative flight paths through the volume, perform worse case thermal
analysis to determine whether surface (feather) temperature exceeds 160o C along given flight path.
o Consider number of flight paths exceeding 160oC or the total time of exceedance as
metrics to determine the effectiveness of different stand-by aiming strategies.

16
Flux Hazard Analysis
o Evaluate successful aiming strategies for impact on annual performance o Quantify time from standby to
operational for representative days of the year and for both baseline and alternative standby aiming strategies.
o Quantify annual performance impact of alternative vs baseline cases with the goal of achieving zero loss of annual energy delivered.
o Provide both input and output data
from methodology for validation of the enhanced Tower Illuminance Model (TIM)

NREL is a national laboratory of the U.S. Department of Energy, Office of Energy Efficiency and Renewable Energy, operated by the Alliance for Sustainable Energy, LLC.
Wind Energy/Wildlife Interactions: Overview of the Challenges and Current Efforts to Address Them
Elise DeGeorge, NREL
May 11, 2016

2
Outline
2
• Historical overview and statutory authority
• Challenges to wildlife • Key species habitat distribution • Research • Collaboratives • Conclusions
Red-tailed hawk eating a rabbit. Photo by Dennis Schroeder, NREL 22325

3
Outline
3
• Historical overview and statutory authority
• Challenges to wildlife • Key species habitat distribution • Research • Collaboratives • Conclusions
Photo by J. Lucas, Purdue University

4
Wind Installed Capacity over Time
4 Source: 2012 Wind Technologies Market Report

5
Induction Generator
1st Variable Speed Turbine
Wound Rotor With Power Converter
1st Full Power AC-DC-AC Converters & Direct Drive

6
Wind Turbines May Impact Wildlife & Habitats
The discussion of wind turbine impact on wildlife began at the Altamont Wind Resource Area, California, in the late 1980s and early 1990s
Junction Hill Top Wind Farm, Iowa. Five GE 1.6-megawatt (MW) turbines. Photo by Tom Wind, NREL 26494
Altamont Pass Wind Resource Area, California. Kenetech 56-100 kilowatt (kW) turbines. Photo by Shawn Smallwood, NREL 17329

7
Real or Perceived Wildlife Impacts can be a Challenge for Development • Misinformation on potential of
impacts is rampant • Impacts are species- and habitat-
specific • Impacts are site-specific;
micrositing is critical to reducing these impacts.
Eight Nordex N60, 1,300-kW wind turbines in Garrett, Pennsylvania. Photo by Green Mountain Energy Company, NREL 09699
Combination of 221 Mitsubishi Heavy Industries 1-MW turbines and 53 GE 1.5-MW turbines at the Cedar Creek Wind Farm in Grover, Colorado. Photo by Dennis Schroeder, NREL 30593

8
Bird Mortality at U.S. Wind Sites
Bat Mortality at U.S. Wind Sites
Source: NWCC Wind Turbine Interactions with Birds, Bats and their Habitats, 2010 www.nationalwind.org
The average is about three birds/MW/year
The average is about eight bats/MW/year
9
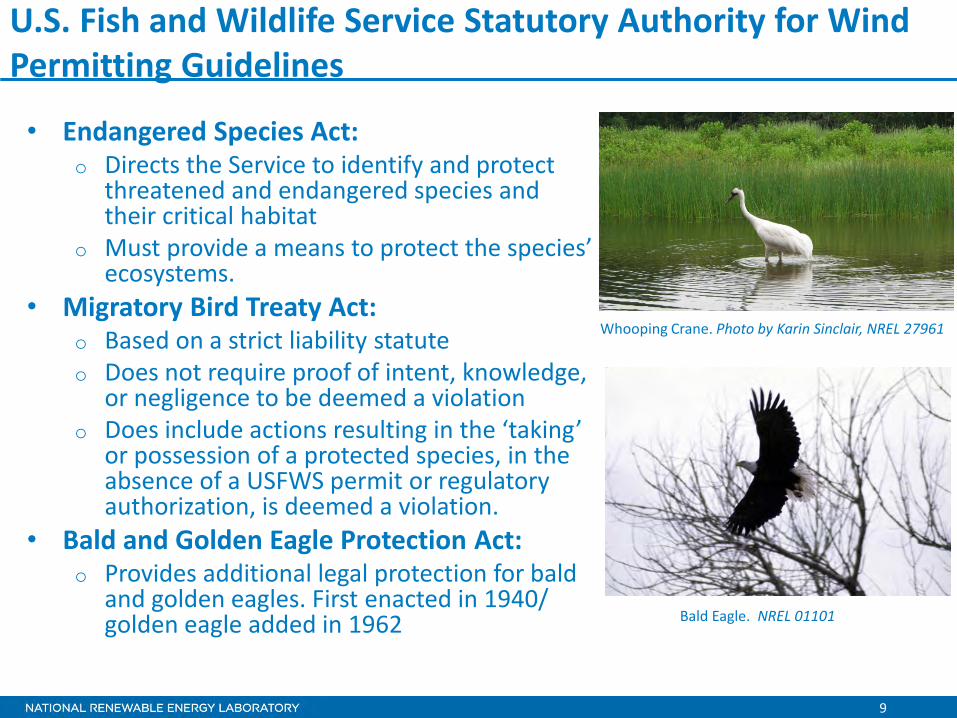
U.S. Fish and Wildlife Service Statutory Authority for Wind Permitting Guidelines
• Endangered Species Act: o Directs the Service to identify and protect
threatened and endangered species and their critical habitat
o Must provide a means to protect the species’ ecosystems.
• Migratory Bird Treaty Act: o Based on a strict liability statute o Does not require proof of intent, knowledge,
or negligence to be deemed a violation o Does include actions resulting in the ‘taking’
or possession of a protected species, in the absence of a USFWS permit or regulatory authorization, is deemed a violation.
• Bald and Golden Eagle Protection Act: o Provides additional legal protection for bald
and golden eagles. First enacted in 1940/ golden eagle added in 1962
Bald Eagle. NREL 01101
Whooping Crane. Photo by Karin Sinclair, NREL 27961

10
Outline
10
• Historical overview and statutory authority
• Challenges to wildlife • Key species habitat distribution • Research • Collaboratives • Conclusions

11
Challenges to Wildlife Related to Wind Energy Wildlife challenges include: • Habitat and species that are likely to be impacted vary by
o Climate o Topography o Location
• No single solution • Impacts expected to increase as more turbines are installed
across the country—but these can be managed. Ways of addressing the challenges: • Identify near-term research needs • Use a multipronged approach • Involve multiple stakeholders • Garner support for collaborative field research,
methods/metrics refinement, tools, mitigation strategies, and deterrent development/testing
• Disseminate information.

12
Challenges: Key Issues Being Addressed Impacts of wind turbines on wildlife include: • Bats (mortality) • Raptors (mortality) • Nocturnal migration (mortality) • Prairie birds (habitat – displacement;
genetic diversity) • Cumulative (population impacts). Tools to avoid problematic sites: • Federal (e.g. Wind Energy Guidelines) • State guidelines • Pre versus post construction validation • Mapping of migratory pathways • Presiting assessments • Risk assessments • Literature archive • Peer review (promote transparency)
Sage Grouse. NREL 20649

13
Avian Strike Probability Versus Turbine Size
15-meter (m) diameter RSA and 100 kW
93-m diameter RSA and 2.5 MW
Altamont Scale Next-Generation Scale

14
Radar tracks of migrating birds through the Nysted Offshore Windfarm for operation in 2003
Response distance:
day = c. 3,000 meters (m)
night = c. 1,000 m
Avoidance Behavior can be Significant

15
Bats Interactions: Curiosity?
Infrared Image of a Bat Flying Through a Wind Turbine Rotor Video by Jason Horn, Boston University
16
Outline
16
• Historical overview and statutory authority
• Challenges to wildlife • Key species habitat distribution • Research • Collaboratives • Conclusions
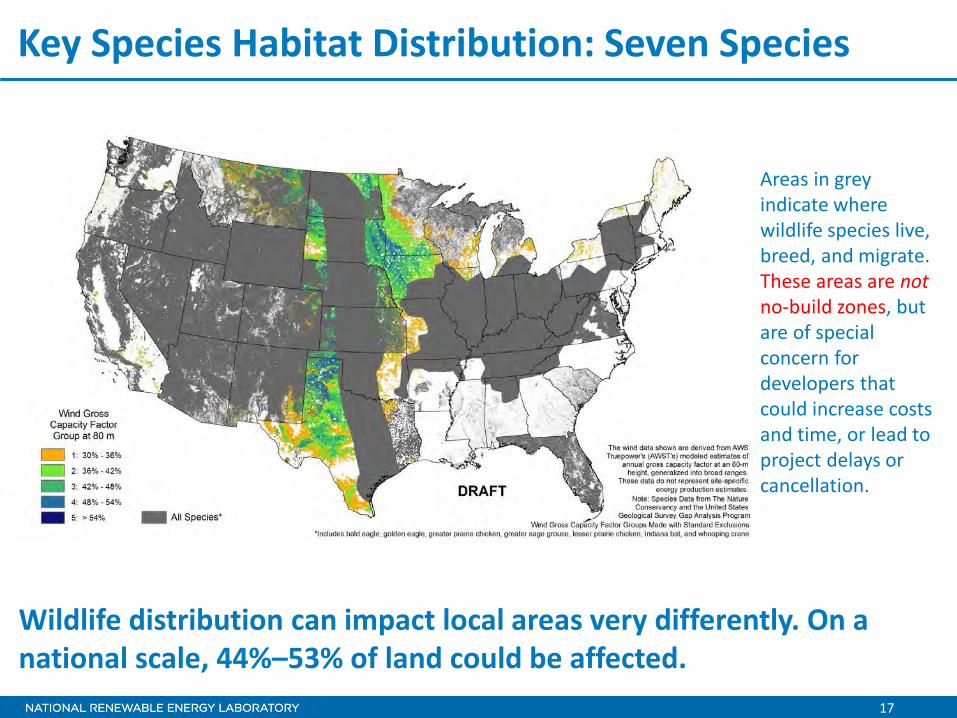
17
Key Species Habitat Distribution: Seven Species
Wildlife distribution can impact local areas very differently. On a national scale, 44%–53% of land could be affected.
Areas in grey indicate where wildlife species live, breed, and migrate. These areas are not no-build zones, but are of special concern for developers that could increase costs and time, or lead to project delays or cancellation.

18
Key Species Habitat Distribution: Golden Eagles
Golden eagle habitat: areas requiring additional consideration

19
Key Species Habitat Distribution: Bald Eagles
Bald eagle habitat: areas requiring additional consideration

20
Key Species Habitat Distribution: Sage Grouse
Sage grouse habitat and breeding sites: areas requiring additional consideration

21
Key Species Habitat Distribution: Whooping Crane
Whooping crane habitat and migratory corridor: areas requiring additional consideration

22
Key Species Habitat Distribution: Indiana Bat
Indiana bat habitat distribution: areas requiring additional consideration

23
Key Species Habitat Distribution: Combined
Combined wildlife impacts: areas requiring additional consideration

24
Outline
24
• Historical overview and statutory authority
• Challenges to wildlife • Key species habitat distribution • Research • Collaboratives • Conclusions
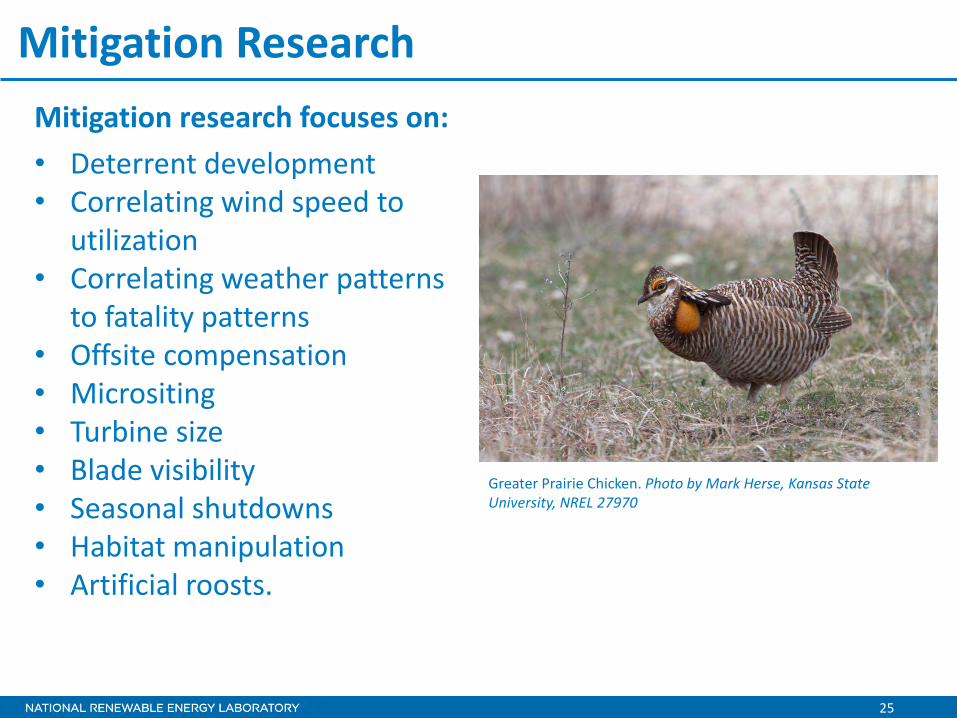
25
Mitigation Research Mitigation research focuses on: • Deterrent development • Correlating wind speed to
utilization • Correlating weather patterns
to fatality patterns • Offsite compensation • Micrositing • Turbine size • Blade visibility • Seasonal shutdowns • Habitat manipulation • Artificial roosts.
Greater Prairie Chicken. Photo by Mark Herse, Kansas State University, NREL 27970

26
Technology/Model Research Technology/modeling research is focused on: • Radar validation • Thermal imaging cameras • Near-infrared cameras • Stable isotopes • Predictive models.
Infrared camera. Photo by Dennis Schroeder, NREL 20338

27
Testing Detection Systems at the NWTC
Houdini in flight during FY15. GPS data logger can be seen on his right foot and UHF tracker can be seen on
his left.
Testing of detection systems using Auburn University’s golden and bald
eagles

28
Importance of Convening Interdisciplinary Panel of Experts for Prioritizing Research
• Bringing people of different focus areas/expertise to the table to understand and prioritize solutions
• Outcome as it relates to wind energy and eagle impacts: need to understand fundamental behavior and physiology of species of concern

29
Recommendations from Physiology and Behavior Specialists
For auditory deterrent research, one expert recommends the following: • Measure the auditory system of
these birds • Use this information to build a
library of sounds that might be stressful (annoying)
• Use heart monitors to give us an index of stress (estimated by an increase in heart rate)
• Give a variety of different sounds to estimate stress induced by the sounds
• Test birds over different time intervals (hours to weeks) to estimate the rate of adaptation to these sounds
• Understand: population and habitat associations, threats, annual cycle, demography, flight behavior, diet, etc..
• Risk is when turbines intersect with a species basic needs (e.g. with eagles it is food, updraft and nesting sites)
Photo provided by T. Katzner Properties of the Vocal System Provide Clues about Properties of the Auditory System
Golden eagle copulation call
Source: As presented by Jeff Lucas, Purdue University at Eagle Detection and Deterrent Technology Research Gaps and Solutions Workshop, December 2015

30
BWEC Study Results
Source: BWEC Report 2005

31
31
Source: http://nawindpower.com/online/issues/NAW1604/FEAT_01_Duke-s-Avian-Mitigation-Techniques-Take-Flight-What-s-Working-And-Why.html
• Onsite wildlife specialists during daylight hours • Working with FWS on an eagle trapping and
tracking project • GPS help to understand eagle migration
movements • Advancing IdentiFlight camera system • Opportunities for R&D when faced with
unsupported requirements
Research Conducted from Settlement Agreements Duke Energy at Top of the World Windfarm in Casper, Wyoming
32
Outline
32
• Historical overview and statutory authority
• Challenges to wildlife • Key species habitat distribution • Research • Collaboratives • Conclusions

33
Collaboratives are Often Beneficial for Advancing the Knowledge Base
Benefits of collaboratives include: • Access to third party, unbiased
research • Accepted experts within collaborative • Agreement on study design • The ability to develop relationships
(trust) • A safe forum for discussion • The ability to engage early and often • Transparency/credibility • Leveraging of funds • Project access • Access to interim results • Accepted results • A model for future interactions.
705-MW project in Tehachapi Pass Wind Resource Area, California.
Photo by David Hicks, NREL 18455

34
Current collaboratives
• The National Wind Coordinating Collaborative (NWCC). Includes federal, state, utilities, nongovernmental organizations (NGOs), and wind industry o Grassland Shrub Steppe Species Collaborative. Includes federal, state,
NGOs, and wind industry o Sage Grouse Collaborative. Includes federal, state, NGOs, and wind
industry
• Bats and Wind Energy Cooperative (BWEC). Includes federal, state, NGOs, and wind industry
• American Wind Wildlife Institute (AWWI). Includes industry and NGOs
• International Energy Agency Wind Task 34. Includes nine member countries.
Current collaboratives include:

35
More on International Energy Agency Wind Task 34 • Working Together to Resolve Environmental
Effects of Wind Energy, known as WREN • October 2012–2016; extension under
discussion • Current member countries: Ireland,
Netherlands, Norway, Spain, Switzerland, United Kingdom, United States, France, and Sweden.
Primary products: • WREN Hub/Tethys (http://tethys.pnnl.gov/) • White papers: Adaptive management,
individual impacts to population effects, green versus green, cumulative impacts, transboundary issues
• Webinars: on land/offshore, birds/bats/marine mammals, tools http://tethys.pnnl.gov/environmental-webinars?content=wind

36
Outline
36
• Historical overview and statutory authority
• Challenges to wildlife • Key species habitat distribution • Research • Collaboratives • Conclusions

37
Conclusions
• Wind-wildlife impact concerns are complicated
• Micrositing is key to avoiding, minimizing, and mitigating impacts; some locations may just not be appropriate for wind development
• Research and development of tools is ongoing and benefits from interdisciplinary approaches
• Collaboratives provide opportunities to leverage resources to find solutions for common challenges.
Grand Ridge Wind Energy Center. GE 1.5-MW turbines in Lasalle County, Illinois. Photo by Invenergy, LLC, NREL 16040.

QUESTIONS?

39
Power in the Wind = ½ρAV3
A - Area of the circle swept by the rotor ρ = Air density V = Wind Velocity
Turbine Power Basics
Wind Turbine Power Curve
Variable rpm
rpm ~ wind speed
Zero rpm
Almost constant rpm
and near constant power

40
NWCC Formed in 1994, founding members included NREL and DOE, the American Wind Energy Association, National Audubon Society, Electric Power Research Institute, and Union of Concerned Scientists. Membership currently exceeds 1,500 people. Major features of the NWCC include: • Multistakeholder • Facilitated; ground rules for engagement • Coordinated field research • Information dissemination (e.g., website; coordination of report preparation
and publication; presentations at meetings) • Biennial Research Meeting (X in December 2014) Recent research activities were initiated under the Grassland Shrub Steppe Species Collaborative, and include: • Grassland Community Collaborative (Prairie-Chicken research) • Sage Grouse Collaborative (Sage Grouse research) http://www.nationalwind.org/

41
BWEC Formed in 2004, founding members included the American Wind Energy Association, Bat Conservation International, USFWS, and NREL, with DOE and the U.S. Geological Survey later. Major features of the BWEC include: • Objective, science-based • International expertise tapped • Organizational structure includes an oversight
committee, technical committee, and science committee
• Coordination of field research (e.g., operational curtailment, acoustic deterrent, other)
• Information dissemination (e.g., website; coordination of report preparation and publication; presentations at meetings)
• Frequent science meeting. http://www.batsandwind.org/ Source: Arnett, et al. 2008. Effectiveness
of Changing Wind Turbine Cut-in Speed to Reduce Bat Fatalities at Wind Facilities

42
AWWI Formed in 2008, board members consist of 50% industry and 50% NGOs. Primary activities include: • Research • Data repository Wind-Wildlife Research Information System • Landscape tools Landscape Assessment Tool • Mitigation strategies for eagle take Through the use of expert elicitation, AWWI has facilitated the development of two models to predict numerical effects of compensatory mitigation on golden eagle survival and reproduction through: lead abatement and vehicle collision reduction strategies. • Education http://www.awwi.org/
Golden Eagle with a transmitter on its back. Photo by Randy Flament, NREL 23585
43
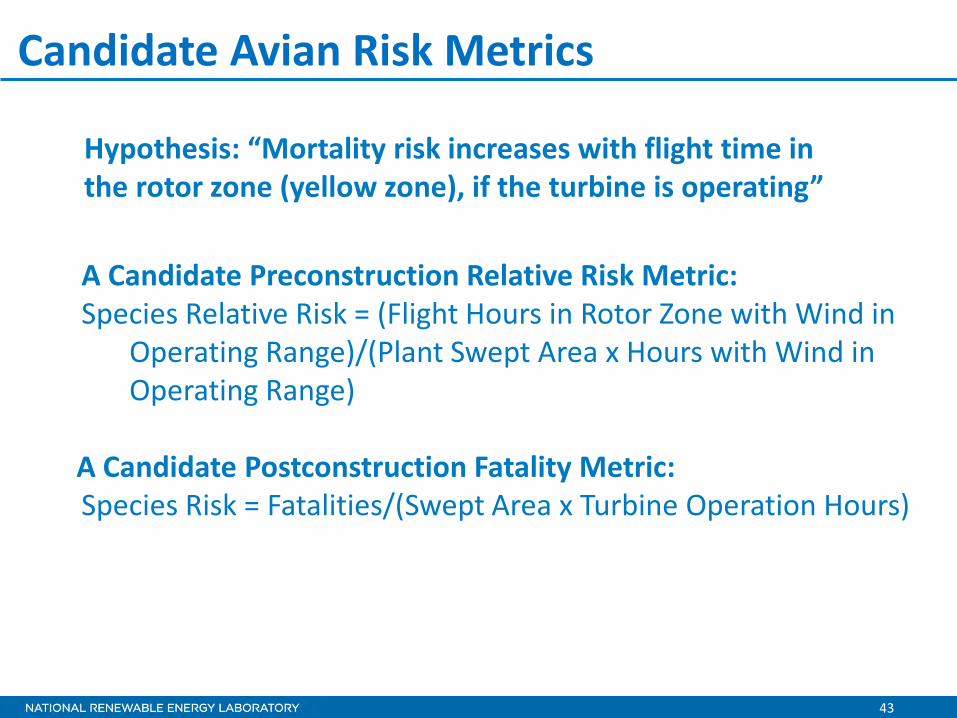
Candidate Avian Risk Metrics
A Candidate Preconstruction Relative Risk Metric: Species Relative Risk = (Flight Hours in Rotor Zone with Wind in
Operating Range)/(Plant Swept Area x Hours with Wind in Operating Range)
A Candidate Postconstruction Fatality Metric:
Species Risk = Fatalities/(Swept Area x Turbine Operation Hours)
Hypothesis: “Mortality risk increases with flight time in the rotor zone (yellow zone), if the turbine is operating”

44
Released March 2012
Provide a Tiered Approach, including: • Tier 1 – Preliminary site evaluation
(landscape-scale screening of possible project sites)
• Tier 2 – Site characterization (broad characterization of one or more potential project sites)
• Tier 3 – Field studies to document site wildlife and habitat and predict project impacts
• Tier 4 – Postconstruction studies to estimate impacts
• Tier 5 – Other postconstruction studies and research.
The USFWS Land-based Wind Energy Guidelines

45
USFWS Guidelines: Developer and Service Roles

46
USFWS Eagle Conservation Plan Guidance (April 2013)
• To facilitate issuance of programmatic eagle take permits for wind energy facilities the USFWS finalized the Eagle Conservation Plan Guidance- Module 1- Land-based Wind Energy Version 2
• This Guidance provides a framework for developing and evaluating Advanced Conservation Practices, which is the framework for detect and deter technologies
Photo by T. Katzner

47
Power and Size of Turbines Over Time
47
Source: 2012 Wind Technologies Market Report

48
Representative Wind Turbine Specifications
Turbine Power - MW Rotor Size - m Rotor Area – m2 Rotor Speed - rpm Tower Height - m Cut-in Wind Speed
m/s
GE 1.5 se 1.5 70.5 3904 12-22.4 54.7 – 64.7 4 GE 1.5 sl 1.5 77 4657 11-20.4 61.4 - 100 3.5 GE 1.5 sle 1.5 77 4657 11-20.4 61.4 - 100 3.5 GE 1.5 xle 1.5 82.5 5346 10.1-18.7 58.7 - 100 3.5 GE 1.6 or 1.7 1.6 – 1.7 100 7854 ? 80 -96 ? GE 2.5 -100 2.5 103 8333 ? 75-100 3 GE 3.2 -103 3.2 103 8333 ? 70-98 ? Siemens SWT 2.3 2.3 100 7854 6-16 80 or Site specific 3-4 Siemens Offshore SWT – 6.0 – 154 6 154 18,600 5-11 Site Specific 3-5
GE 1.5 -77 Siemens 2.3
Alstom 3 MW 100
Gamesa 2 MW 97
CART 600 kW
National Wind Technology Center – NREL Pic 25898 Danish National Wind Test Center – Photo by R. Thresher
Siemens 6 MW -154

49
U.S. Department of Energy Wind Program’s Mission
• Reduce challenges to project development to accelerate deployment of appropriate wind energy
• Support achievement of 20% wind energy by 2030 • Accelerate wind energy capacity growth/
development of domestic energy options (Energy Policy Act of 2005).
Northwind 100, 100-kW wind turbine; Hempstead, New York. Photo by Town of Hempstead, NREL 28963

50
ALL REGIONS11%
3%
74%
1%1%
2%1%6%
1%Doves/Pigeons
Game birds
Other Birds
Passerines
Rails/Coots
Raptors/Vultures
Shorebirds
Unidentified Birds
Water birds
Waterfowl
Proportion of fatalities at sites reporting fatalities by species, for all regions where studies have been conducted (the Pacific Northwest, Midwest, Rocky Mountains, and East). Source: Strickland and Morrison, February 26, 2008. http://www.fws.gov/habitatconservation/windpower/Past_Meeting_Presentations/Morrison_Strickland.pdf
Research: Species Composition of Bird Fatalities

51
Distribution of flight heights above ground level amount red-tailed hawks observed during behavioral observation sessions during 2003 and 2004 in the Altamont Pass Wind Resource Area.
Mean flight heights of red-tailed hawk over aspect of ridge relative to oncoming winds.
Source: K. Smallwood and L. Neher, CEC-500-2005-005, December 2004
Red-Tailed Hawk Flight Observations in Altamont Pass
Height Histogram Height versus Orientation

52
Raptor Fatalities and Sightings
Fatalities Sightings Rel. Risk F/S
Burrowing Owl 38 56 0.68 American Kestrel 22 429 0.05 Red-Tailed Hawk 100 1,780 0.06 Golden Eagle 10 401 0.02 Northern Harrier 2 114 0.02 Prairie Falcon 1 63 0.02 Turkey Vulture 0 756 0 Common Raven 0 792 0
From: Bird Risk Behaviors and Fatalities at the Altamont Pass WRA, Carl G. Thelander, et al
Highlights of One Interaction Study in Altamont Pass

53
53
Sage Grouse Research
Internal Document – Not for Distribution Ecology of Male Greater Sage-Grouse in Relation to Wind Energy in Wyoming Research Team: Power Company of Wyoming and University of Missouri
Sage Grouse. NREL 20649
54
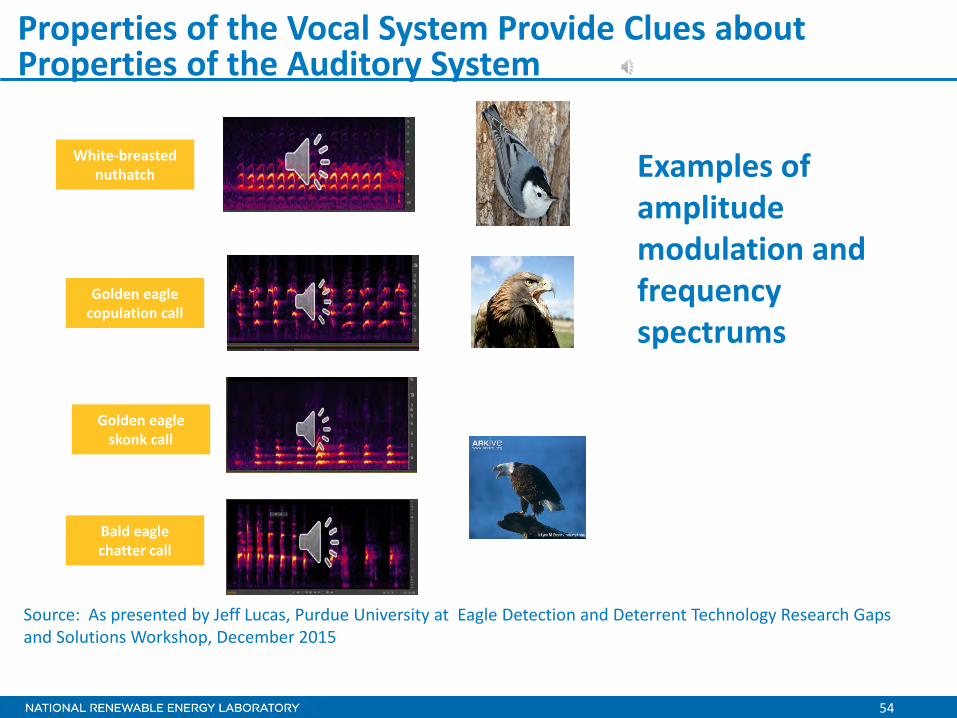
Golden eagle copulation call
Bald eagle chatter call
Golden eagle skonk call
White-breasted nuthatch
Properties of the Vocal System Provide Clues about Properties of the Auditory System
Source: As presented by Jeff Lucas, Purdue University at Eagle Detection and Deterrent Technology Research Gaps and Solutions Workshop, December 2015
Examples of amplitude modulation and frequency spectrums

Breakout Session 1 (Day 1) Stakeholder Concerns, Additional Relevant Data
Sources, and Additional Research underway

Breakout Group 1

Other things CWG should undertake? • Greater stakeholder involvement
• CWG & ASWG • FACA? • Use industry as a resource • Review of the Science Plan
• Outline next steps beyond the Science Plan • Implementation

New Information
• New solar project in Pahrump, NV • Panel spacing may diffuse the lake effect
• Widen the scope beyond AZ, CA, and NV • USGS-FWS OFR on standardized monitoring

Group 2 (Day 2)

What other tasks should the CWG Undertake (1 of 2) • Focusing on the science is the correct approach. Monitoring should be informed by
research. Don’t monitor for sake of monitoring. Interrelationship between monitoring and research.
• Consider costs when determining monitoring requirements (Danielle, Jeremiah) • Monitoring should be designed to answer specific questions. • Monitoring Guidelines due out in June. Will be publically available. Different from the
CWG Science Plan. • Monitoring procedures are a research question. • Determine level of overall mortality • Look at causation. • Get data to focus the research • Science plan should have priorities as a product • What is the low hanging fruit? • Leverage information and existing data

What other tasks should the CWG Undertake (1 of 2) • Site specific monitoring vs understanding where projects should go • What are we siting for? Any specific species? (Songbirds, migratory birds, etc.) E.g.
wind now focuses on bats and raptors. • Good model is San Juaquin Valley Least Conflict Plan (goes beyond science) • What features in the landscape influence avian presence and behavior • Keep in mind Technology specific effects • Keep visibility on ongoing research efforts, common database? AWWI web site has
extensive list of studies. When should studies be released? • General research studies vs project data. CEC posts project data after review. • Lots of folks want data/information, but many studies are still underway • CWG and ASWG access to raw data? What questions can be answered?

Any ongoing or planned research or data collection efforts that are relevant to developing the science plan • ASWG Research Panel looking at rough methodologies to answer ASWG questions • ASWG Research Panel asked to sequence the research

Breakout Group 3 Stakeholder Concerns, Additional Relevant Data
Sources, and Additional Research underway

Group 3
• Dan Boff, DOE • Kirk LaGory • Amy Fesnock, • Bill Werner • Katie Umekubo • Chuck Griffin • Juliette Falkner • Karyn Coppinger • Brian Boroski, H.T. Harvey • Matt Hutchinson

Other things CWG should undertake? • Need to specify focus on causation of mortality • Look at sublethal effects (e.g., decreased
reproduction, carrying capacity, etc.) • Scope should go beyond regulatory requirements
Data and models
• Use of existing monitoring data: What does it tell us? What would we do differently?
• Making data available to the public. Data quality issues.
• Need to develop a toolkit

Relevant studies
• Genetic studies to examine population of origin • Golden eagle research related to populations • Look at rare and common species to provide
bookends • Condor Issue (vol 118): several papers population
concerns related to renewable energy issues • Draft article submitted to JWM, modeling estimates
related to searcher efficiencies for rare species • Draft paper looking at direct and indirect effects for
solar, wind, and transmission

Conceptual Understanding of Avian-Solar Interactions
Lee Walston Argonne National Laboratory May 10-11, 2016 Sacramento, California

Why Develop a Conceptual Model?
Illustrate important processes
– Direct & indirect effects
– Interactions and cumulative effects
Synthesize current understanding of avian-solar interactions
– Foster a common understanding
Identify information gaps and research priorities
Starting point for the avian-solar science plan
2 Multiagency CWG Stakeholder Workshop, May 2016

Avian-Solar Conceptual Model
3 Multiagency CWG Stakeholder Workshop, May 2016
Solar Energy Development
Impacts on Birds
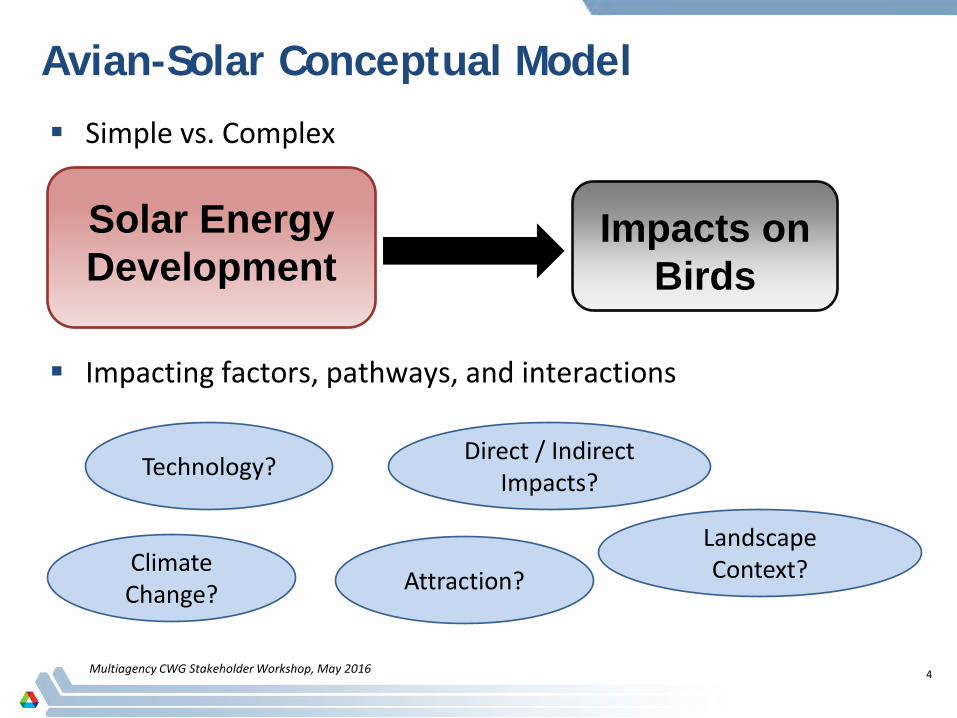
Simple vs. Complex
Two main focal points
Avian-Solar Conceptual Model
4 Multiagency CWG Stakeholder Workshop, May 2016
Solar Energy Development
Impacts on Birds
Simple vs. Complex
Technology? Direct / Indirect Impacts?
Climate Change?
Impacting factors, pathways, and interactions
Attraction?
Landscape Context?

Avian-Solar Conceptual Model
5 Multiagency CWG Stakeholder Workshop, May 2016

Avian-Solar Conceptual Model
6 Multiagency CWG Stakeholder Workshop, May 2016
Solar Energy Development
Roads, transmission,
& fencing
PV Technologies
CSP Technologies
Human Development & Land Use
Change
Climate Change Indirect Effects
Habitat loss & fragmentation
Habitat degradation
Change in suitable climate
Habitat loss
Spread of nonnative / invasive species
Altered ecological succession

Avian-Solar Conceptual Model
7 Multiagency CWG Stakeholder Workshop, May 2016
Solar Energy Development
Roads, transmission,
& fencing
PV Technologies
CSP Technologies
Human Development & Land Use
Change
Climate Change Direct Effects
Mortality
Sublethal Effects
Construction mortality, collision, flux, predation
Attraction of birds, prey, and predators
Technological considerations & project design (e.g., water)

Avian-Solar Conceptual Model
8 Multiagency CWG Stakeholder Workshop, May 2016
Location matters
Impacts on Birds
Direct Effects
Landscape Context Project location, proximity to wetlands,
riparian areas, agriculture, flyways, stopover sites, and other human land uses
Mortality (construction mortality,
collision, flux, predation)
Sublethal Effects (injury, energetic costs)
Indirect Effects Habitat Loss & Fragmentation
Habitat degradation
Avian-Solar Conceptual Model
9 Multiagency CWG Stakeholder Workshop, May 2016
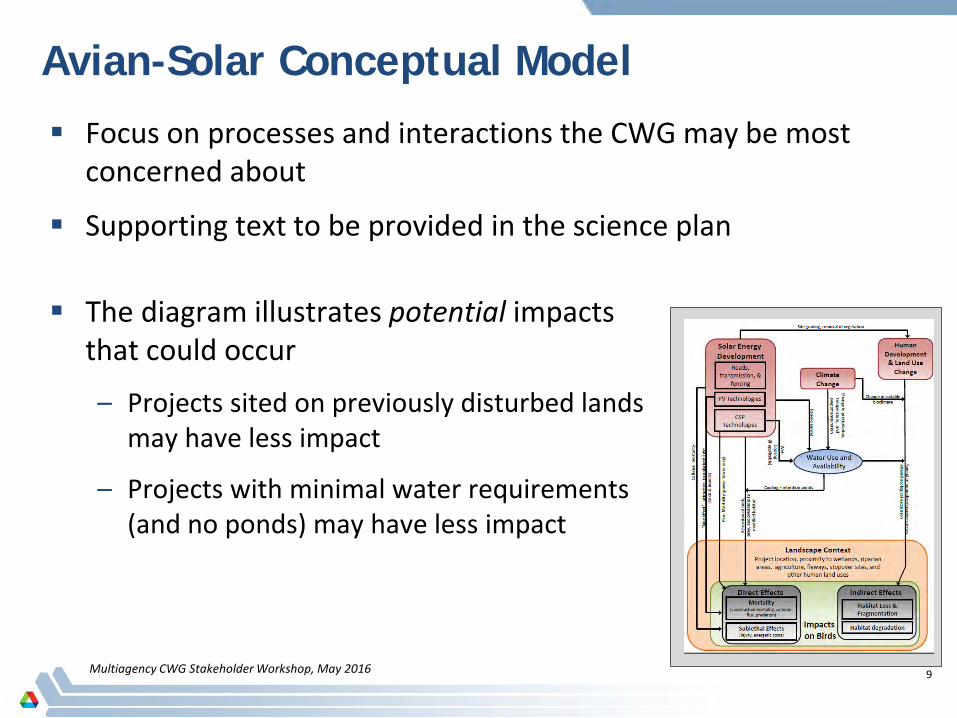
Focus on processes and interactions the CWG may be most concerned about
Supporting text to be provided in the science plan
The diagram illustrates potential impacts that could occur
– Projects sited on previously disturbed lands may have less impact
– Projects with minimal water requirements (and no ponds) may have less impact
Avian-Solar Conceptual Model
10 Multiagency CWG Stakeholder Workshop, May 2016
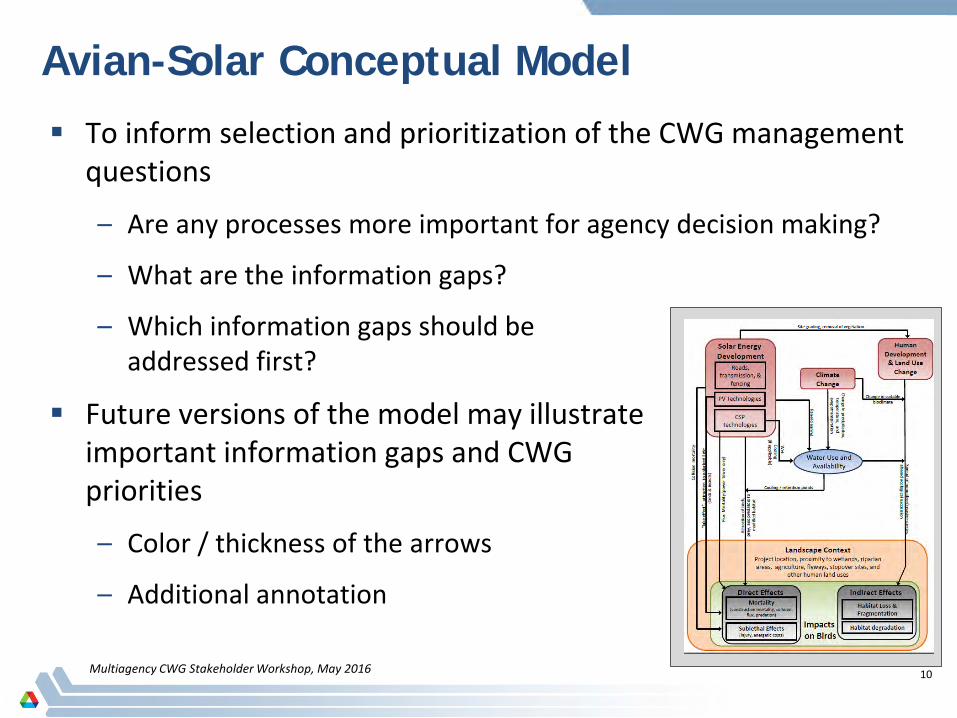
To inform selection and prioritization of the CWG management questions
– Are any processes more important for agency decision making?
– What are the information gaps?
– Which information gaps should be addressed first?
Future versions of the model may illustrate important information gaps and CWG priorities
– Color / thickness of the arrows
– Additional annotation

Questions?
11 Multiagency CWG Stakeholder Workshop, May 2016

NREL is a national laboratory of the U.S. Department of Energy, Office of Energy Efficiency and Renewable Energy, operated by the Alliance for Sustainable Energy, LLC.
Agency Management Questions and Related Research Needs
Tony Jimenez
May 11, 2016
2
Outline
2
• Avian-Solar Interaction Model • “Management Question” Defined • Sample Questions • Management Question Categories • Generalized Management Questions • Research Prioritization • Discussion
Red-tailed hawk eating a rabbit. Photo by Dennis Schroeder, NREL 22325

3
Avian Solar Conceptual Framework
3

4
Management Questions Background
4
• Define what information the agencies need • Define research needs • Tied to the conceptual model • Due to differing missions, different agencies may
have different questions • Received 108 questions • Questions grouped into seven (7) categories • Questions consolidated into 14 “generalized
questions”

5
Sampling of Management Questions
5
• What are the most scientifically rigorous and cost-effective population monitoring tools available for: 1) quickly identifying potential impacts to populations, and 2) determining effectiveness of mitigation strategies at local and regional scales?
• Is higher mortality realized during any particular time of year?
• Are birds being attracted to the site to forage on insects killed by the concentrated solar flux?

6
Management Questions Categories
6
1. Landscape Considerations 2. Methods to Evaluate Avian Risk and Impacts 3. Sources of Mortality and Injury 4. Avian Behavior (Attraction/Avoidance) 5. Impacts to Habitat and Other Wildlife That Might Affect Birds 6. Taxonomic and Guild-Specific Impacts 7. Minimization, Mitigation, and Adaptive Management

7
Generalized Management Questions
7
1. Landscape Considerations
What are the larger-scale avian movement patterns in the region (including seasonal movements and factors that influence avian movements such as the presence of stopover sites in the landscape)? What are the landscape-level cumulative impacts on regional bird populations or on bird populations migrating through landscapes targeted for solar development? What is the anticipated solar energy build-out for the foreseeable future? (e.g., project size, location, technology type)
2. Methods to Evaluate Avian Risk and Impacts
What are the best methods for monitoring and evaluating avian mortality, specific to each type of solar energy technology? What are the best methods for identifying the bird species that would be most vulnerable during all phases of solar development (pre-construction, construction, and post-construction)?
3. Sources of Mortality and Injury
What are the sources of avian mortality and injury at solar facilities (i.e., project features), and what factors (e.g., location, habitat characteristics, time of year, species) affect frequency of those mortalities and injuries?

8
Generalized Management Questions
8
4. Avian Behavior (Attraction / Avoidance)
How do solar facilities affect landscape level movements of birds (i.e., migration and dispersal movements), and what factors (e.g., location, habitat characteristics, time of year, species) affect these movements? How do solar facilities affect local-scale movements/behaviors of birds (i.e., foraging and breeding behaviors), and what factors affect these behaviors?
5. Impacts to Habitat and Other Wildlife That Might Affect Birds
What are the impacts of solar development to other wildlife (such as predators or prey) and habitat that might affect birds?

9
Generalized Management Questions
9
6. Taxonomic and Guild-Specific Impacts
How do solar developments affect different bird taxa or guilds? What are the population effects from solar developments to individual bird species, particularly those of conservation concern? Which population or species-specific impacts are of greatest conservation concern?
7. Minimization, Mitigation, and Adaptive Management
What are the most effective minimization and mitigation methods to reduce or eliminate avian mortality? (e.g., project siting, technology engineering and project design to reduce attractiveness of facilities to birds, construction timing, operational parameters, deterrents, or offset) What off-site mitigation is most effective for off-setting mortalities for affected populations/species?
10
Research Prioritization
10
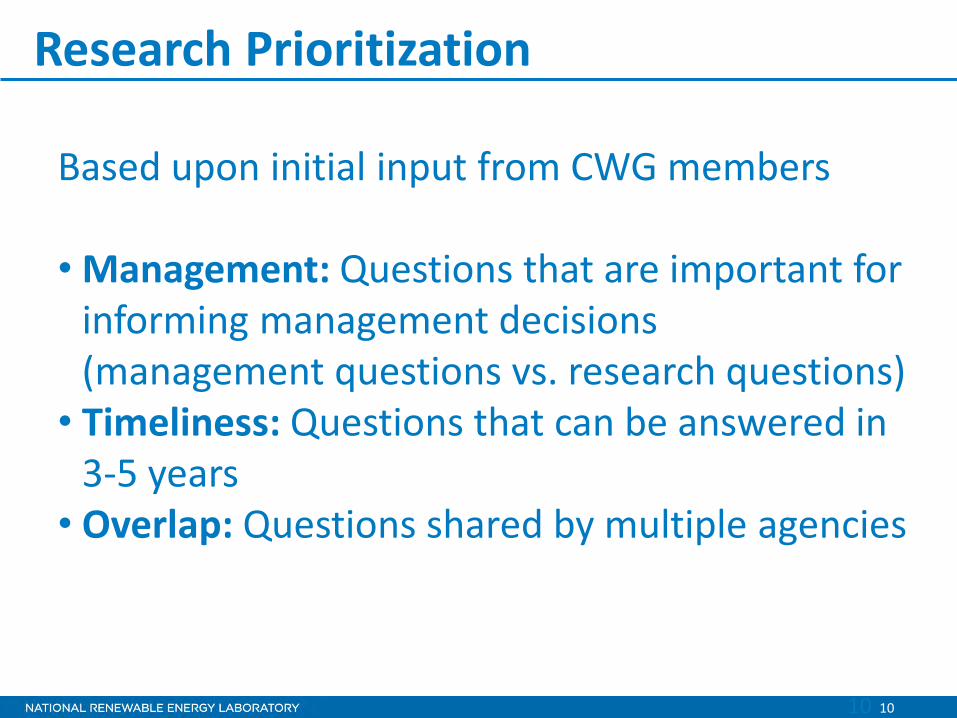
Based upon initial input from CWG members • Management: Questions that are important for
informing management decisions (management questions vs. research questions)
• Timeliness: Questions that can be answered in 3-5 years
• Overlap: Questions shared by multiple agencies

QUESTIONS / DISCUSSION

Day 2 Breakout Group Discussions

Group #1

Conceptual Framework • Add stranding as another form of mortality • Add dust suppression as water use

Management Questions (General) • Research questions cannot be fully addressed through
monitoring; require research/study design • Not all questions can be answered with existing data • Focus on natural history of taxa most likely to interact with
solar facilities (e.g., insectivores). #1 Landscape Considerations • Scope concerns with the amount of foreseeable development
question. • Meta-analysis of existing data could address landscape
considerations • ebird • Breeding bird survey

#2 Monitoring Methods • Consider changes to pre-construction baseline surveys for taxa
most likely to be affected (“better” baseline monitoring data) • Different seasons • Species-specific protocols • What taxa are most likely to interact with solar facilities?
#3 Source of Mortality and Injury • It is possible (“maybe”) for existing data and monitoring
protocols to help inform sources of mortality and causation.

#4 Behavior • Existing data/studies that could be used to understand avian
behavior: • Pre-construction radar study for at least one solar project • Raptor telemetry data
#5 Impacts to habitat and other wildlife • Could use predictive information on ravens, raptors, and
desert tortoise.

#6 Population-level effects • Monitoring data could help address how solar impacts
different taxa differently.
#7 Mitigation • Look at deterrents used in other industries (wind, aviation) • Connect new approaches to systematic monitoring designs

Climate Change • Could also be used to determine species of concern.
Criteria • Budget & duration • Would the answer to the question affect decisions?

Group 2 (Day 2)

Any Important elements missing or misrepresented in the conceptual framework? • These were mostly captured in the discussion after Lee’s
presentation • All birds lumped as one. Consider differential impacts to
different guilds/species • Take into account potential benefits and risks? Or relabel
“Potential Negative Impacts” which acknowledges that there may be potential benefits.
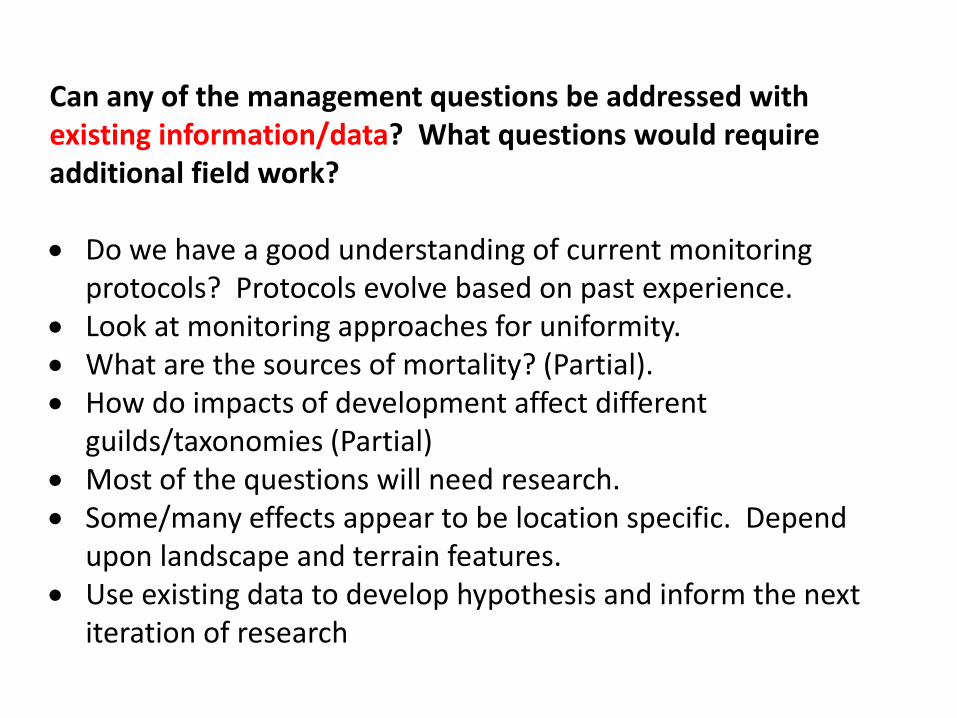
Can any of the management questions be addressed with existing information/data? What questions would require additional field work? • Do we have a good understanding of current monitoring
protocols? Protocols evolve based on past experience. • Look at monitoring approaches for uniformity. • What are the sources of mortality? (Partial). • How do impacts of development affect different
guilds/taxonomies (Partial) • Most of the questions will need research. • Some/many effects appear to be location specific. Depend
upon landscape and terrain features. • Use existing data to develop hypothesis and inform the next
iteration of research
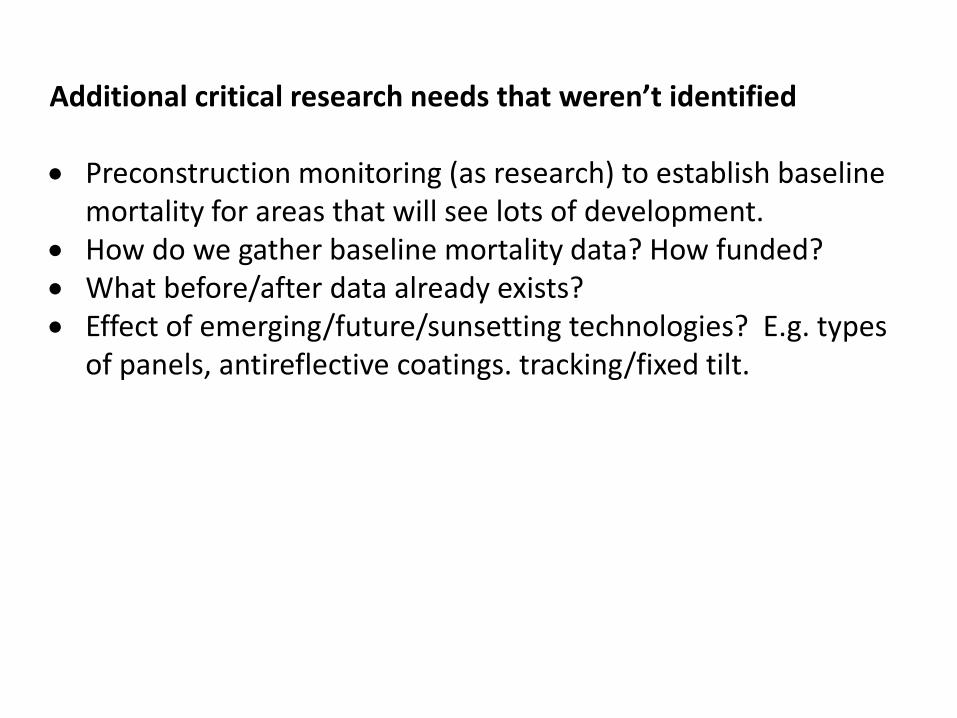
Additional critical research needs that weren’t identified • Preconstruction monitoring (as research) to establish baseline
mortality for areas that will see lots of development. • How do we gather baseline mortality data? How funded? • What before/after data already exists? • Effect of emerging/future/sunsetting technologies? E.g. types
of panels, antireflective coatings. tracking/fixed tilt.

What criteria should be considered by the agencies in establishing priorities for future research? Can you rank in terms of importance for guiding future research (e.g. allocation of funds)? • Prioritize questions that can be answered sooner? • Cost/difficulty • Avoid duplication • Foundationality • Fills an important gap • Should different agencies focus on different questions? • What are the priorities of the individual agencies? • Scope and applicability • Unique to solar • Solicit public comment on criteria & research needs

Other • No definitive focus yet (as to priorities) • Need to do background comparisons • How do we ensure these agreed-upon priorities are carried
out by the member agencies (implementation)

Breakout Session 3
Conceptual Framework, Management Questions, Research
Needs and Priorities
Group 3 • Dan Boff, DOE • Kirk LaGory • Amy Fesnock, • Bill Werner • Katie Umekubo • Chuck Griffin • Juliette Falkner • Karyn Coppinger • Brian Borowski, H.T. Harvey • Matt Hutchinson
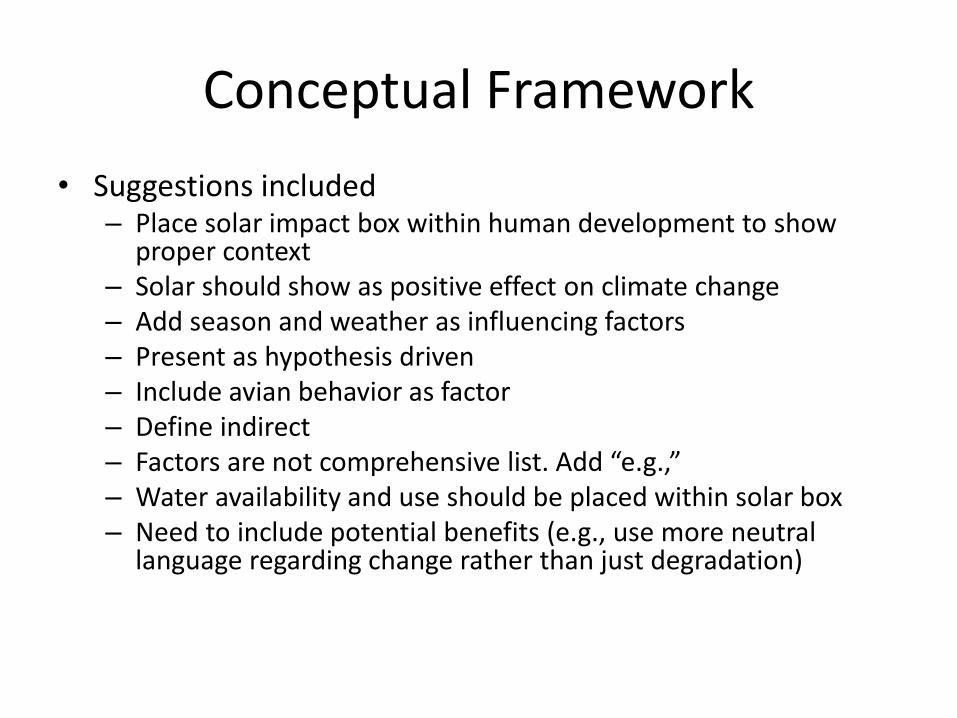
Conceptual Framework • Suggestions included
– Place solar impact box within human development to show proper context
– Solar should show as positive effect on climate change – Add season and weather as influencing factors – Present as hypothesis driven – Include avian behavior as factor – Define indirect – Factors are not comprehensive list. Add “e.g.,” – Water availability and use should be placed within solar box – Need to include potential benefits (e.g., use more neutral
language regarding change rather than just degradation)

Management Questions
• Many questions have landscape context but not included in landscape bin
• Data are available on solar development projections, but may not have specific information on where these would go
• Monitoring data available on limited questions regarding mortality
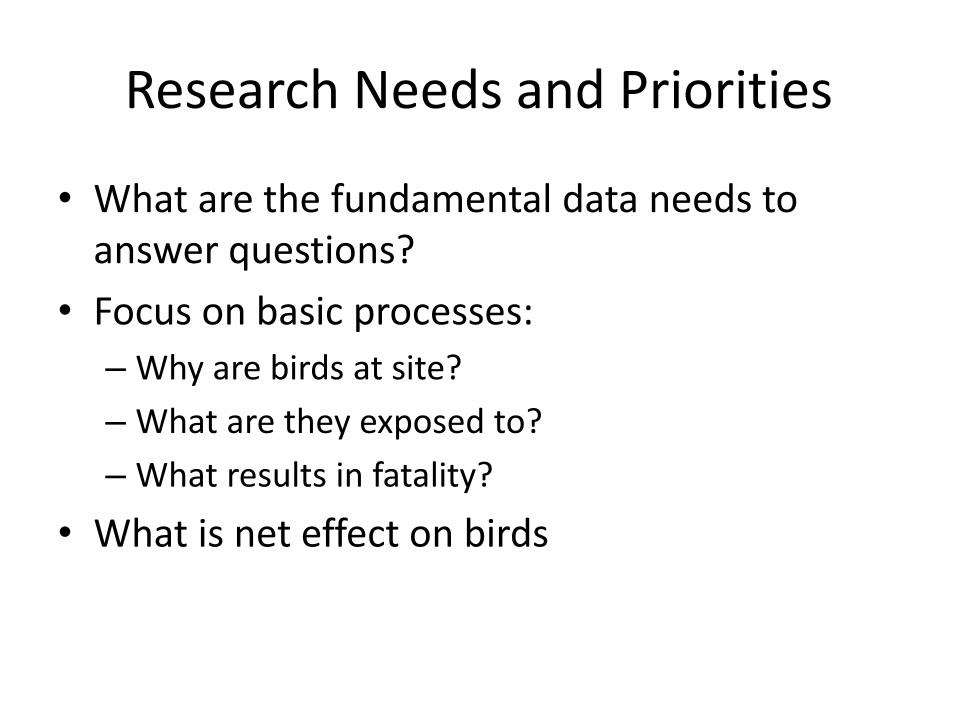
Research Needs and Priorities
• What are the fundamental data needs to answer questions?
• Focus on basic processes: – Why are birds at site? – What are they exposed to? – What results in fatality?
• What is net effect on birds

• Landscape Framework comments – Broader context would be good beyond just solar. – Also, put INTO context to ensure it isn’t
misinterpreted when seen as a standalone document.
– Should be entitled “pathway for potential impacts”;
– Suggest that at the core, it begins with the concepts lifecycle/life history perspective
Breakout 4 –

Breakout 4
• Management questions comments – ‘landscape considerations’ is not a management
question but rather required background for solving other management questions.
• Importance of background mortality – Level of pre-construction needed
• BACI versus geospatial • Understand first what agency’s want to see
– Different ways to determine which guilds/species to study, e.g.
• disproportional impacts, water birds, subset example of all guilds, other?

Breakout 4
• ASWG compared to CWG questions – Feather spots…include clearly in CWG – climate change futures with landscape considerations
management question – Standardization - what attributes are needed to
determine best methods? • Criteria Ranking
– #1 Fundamental need – recommend adding this – #2 Management – #3 Overlap – #4 Timeliness
Multiagency Avian-Solar Collaborative Working Group: Stakeholder Workshop Next Steps
May 10-11, 2016 Sacramento, California

Stakeholder Input Wanted
All handouts and presentations will be available on the CWG webpage: http://blmsolar.anl.gov/program/avian-solar/
Stakeholders can comment during this meeting and/or in writing following the workshop by June 1, 2016
Agencies are seeking input from stakeholders on all matters relevant to the CWG objectives: – Concerns about avian-solar issues – Relevant existing data and studies – Understanding of avian-solar interactions – Focus of future research – Priorities for research needs – Future activities of the CWG – Level and mode of future stakeholder engagement
2 Multiagency CWG Stakeholder Workshop, May 2016

Draft Avian-Solar Science Plan
Revise draft elements incorporating stakeholder comments – Summary of available data – Conceptual framework – Management questions
Develop additional elements – Prioritization of management questions – Implementation plan – Comparative cost data
Draft plan released for stakeholder review mid summer
3 Multiagency CWG Stakeholder Workshop, May 2016

Future Stakeholder Engagement
A stakeholder webinar will be hosted to present and take comments on the draft avian-solar science plan (late summer 2016)
For more information: – Subscribe for email updates: send request to [email protected] – CWG webpage: http://blmsolar.anl.gov/program/avian-solar/
4
Multiagency CWG Stakeholder Workshop, May 2016