Embed Size (px)
Citation preview

Santa Clara UniversityScholar Commons
Civil Engineering Senior Theses Engineering Senior Theses
6-9-2016
Nicaragua Water Distribution SystemLeah BenschingSanta Clara Univeristy
Jamie MonkSanta Clara Univeristy
Follow this and additional works at: https://scholarcommons.scu.edu/ceng_senior
Part of the Civil and Environmental Engineering Commons
This Thesis is brought to you for free and open access by the Engineering Senior Theses at Scholar Commons. It has been accepted for inclusion in CivilEngineering Senior Theses by an authorized administrator of Scholar Commons. For more information, please contact [email protected].
Recommended CitationBensching, Leah and Monk, Jamie, "Nicaragua Water Distribution System" (2016). Civil Engineering Senior Theses. 47.https://scholarcommons.scu.edu/ceng_senior/47


Nicaragua Water Distribution System
Leah Bensching & Jamie Monk
Civil Engineering
Class of 2016

1
Table of Contents
Abstract 2
Introduction 2
Project Background and Motivation 4
Project Objectives 6
Ethical Analysis 7
Related Non-Technical Issues 9
Design Information 10
Design Standards 15
Design Alternatives 17
Supplemental Materials 23
Design Recommendation 25
Future Research 26
Conclusion 26
Resources 27

2
Abstract
In developing nations, such as Nicaragua, water security issues affect a large portion of
the population. A lack of clean and secure water negatively causes many public health,
environmental and economic concerns. This project addresses the need to develop a water
distribution system to a rural community in Nicaragua. The proposed solutions will allow the
community to choose more resilient design options to ensure reliable water delivery throughout
the community.
By using NeatWork, a Nicaraguan based system, and WaterGEMS, which is more
commonly used in the United States, it was determined that designing for 100% reliability was
the most responsible approach, especially for community with growing populations. This would
allow the community to receive ample water in more extreme circumstances, instead of merely
average circumstances. The addition of a loop, or redundancy, would protect the integrity of the
system by allowing water to be re-routed if a section of the system is compromised.
Introduction
In September of 2015, the United Nations presented the Sustainable Development Goals.
Theses 16 goals work to “end poverty, protect the planet, and ensure prosperity for all,” and
range from ending hunger to improving education for women (Sustainable). If the United
Nations hopes to accomplish these goals by 2050, access to potable water is key. With this in
mind, this project focuses on improving access to potable water for a rural community in
Nicaragua by designing a water distribution system. The design primarily focuses on three of the
Sustainable Development Goals: Clean Water and Sanitation, Industry Innovation and
Infrastructure, and Climate Action.

3
According to the United Nations, 663 million people are still without a source of water and 1.8
billion people use a source of water that is contaminated. These statistics are the root of the goal
for Clean Water and Sanitation. The most important aspect of this goal is “universal and
equitable access to safe and affordable drinking water for all” (Sustainable). To work toward
achieving this goal, this water distribution system design aims to provide a reliable source of
water while minimizing effects on the surrounding ecosystem. It is not only important to design
systems to meet the needs of people now, but to meet their needs for generations to come.
The United Nations believes that the connection between the goal of Industry, Innovation and
Infrastructure and the overall economic success of a community are directly related. The goal
focuses on improving existing infrastructure with new technologies and expanding it to
communities that currently do not have reliable access. Strong local infrastructure is positively
correlated to the success of a community by providing more reliable utilities and support to local
businesses. Specifically, a water distribution system can improve the health of a community and
limit time needed to collect water, allowing residents to have more time to work toward financial
security and prosperity.
Climate Action is a two-part goal. It first focuses on minimal environmental impact while
still working to achieve other Sustainable Development Goals. Second, Climate Actions
identifies the importance of considering future climate change in the design of new
infrastructure, so that communities are prepared for the changing climate patterns.
A core value of the Sustainable Development Goals is a call for action to address climate change
while improving the lives of people around the world. From 1880 to 2012, the average global
temperature has increased 0.85 degrees Celsius and the sea level rose 19 cm (Sustainable
Development Goals). It is important for all engineers to keep in mind the effects of their designs

4
on the environment. In many communities, infrastructure is not designed to withstand changing
climate patterns. In the case of water, this means longer periods of drought and more intense
floods, especially in Central America.
Project Background and Motivation As outlined by the Sustainable Development Goals, water scarcity is an important issue
that needs to be addressed around the world. There are two types of water scarcity: physical and
economic. Physical water scarcity is when a region does not have enough water to available to
supply the population. Economic water scarcity occurs when a region has enough water but does
not have the infrastructure to deliver it to the people. Both of these are highlighted in various
geographic regions in Figure 1. An example of a country with economic water scarcity is
Nicaragua.
Figure 1: Global Water Scarcity from United Nations World Development Report 2012
As in many Central American countries, Nicaragua is categorized as a tropical climate with a dry
and wet season. During the rainy season, which takes place from June to December, the country
receives approximately one meter of precipitation per year (Nicaragua - Climate). The regions

5
along the Caribbean coast and the adjacent mountains receive more precipitation than the
western half of the country, where the capital city of Managua, lies.
Although plenty of rainfall occurs within the country, Nicaragua is categorized as an
economic water scarcity region because the majority of citizens lack access to potable water
(United Nations). A variety of environmental, political and economic factors play into the water
security issues that continue to inhibit the country from further development. In 1998, Hurricane
Mitch caused intense mudslides and floods, resulting in thousands of deaths and about $1 Billion
(USD) of damage to an already fragile infrastructure. The Nicaraguan Revolution caused
extreme separation and distrust between the government and its people, resulting in a large
division of resources. As the second poorest country in Latin America, it has a largely uneven
distribution of wealth. This affects access to clean water for the rural, agricultural communities
that produce 18% of the total GDP.. The large disparity between the service-based urban
population and the farmers in the rural regions of the country have sparked an interest in the
water security dispute (CIA World Factbook)
Currently, one third of the people living in rural communities in Nicaragua do not have
access to clean drinking water. Nicaragua has many of sources of fresh water, but most of it is
either not safe to drink or not accessible due to government disputes over water rights. Nicaragua
is considered at “high risk” for disease, including bacterial diarrhea, hepatitis A and typhoid
fever (CIA World Fact Book). This is mostly due to limited access of potable water throughout
the country. In addition, in-person surveys show that 76% of residents have access to potable
drinking water, but in the last five years the quality and quantity have decreased (Johnson).
Local access to water includes nearby streams, wells, and springs, which are considered

6
communal by Nicaraguan law; however, the private land surrounding the water sources often
blocks the public from accessing these sources.
With the help of Dr. Chris Bacon, a professor of Environmental Studies and Sciences at
Santa Clara University, a Nicaraguan based non-governmental organization (NGO) called
ASDENIC (La Asociación de Desarrollo Social de Nicaragua) was collaborated with to address
shortcomings in their current potable water supply distribution designs. ASDENIC focuses on
community driven projects that use technology and engineering to address the needs of the
people. They identified the demand for increased supply of potable water to El Bramadero, a
rural community in the northwestern, mountainous region of the country. El Bramadero was
chosen due to the increasing population in the region and existing system in need of repair. In
addition, they provided valuable context regarding not only the geography of the land, but also
the cultural climate of the region. Working with local NGOs, such as ASDENIC, is crucial to the
success of projects in developing countries because it allows engineers the opportunity to better
understand and address the needs of the people.
Project Objectives
The goal for this project was to design a more reliable and resilient water distribution
system for a rural community in northwestern Nicaragua called El Bramadero. There are
currently 800 residents in the community, but they expect significant growth over the next 20
years. The system is designed for 20% growth or 950 people. According to field information
provided by ASDENIC, The existing system has 13 tap stands, but many of them are broken or
are unused because of their location. The existing system must either be completely replaced or
retrofitted to meet the growing demand.

7
The water distribution system will draw from a local source. Information from ASDENIC
tells us that the source does not have a history of contamination and most households have
personal water filtration units, so a treatment system does not need to be installed. There is a
significant amount of sediment in the stream, so a sedimentation basin will be used at the source
to remove it.
Considering the Sustainable Development Goals previously discussed, we identified three
objectives to guide the design process for our project and future community projects:
1. Design a comprehensive system that delivers a dependable water supply to the
community with minimal effects on the local ecosystem
In order to truly help the citizens of El Bramadero, the water distribution system needs to
function at a high reliability factor. Certain design considerations must be made to make sure the
system functions in average and worse case scenarios. This includes designing for the expansion
of the community and making sure not to deplete necessary resources.
2. Compare and analyze designs from NeatWork and WaterGEMS
NeatWork is a Nicaraguan based software that specializes in gravity fed water designs
and is available without cost. WaterGEMS is more commonly used in the United States because
of its many design features and its high cost. The benefits and shortcomings of both platforms
were analyzed in order to present ASDENIC to aid in interpreting results..
Ethical Analysis
There are many moral and cultural implications to consider during the design of a water
distribution system. To ensure the highest ethical conduct throughout the project, good relations
must be maintained with all involved parties. It was necessary to maintain open communication
with the contacts at ASDENIC and in the community that relate the details of the project to the

8
people of El Bramadero. The most ethical way to complete the design on the water distribution
system was to consider the needs of the community during all phases, especially since the
citizens will be completing all of the labor. Once completed, the design was presented with an
honest recommendation for the improvement of the community’s access to water.
The short-term effects of a new water distribution system are that there will be limited
access to water during construction. While not ideal, it is necessary to remove the current system
in order to allow for the new system to be installed properly. During this period, the community
can retrieve water from the source directly and continue to use the household filtration unit in
order to remove sediment, or water can be shipped in. The second option can be very expensive
and is recommended for drinking water only. While this solution is temporary, it solves the main
issue of water demand for El Bramadero during this transition.
The long-term implications of the project focus on the environmental implications and
security risk. The Ministry of the Environment and Natural Resources will have jurisdiction
over our project. ASDENIC also has environmental protocols for all of their projects.
Unfortunately the most common building material for water distribution systems is PVC, which
is known to be destructive to the environment. PVC has shown to contain toxins that, over time,
affect the soil quality surrounding the pipe. Even though it is environmentally destructive, this
material is the most sensible choice because of its availability in Nicaragua and general cost
effectiveness. The lack of a more beneficial choice lead to the use of PVC in this distribution
system. The best way to mitigate this risk is to use the highest-grade material and recommend
annual testing of the soil conditions along the pipeline. There is also security risks in the project
occur after completion. Vandalism is a reality for many projects in all locations. From the onset
of the project, the community must show support and promise to protect it. Because of the

9
political disputes around water rights in Nicaragua, it is impossible to guarantee the complete
security of the system, but if the citizens of El Bramadero can agree to take care of the
distribution system over the lifespan there is a greater chance for success.
Related Non-Technical Issues
When working with rural communities, there are many non-technical factors to consider
in design. Most importantly, the cooperation of the community is key. It will primarily be the
responsibility of the community to construct and maintain the water distribution system. If the
community is not fully on board, the project will not be successful. The largest obstacle to
understanding the community needs is the language barrier. We focused on using clear language
throughout the project to avoid misunderstandings across translations. Software and funding
need to supply clean water are often unavailable to Nicaraguans, which makes it difficult to
continue to improve infrastructure. Working with ASDENIC allowed us insight into Nicaraguan
culture and guidance for how to engage with the community.
Another important aspect when designing for the community is the financial commitment
required by the project. Rural communities are often required to fund and develop their own
innovations with the help of local engineers. The initial capital needed for the project can be
extremely stressful on the local government and citizens, especially considering residential fights
for water rights against agricultural and mining industries. The best way to manage the financial
risk is to decrease the amount of maintenance costs for the community. This can be done by
using responsible, sustainable, and locally sourced materials, including local PVC suppliers and
and sustainable faucets.
As in many developing countries, the political climate plays a strong role in the
distribution of resources. Water rights are a controversial issue in Nicaragua because of water’s

10
importance to the agricultural and industrial industries that make up the majority of their GDP.
The tension around water rights began in 1979 with a political revolution and carried through
until the turn of the century, opening up new channels for political involvement in national and
local government, such as the Comités de Agua Potable y Saneamiento (CAPS). After Hurricane
Mitch struck in 1998, Nicaragua received a $21 million dollar (US) loan to increase the amount
of public-private partnerships in the water and sanitation sector. CAPS grew as a non-formalized
community based water association to provide potable water access to over 1 million rural
residents in the poorest parts of the country. Despite their ability to deliver this crucial service to
areas that are not reached by state programs, they have no formal state recognition or legal
priority (Romano). Due to the economic disparity, one third of the country still experiences
limited access to clean drinking water. Even though the design does not address water rights, it is
important to keep in mind for future applications of water distribution systems in Nicaragua.
Design Information
El Bramadero is a community of 175 families with a population of 800. Due to expected
population growth, the system will be designed for 950 people. ASDENIC identified a source
that can provide 1.14 liters per second, which is equivalent to 98 liters per person per day. This is
well above the 15 liters per person per day recommended by the World Health Organization
(World Heath Organization). The existing system has 13 access points (faucets). To have
convenient access for all citizens of El Bramadero, old tap stands will be replaced and the
number of tap stands will be increased to 16.
The source is in an ideal location because it is at a higher elevation than the community,
allowing for the design of a gravity driven system. By not using a pump, the cost of the system
decreases drastically. The existing path of the system was found to have the most workable

11
topography. It avoided the steep slope in the valley while staying in proximity to the existing
houses. The proposed path can be seen in Figure 2.
Figure 2: Aerial view of El Bramadero showing pipe routs
The piping system is shown in three sections, the main branch (red), the north branch
(orange) and the loop addition (yellow). The main branch and north branch make up the existing
system. To identify the best option for El Bramadero, a cost analysis of three designs was done.
In WaterGEMS, models were analyzed for the system with and without the loop addition. In
NeatWork, only a model was analyzed for the system without loops due to constraints of the
software.

12
Figure 3 shows the topography of the main branch, which begins at an elevation of 875m
and ending at an elevation of 825m. This provides 50m of pressure head, or 490 kPA of pressure,
for the system. The topography also shows that there are many relatively high and low points
throughout the system. At the high points, air-release valves will be installed to allow the
removal of air pockets that are at risk of forming in those locations, and at the low points
sedimentation release valves will be installed to allow sediment that has settled to be removed.
It is also important to notice the relative low point of 840 m at station 350 and the hill between
stations 400 and 600 that peaks at 860 m. The first community houses are located on the
backside of the hill near station 550. The initial design placed a tank near those houses for easy
access, but the final design moved the tank to the top of the hill to allow for more pressure
throughout the system.
Figure 3: Topography of Main branch showing a pressure head of 50 meters

13
The water will flow a different direction in the north branch depending on if the direction
of flow through the North Branch is dependent on whether or not the loop is present. Without the
loop, the water flows uphill from station zero to station 450. As seen in figure 4 without the loop,
the water will flow uphill, left to right. With the loop addition, the water will flow the opposite
direction from station 630 to zero where it will re-enter the main branch. The loop addition
allowed the water to flow with decreasing elevation throughout the system, which will provide
more uniform pressure distributions.
As requested by ASDENIC, the system will be modeled in two different software
packages, NeatWork and WaterGEMS. NeatWork is Nicaraguan based software that designs
specifically for gravity-fed water systems using the Darcy Weiss Bach friction equation. It is
available free of charge on the Neatwork official site. It runs using a 2010 version of Java and is
not compatible with any new versions. The system has a simple interface and allows for
information to be copied in from other tools such as Excel. It works by defining the topography
through the designation of the coordinates and elevation of the tank, each branch node, and any
faucets in the system. From there, specifying a variety of conditions specific to the project
creates a design. Once the system is designed, a variety of simulations can be run to predict how
the system behaves in different situation. The simulations are run using the Monte Carlo
Figure 4: Topography of the North Branch in orange and the Loop Addition in yellow.

14
Method. The main drawbacks of the NeatWork software are its inability to allow redundancies
and include more than one tank in the design.
WaterGEMS is more commonly used in the United States and requires that a license be
purchased from Bentley Software. It uses the Hazen Williams friction equation and offers a wide
variety of design options that allow the system to be customized. While the data entry method is
more tedious than NeatWork since it is not compatible with Excel, its capabilities are give
accurate results and allow for specific demand to be designed and analyzed. The capability of
WaterGEMS taken advantage for this project is its ability to design with loops and redundancies.
This will increase the reliability and resilience of the system. The Darwin Designer tool in
WaterGEMS optimizes a system for cost, which allows for more economic designs and allows
the designs to be compared to NeatWork.
The system will be designed with PVC because it is the most common material in the
region. Its easy installation, strength and lightweight add to its versatility and practicality. PVC,
however, is not environmentally friendly because it leaches chemicals into the soil. There is
currently no reasonably priced alternative to PVC for small piping systems. Although ASDENIC
did not provide any budget constraints, it is important for projects in developing communities
consider the cost. NeatWork comes with a database of PVC pipes sizes and costs. To ensure the
uniform comparison between all models, the information provided in NeatWork was also used in
the WaterGEMS model.
The loop was placed near the center of the system because it is near the majority of the
houses, the school and other community buildings. The taps at the community center will
probably get the most use because of the dense population increasing the risk of misuse and
breaks. By inserting the loop, it will protect the community against a system-wide failure and

15
provide a more resilient and reliable source of water by allowing a shut off without loss of
service. The analysis of both a loop and non-loop system was done and the cost was compared to
ensure the loop addition is worth the investment, which is detailed in the Design Alternatives
Section.
The demand at each of the 16 tap stands will be a minimum of 100 ml per second, but we
will aim to provide at least 200 ml per second to most tap stands. 200ml per second is the
recommended value in NeatWork, so will be used for consistency across all three models. The
minimum pressure in the tap stands will be 5kPa to ensure enough pressure to deliver a usable
amount of water. The maximum pressure in the system will be 175 kPa to ensure the PVC does
not burst. The velocity throughout the whole system will aim to be between 0.5 meters per
second and 3 meters per second. These values are recommended by “Field Guide to
Environmental Engineering for Development Workers” (Mihelcic). The lower limit is set to
prevent sediment from settling and clogging the pipes, and upper limit is set to prevent
turbulence from adding air pockets to the system.
Design Standards
The basis for design will come from the ASCE specification for a gravity fed water
systems, specifically referencing “Field Guide to Environmental Engineering for Development
Workers” (Mihelcic). The hydraulic equations are the same for any piping system, but there are
multiple ways to calculate the friction loss from the pipes. The most common are the Darcy-
Weisbach and the Hazen- Williams equations.
The governing equation for a hydraulic system comes from the principle of conservation
of energy. The energy equation for hydraulic systems is
𝑃1
𝛾+
8𝑄12
𝑔𝜋2𝐷14 + 𝑍1 + 𝐻𝑝 =
𝑃1
𝛾+
8𝑄22
𝑔𝜋2𝐷24 + 𝑍2 + ∑ 𝐻𝐿 . (1)
16
Equation 1 is used in both NeatWork and WaterGEMS. In the first term, P is the pressure, 𝛾 is
the specific weight of water (62.4. lb/ft3). The second term includes the flow rate Q (ft
3/s),
gravity g (32.2ft/s2) and the diameter D in feet. Z is the change in elevation from a reference
point in feet, Hp is the pressure head supplied in feet by the pump and hL is the head loss from
friction and minor losses.
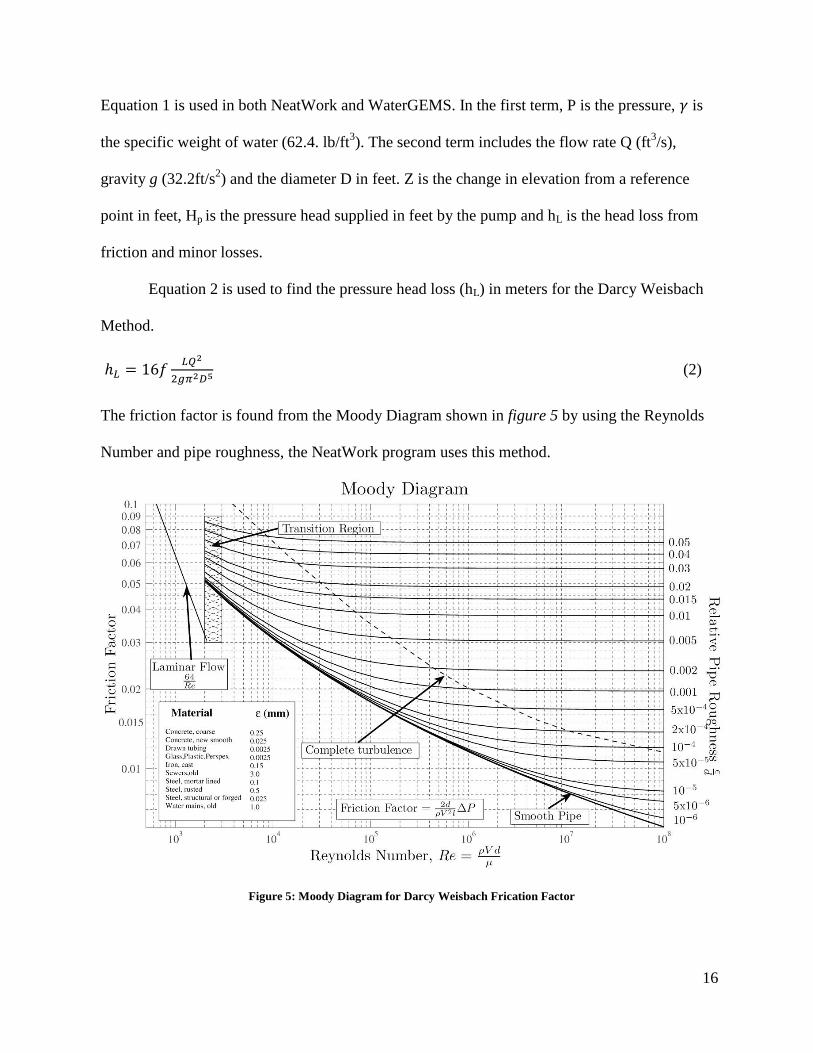
Equation 2 is used to find the pressure head loss (hL) in meters for the Darcy Weisbach
Method.
ℎ𝐿 = 16𝑓𝐿𝑄2
2𝑔𝜋2𝐷5 (2)
The friction factor is found from the Moody Diagram shown in figure 5 by using the Reynolds
Number and pipe roughness, the NeatWork program uses this method.
Figure 5: Moody Diagram for Darcy Weisbach Frication Factor

17
The pipe roughness (ε), for PVC as defined by NeatWork is 0.0015. And the equation for the
Reynolds Number is
𝑅𝑒 =𝜌𝑉𝑑
𝜇. (3)
Where ρ is the density of the liquid (1,000 kg/m³ for water) V is the velocity in meters per
second, d is the diameter in meters and μ is the fluid viscosity (1.002 x10⁻⁴
Pa-s at 20 degrees C).
The second method is the Hazen William Equation, which uses a coefficient C to account
for material roughness. The equation for head loss using with the Hazen Williams Equation is
ℎ𝐿 =10.67𝑄1.85
𝐶1.85𝑑4.865 (4)
The C coefficient for PVC is 150, Q is the flow in m3 per second and d is the diameter in meters.
The Hazen William method is the default in WaterGEMS.
Design Alternatives
The initial design idea focuses on establishing a system that would operate efficiently
with the given restrictions. ASDENIC proposed an initial route for the Main Branch and North
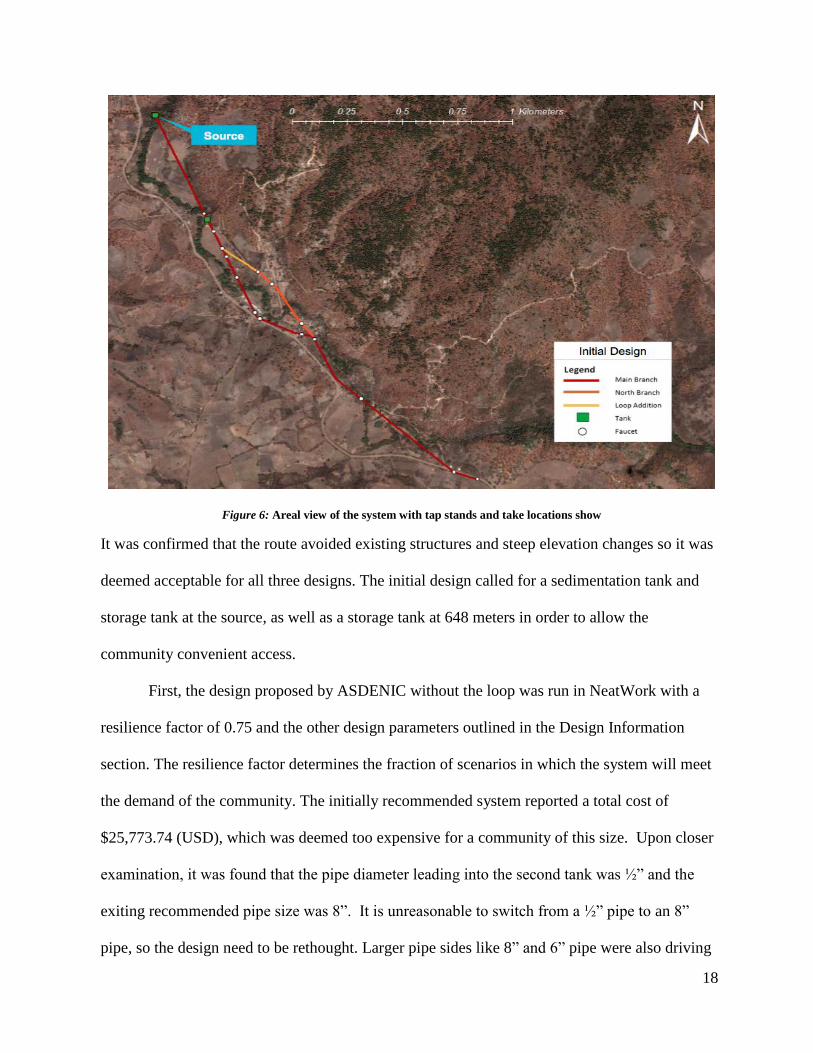
Branch of the Pipe, as seen in figure 6.
18
Figure 6: Areal view of the system with tap stands and take locations show
It was confirmed that the route avoided existing structures and steep elevation changes so it was
deemed acceptable for all three designs. The initial design called for a sedimentation tank and
storage tank at the source, as well as a storage tank at 648 meters in order to allow the
community convenient access.
First, the design proposed by ASDENIC without the loop was run in NeatWork with a
resilience factor of 0.75 and the other design parameters outlined in the Design Information
section. The resilience factor determines the fraction of scenarios in which the system will meet
the demand of the community. The initially recommended system reported a total cost of
$25,773.74 (USD), which was deemed too expensive for a community of this size. Upon closer
examination, it was found that the pipe diameter leading into the second tank was ½” and the
exiting recommended pipe size was 8”. It is unreasonable to switch from a ½” pipe to an 8”
pipe, so the design need to be rethought. Larger pipe sides like 8” and 6” pipe were also driving

19
up the cost of the system. The design without the loop was then tested in WaterGEMS, but a
system failure occurred. The Darwin Designer with in WaterGEMS would not recommend large
pipe sizes to overcome limited pressure head. Large pipe sizes decrease the velocity thus
decreasing the friction loss in the system. This confirmed the need to move the location of the
tank.
The tank was moved to station 493 with an elevation of 861m providing 40 m of pressure
head or 392 kPa of pressure for the system. The new location for the tank is before the first tap
stand allowing the storage tank at the source to be removed, cutting out that additional cost. The
water would now flow through the sedimentation basin at the source and then through 490
meters of pipe into the storage tank. From there, the water would be delivered to the rest of the
community. The three alternatives were then run for this new tank location.
NeatWork Design
The NeatWork design resulted in the cheapest cost for the piping system at
$4,766.22. But upon closer examination, the software is set to design for less than 100%
reliability, making it more likely to optimize cost over efficiency. While this delivers water to El
Bramadero for the majority of the time, the goal of this project was to increase the conditions to
100% reliable.
WaterGEMS Design without Loop
The total cost piping for the WaterGEMS model without the loop came to $5,528.78. Nearly
$2,000 of that was spent on a total of 801 meters of 1 ½” pipe. This was also the most length of
once size of pipe. The next largest cost was $1,040 for 441 meters of 1 ¼” pipe. There is 113

20
meters of 1” pipe with at total cost of $877, 661 meters of ¾” pipe for $951 and 982 meters of
½” pipe for a total cost of $686.
WaterGEMS Design with Loop
The pipes for the WaterGEMS design with the loop came to a total cost of $5,170. The
majority of the cost came from the 1286 meters of ¾” pipe with a total cost of $1,851.48. This is
a much smaller pipe size compared to the majority of the cost of the WaterGEMS design without
the Loop which came from 1 ½” pipes. 1 ½” pipes for this model were the second most total cost
at 497 meters for $1,217. There was significantly more ½” pipe in the system than other design
alternatives with 928 meters for a total of $974. There were 388 meters of 1 ¼” pipe and 113
meters of 1” pipe at $915 and $211 total respectively.
To see the engineering effects of the difference between the WaterGEMS design with and
without a loop, the Hydraulic Grade Line is compared to the elevation across the main branch of
the system. Both designs have a pressure head higher than the elevation, which implies positive
pressure throughout the system. The WaterGEMS design with the loop, highlighted in yellow,
slopes at a more gradual rate. The loop gives higher-pressure heads at the farthest faucets in the
system, which is to the benefit of the Community.

21
Figure 7: Hydraulic Grade Line for WaterGEMS Modles with and without Loop
Cost Comparison of Design Alternatives
The real difference in the various designs can be seen in the cost differentiation. During
the initial design phase, it was discovered that the NeatWork program included a pipe
information database that contained useful information such as the size of piping available and
the unit cost, as seen in Table 1. This database was used in all three designs in order to ensure a
universal comparison was made.
Table 1: Unit Cost of Pipe Sizes ranging from 1/2" to 2" in U.S. Dollars from NeatWork
Nominal Pipe Diameter U.S. Dollar per Meter
1/2" 1.05
3/4" 1.44
1 " 1.87
1 1/4" 2.36
1 1/2" 2.45
2 " 3.68

22
Each model provided the total length of each pipe size selected. By using Table 1, it was
possible to determine the total cost for each pipe size in each system. NeatWork optimized not
to use any of the 1 ¼” pipe size. The WaterGEMS model without the loop used the most of the 1
½” pipe, which was the largest pipe selected by all three designs. The WaterGEMS system with
the suggested loop in place cuts the cost of the amount of 1 ½” pipe used because the water is
diverted in more directions, allowing more ¾” pipe to be used.
Table 2: Length and Total Cost Per Pipe Size in U.S. Dollars for Each Design
NeatWork
WaterGEMS without
Loop WaterGEMS with Loop
Length (m) Cost (USD) Length (m) Cost (USD) Length (m) Cost (USD)
1 1/2" 647.256 $1,585.78 801 $1,962.45 497 $1,217.65
1 1/4" - - 441 $1,040.76 388 915.68
1" 1091.849 $2,041.76 469 $877.03 113 $211.31
3/4" 646.296 $930.67 661 $951.84 1286 $1,851.84
1/2" 198.115 $208.02 654 $686.70 928 $974.40
Table 2 shows that NeatWork provided the cheapest solution, and that lest cost effective design
is the WaterGEMS model without a loop. The WaterGEMS alternative without the loop the the
median cost.
Table 3: Total Pipe Cost Comparison in U.S. Dollars
NeatWork WaterGEMS without Loop
WaterGEMS with Loop
$4,766.22 $5,518.78 $5,170.88

23
Supplemental Materials
In addition to PVC pipe, other materials must be considered in the overall cost of the
system. Since the proposed location and number of tap stands is the same for each design, this
information is considered supplemental. When exploring the design of the tap stands, concrete
was deemed the best option because of its durability in extreme weather and stand up to to
livestock. It is also an accessible material in Nicaragua. The materials needed for each tap stand
include the faucet, concrete mix, rebar, galvanized pipe and PVC pipe. ***Table X*** shows
the estimated cost (USD) for all 16 tap stands. Figure XXXX shows the sketch of a typical
concrete tap stand for a rural developing community.
Figure 8: Concrete Tap Stand Design (Mihelcic)

24
Table 4: Supplemental Material Cost
Galvanized Iron Pipe $27.09
PVC within Tap stand $33.60
#4 Rebar $299.52
Concrete $255.68
90 Degree Elbow $41.60
Faucet Heads $117.60
Tank $700.00
Sedimentation $500.00
Sedimentation Valves $555.00
Aeration Valves $201.75
Total Supplemental Cost $2,731.84
In addition to the tap stands, the sedimentation basin and storage tank were designed for
the 1.15 L/s of flow from the source. The water first flows through the sedimentation basin to
remove the majority of the sediment. The tanks were designed based on recommendations from
Field Guide to Environmental Engineering for Development Workers (Mihelcic). The
sedimentation basin needs to be at least 4 meters long. Most basins have a length to width ration
of 1 to 4, so the basin will be 1 meter wide. A sedimentation basin does not store the water, water
flows through it dropping the sediment. The final dimension for the tank should be 4 meters by 1
meter by ¾ meter. A storage tank needs to hold enough water for 1 hour of peak usage. For El

25
Bramadero, this is 4 square meters. The dimensions of the storage tank are not as important as
the size. Any shape deemed most economic by ASDENIC will be acceptable.
Design Recommendation
When giving a final recommendation for the community of El Bramadero, it was
important to look back at the Sustainable Development Goals: Clean Water and Sanitation,
Industry Innovation and Infrastructure, and Climate Action. Clean Water and Sanitation
emphasizes the importance of providing a reliable source of water to all, so it was decided to
choose the most reliable system but still consider cost. The most reliable option is the
WaterGEMS design with the loop because it provides an important resilience factor for the
system. The loop is placed in the most population concentrated area of the community, so if a
portion were to break, the people would still have access to water via the alternate pipe rout.
Loops are not often used in developing communities because it adds cost, so using the loop,
aligns with the goal Industry, Innovation and Infrastructure. In the case of El Bramadero, the
pipe cost for the looped system is less expensive than the non-looped system. However, it is
important to keep in mind that the addition 80 meters of pipe will cost the community labor time.
The total cost of the looped system will be $7,902.72 (US). Although the NeatWork
design was the least expensive, the program designs for 75% reliability. Due the increasing
population, it is important for the system to be extremely reliable. Ensuring a reliable source of
water for the growing population is the final reason to recommend the slightly more expensive
looped design from WaterGEMS.

26
Future Research
The analysis of the looped and non-looped water distribution system in WaterGEMs
showed that in the case of El Bramadero, a looped system can be less expensive. Although there
is more total length of pipe, the lower cost is due to smaller pipe sizes that are used in the loop
when the water is diverted to two pipes. To expand our knowledge of piping systems in rural
areas, it would be beneficial to do a cost- benefit analysis of loop additions in a variety of
communities. Factors such as population size, topography, available pressure head and source
flow vary for every community. Analyzing each in a variety of communities will give engineers
a better sense of when a loop addition will be more cost effective or overall cost less than a
system without loops.
More specific to the community of El Bramadero, the location of tap stands and tanks can
have significant influence on the system. Before a final design is decided, the tank location and
tap stand locations should be analyzed further. The storage tank could be tested at different
elevations on the hill at station 500. In addition, it could be moved to the source to see if the few
meters of addition presser head are beneficial to the system despite not being in a convenient
location for the community to monitor. Different configurations for the tap stands could also be
tested. There are an infinite number of possibilities for tap stand arrangements, but by changing
the locations of a few, a better understanding of the weaknesses in the system could be found.
Conclusion
The design methods presented all deliver a dependable water supply to the community of
El Bramadero, while optimizing cost to ensure it will not cripple the people’s resources. This
system is designed for the growth of the community over the lifetime of the system, allowing the
people to reap the economic and health benefits of an in ground water distribution system. While

27
this design is specific to El Bramadero, the key points of 100% reliability and material needs can
be applied to other economically scarce water communities throughout the world.

28
Resources
Johnson, N. L., and M. E. Baltodano. "The Economics of Community Watershed Management:
Some Evidence from Nicaragua." Ecological Economics 49.1 (2004): 57-71. ProQuest.
Web.
Mihelcic, James R., et al. Field Guild to Environmental Engineering for Development Workers.
Reston, VA: ASCE Press, 2009. Print.
"Nicaragua - Climate." Climate. Nations Encyclopedia, n.d. Web
Romano, Sarah T., From “Protest to Proposal: The Contentious Politics of the Nicaraguan Anti-
Water Privatisation Social Movement.” Bulletin of Latin American Research. 31 (2012):
499–514. Print.
Sustainable Development Goals. Rep. N.p.: United Nations, 2015. Print.
World Health Organization and UNICEF Joint Monitoring Programme (JMP). (2015) Progress
on Drinking Water and Sanitation, 2015 Update and MDG Assessment.

29
Appendix A
NeatWork: Tree View

30
Appendix B: NeatWork: Solution
Begin End Total Length Length 1 Diameter 1 Length 2 Diameter 2
Source N1 30.866 24.000 0.2350 6.866 0.0182
N1 N2 30.866 24.000 0.2350 6.866 0.0182
N2 N3 30.866 24.000 0.2350 6.866 0.0182
N3 N4 30.866 24.000 0.2350 6.866 0.0182
N4 N5 30.866 24.000 0.2350 6.866 0.0182
N5 N6 30.866 24.000 0.2350 6.865 0.0182
N6 N7 30.866 24.000 0.2350 6.865 0.0182
N7 N8 30.866 24.000 0.2350 6.865 0.0182
N8 N9 30.866 24.000 0.2350 6.865 0.0182
N9 N10 30.866 24.000 0.2350 6.865 0.0182
N10 N11 30.865 24.000 0.2350 6.865 0.0182
N11 N12 30.865 24.000 0.2350 6.865 0.0182
N12 N13 30.865 24.000 0.2350 6.865 0.0182
N13 N14 30.865 24.000 0.2350 6.865 0.0182
N14 N15 30.865 12.865 0.2350 18.000 0.0182
N15 T 30.865 6.865 0.2350 24.000 0.0182
T N16 30.865 30.865 0.0459 0.000 0.0000
N16 N17 61.730 61.730 0.0459 0.000 0.0000
N17 N18 61.730 61.730 0.0459 0.000 0.0000
N18 N19 30.865 30.865 0.0459 0.000 0.0000
N19 N20 30.865 30.865 0.0459 0.000 0.0000
N20 N21 30.865 30.865 0.0459 0.000 0.0000
N21 N22 30.865 30.865 0.0459 0.000 0.0000
N22 N23 61.730 61.730 0.0459 0.000 0.0000
N23 N24 30.865 30.865 0.0459 0.000 0.0000
N24 N25 30.865 30.865 0.0459 0.000 0.0000
N25 N26 61.730 61.730 0.0459 0.000 0.0000
N26 N27 30.865 30.865 0.0459 0.000 0.0000
N27 N28 61.729 61.729 0.0459 0.000 0.0000
N28 N29 30.865 30.865 0.0459 0.000 0.0000
N29 N30 30.865 30.865 0.0459 0.000 0.0000
N30 N31 59.957 59.957 0.0459 0.000 0.0000

31
N31 N32 29.092 29.092 0.0459 0.000 0.0000
N32 N33 58.184 58.184 0.0459 0.000 0.0000
N33 N34 29.091 29.091 0.0459 0.000 0.0000
N34 N35 29.092 29.092 0.0459 0.000 0.0000
N35 N36 29.092 29.092 0.0459 0.000 0.0000
N36 N37 24.946 24.946 0.0459 0.000 0.0000
N37 N38 24.945 24.945 0.0459 0.000 0.0000
N38 N39 24.945 24.945 0.0459 0.000 0.0000
N39 N40 59.583 59.583 0.0459 0.000 0.0000
N40 N41 29.791 29.791 0.0459 0.000 0.0000
N41 N42 29.792 29.792 0.0459 0.000 0.0000
N42 N43 29.791 29.791 0.0459 0.000 0.0000
N43 N44 29.792 29.792 0.0459 0.000 0.0000
N44 N45 29.791 29.791 0.0459 0.000 0.0000
N45 N46 29.791 29.791 0.0459 0.000 0.0000
N46 N47 30.590 30.590 0.0459 0.000 0.0000
N47 N48 53.594 53.594 0.0235 0.000 0.0000
N48 N49 30.590 30.590 0.0235 0.000 0.0000
N49 N50 30.590 30.590 0.0235 0.000 0.0000
N50 N51 30.590 30.590 0.0235 0.000 0.0000
N51 N52 30.590 30.590 0.0235 0.000 0.0000
N52 N53 61.181 61.181 0.0235 0.000 0.0000
N53 N54 30.590 30.590 0.0235 0.000 0.0000
N54 N55 30.590 30.590 0.0235 0.000 0.0000
N55 N56 30.590 30.590 0.0235 0.000 0.0000
N56 N57 30.590 30.590 0.0235 0.000 0.0000
N57 N58 30.590 30.590 0.0235 0.000 0.0000
N58 N59 30.590 30.590 0.0235 0.000 0.0000
N59 N60 30.590 30.590 0.0235 0.000 0.0000
N60 N61 30.590 30.590 0.0235 0.000 0.0000
N61 N62 30.590 30.590 0.0235 0.000 0.0000
N62 N63 30.590 30.590 0.0235 0.000 0.0000
N63 N64 30.590 30.590 0.0235 0.000 0.0000
N64 N65 30.590 30.590 0.0235 0.000 0.0000

32
N65 N66 30.590 30.590 0.0235 0.000 0.0000
N66 N67 61.180 36.000 0.0235 25.180 0.0182
N67 N68 30.542 18.000 0.0235 12.542 0.0182
N68 N69 61.084 61.084 0.0182 0.000 0.0000
N69 N70 30.542 30.542 0.0182 0.000 0.0000
N47 N72 7.587 7.587 0.0235 0.000 0.0000
N72 N73 25.540 25.540 0.0235 0.000 0.0000
N73 N74 25.540 25.540 0.0235 0.000 0.0000
N74 N75 25.540 25.540 0.0235 0.000 0.0000
N75 N76 25.540 25.540 0.0235 0.000 0.0000
N76 N77 29.833 29.833 0.0235 0.000 0.0000
N77 N78 29.833 29.833 0.0235 0.000 0.0000
N78 N79 59.667 59.667 0.0235 0.000 0.0000
N79 N80 29.833 29.833 0.0235 0.000 0.0000
N80 N81 29.833 29.833 0.0235 0.000 0.0000
N81 N82 29.833 29.833 0.0235 0.000 0.0000
N82 N83 28.676 28.676 0.0235 0.000 0.0000
N83 N84 57.352 30.000 0.0235 27.352 0.0182
N16 F1 5.000 5.000 0.0182 0.000 0.0000
N17 F2 5.000 5.000 0.0182 0.000 0.0000
N22 F3 5.000 5.000 0.0182 0.000 0.0000
N25 F4 5.000 5.000 0.0182 0.000 0.0000
N27 F5 5.000 5.000 0.0182 0.000 0.0000
N30 F6 5.000 5.000 0.0182 0.000 0.0000
N32 F7 5.000 5.000 0.0182 0.000 0.0000
N39 F8 5.000 5.000 0.0182 0.000 0.0000
N47 F9 5.000 5.000 0.0182 0.000 0.0000
N52 F10 5.000 5.000 0.0182 0.000 0.0000
N66 F11 5.000 5.000 0.0182 0.000 0.0000
N68 F12 5.000 5.000 0.0182 0.000 0.0000
N70 N71 8.367 8.367 0.0182 0.000 0.0000
N78 F13 5.000 5.000 0.0182 0.000 0.0000
N83 F14 5.000 5.000 0.0182 0.000 0.0000
N84 F15 33.676 18.000 0.0235 15.676 0.0182

33
Appendix C: Neatwork: Velocity at Faucet Heads
Figure C: Velocity at Faucets when 60% open given 100 simulations.

34
Table C: Velocity at Faucet Heads in m/s for 60% of Faucets Open
Faucet
ID
Number
occurrences Min < 10% < 25% < 50% < 75% < 90% Max
F1 64 0.2124 0.2127 0.213 0.2138 0.2142 0.2145 0.215
F2 61 0.1788 0.1793 0.1797 0.1804 0.1812 0.1816 0.1826
F3 66 0.2161 0.2201 0.2218 0.2241 0.2262 0.2302 0.2325
F4 68 0.1506 0.155 0.1572 0.1593 0.1614 0.1637 0.1692
F5 55 0.1534 0.1575 0.1598 0.163 0.1648 0.1663 0.1705
F6 55 0.1589 0.1629 0.1664 0.1682 0.1704 0.1716 0.1767
F7 68 0.1294 0.1444 0.158 0.1621 0.1712 0.183 0.1935
F8 64 0.1478 0.1518 0.1567 0.1647 0.1803 0.1938 0.2214
F9 57 0.1152 0.1226 0.1356 0.1509 0.1705 0.1808 0.24
F10 58 0.1599 0.164 0.1688 0.1733 0.179 0.1876 0.2299
F11 49 0.1358 0.1493 0.1567 0.169 0.1878 0.2165 0.2622
F12 69 0.0609 0.0809 0.113 0.1297 0.1519 0.1961 0.2713
N71 66 0.0969 0.1198 0.1436 0.1684 0.1935 0.2767 0.3183

35
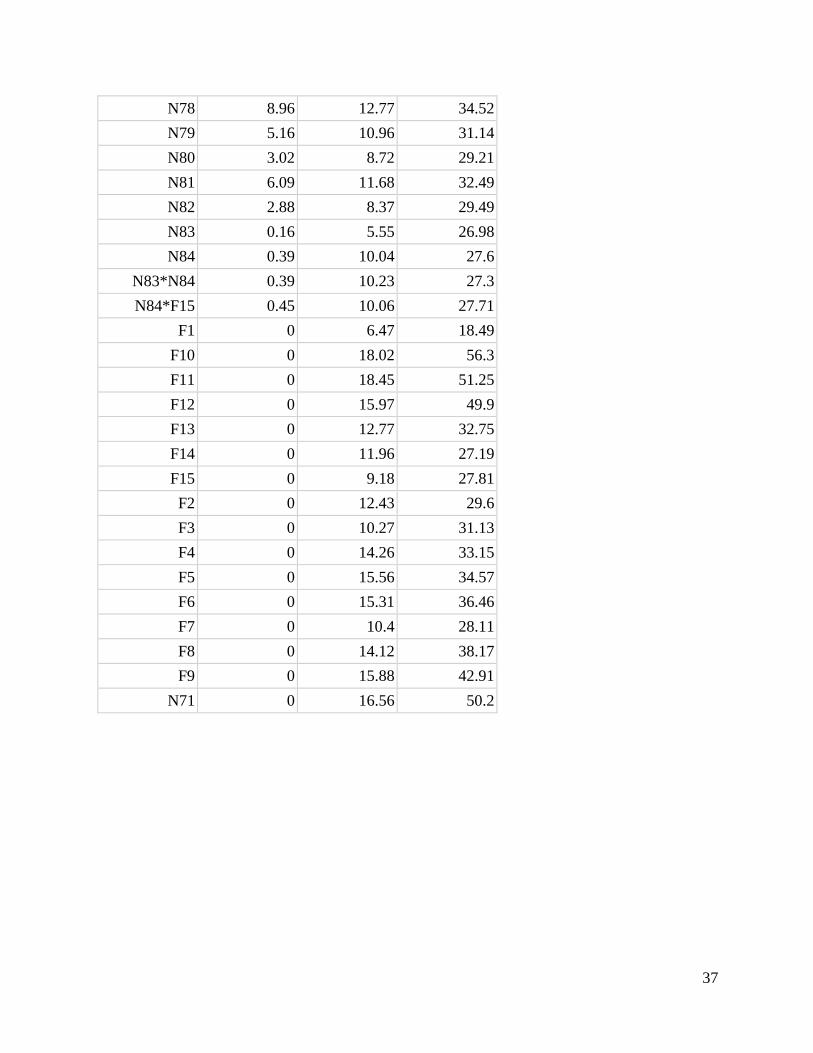
Appendix D
NeatWork: Node Pressures in Meters
Node ID Minimum Average Maximum
T 0 0 0
N16 13.21 13.48 13.71
N17 29.95 30.65 31.42
N18 25.85 26.89 27.98
N19 26.5 27.71 28.95
N20 24.55 25.94 27.34
N21 20.97 22.52 24.08
N22 23.15 24.87 26.59
N23 21.67 23.61 25.43
N24 20.11 22.15 24.15
N25 20.29 22.44 24.65
N26 19.17 21.4 23.86
N27 20.4 22.67 25.26
N28 22.9 25.28 28.22
N29 27.41 29.85 32.97
N30 26.51 29.01 32.3
N31 17.69 20.2 23.69
N32 17.36 19.88 23.46
N33 7.97 10.45 14.28
N34 7.72 10.18 14.14
N35 13.61 16.14 20.22
N36 18.24 20.84 25.03
N37 23.51 26.17 30.47
N38 25.04 27.76 32.2
N39 23.72 26.5 31.09
N40 23.84 26.68 31.5
N41 23.53 26.4 31.34
N42 21.74 24.64 29.7
N43 21.49 24.42 29.6
N44 18.31 21.27 26.56

36
N45 14.6 17.59 23
N46 15.44 18.46 23.99
N47 19.56 22.62 28.26
N48 20.82 24.01 29.66
N49 21.89 25.43 31.42
N50 23.25 27.13 33.46
N51 21.71 25.93 32.6
N52 22.78 27.34 34.95
N53 20.28 25.29 55.17
N54 18.94 23.97 54.75
N55 18.21 23.25 54.93
N56 18.61 23.67 56.25
N57 20.1 25.18 58.65
N58 19.78 24.88 59.26
N59 13.86 18.98 54.25
N60 18.24 23.38 59.55
N61 18.16 23.32 60.39
N62 15.82 21 58.97
N63 18.39 23.59 62.45
N64 16.73 21.95 61.71
N65 8.95 14.19 54.85
N66 4.27 9.53 51.09
N66*N67 4.64 12.25 51.84
N67 4.24 11.53 52.37
N67*N68 2.93 10.14 51.24
N68 1.68 8.74 50.46
N69 0.47 17.63 49.89
N70 0.75 17.7 50.49
N72 20.99 24.5 42.08
N73 22.73 26.22 44.45
N74 22.81 26.27 45.16
N75 20.62 24.06 43.61
N76 17.78 21.32 41.53
N77 11.63 15.31 36.29
37
N78 8.96 12.77 34.52
N79 5.16 10.96 31.14
N80 3.02 8.72 29.21
N81 6.09 11.68 32.49
N82 2.88 8.37 29.49
N83 0.16 5.55 26.98
N84 0.39 10.04 27.6
N83*N84 0.39 10.23 27.3
N84*F15 0.45 10.06 27.71
F1 0 6.47 18.49
F10 0 18.02 56.3
F11 0 18.45 51.25
F12 0 15.97 49.9
F13 0 12.77 32.75
F14 0 11.96 27.19
F15 0 9.18 27.81
F2 0 12.43 29.6
F3 0 10.27 31.13
F4 0 14.26 33.15
F5 0 15.56 34.57
F6 0 15.31 36.46
F7 0 10.4 28.11
F8 0 14.12 38.17
F9 0 15.88 42.91
N71 0 16.56 50.2

38
Appendix E: WaterGEMS without Loop: Tree View

39
Appendix F: WaterGEMS without Loop: Solution
Table F1: Pressures in KPa at each junction as modeled in WaterGEMS
Junction Pressure (Kpa) Junction Pressure (Kpa)
J-1 113.4 J-17 173.2
J-2 113.5 J-18 194.9
J-3 177.9 J-19 194.9
J-4 177.9 J-20 189.8
J-5 151.1 J-21 189.8
J-6 151.1 J-22 25.4
J-7 161.5 J-23 25.4
J-8 161.5 J-24 9.1
J-9 151.5 J-25 8.5
J-10 151.5 J-26 1.2
J-11 165.6 J-27 95.8
J-12 165.6 J-28 95.6
J-13 77.3 J-29 20.5
J-14 77.3 J-30 20.5
J-15 159 J-31 20.1
J-16 159 J-32 19.5
Table F2: Diameter, Cost, length and velocity for each section of pipe.
Pipe Diameter (mm) Diameter (in) Cost per Section Length (m) Velocity (m/s)
P-1 18.2 0.5 517.6 493 0.6
P-2 30.4 1 117 63 0.83
P-3 45.9 1.5 151.2 62 0.36
P-4 45.9 1.5 453.7 5 0.36
P-5 39.1 1.25 291.4 185 0.5
P-6 30.4 1 173.2 123 0.83
P-7 45.9 1.5 302.5 93 0.36
P-8 39.1 1.25 206 123 0.5
P-9 39.1 1.25 521.5 87 0.5
P-10 45.9 1.5 585.5 5 0.36

40
P-11 30.4 1 57.2 5 0.41
P-12 30.4 1 3,559.60 221 0.41
P-13 23.5 0.75 660.7 239 0.69
P-14 30.4 1 171.4 31 0.28
P-15 18.2 0.5 72.9 185 0.38
P-16 45.9 1.5 469.6 192 0.18
P-17 23.5 0.75 254.4 177 0.46
P-18 18.2 0.5 60.2 57 0.38
P-19 18.2 0.5 5.3 5 0
P-20 18.2 0.5 5.3 5 0
P-21 18.2 0.5 5.3 459 0
P-22 18.2 0.5 5.3 92 0
P-23 18.2 0.5 5.3 69 0
P-24 23.5 0.75 7.2 5 0
P-25 23.5 0.75 7.2 5 0
P-26 23.5 0.75 7.2 5 0
P-27 23.5 0.75 7.2 5 0
P-28 39.1 1.25 11.8 5 0
P-29 30.4 1 9.3 5 0.14
P-30 18.2 0.5 5.3 5 0.38
P-31 23.5 0.75 7.2 5 0.23
P-32 39.1 1.25 11.8 5 0.08
P-33 18.2 0.5 5.3 5 0.38

41
Appendix G
WaterGEMS with Loop Tree View

42
Appendix H
WaterGEMS with Loop Solution
Table H1: Pressures in KPa at each junction as modeled in WaterGEMS
Pipe Diameter (mm) Diameter (in) Cost per Section Length (m)
P-5 23.5 0.75 177.8 123
P-6 30.4 1 173.2 93
P-7 45.9 1.5 302.5 123
P-8 18.2 0.5 91.6 87
P-9 23.5 0.75 318.2 221
P-12 23.5 0.75 264.3 184
P-13 23.5 0.75 660.7 459
P-14 23.5 0.75 132 92
P-15 18.2 0.5 72.9 69
P-23 18.2 0.5 5.3 5
P-24 18.2 0.5 5.3 5
P-25 30.4 1 9.3 5
P-26 18.2 0.5 5.3 5
P-27 23.5 0.75 7.2 5
P-28 18.2 0.5 5.3 5
P-29 30.4 1 9.3 5
P-30 18.2 0.5 5.3 5
P-31 18.2 0.5 5.3 5
P-32 23.5 0.75 7.2 5
P-4 45.9 1.5 453.7 185
P-22 18.2 0.5 5.3 5
P-10 18.2 0.5 250.9 239
P-11 39.1 1.25 72.2 31
P-16 23.5 0.75 276 192
P-18 45.9 1.5 140.5 57
P-19 45.9 1.5 16.4 7
P-17 39.1 1.25 417 177

43
P-33 30.4 1 9.3 5
P-34 18.2 0.5 5.3 5
P-35 30.4 1 9.3 5
P-1 18.2 0.5 517.6 493
P-2 45.9 1.5 153.3 63
P-3 45.9 1.5 151.2 62
P-21 23.5 0.75 7.2 5
P-20 39.1 1.25 424.8 180
Table H2: Pressure in KPa for each junction as modeled in WaterGEMS.
Junction Pressure (Kpa) Junction Pressure (Kpa)
J-1 125 J-18 153.3
J-2 125.1 J-19 153.2
J-3 187.1 J-20 206
J-4 187.1 J-21 205.5
J-5 153 J-22 41.7
J-6 153 J-23 41.1
J-7 157.5 J-24 17.6
J-8 157.5 J-25 17.5
J-9 168.1 J-26 9.7
J-10 168.1 J-27 135.6
J-11 186 J-28 135.5
J-12 186 J-29 94.4
J-13 66.9 J-30 94.4
J-14 66.9 J-31 102.4
J-15 138.1 J-32 102.4
J-16 137.5 J-33 96.5
J-17 131.1