Embed Size (px)
Citation preview

(1st Revision) 8. Customer, Energy and Demand Forecast October 11, 2007
Newfoundland Power Inc. Customer, Energy and Demand Forecast
2007 - 2008
September 2007

(1st Revision) 8. Customer, Energy and Demand Forecast October 11, 2007
Newfoundland Power – 2008 General Rate Application Page i
Table of Contents Page
1.0 Introduction........................................................................................................................ 1 2.0 Forecast Methodology ....................................................................................................... 1 3.0 Key Forecast Assumptions ................................................................................................ 2 3.1 Economic Outlook ................................................................................................. 2 3.2 Energy Prices Outlook ........................................................................................... 3 3.3 Other Inputs ........................................................................................................... 4 4.0 Customer and Energy Forecast .......................................................................................... 4 5.0 Purchased Energy and Demand Forecast........................................................................... 5 6.0 Forecast Accuracy.............................................................................................................. 6 Appendix A: Key Economic Indicators Appendix B: Customer and Energy Forecast 2007 – 2008F Appendix C: Purchased Energy & Demand Forecast 2007 – 2008F Appendix D: Comparison of Forecast Energy Sales to Weather Adjusted Actual Sales

(1st Revision) 8. Customer, Energy and Demand Forecast October 11, 2007
Newfoundland Power – 2008 General Rate Application Page 1
1.0 INTRODUCTION The Customer, Energy and Demand forecast, which is prepared annually, forms the foundation of Newfoundland Power’s planning process. The forecast is a key input in developing estimates of capital expenditures required to ensure the electrical system can meet the increasing demands associated with both customer and energy sales growth. The forecast also directly impacts the forecast of both revenue from electrical sales and the Company’s single largest expenditure, purchased power. These items are key components of the Company’s financial planning process. 2.0 FORECAST METHODOLOGY Newfoundland Power provides electrical service to three distinct categories of customers: domestic; general service; and, street and area lighting. In 2006, domestic accounted for 60 percent of total energy sales while general service and street and area lighting represent 39 percent and 1 percent, respectively. The domestic category, Rate # 1.1, primarily refers to residential dwellings such as single detached homes, single attached homes, apartments and mobile homes. The category also includes non-residential services such as cottages, personal use garages and other meter services that qualify for the domestic rate category. Residential customers use electricity primarily for space and water heating, and the operation of miscellaneous appliances and lighting. In this category a customer/average use methodology is employed where customer growth is primarily based on the housing starts while average use is forecast using an end-use/econometric model that includes the market share for electric space heating, personal disposable income and the marginal price of electricity in the current and previous year. The general service category primarily refers to commercial, institutional and industrial customers. Unlike the domestic category which represents a homogenous group of customers, the general service category represents a very diverse group whose activities include, trade, finance, real estate, public administration, health, education, commercial services, transportation, manufacturing, mining, fishing, forestry and construction. These customers provide goods and services to the local market as well as for export. In 2006, approximately 85 percent of energy sales in this category were to customers in the service producing sector of the economy while only 15 percent were in the goods producing sector. From a forecasting perspective the general service category is divided into small general service which includes Rate # 2.1 0 - 10 kW and Rate # 2.2 10 – 100 kW (110 kVA) and large general service which includes Rate # 2.3 110 kVA (100 kW) – 1000 kVA and Rate # 2.4 1000 kVA and Over. In the small general service category a customer/average use methodology is employed where the number of customers is primarily based on the number of domestic customers while average use is forecast using an econometric model that includes the Gross Domestic Product for the service sector per small general service customers and the average price of electricity in the current year.

(1st Revision) 8. Customer, Energy and Demand Forecast October 11, 2007
Newfoundland Power – 2008 General Rate Application Page 2
In the large general service category, given the relatively small number of customers in this group, an informed opinion methodology is employed and energy sales are forecast on an individual customer basis. Street and area lighting energy sales are directly related to the number of fixtures required to meet the lighting needs of both municipalities and unincorporated communities. At the end of 2006 approximately 55,700 fixtures were installed with high pressure sodium fixtures accounting for 85 percent of these fixtures and mercury vapour accounting for the remainder. Given the nature of this category an end use forecasting methodology is employed. The street and area lighting sales forecast is determined by multiplying the forecast quantity of fixtures by the amount of electricity consumed for each fixture type and wattage. Total energy sales are calculated by adding domestic, general service, and street and area lighting sales. Company use, system losses and wheeled are then added to total energy sales to obtain total produced, purchased and wheeled. Company use includes all electricity consumed in facilities owned by Newfoundland Power and used in the delivery of service to customers. System losses refer to energy that is lost during the transmission and distribution of energy between the source of supply and delivery to customers. Wheeled information is provided by Newfoundland and Labrador Hydro. Purchased energy is calculated by subtracting normal hydraulic production from the forecast of total produced and purchased. Each year normal production is adjusted to reflect plant availability and any modifications to plants that may impact production. Purchased power demand is calculated by subtracting the hydraulic generation credit from native peak. Newfoundland Power’s native peak is determined using a load factor based methodology. The load factor used in the calculation is the average of 15 years of normalized annual load factors. Native peak is calculated by applying the average load factor to total produced and purchased power. This peak is adjusted to reflect the impact of load curtailment by Newfoundland Power customers and at company owned facilities. 3.0 KEY FORECAST ASSUMPTIONS The forecasting process relies on a wide range of information related to the economy, energy prices and other resource based developments within Newfoundland Power’s Service territory. 3.1 Economic Outlook While the Company monitors forecasts from various banks and financial institutions the Conference Board of Canada is the Company’s primary provider of economic information. The economic assumptions used in preparing the customer and energy sales forecasts are based on the Conference Board of Canada, Provincial Outlook Summer 2007, <> Economic Forecast, dated July 18, 2007. A table summarizing the key economic indicators contained in this forecast for 2007 and 2008 is shown in Appendix A. A copy of the Conference Board of Canada’s <> economic forecast is enclosed as Attachment A.

(1st Revision) 8. Customer, Energy and Demand Forecast October 11, 2007
Newfoundland Power – 2008 General Rate Application Page 3
Since 1996, the Newfoundland and Labrador economy has been primarily driven by the mining sector. Large resource based projects such as Hibernia, Terra Nova, White Rose and Voisey’s Bay have resulted in the mining sector experiencing average annual growth in excess of 20 percent per year during this period. As a result Newfoundland and Labrador has lead the country in economic growth in 5 of the past 10 years. The fishing sector has also contributed with increased landings of both crab and shrimp. These developments have positively impacted other key economic indicators such as personal income, unemployment rates and service sector growth. As in recent years economic performance will continue to be driven by large resource based projects. In 2006 economic growth was negatively impacted by a two-month strike at Voisey’s Bay and lost production due to a six-month shutdown at the Terra Nova offshore oil field. With both projects fully operational, real GDP growth is forecast to jump from 3.0 percent in 2006 to a country leading 7.1 percent in 2007. In 2008, with lower production at the Hibernia offshore oil field, real GDP growth is forecast to drop to 0.4 percent, the lowest in the country. Even with the strong growth in real GDP, the underlying domestic economy remains weak with declining population, weak consumer spending, low employment growth, high unemployment and low growth in real personal disposable income and service sector GDP growth. Given Newfoundland Power’s customer base, energy sales growth is primarily influenced by the domestic economy. More specifically, growth in the service sector, changes in employment levels, personal income, energy prices and population demographics in the Company’s service territory are more determinative of sales growth than resource industry production levels. Economic growth will not be uniform across Newfoundland Power’s service territory. In the Northeast Avalon, growth will continue to be strong principally due to activities related to the offshore oil industry. In contrast much of rural Newfoundland and Labrador is expected to continue the trend of economic stagnation. 3.2 Energy Prices Outlook Changes in energy prices have a direct impact on energy sales growth through the inclusion of price elasticity effects in the various models. Overall, analysis of customer response to changes in the price of electricity is relatively inelastic. That is to say a 1 percent change in the price of electricity will result in a change in energy sales of less than 1 percent. The current model indicated that a 1 percent increase in the price of electricity will result in a 0.25 percent decrease in energy sales. The model also indicates the response will vary depending on the time frame and rate category. In addition, changes in oil prices can impact the market share of electricity in the competitive space heating market. The energy sales forecast is impacted by changes in the price of electricity during the past two years as well forecast changes in the price of electricity. Electricity prices forecasts are developed based on information available internally and provided by Newfoundland and Labrador Hydro. The annual review of the rate stabilization mechanism resulted in increases in

(1st Revision) 8. Customer, Energy and Demand Forecast October 11, 2007
Newfoundland Power – 2008 General Rate Application Page 4
the price of electricity of 5.2 percent on July 1, 2005 and 4.8 percent on July 1, 2006. Electricity prices also increased by approximately 0.1 percent on January 1, 2007 as a result of a combination of higher purchased power cost from Newfoundland and Labrador Hydro and a reduction in Newfoundland Power’s rate of return. The forecast <> includes an electricity rate decrease of 2.9 percent on July 1, 2007 as a result of the rate stabilization mechanism. The forecast assumes no change in the price of electricity <> on July 1, 2008 as a result of the rate stabilization mechanism. <> As proposed in Newfoundland Power’s application, a 2.8 percent increase in current customer rates effective January 1, 2008 has been included in the energy sales forecast under proposed rates. Furnace oil prices are expected to remain at the 2006 level in 2007 and <> 2008. This projection is consistent with the forecast of No. 6 fuel forecast used in the calculation of the Rate Stabilization Plan adjustments. 3.3 Other Inputs Information from a number of other sources is used in preparing the forecast. Each year Newfoundland Power surveys approximately 150 customers representing approximately 600 accounts requesting information with respect to future load requirements. This information along with information gathered from Newfoundland Power regional operations, the St. John’s Board of Trade, various other trade organizations, and the provincial and federal government is also incorporated into the large general service forecast. In addition, information from Canada Mortgage and Housing with respect to housing starts is combined with information received from the Conference Board of Canada in preparing the domestic customer forecast.
4.0 CUSTOMER AND ENERGY FORECAST Appendix B shows the customer and energy forecasts for the 2007 - 2008 period under both existing and proposed rates. Under both scenarios the total number of customers is forecast to increase by 1.1 percent in 2007 and <> 2008. Energy sales under existing rates are forecast to increase by 2.3 percent in 2007 and 2.4 percent in 2008. Energy sales under proposed rates are forecast to increase by 2.3 percent in 2007 and 2.0 percent in 2008. Under both forecasts energy sales in 2008 are higher by 0.3 percent due to an additional day of sales resulting from 2008 being a leap year. Domestic customer growth is largely a result of housing starts. The Conference Board of Canada forecasts housing starts of 1,942 units in 2007 and 1,634 in 2008 while Canada Mortgage and Housing is projecting 2,100 units in 2007 and 2,025 units in 2008. Using an average of these forecasts the number of domestic customers is forecast to grow by 1.2 percent in 2007 and 1.1 percent in 2008. Domestic electricity consumption is a function of the major end uses in the home, such as space heating, water heating, lighting, and major appliances. In addition, changes in energy prices and

(1st Revision) 8. Customer, Energy and Demand Forecast October 11, 2007
Newfoundland Power – 2008 General Rate Application Page 5
income have an impact on electricity consumption. Using proposed rates the average use of energy is forecast to increase <> 1.5 percent in 2007 and by 1.1 percent in 2008. The combined impact of increased numbers of customers and changes in average use will result in growth in domestic energy sales under proposed rates of 2.7 percent in 2007 and 2.2 percent in 2008. In the small general service rate classes 2.1 and 2.2, customer and energy sales growth are dependent on growth in the service-producing sector of the GDP and changes in the price of electricity. In the large general service rate classes 2.3 and 2.4, energy sales are also influenced by changes in the service-producing sector of the GDP. However, in the large general service category, energy sales are mainly determined by changes in the load of larger customers in the goods-producing sector. Information obtained from specific customers is incorporated into forecasts for rate classes 2.3 and 2.4. Overall, the number of General Service customers is forecast to grow by 0.6 percent in 2007 and <> 2008. Under proposed rates the volume of General Service energy sales is forecast to grow by 1.7 percent in 2007 and 1.8 percent in 2008. In the street and area lighting class the number of customers is forecast to grow on average by 0.6 percent during the 2007 – 2008 period while the volume of energy sales is forecast to grow on average by 0.4 percent. The volume of street and area lighting energy sales continues to be impacted by the conversion of mercury vapour lights to the energy efficient high pressure sodium fixtures. Produced and purchased is the sum of total energy sales, company use and system losses. The forecast of company use is based on historical energy usage and information gathered from each of Newfoundland Power’s operating areas with respect to the operation of these facilities. System losses are based on historical information and are forecast to be approximately 5.4 percent of total produced and purchased. 5.0 PURCHASED ENERGY AND DEMAND FORECAST Purchased energy is calculated by subtracting Newfoundland Power’s normal hydraulic production from produced and purchased. Newfoundland Power’s normal hydraulic production is based on the Water Management Study – Hydrology Update prepared by SGE Acres Limited in 2005. This study recommended a normal production of 419.6 GWh. Each year, normal production is adjusted to reflect plant availability and any modifications to plants that may impact production. In 2007 the refurbishment of Rattling Brook Hydro plant will result in lost production of 38.2 GWh. In 2008 the normal hydro production has been increased by 6.2 GWh to reflect increased production resulting from the modifications to the Rattling Brook Hydro plant. Newfoundland Power’s forecast of native peak demand is determined by applying the average weather adjusted load factor to the forecast of produced and purchased energy. The peak demand is then adjusted to reflect the impact of load curtailment by Newfoundland Power customers and

(1st Revision) 8. Customer, Energy and Demand Forecast October 11, 2007
Newfoundland Power – 2008 General Rate Application Page 6
company owned facilities. Newfoundland Power’s purchased demand is then derived by subtracting the generation credit approved by the Public Utilities Board. A copy of the Energy Purchased and Demand forecast is contained in Appendix C. 6.0 FORECAST ACCURACY The energy sales forecasts and actual weather adjusted energy sales for the past 10 years are shown in Appendix D. During this period, differences from forecast have ranged from a high of 2.7 percent to a low of 0.1 percent with differences being 1 percent or less in 7 of the past 10 years. Further, the analysis of differences indicates that 50 percent of the time the actual was higher than forecast and vice versa.

8. Customer, Energy and Demand Forecast 2007-2008
Key Economic Indicators1
2006 - 2008F
(millions of dollars)
ForecastChange Change Change
Indicator 2005 2006 From 2005 2007 From 2006 2008 From 200712 Gross Domestic Product ($ 1997)34 Goods Producing Industries 5,074 5,198 2.4% 5,934 14.1% 5,843 -1.5%56 Service Producing Industries 8,329 8,486 1.9% 8,744 3.0% 8,897 1.7%78 Total of All Industries 13,696 14,104 3.0% 15,101 7.1% 15,165 0.4%91011 Consumer Price Index (1992=100) 126.1 128.4 1.8% 130.6 1.7% 133.1 1.9%121314 Personal Disposable Income ($ 1992) 8,268 8,588 3.9% 8,577 -0.1% 8,741 1.9%151617 Unemployment Rate (%) 15.2% 14.8% 13.5% 13.2%181920 Housing Starts - Units 2,498 2,234 -10.6% 1,942 -13.1% 1,634 -15.9%212223 Canadian GDP Deflator (1997=100) 120.5 123.6 2.6% 127.1 2.9% 128.8 1.3%242526 Canada Mortgage and Housing Corporation2
2728 Housing Starts - Units 2,498 2,234 -10.6% 2,100 -6.0% 2,025 -3.6%2930313233343536 1 Conference Board of Canada, Provincial Outlook Summer 2007, Economic Forecast, Dated: July 18, 2007.37 2 Canada Mortgage and Housing Corporation, Housing Market Outlook, Third Quarter, 2007.
1st Revision Note: Updated for revised forecasts for 2007 and 2008.
Newfoundland Power - 2008 General Rate Application
Appendix A(1st Revision)
Newfoundland Power Inc.
Page 1 of 1
October 11, 2007

Actual Existing Proposed
Percentage Percentage Percentage Percentage Percentage2005 2006 Change 2007 Change 2008 Change 2007 Change 2008 Change
1 Customers2 3 Domestic 1.1 196,412 198,568 1.1% 200,935 1.2% 203,197 1.1% 200,935 1.2% 203,197 1.1%45 General Service6 0-10 kW 2.1 12,046 11,915 -1.1% 11,897 -0.2% 11,903 0.1% 11,897 -0.2% 11,903 0.1%7 10-100 kW (110 kVA) 2.2 8,114 8,261 1.8% 8,408 1.8% 8,525 1.4% 8,408 1.8% 8,525 1.4%8 110 kVA (100 kW) - 1000 kVA 2.3 1031 1,031 0.0% 1,028 -0.3% 1,038 1.0% 1,028 -0.3% 1,038 1.0%9 1000 kVA and Over 2.4 61 61 0.0% 62 1.6% 64 3.2% 62 1.6% 64 3.2%10 11 Total General Service 21,252 21,268 0.1% 21,395 0.6% 21,530 0.6% 21,395 0.6% 21,530 0.6%1213 Street and Area Lighting 4.1 9,637 9,664 0.3% 9,727 0.7% 9,783 0.6% 9,727 0.7% 9,783 0.6%14 15 Total Customers 227,301 229,500 1.0% 232,057 1.1% 234,510 1.1% 232,057 1.1% 234,510 1.1%1617 Energy Sales (GWh)1819 Domestic 1.1 2,988.6 2,981.1 -0.3% 3,063.0 2.7% 3,149.5 2.8% 3,063.0 2.7% 3,130.8 2.2%2021 General Service22 0-10 kW 2.1 96.7 94.0 -2.8% 93.0 -1.1% 95.6 2.8% 93.0 -1.1% 95.8 3.0%23 10-100 kW (110 kVA) 2.2 611.4 616.4 0.8% 633.1 2.7% 646.5 2.1% 633.1 2.7% 647.4 2.3%24 110 kVA (100 kW) - 1000 kVA 2.3 862.7 854.0 -1.0% 869.5 1.8% 875.3 0.7% 869.5 1.8% 875.3 0.7%25 1000 kVA and Over 2.4 411.4 413.7 0.6% 417.0 0.8% 429.6 3.0% 417.0 0.8% 429.6 3.0%26 27 Total General Service 1,982.2 1,978.1 -0.2% 2,012.6 1.7% 2,047.0 1.7% 2,012.6 1.7% 2,048.1 1.8%2829 Street and Area Lighting 4.1 36.1 35.9 -0.6% 36.1 0.6% 36.2 0.3% 36.1 0.6% 36.2 0.3%30 31 Total Energy Sales 5,006.9 4,995.1 -0.2% 5,111.7 2.3% 5,232.7 2.4% 5,111.7 2.3% 5,215.1 2.0%3233 Company Use 12.0 11.7 -2.5% 11.8 0.9% 11.8 0.0% 11.8 0.9% 11.8 0.0%3435 Losses 279.9 285.9 2.1% 292.2 2.2% 299.9 2.6% 292.2 2.2% 298.8 2.3%3637 Produced & Purchased 5,298.8 5,292.7 -0.1% 5,415.7 2.3% 5,544.4 2.4% 5,415.7 2.3% 5,525.7 2.0%3839 Wheeled 62.1 61.7 -0.6% 71.4 15.7% 75.8 6.2% 71.4 15.7% 75.8 6.2%4041 Total System Energy 5,360.9 5,354.4 -0.1% 5,487.1 2.5% 5,620.2 2.4% 5,487.1 2.5% 5,601.5 2.1%
Note:1 All amounts are reported on an accrued basis.1st Revision Note: Updated for revised forecasts for 2007 and 2008.
8. Custom
er, Energy and Dem
and Forecast 2007-2008
New
foundland Power - 2008 G
eneral Rate ApplicationPage 1 of 1
Newfoundland Power Inc.
2007 - 2008FCustomer & Energy Forecast1
Appendix B
(1st Revision)
October 11, 2007

Newfoundland Power Inc.
Purchased Energy & Demand Forecast2007 - 2008F
1 Produced Total Total Total Produced2 Purchased Wheeled Curtailed & Purchased Total3 & Wheeled Energy Demand (NP Native Peak) NP Produced Purchased4 (1) (2) (3) (4) (5)5 Load Credit6 Year GWH GWH MW GWH MW Factor GWH MW GWH MW78 Existing9 2007 5,487.1 71.4 10.0 5,415.7 1,219.82 50.27% 381.7 117.93 5,034.0 1,101.8910 2008 5,620.2 75.8 10.0 5,544.4 1,245.61 50.27% 425.8 117.93 5,118.6 1,127.681112 Proposed13 2007 5,487.1 71.4 10.0 5,415.7 1,219.82 50.27% 381.7 117.93 5,034.0 1,101.8914 2008 5,601.5 75.8 10.0 5,525.7 1,241.37 50.27% 425.8 117.93 5,099.9 1,123.441516 Notes:17 1. Energy for 2008 is based upon a leap year (8,784 hours).18 2. Based on historical performance of participants plus curtailment of company owned facilities. 19 3. Load Factor is based on an average of 15 year historical (normalized) load factors.20 4. Average water year for the forecast period is 419.6 GWh adjusted for plant availability and efficiency improvements.21 5. Assumes a generation credit of 117.93 MW.
Page 1 of 1 1st Revision Note: Updated for revised forecasts for 2007 and 2008.
8. Custom
er, Energy and Dem
and Forecast 2007-2008
New
foundland Power - 2008 G
eneral Rate Application
Appendix C
(1st Revision)
October 11, 2007

8. Customer, Energy and Demand Forecast 2007-2008
Newfoundland Power Inc.
Comparison of Forecast Energy SalesTo Weather Adjusted Actual Sales1
Forecast Weather AdjustedSales2 Actual Sales Difference
(GWh) (GWh) (GWh) (%)12 1997 4,400.5 4,438.0 37.534 1998 4,443.7 4,439.6 -4.156 1999 4,516.4 4,499.7 -16.778 2000 4,558.5 4,554.8 -3.7910 2001 4,592.3 4,666.7 74.41112 2002 4,652.0 4,764.9 112.91314 2003 4,852.2 4,882.0 29.81516 2004 4,927.0 4,978.6 51.61718 2005 5,010.1 5,004.0 -6.11920 2006 5,130.6 4,991.2 -139.42122232425 Notes:
26 2 The forecast sales figures are from the annual forecasts prepared in the previous year and27 were part of the Capital Budget presentations made to the Board in those years. The 1997,28 1999, 2003 and 2004 forecasts were the basis for the revenue requirement determinations 29 presented as part of the Company's rate applications in 1996, 1998 and 2003, respectively.
Newfoundland Power - 2008 General Rate Application Page 1 of 1
1 All amounts are reported on a billed basis.
0.6
October 11, 2007
0.9
-0.1
-0.4
1.0
-0.1
-2.7
Appendix D
-0.1
1.6
2.4

Attachment A (1st Revision)
8. Customer, Energy and Demand Forecast 2007-2008 October 11, 2007
Newfoundland Power - 2008 General Rate Application
Conference Board of Canada Provincial Outlook Summer 2007
Economic Forecast Dated: July 18, 2007


The Conference Board of Canada Insights You Can Count On
Provincial Outlook Summer 2007: Economic Forecast by The Conference Board of Canada
Preface The Provincial Outlook Summer 2007 was prepared by Marie-Christine Bernard, Associate Director, under the general direction of Paul Darby, Deputy Chief Economist.
The report examines the economic outlook for the provinces, including gross domestic product (GDP), output by industry and labour market conditions. At the end of the report, there is a forecast for Canadian economic indicators and a comparison of GDP by province and industry.
The Provincial Outlook is updated quarterly using the Conference Board's large econometric model of the provincial economies.
The publication can be accessed on-line at www.e-library.ca and for clients subscribing to e-Data at www.conferenceboard.ca/edata.htm. For more information, please contact our information specialist at 613-526-3280 or 1-866-71 1-2262 or e-mail [email protected].

Contents ............................ Executive Summary-High-Flying Loonie: A Concern for Central Canada i
....................................... Synopsis -- La hausse du dollar prkoccupe le Canada central v .. -.
............. Newfoundland and Labrador-Increased Oil Production Leads to Strong Economic Growth 1
....
............................... Prince Edward 1sland-G DP Growth Steady and Poised to Accelerate 4
................................. Nova Scotia-Steady Gains in Services Sector Keep Economy Afloat 7
..................................... New Brunswick-Momentum in the Economy to be Sustained 10
............................... Quebec-Loonie's 30-Year High Creating More Impediments to Trade 13
............................. Qu6bec -- La force du huard cause des difficultCs au commerce extkrieur 16
........................................... Ontario-0 n the Road to Recovery. One Step at a Time 19
.................................................... Manitoba-Robust and Diversified Economy 22
........................................................ Saskatchewan-Hot Domestic Demand 25
-. - .
Alberta-Oil Sands Development Bears Fruit: Oil Production Jumps in 2008 .......................... 28
British Columbia-Forestry Woes Putting a Dent in Economic Growth . . . . . . . . . . . . . . . . . . . . . . . . . . . . . . 31
Forecast Tables ............................................................................ 34


EXECUTIVE SUMMARY Marie-Chris tine Bernard
High-Flying Loonie: A Concern for Central Canada
NATIONAL OVERVIEW
T he Canadian economy charged ahead early this year, posting annualized growth of 3.7 per cent in the first quarter. Real gross domestic product (GDP) growth prospects for 2007
have, however, been revised down. This is due entirely to the impact that the second-quarter surge in the loonie is expected to have on Canada's economic growth over the remainder of the year. The loonie's rise was unexpected, bolstered not by changes to funda- mental drivers but by financial market sentiment surrounding the strength of the economy, potential interest rate moves, and the effects of a number of foreign companies announcing their intentions to acquire Canadian businesses. Indeed, the difference between the first- and second-quarter averages for the Canadian dollar was nine cents US.-a swift 11 per cent appreciation in just three months! That pace of increase far exceeds anything we've seen in the recent past.
As a result of the jump in the dollar, Canadian exporters and man- ufacturers will struggle. For the most part, Canadian manufacturers have met the challenge of the loonie's strengthening since 2002 by cutting back on workers and investing heavily in productivity- enhancing machinery. If the 62,000 job losses in manufacturing between April and June are any indication, this trend will likely continue through the rest of this year. A strengthening loonie goes a
long way toward reducing the cost of imported machinery, while the accelerated capital cost allowances announced in the 2007 federal budget should also help encourage investment. As the restructuring continues, Canada's export performance will remain muted again in 2007, with real growth of only 2.1 per cent. Moreover, lower prices for goods produced outside Canada will undoubtedly encourage robust gains in imports, with the result being that the trade balance is expected to strip 0.5 percentage points from growth in 2007. Overall then, real GDP is expected to advance by 2.5 per cent in 2007, sustained by momentum in household spending.
Canada's export performance is also being held back by weaker U.S. growth. Exports of lumber and other construction materials, for example, have fallen off sharply as a major correction in new home construction continues to play itself out in the United States. The good news is that new home construction levels have adjusted rapidly enough to avoid a major correction in home values. As such, U.S. households are expected to see only an easing in the pace of consumer spending (rather than the more severe retrench- ment that many had been anticipating). Real U.S. GDP growth is expected to fade to 2.2 per cent in 2007 but regain its strength in 2008, with growth of 3.1 per cent expected. The rebound in U.S. growth next year, coupled with a more stable Canadian dollar, will help boost real Canadian exports by over 3 per cent. This, coupled with a still-strong domestic economy, should help propel Canada's economy to 3.2 per cent growth in 2008.
While Canada will continue to lose out on trade, there is plenty of momentum in household spending, at least through the rest of this year. The wealth effect of higher resource prices culminated in peak growth in real after-tax household income last year. Benefiting from solid employment gains, generous growth in real wages, and the redistribution (through various channels) of roughly $1 1 billion from federal and provincial coffers to households, real disposable income posted exceptional growth of 5 per cent in 2006. This year, the fiscal dividend going to consumers will be smaller, although households in some provinces (Quebec in particular) will benefit from tax reductions and other government transfers to persons. Overall though, growth in real disposable income will still reach 3.6 per cent in 2007, as employment and real wage gains remain healthy. The strength in household income is expected to boost real consumer spending by 3.8 per cent this year, following a 4.2 per cent gain in 2006. In 2008, fiscal measures are expected to dry up while employment growth will be more muted, resulting in softer growth in consumer spending.
Statistics Canada's latest Private and Public Investment (PPI) intentions survey suggests that business investment intentions have moderated from last year. In particular, machinery and equipment
The Conference Board of Canada i

investment posted a rare decline in the first quarter of this year although growth is expected to rebound going forward. The forecast for energy investment is also down sharply-not because of dimin- ished oil sands construction, but mostly because of a steep decline in energy exploration expected this year. On a more positive note, non-energy construction is getting a substantial boost in 2007 from new office and commercial building construction. As well, new home construction remains at elevated levels, held up by still-rising home prices and strong demand, especially out west. Rising financing costs, coupled with softer growth in household after-tax income, should help moderate new home construction over the next few years to below 190,000 annual starts-a level more closely aligned with our estimates of demographic requirements.
PROVINCIAL OVERVIEW
The domestic economy in all provinces will continue to expe- rience healthy gains. However, provinces in Western Canada will again enjoy firmer economic gains due to the development of their resource industries. While the Canadian dollar's rise to a 30-year high is further challenging Central Canada, British Columbia's economic growth is held back by difficult market conditions in the forestry industry that have affected demand for wood products. Saskatchewan will lead the Western provinces this year. A red-hot domestic economy, a rebound in the primary sector, and positive net inter-provincial migration are fuelling the province. Alberta will settle down with more sustainable growth as less income stimulus and a downturn in the drilling industry shaves a few points from GDP growth. Manitoba will continue to enjoy good times as the construction boom carries on for another two years. The Atlantic provinces will also do well over the near term as major capital developments continue and new ones get underway. With mineral production boosting economic growth substantially, Newfoundland and Labrador will surpass all other provinces in 2007. (See charts 1 and 2.)
The economic performance of Central Canada is being hurt by the effects of the swift appreciation in the Canadian dollar since May. The province of Quebec will most likely experience no gains in
Chart 1 Real GDP by Province, 2007 (percentage change; 1997 $)
NL SK AB MB BC NB ON PEI NS QC
0 1 2 3 4 5 6 7 8
Sources: The Conference Board of Canada; Statistics Canada.
Chart 2 Real GDP by Province, 2008 (percentage change; 1997 $)
AB MB ON BC SK QC PEI NB NS NL
0 0.5 1.0 1.5 2.0 2.5 3.0 3.5 4.0 4.5 5.0
Sources: The Conference Board of Canada; Statistics Canada.
exports this year due to a steep drop in demand for wood products and pulp and paper. Real GDP at basic prices in Quebec will advance by only 2 per cent in 2007. While the industrial sector is at a stand- still, the household sector in Quebec is benefiting from strong income gains boosted by a large one-time retroactive pay equity settlement and by robust job creation since the start of the year. The outlook in Quebec will improve in 2008 when the trade sector gets back on its feet, lifting overall economic growth to 2.9 per cent. The difficulties in the trade sector in Quebec have not been mirrored in Ontario. The recent surge in vehicle demand south of the border has allowed Ontario's exports to grow. However, the positive performance will be short lived. Vehicle demand in the U.S. is expected to falter as the housing correction dries up excess disposable income from home-equity withdrawal. Nonetheless, despite a weakening domestic economy in Ontario, the strength in the auto sector early in the year will be enough to bring overall real GDP growth at basic prices to 2.3 per cent in 2007, an improve- ment over the 1.9 per cent performance of 2006. We will have to wait until 2008 to see the economic performance of Ontario match the national average of 3.4 per cent. At that point, the auto industry will have restructured, downsized, and adapted to consumer demand. In addition, the new Woodstock Toyota plant will be in operation, and stronger growth south of the border should revive other indus- trial sectors.
While Newfoundland and Labrador will advance by a nation- leading 7.1 per cent in 2007, the other Atlantic provinces will also fare relatively well. New Brunswick and Nova Scotia will be chal- lenged by the rise in the Canadian currency as several manufacturers cease operations. Nevertheless, New Brunswick's economy will enjoy sound economic growth as construction work continues on the expansion of the Pointe Lepreau nuclear generating station and on the development of a liquefied natural gas terminal in Saint John. Overall real GDP is expected to rise by 2.4 per cent in 2007 and 2.5 per cent in 2008. In Nova Scotia, an expanding financial services sector, combined with solid domestic demand and increasing natural gas production, should enable the provincial economy to grow by 2 per cent in 2007. The development of a large petrochemical com- plex in Nova Scotia starting in 2008 will revive the construction
ii The Conference Board of Canada

industry, allowing overall real GDP to advance by 2.3 per cent. Despite the weakness in the primary sector and in the tourism indus- try, Prince Edward Island will benefit from resurgence in wholesale and retail trade as new provincial fiscal relief fuels consumer spend- ing. Overall real GDP on the Island is forecast to rise by 2.2 per cent in 2007 and 2.5 per cent in 2008. In Newfoundland and Labrador, labour disputes at Voisey's Bay and operational difficulties at the Terra Nova oil field held back mining output in 2006. But with both projects now fully operational and higher production coming from the White Rose oil project, mining output will soar this year. The retail and manufacturing sectors will also progress strongly in 2007. Looking ahead, however, Newfoundland and Labrador's growth will suffer as a result of the sector that brought prosperity to the province. The Hibemia and Terra Nova offshore oilfields have reached peak production capacity and, starting in 2008, will no longer contribute to mining gains in the province. Economic growth is forecast to falter to just 0.4 per cent in 2008 as the oil industry matures.
A combination of factors-such as a construction boom, a pos- itive outlook for the manufacturing sector, and a strong domestic economy buoyed by fiscal relief-will boost Manitoba's real GDP by 3.4 per cent in 2007 and 3.6 per cent in 2008. A turnaround in the primary sector and a robust domestic economy fuelled by more favourable migration flows will propel economic growth in Saskatchewan to a solid 4.4 per cent in 2007 and 3.2 per cent in 2008. Saskatchewan will continue to benefit from the seemingly insatiable global demand for potash. Given the optimistic potash demand outlook, Potash Corp. has announced a major $900 mil- lion capacity expansion at its Cory facility.
Following weaker drilling activity this past winter, overall eco- nomic growth in Alberta is losing speed. In addition, less income stimulus and weakening net interprovincial migration will rein in consumer demand over the next two years. With high housing costs and improved economic conditions in other regions of the country, net interprovincial migration will subside. Following the astounding 6.6 per cent growth of 2006, Alberta's economy is forecast to advance at a more sustainable 3.9 per cent this year. The intense develop- ment of the oil sands over the past several years will finally bear fruit; non-conventional oil production will soar in 2008, lifting overall mining output by 6.8 per cent. All in all, real GDP growth in Alberta is forecast to accelerate to 4.7 per cent next year.
British Columbia's economic outlook is clouded by the decline in lumber production. The elevated Canadian dollar, the tumbling housing sector in the United States and, more recently, labour unrest are plaguing the beleaguered forestry industry. With no output gains expected in the manufacturing sector due to a large drop in demand for wood products, overall real GDP in British Columbia will advance by 2.7 per cent in 2007. The domestic economy, on the other hand, will perform well, stimulated by exceptional job creation and a lower tax burden. The economic outlook will turn around next year as the forestry and manufacturing sectors recu- perate. The province should expand by a healthy 3.3 per cent in 2008. The mining sector will also contribute to the positive out- look. Benefiting from record exploration activity, new mines are set to start producing in the next two years, and the medium term is very promising. There are several mining projects at various stages of environmental review.
U.S. ECONOMY
Confidence in the U.S. economy has improved recently as the economic slowdown that transpired in the first quarter of this year seems to be coming to an end. While the economy expanded by a miniscule annualized pace of 0.7 per cent in the first quarter, growth in the second quarter was on track to reach 3 per cent. The revival in economic activity is partially explained by the completion of a massive inventory drawdown. Inventories are currently back in line with sales, and manufacturing activity has consequently rebounded. Following a winter lull, there has also been a welcome surge in investment spending brought on by the introduction of tougher environmental regulations for heavy trucks. Record-high corporate profitability and solid balance sheets will leave many U.S. firms in a solid position to expand operations.
International trade has finally emerged as a source of strength after many years of dragging down overall economic growth. The trade deficit has started to narrow as exports grow at a nearly double- digit pace while import growth has tapered off over the past few quarters. Export activity has also benefited from the healthy state of the U.S. economy and the gradual depreciation of the dollar since 2002. While the trade deficit with China continues to widen, Chinese government officials now seem more willing to permit the yuan to appreciate at a faster clip. This should enable the trade deficit with China to stabilize in the latter part of the decade.
Investment spending and strength in exports will negate the anticipated slowdown in growth in household spending. While real consumer spending increased at an annualized pace above 4 per cent in the first quarter, growth will decline to the 2 per cent range over the near term. High gasoline prices, more modest growth in house- hold income, and the negative impact of weaker home prices are the main factors that will restrain spending. Real GDP is expected to increase by 2.2 per cent in 2007 before growth rebounds to 3.1 per cent in 2008. (See Chart 3.)
Chart 3 U.S Economy to Improve in 2008 (real GDP; percentage change)
5
4
3
2
1
0 1998 99 00 01 02 03 04 05 06 07f 08f
f = forecast Sources: The Conference Board of Canada; U.S. Bureau of Economic Analysis (BEA).
The Conference Board of Canada iii

Inflation is expected to moderate into the Federal Reserve's target range in the second half of this year. A weaker job market will keep labour costs under control while the over-supplied housing market will restrain consumer prices for housing services. The unem- ployment rate is forecast to gradually increase to close to 5 per cent by the end of 2008. Monetary policy will remain on hold for the remainder of this year as the Federal Reserve holds its federal funds rate at 5.25 per cent. (In the early part of 2007, financial markets anticipated rate cuts due to the weak growth in the econ- omy. However, the rebound in activity in the second quarter has significantly diminished the prospects for rate cuts in the second half of 2007.)
MONETARY POLICY
The prospect that rates in the United States will not come down is welcome news for Canadian manufacturers and exporters already struggling with the swift appreciation in the loonie. On a quarterly basis, the Canadian dollar appreciated by nine cents U.S. (or 11 per cent) in the second quarter of 2007, a rapid surge that has by far outpaced any other in recent history. While expectations that the U.S. Federal Reserve will cut rates have eased, the Bank of Canada reinforced its message that keeping inflation under control was its number one priority. The strong wording was meant to address core inflation rates that have recently crept uncomfortably above the Bank's 2 per cent target.
Aside from potential interest rate movements, a number of announcements about acquisitions (or potential acquisitions) of Canadian firms by foreign companies had important repercussions on the value of the Canadian dollar. While it is difficult to disen- tangle the effect of potential mergers and acquisitions on the cur- rency, the Canadian dollar was ratcheted up significantly over the April-to-June period by numerous large merger or acquisition announcements. (By way of example, in mid-April, the global con- glomerate Essar announced that it would bid to acquire Algoma steel for nearly $1.9 billion. In the days immediately following that announcement, the Canadian dollar gained nearly a cent.) Stronger oil and commodity prices, along with a stellar first-quarter GDP performance, also helped bolster the loonie in recent months. Ironically, the first-quarter strength helped lift the value of the loonie, and the stronger loonie is now expected to drag down growth significantly over the remainder of the year. The loonie is forecast to average US$0.953 over the last six months of the year, representing an appreciation of 8.3 per cent over last year's already strong level. (See Chart 4.)
FISCAL POLICY
Over the last few years, the federal government has found itself in the enviable position of consistently ending up with much more fiscal room than first projected in its annual budgetary exercise.
Chart 4 Canadian Dollar Soar ing (US$ per C$)
1 .o
0.9
0.8
0.7
0.6
0.5 1999 00 01 02 03 04 05 06 07f 08f
f = forecast Sources: The Conference Board of Canada; Statistics Canada.
Despite accounting for numerous personal income tax cuts, some of which are still being phased in, personal income tax revenues have continuously outpaced budgetary growth projections and provided much of the generous boost to federal surpluses in recent years. Measured on a National Accounts basis,' in 2006, the federal gov- ernment registered its 10th straight year of posting surpluses-and 2007 will undoubtedly mark the 1 lth. In Budget 2007, the federal government took aim at correcting the "fiscal imbalance" (a term that describes the situation in which the federal government was running huge surpluses while many provinces were struggling to balance their books) through generous increases to provincial trans- fers. However, while the provincial books are generally in pretty good shape, the federal government's fiscal position is starting off on a very strong footing that will likely see another year of better- than-expected fiscal results.
Provincial governments, too, are reporting better-than-expected revenue gains and more room to manoeuvre on their fiscal plans. On a Public Accounts basis, all the provincial governments are forecasting surpluses for their respective 2007-08 budgets-with the exception of Quebec, which is aiming for a balanced budget despite generous tax cuts and other transfers to persons occurring this year. Municipal governments are in a more difficult bind, as Statistics Canada's figures suggest that the consolidated balance at the local government level has posted deepening deficits over the past few years and averaged a shortfall of nearly $5 billion over the past four quarters.2 But, despite weaker spending forecast at the local level in 2007, improving fiscal positions at the federal and provincial level should help keep real government spending on goods and services on track to post steady growth of around 2.5 per cent this year and next.
1 Statistics Canada compiles the National Accounts at the federal, regional, and local lev- 2 The government sector in the Board's National Medium Term Forecasting Model (MTFM) els of government. At the federal level, the National Accounts estimates are based on fed- has been extended to separate out provincial and local levels of government from the era1 Public Accounts data. However, Public Accounts revenue and spending estimates are more aggregate regional government accounts. In other words, historical data and fore- realigned so that they occur at the same time as they impact the economy. For example, casts are now available separately for aggregate municipal accounts and for aggregate government investment spending would occur not when the funds are set aside (as is provincial and territorial accounts, whereas in the past these were combined into a total often done in budget documents) but when the spending actually occurs and measurably regional government accounts. impacts economic growth.
The Conference Board o f Canada

SYNOPSIS Marie-Christine Bernard
La hausse du dollar prCoccupe le Canada central
ont kt6
'Cconomie canadienne a dCmarr6 en trombe au dCbut de I'annCe, affichant une croissance annualisde de 3,7 p. 100 au premier trimestre. Les prCvisions de croissance pour 2007 revues B la baisse par contre. Cela tient entikrement B I'envol
du huard au second trimestre et B l'effet qu'il devrait avoir sur la croissance Cconomique du Canada pendant le reste de I'annCe. Inattendue, l'appre'ciation du huard a re'sulte' non des changements survenus dans les moteurs fondamentaux de l'Cconomie, mais d'une perception diffirente par les march& financiers de la santC de llCconomie, des possibilitts d'une modification des taux d'in- tCr6t et des effets d'annonces de rachat d'entreprises canadiennes par un certain nombre de compagnies Ctrangkres. A vrai dire, la diffirence de valeur moyenne du dollar canadien entre le premier et le deuxibme trimestres a CtC de 9 cents amdricains - une appre'ciation foudroyante de 1 1 p. 100 en tout juste trois mois! Ce rythme dCpasse de loin tout ce que nous avons vu dernibrement.
Suite au bond du dollar, les exportateurs et les manufacturiers canadiens vont connaitre des difficultks. Pour la plus grande partie, les manufacturiers canadiens ont relev6 le d6fi pose par I'apprCci- ation du huard depuis 20M. en r6duisant leurs effectifs et en investis- sant lourdement dans des Cquipements gCn6rateurs de gains de productivitC. A en juger par les 62 000 suppressions d'emplois d'avril B juin dans les industries manufacturikres, cette tendance devrait se poursuivre tout le reste de l'annte. Par ailleurs, un huard renforcC devrait largement contribuer B faire baisser le prix des machines importCes et la mesure d'accC1Cration des provisions pour consommation de capital, annonce'e avec le budget fCdCral de 2007, devrait tgalement soutenir l'investissement. Avec la poursuite de la structuration, les rksultats du Canada au chapitre des exportations devraient de nouveau rester en retrait en 2007, affichant une croissance rCelle de seulement 2,l p. 100. De plus, les prix plus bas des biens produits hors du Canada devraient cer- tainement engendrer une hausse importante des importations, et, du coup, la balance commerciale fera fltchir la croissance d'un demi point de pourcentage en 2007. Au bout du compte, le pro- duit intCrieur brut (PIB) rCel devrait augmenter de 2,s p. 100 en 2007, la croissance Ctant soutenue par le dynamisme des dkpenses des mtnages.
Les rCsultats des exportations canadiennes sont tgalement plombts par I'affaiblissement de la croissance amkricaine. Par exemple, les exportations de bois d'ceuvre et d'autres matiriaux de construction se sont effondrCs B cause de la correction majeure en cours sur le march6 de la construction des logements neufs aux ~ t a t s - ~ n i s . Le point positif est que le nombre de constructions de logements neufs s'est ajustC assez vite pour Cviter une correction Cgale sur le plan des prix. Dans ces conditions, les mCnages amen- cains devraient se contenter de ralentir le rythme de leurs dkpenses (au lieu que celles-ci connaissent le sCvkre repli que beaucoup privoyaient). La croissance du PIB rCel amCricain devrait fondre jusqu'i 2,2 p. 100 en 2007 mais retrouver de la vigueur en 2008, oh l'on prCvoit une croissance de 3,l p. 100. Le retour de la crois- sance aux gtats-~nis l'an prochain, associe' B un dollar canadien plus stable, devrait soutenir les exportations rCelles canadiennes de plus de 3 p. 100. Cette situation, associCe B une Cconomie intCrieure toujours forte, devrait propulser le niveau de croissance Cconomique du Canada B 3,2 p. 100 en 2008.
Alors que le Canada continuera de reculer sur le terrain des Cchanges commerciaux, les dCpenses des mCnages conserveront leur Clan, au moins pour le reste de I'annCe. L'effet de richesse dB B l'augmentation des prix des matikres premibres a dCbouchC sur une croissance maximale du revenu net rCel des mCnages en 2006.
Le Conference Board du Canada

GrPce & la solide augmentation de l'emploi, a la croissance gCnCreuse des salaires riels et & la redistribution aux mCnages (par divers moyens) d'environ 11 milliards de dollars des trCsors fCdCral et provinciaux, le revenu disponible rtel a affichC une croissance exceptionnelle de 5 p. 100 en 2006. Cette annte, le dividende budgitaire distribui aux consommateurs sera plus maigre, m&me si, dans certaines provinces (en particulier au Que%ec), les mCnages bCnCficieront de baisses d'imp6ts et d'autres transferts gouveme- mentaux vers les particuliers. Tout compte fait, la croissance du revenu r&l disponible devrait encore atteindre 3,6 p. 100 en 2007, alors que l'emploi et les salaires rtels demeureront vigoureux. La bonne santC des revenus des mCnages devrait pousser les dCpenses k l l e s de consommation d'environ 3,8 p. 100 cette am&, apks une croissance de 4,2 p. 100 en 2006. En 2008, les mesures budgktaires devraient se tarir et la croissance de l'emploi se faire plus discrkte, ce qui entrainera une augmentation plus faible des dCpenses de consommation.
D'aprks la dernikre mouture de l'ttude de Statistique Canada Investissements privCs et publics (PP) : perspectives, les intentions d'investissements des entreprises sont moins ambitieuses que l'an demier. Les investissements en matkriel et outillage, en particulier, rtvklent une baisse anormale au premier trimestre de cette annCe, alors qu'on s'attend B un rebond de croissance. Les prkvisions sur les investissements en Cnergie sont Cgalement en forte baisse - non pas 1 cause d'une diminution des constructions d'infrastructure dans le secteur des sables bitumeux, mais plut6t d'une baisse de I'activitC de forage. Sur une note plus optimiste, la construction non 6nergCtique btnkficiera d'un soutien substantiel en 2007 du secteur des nouveaux immeubles de bureaux et commerciaux. En outre, le secteur de la construction de logements neufs se main- tient & des niveaux eleve's, aid6 en cela par les prix toujours plus hauts des maisons et une demande vigoureuse, en particulier dans l'Ouest. Mais la Banque du Canada a augment6 ses taux de base d'un quart de point le 10 juillet et les taux d'intCr2t B plus long terme, y compris les taux hypothCcaires, suivent une tendance haussikre. Dans les prochaines annCes, l'augmentation des frais de financement, associCe & une croissance plus faible des revenus aprks imptits des mCnages, devrait contribuer a freiner les con- structions de nouveaux logements & moins de 190 000 mises en chantier par annCe - un niveau plus proche de nos estimations des besoins dkmographiques.
L'Cconomie des provinces continuera de marquer des gains importants. Toutefois, les provinces de I'Ouest enregistreront encore une fois des gains konomiques supCrieurs grPce B l'expansion leurs industries des ressources primaires. Le plus haut niveau atteint par le dollar canadien depuis 30 ans vient alourdir les difficultCs des provinces du centre. La croissance tconomique de la Colombie- Britannique, elle, est freinte par les conditions dtfavorables du march6 de l'industrie forestikre. Cette annCe, la Saskatchewan sera en the des provinces de l'Ouest. Une Cconomie en pleine Cbullition, la reprise du secteur primaire et une migration interprovinciale nette positive sont les moteurs de l'ckonomie de la province. L'Alberta
connaitra une croissance plus soutenable, quelque peut ralentie par la diminution des stimulants du revenu et le ralentissement de l'industrie pktrolikre. Le Manitoba continuera de profiter de l'essor du secteur de la construction pendant encore deux ans. Les provinces de I'Atlantique enregistreront aussi une bonne performance B court terme avec la poursuite d'importants projets d'immobilisations et le lancement de nouveaux. A Terre-Neuve-et-Labrador, la production minCrale stimulera fortement la croissance Cconomique. En 2007, la province surpassera toutes les autres. (Voir les graphiques 1 et 2.)
La performance Cconomique du Canada central souffre des effets de I'apprCciation rapide du dollar canadien depuis le mois de mai. Cette annCe, le QuCbec ne fera presque certainement aucun gain dans ses exportations en raison d'une forte chute de la demande de produits forestiers et de pPtes et papiers. Le PIB rtel aux prix de base du QuCbec ne progressera que de 2 p. 100 en 2007. Le secteur industriel est au point mort, mais celui de la consomma- tion des mCnages profite de solides gains de revenu assurCs par un versement ritroactif au titre de 1'6quitC salariale et la forte crkation d'emplois depuis le dCbut de I'annCe. I1 faudra attendre 2008 pour voir s'amkliorer les perspectives du Quekc avec la reprise du secteur du commerce qui contribuera a hausser la croissance Cconomique globale & 2,9 p. 100. Les difficultts du secteur que%tcois du com- merce ont t t t 6pargnCes ?i I'Ontario. L'augmentation rCcente des ventes de vChicules chez nos voisins du Sud ont permis h I'Ontario d'amCliorer ses exportations. Toutefois, cette progression ne durera pas. La demande de vkhicules aux ~tats-UNS devrait flCchir dans la mesure oh la correction du march6 immobilier rdduira le revenu disponible par suite de la diminution des extractions de la valeur hypothkcaire. NCanmoins, malgri le ralentissement de 1'Cconomie ontarienne, la bonne santC du secteur de l'automobile au de%ut de I'annCe suffira B hausser la croissance du PIB rCel aux prix de base & 2,3 p. 100 en 2007 par rapport B 1,9 p. 100 en 2006. Ce n'est qu'en 2008 que le rendement Cconomique de I'Ontario rejoindra la moyenne nationale de 3,4 p. 100. A ce moment-18, l'industrie de l'automobile aura fini de se restructurer, de se rationaliser et de
Graphique 1 PIB reel par province, en 2007 (variation en pourcentage; en dollars de 1997)
T -N. Sask.
Al b. Man. C.-B. N.-B. Ont.
1.-P.-E. N.-E. QuB.
I I I I I I I I I
0 1 2 3 4 5 6 7 8
Sources : Le Conference Board du Canada; Statistique Canada.
Le Conference Board du Canada

Graphique 2 PIB reel par province, en 2008 (variation en pourcentage; en dollars de 1997)
Al b. Man. Ont.
C.-B. Sask. Qu6.
i.-P.-E. N.-B. N.-E. T.-N.
0 0,5 1,0 1,5 2,O 2,5 3,O 3,5 4,O 4,5 5,O
Sources : Le Conference Board du Canada; Statistique Canada.
s'adapter 1 la demande des consommateurs. En outre, la nouvelle usine de Toyota a Woodstock sera en exploitation et la plus forte croissance attendue au sud de la frontibre stimulera les autres secteurs industriels.
En 2007, Terre-Neuve-et-Labrador sera en t&te de toutes les provinces avec un taux de croissance de 7,l p. 100, mais les autres provinces de 1'Atlantique feront aussi relativement bonne figure. Le Nouveau-Brunswick et la ~ouvel le-~cosse seront freinCs par la hausse de la devise canadienne qui obligera certains fabricants B fermer leurs portes. Toutefois, 1'Cconomie du Nouveau-Brunswick connaitra une saine croissance Cconomique grPce & la poursuite des travaux d'expansion de la centrale nucltaire de Pointe Lepreau et de construction d'un terminal de gaz naturel liquCfi6 B Saint John. Le PIB rCel devrait augmenter de 2,4 p. 100 en 2007 et de 2,5 p. 100 en 2008. En ~ouvelle-~cosse, l'expansion du secteur des services financiers, combinie B une solide demande int6rieure et B l'accroisse- ment de la production de gaz naturel, devrait permettre B la province d'enregistrer un taux de croissance Cconomique de 2 p. 100 en 2007. L'amCnagement d'un grand complexe pktrochimique en Nouvelle- ~ c o s s e B compter de 2008 relancera l'industrie de la construction et portera la croissance du PIB r6el ti 2,3 p. 100. Malgr6 la faiblesse du secteur primaire et de l'industrie touristique, l'fle-du-prince- fidouard bCnCficiera de la reprise de la vente de gros et de dCtail grsce aux nouveaux allkgements fiscaux accordCs par la province pour stimuler la consommation. On prCvoit que le PIB rCel de l'ile devrait augmenter de 2,2 p. 100 en 2007 et de 2,5 p. 100 en 2008. A Terre-Neuve-et-Labrador, en 2006, les conflits de travail 1 Voisey's Bay et les difficult& op6rationnelles au champ de pCtrole Terra Nova ont nui B la production minibre. Maintenant que les deux projets sont pleinement opCrationnels et que le projet pCtro- lifere de White Rose a atteint un rendement supkrieur, la produc- tion minibre montera en flbche cette annCe. Les secteurs de la vente au dttail et de la fabrication progresseront aussi fortement en 2007. Toutefois, dans les prochaines annCes, la croissance de Terre-Neuve-et-Labrador souffrira de la baisse de rendement dans
le secteur mCme qui lui aura apportC la prospCritC B la province. Les champs de pCtrole extra-c6tiers d'Hibernia et de Terra Nova ont atteint leur capacitC de production maximale et, B compter de 2008, ils ne contribueront plus aux gains du secteur minier de la province. La croissance Cconomique de la province devrait s'af- faisser B tout juste 0,4 p. 100 en 2008.
Une combinaison de facteurs - comme l'essor du secteur de la construction, les perspectives prometteuses du secteur de la fabrication et les allCgements fiscaux pour renforcer l'tconomie intkrieure - feront augmenter le PIB 1-63 du Manitoba de 3,4 p. 100 en 2007 et de 3,6 p. 100 en 2008. Un revirement du secteur pri- maire et une Cconomie intkrieure robuste soutenue par un afflux migratoire plus favorable en Saskatchewan propulseront la crois- sance Cconomique B un solide taux de 4,4 p. 100 en 2007 et de 3,2 p. I00 en 2008. La Saskatchewan continuera de bCnCficier de la demande mondiale apparemment insatiable de potasse. Les per- spectives optimistes de la demande de potasse ont incitt Potash Corp. B annoncer une importante expansion de 900 millions de dollars de ses installations de Cory.
En Alberta, la diminution des activitCs de forage, l'hiver demier, a entrain6 un ralentissement de la croissance Cconomique globale. En outre, un diminution des stimulants du revenu et la baisse de la migration interprovinciale nette ralentiront la demande de consom- mation au cours des deux prochaines annCes. Les coiits de loge- ment ClevCs et l'amClioration des conditions Cconomiques dans d'autres regions du pays ambneront une diminution de la migration interprovinciale nette. Par suite de l'impressionnante croissance de 6,6 p. 100 en 2006,l'Cconomie de I'Alberta devrait progresser B un taux plus soutenable de 3,9 p. 100 cette annte. Les intenses activitgs de mise en valeur des sables bitumineux ces demibres annCes portera enfin fruit; la production de pktrole non conven- tionnel grimpera en 2008, portant l'augmentation de la production minihe globale B 6,8 p. 100. Somme toute, la croissance du PIB rCel de 1'Alberta devrait s'accClCrer B 4,7 p. 100 l'an prochain.
Les perspectives Cconomiques de la Colombie-Britannique sont asombries par la baisse de la production de bois d'ceuvre. La hausse du dollar canadien, l'effondrement du secteur de la construction rksidentielle aux fitats-~nis et, tout ricemment, les conflits de travail accablent une industrie forestibre dCjB en difficult6. Sans gains de production pr6vus dans le secteur de la fabrication en raison d'une importante chute de la demande de produits du bois, le PIB rCel de la Colombie-Britannique progressera de 2,7 p. 100 en 2007. Par ailleurs, I'Cconomie intkrieure se portera bien, stirnulee par une crCation d'emplois exceptionnelle et un alltgement du fardeau fiscal. Les perspectives Cconomiques s'amClioreront l'an prochain avec la reprise des secteurs forestier et manufacturier. La province devrait enregistrer un satisfaisant taux de croissance de 3,3 p. 100 en 2008. Le secteur minier contribuera aussi 8 I'amClioration des perspectives. Profitant d'une activitC d'exploration sans prCcCdent, les deux prochaines anntes devraient voir l'entrke en exploitation de nouvelles mines et les perspectives B moyen terme sont trbs prometteuses. Plusieurs projets miniers sont B divers stades du processus d'kvaluation environnementale.
Le Conference Board du Canada vii

La confiance dans 1'Cconomie amkricaine s'est raffermie rCcem- ment, la panne de la croissance Cconomique du premier trimestre de cette annCe semblant sur le point de se terminer. Alors que la croissance au premier trimestre n'a connu qu'une augmentation minime de 0,7 p. 100 en taux annualisC, au deuxibme trimestre, elle est bien partie pour atteindre plus de 3 p. 100. La reprise de l'activite' 6conomique s'explique en partie par un assbchement massif des stocks. Le niveau des stocks est aujourd'hui en phase avec celui des ventes, ce qui relance I'activitC manufacturibre. Aprks un hiver calme, les dCpenses d'investissement connaissent aussi un envol bienvenu grlce B l'introduction de rkglementations environnementales plus se'vkres sur les poids lourds. Les btnkfices records et les bilans solides des entreprises donneront en outre B ces dernikres des bases saines pour divelopper leurs activitis.
Le commerce international s'est enfin r6vClC comrne une source de vigueur, ap&s avoir CtC un boulet pour la croissance Cconomique pendant des annks. Le dCficit commercial a commencC 1 se rksorber, grlce B la croissance des exportations B un taux proche de 10 p. 100 et B la diminution des importations durant les derniers trimestres. Les exportations ont aussi profit6 de la bonne santC de 1'Cconomie amCricaine et de la dCprCciation graduelle du dollar depuis 2002. MCme si le dCficit commercial avec la Chine continue de se creuser, les reprksentants du gouvernement chinois semblent plus enclins B laisser le yuan s'apprkcier un peu plus vite. Cela devrait permettre de stabiliser le dCficit commercial avec ce pays dans la dernikre partie de la dicennie.
Les dtpenses d'investissements et la vigueur des exportations contrebalanceront le ralentissement prkvisible de la croissance des dkpenses des mCnages. Bien que les dkpenses r6elles de consom- mation aient augment6 au premier trimestre B un taux annualis6 de plus de 4 p. 100, la croissance dCclinera jusqu'aux environs de 2 p. 100 B court terme. Les prix ClevCs de l'essence, la croissance plus modeste du revenu des m6nages et l'effet nCgatif de la baisse des prix des logements seront les principaux facteurs de compres- sion des dkpenses. Le PIE3 rCel devrait augmenter de 2,2 p. 100 en 2007 avant un rebond de la croissance B 3,l p. 100 en 2008. (Voir le graphique 3.)
Durant le deuxibme semestre de 2007, l'inflation devrait ralentir pour s'aligner sur la fourchette fixCe par la Rherve fCdCrale. Le march6 plus faible de l'emploi devrait permettre de contenir les coiits de la main-d'oeuvre et le march6 exckdentaire des logements limitera les prix B la consommation des services de logement. Le taux de chomPge devrait augmenter de manikre graduelle pour s'approcher des 5 p. 100 d'ici la fin de 2008. La politique monC- take restera inchangte pour le reste de I'annCe, la RCserve fCdCrale maintenant son taux des fonds fCdCraux B 5,25 p. 100. (DCbut 2007, les marche's financiers s'e'taient attendus B une baisse des taux, en raison de la faible croissance de 1'Cconomie. Cependant, la reprise de l'activite' au second trimestre a nettement reduit les perspectives de baisse des taux pour la seconde moitit de 2007.)
Graphique 3 CBconomie americaine se redressera en 2008 (PIB reel; variation en pourcentage)
p = prkvisions Sources : Le Conference Board du Canada; U.S. Bureau of Economic Analysis (BEA).
La perspective d'un maintien des taux d'intCrEt amMcains est une bonne nouvelle pour les manufacturiers et les exportateurs canadiens, dCjB aux prises avec l'appukiation rapide du huard. Sur une base trimestrielle, le dollar canadien s'est apprCciC de 9 cents amtricains (ou 11 p. 100) au deuxikme trimestre de 2007, une hausse rapide qui a dCpass6 de beaucoup toutes celles des annCes prCcCdentes. (Voir le graphique 4.) Alors que les risques de hausse des taux d'intCrCt par la Rkserve fCdCrale amkricaine s'estompent, la Banque du Canada a rCaffirmC que contenir l'inflation Ctait son objectif prioritaire. Cette position trks claire de la Banque se voulait une rCponse B la rCcente poussCe des taux d'inflation de base au- dessus de l'objectif de 2 p. 100. Avant mCme que la Banque du Canada n'augmente ses taux de base, les marches financiers, privoyant que l'tcart des taux d'intkrCt, actuellement favorable aux Etats-Unis, serait bient6t r&Iuit, avaient poussC la valeur du huard de quelques cents.
Graphique 4 Le dollar canadien s'envole ($US par $CAN)
p = previsions Sources : Le Conference Board du Canada; Statistique Canada.
viii Le Conference Board du Canada

En dehors de mouvements tventuels sur les taux d'inttrct, un certain nombre de communiquCs annonqant des rachats (ou des rachats tventuels) d'entreprises canadiennes par des compagnies etrangkres avaient dtjB eu des n5percussions importantes sur la valeur du dollar canadien. M6me s'il est difficile de cerner les effets de fusions et d'acquisitions Cventuelles sur la valeur de la devise, le dollar canadien s'est apprCci6 au cours de la pCriode d'avril i juin, par l'effet d'un grand nombre d'annonces de fusions ou d'acquisi- tions. (Par exemple, mi-avril, le groupe mondial Essar a annonct qu'il allait faire une offre d'achat d'Algoma Steel pour prks de 1,9 milliards de dollars. Dans les jours suivants, le dollar canadien a gagnC presque un cent.) Les prix plus devCs du p6trole et des matikres premitres, associCs aux r6sultats remarquables du PIB au premier trimestre, ont Bgalement contribuk i soutenir le huard ces derniers mois.
C'est ce ralentissement de la croissance qui devrait pousser la Banque du Canada agir prudemment en ce qui concerne une aug- mentation suppltmentaire de son taux d'inttrEt de%iteur de base. Le huard devrait s'etablir en moyenne A 0,953 $US durant les six prochains mois, ce qui represente une apprtciation de 8,3 p. 100 par rapport au niveau, d t j i tlevt, de l'ann6e demikre. Au deuxikme trimestre, le huard s'apprCciant fortement par rapport a toutes les autres devises phares, la santt de notre monnaie continuera de freiner la demande globale en favorisant la consommation de pro- duits importts. Les prix plus faibles des produits importCs devraient aider i limiter les pressions inflationnistes. Cela vaut Cgalement pour les biens provenant de producteurs locaux en concurrence avec les AmCricains (sans parler des Chinois). Il est Cvident qu'on est encore loin de mesurer tous les effets induits par cette situation, dans la mesure oij les prix d'un grand nombre de produits importts ne se sont pas encore complktement ajustCs 8 l'apprtciation rtelle du huard. Cet Ctat de fait devrait contribuer B contenir les pressions inflationnistes qui menacent le Canada, m6me si la crainte d'une inflation mondiale se renforce.
Durant les dernikres annks, le gouvernement fCdCral s'est trouvC dans la situation enviable de terminer systtmatiquement l'annk avec un exctdent budgttaire nettement sup6rieur aux prtvisions. Malgrt un grand nombre de baisses d'imp6ts sur le revenu des particuliers, dont certaines sont encore B venir, les produits de I'imp6t sur le revenu des particuliers ont constarnment d$assC les previsions de croissance budgttaire et fournit la plus grande partie des surplus fddtraux des dernikres annCes. En 2006, d'aprks les Comptes nationauxl, le gouvernement fCdCral a enregistrk son dixikme exctdent budgdtaire annuel de suite - et 2007 verra certainement le onzikme. Pour le budget de 2007, l'objectif du gouvernement fCdCral ttait de redresser le << dtsauilibre fiscal >> (une expression qui dtsigne la situation oG le gouvernement fCdCral doit gtrer d'tnormes excCdents alors que de nombreuses provinces luttent pour Cquilibrer leur budget) en augmentant gCnCreusement les transferts aux provinces. Pourtant, alors que les budgets provinciaux sont, d'une faqon gBntrale, en bonne sant6, la situation budgCtaire du gouvernement ftd6al dCmarre sur les chapeaux de roues et devrait certainement connaitre une nouvelle annCe de rksultats budgttaires suptrieurs aux prCvisions.
Les gouvernements provinciaux font Cgalement Ctat de recettes suptrieures aux prtvisions et de plus d'aisance pour conduire leurs plans budgttaires. Sur la base des Comptes publics, tous les gou- vernements provinciaux prkvoient des excCdents sur leur budget de 2007-2008, B l'exception du Qutbec qui vise 1'6quilibre en dtpit de gentreuses baisses d'imfits et d'autres tranferts vers les partic- uliers cette annte. Les gouvernements municipaux sont dans une situation plus difficile. Les chiffres de Statistique Canada donnent ?I penser que le bilan consolidt au niveau des gouvemements locaux a afficht un creusement des dCficits durant les demikres ann&s et abouti B un manque i gagner moyen de p&s de 5 milliards de dollars pour les quatre demiers trimestres2. Malgrt les pr6visions plus faibles de dkpenses au niveau local en 2007, i'amtliordtion des situations budgttaires aux niveaux fidbal et provincial devrait quand m6me maintenir les dtpenses gouvernementales rCelles sur une solide tendance haussikre qui se traduira par une croissance d'environ 2,5 p. 100 cette annCe et l'annte prochaine.
1 Statistique Canada rassemble les comptes nationaux des administrations Id6rale. orovinciale et municioale. Au niveau fkdkral, les estimations des comDtes nationaux ieposent sur les d o n n h des comptes publics fkdkraux. Cependant, les estimations des revenus et des depenses des comptes publics sont rectifiees sur le plan chronologique afin de correswndre & leurs incidences sur Kconomie. Ainsi, les depenses d'investisse- ment du gouvernement ne sont pas enregistrees au moment oh les fonds sont accordks
2 Dans le Medium Term Forecasting Model (MTFM) national du Conference Board, on a elargi le secteur public afin d'extraire les administrations provinciales et municipales des comptes publics rggionaux regroupks. Autrement dit, les donnkes historiques et les previsions sur les comptes municipaux regroupts et les comptes provinciaux et territori- aux regroupes sont maintenant disponibles sbparkment, alors qu'auparavant, elks Qient combinks dans des comptes publics regionaux totaux.
(comme dans les budgets), mais bien au moment oh les fonds sont verses et ont des rfipercussions mesurables sur la croissance economique.
Le Conference Board du Canada

The province is expected to post its third con- secutive budget surplus this year, marking the first time since Confederation this has occurred. The unemployment rate is expected to fall for the third consecutive year.
Real GDP
.. il Growth Ranking ?:* B~,,J..-‘ 7.1 #I
Growth Ranking #10
Retail Sales
Ranking 8.4 #I
Growth Ranking #6
Increased Oil Production Leads to Strong Economic Growth
by Todd A. Crawford
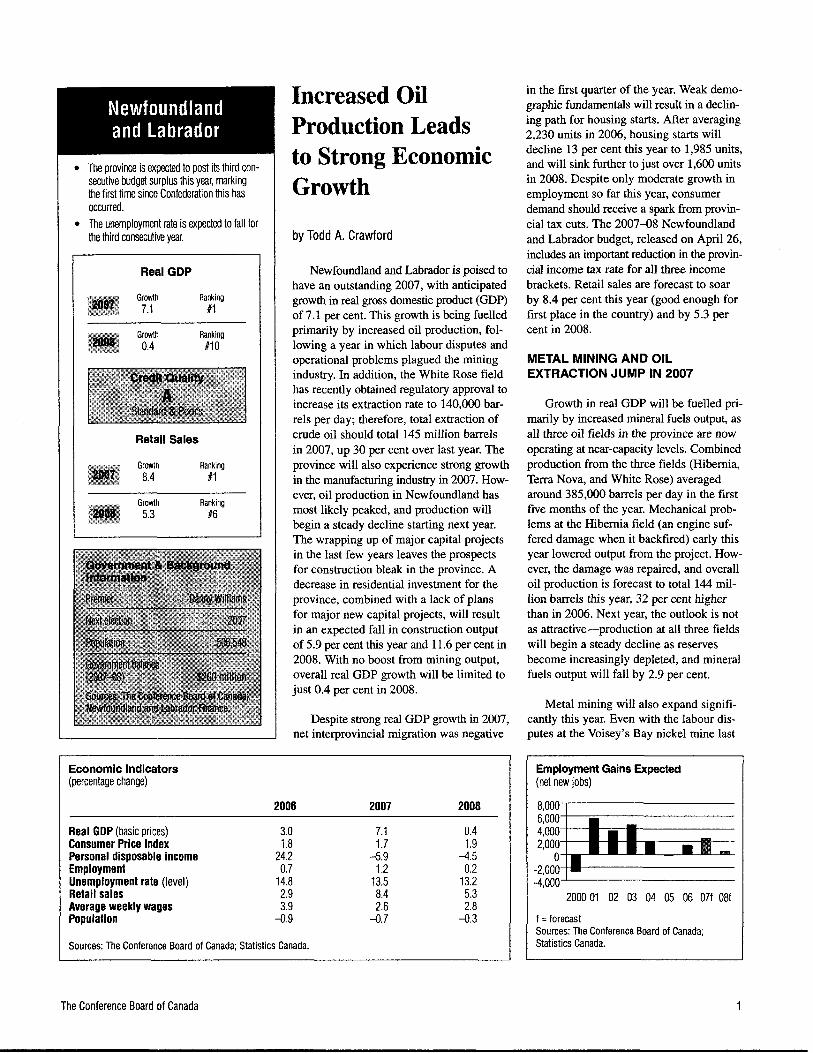
Newfoundland and Labrador is poised to have an outstanding 2007, with anticipated growth in real gross domestic product (GDP) of 7.1 per cent. This growth is being fuelled primarily by increased oil production, fol- lowing a year in which labour disputes and operational problems plagued the mining industry. In addition, the White Rose field has recently obtained regulatory approval to increase its extraction rate to 140,000 bar- rels per day; therefore, total extraction of crude oil should total 145 million barrels in 2007, up 30 per cent over last year. The province will also experience strong growth in the manufacturing industry in 2007. How- ever, oil production in Newfoundland has most likely peaked, and production will begin a steady decline starting next year. The wrapping up of major capital projects in the last few years leaves the prospects for construction bleak in the province. A decrease in residential investment for the province, combined with a lack of plans for major new capital projects, will result in an expected fall in construction output of 5.9 per cent this year and 11.6 per cent in 2008. With no boost from mining output, overall real GDP growth will be limited to just 0.4 per cent in 2008.
Despite strong real GDP growth in 2007, net interprovincial migration was negative
Economic Indicators (percentage change)
2006 2007 2008
Real GDP (basic prices) 3.0 7.1 0.4 Consumer Price Index 1.8 1.7 1.9 Personal disposable income 24.2 -5.9 -4.5 Employment 0.7 1.2 0.2 Unemployment rate (level) 14.8 13.5 13.2 Retail sales 2.9 8.4 5.3 Average weekly wages 3.9 2.6 2.8 Population -0.9 -0.7 -0.3
Sources: The Conference Board of Canada; Statistics Canada.
in the first quarter of the year. Weak demo- graphic fundamentals will result in a declin- ing path for housing starts. After averaging 2,230 units in 2006, housing starts will decline 13 per cent this year to 1,985 units, and will sink further to just over 1,600 units in 2008. Despite only moderate growth in employment so far this year, consumer demand should receive a spark from provin- cial tax cuts. The 2007-08 Newfoundland and Labrador budget, released on April 26, includes an impottant reduction in the provin- cial income tax rate for all three income brackets. Retail sales are forecast to soar by 8.4 per cent this year (good enough for first place in the country) and by 5.3 per cent in 2008.
METAL MINING AND OIL EXTRACTION JUMP IN 2007
Growth in real GDP will be fuelled pri- marily by increased mineral fuels output, as all three oil fields in the province are now operating at near-capacity levels. Combined production from the three fields (Hibernia, Terra Nova, and White Rose) averaged around 385,000 barrels per day in the first five months of the year. Mechanical prob- lems at the Hibernia field (an engine suf- fered damage when it backfired) early this year lowered output from the project. How- ever, the damage was repaired, and overall oil production is forecast to total 144 mil- lion barrels this year, 32 per cent higher than in 2006. Next year, the outlook is not as attractive-production at all three fields will begin a steady decline as reserves become increasingly depleted, and mineral fuels output will fall by 2.9 per cent.
Metal mining will also expand signifi- cantly this year. Even with the labour dis- putes at the Voisey's Bay nickel mine last
Employment Gains Expected (net new jobs)
8,000 6,000 4,000 2,000
0 -2,000 -4,000
2000 01 02 03 04 05 06 07f 08f
f = forecast Sources: The Conference Board of Canada; Statistics Canada.
The Conference Board of Canada 1

year, production increased by an estimated 17 per cent. With better labour relations expected this year, production should increase even further. A strike by support workers did shut down production in late April, but production resumed one week later after replacement workers were brought in. Overall, total metal mining-including iron ore production-is expected to increase by 20.2 per cent this year and 4 per cent next year.
WEAK RESIDENTIAL INVESTMENT HURTS CONSTRUCTION OUTPUT
With a noticeable lack of capital pro- jects on the horizon, investment in the province will suffer. Business and public non-residential investment is expected to fall by 1 per cent in 2007 and by a further 11.9 per cent next year. With a projected decline of 13.1 per cent in housing starts, total residential investment will fall 2.3 per cent this year-and as the decline in hous- ing starts continues, residential investment in 2008 will fall by 2.5 per cent. Increasing mortgage costs and a declining population will drive this weakness in the housing market. Once a mainstay of growth in the province, construction output is forecast to contract by 5.9 per cent in 2007 and 11.6 per cent in 2008.
MANUFACTURING WOES A THING OF THE PAST
Although the manufacturing sector has been susceptible to ups and downs in recent years, it would seem that the province has moved past those troubling times. No major plant closures are expected this year, and the manufacturing sector is forecast to expand by a healthy 6 per cent this year and 2 per cent in 2008. Cooke Aquaculture has announced an important salmon farming, processing, and hatchery project that will bring $135 million in investment and 200 new jobs to the south coast of Newfoundland.
EMPLOYMENT GAINS EXPECTED THIS YEAR
Solid employment gains will help lower the unemployment rate from 14.8 per cent in 2006 to 13.5 per cent this year and 13.2 per cent in 2008. Employment in the construc- tion sector will contract in 2007 and 2008. A total of 1,560 jobs will be lost-in line
with a suffering housing sector and the lack of major capital projects. On the other hand, excellent gains are expected in other sectors during the same time frame. With all mining projects operating at close to capacity, the primary sector will help offset the loss of jobs in construction as it adds over 750 jobs this year and another 200 in 2008. The public administration sector will also add to the payrolls, with an additional 1,300 jobs created over the next two years. All in all, total employment in the province will expand by 1.2 per cent this year (or about 2,500 net new jobs) and 0.2 per cent in 2008 (just over 500 net new jobs).
Budget 2007-08 introduced significant fiscal relief (totalling $154 million) to both individuals and businesses. The goal is to both the national and provincial levels and make personal tax rates in Newfoundland caused a temporary surge in the growth of and Labrador the lowest in the Atlantic government spending, personal disposable region and to help increase business invest- income, and personal savings. However, ment. Personal income tax rates have been the flow of funds will have very little decreased for all three brackets and the 9 per effect on real GDP.
Mineral Fuels Output to Begin Steady Decline in 2008 (1997 $millions)
cent surtax has been eliminated. In addition, the small business corporate tax threshold was increased from $300,000 to $400,000.
3,000 2,500 2,000 1,500 1,000
500 0
The provincial government of Newfoundland and Labrador has taken major steps in the past two years to erase its net pension liabilities. Last year, the provincial government used a windfall of $1.9 billion from the Atlantic Accord to reduce the actuarial deficit of a pension plan sponsored by the government. This year, the government placed $400 million into the Public Service Pension Plan in mid-March and another $582 million on June 30. These special payments had a substantial impact on labour income at
J I I I I r I I I I I I I
Industry Outlook (percentage change; 1997 $)
2007f H 2008f 30 20 10 0
-1 0 -20
Mining Community Finance, Wholesale Public Transpor- Manu- Construc- business and insurance and retail adminis- tation, ware- facturing tion
personal and real trade tration and housing and services estate defence information
f =forecast Sources: The Conference Board of Canada; Statistics Canada.
,&is +&+Q~+*'$\@@@,.
f = forecast Sources: The Conference Board of Canada; Statistics Canada.
The Conference Board of Canada


Prince Edward Island is the first province to export wind power to the United States as Ventus' $250 million project becomes operational. The sewice-sector boom continues, with wholesale trade and retail sales soaring.
Real GDP
Growth Rank~ng 88
Growth Ranking
25 17
Retail Sales
Growth 6 8
Rank~ng 83
Growth Rank~ng #8
GDP Growth Steady and Poised to Accelerate
by Sabrina Browarski
Provincial fiscal relief will greatly bene- fit the Prince Edward Island economy over the near term. Steady gross domestic prod- uct (GDP) growth of 2.2 per cent is pro- jected this year followed by 2.5 per cent in 2008. Provincial personal income tax cuts totalling $34 million will boost disposable income and consumer demand. Employment will make solid gains following sluggish labour market conditions in 2006, with strong growth in service-sector employ- ment. Several high-paying firms based in downtown Charlottetown are anticipated to create 1,200 new jobs this year. Retail sales will climb by 6.8 per cent in 2007 and 5 per cent in 2008.
The Island's economy will be propelled by its service sector, which will advance by 3 per cent in 2007 and by 2.7 per cent in 2008. Wholesale and retail trade output is forecast to make strong gains with whole- sale trade advancing by an impressive 11.8 per cent in 2007. Tourism will remain an ongoing concern in the wake of the high Canadian dollar, rising gasoline prices, and new cross- border security standards.
Weakness in the primary sector will dampen performance in the Island's goods- producing sector by 0.5 per cent this year. A cold spring translated into a 15 per cent drop in year-to-date lobster landings, and
tuna quotas were slashed by more than 40 per cent. Growth in agriculture is forecast to be muted-a decline of 1.6 per cent in 2007 and a meagre rise of 1.2 per cent in 2008. The construction industry will feel the effects of a sizable 20.7 per cent drop in housing starts in 2007. (See Chart 1.) Non-residential construction growth will unwind from its feverish pace to advance by 10 per cent in 2007 and 1.8 per cent in 2008 as a number of mega-projects come to a close.
DISPOSABLE INCOME BENEFITS FROM FISCAL RELIEF
Fiscal relief of $34 million in 2007 and $4.2 million for child-care centres from federal trusts in 2009 will spur growth over the near term. Personal disposable income is forecast to rise by 6.2 per cent in 2007-second only to Alberta-and by 3.5 per cent in 2008. (See Chart 2.) The fiscal position of the provincial govern- ment has improved considerably, allowing for some tax relief and a modest budget surplus. An additional $44 million of transfer funding from federal coffers for fiscal 2007-08 will help the province in achieving a projected $2.1 million surplus.
Labour market conditions will improve after a sluggish performance last year, with employment forecast to rise by 1.8 per cent in 2007 and by 0.8 per cent in 2008. Italian yacht-component producer Opacmare of Rivalta will offer starting salaries of $35,000 to 100 new employees when its new Montague facility opens this year. A hand- ful of other f m s will create 1,200 new jobs in downtown Charlottetown this year. This will drive average weekly wage growth of 4.4 per cent in 2007 and 2.5 per cent in 2008.
r
Economic Indicators (percentage change)
2006 2007 2008
Real GDP (basic prices) 2.1 2.2 2.5 Consumer Price Index 2.2 1.9 1.8 Personal disposable income 4.0 6.2 3.5 Employment 0.5 1.8 0.8 Unemployment rate (level) 11.1 10.4 10.3 Retail sales 4.1 6.8 5.0 Average weekly wages 4.2 4.4 2.5 Population 0.2 0.3 0.5
Sources: The Conference Board of Canada; Statistics Canada.
Housing Starts Tumble (percentage change)
20 10 0
-1 0 -20 -30
1999 00 01 02 03 04 05 06 07f 08f
f = forecast Sources: The Conference Board of Canada; CMHC Housing Time Series Database.
4 The Conference Board of Canada

STRENGTH IN THE SERVICE SECTOR soybean exports to Japan garnering interest. Hog farmers, who have been challenged
The Island's economy will be propelled by rising feed costs, received $750,000 in - - by strength in its service sector this year. assistance to stabilize price volatility. On Wholesale and retail trade output will rebound a more positive note, the manufacturing after a dismal performance in 2006. Whole- industry will rebound by 1.8 per cent in sale trade will advance by a stellar 11.8 per 2007 and by 3 per cent in 2008, improving cent in 2007, and retail trade will post 3.4 per near-term prospects in the goods-producing cent growth in 2007. Public administration sector. and defense output, which is forecast to expand by 1.8 per cent in 2007 and by 3.1 per cent in 2008, will also fuel strength in the services sector.
Personal disposable income will rise by 6.2 per cent in 2007-second only to Alberta.
The outlook for the tourism industry is dampened by the combination of high gaso- line prices, a strong Canadian dollar, and confusion over cross-border passport require- mats. The number of visitors from the United States is forecast to decline by 8.4 per cent in 2007. However, ail is not bleak-a new and upgraded arrivals gate at Charlottetown airport has buoyed passenger traffic, which rose 12 per cent year-over-year in June.
PRIMARY SECTOR STRUGGLING
The goods sector will recede by 0.5 per cent this year, and will rebound by 1.9 per cent in 2008. The fishing and trapping industry was hard hit and will decline by 2 per cent this year before resuming growth of 1.5 per cent in 2008. Cold waters this spring reduced early lobster landings by 15 per cent year-over-year, and tuna quotas were slashed from 250 tonnes per year to 147 tonnes. However, a lobster shortage south of the border has driven prices to a record high of $15/lb, which should encour- age a quick rebound.
Agricultural prospects are muted- growth will decline by 1.6 per cent in 2007 and rise by 1.2 per cent next year. (See Chart 3.) The potato acreage cap will pro- vide some upward price pressure in the near term. Farmers are increasingly diversifying their crops, with plans for the $40 million AgriTech Ethanol plant moving ahead and
CONSTRUCTION GROWTH DECELERATES
In total, construction output will recede by 3.8 per cent in 2007 and will rebound by a minor 0.4 per cent in 2008. Residential investment will fall by 8.8 per cent in 2007 and will rebound by 4.3 per cent in 2008. A saturated housing market will depress housing starts by 20.7 per cent in 2007- the largest drop in the country -with only a slight 1 per cent rebound in 2008. More positively, Charlottetown City Hall recently approved plans for a $7-million Harbour Square townhouse development.
Non-residential construction will also decelerate as several mega-projects end. Nevertheless, non-residential investment will advance by 10 per cent this year, with growth tapering to 1.8 per cent in 2008. The remaining projects, primarily in Charlottetown, include: a $9 million office tower for Aidr imark, the $20.9 million Charlottetown Waterfront Redevelopment Project, a $25 million Summerside condo1 mall development, and an $8.1 million head- quarters for ice cream company COWS.
A major coup for the Island was the grand opening of Ventus Energy Inc.'s West Cape wind farm, which supplies a
Personal Disposable Income Climbs (percentage change)
7 6 5 4 3 2 1 0
1999 00 01 02 03 04 05 06 07f 08f
f =forecast Sources: The Conference Board of Canada; Statistics Canada.
L
quarter of the Island's energy consumption. The second phase of the Ventus project will get underway this summer, with investment totalling $250 million. Ventus has entered into a 20-year, fixed-price contract with the New England Power Pool, making it the first independent Canadian energy supplier to export wind power to the United States.
Industry Outlook (percentage change; 1997 $)
2007f . 2008f 8 6 4 2 0
-2 -4
Agriculture Fishing and Construction Manufacturing Wholesale and Public trapp~ng retail trade adm~nlsfration
and defence f =forecast Sources: The Conference Board of Canada; Statistics Canada.
The Conference Board of Canada 5


The service sector is expanding at a healthy clip. Manufacturing plant clasures and lack of major capital investment are taking the steam out of the economy.
Real GDP
,,.... ." ,,,**: Growth 2 0 Ranking :;.<*.;-%$ . #9
Growth Ranking , , 2.3 #9
B;gi Growth Ranking 4.0 $8
Growth Ranking 4.7 #I 0
Steady Gains in Services Sector Keep Economy Afloat
by Prince Owusu
Helped by steady gains in the services- producing industries, real gross domestic product (GDP) is expected to advance by 2 per cent this year. Improved labour mar- kets, solid income gains, and an inflow of new financial services will help boost eco- nomic activity in the province. In particular, wholesalers and retailers got off to a better start early this year with strong sales, and the momentum is expected to last through the year. The arrival of new financial services firms and continued strength in the indus- trial, commercial, and institutional real estate market are expected to counter the dwin- dling fortunes of the residential real estate market as the housing boom fizzles out.
The recovery in the job market is expected to yield good results for domestic trade.
The story unfolds differently in the goods- producing sectors. With the exception of the mining industry (where new natural gas extraction methods and increased base metal prospecting are boosting economic activity), growth in the industrial sector will remain temperate. Manufacturing activity will drop for the third consecutive year as the industry grapples with plant closures. Growth in the construction industry will
Economic Indicators (percentage change)
2006 2007 2008
Real GDP (basic prices) 1.2 2.0 2.3 Consumer Price Index 2.1 2.0 1.9 Personal disposable income 4.4 4.4 3.2 Employment -0.3 1.6 0.4 Unemployment rate (level) 7.9 7.8 7.3 Retail sales 6.3 4.0 4.7 Average weekly wages 3.1 2.6 2.6 Population -0.2 -0.1 0.1
Sources: The Conference Board of Canada; Statistics Canada.
contract this year due to a lack of major projects. However, in 2008, construction of a container terminal ($300 million), a golf and spa resort (also estimated at $300 rnil- lion), and the start-up of the $4.5 billion Keltic petrochemical complex project will help revive the construction industry. Overall real GDP growth of 2.3 per cent is projected for the province in 2008.
SERVICE SECTOR WILL CONTINUE TO PROD ECONOMY
The service sector will continue to prod the provincial economy in the near term. The recovery in the job market is expected to yield good results for domestic trade. Wholesale trade recovered remarkably at the beginning of the year from the lull of the last quarter of 2006, and it is expected to get a further boost from healthy retail sales over the remainder of this year. All in all, wholesale and retail trade output is expected to advance by 4.4 per cent this year and by a further 2.5 per cent in 2008.
Restaurants, as well as amusement and personal services activities, will benefit from the healthy job market and the resultant income gains. The information, communi- cation, and technology sector is also expand- ing in the province. Research In Motion, which broke ground for its new $230 mil- lion technical support centre in Hammonds Plains, continues to add staff at its interim location near Bayers Lake Industrial Park. Other technical support centres are also doing well. Minacs, ServiCom, HI3 Studios, On-Line Support, xwave, and other technical support centres continue to expand by adding new employees to their payrolls. This will help the commercial services industry advance by an average of 2.6 per cent over 2007-08.
Wholesale and Retail Trade Flourishing (percentage change; 1997 $)
10 8 6 4 2 0
1999 00 01 02 03 04 05 06 07f 08f
f =forecast Sources: The Conference Board of Canada; Statistics Canada.
The Conference Board of Canada 7

Financial services firms (two from Bermuda and a third from Toronto) are setting up new operations in the province, and this will help mitigate the impact of the housing sector slowdown on the overall finance, insurance, and real estate markets. Growth in the industry should advance by an annual average of 2.5 per cent over 2007-08.
MANUFACTURING AND CONSTRUCTION TAKE STEAM OUT OF GOODS SECTOR . . .
The goods industry will again under- perform this year. Plant closures, the soar- ing Canadian dollar, the slowdown in the U.S. economy, and competitive pressures from other countries will hurt the manufac- turing sector this year. After dropping by a sizable 6.2 per cent last year, output will contract again by 0.9 per cent this year. The province lost 380 meat-processing jobs with the closure of the Maple Leaf plant in Canard early this year. As well, TrentonWorks shut its railcar manufacturing plant this spring leaving 300 people without jobs, and 580 jobs will be lost when Hershey closes its Moir's chocolate factory in Dartmouth at the end of the year and moves production to Mexico. The outlook is, however, quite positive for shipbuilding and for the aerospace industry. The strength in these industries, plus a stronger economy south of the border, will help the sector advance by 1.9 per cent in 2008.
The construction industry will add to the weakness in the goods-producing sector this year. There are no new major projects to stimulate the industry. (Several mixed residential-commercial plaza developments began last year and are spread over many years, resulting in minimal impact on the industry this year.) Growth in real con- struction output is expected to decline by 8.1 per cent this year but will quickly bounce back to 2.3 per cent growth in 2008, thanks to the construction of the $4.5 billion Keltic petrochemical project. The construction industry however will be facing a large contraction in housing demand going forward, and that will limit possible gains from the residential sector.
. . . BUT MINING RIDES TO THE RESCUE
The production of natural gas in the province is on the cusp of resurgence. In late 2006, owners of the Sable Offshore Energy Project installed a compression platform at the Thebaud field, the hub of the six fields that form the offshore project. The platform will enhance the gas flow from the field. The expected increase in the production of natural gas and related by-products will help lift growth in min- eral fuels output by 16.5 per cent this year. Growth will drop to 0.4 per cent in 2008,
however' as gas production down. to boost production. Insufficient poultry
Plant Closures Hurt Manufacturing (percentage change; 1997 $)
10
5
0
-5
-1 0 1999 00 01 02 03 04 05 06 071 08f
f = forecast Sources: The Conference Board of Canada; Statistics Canada.
On the metals front, the rush is on for property claims as metal prices have shot through the roof. Acadian Gold has added the Lake Ainslie barite-fluorite deposits (a total of 52 claims) to its portfolio. That is in addition to its 86 mineral claims covering 3,440 acres around the Scotia Mine pro- cessing plant at Gays River. Operations at the mothballed Scotia Mine resumed early this year after a 15-year hiatus. It is expected to produce 39.8 million pounds of zinc and 16.5 million pounds of lead annually, and will employ 90 people. All in all, real mining output is expected to expand by 11.5 per cent per this year, helping to limit the decline in the goods sector to 0.9 per cent in 2007.
In contrast to the revival in the mining industry, the outlook is dull for the rest of the resource sector this year. After advancing by an annual average of 5.4 per cent over the past four years, growth in the agricul- ture industry is expected to decelerate to 1.3 per cent this year. Hog farmers continue to face challenging market conditions, and high feed costs are limiting farmers' ability
volumes led to the closure of the Maple Leaf processing plant earlier this year. This may force farmers who rely on the plant to further curtail their poultry opera- tions. On the fishing front, growth in the industry is expected to advance moderately by 1.7 per cent annually over 2007-08 as fishable stocks are depleted.
Industry Outlook (percentage change; 1997 $)
20071 2008f 10 5 0
-5 -1 0
Fishing and Construe- Agriculture Goods Wholesa!e Finance, Community, Services traPPlng tion sector and retall insurance, busmess and sector
trade real estate personal servlces
f = forecast Sources: The Conference Board of Canada; Statistics Canada.
The Conference Board of Canada


is expected to last through next year as prospecting activity and new production coming online help generate double-digit growth for the industry.
projects. Sawmills and pulp and paper mill closures deal a blow to an otherwise strong economy.
Real GDP
Growth Ranking , . 2.5 .. #8
Growth Ranking 5.0 #7
Cm Growth Ranking * f &.re:f& 4.9 89
Forestry-related activity is afFected this year by a number of mill closures in the province. In addition, the slowdown in the U.S. economy, the high Canadian dollar, and competitive pressures from abroad will impede manufacturing output in the province. However, the industry will get a boost from the new liquefied natural gas plant which is expected to start re-gasification next year. Manufacturing output is expected to post a healthy 5.3 per cent gain in 2008, following a forecast 2.8 mr cent decline this year. The
by Prince Owusu
New Brunswick's economy will con- tinue to expand at a healthy clip this year. Major capital projects and booming mining operations, together with healthy domestic demand, will help boost growth in real gross domestic product (GDP) to 2.4 per cent this year following a 2.8 per cent gain in 2006.
The construction industry will continue to grab headlines as ongoing large-scale projects help stimulate economic activity. Notable are the $1.4 billion upgrade to the Point Lepreau nuclear plant and Irving Oil's new $750 million liquefied natural gas plant in Saint John with its associated pipeline. Construction activity is projected to wind down next year as the megapro- jects come to an end. Declining residential investment will also weigh down construc- tion activity in the near term.
current resurgence in the mining industry
Economic Indicators (percentage change)
Real GDP (basic prices) Consumer Price Index Personal disposable income Employment Unemployment rate (level) Retail sales Average weekly wages Population
Sources: The Conference Board of Canada; Statistics Canada.
The service sector will continue to expand at a healthy pace as a flurry of call centre openings improve the job market outlook, thus boosting income prospects. Consumption expenditures should benefit from the healthy labour income gains despite higher provincial income taxes. All in all, real GDP growth of 2.5 per cent is forecast for 2008.
INDUSTRIAL FORECAST
With the exception of the manufacturing industry (which has been hurt by a number of mill closures), the goods sector is doing quite well. Exploration companies are scouring the province at a pace not seen before. Blue Note Mining (a junior mining company) has reactivated the defunct Restigouche and Caribou mines which were shut down in 1998 when world metal prices collapsed. Production began this spring, and 476 million pounds of zinc, 223 million pounds of lead, and 5 million ounces of silver are expected to be produced over five years by the more than 270 new employees.
Junior oil and gas company Comdor Resources is expected to bring several wells into production this year, helping to lift natural gas production to 30 million cubic feet per day. Metals, natural gas production, and more exploratory activities should help boost real mining output by 16.8 per cent this year and by 20.3 per cent next year. There are some upside risks to the outlook in the mining industry as some of the prospect- ing areas, such as the Mount Pleasant mine
Economy Expands at Healthy Pace (real GDP, percentage change)
f = forecast Sources: The Conference Board of Canada; Statistics Canada.
10 The Conference Board of Canada

near St. George and the RoIIingdarn area, could turn up sufficient commercial deposits to warrant production.
Major capital projects are also boosting construction activities in the province. Notable among the projects are the $1.4 billion refurbishment of the Point Lepreau nuclear plant and the development of a $750 million liquefied natural gas terminal in Saint John. Associated with the terminal project is a $350 million pipeline expected to be built by Emera. These megaprojects, plus other medium-size capital initiatives, will help boost real construction output by 13.9 per cent this year. The completion of these projects and the weakness in the housing market will result in a 4.8 per cent decline in real construction output next year. How- ever, there is upside risk to the construction outlook. Potash Corp of Saskatchewan has recently announced a US$1.6 billion plan to build a two-million-tonne potash mine and expanded milling operation in New Brunswick. Construction could begin next year once the necessary permits are obtained. Meanwhile, Irving Oil is moving ahead with its application to build a second refinery at a cost of $7 billion. These projects will definitely help improve economic growth and may stem the negative net interprovin- cial migration over the next five years.
The story is different on the manufactur- ing side. The high Canadian dollar, a slower U.S. economy, and competitive pressures have forced some pulp and paper mills and sawmills in the province to close. Real manufacturing output is expected to drop by 2.8 per cent this year, but there will be a strong rebound of 5.3 per cent forecast in 2008 thanks to a stronger U.S. economy and the start-up of re-gasification of lique- fied natural gas at the new Irving Oil ter- minal in Saint John.
DOMESTIC DEMAND OUTLOOK
With 11,000 new jobs created in the &st half of this year, the province is set to out- pace last year's healthy job growth as all industries (with the exception of manufac- turing, transportation, and finance, insurance, and real estate) have added to their rosters. The unemployment rate fell to 6.8 per cent in June this year, the lowest the province has ever recorded. As a result, growth in personal disposable incomes is expected to remain sturdy at 4.5 per cent this year, thus
giving impetus to more consumer spending. Retail sales are expected to advance by 5 per cent this year. Wholesalers are cashing in on the brisk retail activities and will increase output by 4.3 per cent this year (compared with the decline of 1.9 per cent incurred last year). Increased industrial production and sizzling construction activities will bode well for wholesalers in the province. The opening of a new shopping mall with 700 workers in Fredericton will help boost domestic trade. In all, wholesale and retail trade are projected to expand by 4 per cent this year and a further 2.7 per cent in 2008.
Personal services, restaurants, and amuse- ment activities are all expected to benefit from the healthy income levels across the province. As a result, commercial services should advance by 2.7 per cent this year and by a further 2.6 per cent in 2008. In addition to the expected increase in demand for personal services, customer service activities are booming in the province and will help generate growth for commercial services. Rogers Communications is adding 244 people to its payroll in Moncton, while Florida-based online services provider Hostopia.com will create 200 jobs at its new customer interaction centre in Miramichi. The city and its surrounding communities are expected to lose over 800 forestry jobs this year by either permanent or temporary closures of three pulp and paper mills and three sawmills, so these new jobs come at an opportune time for the community, and there is talk of more call centre jobs coming into the area.
The housing boom has dissipated 'and growth in the finance, insurance, and real estate sector is expected to decelerate from 3.1 per cent in 2006 to a still healthy average
BetterTimes for the Mining Industry (percentage change; 1997 $)
30
20
10
0
-1 0
-20 1999 00 01 02 03 04 05 06 07f 08f
f =forecast Sources: The Conference Board of Canada; Statistics Canada.
of 2.4 per cent over 2007-08. The underly- ing activities, such as financial intermedia- tion (all activities related to banking and depository institutions) and rental and leas- ing services, are expected to remain steady in the near term given the positive outlook for income. The only area of weakness will come from real estate brokerage services hurt by the decline in the housing market.
Industry Outlook (percentage change; 1997 $)
20071 2008f
15 10 5 0
-5 -1 0
Agriculture Construc- Manufac- , Goods Wholesale Community, Public Services tion turing ~ndustrles and retall bus~ness and admlnls- industries
personal tration and services defence
f =forecast Sources: The Conference Board of Canada; Statistics Canada.
The Conference Board of Canada


boosting consumer demand. The construction outlook is bright due to large public sector projects for new health- care facilities and highway upgrades.
Real GDP +A,:%.-> +,:,~?, Growth Ranking 2.0 #10
Growth Ranking #6
Retail Sales
, . : Gravth Ranking ,fm 4.0 *~~P+*W%? #9
Ranking #5
by Marie-Christine Bernard
While the recent pay equity settlement's boost to household incomes has meant plenty of good news for consumers and retailers, the manufacturing sector is suffering from the recent ascent of the Canadian dollar to above the US$0.95 level. The year started on a very weak note for exporters, and the surge in the loonie since May will prolong the slump in trade. The trade sector held its own last year with exports rising by 3 per cent. However, with more declines projected in exports of wood products and pulp and paper, and with generalized weakness in several other smaller sectors, a decline of 0.5 per cent in total exports is forecast for 2007. Imports will continue to grow to sat- isfy robust consumption expenditures. The trade balance will continue to be a negative force with the result that real gross domestic product (GDP) at market prices will advance by a slow 2 per cent in 2007. The economic outlook will improve next year when a more balanced trade performance allows real GDP to rise by 2.8 per cent.
Bright prospects for disposable income gains, together with firmer capital expendi- tures, will soften the blow from the diffi- culties in the trade sector. The $1.8 billion retroactive pay equity payout to over 300,000 public sector employees, coupled with strong job creation in the first half of
( the year (69,500 new jobs between January I and June 2007 compared with 19,200 during
Economic Indicators (percentage change)
Real GDP (market prices) Consumer Price Index Personal disposable income Employment Unemployment rate (level) Retail sales Average weekly wages Population
I Sources: The Conference Board of Canada; Statistics Canada. I
the same period last year), will boost real consumer expenditures by 3.5 per cent in 2007. The housing market, even on a declin- ing trend, has proven to be more resilient than expected, with housing starts still averaging a strong 50,000 units at annual rates between April and June. In addition, public investment will make strong gains over the forecast horizon as several large capital projects involving new health care facilities get underway. While the rising Canadian currency is troubling exporters, it is expected to fuel demand for new machinery and equipment in order to improve efficiency and competitiveness. Real machinery and equipment investment will advance by a strong 8.7 per cent in 2007 and by 6.9 per cent in 2008.
Quebec led the way in retail sales in May 2007 with a rise of 4.9 per cent.
DOMESTIC ECONOMY TO THE RESCUE
A combination of factors will fuel robust gains in consumer expenditures this year. While job creation in the province has far exceeded expectations so far this year, a large proportion of those new jobs were among the self-employed and the lower- paying service sectors. Retailers, however, have nothing to worry about since house- holds will have plenty of income to spend. Incomes in Quebec this year will also get a boost from a minor provincial income tax cut and, more importantly, from the pay- equity agreement between the provincial government and over 300,000 public sector employees (mainly in the education and
Retail Sales Getting a Boost From Pay Equity Payment (seasonally adjusted retail sales; at annual rates; $ billions)
' 8.0 7.8 7.6 7.4 7.2 7.0 6.8
0 6 0 6 D 6 0 6 C P 0 6 0 2 0 2 0 2 ,re &. *A $ %& ..$A. \ - &. *A Source: Statistics Canada.
The Conference Board of Canada

health care sectors). It will cost the provin- cial government $825 million per year starting in April 2007 in addition to the $240 million paid out in fiscal year 2006-07. Affected workers will receive average annual salary increases of 6.5 per cent in addition to the $1.8 billion retroactive settlement (going back five years) paid out over the course of this year. Newly announced provin- cial fiscal relief totalling close to $1 billion and starting in January 2008 will provide support to incomes going forward. Real consumer expenditures will be solid in the next two years, rising by 3.5 per cent in 2007 and 2.8 per cent in 2008. Quebec led the way in retail sales in May 2007 with a rise of 4.9 per cent, the strongest monthly sales growth since February 1998.
Exporters saw their performance deteri- orate in the first few months of 2007.
PUBLIC INVESTMENT DOMINATING
The overall construction outlook is bright, and most of the strength is coming from the public sector. Over the next five years, the provincial government plans to invest $30 billion to renovate and expand the public transportation system, roads, and education and health care facilities. In fiscal 2007-08, provincial public capital expenditures will jump to $6.4 billion, up from $4.9 billion last fiscal year. Over the next five years, $3.6 billion will be invested in the McGill Health Centre, the Centre Hospitalier Universitaire de MontrCal, and Ste-Justine hospital. Furthermore, by 2010, $750 mil- lion will have been spent to develop Highway 175 in the Saguenay-Lac-Saint-Jean region's Parc des Laurentides.
Large capital developments in the energy sector will also fuel construction work in the province in the next few years. Hydro- QuCbec's Eastmain-lA/Rupert $5 billion project, the work to increase transmission capacity with the Ontario electricity grid ($808 million), and a natural gas liquid terminal in Gros-Cacouna ($660 million) have recently begun or will get under way in the near future. In addition, new wind farm capacity will be added between now and the end of the decade--Cartier Cnergie
dolienne, Northland Power, Skypower, Axor, and 3Ci will invest a total of $1.8 billion over the next two to six years.
EXPORTS HURTING
While the Canadian dollar continues to experience a summer of 30-year highs (rising 1 above US$0.96 on July 24), exporters saw their performance deteriorate in the first few months of 2007. Because of the weak- ening of the U.S. economy (particularly in consumer demand and the housing sector), exports will remain weak-but there will be some improvement next year. The aero- space industry, a mainstay of the economy, seems to be escaping an ongoing slump among manufacturers. Moreover, Bombardier is more confident than ever about the busi- ness jet segment of the market. It forecasts is forecasting a balanced budget in both worldwide demand for business jets at 995 years. In addition, the provincial govern- over the next 10 years, a high level that ment is planning to inject $200 million could benefit the province. The aerospace into the Generation Fund this fiscal year. industry continues to support the manufac- By the end of fiscal 2008-09, more than turing sector through exports of aerospace $2 billion will have been placed in this fund. products and parts. These exports are
Exports to Suffer From Strength in Loonie (real exports; percentage change)
Export growth - f!$!$e rate
12 0.95 10 0.90 8 0.85 6 0.80 4 0.75 2 0.70 0 0.65
-2 0.60 -4 0.55
~ ~ s + o z s o ~ s ~ & & Z
f = forecast Sources: The Conference Board of Canada; Statistics Canada.
expected to grow by an annual average of 10.9 per cent over 2007-08. Overall we expect total exports to drop by 0.5 per cent in 2007 and rebound by 3.1 per cent in 2008. Still, the trade balance will continue to be a drag on bottom-line growth in both years as imports make strong gains.
FISCAL SITUATION
On May 24, the provincial government released its 2007-08 budget-one that will keep government spending in check. Nominal program spending will increase by 3.9 per cent this fiscal year and by 3 per cent in 2008-09, with two-thirds of the increase going toward health care. The government
Industry Outlook (percentage change; 1997 $)
20071 20081
1
Manufac- Mining Construction Goods Wholesale Community, Public Services turing sector and retail business adminis- sector
trade and personal tration and servlces defence
f = forecast Sources: The Conference Board of Canada; Statistics Canada.
i
The Conference Board of Canada

The Conference Board of Canada


L'lNVESTlSSEMENT PUBLIC DOMINE
Dans l'ensemble, l'industrie de la con- struction jouit de perspectives florissantes, dues en grande partie au secteur public. Au cours des cinq prochaines annCes, le gouvemement provincial a l'intention d'in- vestir 30 milliards de dollars dans la rCfec- tion et l'expansion du rkseau de transport en commun, des routes et de certains Ctab- lissements d'enseignement et de soins de sand. Pendant l'exercice 2007-2008, les dCpenses publiques en capital de la province atteindront 6,4 milliards de dollars compar- ativement B 4,9 milliards 17annCe demikre. D'ici ?i cinq ans, 3,6 milliards de dollars seront investis dans le Centre de santC McGill, le Centre hospitalier universitaire de MontrCal et l'hbpital Ste-Justine. De plus, d'ici B 2010,750 millions de dollars auront CtC consacrCs B l'tlargissement de la route 175 dans le Parc des Laurentides, situt dans la r6gion du Saguenay-Lac-Saint-Jean.
En mai 2007, le QuClbec a enregistre la plus forte augmentation des ventes au d6tail- 4,9 p. 100.
Au cows des prochaines annCes, la construction dans la province sera stirnulie Cgalement par d'importants projets d'in- vestissement dans le secteur de 1'Cnergie. Le projet Eastmain- 1 AtRupert d'Hydro- Que%ec (5 milliards de dollars), les travaux visant accroitre la capacitC de transmission d'tlectricitC vers I'Ontario (808 millions de dollars) et la construction d'un terminal de rkception du gaz nature1 liquCfiC Gros- Cacouna (660 millions de dollars) ont CtC entamCs demibrement ou commenceront sous peu. A cela s'ajoutera I'tlargissement du parc Colien prCvu d'ici i la fin de la dkennie : Cartier Cnergie hlienne, Northland Power, Skypower, Axor et 3Ci investiront au total 1,8 milliard de dollars au cours des deux B six prochaines anntes.
LES EXPORTATIONS SOUFFRENT
Alors que 1'CtC de tous les records depuis 30 ans se poursuit pour le dollar canadien (qui a dCpassC les 0,96 $US le 24 juillet), les exportateurs ont vu leur performance se dCtCriorer durant les premiers mois de 2007. ~ t a n t domi le ralentissement de 1'Cconomie
am6ricaine (particulikrement au chapitre de la demande des consomrnateurs et du secteur du logement), les exportations demeureront faibles. Toutefois, la situation s'amkliorera quelque peu I'annCe prochaine. L'industrie abrospatiale, pilier de l'tconomie, semble Cchapper au marasme qui persiste dans le secteur manufacturier. De plus, la sociCtC Bombardier est plus confiante que jarnais dans l'avenir du cr6neau des avions d'affaires i rkaction. Elle prCvoit que la demande mondiale atteindra 995 avions d'affaires au cours des 10 prochaines annCes, ce qui pourrait 6tre avantageux pour la province. L'industrie akrospatiale continue de soutenir le secteur manufacturier grice B ses expor- tations de produits et de pikes, qui devraient faire un bond annuel de 10,9 p. 100 en moyenne durant la pCriode 2007-2008. Nous prkvoyons que, dans l'ensemble, les exportations totales accuseront une baisse de 0,5 p. 100 en 2007 avant d'augmenter de 3,l p. 100 en 2008. Malgr6 tout, la bal- ance commerciale continuera d'entraver la croissance Cconomique au cows de ces deux annees, car les importations progresseront rondement.
Les exportateurs ont vu leur perform- ance se deteriorer durant les premiers mois de 2007.
LA SITUATION FISCALE
Le 24 mai, le gouvemement provincial a dCpod son budget 2007-2008, qui sera marquC par une certaine austCrit6 dans les dCpenses publiques. Les dCpenses nominales consacdes aux programmes augmenteront de 3,9 p. 100 cette annCe et de 3 p. 100
Les exportations souffriront de la vigueur du huard (exportations rbelles; variation en pourcentage)
Croissance des exportations totales - $ CAN
15 0,95 10 0,85 5 0,75 0 0,65
-5 0,55 . \ 9 j o 0 6 0 ? . S ~ & 8 ~ ~ @
p = prevision Sources : Le Conference Board du Canada; Statistique Canada.
pendant l'exercice 2008-2009; les deux tiers de l'augmentation de ces dCpenses iront B la santb. Le gouvernement compte dCposer un budget Cquilibr6 pour ces deux exercices. De plus, il a l'intention d'injecter 200 mil- lions de dollars dans le Fonds des gtnCra- tions au cours du pdsent exercice. D'ici a la fin de 2008-2009, plus de deux milliards de dollars auront 6tC investis dans le Fonds.
Perspectives sectorielles (variation en pourcentage; $ de 1997)
2007p 2008p
10 8 6 4 2 0
Fabrication Mines Construction Biens Commerce Services - Adminis- Services de gros et communautbs, tration de detall entreprrses, publique
particullers et d6fense p = prevision Sources : Le Conference Board du Canada; Statistique Canada.
Le Conference Board du Canada 17

18 Le Conference Board du Canada

Accelerated capital cost allowances will stim- ulate a large increase in machinery and equipment investment in 2007-08. Residential construction will grow modestly, with large gains in renovation activity offset- ting falling housing starts.
Real GDP
p a : Growth Ranking 2.3 * .. #7
Retail Sales
Growth Ranking 3.3 #10
Ranking
:*;.e',2.;a,:3 5.8 14
On the Road to Recovery, One Step at a Time
by Sabrina Browarski
The Ontario economy will once again under-perform the national average this year, but it now appears to be on the road to recovery. While real gross domestic product (GDP) at market prices is forecast to grow at a moderate 2.3 per cent in 2007, economic growth will be more in line with the national average in 2008, advancing by 3.2 per cent. Personal disposable income is forecast to advance by a respectable 3.9 per cent in 2007, and the net outflow of interprovin- cial migrants is anticipated to ease in the coming quarters, providing optimism for better times in the near term.
Due to resilient vehicle sales south of the border late last year and early in 2007, Ontario automobile exports have not fal- tered. However, the momentum will not last through to the end of this year. U.S. demand for new vehicles is expected to dwindle as a decline in the amount of home-equity withdrawals dampens spend- ing. However, the medium-term outlook for the Ontario auto sector is promising. The industry will benefit from the ongoing plant restructurings and upgrades (totalling more than $5 billion) by GM, Ford, and Chrysler which will ultimately enable the production of multiple vehicle models in a single facility. A new Toyota plant sched- uled to open in 2008 will contribute to an estimated 4.6 per cent upswing in manu- facturing output in Ontario next year. The
Economic Indicators (percentage change)
2006 2007 2008
Real GDP (market prices) 2.0 2.3 3.2 Consumer Price Index 1.8 2.2 2.1 Personal disposable income 5.1 3.9 4.0 Employment 1.5 1.4 1.4 Unemployment rate (level) 6.3 6.5 6.6 Retail sales 4.0 3.3 5.8 Average weekly wages 1.8 2.5 2.6 Population 1 .O 0.8 1.1
Sources: The Conference Board of Canada; Statistics Canada.
strength in the auto sector early this year will be enough to lift total exports by 4.3 per cent in 2007. With stronger economic activity south of the border in 2008, more balanced export gains are anticipated. The trade bal- ance is expected to contribute to overall economic growth starting in 2008.
The strength in the auto sector early in the year will be enough to litt total exports in 2007.
With weak job creation and modest wage gains so far this year, overall consumer demand will wane in the short term. The construction industry in the province will greatly benefit from commercial/office tower developments and from rising capi- tal expenditures for the development and enhancement of the power-utility network. Moreover, the federal government's accel- erated capital cost allowances for capital investments made by manufacturers before 2009 will further stoke investment inten- tions. As such, while real machinery and equipment investment will slow to growth of just 4 per cent this year, a healthy 6.7 per cent gain is anticipated for 2008.
CAPITAL INVESTMENT MODERATES
Capital expenditures will continue to stimulate Ontario, though at a more mod- erate pace than last year. Retooling in the auto and parts sector, coupled with a surge in office and hotel/condo developments in downtown Toronto, will continue to fuel non-residential investment. However, with construction of several projects scheduled to unwind by 2009, total capital investment growth will soften in the near-term. After
Machinery and Equipment Investment Rebounds (percentage change; 1997 $ )
15 10 5 0
-5 -1 0
1999 00 01 02 03 04 05 06 071 08f
f =forecast Sources: The Conference Board of Canada; Statistics Canada.
The Conference Board of Canada 19

a 6.3 per cent surge in 2006, gross fixed capital formation will advance by a slower 2.7 per cent this year and by 4.3 per cent in 2008. In total, the Conference Board estimates that around $8.5 billion worth of medium to large public- and private-investment projects are now underway in Ontario'.
Non-residential construction is booming in downtown Toronto, where $1.7 billion has been committed for several office com- plexes through to 2009. Among the major projects under way are the $400 million RBC Centre by Cadillac Fairview Corporation, the $300 million Bay Adelaide Centre by Brookfield Properties, and the $250 million Telus building by Menkes Developments Ltd. The dual condominium-hotel has also become popular in Toronto, with several significant developments. These include the $350 million Ritz-Carlton Hotel & Residences, the Trump International Tower & Hotel, phases two and three of the Brookfield Properties Corporation project, and the $430 i l l i o n ~ h a n i r i - ~ a ~ i t e l s and Resorts complex. Approval was recently granted for a $500 million residentialhotel undertaking by Four Seasons. Overall, non-residential investment is expected to expand by 3.5 per cent this year, but will decline by 1.3 per cent in 2008.
Strength in government investment will be sustained in the near-term by energy and transportation infrastructure renewal. The provincial government has earmarked $1.2 billion for the extension of the GTA subway to York. Between 2005 and 2010, the province's more comprehensive $30 bil- lion "ReNew Ontario" plan will direct funding to health-care and educational facilities in addition to transit and trans- portation upgrades. In total, real govern- ment investment will advance by 1.3 per cent this year and by 5.3 per cent in 2008.
Prospects for residential investment are divided this year, as solid gains in the resale market will more than outweigh new hous- ing developments. New housing is forecast to recede by 4.7 per cent this year, and will rebound by 1.2 per cent in 2008. By con- trast, other residential investment (the sum of renovations and ownership transfer costs) will advance by 6.8 per cent this year, with growth tapering to 5.6 per cent in 2008. In total, residential investment will advance by 1.7 per cent in 2007 and by 3.8 per cent in 2008.
MACHINERY AND EQUIPMENT INVESTMENT SURGES
Thanks in part to short-term tax incen- tives introduced by the federal government, Ontario's battered manufacturing sector is forecast to rebound by 2008. A strong Canadian dollar and rising energy costs will continue to be an albatross around the province's neck in 2007, with the manufac- turing sector forecast to remain at a stand- still. However, an accelerated capital cost allowance (CCA) schedule will provide a temporary stimulus to manufacturing and processing businesses struggling with an
Residential Investment Divided (percentage change; 1997 $ )
New housing Other residential * 20 15 10 5 0
-5 1999 00 01 02 03 04 05 06 071 081
*Other residential represents renovation activity and ownership transfer costs. f =forecast Sources: The Conference Board of Canada; Statistics Canada.
unfavourable currency and strong foreign competition. Investment in machinery and rise by 3.9 per cent in 2007, with growth equipment will advance by 4 per cent this accelerating to 4 per cent next year. This year, but growth will accelerate to 6.7 per will stimulate consumer spending, raising cent in 2008. Performance in the manufac- retail sales growth above the national average. turing sector will rebound by 4.6 per cent in 2008 and the aver- 1 Calculated from private data sources as the sum of non- age as auto sector investment projects residential, non-energy related projects valued at more enter the spending phase. than $200 million.
DOMESTIC DEMAND MUTED
Domestic demand will weaken in the short term alongside mild job and wage gains. In 2007, real consumer expenditures are forecast to lose momentum with growth of 3.2 per cent, down from 3.6 per cent in 2006. Growth in retail sales will lag slightly at 3.3 per cent this year in the face of weaker job prospects. While modest employment gains are in the cards in the near-term, downsizing in the goods sector remains a challenge. Nevertheless, wage gains will remain solid at 2.5 per cent this year. Owing partly to the advent of the Ontario Child Benefit, personal disposable income will
Industry Outlook (percentage change; 1997 $)
2007f 2008f 5 4 3 2 1 0
Agriculture Fishing Construction Manufacturing Wholesaleand Public retail trade adm~ntstration
and defence f =forecast Sources: The Conference Board of Canada; Statistics Canada.
The Conference Board of Canada

21 The Conference Board of Canada

Manufacturing sector to benefit from large orders in the transportation industry. The domestic economy is thriving due to a boom in housing starts and strong retail activity.
Real GDP
Ranking
3 3 4 #4
Growth Ranking 'a, 3 6 #2
Retail Sales
Ranking #4
Growth Rank~ng 9e 6 0 #2
Robust and Diversified Economy
by Nancy Bergeron
Manitoba's economy is forecast to expand by a healthy 3.4 per cent this year and 3.6 per cent in 2008. Construction will be an important growth driver in the province over the forecast horizon. Residential invest- ment is projected to advance by 11 per cent this year and 5.4 per cent next year, while non-residential investment will experience double-digit gains as several major projects-- including the Red River Floodway expansion and the Wuskwatim hydro project-are under way. The province's industrial sector is thriving. Nominal manufacturing ship- ments grew considerably in the first part of the year in spite of an appreciating currency and weakening economic activity south of the border. The manufacturing outlook is very positive going forward. The new Maple Leaf hog processing plant in Brandon is expected to add a second shift to production this fall. In late May, bus maker New Flyer announced it had firm orders for 1,733 buses and options for 973 more, for a total value of more than US$1.3 billion. Furthermore, Boeing's Dreamliner 787 is breaking records in orders for a newly launched commercial airplane. Boeing Winnipeg took an active part in the engineering of the plane and will manufacture a number of its key com- ponents. Also contributing to the positive outlook in the province is the bounce back in utility output this year due to abundant precipitation filling up hydro reservoirs.
The domestic economy in the province is also very robust. Labour markets continue
Economic Indicators (percentage change)
2006 2007 2008
Real GDP (basic prices) 3.1 3.4 3.6 Consumer Price Index 1.9 2.3 2.0 Personal disposable income 4.6 5.8 4.0 Employment 1.2 1.6 1.5 Unemployment rate (level) 4.3 4.5 4.3 Retail sales 5.8 6.5 6.0 Average weekly wages 1.8 2.7 2.6 Population 0.2 0.6 0.7
Sources: The Conference Board of Canada; Statistics Canada.
to be strong with 9,200 additions to pay- rolls in the first half of 2007. A vigorous economy and provincial fiscal relief will lift retail sales by 6.5 per cent in 2007 and by 6 per cent in 2008.
Although prices for most agricultural goods have improved, the sector will most likely experience a small output contraction this year due to a drop in seeded acreage of grains, oilseeds, and special crops and to wet conditions that could affect crop quality in certain areas.
CONSTRUCTION GROWTH REMAINS STRONG
Construction output is expected to increase by a strong 8.9 per cent in 2007 and 7.2 per cent next year. Fuelled by strong demand for housing, nominal residential investment is projected to increase by 11 per cent this year and 5.4 per cent next year. Boosted by exceptional economic growth and a robust labour market, housing starts will rise to a 20-year high of 5,881 units in 2007 before receding to 5,219 units in 2008-still 1,600 units more than the average of the last 10 years. The resale residential market is also very active and will continue to fuel new housing starts: the sales-to-listing ratio is at 82 per cent on average so far this year and peaked at 90 per cent in May. In addition, while there can be large quarterly variations in migration flows, less people decided to leave the province early this year than in the past few years. The improved net interprovincial migration will also spur housing construction this year.
Nominal non-residential investment will increase by 16.5 per cent this year and by 13 per cent in 2008. Notable non-residential investment projects scheduled for completion
Construction Forges Ahead (current $; percentage change)
Non-residential investment Residential investment
40 30 20 10 0
-1 0 -20
1999 00 01 02 03 04 05 061 07f 08f
f =forecast Sources: The Conference Board of Canada; Statistics Canada.
22 The Conference Board of Canada

in 2009 include the $800 million Red River Floodway expansion and the $572 million in improvements for International Airport. On a larger scale, in August 2006, Manitoba Hydro started construction of the $1.3 billion Wuskwatirn 2Wmegawatt hydre electric generating facility, which should be in service by 2012. In addition, the public sector is also stimulating construction over the forecast period. Improvements of high- ways at a cost of $350 million are under way until mid-2009.
CROP ACREAGE DOWN
In spite of increasing farm product prices, seeded acreage of grains, oilseeds, and special crops has decreased by 10 per cent, according to Statistics Canada's Preliminary Estimates of Principal Field Crop Areas. Also, wet conditions have triggered disease pressure in several crop areas. However, cattle ranchers face improving prospects as progress continues to be made in a number of markets. Overall, agricultural output is forecast to contract by 2.1 per cent in 2007 and to grow by 3 per cent next year.
Earlier this year, the federal government passed a regulation to end the barley mar- keting monopoly of the Canadian Wheat Board (CWB) as of August 1,2007. How- ever, the Winnipeg-based CWB took the government to court to try to reverse the process. On July 3 1, the court sided with the CWB. It said the government had over- stepped its authority, and it ruled that the barley monopoly would remain.
MINING SECTOR GOING STRONG
Thanks to high metal and crude oil prices, mining extraction companies are busy. Metal output will gain 4.1 per cent this year. In 2008, it will expand by 9.2 per cent as the new Crowflight Minerals Inc. nickel mine comes online. Benefiting from extensive oil exploration activities in the province since 2004, mineral fuel output is expected to increase by 8 per cent this year and by 2.8 per cent in 2008. Overall mining output is forecast to increase by 4.8 per cent in 2007 and 7.4 per cent in 2008.
MANUFACTURERS DOING WELL
WhiIe the Canadian dolIar soars and economic activity south of the border weak- ens, the manufacturing sector in Manitoba
is poised to have a good year. As of May, year-to-date nominal manufacturing ship- ments had grown 13 per cent. The increase is, in part, being fuelled by rising prices, but there are indications that volumes are also making good progress. Important gains have occurred for electrical equipment, appliances and components, and for trans- portation equipment products. The last item is consistent with bus maker New Flyer Industries trying to make up for the short- falls from a labour strike last year, as well as large orders being filled by New Flyer and Motor Coach Industries. The outlook is quite bright for manufacturers. Namely, Boeing Winnipeg will manufacture several key components of the new Dreamliner 787, creating jobs for several years to come.
Feeling the effects of changing market conditions, wood products manufacturing has been on a declining trend. There was more bad news for the sector. Tembec recently announced that it will close its Pine Falls paper mill for one week in September and another week in December, decreasing its newspaper production by 6,000 tonnes (3.3 per cent of its annual capacity). Overall, however, manufacturing output should gain 3.6 per cent in 2007 and 4.4 per cent next year.
ROBUST DOMESTIC DEMAND
The domestic economy is benefiting from the robust performance of the industrial sector. New motor vehicles sales are rising, with a 6.9 per cent increase year-to-date as of May. With the economy continuing to progress at a very robust pace, job oppor- tunities will be almost as abundant next year as they were this year. Employment is forecast to grow by 1.6 per cent in 2007 (9,600 new jobs) and by 1.5 per cent in 2008
Gains in Mining (percentage change; 1997 $)
Mineral fuel output . Metal output 50 40 30 20 10 0
-1 0 -20
1999 00 01 02 03 04 05 06 07f 081
f =forecast Sources: The Conference Board of Canada; Statistics Canada.
(8,800 new jobs), leading to an unemploy- ment rate of 4.4 per cent by the end of next year. A vigorous economy, as well as provin- cial personal tax cuts of $97 million in 2007 and $148 million in 2008, will lift retail sales by 6.3 per cent on average over 2007-08. A hot housing market will stimulate the finance, insurance, and real estate industry this year. The sector will advance by 3.3 per cent in 2007 and 2 per cent in 2008.
Industry Outlook (percentage change; 1997 $)
2007f . 20081 10 8 6 4 2 0
-2 -4 '
Agriculture Community, Construction Finance, Manufacturing Utilities Wholesale business and insurance and retall trade
personal services and real estate
f = forecast Sources: The Conference Board of Canada; Statistics Canada.
The Conference Board of Canada


New and existing housing markets are boom- ing as more people relocate to the province. Inflation pressures are mounting in the province due to rising prices for new homes.
Real GDP
Retail Sales
,--.. -\:\, , , I Growth Ranking #5
Ranking , 5.2
,w*,i #7
Hot Domestic Demand
by Nancy Bergeron
After a very weak performance by the primary sector in 2006, Saskatchewan's economy is now experiencing a broad-based boom. Real gross domestic product (GDP) growth of 4.4 per cent is projected for 2007, and a still strong 3.2 per cent gain is fore- cast for 2008. The outlook for the agricul- ture sector will improve as seeded acreage of grains, oilseeds, and special crops increased by 7 per cent. As of early August, crop yields in certain areas of the province were affected by a lack of precipitation. However, harvest operations are just getting under way. A bounce back in potash production will drive solid growth in the mining sector this year, and the potash industry will con- tinue to stimulate economic growth through- out the medium term. Given the optimistic potash demand outlook, Potash Corp. has announced a $900 million capacity expan- sion at its Cory facility.
Potash Corp. announced a $900 million capacity expansion at its Cory facility.
With the domestic economy firing on all cylinders in Saskatchewan, the unemploy- ment rate is averaging a low 4.1 per cent so far this year. In addition, a changing trend of positive net interprovincial migration in the last quarter of 2006 and the first quarter of this year is fuelling robust demand for new and existing homes. (See Chart 1.)
Economic Indicators (percentage change)
2006 2007 2008
Real GDP (basic prices) 1 .O 4.4 3.2 Consumer Price Index 2.0 2.7 2.2 Personal disposable income 4.1 5.2 3.8 Employment 1.7 2.4 1 .O Unemployment rate (level) 4.7 4.1 4.0 Retail sales 5.9 6.3 5.2 Average weekly wages 3.7 4.6 2.8 Population -0.5 0.4 0.2
Sources: The Conference Board of Canada; Statistics Canada.
Housing starts shot up to an average of over 6,000 units at annual rates in the first half of the year, a 70.6 per cent increase compared with the same period last year. The resale residential market is just as hot: the sales-to-listing ratio is averaging 90 per cent so far this year, the highest of all provinces. New motor vehicles sales are also on the rise, especially for trucks, with a 25 per cent increase year-to-date as of May. Consequently, wholesale and retail trade output is expected to grow by a robust 8 per cent this year. The favourable migration pattern will likely persist in the next few quarters, further stimulating con- sumer demand.
On the downside, despite a very active economy, nominal manufacturing shipments are slightly lower so far this year, mostly due to major setbacks in the wood product and paper manufacturing industries. Price pressures are mounting in Saskatchewan due to the sizable increase in the price of new homes. As the housing frenzy continues, the inflation rate as measured by the Consumer Price Index will continue to experience upward pressure in the short term.
REBOUND IN AGRICULTURE
The outlook for the agriculture sector should rebound as seeded acreage of grains, oilseeds, and special crops increased by 7 per cent. Cattle export markets continue to re-open, and the number of cattle heads exported is growing in Canada, boding well for Saskatchewan producers. Overall, we expect 7.8 per cent growth in agriculture output this year and 2.2 per cent in 2008.
Earlier this year, the federal government passed a regulation to end the Canadian Wheat Board's barley monopoly as of
Robust Housing Starts (percentage change)
Saskatchewan Canada 40 30 20 10 0
-1 0 -20 -30
1999 00 01 02 03 04 05 06 07f 08f
f =forecast Sources: The Conference Board of Canada; CMHC Housing Time Series Database.
1
The Conference Board of Canada 25

August 1,2007. However, the Wheat Board took the government to court to try to reverse the process. On July 31, the court sided with the Wheat Board. It ruled that the govern- ment had overstepped its authority, and it said the monopoly would stay in place.
MINING BOUNCES BACK
Potash production is bouncing back. In April, Canada saw a 36 per cent year-to-date increase in potash mining, a large propor- tion of which occurs in Saskatchewan. Uranium production is also going well. Fuelled by a 27.6 per cent jump in non- metal output, overall mining is forecast to rise by 6 per cent in 2007 and by 4.5 per cent in 2008. On the downside, recent price declines in uranium markets and news that the Cigar Lake mine will not be productive before 201 1 raises uncertainty about future production. Cameco, which owns 50 per cent of the mine, announced that several risk factors render the Cigar Lake deposit a challenge to develop and could lead to further delays or even an interruption in planned uranium production.
In the energy sector, drilling activity will remain relatively flat with around 3,810 new wells drilled in 2007, according to the latest estimates of the Petroleum Services Association of Canada. Mineral fuel mining will show modest growth-1.4 per cent on average over the next two years.
HIGH LOONIE HURTS WOOD AND PAPER MANUFACTURERS
With higher potash extraction, nominal manufacturing shipments for non-metallic mineral products increased by 20 per cent in the first five months of this year compared with the same period last year. For machinery products, shipments were up 30 per cent. Nonetheless, year-to-date total nominal manufacturing shipments as of May were down 3 per cent, mostly due to major set- backs in wood products and in paper man- ufacturing. The high loonie and the slump in residential construction south of the border are hurting wood product manufac- turers. Overall, manufacturing output will more or less stagnate this year but will recover in 2008 with growth of 4.2 per cent.
CONSTRUCTION TO BENEFIT FROM MEGA PROJECTS
Construction output is forecast to increase by 4.6 per cent in 2007 and by 4.3 per cent next year as domestic demand stimulates residential investment and non-residential investment benefits from large new projects. Nominal residential investment is expected to grow by 21.9 per cent this year, and to decrease by 1.8 per cent in 2008. (See Chart 2.)
Migration patterns will continue to favour the province over the next few quarters.
Husky Energy is investing $90 million in engineering planning this year toward the Lloydminster heavy oil upgrader expansion (estimated at $2.3 billion). There is no def- inite start date, but construction activities on this project could begin next year. Potash Corp. has also announced a $900 million expansion at its Cory facility, which will add 1.2 million tonnes of annual produc- tion capacity by mid-2010. In total, nom- inal public and private investment in non-residential construction is forecast to increase by 4.8 per cent in 2007 and by 11.5 per cent next year.
DOMESTIC DEMAND BOOMING
Benefiting from strong job creation in the latter half of 2006 and early this year, and also from changing migration patterns, the domestic economy in Saskatchewan is booming. Housing starts are forecast to aver- age 5,135 units in 2007-a 38.2 per cent increase over 2006. While migration patterns
Construction Booming (percentage change; current $)
Residential investment
rn Non-residential investment 30 20 10 0
-1 0 1999 00 01 02 03 04 05 06 07f 081
f =forecast Sources: The Conference Board of Canada; Statistics Canada.
will continue to favour Saskatchewan in the next few quarters, net interprovincial migration will gently retreat going into 2008. Housing starts will fall back to an average of 4,037 units in 2008, but that is still 1,000 units higher than the average of the last 10 years. Retail sales will also rise strongly, with gains of 6.3 per cent fore- cast for 2007 and 5.2 per cent for 2008.
Industry Outlook (percentage change; 1997 $)
20071 2008f 8 6 4 2 0
Agriculture Community, Construction Finance, Manufacturing Mining Wholesale and bus~ness and insurance retail trade
personal and real services estate
f =forecast Sources: The Conference Board of Canada; Statistics Canada.
The Conference Board of Canada


Drilling in the province will be down over 18 per cent this year. 85,000 new jobs are expected to be created in the province in 2007, keeping the unem- ployment rate the lowest in the country.
Real GDP
jm Growih Ranking *< ., ~~, .'.L;>~~(., ,, , 4 3.9 #3
- .. Growih Ranking
:i'?+.+ 4.7 R1
Growth Ranking
t%:i 'I;,<,,$, 8.3 12
Ranking 6.8 #I
Oil Sands Development Bears Fruit: Oil Production Jumps in 2008
by Todd A. Crawford
Alberta's economy is still running at a very robust pace-however, this year will see a more sustainable level of real gross domestic product (GDP) growth of 3.9 per cent. Less income stimulus and difficulties in the drilling sector will temper economic activity. An early spring thaw forced drilling rigs to shut down earlier than usual. The Petroleum Services Association of Canada (PSAC) is projecting a decrease of nearly 20 per cent in the number of wells drilled in Alberta this year, but drilling difficulties should be contained to 2007 as natural gas prices have rebounded and are expected to remain strong into 2008. Thanks to signifi- cant increases in non-conventional crude oil production, overall real GDP is forecast to expand by a solid 4.7 per cent in 2008.
Despite the robust economic outlook, the total number of people relocating to the province (on a net basis) is subsiding as steep housing costs and improved economic pros- pects in neighbouring provinces influence interprovincial migration. The province is fore- cast to attract (on a net basis) 29,000 people, down from a high of 63,000 last year. While the economy will continue to prosper over the coming years, more sustainable income gains and softer net inter-provincial migra- tion will lead to more moderate growth in consumer demand. Following three
Economic Indicators (percentage change)
2006 2007 2008
Real GDP (basic prices) 6.6 3.9 4.7 Consumer Price Index 3.9 4.9 3.5 Personal disposable income 12.4 9.8 5.2 Employment 4.8 4.5 2.4 Unemployment rate (level) 3.4 3.6 3.5 Retail sales 16.0 8.3 6.8 Average weekly wages 5.0 4.6 3.1 Population 3.0 2.8 1.9
Sources: The Conference Board of Canada; Statistics Canada.
consecutive years of double-digit growth, retail sales gains in the province will decelerate to 8.3 per cent in 2007.
INDUSTRIAL OUTLOOK
Natural gas production is forecast to decline by 2 per cent this year due to a major contraction in drilling activity. The Petroleum Services Association of Canada is projecting more than 18 per cent decline in the number of wells drilled this year, particularly on the natural gas side. Crude oil production will, however, increase by around 6 per cent due to intensifying non-conventional oil extraction. Overall mineral fuel output will advance by 2.6 per cent in 2007 and jump by 6.9 per cent in 2008.
Construction output will be hampered this year by the lacklustre drilling activity of this past winter. Warm weather and weak natural gas prices last year forced companies to slash drilling budgets and operations. Continuous investment in the oil sands will however keep energy invest- ment robust. Major projects are scheduled to begin in 2007, including the $4 billion expansion of the Muskeg River mine and the first phase of Husky Energy's Sunrise SAGD $2.4 billion project.
Investment in pipelines is increasingly important as it becomes necessary to deliver crude extracted from the oil sands to mar- kets across the United States and overseas. Between 2007 and 2008, more than $3 bil- lion will be spent on different pipeline projects within Alberta. Chief among these are the proposed Enbridge pipeline and the Kinder Morgan pipeline expansion projects. After expanding by 26 per cent in 2006, investment spending in energy projects will take a breather this year. Investment will
High Commodity Prices (WI , US$ per barrel; Henry Hub, US$ mmbtu)
- Price (WTI) US$ "' Hen Hub US$ (left axis) (righraxis)
P 40 .. .... ....+.... ..--.. 10 20 ... '.' ...... . 5 0 0
%' q!,!, c$ U> $? $? ?? % ? + Q Q Q O Q Q Q Q Q
f = forecast Sources: The Conference Board of Canada; U.S. Energy Information Administration.
28 The Conference Board of Canada

remain flat primarily due to the setback in drilling. Energy investment is forecast to rebound by 11 per cent in 2008. There is a downside risk to the energy outlook; soaring construction costs in the province could jeopardize or delay major capital projects. The cost of materials in the province is forecast to accelerate by 10 per cent this year while the cost of labour will grow by 4.3 per cent1.
New office/commercial developments in conjunction with a still active residential housing market will offset weakness in energy investment. Total construction out- put is forecast to grow moderately this year, expanding by 2.1 per cent. With an expected rebound in drilling, construction output will expand by 2.8 per cent in 2008.
Manufacturing will continue to make strong gains. Demand for petroleum and coal products, chemicals, fabricated metals, and transportation equipment used in the construction of oil sands projects is stimu- lating growth. With the high number of people moving to the province needing . .
homes and home furniihings, furniture man- ufacturers should remain busy. Real manu- facturing output will expand by 5.8 per cent this year and 5.5 per cent in 2008.
RESIDENTIAL INVESTMENTTO EASE
The residential construction market has likely peaked. Housing starts are forecast to gently retreat-from 48,950 units in 2006 to 46,000 units this year and 39,000 units in 2008. Strong disposable income gains and robust net inter-provincial migration will maintain housing starts at still elevated levels. Fuelled by vigorous renovation activities, overall residential investment is expected to grow 10 per cent this year but will contract by 3.4 per cent in 2008.
DOMESTIC DEMAND
Job creation in Alberta has been extremely strong in the past 18 months, and the Conference Board expects this trend to continue with total employment forecast to expand by 4.5 per cent in 2007 as 85,000 new jobs are created. In 2008, job gains will moderate somewhat as employment will increase by 2.4 per cent or 47,000 more jobs. Job gains will be particularly strong in the manufacturing, construction, and other
primary industries, keeping the provincial unemployment rate low at 3.6 on average in 200748.
Labour in the province continues to be in short supply, fuelling solid gains in wages. With positive labour markets and solid wage increases, personal disposable income is forecast to expand by 9.8 per cent in 2007 and by 5.2 per cent in 2008. However, after three consecutive years of double-digit increases in retail sales, consumer demand is losing speed. Nevertheless, retailers can still expect an 8.3 per cent hike in sales in 2007 and 6.8 per cent gain in 2008.
FISCAL SITUATION
Alberta's budgetary fiscal situation remains enviable. The government's 2007-08 budget showed a healthy fiscal situation and included plans to increase spending in a number of areas. Rapid pop- ulation growth has made it difficult for the province to provide and maintain services and infrastructure sufficient to meet people's needs. Large investment projects will help to . .
alleviate some of these pressing social con- cerns. The health and education sectors will receive $5.9 billion in fiscal year 2007-08, while the provincial highway network will receive $4.6 billion this year. Another $3.5 billion is budgeted to go toward proj- ects such as community facilities, housing, and waterfwastewater infrastructure.
In addition to the capital expenditures in the budget, the government has also scheduled several spending initiatives. Education spending is budgeted to increase 5.5 per cent this year. Health care spending will increase to $10.8 billion. All in all, expenses are projected to grow by 10 per
Manufacturing to Remain a Comerstone of Growth (percentage change; 1997 $)
20 15 10 5 0
-5 2000 01 02 03 04 05 06 07f 08f
f = forecast Sources: The Conference Board of Canada; Statistics Canada.
cent, while revenues in the province should fall by 4.7 per cent this fiscal year. Never- theless the province should still record a hefty $2.2 billion surplus.
I The Conference Board of Canada. Canada's Oil Extraction Industry: Industrial Outlook, Summer 2007 (Ottawa: CBoC, 2007).
Industry Outlook (percentage change; 1997 $)
2007f 20081 10 8 6 4 2 0
Mineral fuel mining Manufacturing Construction Wholesale and Community, retail trade business, and
personal servlces
f =forecast Sources: The Conference Board of Canada; Statistics Canada.
The Conference Board of Canada 29

30 The Conference Board of Canada

I due to the weakness in manufacturing activity. I
Real GDP
p@& Growth Ranking , 2.7 $5
wzj Growth Ranking 3.3 $4
Retail Sales
GrMh Ranking tCp 5.9 $6
GrMHth Ranking gw: , 5.9 $3
Domestic activity is doing well as it benefits from stellar job creation early in 2007 and provincial fiscal relief.
The real gross domestic product (GDP) growth forecast for British Columbia in 2007 has been revised down since the Board's spring Provincial Outlook-from 3.1 per cent to 2.7 per cent. The revision is due to the weakness in manufacturing activity; in particular, for the wood products industry where nominal shipments from January to May 2007 are down nearly 20 per cent in comparison with the same period last year. The forestry sector continues to be chal- lenged from both the supply and demand sides. Major restructuring and consolida- tion in the forestry industry will constrain growth this year. In addition, weak housing markets in Canada and, even more impor- tantly, in the United States will further depress growth in the forestry sector. However, the situation will improve. With restructuring in the industry expected to be completed soon, an increase in efforts to salvage lumber damaged by the mountain pine beetle already under way, and a turnaround expected in U.S. home construction, the forestry industry is forecast to rebound in 2008. Construc- tion activity in the province will take a breather this year as a number of projects wind down. However, with many large infrastructure and mining projects starting up, construction activity will surge ahead in 2008. A revival in the industrial and forestry sector will lift overall real GDP growth to 3.3 per cent in 2008.
by Marie-Christine Bernard, Sabrina Browarski, Todd A. Crawford
Economic Indicators (percentage change)
2006 2007 2008
Real GDP (basic prices) 3.7 2.7 3.3 Consumer Price Index 1.8 1.9 1.9 Personal disposable income 7.8 5.9 4.4 Employment 3.1 3.2 1.3 Unemployment rate (level) 4.8 4.1 3.9 Retail sales 6.2 5.9 5.1 Average weekly wages 3.2 3.4 3.0 Population 1.3 1.2 1 .O
Sources: The Conference Board of Canada; Statistics Canada.
The service sector is once again expected to set the pace in 2007. The domestic side of the economy will perform well over the short term. Solid employment growth early in the year, combined with provincial income tax cuts, will bolster retail sales by an aver- age of close to 6 per cent annually over the next two years. The provincial government will also contribute to economic growth. Last year, the province realized a $4.1 bil- lion surplus, of which $1 billion was used to pay down debt and $3.4 billion went to public capital infrastructure developments.
With the province dealing with two major labour strikes, there is downside risk to the British Columbia outlook. Around 4,000 to 5,000 Vancouver civic workers and 6,500 coastal forestry loggers and sawmill workers are affected. Logging operations in the interior forest industry, however, continue to function as usual.
MIMING OUTPUT TO SURGE
Last year, mining in British Columbia was hampered by a reduction in mineral fuels output, primarily coal. This year, mineral fuel mining will get a boost as production ramps up at the Wolverine coal mine, which began production in mid-2006, and from Peace River Coal, which received permission to increase production at its Trend coal mine to 1.6 million plant-feed tons per year. The sector will also benefit from the development of the Brule mine which came online early this year replacing production from the depleted Dillon coal mine. All in all, mineral fuels output is expected to expand by an average of 6.4 per cent over the next two years.
Goods Sector to Rebound (percentage change; 1997 $)
Goods sector Service sector
8 6 4 2 0
-2 -4
1999 00 01 02 03 04 05 06 071 081
f =forecast Sources: The Conference Board of Canada; Statistics Canada.
The Conference Board of Canada 31

Metal mining output will get a boost this year and next from the molybdenum mine being constructed by Roca Mines, and by Cross Lake's re-start of the QR gold mine. Overall, metal mining is expected to expand 5.6 per cent in 2007 and another 4.3 per cent in 2008. After accelerating by 20 per cent last year, non-metal mining will con- tinue to grow at a quick pace advancing by 10.3 per cent this year and by 5.9 per cent next year, thanks to Ascot Resources' Swamp Point sand and gravel mine which began production earlier this year.
Weak natural gas prices in the latter half of 2006 have led to weaker drilling expec- tations for 2007. The Petroleum Services Association of Canada is forecasting a 43 per cent decrease in total wells drilled in the province. This weakness in drilling will hold back growth in total mining, which is forecast to expand this year by 2.6 per cent. Next year, with a rebound in drilling expected, total mining output is forecast to grow by 5.7 per cent.
FORESTRY SECTOR
Major restructuring in the forestry indus- try and weakness in pulp and paper will constrain growth in the forestry sector this year. Companies are facing problems due to weak paper prices and rising fibre and maintenance costs. The Random Lengths Framing Lumber Composite Price averaged $290 in the first six months of 2007, notably lower than the $327 average in 2006.
Weaker housing markets in both Canada and the U.S. will also serve to depress growth in the forestry sector. Recent statistics indi- cate that first-quarter production of lumber in the province has declined by 9.1 per cent on a year-over-year basis. Restructuring, the high Canadian dollar, high energy costs, the softwood lumber export tax, and weak housing markets will cause the forestry sector to contract by 3.2 per cent this year.
The ongoing problems created by the mountain pine beetle infestation are destroy- ing provincial lumber stocks. The provincial Ministry of Forests and logging companies have responded to the infestation by clear- cutting large portions of forests and by making investments in the development of new uses and new markets for infected wood. With restructuring expected to be complete, and with increased harvesting
(due to the pine beetle), forestry output should rise by 3 per cent in 2008.
INVESTMENT SOFTENS
A number of public and private construc- tion projects led to growth of 15 per cent in non-residential construction last year. With fewer large-scale projects on the docket this year, growth will decelerate, yet remain very strong at an expected 8.9 per cent. Next year, thanks to projects such as the Port Mann Bridge expansion, the Lodgepole coal mine, and the Kicking Horse Canyon transportation project, non-residential investment will remain strong, expanding by 4.8 per cent. With housing starts in the province expected to remain flat this year and then fall by 2,800 units (to 33,832 units) in 2008, residential investment in the province will begin to slow.
LABOUR MARKETS, INCOMES SIZZLE
Labour markets in British Columbia continue to defy expectations as the employment rate hovers near an all-time high. Employment gains of 3.2 per cent will once again outpace the national aver- age of 1.3 per cent in 2007. Good news abounds, as employment gains are forecast to exceed labour force growth in the near term. This means that although the unem- ployment rate will rise to 4.1 per cent in 2007, it will return to its March 2007 record low of 3.9 per cent by 2008.
The strength of British Columbia's labour markets translates directly into improved income prospects in the near-term. A mas- sive 10 per cent personal income tax cut for those earning up to $100,000 helped British
Forestry Sector in the Doldrums (percentage change; 1997 $)
20 15
-1 0 1999 00 01 02 03 04 05 06 07f 08f
f = forecast Sources: The Conference Board of Canada; Statistics Canada.
Columbia supplant Alberta as Canada's lowest-taxed jurisdiction for this income bracket. The generous fiscal relief will enable personal disposable income growth to soar by 5.9 per cent and 4.4 per cent in 2007 and 2008 respectively. Retail sales will surpass the national average substan- tially in the near-term.
Industry Outlook (percentage change; 1997 $)
2007f 2008f 6 4 2 0
-2 -4
Mining Forestry Manufacturing Construction Public Finance, Wholesale administration insurance and and retall and defence real estate trade
f =forecast Sources: The Conference Board of Canada; Statistics Canada.
The Conference Board of Canada

33 The Conference Board of Canada

34 The Conference Board of Canada


The Conference Board of Canada
255 Smyth Road
Ottawa ON K1H 8M7 Canada
TeeL 1-866-71 1-2262
Fax 613-526-4857
www.conferenceboard.ca
The Conference Board, Inc.
845 Third Avenue, New York NY
10022-6679 USA
Tel. 21 2-759-0900
Fa 21 2-980-701 4
www.conference-board.org
The Conference Board Europe
Chausshe de La Hulpe 130, Box 11
B-1000 Brussels, Belgium
Tel. t32 2 675 54 05
Fax t32 2 675 03 95
The Conference Board Asia-Pacific
2802 Admiralty Centre, Tower 1
18 Harcourt Road, Admiralty
Hong Kong SAR
Tel. t852 251 1 1630
Fax t852 2869 1403


![[Ramaprasad Bhar] Stochastic Filtering With Applic(Bookos.org)](https://img.dokumen.tips/doc/110x75/577cca1c1a28aba711a564dd/ramaprasad-bhar-stochastic-filtering-with-applicbookosorg.jpg)