Embed Size (px)
Citation preview

Newcastle West Drainage Study
Final Report Volume 1 of 2: Report
Revision 3 March 2017

i
Newcastle West Drainage Study
Final Report
REVISION / REVIEW HISTORY
Revision # Description Prepared by Reviewed by
1 Draft report D. Tetley & P. Gillam C. Ryan
2 Draft report including Council comments D. Tetley & P. Gillam C. Ryan
3 Final report D. Tetley C. Ryan
DISTRIBUTION
Revision # Distribution List Date Issued Number of Copies
1 The City of Newcastle 18/01/2017 PDF
2 The City of Newcastle 7/02/2017 PDF
3 The City of Newcastle 18/03/2017 PDF +
Catchment Simulation Solutions
Suite 2.01, Level 2 210 George Street Sydney, NSW, 2000
(02) 8355 5500 [email protected]
(02) 8355 5505 www.csse.com.au
File Reference: newcastle west drainage study - draft report (rev 3) - volume 1.docx
The information within this document is and shall remain the property of Catchment Simulation Solutions.

ii
TABLE OF CONTENTS
1 INTRODUCTION .......................................................................................................... 1
2 THE EXISTING DRAINAGE PROBLEM .................................................................. 2
2.1 Catchment Description ...................................................................................... 2
2.2 History of Flooding ............................................................................................. 2
2.3 Defining the Existing Drainage Problem......................................................... 5
2.3.1 Overview ....................................................................................................... 5
2.3.2 Hydraulic Model Development .................................................................. 5
2.3.3 Hydraulic Model Verification ...................................................................... 6
2.3.4 Design Flood Simulations .......................................................................... 7
2.3.5 Sensitivity Analysis .................................................................................... 14
2.3.6 Climate Change Analysis ......................................................................... 21
2.4 Summary ........................................................................................................... 25
3 OPTIONS FOR MANAGING THE EXISTING DRAINAGE PROBLEMS .......... 27
3.1 General .............................................................................................................. 27
3.2 Options Considered ......................................................................................... 27
3.3 Assessment of Options ................................................................................... 28
3.3.1 Option A - Stormwater upgrades and Regrading in King Street ........ 29
3.3.2 Option B - Stormwater upgrades and Regrading in National Park,
Hunter and Bellevue Streets .................................................................... 32
3.3.3 Option C - Regrading from King Street north along Steel Street
towards Newcastle Harbour ..................................................................... 34
3.3.4 Option D - New Culvert from Cottage Creek running north along Steel
Street to Newcastle Harbour.................................................................... 37
3.3.5 Option E - Widen Cottage Creek channel between King St and
Newcastle Harbour .................................................................................... 40
3.4 Miscellaneous Options .................................................................................... 45
3.5 Recommendations ........................................................................................... 45
4 CONCLUSION ............................................................................................................ 47
5 REFERENCES ........................................................................................................... 48
iii
LIST OF APPENICIES
APPENDIX A Blockage Calculations
APPENDIX B 2007 Flood Simulation Results
APPENDIX C Options Workshop
APPENDIX D Concept Design Plans
APPENDIX E Cost Estimates
LIST OF TABLES
Table 1 Hydraulic Behaviour Thresholds (City of Newcastle, 2012) .................................... 10
Table 2 Risk to Life Categories (City of Newcastle, 2012) ................................................... 11
Table 3 Property Hazard Categories (City of Newcastle, 2012) ........................................... 12
Table 4 Qualitative and Quantitative Criteria for Hydraulic Categories ................................ 13
Table 5 Options Considered for Managing the Drainage Problem ....................................... 27
Table 6 Options Adopted for Detailed Investigations ........................................................... 28
Table 7 Option A Design Overview ..................................................................................... 30
Table 8 Option B Design Overview ..................................................................................... 33
Table 9 Option C Design Overview ..................................................................................... 35
Table 10 Option D Design Overview ..................................................................................... 38
Table 11 Option E Design Overview ..................................................................................... 41
LIST OF PLATES
Plate 1 View looking south from Hunter Street showing flooding in Steele Street in 1905 (Newcastle and Hunter District Historical Society Archives) ..................................... 3
Plate 2 View looking north from King Street showing flooding in Steele Street in the 1920s (Hunter Regional Committee of the National Trust) .................................................. 3
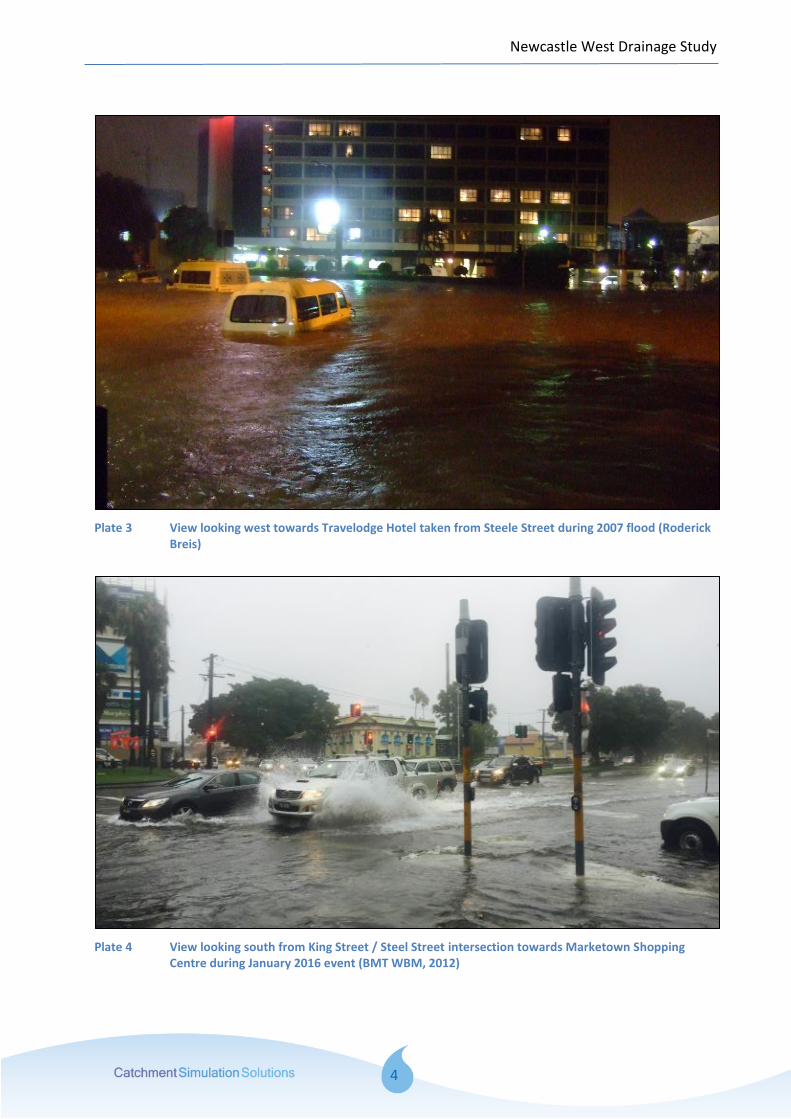
Plate 3 View looking west towards Travelodge Hotel taken from Steele Street during 2007 flood (Roderick Breis) ............................................................................................... 4
Plate 4 View looking south from King Street / Steel Street intersection towards Marketown Shopping Centre during January 2016 event (BMT WBM, 2012) ............................. 4
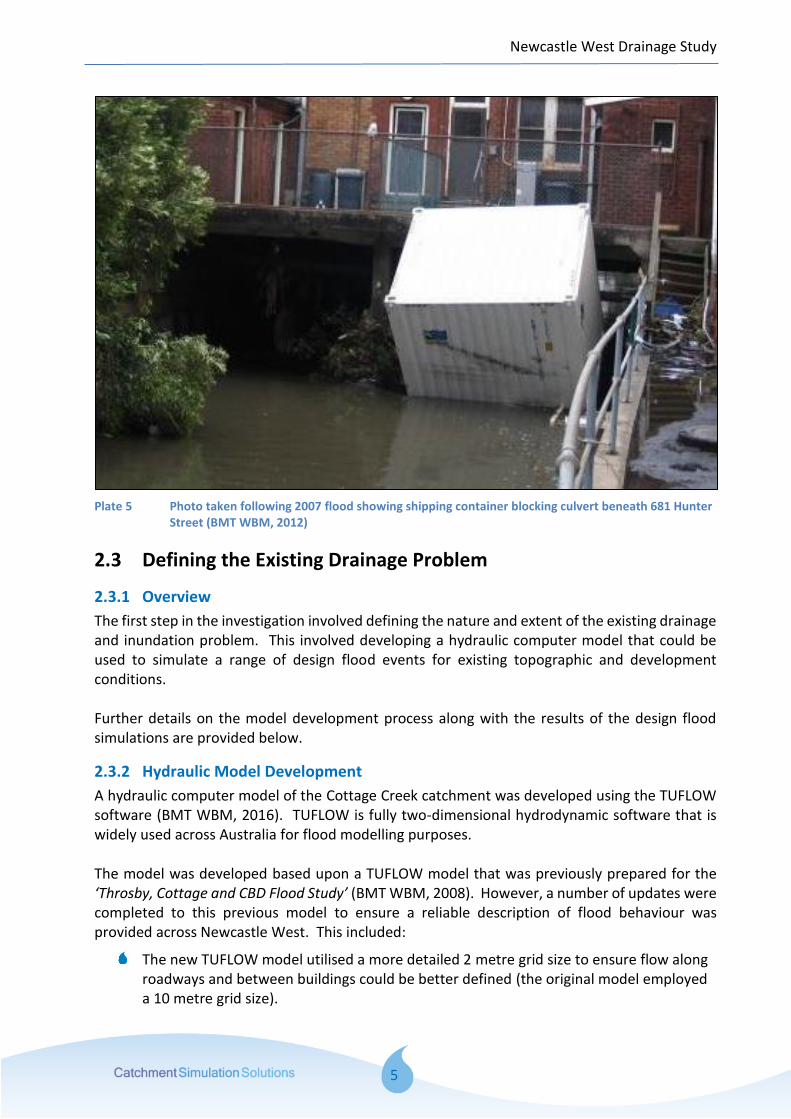
Plate 5 Photo taken following 2007 flood showing shipping container blocking culvert beneath 681 Hunter Street (BMT WBM, 2012) ......................................................... 5
Plate 6 Adopted Newcastle Harbour Water Level for Design Flood Simulation .................... 8
Plate 7 1% AEP flood level difference map for 0.0 mAHD harbour level simulation ............ 15

iv
Plate 8 1% AEP flood level difference map for 1.4 mAHD harbour level simulation ............ 16
Plate 9 1% AEP flood level difference map with no blockage ............................................. 17
Plate 10 1% AEP flood level difference map with complete blockage ................................... 17
Plate 11 1% AEP flood level difference map after filling of all potentially developable land .. 19
Plate 12 1% AEP flood level difference map with 10% increase in rainfall intensity .............. 21
Plate 13 1% AEP flood level difference map with 20% increase in rainfall intensity .............. 22
Plate 14 1% AEP flood level difference map with 30% increase in rainfall intensity .............. 22
Plate 15 1% AEP flood level difference map with 2050 sea level increase ........................... 24
Plate 16 1% AEP flood level difference map with 2100 sea level increase ........................... 24
Plate 17 1% AEP flood level difference map with 30% increase in rainfall and 2100 sea level increase ................................................................................................................. 25
Plate 18 Proposed alignment of new culvert along Steel Street looking south from Newcastle Harbour .................................................................................................................. 37
Plate 11 1% AEP flood level difference map for Option E1 ................................................... 43
Plate 11 1% AEP flood level difference map for Option E2 ................................................... 43
1
1 INTRODUCTION Newcastle West is an inner-city suburb of Newcastle and forms part of Newcastle’s Central Business District. The extent of the Newcastle West area is shown in Figure 1 and primarily contains commercial properties including the Marketown shopping centre. Several major transportation links also bisect the study area including King Street and Hunter Street. The Newcastle light rail, which is currently under construction, will also extend through the study area. Newcastle West has a history of flooding and drainage problems with reports of significant inundation extending back to the early twentieth century. The 2007 (i.e., “Pasha Bulker”) storm, in particular, resulted in extensive inundation depths across Newcastle West and damaged numerous cars and properties. In recognition of the inundation problems facing Newcastle West, the City of Newcastle resolved to prepare a drainage study for Newcastle West. The aims of the study were to better understand flooding and drainage behaviour and look at opportunities to improve the performance of the drainage and overland flow system. Council also recognised that the area is currently undergoing redevelopment and there may be opportunities to integrate the drainage improvements in a way that complements the ongoing redevelopment of the area. This report forms the drainage study for Newcastle West. It outlines the nature and extent of the existing drainage problem and evaluates potential options for reducing the frequency and severity of inundation across Newcastle West. The drainage study comprises two volumes, i.e.:
Volume 1 (this document): contains the report text and appendices
Volume 2: contains all figures/maps

2
2 THE EXISTING DRAINAGE PROBLEM
2.1 Catchment Description
Newcastle West falls within the Cottage Creek catchment. The Cottage Creek catchment upstream of Newcastle West covers an area of approximately 0.6 km2 and is highly urbanised. Rainfall falling across the upper catchment areas is conveyed via a network of kerbs/gutters and stormwater pipes into one of several concrete-lined open channels. The open channels carry runoff through National Park, past the Marketown Shopping Centre and beneath King Street, Hunter Street, the former rainfall line and Honeysuckle Drive before discharging into Newcastle Harbour. Figure 2 provides a Digital Elevation Model (DEM) of Newcastle West and the immediate surrounds. The DEM was developed based upon detailed LiDAR information that was collected in 2014. Figure 2 shows that some sections of Newcastle West and National Park are located below 2 mAHD. Most notably, Steele Street (near the King Street intersection) is located at 1.8mAHD. Figure 2 also shows that the surrounding roadways are elevated above King Street. This includes Hunter Street which is typically elevated above 2.5 mAHD. This effectively forms a topographic “bowl”. Accordingly, during rainfall events, water drains to these low points and can only drain out via the stormwater system. During events that exceed the capacity of the stormwater system, the excess runoff fills these topographic low points, inundating adjoining properties and infrastructure.
2.2 History of Flooding
Newcastle West has experienced a number of floods since settlement of the area. Records indicate flooding has been experienced as far back as the early twentieth century particularly in the vicinity of Steel Street (refer Plate 1 and Plate 2). More recently, inundation across the area has been experienced in 1988, 1990, 2007 and 2016 (refer Plate 3 and Plate 4). The 2007 event, in particular caused widespread damage across Newcastle West and the broader Newcastle area. The 2007 event is considered to be roughly equivalent to a 1% AEP flood (BMT WBM 2012). However, flooding across Newcastle West during this event was exacerbated due to blockage of bridges, culverts and stormwater infrastructure (refer Plate 5). Investigations completed as part of the ‘Newcastle City-wide Floodplain Risk Management Study and Plan’ (BMT WBM 2012) noted that blockage has the potential to increase 1% AEP flood levels by well over 0.5 metres at some locations. Fortunately, loss of life has been limited although there were reports of many people being in life threatening situations during the 2007 event (BMT WBM, 2012). Most notably, many people were trapped in their cars as the 2007 event coincided with Friday afternoon “peak hour” traffic. The available historic information confirms the susceptibility of the area to inundation, particularly the area around King and Steel Streets.

Newcastle West Drainage Study
3
Plate 1 View looking south from Hunter Street showing flooding in Steele Street in 1905 (Newcastle and Hunter District Historical Society Archives)
Plate 2 View looking north from King Street showing flooding in Steele Street in the 1920s (Hunter Regional Committee of the National Trust)
Newcastle West Drainage Study
4
Plate 3 View looking west towards Travelodge Hotel taken from Steele Street during 2007 flood (Roderick Breis)
Plate 4 View looking south from King Street / Steel Street intersection towards Marketown Shopping Centre during January 2016 event (BMT WBM, 2012)
Newcastle West Drainage Study
5
Plate 5 Photo taken following 2007 flood showing shipping container blocking culvert beneath 681 Hunter Street (BMT WBM, 2012)
2.3 Defining the Existing Drainage Problem
2.3.1 Overview
The first step in the investigation involved defining the nature and extent of the existing drainage and inundation problem. This involved developing a hydraulic computer model that could be used to simulate a range of design flood events for existing topographic and development conditions. Further details on the model development process along with the results of the design flood simulations are provided below.
2.3.2 Hydraulic Model Development
A hydraulic computer model of the Cottage Creek catchment was developed using the TUFLOW software (BMT WBM, 2016). TUFLOW is fully two-dimensional hydrodynamic software that is widely used across Australia for flood modelling purposes. The model was developed based upon a TUFLOW model that was previously prepared for the ‘Throsby, Cottage and CBD Flood Study’ (BMT WBM, 2008). However, a number of updates were completed to this previous model to ensure a reliable description of flood behaviour was provided across Newcastle West. This included:
The new TUFLOW model utilised a more detailed 2 metre grid size to ensure flow along roadways and between buildings could be better defined (the original model employed a 10 metre grid size).
Newcastle West Drainage Study
6
The model domain was reduced to only cover the lower sections of the Cottage Creek catchment (the extent of the model is shown in Figure 3).
The variation in ground surface elevations across the new model was defined based upon more recent 2011 LiDAR information (refer Figure 2).
The spatial variation in Manning’s “n” roughness values was defined based upon a detailed remote sensing analysis that took advantage of the 2011 LiDAR and 2014 aerial imagery. The outputs from the remote sensing land use analysis is shown in Figure 3.
All buildings were represented in the model as complete flow obstructions (i.e., water was assumed not to enter any of the buildings).
The new model incorporated a full description of the stormwater drainage system (the previous model only included major trunk drainage infrastructure). The stormwater system was defined based on Council’s stormwater pit/pipe asset layer. However, it was noted that this dataset was not complete (e.g., missing pipes) and did not include attributes for all pits and pipe (eg., pit depths, pipe sizes). Therefore, some assumptions where necessary to ensure a reasonable representation of the stormwater system was included in the model. The extent of the stormwater network included in the model is shown in Figure 3.
Blockage calculations were completed for all bridges and culverts contained within the model area based upon ‘Blockage of Hydraulic Structures’ (Engineers Australia, 2015) (the previous model assumed no blockage of hydraulic structures). The location of bridges and culverts is shown in Figure 3 and the blockage calculations are summarised in Appendix A. In general, blockage factors of less than 10% were adopted for most structures. A 50% blockage factor was applied to “sag” stormwater inlets and a 20% blockage factor was applied to “on grade” stormwater pits.
The 1-dimensional representation of the various open channels was refined. This included adding an additional open channel between National Park Street and the main Cottage Creek channel within National Park. The extent of the 1-dimensional channels included in the TUFLOW model is shown in Figure 3.
2.3.3 Hydraulic Model Verification
To ensure the new hydraulic model was providing a reliable representation of flood behaviour across Newcastle West, it was verified against historic flood marks that were collected following the June 2007 flood. This included 180 surveyed flood marks within the TUFLOW model area. Further details on the 2007 verification is provided below.
Inflow Boundary Conditions Upstream (i.e., inflow) boundary conditions for the TUFLOW model were defined based upon flow hydrographs generated by a WBNM hydrologic model that was developed as part of the ‘Throsby, Cottage and CBD Flood Study’ (BMT WBM, 2008). Recorded rainfall for the 2007 event from a continuous Hunter Water rainfall gauge (Merewether WPS Rain Gauge) was applied to the WBNM model. The WBNM model was then used to simulate the transformation of rainfall into runoff and generate flow hydrographs at the outlet of each subcatchment within the Cottage Creek catchment. The flow hydrographs were extracted from the WBNM model and used to define inflows for the 2007 event in the TUFLOW model. However, the flow hydrographs were distributed to the

Newcastle West Drainage Study
7
surface off all pits within each subcatchment to provide a more realistic representation of the distribution of runoff across the TUFLOW model area (i.e., flow being distributed across the full model area rather than being “lumped” at discreet locations).
Newcastle Harbour Boundary Condition Hydraulic computer models also require a suitable downstream water level / boundary condition to be defined. As shown in Figure 3, the downstream boundary of the TUFLOW model is located within Newcastle Harbour. Therefore, historic water level information from the 2007 event was extracted from a water level gauge located on the Hunter River at Stockton Bridge and was used to define the variation in water levels within the TUFLOW model for Newcastle Harbour.
Blockage As discussed in Section 2.2, blockage had a significant impact on flood behaviour across Newcastle West during the 2007 flood. Information describing the degree of blockage at each individual culvert or bridge is not available. Therefore, a global blockage factor of 25% was applied to each bridge and culvert for the 2007 simulation to reflect partial blockage of all structures. Increased blockage factors of 50% were applied to the Hunter Street and King Street culverts to reflect the more significant obstruction formed by the shipping containers that became lodged in these culverts during the 2007 event (refer Plate 5). For stormwater pits, 50% blockage was applied to “sag” pits and 20% blockage was assigned to “on grade” pits.
Results The TUFLOW model was used to simulate the 2007 flood based on the boundary condition and blockage information discussed above. Peak floodwater depths were extracted from the results of the 2007 flood simulation and are included on Figure B1, which is enclosed in Appendix B. Peak floodwater levels were also extracted from the results of the 2007 simulations and were compared against the surveyed flood mark elevations. This comparison is provided in Table B1 in Appendix B. The flood mark comparison indicates that the TUFLOW model provides a reasonable reproduction of the surveyed flood mark elevations. More specifically, the average difference between simulated and surveyed flood levels is 0.01 metres and over 80% of the flood marks are reproduced to within ±0.1 metres. Some more significant differences (i.e., >0.3 metres) do occur at isolated locations. Each of these locations was investigated in detail and, in most cases, it appears that the flood marks may be in error (based on comparisons with other nearby flood mark elevations). Overall, the results of the 2007 flood simulation indicate that the TUFLOW model is providing a reasonable representation of flood behaviour across the lower Cottage Creek catchment and it will serve as a suitable tool to assist in defining exiting drainage behaviour across Newcastle West.
2.3.4 Design Flood Simulations
Critical Duration A range of storm durations were initially simulated for each design flood to determine the duration that produced the highest peak water level across the study area (i.e., the critical storm
Newcastle West Drainage Study
8
duration). This determined that the 120-minute storm produced the highest peak water levels across the majority of the Newcastle West study area. Accordingly, the 120-minute storm duration was used for all subsequent design flood simulations.
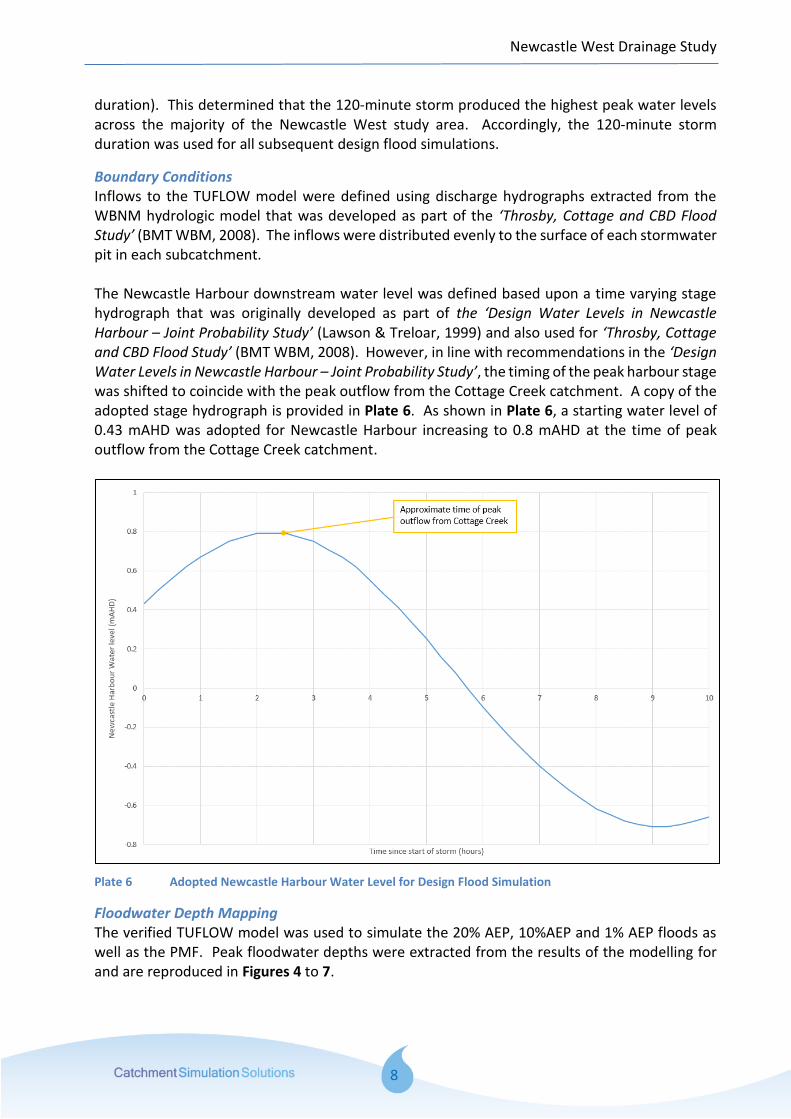
Boundary Conditions Inflows to the TUFLOW model were defined using discharge hydrographs extracted from the WBNM hydrologic model that was developed as part of the ‘Throsby, Cottage and CBD Flood Study’ (BMT WBM, 2008). The inflows were distributed evenly to the surface of each stormwater pit in each subcatchment. The Newcastle Harbour downstream water level was defined based upon a time varying stage hydrograph that was originally developed as part of the ‘Design Water Levels in Newcastle Harbour – Joint Probability Study’ (Lawson & Treloar, 1999) and also used for ‘Throsby, Cottage and CBD Flood Study’ (BMT WBM, 2008). However, in line with recommendations in the ‘Design Water Levels in Newcastle Harbour – Joint Probability Study’, the timing of the peak harbour stage was shifted to coincide with the peak outflow from the Cottage Creek catchment. A copy of the adopted stage hydrograph is provided in Plate 6. As shown in Plate 6, a starting water level of 0.43 mAHD was adopted for Newcastle Harbour increasing to 0.8 mAHD at the time of peak outflow from the Cottage Creek catchment.
Plate 6 Adopted Newcastle Harbour Water Level for Design Flood Simulation
Floodwater Depth Mapping The verified TUFLOW model was used to simulate the 20% AEP, 10%AEP and 1% AEP floods as well as the PMF. Peak floodwater depths were extracted from the results of the modelling for and are reproduced in Figures 4 to 7.

Newcastle West Drainage Study
9
Figure 4 shows that inundation at the peak of the 20% AEP flood is typically contained within the Cottage Creek channel or along roadways. Nevertheless, some more significant ponding depths are evident in the vicinity of:
Steel Street/King Street: 0.30 metres during the 20% AEP event increasing to 0.7 metres during the 1% AEP event
Hunter Street/Union Street: 0.35 metres during the 20% AEP event increasing to 0.45 metres during the 1% AEP event
Parry Street/Steel Street: 0.15 metres during the 20% AEP event increasing to 0.6 metres during the 1% AEP event
VxD Mapping Peak velocity depth product results were also extracted from the results of the modelling and are presented in Figures 8 to 11. The velocity depth product mapping can be used to assess the potential hydraulic hazard that the community may be exposed to during each design flood. More specifically:
VxD < 0.4m2/s = generally safe for people
VxD >= 0.4m2/s = generally unsafe for children and the elderly
VxD >= 0.8m2/s = generally unsafe for able-bodied adults Figures 8 to 11 shows that the majority of the study area would be exposed to a velocity depth product of less than 0.4 m2/s during all events up to and including the 1% AEP event. Nevertheless, velocity depth product values of over 0.4 m2/s are predicted at the peak of the 1% AEP flood across some areas in close proximity to main Cottage Creek channel. The relatively high water depths but low VxD across the study area (in particularly around King/Steel St) indicates that the water is typically moving slowly. In most cases this is associated with water “ponding” in localised topographic depressions. As water cannot freely drain overland from these depressions areas, it must wait for capacity to become available in the stormwater system.
Floodwater Surface Profiles Peak design water levels were also extracted along the centreline of Cottage Creek for each design flood and are presented as water surface profiles in Figure 12. The ground surface information included in Figure 12 shows that Hunter Street is typically elevated higher than all adjoining streets in the area. Therefore, Hunter Street serves as a significant impediment to flow draining towards Newcastle Harbour. Figure 12 also shows a significant increase in water level between Newcastle Harbour and upstream of Honeysuckle Drive. The water surface profiles upstream of Honeysuckle Drive are also relatively “flat”. This indicates that water is “building up” on the southern side of the Honeysuckle Drive culvert. That is, the Honeysuckle Drive culvert is restricting the “escape” of water to Newcastle Harbour. A review of the Cottage Creek channel and culvert at this location indicates the channel is approximately 10 metres wide and the culvert is approximately 8 metres wide. The reduction in waterway area plus hydraulic losses associated with friction and contraction/expansion losses are likely contributing to the reduced hydraulic efficiency in this

Newcastle West Drainage Study
10
area. Notable afflux is also evident upstream of the former railway line as well as King Street during the 1%AEP flood.
Flood Hazard Mapping The City of Newcastle has defined a range of hydraulic threshold, life hazard and property hazard categories in Section 4.01 (Flood Management) of the Newcastle Development Control Plan (DCP) 2012. The categories describe the potential impact that flooding may have on people and properties by giving consideration to hydraulic behaviour, flood warning times, and availability of evacuation routes. The hydraulic behaviour thresholds are reproduced in Table 1 and describe the potential impact that floodwater may have on people and properties based upon consideration of flood hydraulics only (i.e., the depth and velocity of floodwaters).
Table 1 Hydraulic Behaviour Thresholds (City of Newcastle, 2012)
Hydraulic Behaviour Category
Description Adopted Criteria
H1 hydraulically suitable for parked or moving cars V < 0.5m/s, d < 0.3m
H2 hydraulically suitable for parked or moving heavy vehicles and wading by able bodied adults
V < 2m/sec, d< 0.8m and v < 3.2 – 4*d
H3 hydraulically suitable for light construction (eg. timber frame and brick veneer)
v < 2m/s, d < 2m, v*d < 1
H4 hydraulically suitable for heavy construction (eg. steel frame and reinforced concrete)
v < 2.5m/sec, d < 2.5m, v*d < 2.5
H5 generally unsuitable Exceeds H1 to H5 criteria
Hydraulic behaviour threshold mapping was prepared based on the criteria list in Table 1 for the 1% AEP and PMF events and is presented in Figure 13 and Figure 14 respectively. DCP 2012 also presents risk to life categories which build upon the information provided by the hydraulic behaviour threshold mapping and describe the potential risk that floodwaters will pose to people based upon consideration of flood hydraulics as well as flood warning time and availability of evacuation routes. The life hazard categories are summarised in Table 2. As noted in Table 2, only areas subject to riverine flooding with considerable warning time can be designated as category L1. As the critical duration for the Cottage Creek catchment is 2-hours it was considered that these criteria could not be met. Therefore, the L1 category was omitted from the risk to life mapping for Newcastle West. Categories L4 and L5 were defined based upon the hydraulic behaviour mapping and Categories L2 and L3 were defined based upon consideration of the hydraulic behaviour mapping and whether properties had access to an evacuation route that graded up and out of the floodplain. The resulting risk to life mapping is presented in Figure 15 for the PMF in accordance with DCP 2012.
Newcastle West Drainage Study
11
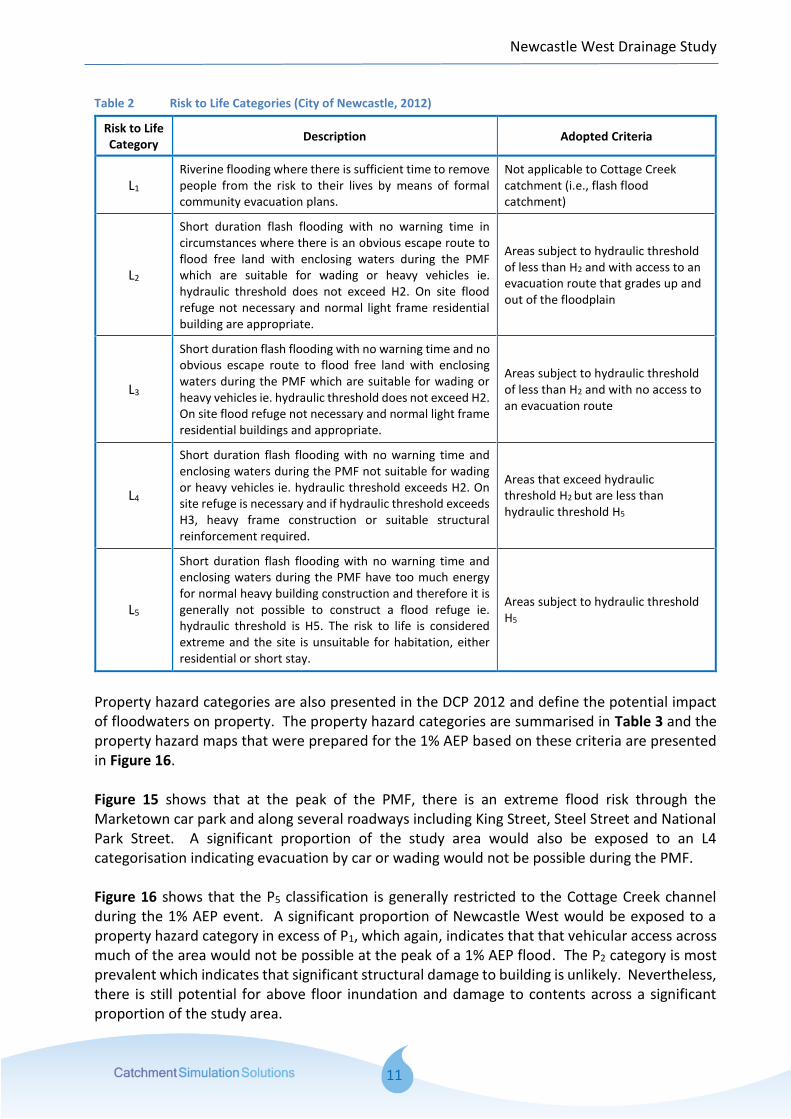
Table 2 Risk to Life Categories (City of Newcastle, 2012)
Risk to Life Category
Description Adopted Criteria
L1 Riverine flooding where there is sufficient time to remove people from the risk to their lives by means of formal community evacuation plans.
Not applicable to Cottage Creek catchment (i.e., flash flood catchment)
L2
Short duration flash flooding with no warning time in circumstances where there is an obvious escape route to flood free land with enclosing waters during the PMF which are suitable for wading or heavy vehicles ie. hydraulic threshold does not exceed H2. On site flood refuge not necessary and normal light frame residential building are appropriate.
Areas subject to hydraulic threshold of less than H2 and with access to an evacuation route that grades up and out of the floodplain
L3
Short duration flash flooding with no warning time and no obvious escape route to flood free land with enclosing waters during the PMF which are suitable for wading or heavy vehicles ie. hydraulic threshold does not exceed H2. On site flood refuge not necessary and normal light frame residential buildings and appropriate.
Areas subject to hydraulic threshold of less than H2 and with no access to an evacuation route
L4
Short duration flash flooding with no warning time and enclosing waters during the PMF not suitable for wading or heavy vehicles ie. hydraulic threshold exceeds H2. On site refuge is necessary and if hydraulic threshold exceeds H3, heavy frame construction or suitable structural reinforcement required.
Areas that exceed hydraulic threshold H2 but are less than hydraulic threshold H5
L5
Short duration flash flooding with no warning time and enclosing waters during the PMF have too much energy for normal heavy building construction and therefore it is generally not possible to construct a flood refuge ie. hydraulic threshold is H5. The risk to life is considered extreme and the site is unsuitable for habitation, either residential or short stay.
Areas subject to hydraulic threshold H5
Property hazard categories are also presented in the DCP 2012 and define the potential impact of floodwaters on property. The property hazard categories are summarised in Table 3 and the property hazard maps that were prepared for the 1% AEP based on these criteria are presented in Figure 16. Figure 15 shows that at the peak of the PMF, there is an extreme flood risk through the Marketown car park and along several roadways including King Street, Steel Street and National Park Street. A significant proportion of the study area would also be exposed to an L4 categorisation indicating evacuation by car or wading would not be possible during the PMF. Figure 16 shows that the P5 classification is generally restricted to the Cottage Creek channel during the 1% AEP event. A significant proportion of Newcastle West would be exposed to a property hazard category in excess of P1, which again, indicates that that vehicular access across much of the area would not be possible at the peak of a 1% AEP flood. The P2 category is most prevalent which indicates that significant structural damage to building is unlikely. Nevertheless, there is still potential for above floor inundation and damage to contents across a significant proportion of the study area.

Newcastle West Drainage Study
12
Table 3 Property Hazard Categories (City of Newcastle, 2012)
Hazard Category
Description Adopted Criteria
P1 Parked or moving cars remain stable ie. equivalent to areas of H1 at the Flood Planning Event.
Areas subject to hydraulic category H1
P2 Parked or moving heavy vehicles remain stable ie. equivalent to areas of H2 at the Flood Planning Event.
Areas subject to hydraulic category H2
P3 Suitable for light construction (eg. timber frame, masonry and brick veneer) ie. equivalent to areas of H3 at the Flood Planning Event.
Areas subject to hydraulic category H3
P4 Suitable for heavy construction (eg. steel frame, reinforced concrete) ie. equivalent to areas of H4 at the Flood Planning Event.
Areas subject to hydraulic category H4
P5 Hydraulically unsuitable for normal building construction is equivalent to areas of H5 at the Flood Planning Event.
Areas subject to hydraulic category H5
Hydraulic Categories The NSW Government’s ‘Floodplain Development Manual’ (NSW Government, 2005) characterises flood prone areas according to the hydraulic categories presented in Table 4. The hydraulic categories provide an indication of the potential for development across different sections of the floodplain to impact on existing flood behaviour and highlights areas that should be retained for the conveyance of floodwaters. The ‘Floodplain Development Manual’ (NSW Government, 2005) does not provide explicit quantitative criteria for defining hydraulic categories. This is because the extent of floodway, flood storage and flood fringe areas are typically specific to a particular catchment. However, criteria for delineating hydraulic categories for the 1% AEP flood and PMF were established as part of the ‘Newcastle City-wide Floodplain Risk Management Study and Plan’ (BMT WBM, 2012) and are summarised in Table 4. These criteria were reviewed as part of the current study and the floodway criteria determined to be suitable for application to Newcastle West. The resulting 1% AEP and PMF hydraulic category mapping is provided in Figure 17 and Figure 18. Figure 17 indicates that during the 1% AEP event, floodways are typically aligned with the main Cottage Creek channel. Figure 17 also shows that National Park affords significant flood storage. Some isolated storage is also provided in roadway “sag points” (e.g., Steel Street, King Street, National Park Street). Figure 18 indicates that the extent of floodways across the study area is much more extensive during the PMF. Floodways are aligned with the major waterway but also along many roadways. This is associated with the elevated water levels during the PMF allowing water to overtop roadways embankments and travel more readily towards Newcastle Harbour. National Park continues to provide significant flood storage during the PMF.

Newcastle West Drainage Study
13
Table 4 Qualitative and Quantitative Criteria for Hydraulic Categories
Hydraulic Category
Floodplain Development Manual Definition Adopted Criteria
Floodway those areas where a significant volume of water flows during floods
often aligned with obvious natural channels and drainage depressions
they are areas that, even if only partially blocked, would have a significant impact on upstream water levels and/or would divert water from existing flowpaths resulting in the development of new flowpaths.
they are often, but not necessarily, areas with deeper flow or areas where higher velocities occur.
VxD >= 0.3 m2/s (1% AEP)
VxD >= 1.0 m2/s (PMF)
Flood Storage those parts of the floodplain that are important for the temporary storage of floodwaters during the passage of a flood
if the capacity of a flood storage area is substantially reduced by, for example, the construction of levees or by landfill, flood levels in nearby areas may rise and the peak discharge downstream may be increased.
substantial reduction of the capacity of a flood storage area can also cause a significant redistribution of flood flows.
If not FLOODWAY and D >=0.5 m (1% AEP)
If not FLOODWAY and D >=1 m (PMF)
Flood Fringe the remaining area of land affected by flooding, after floodway and flood storage areas have been defined.
development (e.g., filling) in flood fringe areas would not have any significant effect on the pattern of flood flows and/or flood levels.
Remaining areas after FLOODWAY and FLOOD STORAGE are defined
Stormwater Capacity Mapping The TUFLOW model also produces information describing the amount of water flowing into each stormwater pit and through each stormwater pipe and culvert/bridge. This includes information describing which hydraulic structures are flowing completely full during each design flood. This information can be used to provide an assessment of the capacity of each pit and pipe in the stormwater system. In doing so, it allows identification of where stormwater capacity constraints may exist across the study area. The pipe flow results of all design flood simulations were interrogated to determine the capacity of each stormwater pipe in terms of a nominal return period (i.e., AEP). The capacity of the pipe was defined as the largest design event whereby the pipe was not flowing completely full. For example, if a particular stormwater pipe was flowing 95% full during the 10% AEP event and 100% full during the 5% AEP event, the pipe capacity would be defined as “10% AEP”. A nominal return period was also calculated for each pit based on one of the following “failure” criteria:

Newcastle West Drainage Study
14
AEP at which the pit begins to surcharge;
AEP at which the water depth at the pit exceeds 0.15 metres; The resulting stormwater capacity map is presented in Figure 19. As shown in Figure 19, the pit and pipe capacities are colour coded based on the nominal capacity that was calculated. Furthermore, different symbols have been applied to each pit to define whether the pit first “fails” via ponding depth or surcharge. The information presented in Figure 19 shows that the capacity of the stormwater pipe system across the majority of the study areas has a capacity of equal to or less than the 20% AEP event. It also shows that the pipe capacity rather than the pit capacity is generally the limiting constraint with the pit ponding depth criteria only being exceeded during relatively large events (i.e., 1% AEP and larger). When designing new stormwater systems, Council aims to convey the 10% AEP event via the subsurface drainage system with flows during larger events up to and including the 1% AEP event being conveyed overland. Figure 19 indicates that a significant proportion of the drainage system across Newcastle West does not meet Council’s current design standards. More specifically, the stormwater system does not have capacity to convey the 10% AEP event and flows in excess of the capacity of the stormwater system are typically trapped in localised sag points and are unable to freely discharge towards Newcastle Harbour.
2.3.5 Sensitivity Analysis
Computer flood models require the adoption of several parameters that are not necessarily known with a high degree of certainty or are subject to variability. Each of these parameters can impact on the results generated by the model. Although the TUFLOW model was verified against historic information for the 2007 flood, it was considered important to understand how any uncertainties and variability in model input parameters may impact on the results produced by the model. Therefore, a sensitivity analysis was undertaken to establish the sensitivity of the results generated by the computer model to changes in model input parameter values as well as potential future changes in terrain / flow obstructions. The scenarios considered as part of the sensitivity analysis included:
Newcastle harbour levels
Blockage of culverts, bridges and stormwater pits
Removal of 681 Hunter Street
Future filling
Newcastle Harbour Water Levels The Cottage Creek catchment drains into Newcastle Harbour which is tidal and, therefore, subject to variations in water level. A conservative Newcastle Harbour peak water level of 0.8 mAHD has been adopted for all design flood simulations. However, if a local catchment flood occurred at “low tide” or in conjunction with elevated “storm surge” harbour levels, it will likely alter the way in which water is able to drain from the catchment. Therefore, additional 1% AEP simulations were completed with the following harbour water levels:
0.0 mAHD (corresponding to mean sea level)

Newcastle West Drainage Study
15
1.4 mAHD (corresponding to a peak 1% AEP storm surge harbour level) The TUFLOW model was used to simulate the 1% AEP local catchment storms in conjunction with each alternate harbour water level. Peak water levels were extracted from the results of the modelling and were compared against peak water flood levels for “base” design conditions. This allowed water level difference mapping to be prepared showing the magnitude of any change in water level associated with the different harbour water level. The difference mapping is presented in Plate 7 and Plate 8. Plate 7 shows that a lower harbour level will reduce peak 1% AEP flood levels across a significant area of Newcastle West. Reductions in water level are most significant across the downstream reaches of the study areas (e.g., north of the former railway line) but reductions are also predicted to extend upstream across National Park. Reductions in the vicinity of King and Steel Streets are in the order of 0.1 to 0.15 metres. Plate 8 shows that a higher harbour water level will increase peak 1% AEP flood levels across most of Newcastle West. Again, the most significant impacts occur across the downstream sections of the catchment but are predicted to extend to the southern end of National Park. Increases in flood level around King and Steel Streets are predicted to be about 0.15 metres.
Plate 7 1% AEP flood level difference map for 0.0 mAHD harbour level simulation
Newcastle West Drainage Study
16
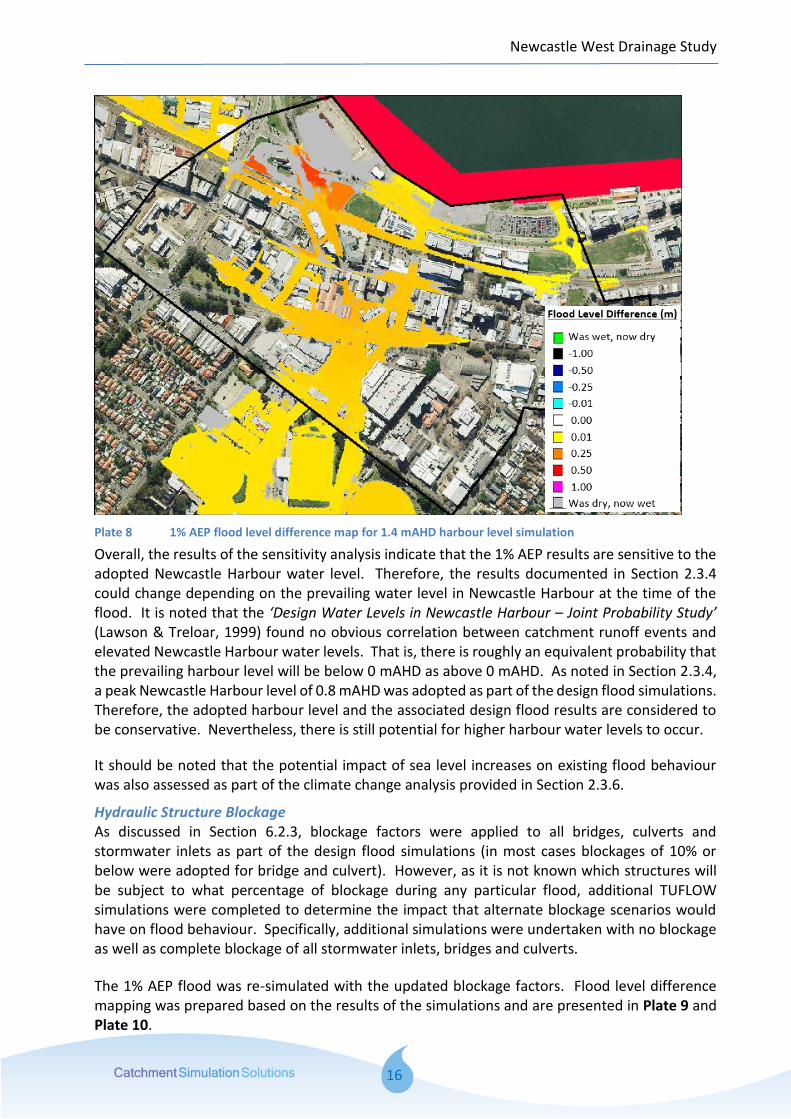
Plate 8 1% AEP flood level difference map for 1.4 mAHD harbour level simulation
Overall, the results of the sensitivity analysis indicate that the 1% AEP results are sensitive to the adopted Newcastle Harbour water level. Therefore, the results documented in Section 2.3.4 could change depending on the prevailing water level in Newcastle Harbour at the time of the flood. It is noted that the ‘Design Water Levels in Newcastle Harbour – Joint Probability Study’ (Lawson & Treloar, 1999) found no obvious correlation between catchment runoff events and elevated Newcastle Harbour water levels. That is, there is roughly an equivalent probability that the prevailing harbour level will be below 0 mAHD as above 0 mAHD. As noted in Section 2.3.4, a peak Newcastle Harbour level of 0.8 mAHD was adopted as part of the design flood simulations. Therefore, the adopted harbour level and the associated design flood results are considered to be conservative. Nevertheless, there is still potential for higher harbour water levels to occur.
It should be noted that the potential impact of sea level increases on existing flood behaviour was also assessed as part of the climate change analysis provided in Section 2.3.6.
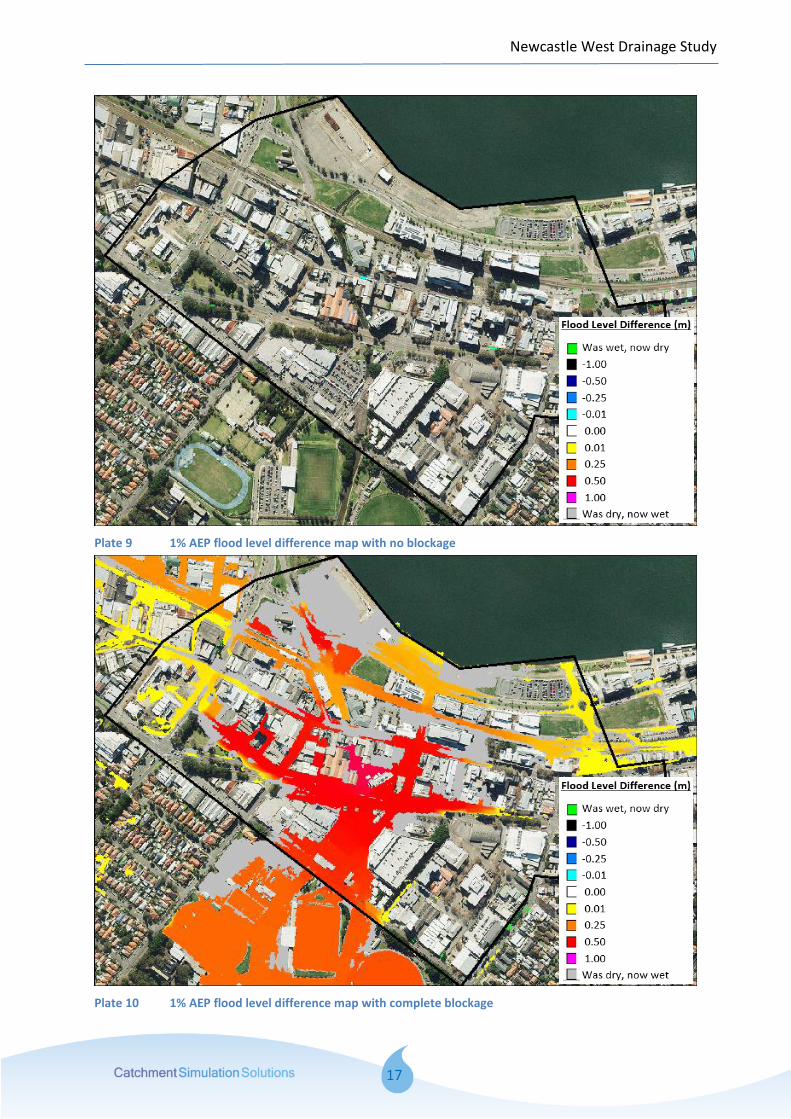
Hydraulic Structure Blockage As discussed in Section 6.2.3, blockage factors were applied to all bridges, culverts and stormwater inlets as part of the design flood simulations (in most cases blockages of 10% or below were adopted for bridge and culvert). However, as it is not known which structures will be subject to what percentage of blockage during any particular flood, additional TUFLOW simulations were completed to determine the impact that alternate blockage scenarios would have on flood behaviour. Specifically, additional simulations were undertaken with no blockage as well as complete blockage of all stormwater inlets, bridges and culverts.
The 1% AEP flood was re-simulated with the updated blockage factors. Flood level difference mapping was prepared based on the results of the simulations and are presented in Plate 9 and Plate 10.
Newcastle West Drainage Study
17
Plate 9 1% AEP flood level difference map with no blockage
Plate 10 1% AEP flood level difference map with complete blockage

Newcastle West Drainage Study
18
Plate 9 shows that the no blockage will have minimal impacts on peak 1% AEP flood levels across Newcastle West. The lack of sensitivity is most likely associated with the low blockage factors that were adopted as part of the “base” design flood simulations. However, Plate 10 shows that complete blockage will have a significant impact on peak 1% AEP flood levels across the study area. More specifically, increases in peak 1% AEP flood levels of over 0.5 metres are predicted across Marketown Shopping Centre, King Street, Steel Street, National Park Street and parts of Hunter Street. Therefore, increased blockage has the potential to significantly increase design flood levels across Newcastle West.
Future Plans for 681 Hunter Street Hunter Water is currently working with stakeholders regarding the building located at 681 Hunter Street which is located directly over Cottage Creek. The removal of this building was a recommendation in the ‘Newcastle City-wide Floodplain Risk Management Study and Plan’ (BMT WBM, 2012). Therefore, an additional simulation was completed to quantify the impact that demolition of this building would have on peak 1% AEP flood levels. The following updates were completed to the TUFLOW model to represent this scenario:
Removal of the flow obstruction provided by the building
Remove the piers supporting the existing building (but retain the existing Hunter Street culvert).
The 1% AEP flood was re-simulated with the building at 681 Hunter Street removed. Flood level difference mapping was prepared based on the results of the simulation. This difference map showed no significant change in peak 1% AEP levels at any location. This indicates that the existing building at 681 Hunter Street does not currently serve as a significant flow impediment during the 1% AEP flood. This tends to confirm the findings of the ‘Newcastle City-wide Floodplain Risk Management Study and Plan’ (BMT WBM, 2012) which determined that the culvert draining beneath Hunter Street has sufficient capacity to convey the 1% AEP flood (the stormwater capacity map also indicates that this culvert has a 1% AEP capacity). Nevertheless, the impact of demolishing this building is likely to be significant during larger events or events in which the Hunter Street culvert becomes blocked (as happened during the 2007 flood).
Future Filling An additional sensitivity simulation was completed to determine the impact that future filling across all potentially developable may have on flood behaviour. In this regard, a 1% AEP simulation was completed with all areas currently zoned for residential, commercial or industrial development elevated above the peak 1% AEP flood level. Only drainage reserves, roadways and parklands/open space were retained for the conveyance of overland flows. The 1% AEP flood was re-simulated with the fill areas in place. Difference mapping was prepared based upon the results of the future fill simulation and is provided in Plate 11.

Newcastle West Drainage Study
19
Plate 11 1% AEP flood level difference map after filling of all potentially developable land
The difference mapping indicates that filling does have the potential to increase existing 1% AEP flood levels. In general, the increases in 1% AEP flood levels are predicted to be less than 0.1 metres, although some localised increases of up to 0.2 metres are predicted in the vicinity of Marketown.
Australian Rainfall and Runoff (2016) During the concluding stages of this project, a revised version of Australian Rainfall and Runoff was released (Geoscience Australia, 2016) (referred to herein as ARR2016). Therefore, revised 1% AEP simulations were completed based upon the revised procedures outlined in ARR2016 to determine the impact that these updates may have on design flood behaviour documented in this report. Design loss and temporal pattern information was downloaded from the ARR2016 data hub and was supplemented with 2016 IFD data obtained from the Bureau of Meteorology website for the 120-minute storm duration (i.e., the critical duration for the catchment). The 2016 IFD data yielded a total 1% AEP rainfall depth of 118mm for the 2-hour storm duration (compared to a total rainfall depth of 96mm for the 1987 IFD). A comparison of the 1987 and 2016 rainfall depths indicates that that the 2016 IFD information provides higher 1% AEP rainfall depths relative to the 1987 IFD. A review of design rainfall for other frequencies indicates a less substantial difference (e.g., the 20% AEP rainfall depths for the 2-hour storm differ by approximately 1 mm). The 2016 1% AEP rainfall depth was applied to the WBNM hydrologic model with a suite of ten different temporal patterns. The peak discharges generated by the WBNM model were reviewed

Newcastle West Drainage Study
20
and the average discharge at the Cottage Creek outlet was determined to be 124 m3/s (this compares to 108 m3/s for the previous version of ARR). The temporal pattern that generated the closest, but next highest peak discharge was subsequently selected for application to the TUFLOW model (temporal pattern 4611). The updated TUFLOW model was then used to simulate the 1% AEP flood with the 2016 design rainfall and temporal pattern information. Difference mapping was prepared based upon the results of the ARR2016 simulations and is provided in Plate 12.
Plate 12 1% AEP flood level difference map for ARR 2016 (1%AEP 120-minute storm)
As shown in Plate 12, the 2016 revision of ARR is predicted to produce wide spread increases in flood levels across Newcastle West relative to the 1987 version of ARR. More specifically, flood level increases of up to 0.4m are predicted along the Cottage Creek channel. The flood level differences are predicted to reduce moving away from the main channel. However, the increases are still predicted to exceed 0.3 metres along Steel Street. Therefore, the 2016 revision of ARR is predicted to have a significant impact on the design flood behaviour across Newcastle West. It is considered appropriate to explore these impacts in more detail as part of further investigations following on from the current study.

Newcastle West Drainage Study
21
2.3.6 Climate Change Analysis
Climate change refers to a significant and lasting change in weather patterns arising from natural and/or human induced processes. Climate change has the potential to increase sea level and/or rainfall intensities, which is likely to exacerbate the existing flooding and drainage problems across Newcastle West. Therefore, additional 1% AEP simulations were completed to quantify the potential impact that climate change may have on flooding across Newcastle West. The outcomes of this assessment are summarised below.
Rainfall Intensity Increases Increases in rainfall intensities would produce increases in runoff volumes and discharges across the Cottage Creek catchment. This, in turn, would likely produce an increase in the depth, extent and velocity of floodwaters. Additional 1% AEP simulations were completed with a 10%, 20% and 30% increase in rainfall. Floodwater difference mapping was prepared based on the results from each simulation and is presented in Plate 13, Plate 14 and Plate 15.
Plate 13 1% AEP flood level difference map with 10% increase in rainfall intensity

Newcastle West Drainage Study
22
Plate 14 1% AEP flood level difference map with 20% increase in rainfall intensity
Plate 15 1% AEP flood level difference map with 30% increase in rainfall intensity

Newcastle West Drainage Study
23
The results of the rainfall intensity increase simulations show that:
A 10% increase in rainfall intensity is predicted to increase existing 1% AEP water levels by between 0.1 and 0.15 metres across most of the study area
A 20% increase in rainfall intensity is predicted to increase existing 1% AEP water levels by between 0.2 and 0.25 metres across most of the study area
A 30% increase in rainfall intensity is predicted to increase existing 1% AEP water levels by around 0.3 metres across most of the study area
Peak 1% AEP floodwater depths across the more significantly impacted parts of Newcastle West are currently exposed to floodwater depths of between 0.3 and 0.7 metres. Therefore, a flood level increase of ~0.3 metres across these areas reflects a significant increase in existing flood levels/depths. Therefore, it is considered that Newcastle West is sensitive to potential future rainfall intensity increases.
Sea Level Increases As outlined in Section 2.3.5, the prevailing water level in Newcastle Harbour can have a significant impact on flood behaviour across Newcastle West. Therefore, increases in harbour water levels associated with climate change also have the potential to impact on flood behaviour. In recognition of the potential for increases in sea level to increase the flood risk across Newcastle West, additional 1% AEP simulations were completed with the following sea / harbour level increases (Department of Environment and Climate Change, 2007).
0.4 metres (corresponding to the projected 2050 sea level increase); and,
0.9 metres (corresponding to the projected 2100 sea level increase). The results of the sea level change simulations were used to prepare flood level difference mapping, which is shown in Plate 16 and Plate 17. The difference mapping indicates that flood level increases are most prevalent across the downstream reaches of the catchment (i.e., north of the former railway line). Nevertheless, increases in flood level are predicted to extend upstream of National Park. In general, the 2050 sea level increase scenario will increase 1% AEP water levels by approximately 0.1 metres across most of the study area. During the 2100 sea level rise scenario, 1% AEP water levels will generally increase by 0.2 metres across the study area. Although separate simulations were completed to quantify the impact of increases in rainfall and increases in sea level, there is also potential for increases in rainfall and sea level to occur simultaneously. Therefore, one additional 1% AEP simulation was completed assuming a 30% increase in rainfall and 2100 sea level increase to provide a “worst case” climate change scenario. Overall, the results of the climate change simulations show that Newcastle West is sensitive to changes in rainfall and sea level. In general, rainfall increases are predicted to have a more significant impact on water levels across most of the study area relative to sea level increases.

Newcastle West Drainage Study
24
Plate 16 1% AEP flood level difference map with 2050 sea level increase
Plate 17 1% AEP flood level difference map with 2100 sea level increase

Newcastle West Drainage Study
25
The results of the 2100 sea level and 30% rainfall intensity increase simulation are presented in Plate 18 as a flood level difference map. The flood level difference mapping shows that this scenario would generate 1% AEP flood level increases of between 0.35 and 0.4 metres across most of the study area.
Plate 18 1% AEP flood level difference map with 30% increase in rainfall and 2100 sea level increase
2.4 Summary
Newcastle West has a long history of flooding and drainage problems. The results of the computer model simulations confirm the extent of the drainage problems. More specifically:
The stormwater pipes in the area generally have inverts well below the 10% AEP water level within Cottage Creek. As a result, each of the pipes will be partly submerged during each flood, reducing their drainage efficiency. Many stormwater pipes across Newcastle West have less than 10% AEP capacity (Council’s current design standard). As a result, significant inundation of many roadways is predicted in relatively frequent rainfall events (e.g., 20% AEP event).
The drainage problems are exacerbated by the topography across the area with a number of elevated roadways that prevent overland flows from freely draining towards Cottage Creek and Newcastle Harbour. This is particularly evident around the intersection of King Street and Steel Street, where ponding depths are predicted to exceed 0.7 metres during the 1% AEP event.

Newcastle West Drainage Study
26
The Cottage Creek channel generally has sufficient capacity to covey main stream flows in events up to and including the 10% AEP event. However, water is predicted to overtop the banks of the creek during the 1% AEP event.
Notable affluxes are predicted along Cottage Creek during the 1% AEP flood upstream of Honeysuckle Drive, the former railway line and King Street. This indicates that each of these embankments and associated culverts/bridges are serving as hydraulic impediments during large Cottage Creek floods.
The outcomes of additional climate change and sensitivity simulations also shows that:
Blockage can have a significant impact on flood and drainage behaviour across Newcastle West. More specifically, complete blockage of all culverts, bridges and stormwater pits has the potential to increase peak 1% AEP flood levels and depths by over 0.5 metres at some locations.
If climate change was to increase rainfall intensities by 30% and ocean levels were to increase by 0.9 metres, 1% AEP flood levels across Newcastle West could increase by over 0.4 metres in some areas.
Therefore, the outcomes of this assessment have confirmed there is a drainage problem across Newcastle West and the severity of the problem could increase if rainfall intensities and sea levels increase in line with current climate change projections.

27
3 OPTIONS FOR MANAGING THE EXISTING
DRAINAGE PROBLEMS
3.1 General
The outcomes of the existing drainage assessment presented in Chapter 2 shows some significant drainage limitations across Newcastle West. The drainage issues are predicted to worsen if sea levels and/or rainfall intensities increase in the future. Therefore, a range of options were investigated to help manage the existing and potential future drainage problem. The following chapter presents a range of potential options for managing the drainage issues across Newcastle West. It evaluates the benefits and costs of each option and provides an appraisal of the viability of each option. Council nominated the following design objectives for the options assessment:
Convey all flows up to the 10% AEP via the subsurface drainage system; and,
Convey flows in excess of the 10% AEP up to the 1% AEP overland.
3.2 Options Considered
A workshop was completed part way through the study to discuss potential options for addressing the drainage problem. A copy of the PowerPoint presentation from the workshop along with minutes describing the outcomes of the workshop is provided in Appendix C. A summary of the options that were considered at the workshop are also included in Table 5.
Table 5 Options Considered for Managing the Drainage Problem
Description of Option
Installation of a flood gate at downstream end of Cottage Creek channel
Stormwater upgrades and regrading in King Street
Stormwater upgrades and regrading in National Park, Hunter and Bellevue Streets
Regrading from King St north along Steel St towards Newcastle Harbour
New culvert from Cottage Creek running north along Steel St to Newcastle Harbour
Widen Cottage Creek channel between King St & Honeysuckle Drive and upgrade Honeysuckle Drive Culvert
Upgrade Honeysuckle Dr culvert and construct open channel downstream to Newcastle Harbour
Upgrade of King Street culvert

Newcastle West Drainage Study
28
The workshop attendees discussed the relative advantages and disadvantages of each option to determine the potential feasibility of each option. Based upon professional experience and feedback received at the workshop, the options summarised in Table 6 were considered appropriate for more detailed investigations.
Table 6 Options Adopted for Detailed Investigations
Option
A Stormwater upgrades and regrading in King Street
B Stormwater upgrades and regrading in National Park, Hunter and Bellevue Streets
C Regrading from King St north along Steel St towards Newcastle Harbour
D New culvert from Cottage Creek running north along Steel St to Newcastle Harbour
E Widen Cottage Creek channel between King St and Newcastle Harbour
3.3 Assessment of Options
Each of the options listed in Table 6 was investigated in detail to assess the potential benefits that each could provide across Newcastle West. Each option was evaluated against the following criteria:
Reduction in flood levels, extents and VxD during the 20%, 10% and 1% AEP events;
Opportunities and constraints (e.g., services/utilities, construction difficulties, disruption to community/traffic);
The estimated cost to implement the option; To assess the benefit of each option in reducing inundation levels and extents, the TUFLOW hydraulic model was updated to include each option. The updated TUFLOW models were then used to re-simulate each of the design storms. The flood level and VxD results from the revised simulations were compared against the flood level and VxD results from the “existing” conditions / do nothing scenario to prepare “difference mapping”. The difference mapping shows the magnitude and location of changes in flood levels, inundation extents and VxD associated with the implementation of the option. Cost estimates have also been prepared for each option (a detailed breakdown of the costs is included in Appendix E). The cost estimates have been prepared using the best available information. However, precise cost estimates can only be prepared once detailed design plans have been prepared. Therefore, the cost estimates presented in this report should be considered approximate only. Nevertheless, they are considered suitable for providing an initial appraisal of the financial viability of each option. A more detailed discussion on the evaluation of each option is provided in the following sections.

Newcastle West Drainage Study
29
3.3.1 Option A - Stormwater upgrades and Regrading in King Street
Description of Option Option A would involve stormwater upgrades in King Street to provide increased drainage capacity during frequent rainfall events as well as regrading of King Street to allow for flows in excess of the capacity of the stormwater system to more freely drain into Cottage Creek. The drainage upgrades would involve installation of new, larger pipes and pits extending from near the intersection of King and National Park Streets to Cottage Creek as well as from near the King Street and Steel Street intersection to Cottage Creek. The regrading would be concentrated along King Street between National Park Street and Cottage Creek and would include “lifting” the existing sag in the road profile adjacent to 464 – 470 King Street to reduce the depth of inundation during events that exceed the capacity of the stormwater system. A summary of the extent of works that would be completed as part of Option A is summarised in Table 7 and concept design plans are included in Appendix D.
Hydraulic Benefits A 1D hydraulic model (DRAINS) of Option A was developed for rapid sizing and testing of stormwater upgrades. The model represented existing grades along King Street, pipe sizes, existing sags and tailwater levels in Cottage Creek. The model shows that it is possible to pipe the 10% AEP flow underground from the Newcastle West catchment. However, there would be residual ponding within a trapped low point at 498 King Street. The stormwater upgrades and regrading were also included in the TUFLOW model and the updated models was used to re-simulate each design flood. Peak floodwater depth mapping for the 20%, 10% and 1% AEP events with Option A in place are presented in Figures A1 to A3 in Map Set A. Peak velocity depth product results were also extracted from the modelling results and are presented in Figures A4 to A6. Flood level difference mapping for each event is also presented in Figures A7 to A9 and VxD difference mapping is presented in Figures A10 to A12. Figures A7 and A8 show that Option A is predicted to produce reductions in water levels and extents during the 20% AEP and 10% AEP near the intersection of King and Steel Streets as well as near the King Street and National Park Street intersection. While the DRAINS modelling predicts that the upgrades stormwater system should have capacity to convey the 10% AEP flows, Figures A1 and A2 show that shallow inundation (i.e., <0.2 metres) is still predicted across the roadways in the area during these more frequent events. This is most likely associated with the 2 m grid size used in the TUFLOW modelling not providing a fully detailed representation of the kerb and gutter system that conveys overland flows into the pipe system (i.e., the TUFLOW model may be underrepresenting the efficiency of the proposed drainage system). Despite these modelling limitations, Figure A7 shows that Option A is predicted to generate some notable reductions in peak flood levels during the 20% AEP event. This includes a 0.24m reduction near the intersection of King and Steel Streets as well as a 0.39m reduction west of the King / National Park Streets intersection. The magnitude of the flood level reductions generally decreases as the severity of the flood increases, with flood level reductions during the 1% AEP

Newcastle West Drainage Study
30
event being no greater than 0.15 m. This indicates that the capacity of the upgraded stormwater system is exceeded during the 1% AEP event and the regrading along King Street does not assist in reducing flood levels significantly.
Table 7 Option A Design Overview
Option A Design Overview
Design Concept
Option A is expected to include the following works:
Removal of 1,216 m of existing stormwater pipes and pits along King Street
Installation of following stormwater infrastructure along northern side of King Street: - 30 metres of 375mm dia stormwater pipes - 127 metres of 450mm dia stormwater pipes - 491 metres of 600mm dia stormwater pipes - 135 metres of 675mm dia stormwater pipes - 152 metres of 750mm dia stormwater pipes - 201 metres of 825mm dia stormwater pipes - At least 14 new stormwater pits with 1.2m lintel and 600mmx450mm grate
Regrading of eastbound King Street travels lanes between Cottage Creek and National Park Street
Reestablishment of kerb, gutter and roadway pavement along King Street
Identified Constraints and
Issues
Access to existing properties near 498 King St will need to be maintained and will limit the regrading of King St to the west of National Park Street
Re-development of 464-470 King Street will establish a floor level above the 1% AEP flood level and there is an opportunity to raise the street scape up to this level, thereby reducing flood depths.
Traffic disruption during construction
Extensive underground services within King Street including underground power, sewer, water, telecoms and fibre.
Risks / Unknowns Details of the existing stormwater system are not fully known, which may
alter the hydraulic performance of the existing and upgraded system
Cost $1.6 million (including 30% contingency)
Hydraulic Benefit
1% AEP Levels: Reduction of 0.15m near King St /National Park St intersection
VxD: Reduction of 0.05m2/s near King St /Steel St intersection & reduction of 0.2m2/s in front of 464-470 King Street
10% AEP
Levels: Reduction of 0.2m near King St/Steel St intersection & 0.45m reductions near King St /National Park St intersection
VxD: Reduction of 0.05m2/s near King St /Steel St intersection & reduction of 0.1m2/s in front of 464-470 King Street
Further Investigations
Identify opportunities to incorporate these works into future King Street and Birdwood Park upgrades.
Open discussion with adjoining developers to regrade the footpath and road adjacent to 464-470 King Street.
Survey of local stormwater drainage system and services in King Street
Preparation of detailed design plans & cost estimates.
However, Figures A10 and A12 shows that the regarding will assist in providing some reductions in velocity depth product along King Street during each design event, with the reductions during the 1% AEP event being most significant in front of 464-470 King Street. Accordingly, although

Newcastle West Drainage Study
31
Option A does not result in a significant reduction in water levels along King Street, the regrading does reduce depths which, in turn, provides a small reduction in VxD/flood hazard.
Constraints and Opportunities Local flood levels in King Street are generally controlled by a combination of elevated water levels in Cottage Creek, flat grades within the existing stormwater network and small pipe diameters. The profile of King Street is higher over Cottage Creek than surrounding areas creating trapped low points to the east and west. Flood depths are significant in these areas, and raising the road surface to the east and west of Cottage Creek will improve the ability of surface water to drain away while reducing the depth of ponding in existing trapped low points. However, raising the road level also requires raising the adjacent footpath level without impacting access to the adjacent properties. Redevelopment of several properties, particularly at 464-470 King Street can facilitate this road work. However, coordination will be required between Council and the developers to ensure opportunities are maximised. The trapped low point in front of 498 King Street cannot be removed by raising the road level due to the current floor and threshold level. Flooding in the vicinity of this low point can only be addressed by improving the downstream drainage. There may be an opportunity to accommodate the existing or residual flooding in this location by providing a rain-garden bioretention basin at the north-western intersection of King Street and National Park Street. This work would be best implemented during future upgrades to King Street or Birdwood Park. Although Option A is predicted to reduce inundation depths during all events up to the 10% AEP event, the TUFLOW model indicates that this option is not predicted to remove inundation from King and Steel Streets completely. While the modelling presented does not strictly meet Council’s design intent of conveying the 10% AEP event via the drainage system, there are limitations to the modelling approach that need to be considered when interpreting the results, namely:
As outlined in Section 2.3.2, stormwater pipe alignments, diameters and invert levels across most sections of Newcastle West were defined based upon information provided by Council in GIS format. In some instances, the pipe network was discontinuous, no pit and pipe invert elevations were supplied and the reliability of the remaining information is unknown. Therefore, assumptions were required to define the stormwater system across some areas. Accordingly, further survey is recommended to confirm pipe alignments, diameters and inverts if this option is pursued to confirm the performance of the existing system and facilitate the preparation of design plans.
The modelling does not include all down pipes or inter-allotment drainage that generally discharge directly into Council’s stormwater network. Therefore, the modelling likely overestimates the amount of flow travelling overland.
Cost Excluding contaminated land management and any tipping costs, the costs of the proposed upgrades are in the order of $1.6 million which includes 30% contingency. A detailed breakdown of costs is provided in Appendix E.

Newcastle West Drainage Study
32
3.3.2 Option B - Stormwater upgrades and Regrading in National Park, Hunter and Bellevue Streets
Description of Option Option B includes stormwater upgrades in National Park and Hunter Streets as well as regrading of National Park, Hunter and Bellevue Streets to provide an overland flow path. The regrading would involve reducing the level of the crown in Hunter Street to encourage ponding water to escape in a major storm events and reduce flood depths in National Park Street. The overland flow path would ultimately convey flows into Cottage Creek between buildings located at 738 Hunter Street and 25 Bellevue Street. The drainage upgrades include replacing the existing stormwater pipes with a new, larger pipe and pit system network between the trapped low point in National Park Street and the Hunter Street bridge. A summary of the extent of works that would be completed as part of Option B is summarised in Table 8 and concept design plans are included in Appendix D.
Hydraulic Benefits Peak floodwater depth mapping for the 20%, 10% and 1% AEP events with Option B in place are presented in Figures B1 to B3 in Map Set B. Peak velocity depth product results were also extracted from the modelling results and are presented in Figures B4 to B6. Flood level difference mapping for each event is also presented in Figures B7 to B9 and VxD difference mapping is presented in Figures B10 to B12. Figures B7 to B9 shows that Option B is predicted to generate reductions in water levels during each design flood in the vicinity of National Park and Hunter Streets. The benefits are most significant during the 10% AEP (reduction in water level of ~0.2m) where the regrading will assist in conveying previously trapped water towards Cottage Creek. Reductions in water level are predicted as far upstream as King Street during the 1% AEP event. The difference mapping does indicate that additional areas would be inundated with Option B (refer magenta areas), however, this additional inundated area is contained within roadways. Figures B10 and B11 show that VxD is predicted to remain largely unchanged as a result of Option B during the 20% and 10% AEP floods. Figure B12 shows some small reductions in VxD along King, National Park, Hunter and Bellevue Streets during the 1% AEP flood. The difference maps also indicate that inundation extents are predicted to increase around the National Park Street / Hunter Street intersection and in Bellevue Street during each design flood as a result of Option B. However, these inundation increases are contained within roadways. Furthermore, Figure B6 shows that the VxD is not predicted to exceed 0.4 m2/s across any of these newly inundated areas indicating that Option B would not expose pedestrians to a significant flood risk.
Recommendation: Option A only affords significant benefits during more frequent rainfall events. However, given that it affords benefits across arguably the most problematic section of Newcastle West, it is considered appropriate to pursue this option.

Newcastle West Drainage Study
33
Table 8 Option B Design Overview
Option B Design Overview
Design Concept
Option B is expected to include the following works:
Removal of existing stormwater pipes and pits within National Park and Hunter Streets
Installation of following stormwater infrastructure along National park and Hunter Streets: - 118 metres of 375mm dia stormwater pipes - 54 metres of 450mm dia stormwater pipes - 167 metres of 600mm dia stormwater pipes - 25 metres of 825mm dia stormwater pipes - 9 stormwater pits with 1.2m lintel and 600mmx450mm grate
Regrading along National Park Street, Hunter Street and Bellevue Street
Relocation of services along National Park Street, Hunter Street and Bellevue Street
Construction of central medians and pipe drainage
Identified Constraints and
Issues
Heritage buildings located near the corner of Hunter and Belleview Streets
Access to existing properties must be preserved which will limit the road regrading that can be undertaken
Traffic disruption during construction
Significant relocation of services
Risks / Unknowns Details of the existing stormwater system are not fully known, which may
alter the hydraulic performance of the existing and upgraded system
Services
Cost $2.3 million
Hydraulic Benefit
1% AEP Levels: Reduction of up to 0.15m near in National Park St. Small reductions in
Hunter Street and Bellevue Street
VxD: Reduction of up to 0.05m2/s in National Park St and Hunter St
10% AEP Levels: Reduction of up to 0.2m in National Park St with some minor
reductions in Hunter Street and Bellevue Street
VxD: Negligible changes in VxD
Further Investigations
Survey of existing services and stormwater system in National Park, Hunter and Bellevue Streets
Preparation of detailed design plans & cost estimates
Constraints and Opportunities Access to the many businesses that front onto the area must be preserved. This includes some heritage buildings at the corner of Hunter and Belleview Streets. The narrow nature of the footpath in this area and existing level of property thresholds limits the amount by which Hunter Street can be modified. A new road design has been developed that complies with current road grading standards and would result in the elevation of the existing crown in Hunter Street being reduced by 150 to 200mm. Hydraulic modelling using DRAINS software demonstrates that stormwater drainage upgrades along Hunter Street can convey the 10% AEP event, however the models predict that approximately 0.2 metres of ponding would remain in National Park Street during a 10% AEP event. This ponding is also evident in the TUFLOW modelling results. This is mostly due to the
Newcastle West Drainage Study
34
low-lying nature of National Park Street and elevated tailwater levels in Cottage Creek. To fully remove the ponded water at this location would require more substantial drainage upgrades which may be difficult to accommodate within the available space.
Cost Excluding contaminated land management and tipping costs, the costs of the proposed upgrades are in the order of $2.3 million. A detailed breakdown of costs is provided in Appendix E.
3.3.3 Option C - Regrading from King Street north along Steel Street towards Newcastle Harbour
Description of Option The “Waterfront and Cottage Creek Flood Management Plan” (Lawson & Treloar, 1996) identified Steel Street as an emergency overland flow path through the Civic and Honeysuckle precinct. Redevelopment of the Civic precinct has occurred since this time and the overland flow path is currently blocked by elevated road levels to the north of the Steel Street and Hunter Street intersection. Option C involves reinstating this overland flow path. It would involve regrading Steel Street from its intersection with King Street north across Hunter Street and the light rail line to Honeysuckle Drive. It is expected that regrading north from Honeysuckle Drive to Newcastle Harbour will also be completed as part of this option to provide a continuous overland flow path from King Street to the harbour. Concept design plans, including longitudinal sections and cut/fill extents, for Option C are provided in Appendix D. A summary of the extent of works that would be completed as part of Option C is also summarised in Table 9.
Hydraulic Benefits Peak floodwater depth mapping for the 20%, 10% and 1% AEP events with Option C in place are presented in Figures C1 to C3 in Map Set C. Peak velocity depth product results were also extracted from the modelling results and are presented in Figures C4 to C6. Flood level difference mapping for each event is also presented in Figures C7 to C9 and VxD difference mapping is presented in Figures C10 to C12. Figures C7 to C9 show that Option C is predicted to produce reductions in water levels and extents near the King Street and Steel Street intersection for all events up to and including the 1% AEP event. Moreover, reductions in water level of around 0.1 metres are predicted during the 1% AEP event around the Hunter Street and Steel Street intersection. In general, the flood level reductions are most significant during the larger events where the regrading directs a greater proportion of runoff overland towards Newcastle Harbour. The flood level difference mapping shows that flood levels and inundation extents are predicted to increase in some areas
Recommendation: Option B affords hydraulic benefits during each flood event although the reductions in water level are typically small. However, the benefits are predicted to extend across a wide area during the 1% AEP flood, including King Street. Therefore, it is considered appropriate to pursue this option.

Newcastle West Drainage Study
35
as a result of the regrading, most notably the northern end of Steel Street, around the former railway line and parts of Honeysuckle Drive.
Table 9 Option C Design Overview
Option C Design Overview
Design Concept Option C involves extensive regrading along Steel Street from King Street to Newcastle Harbour.
Identified Constraints and
Issues
Access to existing properties must be preserved. To achieve the necessary reductions in road elevations along Steel Street, parking spaces and turning lanes will be lost by extending the footpath into the outer trafficable lanes
Existing trees along Steel Street
Traffic disruption during construction
Services (most notably, sewer)
Risks / Unknowns Grade changes associated with light rail
Contaminated land within foreshore
Cost $3.0 million
Hydraulic Benefit
1% AEP Levels: Reduction of up to 0.15m near in National Park St. Small reductions in
Hunter Street and Bellevue Street
VxD: increases in VxD of over 0.2 m2/s across some sections of Steel Street
10% AEP Levels: Reduction of up to 0.2m in National Park St with some minor
reductions in Hunter Street and Bellevue Street
VxD: Negligible changes in VxD
Further Investigations
Not recommended for implementation. No further investigations considered necessary
Figure C10 show that Option C will not produce a significant change in VxD across Newcastle West during the 20% AEP event. However, Figure C12 shows that the regrading will produce notable increases in VxD during the 1% AEP flood along Steel Street (generally > 0.2 m2/s). These increases are predicted to produce a total VxD between Hunter Street and the railway line of over 0.4 m2/s indicating that this area may be unsafe for pedestrians. However, it should be noted that this higher hazard area is contained within the roadway (i.e., adjoining footpath areas are predicted to remain below 0.4 m2/s). Figure C12 also shows that Option C will direct less flow along the Cottage Creek channel. This is predicted to provide a small benefit in Hunter / Bellevue Streets where the improved overland flow conveyance down Steel Street reduces the amount of water travelling overland to this location. Overall, Option C will provide some significant reductions in flood levels during larger floods (e.g., 1% AEP event). However, only relatively small benefits are predicted during more frequent inundation events. To provide greater hydraulic benefits during smaller events it would be necessary to implement this option in conjunction with drainage upgrades (e.g., Option A).

Newcastle West Drainage Study
36
Constraints and Opportunities Steel Street currently grades up towards the north, which is counter to the desired overland flow path. In order to reverse the grade of Steel Street and fall the overland flow path to the north, a significant amount of regrading is required which will alter the road geometry. There are three driveways to buildings on Steel Street that must be preserved. Two of these occur in the location of the largest proposed level change (near the railway line). These can be preserved by widening the footpath and providing constant fall from the property line towards the road centre. In some areas, the footpath may also require terracing with low retaining walls that can be landscaped to manage trip hazards. The widening of the footpath will extend into the outermost lanes of Steel Street and would result in the loss of:
1. Dedicated left turn lane out of Steel Street into Hunter Street to the east and to the west
2. Six parking spots along Steel Street to the south of Hunter Street
3. Five parking spots along Steel Street to the north of Hunter Street A sewer runs north along Steel Street between Hunter and King Streets, and would need to be lowered or realigned within the road reserve. There are several large trees between King Street and Hunter Street that can be retained by tiering along the existing gutter line. These trees will preclude the relocation of the sewer behind the kerb line. Associated road works will cause significant traffic disruptions at King Street and Hunter Street which form a significant access route to the West End shopping district. The overland flow path must cross the light rail corridor. It is understood that the proposed levels of the crossing match the existing levels of the rail corridor in this location. Therefore, it was assumed that elevations in the vicinity of the light rail would remain unchanged. However, this will need to be confirmed upon receipt of the final design plans for the light rail. Although regarding of the full length of Steel Street north of King Street is unlikely to be viable, opportunities to regrade the area between Honeysuckle Drive and the harbour should be explored as part of the future development of the harbour foreshore. This will assist in conveying flows that are currently trapped at the “sag” point at the Honeysuckle Drive / Steel Street intersection into the harbour.
Cost Excluding contaminated land management, the costs of the proposed road works and service realignment are in the order of $3.0 million.
Recommendation: Option C only provides significant hydraulic benefits during larger floods. It is also likely to present some construction challenges, will disrupt traffic during construction and will reduce the available roadway area. Therefore, Option C is unlikely to be viable. However, opportunities for regrading between Honeysuckle Drive and the harbour should be explored as part of the redevelopment of the harbour foreshore.

Newcastle West Drainage Study
37
3.3.4 Option D - New Culvert from Cottage Creek running north along Steel Street to Newcastle Harbour
Description of Option Option D would involve creating a new culvert to provide additional underground drainage capacity to convey stormwater directly to Newcastle Harbour from upstream of King Street. This option is an alternative to an overland flow path as described by Option C. The proposed pipe alignment is shown in Plate 19.
Plate 19 Proposed alignment of new culvert along Steel Street looking south from Newcastle Harbour
This culvert would be constructed within Steel Street and would not require regrading of the overland flow path. It is likely that the current drainage system near the intersection of King Street and Steel Street would need to be modified to drain directly into the new culvert. This should assist in improving drainage from the trapped low point at the corner of King Street and Steel Street. Ideally the new culvert would have capacity to convey all flows in excess of the channel capacity up to the 1% AEP event. A 1.2 metre and 1.8 metre pipe culvert were initially considered. However, twin 1.2 metre diameter pipes were considered more suitable with the current channel invert elevation and limited amount of cover that would be available near the intersection of King and Steel Streets. A summary of the extent of works that would be completed as part of Option D is summarised in Table 10.

Newcastle West Drainage Study
38
Table 10 Option D Design Overview
Option D Design Overview
Design Concept Option D involves construction of a new headwall within the Cottage Creek channel upstream of the King Street culvert and construction of a new twin 1.2 metre diameter pipe culvert along Steel street discharging into Newcastle Harbour.
Identified Constraints and
Issues
Access to existing properties must be preserved. To achieve the necessary reductions in road elevations along Steel Street, parking spaces and turning lanes will be lost by extending the footpath into the outer trafficable lanes
Services (most notably, sewer)
Traffic disruption during construction
Potential historical contamination within wharf roads
Difficult construction conditions at seawall
Risks / Unknowns Contaminated land within foreshore
Cost $11.2 million
Hydraulic Benefit
1% AEP
Levels: Reduction of up to 0.27m near King St /Steel St intersection. Reductions of less than 0.1 m along Cottage Creek, Marketown Shopping Centre and King St west of Cottage Ck
VxD: increases in VxD of up to 0.2 m2/s along Cottage Ck north of King Street and increases of up to 0.35 m2/s along Cottage Creek south of King Street. Small reductions in VxD across King Street and Marketown Shopping Centre
10% AEP
Levels: Reduction of up to 0.21m near King St /Steel St intersection and reductions of up to 0.15m along Cottage Ck.
VxD: Reductions in VxD of up to 0.33 m2/s along Cottage Creek. Negligible changes across roadways
Further Investigations
Not recommended for implementation. No further investigations considered necessary
Hydraulic Benefits Peak floodwater depth mapping for the 20%, 10% and 1% AEP events with Option D in place are presented in Figures D1 to D3 in Map Set D. Peak velocity depth product results were also extracted from the modelling results and are presented in Figures D4 to D6. Flood level and VxD difference mapping for each event is also presented in Figures D7 to D12. Figures D7 to D9 show that Option D will reduce peak design flood levels by over 0.2 metres in the vicinity of Steel and King Streets during each design flood. Inclusion of the new culvert is also predicted to reduce flood levels along Cottage Creek during all design events. Figure D9 shows that during the 1% AEP flood, the flood level reductions are also predicted to extend across the Marketown Shopping Centre as well as King Street west of Cottage Creek. Figures D10 to D12 show that Option D will generally reduce the VxD along the Cottage Creek channel north of King Street during each design event. An increase in VxD is predicted along the Cottage Creek channel south of King Street and is associated with increased flow along this channel section facilitated by the new culvert immediately downstream. Changes in VxD across each of the major roadways is negligible during the 20% and 10% AEP, although some notable
Newcastle West Drainage Study
39
reductions are evident across the Marketown Shopping Centre car park as well as part sections of King Street during the 1% AEP event. Figures D1 and D2 show that, although Option D is predicted to reduce flood levels and flow velocities during each of the simulated design, inundation of many roadways across Newcastle West is still anticipated during each event (most notable King Street west of Cottage Creek).
Constraints and Opportunities Given the pipe length (420m) and the potential disruption to local roads associated with construction, it is preferable to place the culvert using micro tunnelling / pipe jackings. Launch pads would be required in three locations; at the King Street headwall, within the adjacent McDonalds carpark and near the discharge location. In general, pipe jacking is only suitable for larger pipe sizes (e.g., 1.8m diameter) when only limited cover is available (as would be the case around King and Steel Streets). However, a 1.8m diameter pipe is likely to be too large to be accommodated. Therefore, if the twin 1.2m diameter pipes were pursued, it would likely be necessary for the first half of the pipe to be placed through open excavation. This would cause significant disruption to local traffic around King and Steel Streets. As mentioned above, a sewer runs north along Steel Street between Hunter and King Streets, and would need to be lowered or realigned within the road reserve as part of this option. The location of the proposed headwall is tidally affected and the entry to the culvert would need to be set down below the channel base to provide sufficient cover over the pipe at the corner of Hunter Street and Steel Street. This configuration reduces the inlet efficiency, reducing the hydraulic performance of the option. The outlet of the pipe would be submerged at mid to high tide levels and would be completely flooded for the Hunter River tail water condition adopted as part of this study. Therefore, the effectiveness of this option is significantly reduced with increasing harbour water levels. Accordingly, potential future sea level increases may limit the feasibility of this option in providing a significant hydraulic benefit. Construction of the pipe headwall outlet is difficult and may be further constrained by the potential presence of any contaminated material found in the excavation zone.
Cost Excluding service realignment, sea wall construction, contaminated land management and tipping costs, the costs of the proposed upgrades are in the order of $11.2M.
Recommendation: Option D affords some significant hydraulic benefits during smaller flood events. However, the construction difficulties, very high capital cost and the relatively localised hydraulic benefits indicates that Option D is not worth pursuing.

Newcastle West Drainage Study
40
3.3.5 Option E - Widen Cottage Creek channel between King St and Newcastle Harbour
Description of Option Option E will involve widening the existing cottage Creek channel north from King Street to Honeysuckle Drive and upgrading of the Honeysuckle Drive culvert and reinstatement of an open channel from Honeysuckle Drive to Newcastle Harbour. The upgrade will include the following components:
Increasing the width of the Cottage Creek channel between King Street and Honeysuckle Drive.
Upgrading railway bridge and Honeysuckle Drive culvert
Construction of a new open channel from Honeysuckle Drive to Newcastle Harbour. For the purposes of this assessment, it was assumed that a concrete channel would be implemented (i.e., similar to the arrangement for the upstream channel segments of Cottage Creek).
Details of the proposed light rail bridge crossing of Cottage Creek were provided by Council. The plans indicate that a new, higher two span bridge crossing supported on a central pier is proposed at this location as part of the light rail project. The information contained in the design plans was used as basis for including the new bridge crossing of Cottage Creek as part of Option E. However, as noted above, the central island was removed to increase the conveyance capacity through the bridge. As discussed in Section 2.3.5, Hunter Water are currently working with other stakeholders regarding the building located at 681 Hunter Street, which directly overlies Cottage Creek. The long term preferred solution is to remove the building. Therefore, it was assumed that this building would also be removed as part of Option E A summary of the extent of works that would be completed as part of Option E is summarised in Table 11 and concept design plans are included in Appendix D.
Hydraulic Benefits Peak floodwater depth mapping for the 20%, 10% and 1% AEP events with Option E in place are presented in Figures E1 to E3 in Map Set E. Peak velocity depth product results were also extracted from the modelling results and are presented in Figures E4 to E6. Flood level and VxD difference mapping for each event is also presented in Figures E7 to E12. Figures E7 and E8 show that Option E is predicted to generate reductions in water level that are generally concentrated along the Cottage Creek channel during the 20% and 10% AEP. During the 1% AEP event, flood level reductions are predicted to extend well beyond the Cottage Creek channel and into King Street and Steel Street as well as across the Marketown Shopping Centre and into Parry Street (refer Figure E9). Flood level reductions across most of these areas are predicted to exceed 0.2 metres during the 1% AEP event indicating that the reduced water levels within Cottage Creek are predicted to increase the efficiency of the existing drainage system. Figures E10 to E12 show that Option E is predicted to produce some significant changes in VxD. During the 20% AEP and 10% AEP floods, the differences are contained to the Cottage Creek

Newcastle West Drainage Study
41
channel and are predicted to exceed -1 m2/s at some locations. During the 1% AEP flood, the VxD reductions are predicted to exceed 0.2 m2/s across a significant portion of King Street and the Marketown Shopping area.
Table 11 Option E Design Overview
Option E Design Overview
Design Concept
Option E involves the following works along Cottage Creek north of King Street:
Increasing the typical width of the Cottage Creek channel between King Street and Hunter Street from 10 metres to 12 metres.
Increasing the typical width of the Cottage Creek channel between Hunter Street and the light rail line from 10 metres to 13 metres.
Removing the existing “island” beneath the railway line.
Increasing the typical width of the Cottage Creek channel between railway line and Honeysuckle Drive from 9.5 metres to 15 metres.
Upgrading the existing Honeysuckle Drive culvert from a 9m x 2.1m culvert to a 14.5m x 2.1m culvert/bridge.
Construction of a new open channel from north of Honeysuckle Drive to Newcastle Harbour. The channel would be approximately 25metre wide.
Replacement of existing floating trash boom
Identified Constraints and
Issues
Land acquisition
Approvals to carry out works on a HWC asset
Structural issues of adjoining properties
Potential historical contamination along foreshore
Potential aboriginal artefacts within works area
Difficult construction conditions at seawall
Risks / Unknowns Structural feasibility of works
Contaminated land within foreshore.
Cost $7.5 million
Hydraulic Benefit
1% AEP
Levels: Reductions of over 0.5m along Cottage Creek. Typical reductions of between 0.1 and 0.3m across Steel St, King St & Marketown Shopping Centre
VxD: increases in VxD of over 1 m2/s along Cottage Ck south of King Street and decreases of over 1 m2/s along Cottage Creek north of King Street. Small reductions in VxD (typically less than 0.1 m2/s) across King Street and Marketown Shopping Centre
10% AEP
Levels: Reductions of around 0.1m along Cottage Ck. Very small reductions (~0.01m) across adjoining roadways.
VxD: Decreases of over 1 m2/s along Cottage Creek north of King Street. Negligible changes across roadways
Further Investigations
Open discussions with Hunter Development Corporation.
Open discussions with Hunter Water Corporation to discuss the implications of carrying out works on their asset.
Confirm who is the owner of the existing Honeysuckle Drive culvert
Open discussions with adjacent property owners where land take is required.
Commission a structural investigation of adjacent buildings to determine the structural feasibility of widening the channel.

Newcastle West Drainage Study
42
Therefore, Option E appears to afford some notable reductions in flood levels and VxD during all events, particularly along the Cottage Creek channel. However, the hydraulic benefits are most evident during the 1% AEP flood where the flood level reductions are predicted to extend well beyond the Cottage Creek channel. Unfortunately, Figures E7 and E8 shows that there are predicted to be negligible reductions in overland flood levels/depths in areas away from Cottage Creek during the 20% and 10% AEP events. A review of the modelling results indicates that peak pipe / overland flows across Newcastle West occur before the peak flows / water levels along Cottage Creek. Further interrogation of the model results shows that the flood level reductions along Cottage Creek shown in Figures E7 and E8 are not as substantial at the time of peak pipe outflow resulting in minimal overall improvements in pipe flows and reductions in overland flow depths. Therefore, Option E is not predicted to afford significant improvements in overland flood levels during frequents rainfall events. Impact of Alternate Downstream Channel Treatments As discussed, it was assumed that the proposed open channel between Honeysuckle Drive and Newcastle Harbour would comprise a concrete lining. The aesthetics of such an arrangement are considered to be poor. Therefore, the potential impact associated with adopting alternate downstream channel treatments was also explored. This options considered as part of this assessment included:
Option E1: New open channel with vegetated/rock lined base and slide slopes. For the purposes of this assessment, it was assumed that the channel base comprised rock armour with reeds/phragmites (n=0.06) and the side slopes comprised rock with shrubs (n=0.08);
Option E2: No open channel (i.e., the new, widened culvert extends from Honeysuckle Drive to Newcastle Harbour);
Revised 1% AEP simulations were completed with the alternate downstream channel arrangements. The peak water level results from the revised simulations were compare against the results from the concrete lined channel simulations to prepare flood level difference maps. The flood level difference map for Option E1 is provided in Plate 20 and the difference map for Option E2 is provided in Plate 21. Shades of orange/red indicate that the modified channel arrangement is predicted to increase 1% AEP flood levels relative to the concrete lined channel arrangement. As shown in Plate 20, replacing the concrete lined channel with a vegetated/rock protected channel will increase flood levels along Cottage Creek from the harbour upstream to the Steel Street/Marketown culvert. The magnitude of these increases varied between 0.35m near the harbour to 0.15m near Marketown, and are mainly concentrated along the main channel. Negligible impacts are predicted away from the channel. Plate 21 shows that removing the downstream channel and replacing it with a widened culvert is predicted to decrease flood levels along Cottage Creek from Honeysuckle Dr upstream to the Steel St/Marketown culvert. The magnitude of these decreases generally varies between 0.10m and 0.15m.

Newcastle West Drainage Study
43
Plate 20 1% AEP flood level difference map for Option E1
Plate 21 1% AEP flood level difference map for Option E2

Newcastle West Drainage Study
44
Therefore, a heavily vegetated open channel is predicted to increase flood levels, but is likely to provide increased visual amenity. Conversely, an upgraded culvert is predicted to reduce flood levels but will arguably reduce visual amenity north of Honeysuckle Drive. It is considered that an optimal solution for this section of the upgrade could be determined once the additional detailed investigations are completed and the extent/feasibility of the potential widening is more fully understood.
Constraints and Opportunities A significant constraint to this option is the proximity of buildings to the channel. A detailed structural assessment is required to understand whether there is surcharge of load from the adjacent buildings onto the channel itself and the feasibility of the works from a structural perspective. Preliminary discussions with structural engineers indicate that the widening of the channel would likely require:
anchoring the opposite channel wall to resist movement during construction
sheet piling along the proposed channel wall alignment
demolition of the existing channel wall, footing and slab
earthworks and channel shaping
construction of new channel comprising slab and retaining wall
provide batter slope and landscaping as required. A major benefit of this option is that the channel capacity can be increased with a small increase in footprint and without major disruption to public roads and underground services. Council also plans to replace the existing Hunter Street bridge crossing of Cottage Creek. The stormwater capacity mapping indicates that the existing crossing has greater than a 1% AEP capacity and the proposed upgrade will not reduce this capacity. Therefore, the hydraulic benefits documented in this report for Option E is unlikely to change significantly as a result of the proposed replacement. Nevertheless, opportunities to integrate the proposed bridge replacement and channel widening to the north of Hunter Street should be explored. It is noted that there are a number of potential constraints and unknowns associated with this option. Further investigations are recommended to confirm the nature and extent of these constraints to confirm the feasibility of Option E and the potential extent of works. If these investigations determine that some components of Option E may not be practical, the potential incremental benefits of implementation of part sections of the option could be investigated. For example: 1. Elevate railway bridge only and remove the existing island
2. Elevate railway bridge and remove the existing island, upgrade Honeysuckle Drive culvert and culvert from Honeysuckle Drive to the Harbour.
3. Elevate railway bridge and remove the existing island, upgrade Honeysuckle Drive culvert and culvert from Honeysuckle Drive to the Harbour, upgrade open channel from railway bridge to Honeysuckle Drive.
4. Elevate railway bridge and remove the existing island, upgrade Honeysuckle Drive culvert and culvert from Honeysuckle Drive to the Harbour, upgrade open channel from railway bridge to Honeysuckle Drive, upgrade open channel from Hunter Street to the railway bridge.

Newcastle West Drainage Study
45
Cost Excluding contaminated land management, land acquisition and underpinning adjacent buildings, implementation of the channel and Honeysuckle Drive culvert is likely to cost in the order of $7.5 million.
3.4 Miscellaneous Options
It is noted that flooding during the 2007 event was exacerbated due to blockage of bridges and culverts across Newcastle West (in particular, the Hunter Street bridge). The outcomes of a blockage assessment completed as part of this study indicates that there is only a relatively small chance of blockage of bridges and culverts across Newcastle West based on debris that is mobilised from a typical urban catchment (e.g., fence palings, garbage bins). Nevertheless, based on past experiences, there is potential for non-typical urban debris (e.g., shipping containers) to cause significant blockage of structures. Although it will not reduce the existing flooding/drainage problems, it is recommended that debris control structures be investigated to reduce the potential for blockage and ensure the existing drainage problem is not increased. A suitable location for the debris control structure(s) may be within National Park. Controls may also need to be explored by Council for any construction activities in the vicinity of Cottage Creek to reduce the potential for debris to be mobilised leading to blockage of downstream structures. Similarly, regular maintenance of the stormwater drainage system is recommended to remove debris from stormwater inlets (particularly at local sag points) and ensure the full capacity of the existing stormwater system is available during future floods.
3.5 Recommendations
Based upon the assessment of costs, hydraulic benefits and potential constraints, it is recommended that the following options be investigated in detail to assist in reducing the existing flooding and drainage problems across Newcastle West:
High Priority: Option E - Widen Cottage Creek channel between King St & Newcastle Harbour.
Medium Priority: Option A – Stormwater upgrades and regrading in King Street.
Low Priority: Option B - Stormwater upgrades and regrading in National Park, Hunter and Bellevue Streets.
With the ongoing redevelopment across Newcastle West, there may be opportunities to Stage the implementation of Option E in line with adjoining developments/redevelopments. For example:
Recommendation: There are several unknowns associated with Option E and the capital cost is significant. However, it provides some significant hydraulic benefits, particularly during large events. Therefore, it is considered appropriate to pursue this option.

Newcastle West Drainage Study
46
Channel upgrades between King and Hunter Streets could be completed in conjunction with redevelopment of 464-470 King Street and/or Hunter Street bridge upgrades.
Channel upgrades around the light rail line could be completed in conjunction with light rail construction.
Channel upgrades north of Honeysuckle Drive could be completed in conjunction with the proposed development of the harbour foreshore area.
It is noted that none of the options considered as part of the assessment fully meet Council’s design objectives in isolation. Nevertheless, Options A and B will typically contain water below the top of kerb during all events up to and including the 10% AEP event. It is likely that the water level reductions afforded by Option E would further improve the efficiency of any drainage upgrades.

47
4 CONCLUSION Newcastle West can be subject to inundation during heavy rainfall within the Cottage Creek catchment. This can result in roadways being cut, cars and properties being inundated and, during extreme events, it may pose a risk to personal safety. This report presents the outcomes of a drainage study for Newcastle West. It confirms the inundation problems across Newcastle West, which are largely associated with lack of stormwater drainage capacity (which is further hampered by elevated water levels within Cottage Creek), as well as the topography of the area, which prevents overland flows from freely draining towards Newcastle Harbour (i.e., water becomes trapped in topographic low points). This study has investigated potential options for improving the drainage system across Newcastle West, thereby, aiming to reduce the frequency and severity of inundation depths and extents. A total of five options were investigated in detail as part of the study and included. The detailed assessment considered the potential hydraulic benefits provided by each option as well as estimates of the cost to implement the option and any major constraints that may threaten the implementation of the option. Based on this assessment, the following options were recommended for further perusal:
High Priority: Widen Cottage Creek channel between King St & Newcastle Harbour.
Medium Priority: Stormwater upgrades and regrading in King Street.
Low Priority: Stormwater upgrades and regrading in National Park, Hunter and Bellevue Streets.
Implementation of each option outlined above should assist in reducing inundation depths and extents during both frequent and more significant rainfall events. The analysis of each option included the best available information at the time this report was prepared. Notwithstanding, additional investigations are considered necessary to confirm the viability of each option.

48
5 REFERENCES
Ball J, Babister M, Nathan R, Weeks W, Weinmann E, Retallick M, Testoni I, (Editors) (2016) Australian Rainfall and Runoff: A Guide to Flood Estimation, © Commonwealth of Australia (Geoscience Australia).
BMT WBM (2008). Throsby, Cottage and CBD Flood Study. Prepared for Newcastle City Council.
BMT WBM (2012). Newcastle City-wide Floodplain Risk Management Study and Plan. Final Report. Prepared for Newcastle City Council.
BMT WBM. (2016). TUFLOW User Manual: GIS Based 1D/2D Hydrodynamic Modelling. Build 2016-03-AA
Lawson and Treloar Pty Ltd. (1999). Design Water Level in Newcastle Harbour – Joint Probability Study. Prepared for the City of Newcastle
NSW Government. (2005). Floodplain Development Manual: the Management of Flood Liable Land. ISBN: 0 7347 5476 0
Pilgrim, D H (Editor) 1987, Australian Rainfall and Runoff: A Guide to Flood Estimation, Vol. 1, reprinted 2001 edn, The Institution of Engineers, Australia, Barton, ACT.


![No. 2 – Banora Point West Drainage Scheme · PDF fileSection 94 Plan No. 2 Banora Point West Drainage Scheme [Version 5.0.6] [Indexed July 2016] Page 1 of 27 VERSIONS/EDITIONS](https://img.dokumen.tips/doc/110x75/5a72cea47f8b9a98538df0e6/no-2-banora-point-west-drainage-scheme-section-94-plan-no-2-banora-point.jpg)