Embed Size (px)
Citation preview
“Values from the Past, Experience for the Present, Preparing for the Future”
[email protected] • 8421 Auburn Boulevard • Suite 170 • Citrus Heights, CA 95610 • phone: (916) 910-9345 • fax: (916) 910-9479
PRELIMINARY DRAINAGE REPORT
FOR THE
NEWCASTLE FIRE STATION
OLD STATE HIGHWAY
PREPARED FOR THE
NEWCASTLE FIRE PROTECTION DISTRICT
JULY 2014
BY
ROSEVILLE DESIGN GROUP, INC.
ROSEVILLE DESIGN GROUP, Inc • Established 1979
Planning • Surveying • Architecture
Civil Engineering • Structural Engineering
Contents PROJECT DESCRIPTION ........................................................................................................................... 1
PROCEDURE AND DESIGN CRITERIA .................................................................................................. 1
HYDROLOGY AND DRAINAGE SYSTEM ............................................................................................. 1
PRE-DEVELOPMENT ................................................................................................................................ 1
POST-DEVELOPMENT .............................................................................................................................. 3
CONCLUSSIONS ........................................................................................................................................ 5
STORMWATER QUALITY ........................................................................................................................ 5
Attachments ....................................................................................................................................................
1. Pre-development Calculations ............................................................................................................
2. Shed Map “A” .....................................................................................................................................
3. Post-Development Calculations ..........................................................................................................
4. Shed Map “B” .....................................................................................................................................
5. Vicinity Map .......................................................................................................................................
6. FEMA Map .........................................................................................................................................
7. Excerpts from “Placer County Flood Control and Water Conservation District Stormwater Management Manual.” ........................................................................................................................
Newcastle Fire Station – Preliminary Drainage Report July, 2014 Page 1
PROJECT DESCRIPTION
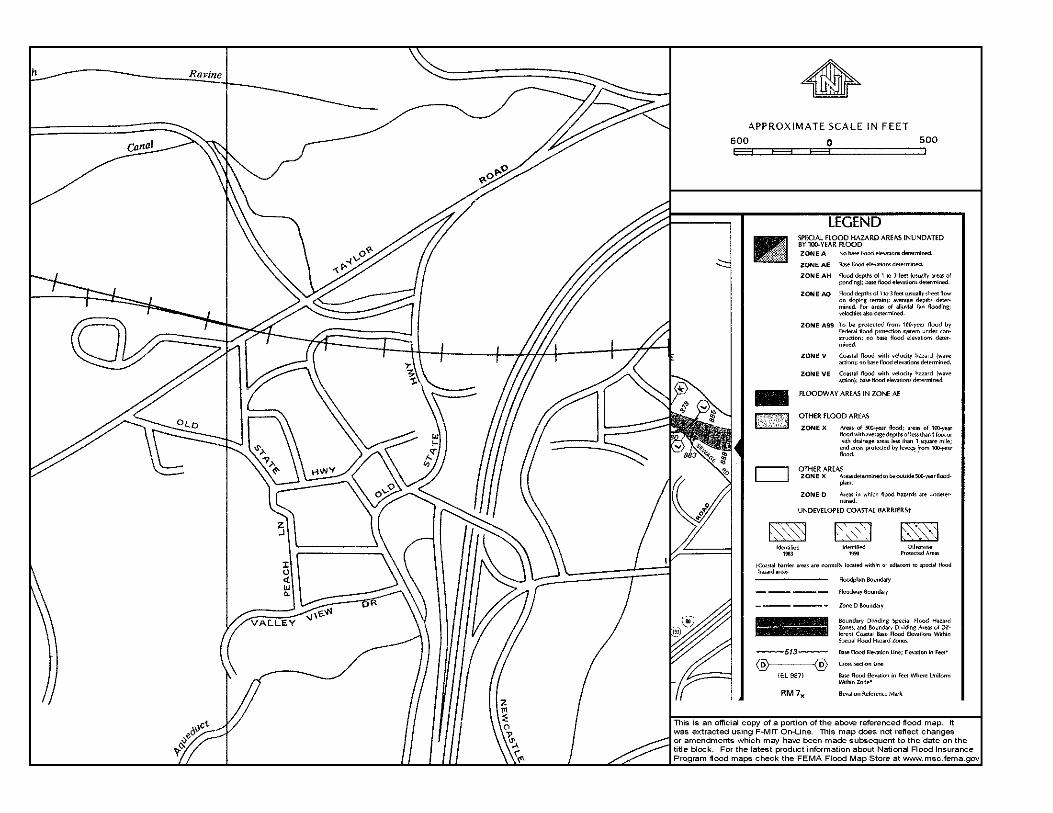
The proposed Newcastle Fire Station is located within half a mile of the existing station in the downtown area of the Town of Newcastle in Placer County, California. The site is located on Old State Hwy at Newcastle Road. The 0.57± acre project is bound by Old State Hwy to the West, Newcastle Road to the south, an industrial parcel owned by Union Pacific Railroad to the north, and Highway 80 to the East.
The property quickly drops off in elevation from Old State Hwy and then gently slopes to the south toward an existing 24 inch diameter culvert on Caltrans property. The highest point of elevation that drains on-site is approximately 928 feet MSL and the lowest point of elevation is approximately 901 feet MSL at the entrance to the culvert.
Development of the project area will consist of removing approximately 50 trees, filling a portion of the site with engineered soil, grading, construction of the Newcastle Fire Station, and paving of a new parking lot. Roseville Design Group, Inc. (RDG) has had preliminary discussions with Caltrans regarding draining post-development storm water flow into their existing 24” diameter culvert.
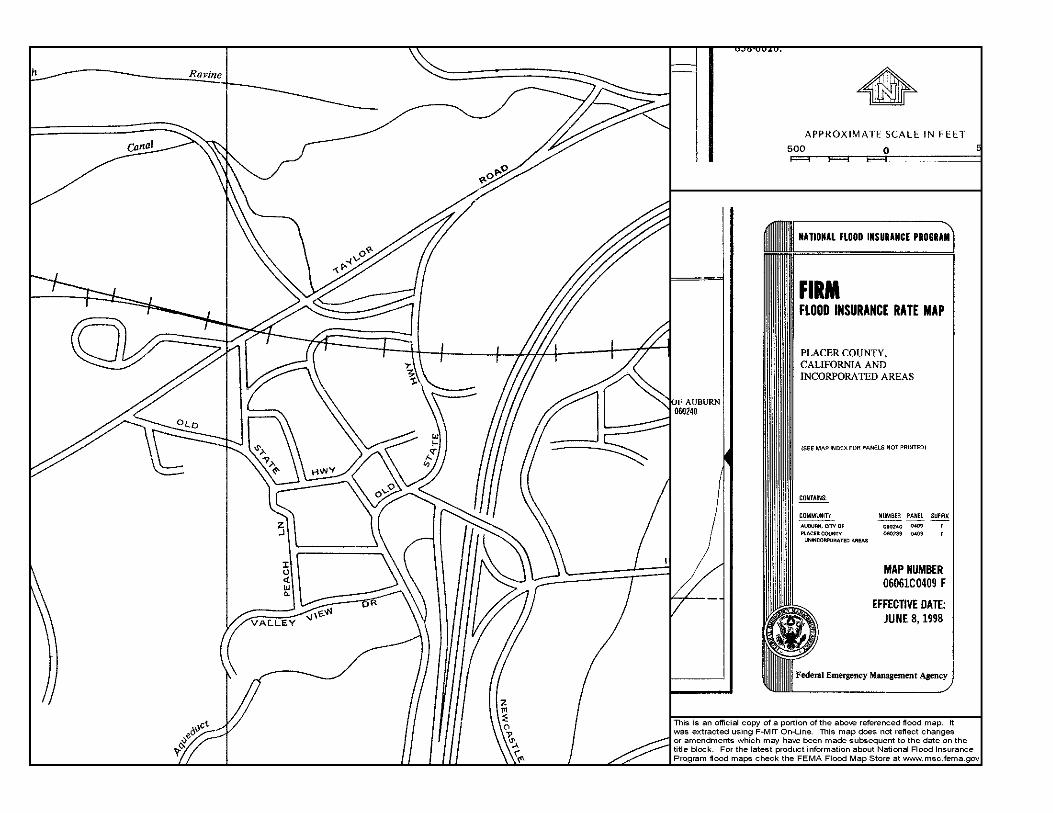
According to FEMA flood insurance rate maps 06061C0409F the property is located outside of the 500-year flood plain (unshaded Zone X).
PROCEDURE AND DESIGN CRITERIA
In accordance with Placer County standards, the Project’s proposed drainage facilities will be designed as follows:
Response times, peak flows, and detention requirements per the Placer County Flood Control and Water Conservation District’s Stormwater management Manual (SWM), version 3, dated February 1990 and October 1994 and 1997 amendments.
HYDROLOGY AND DRAINAGE SYSTEM
The runoff calculations for both the pre-development and post-development phases and the drainage system design for the post-development phase were performed using the Placer County Stormwater Management Manual dated September 1, 1990 (updated February, 1994). Excerpts of the standards are attached. Return periods have been analyzed for the 10-year and 100-year storm events with Hydrologic Soil Group (HSG) type B soils.
PRE-DEVELOPMENT
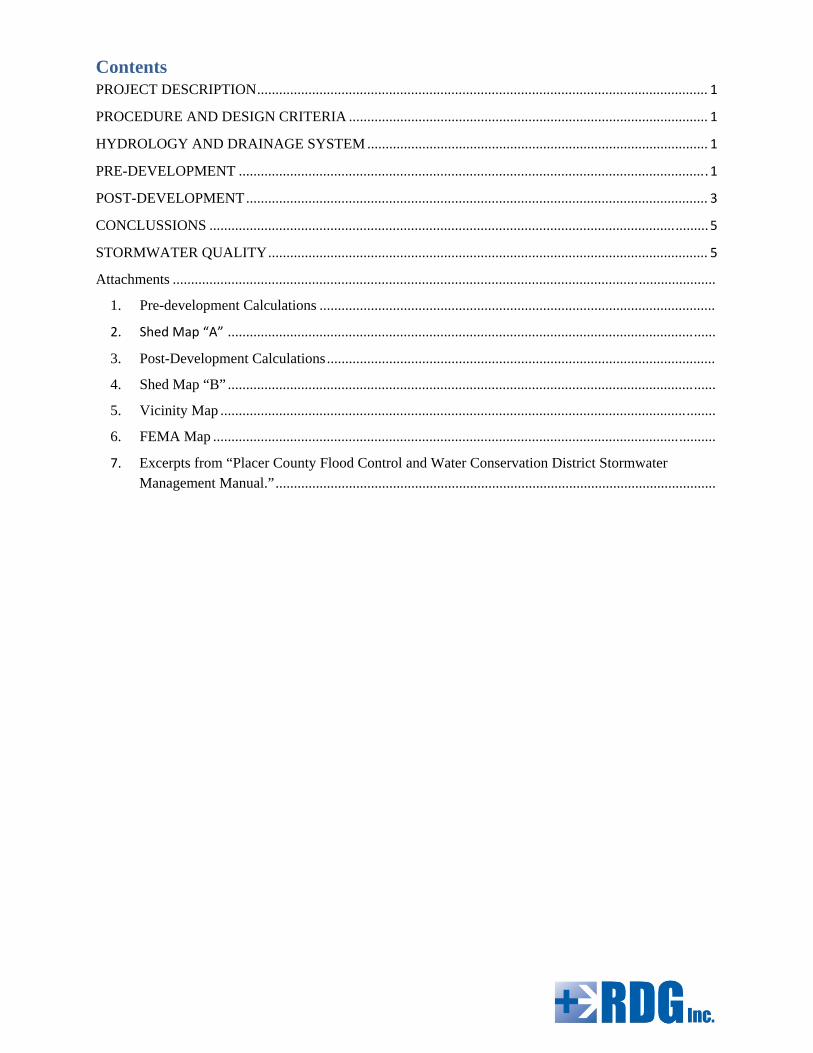
The existing terrain is undeveloped with trees of multiple sizes. Ground cover consists of brush, grasses, and blackberry thickets. The site is depressed approximately 20 feet lower than the surrounding area. Only local runoff drains into the site, then meanders to a 24 inch diameter culvert
Newcastle Fire Station – Preliminary Drainage Report July, 2014 Page 2
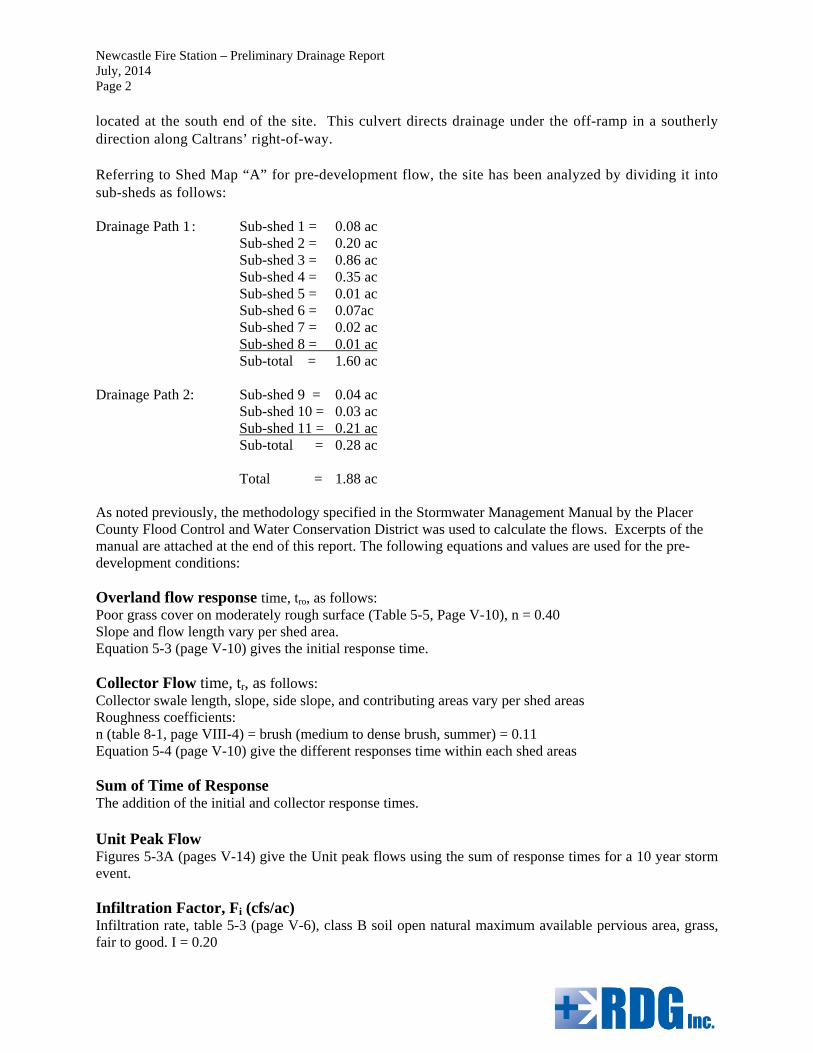
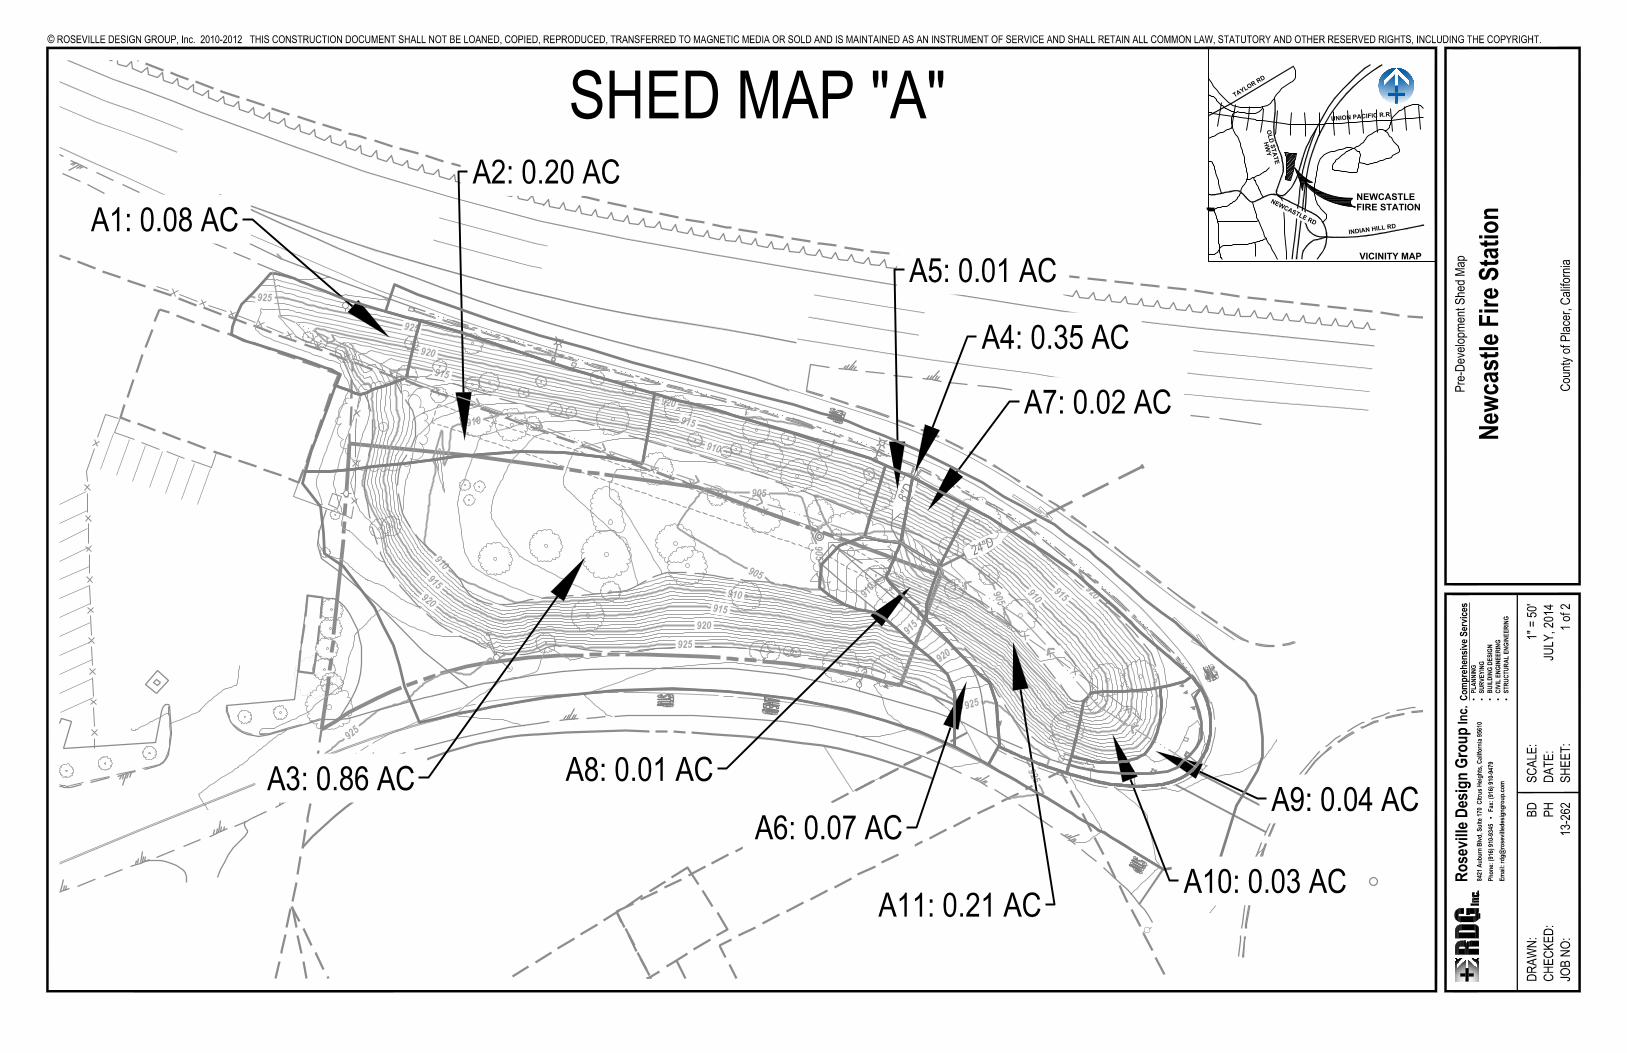
located at the south end of the site. This culvert directs drainage under the off-ramp in a southerly direction along Caltrans’ right-of-way. Referring to Shed Map “A” for pre-development flow, the site has been analyzed by dividing it into sub-sheds as follows: Drainage Path 1 : Sub-shed 1 = 0.08 ac Sub-shed 2 = 0.20 ac Sub-shed 3 = 0.86 ac Sub-shed 4 = 0.35 ac
Sub-shed 5 = 0.01 ac Sub-shed 6 = 0.07ac Sub-shed 7 = 0.02 ac Sub-shed 8 = 0.01 ac Sub-total = 1.60 ac
Drainage Path 2: Sub-shed 9 = 0.04 ac
Sub-shed 10 = 0.03 ac Sub-shed 11 = 0.21 ac Sub-total = 0.28 ac Total = 1.88 ac
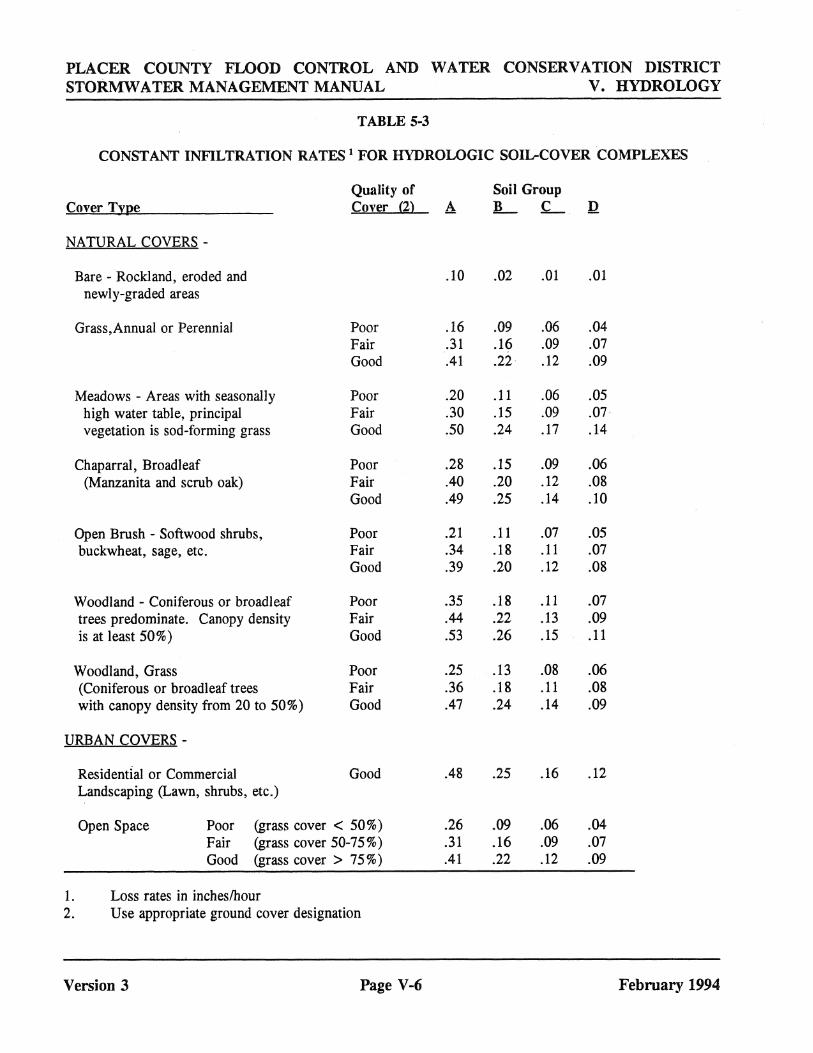
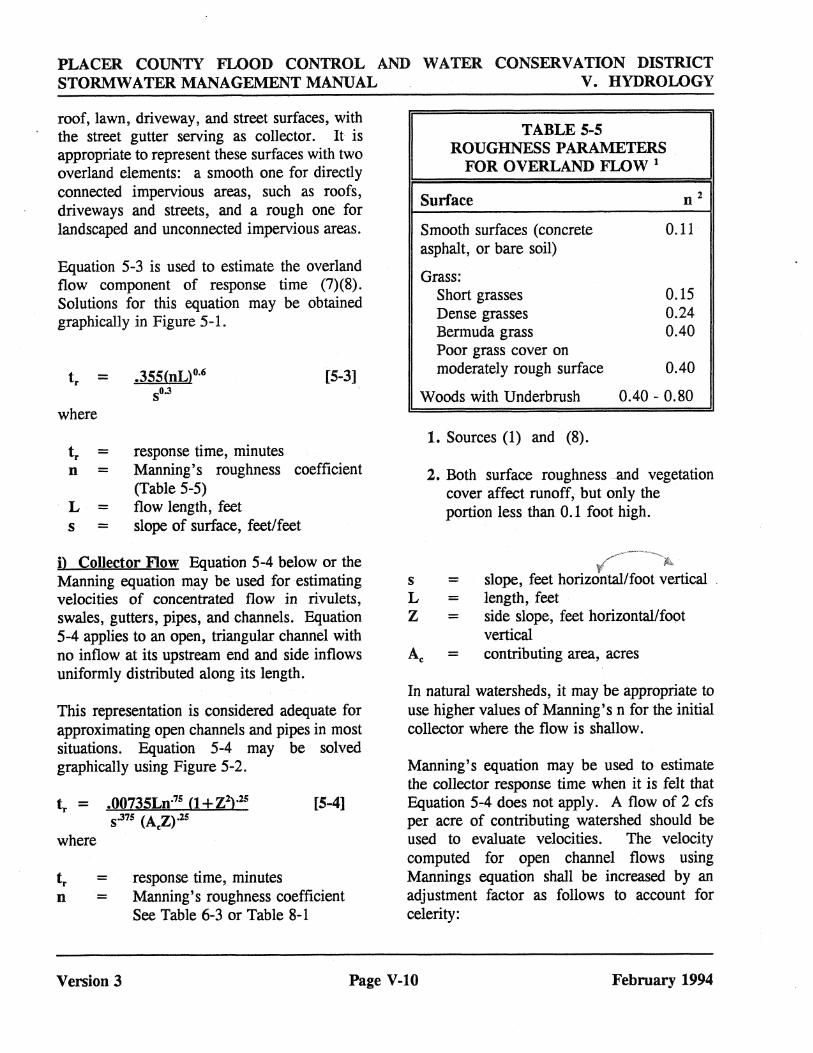
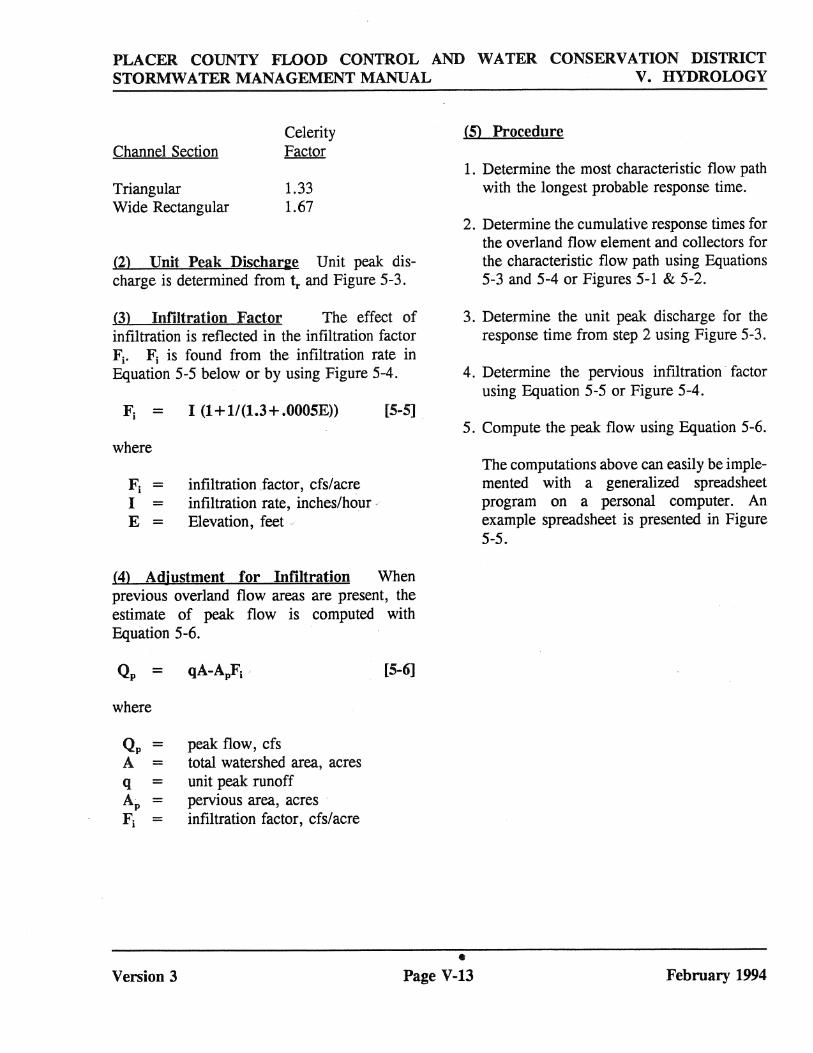
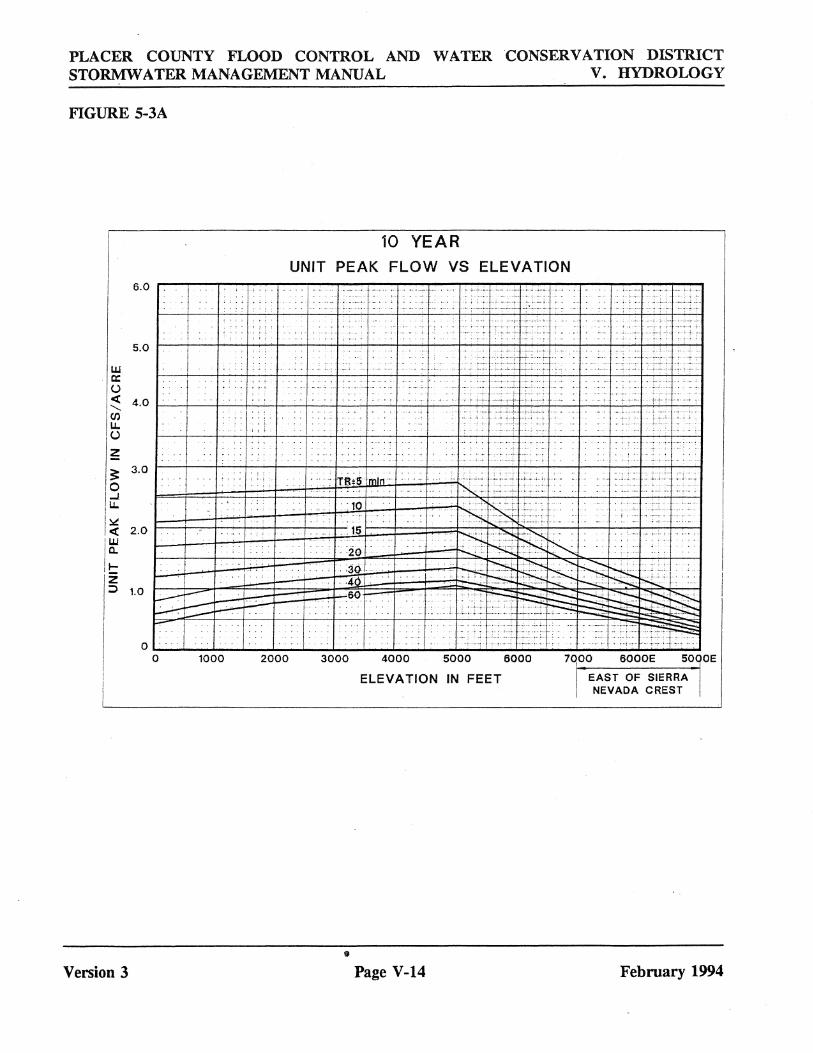
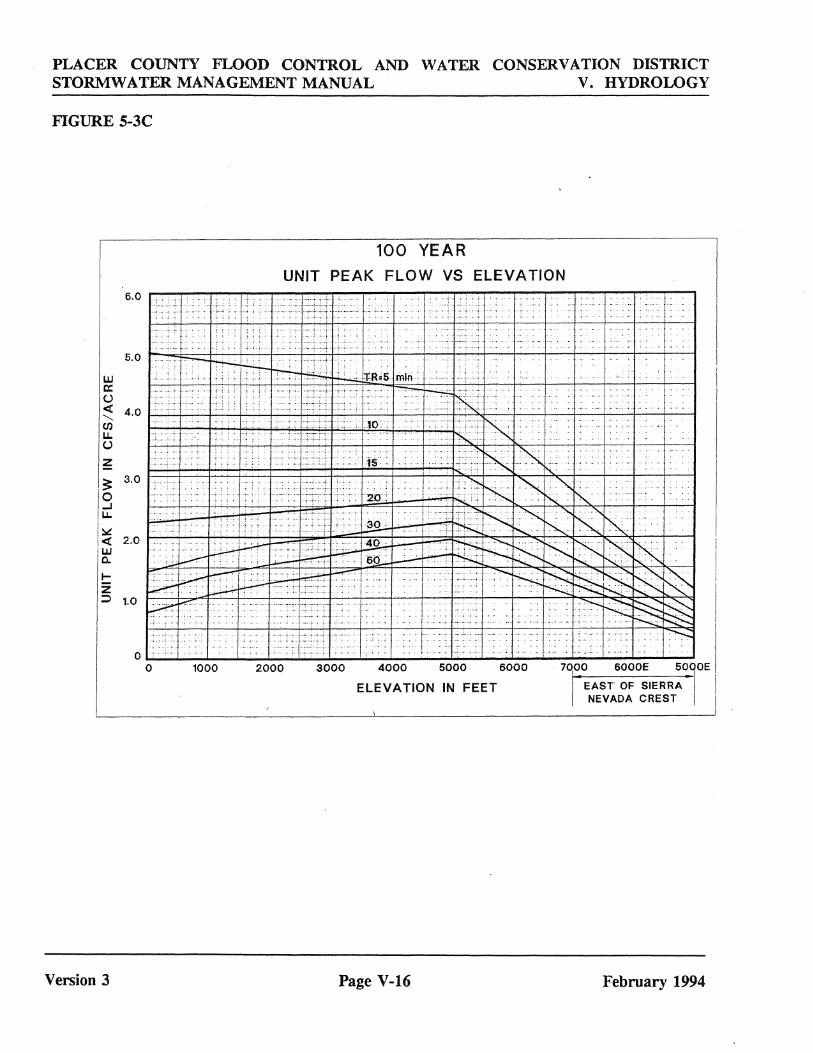
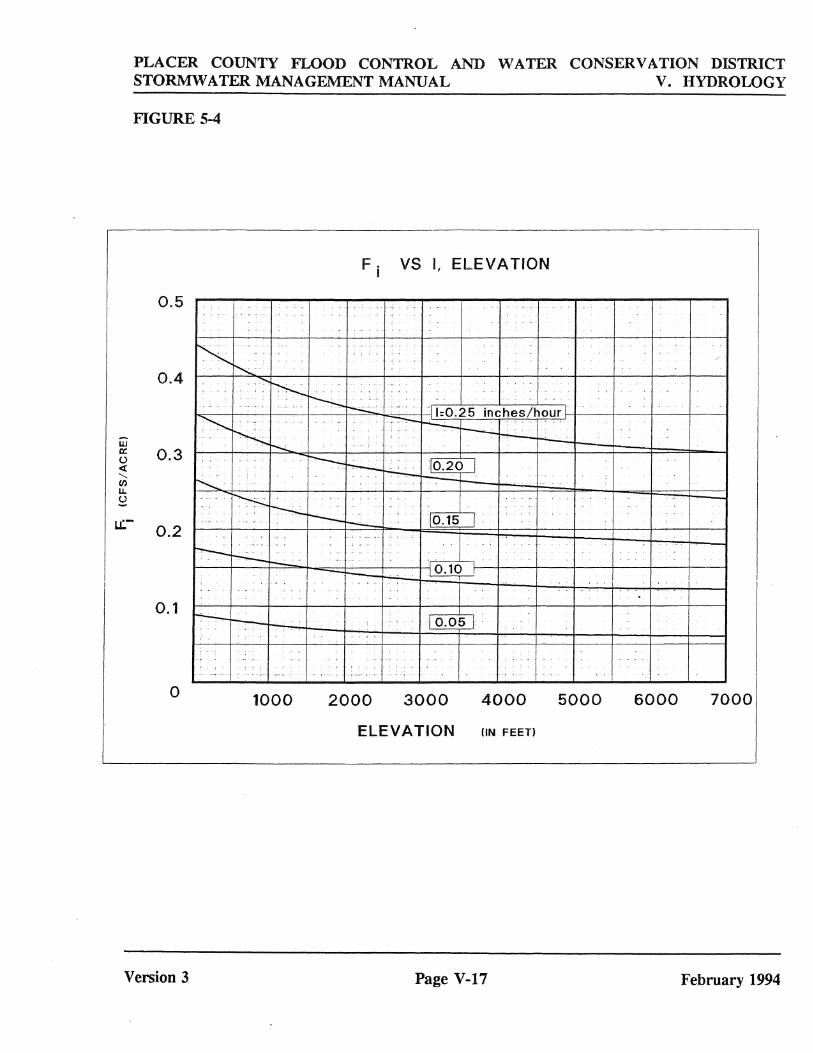
As noted previously, the methodology specified in the Stormwater Management Manual by the Placer County Flood Control and Water Conservation District was used to calculate the flows. Excerpts of the manual are attached at the end of this report. The following equations and values are used for the pre-development conditions: Overland flow response time, tro, as follows: Poor grass cover on moderately rough surface (Table 5-5, Page V-10), n = 0.40 Slope and flow length vary per shed area. Equation 5-3 (page V-10) gives the initial response time. Collector Flow time, tr, as follows: Collector swale length, slope, side slope, and contributing areas vary per shed areas Roughness coefficients: n (table 8-1, page VIII-4) = brush (medium to dense brush, summer) = 0.11 Equation 5-4 (page V-10) give the different responses time within each shed areas Sum of Time of Response The addition of the initial and collector response times. Unit Peak Flow Figures 5-3A (pages V-14) give the Unit peak flows using the sum of response times for a 10 year storm event. Infiltration Factor, Fi (cfs/ac) Infiltration rate, table 5-3 (page V-6), class B soil open natural maximum available pervious area, grass, fair to good. I = 0.20
Newcastle Fire Station – Preliminary Drainage Report July, 2014 Page 3
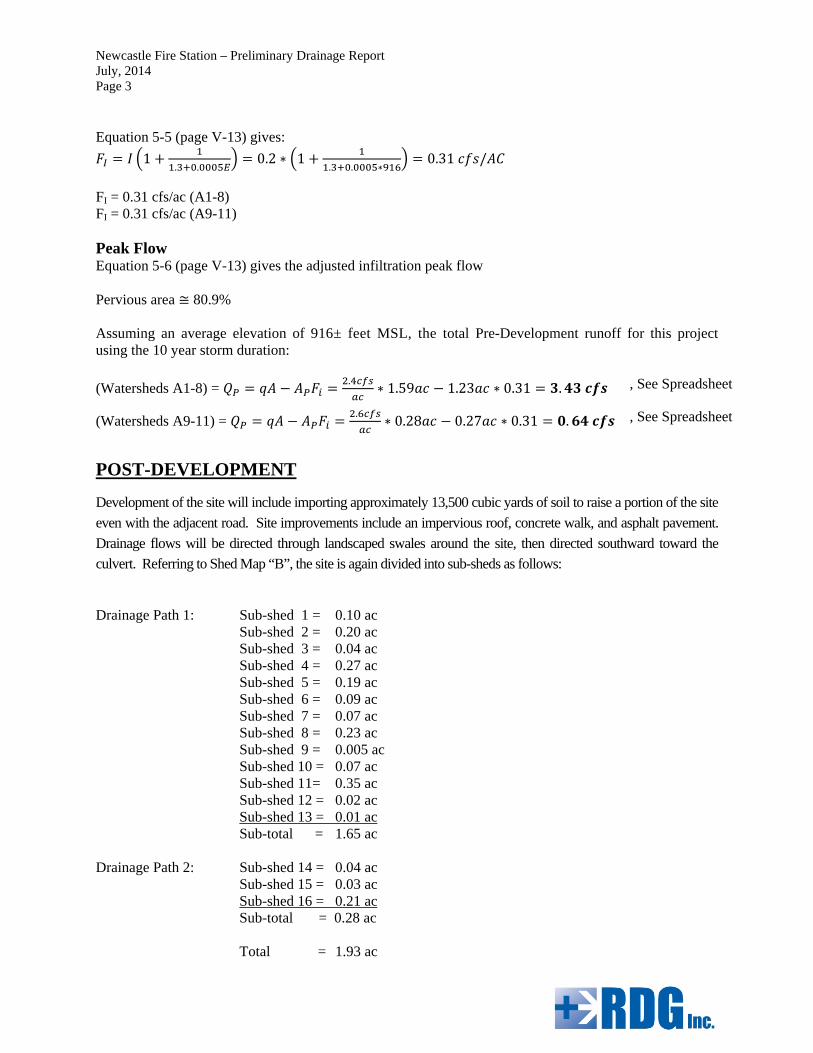
Equation 5-5 (page V-13) gives:
1. .
0.2 ∗ 1. . ∗
0.31 /
FI = 0.31 cfs/ac (A1-8) FI = 0.31 cfs/ac (A9-11) Peak Flow Equation 5-6 (page V-13) gives the adjusted infiltration peak flow Pervious area ≅ 80.9% Assuming an average elevation of 916± feet MSL, the total Pre-Development runoff for this project using the 10 year storm duration:
(Watersheds A1-8) = .
∗ 1.59 1.23 ∗ 0.31 . , See Spreadsheet
(Watersheds A9-11) = .
∗ 0.28 0.27 ∗ 0.31 . , See Spreadsheet
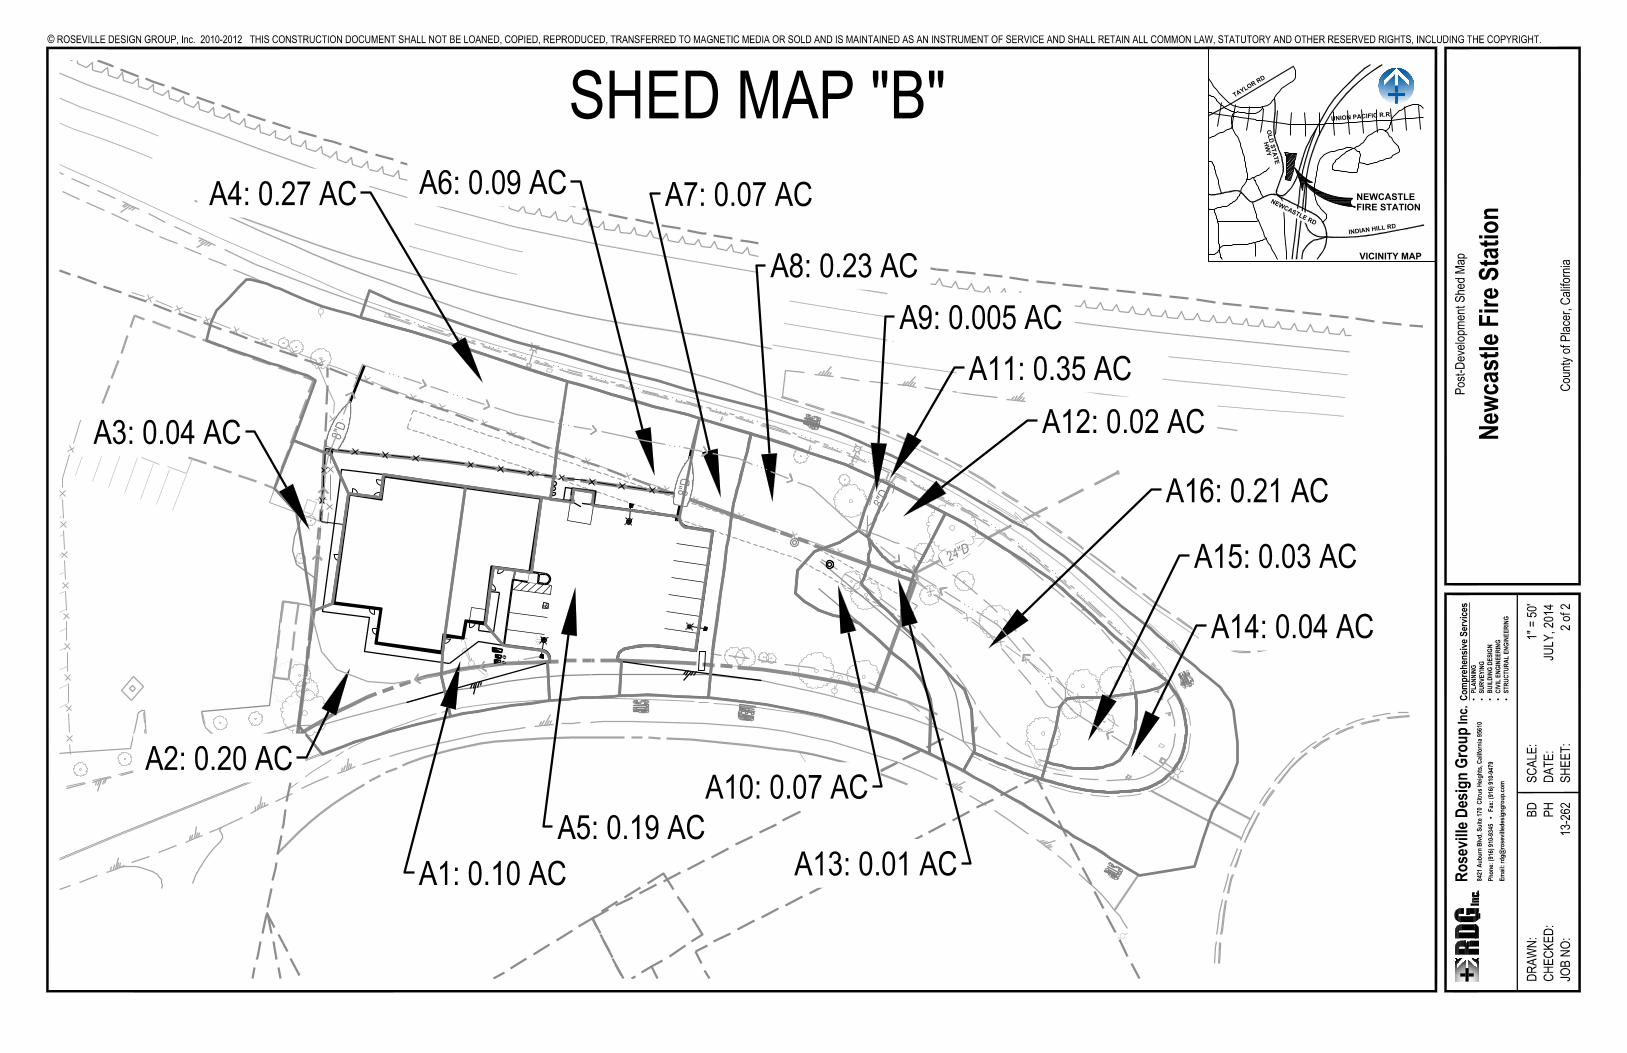
POST-DEVELOPMENT
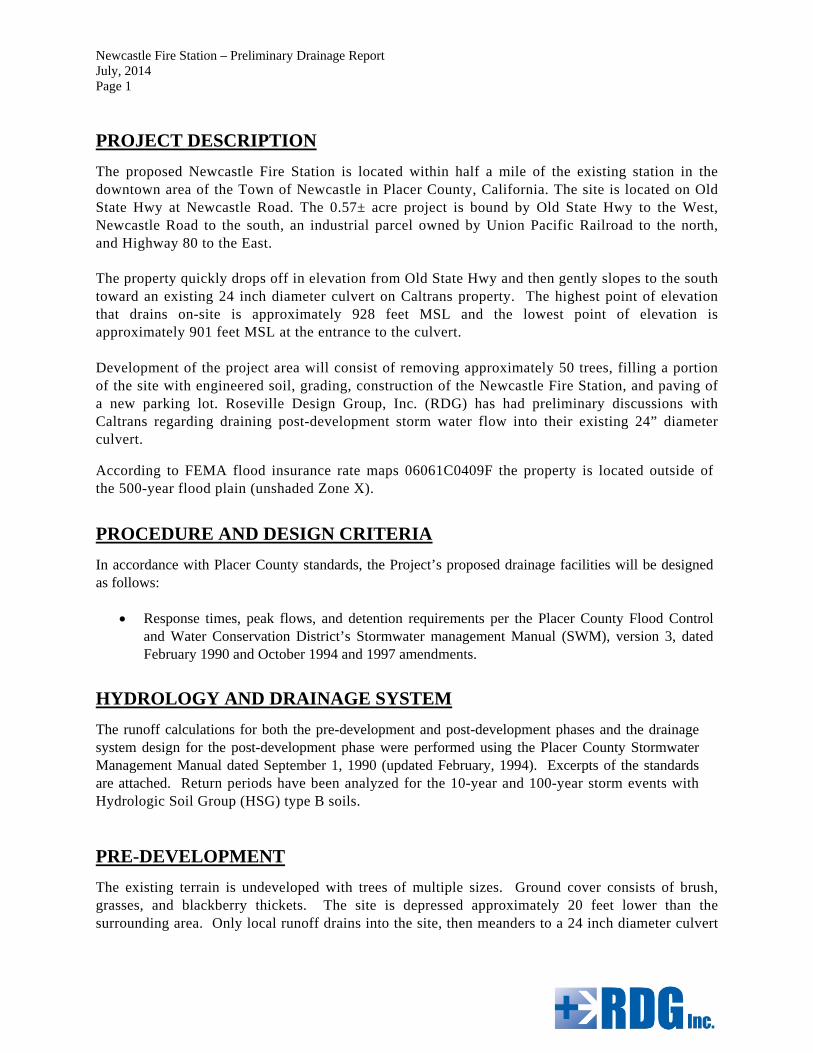
Development of the site will include importing approximately 13,500 cubic yards of soil to raise a portion of the site
even with the adjacent road. Site improvements include an impervious roof, concrete walk, and asphalt pavement.
Drainage flows will be directed through landscaped swales around the site, then directed southward toward the
culvert. Referring to Shed Map “B”, the site is again divided into sub-sheds as follows: Drainage Path 1: Sub-shed 1 = 0.10 ac Sub-shed 2 = 0.20 ac Sub-shed 3 = 0.04 ac Sub-shed 4 = 0.27 ac Sub-shed 5 = 0.19 ac
Sub-shed 6 = 0.09 ac Sub-shed 7 = 0.07 ac Sub-shed 8 = 0.23 ac Sub-shed 9 = 0.005 ac Sub-shed 10 = 0.07 ac Sub-shed 11= 0.35 ac Sub-shed 12 = 0.02 ac Sub-shed 13 = 0.01 ac Sub-total = 1.65 ac
Drainage Path 2: Sub-shed 14 = 0.04 ac Sub-shed 15 = 0.03 ac Sub-shed 16 = 0.21 ac Sub-total = 0.28 ac Total = 1.93 ac
Newcastle Fire Station – Preliminary Drainage Report July, 2014 Page 4
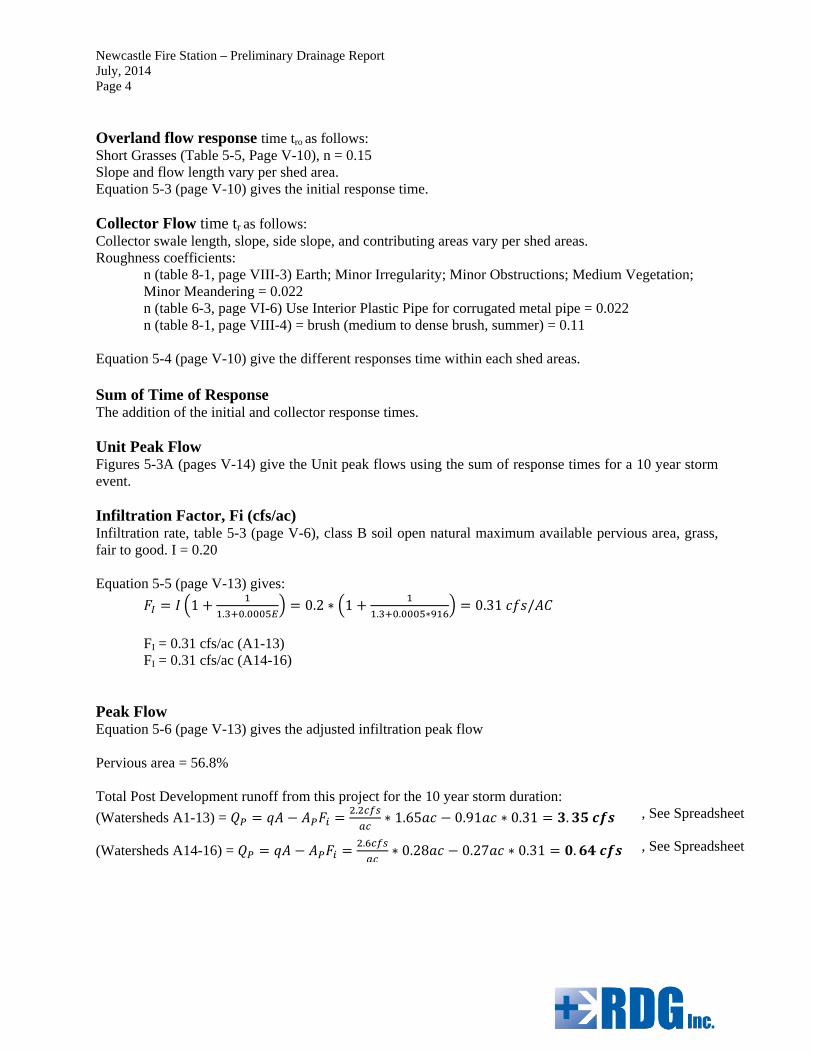
Overland flow response time tro as follows: Short Grasses (Table 5-5, Page V-10), n = 0.15 Slope and flow length vary per shed area. Equation 5-3 (page V-10) gives the initial response time. Collector Flow time tr as follows: Collector swale length, slope, side slope, and contributing areas vary per shed areas. Roughness coefficients:
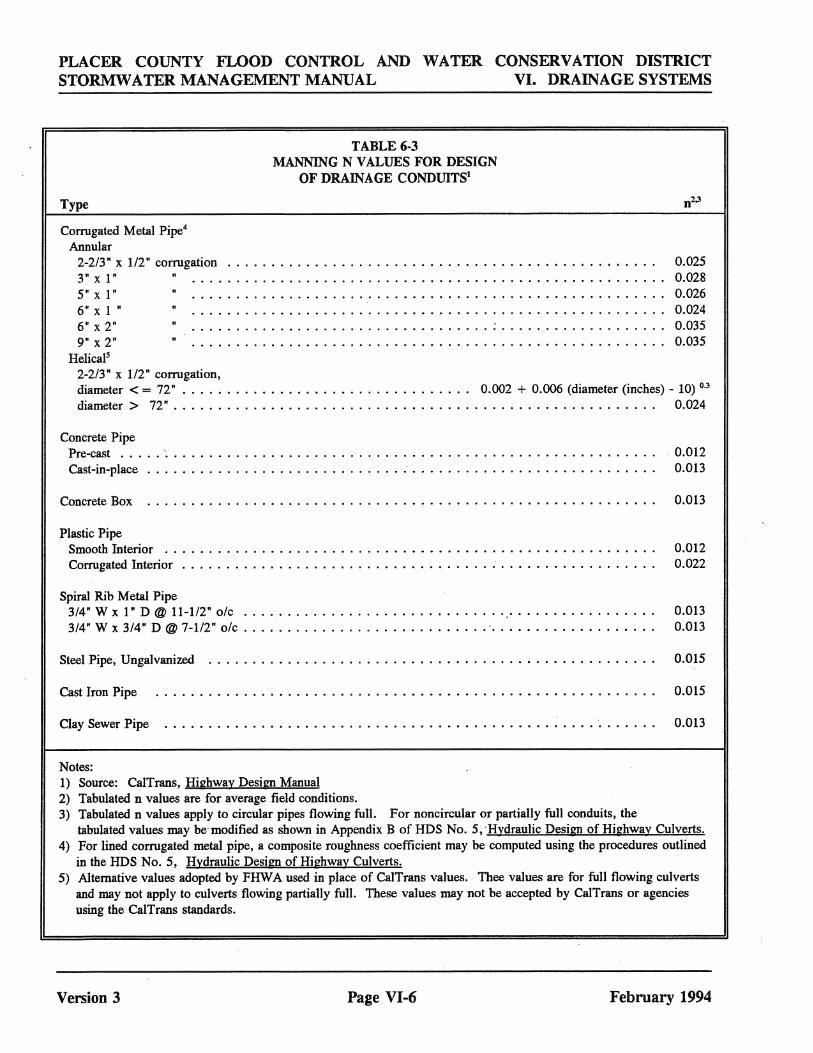
n (table 8-1, page VIII-3) Earth; Minor Irregularity; Minor Obstructions; Medium Vegetation; Minor Meandering = 0.022 n (table 6-3, page VI-6) Use Interior Plastic Pipe for corrugated metal pipe = 0.022 n (table 8-1, page VIII-4) = brush (medium to dense brush, summer) = 0.11
Equation 5-4 (page V-10) give the different responses time within each shed areas. Sum of Time of Response The addition of the initial and collector response times. Unit Peak Flow Figures 5-3A (pages V-14) give the Unit peak flows using the sum of response times for a 10 year storm event. Infiltration Factor, Fi (cfs/ac) Infiltration rate, table 5-3 (page V-6), class B soil open natural maximum available pervious area, grass, fair to good. I = 0.20 Equation 5-5 (page V-13) gives:
1. .
0.2 ∗ 1. . ∗
0.31 /
FI = 0.31 cfs/ac (A1-13) FI = 0.31 cfs/ac (A14-16)
Peak Flow Equation 5-6 (page V-13) gives the adjusted infiltration peak flow Pervious area = 56.8% Total Post Development runoff from this project for the 10 year storm duration:
(Watersheds A1-13) = .
∗ 1.65 0.91 ∗ 0.31 . , See Spreadsheet
(Watersheds A14-16) = .
∗ 0.28 0.27 ∗ 0.31 . , See Spreadsheet
Newcastle Fire Station – Preliminary Drainage Report July, 2014 Page 5
CONCLUSSIONS
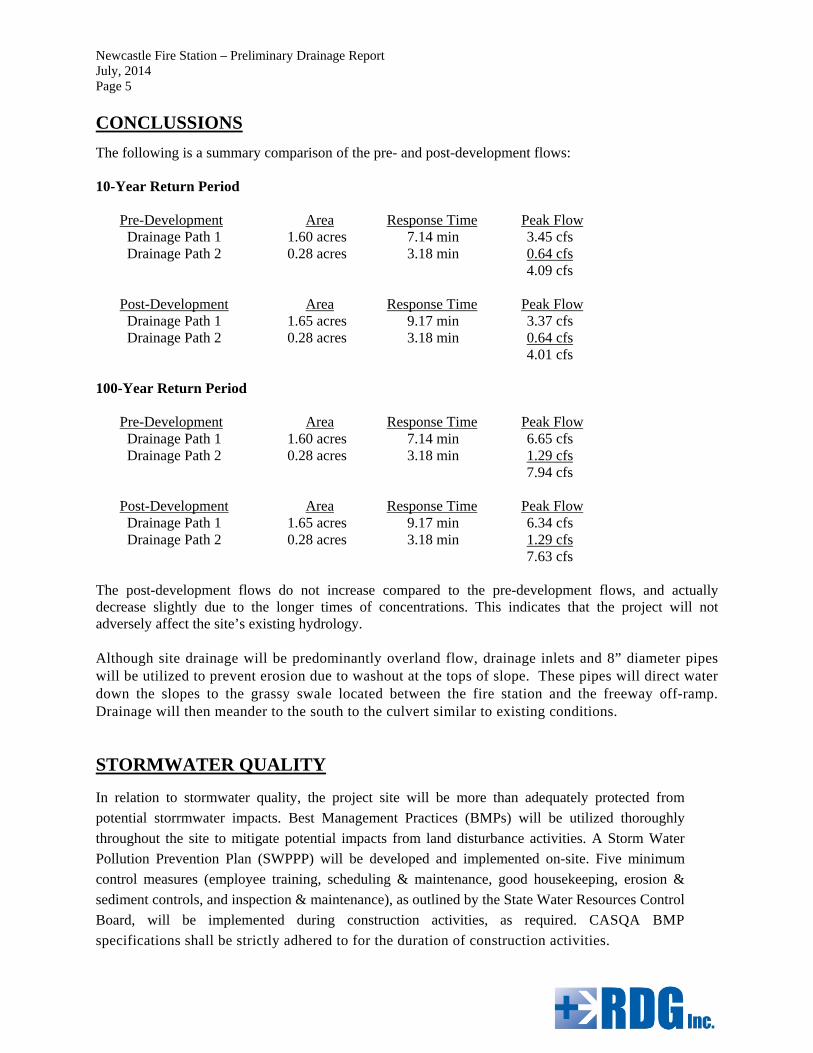
The following is a summary comparison of the pre- and post-development flows: 10-Year Return Period Pre-Development Area Response Time Peak Flow Drainage Path 1 1.60 acres 7.14 min 3.45 cfs Drainage Path 2 0.28 acres 3.18 min 0.64 cfs
4.09 cfs
Post-Development Area Response Time Peak Flow Drainage Path 1 1.65 acres 9.17 min 3.37 cfs Drainage Path 2 0.28 acres 3.18 min 0.64 cfs
4.01 cfs
100-Year Return Period Pre-Development Area Response Time Peak Flow Drainage Path 1 1.60 acres 7.14 min 6.65 cfs Drainage Path 2 0.28 acres 3.18 min 1.29 cfs
7.94 cfs
Post-Development Area Response Time Peak Flow Drainage Path 1 1.65 acres 9.17 min 6.34 cfs Drainage Path 2 0.28 acres 3.18 min 1.29 cfs
7.63 cfs The post-development flows do not increase compared to the pre-development flows, and actually decrease slightly due to the longer times of concentrations. This indicates that the project will not adversely affect the site’s existing hydrology. Although site drainage will be predominantly overland flow, drainage inlets and 8” diameter pipes will be utilized to prevent erosion due to washout at the tops of slope. These pipes will direct water down the slopes to the grassy swale located between the fire station and the freeway off-ramp. Drainage will then meander to the south to the culvert similar to existing conditions.
STORMWATER QUALITY
In relation to stormwater quality, the project site will be more than adequately protected from
potential storrmwater impacts. Best Management Practices (BMPs) will be utilized thoroughly
throughout the site to mitigate potential impacts from land disturbance activities. A Storm Water
Pollution Prevention Plan (SWPPP) will be developed and implemented on-site. Five minimum
control measures (employee training, scheduling & maintenance, good housekeeping, erosion &
sediment controls, and inspection & maintenance), as outlined by the State Water Resources Control
Board, will be implemented during construction activities, as required. CASQA BMP
specifications shall be strictly adhered to for the duration of construction activities.

Newcastle Fire Station – Preliminary Drainage Report July, 2014 Page 6
During grading, the primary potential pollutant of concern is anticipated to be wind erosion,
particularly during grading activities. Areas of exposed soil have a potential to contribute sediment
to stormwater discharges if a rain event occurs. Furthermore, during dry periods, dust control
measures involve applying water to the exposed area, which can also produce sediment-laden runoff
if not applied properly. Runoff control measures such as fiber rolls and inlet protection will be
utilized on-site to avoid an unauthorized discharge due to grading disturbances.
Cut and fill activities also have the potential to contribute to erosion and sedimentation if proper
techniques are not employed. Disturbed areas will be stabilized through a variety of methods
including hydroseeding and fiber rolls. Material storage and equipment staging areas will be
protected from potential run-on and covered and secured prior to predicted rain events.
Post-development pollutants are anticipated to consist primarily of oily stormwater runoff during
the first substantial rain event following the completion of paving activities. Paving activities will
add asphalt and concrete materials to the site, which will require additional BMPs to be
implemented in order to protect the site from a potential unauthorized stormwater discharge. Runoff
control measures including, but not limited to, drain inlet protection and fiber rolls will be utilized
to prevent any oils or pollutants from exiting the work area. Steep slopes on the site will also
require the use of erosion and sediment control measures such as hydroseeding. Runoff will
discharge as sheet flow and channelize into swales leading to existing vegetated areas simulating
pre-development condition).
At a minimum the following CASQA BMPs shall be implemented on-site. Please refer to the
SWPPP for an all-inclusive list of BMPs that will be utilized on-site:
EC-4 – Hydroseeding;
NS-10 – Vehicle & Equipment Maintenance;
SE-5 – Fiber Rolls;
TC-1 – Stabilized Construction Entrance;
WE-1 – Wind Erosion Control; and
WM-1 – Material Delivery and Storage
The BMP’s listed above are included in the CASQA Stormwater Best Management Practice Handbook for New Development and Re-Development, November 2009. Also refer to the SWPPP and the Erosion Control plans for more detail location and description of the BMPs. See the Water Quality appendix for the sizing calculations of the facilities.

EXHIBITS
AND
ATTACHMENTS

PRE-DEVELOPMENT
CALCULATIONS,
10 Year Period

Date
Engineer Roseville Design Group, Inc.
Project Newcastle Fire Station
Watershed A1-8
Area, acres 1.60 Elevation 916 Return Period, Years 100
Feet
Contributing Side Slope Response
Length Slope Mannings Area (ft H per Time
(feet) (V/H) n (acres) 1 ft V) (minutes)
Overland Flow, A1 98 0.226 0.4 5.01
Swale 1, A2 131 0.063 0.11 0.28 0.5 0.90
Swale 2, A3 121 0.013 0.11 1.14 0.5 1.05
Swale 3, A4-A5-A6 19 0.206 0.11 1.22 0.5 0.06
Swale 4, A7-A8 23 0.038 0.11 1.6 0.5 0.12
Total Response Time (minutes) 7.14
Unit Peak Flow (cfs/acre) 4.40
Infiltration Rate (inches/hour) 0.2
Infiltration Factor (cfs/acre) 0.31
Percent Impervious 21.64
Watershed Peak Flow 6.65
Area x Unit Peak Flow - (1-Percent Impervious) * Area x Infiltration Factor
July, 2014
Small Watershed Peak Flow Worksheet, Pre-Development
Placer County Flood Control and Water Conservation District

Date
Engineer Roseville Design Group, Inc.
Project Newcastle Fire Station
Watershed A9-11
Area, acres 0.28 Elevation 916 Return Period, Years 100
Feet
Contributing Side Slope Response
Length Slope Mannings Area (ft H per Time
(feet) (V/H) n (acres) 1 ft V) (minutes)
Overland Flow, A9 26 0.031 0.15 2.28
Swale 1, A10 42 0.500 0.11 0.07 2.0 0.19
Swale 2, A11 104 0.061 0.11 0.28 2.0 0.72
Total Response Time (minutes) 3.18
Unit Peak Flow (cfs/acre) 4.90
Infiltration Rate (inches/hour) 0.2
Infiltration Factor (cfs/acre) 0.31
Percent Impervious 4.91
Watershed Peak Flow 1.29
Area x Unit Peak Flow - (1-Percent Impervious) * Area x Infiltration Factor
July, 2014
Small Watershed Peak Flow Worksheet, Pre-Development
Placer County Flood Control and Water Conservation District
PRE-DEVELOPMENT
CALCULATIONS,
100 Year Period
Date
Engineer Roseville Design Group, Inc.
Project Newcastle Fire Station
Watershed A1-8
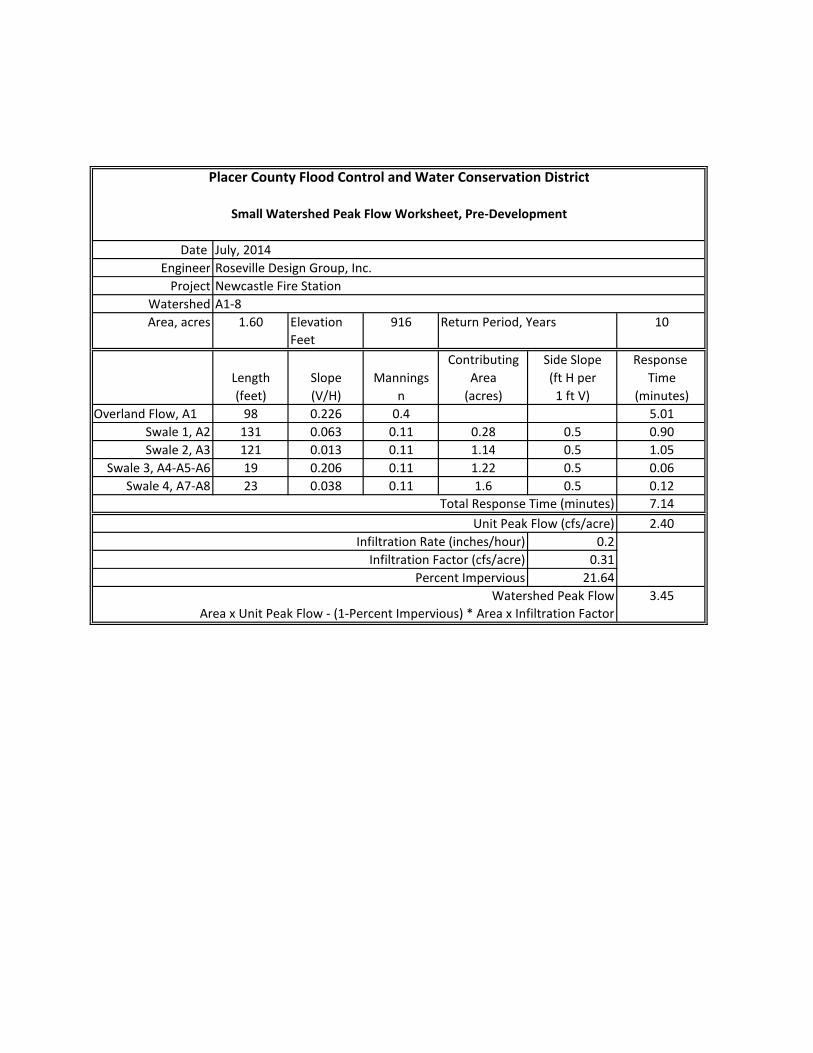
Area, acres 1.60 Elevation 916 Return Period, Years 10
Feet
Contributing Side Slope Response
Length Slope Mannings Area (ft H per Time
(feet) (V/H) n (acres) 1 ft V) (minutes)
Overland Flow, A1 98 0.226 0.4 5.01
Swale 1, A2 131 0.063 0.11 0.28 0.5 0.90
Swale 2, A3 121 0.013 0.11 1.14 0.5 1.05
Swale 3, A4-A5-A6 19 0.206 0.11 1.22 0.5 0.06
Swale 4, A7-A8 23 0.038 0.11 1.6 0.5 0.12
Total Response Time (minutes) 7.14
Unit Peak Flow (cfs/acre) 2.40
Infiltration Rate (inches/hour) 0.2
Infiltration Factor (cfs/acre) 0.31
Percent Impervious 21.64
Watershed Peak Flow 3.45
Area x Unit Peak Flow - (1-Percent Impervious) * Area x Infiltration Factor
July, 2014
Small Watershed Peak Flow Worksheet, Pre-Development
Placer County Flood Control and Water Conservation District
Date
Engineer Roseville Design Group, Inc.
Project Newcastle Fire Station
Watershed A9-11
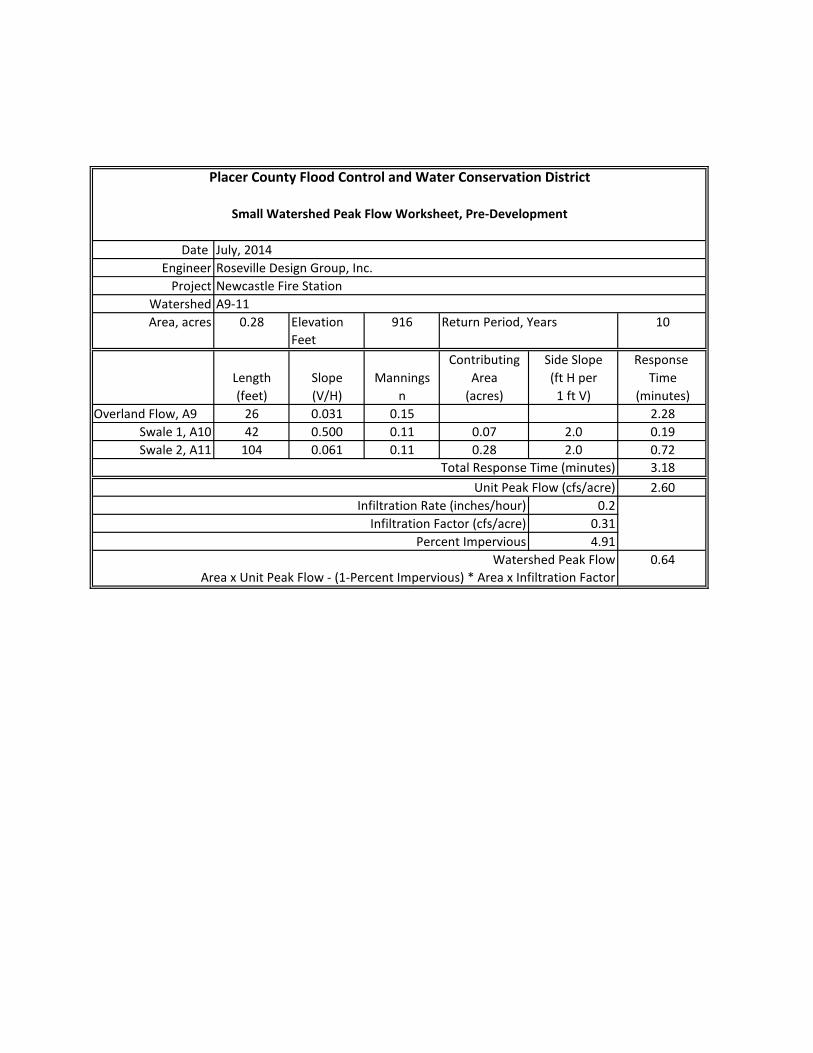
Area, acres 0.28 Elevation 916 Return Period, Years 10
Feet
Contributing Side Slope Response
Length Slope Mannings Area (ft H per Time
(feet) (V/H) n (acres) 1 ft V) (minutes)
Overland Flow, A9 26 0.031 0.15 2.28
Swale 1, A10 42 0.500 0.11 0.07 2.0 0.19
Swale 2, A11 104 0.061 0.11 0.28 2.0 0.72
Total Response Time (minutes) 3.18
Unit Peak Flow (cfs/acre) 2.60
Infiltration Rate (inches/hour) 0.2
Infiltration Factor (cfs/acre) 0.31
Percent Impervious 4.91
Watershed Peak Flow 0.64
Area x Unit Peak Flow - (1-Percent Impervious) * Area x Infiltration Factor
July, 2014
Small Watershed Peak Flow Worksheet, Pre-Development
Placer County Flood Control and Water Conservation District

PRE-DEVELOPMENT
Map
Swale 1
Swale 2Swale 3
Swale 4
Swale 5905
910
915
920
925
905
910915
920
905
910
910
910
915
915
915
920
920
920925
925
925
905
910915
920
925
925
24"D
Pre-
Deve
lopme
nt Sh
ed M
ap
Newc
astle
Fire
Sta
tion
Coun
ty of
Plac
er, C
alifor
nia
1" =
50'
JULY
, 201
41 o
f 2
BD PH13
-262
NEWCASTLEFIRE STATION
UNION PACIFIC R.R.
OLD
STATE
TAYLOR RD
HW
Y
INDIAN HILL RD
NEWCASTLE RD
VICINITY MAP
SHED MAP "A"
POST-DEVELOPMENT
CALCULATIONS,
10 Year Period

Date
Engineer Roseville Design Group, Inc.
Project Newcastle Fire Station
Watershed A1-13
Area, acres 1.65 Elevation 916 Return Period, Years 10
Feet
Contributing Side Slope Response
Length Slope Mannings Area (ft H per Time
(feet) (V/H) n (acres) 1 ft V) (minutes)
Overland Flow, A1 57 0.010 0.15 5.12
Swale 1, A2 91 0.016 0.057 0.30 14.3 0.97
Swale 2, A3 83 0.025 0.057 0.34 3.0 0.50
Pipe, A3 49 0.050 0.022 0.34 3.0 0.11
Swale 4, A4 107 0.015 0.11 0.61 5.0 1.24
Swale 5, A6 70 0.031 0.11 0.70 4.0 0.57
Swale 6, A5-A7 29 0.031 0.11 0.96 3.0 0.20
Swale 7, A8 71 0.137 0.11 1.19 3.0 0.27
Swale 8, A9-A10-A11 7 0.206 0.11 1.62 1.5 0.02
Swale 9, A12-A13 32 0.038 0.11 1.65 1.5 0.16
Total Response Time (minutes) 9.17
Unit Peak Flow (cfs/acre) 2.20
Infiltration Rate (inches/hour) 0.2
Infiltration Factor (cfs/acre) 0.31
Percent Impervious 49.73
Watershed Peak Flow 3.37
Area x Unit Peak Flow - (1-Percent Impervious) * Area x Infiltration Factor
July, 2014
Small Watershed Peak Flow Worksheet, Post Development
Placer County Flood Control and Water Conservation District
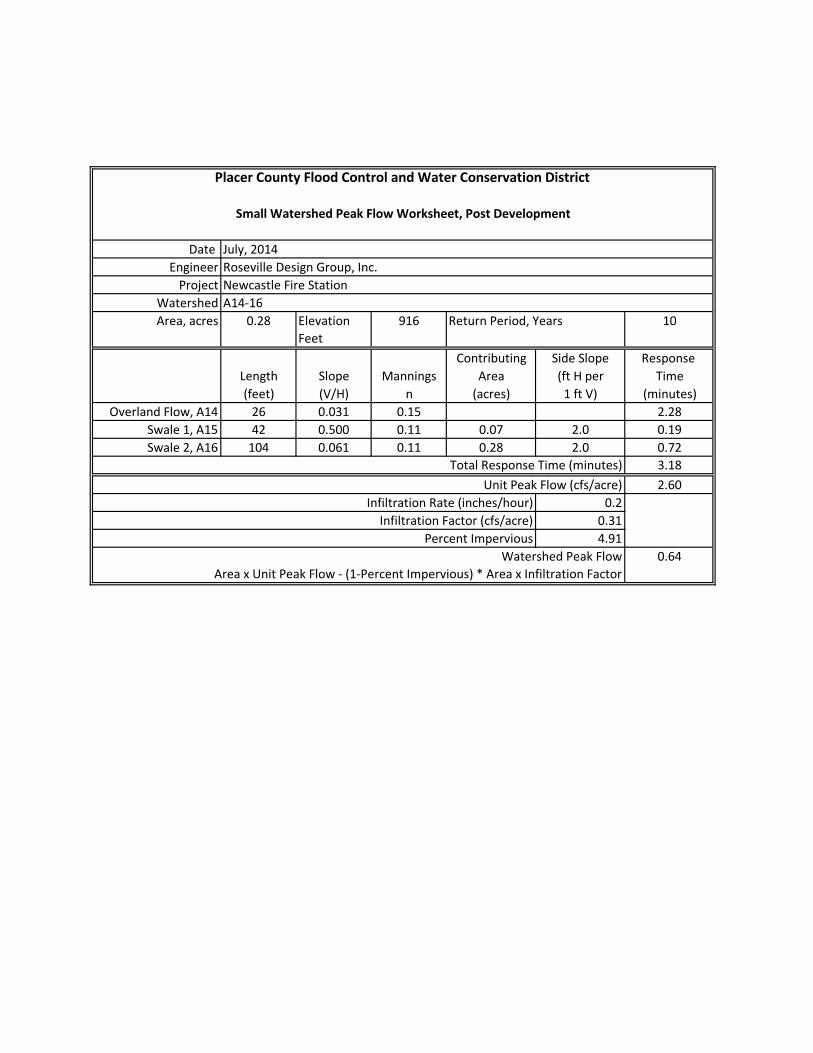
Date
Engineer Roseville Design Group, Inc.
Project Newcastle Fire Station
Watershed A14-16
Area, acres 0.28 Elevation 916 Return Period, Years 10
Feet
Contributing Side Slope Response
Length Slope Mannings Area (ft H per Time
(feet) (V/H) n (acres) 1 ft V) (minutes)
Overland Flow, A14 26 0.031 0.15 2.28
Swale 1, A15 42 0.500 0.11 0.07 2.0 0.19
Swale 2, A16 104 0.061 0.11 0.28 2.0 0.72
Total Response Time (minutes) 3.18
Unit Peak Flow (cfs/acre) 2.60
Infiltration Rate (inches/hour) 0.2
Infiltration Factor (cfs/acre) 0.31
Percent Impervious 4.91
Watershed Peak Flow 0.64
Area x Unit Peak Flow - (1-Percent Impervious) * Area x Infiltration Factor
July, 2014
Small Watershed Peak Flow Worksheet, Post Development
Placer County Flood Control and Water Conservation District
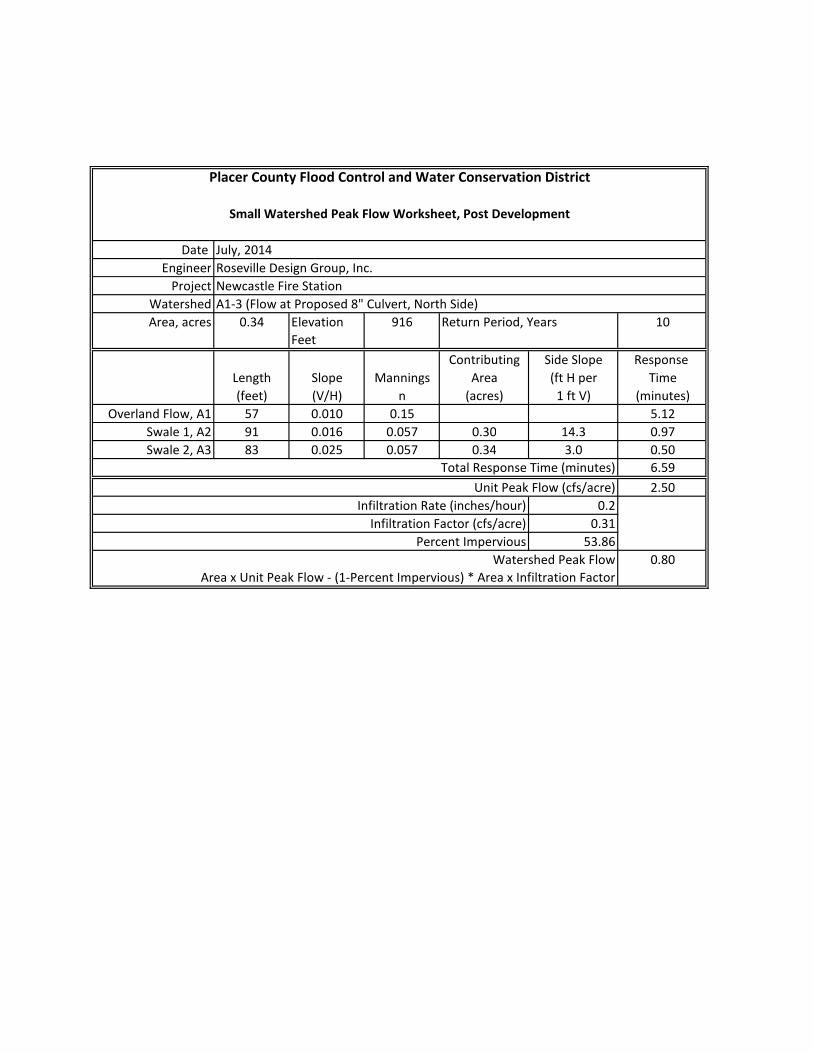
Date
Engineer Roseville Design Group, Inc.
Project Newcastle Fire Station
Watershed A1-3 (Flow at Proposed 8" Culvert, North Side)
Area, acres 0.34 Elevation 916 Return Period, Years 10
Feet
Contributing Side Slope Response
Length Slope Mannings Area (ft H per Time
(feet) (V/H) n (acres) 1 ft V) (minutes)
Overland Flow, A1 57 0.010 0.15 5.12
Swale 1, A2 91 0.016 0.057 0.30 14.3 0.97
Swale 2, A3 83 0.025 0.057 0.34 3.0 0.50
Total Response Time (minutes) 6.59
Unit Peak Flow (cfs/acre) 2.50
Infiltration Rate (inches/hour) 0.2
Infiltration Factor (cfs/acre) 0.31
Percent Impervious 53.86
Watershed Peak Flow 0.80
Area x Unit Peak Flow - (1-Percent Impervious) * Area x Infiltration Factor
Placer County Flood Control and Water Conservation District
Small Watershed Peak Flow Worksheet, Post Development
July, 2014
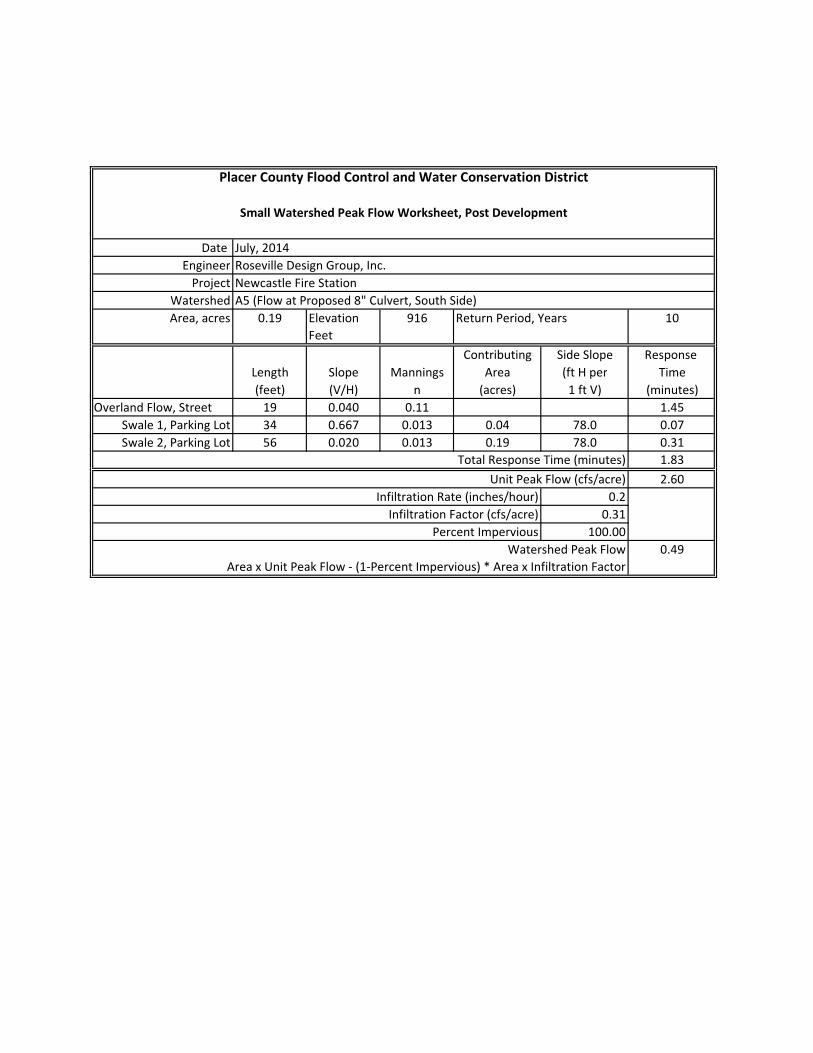
Date
Engineer Roseville Design Group, Inc.
Project Newcastle Fire Station
Watershed A5 (Flow at Proposed 8" Culvert, South Side)
Area, acres 0.19 Elevation 916 Return Period, Years 10
Feet
Contributing Side Slope Response
Length Slope Mannings Area (ft H per Time
(feet) (V/H) n (acres) 1 ft V) (minutes)
Overland Flow, Street 19 0.040 0.11 1.45
Swale 1, Parking Lot 34 0.667 0.013 0.04 78.0 0.07
Swale 2, Parking Lot 56 0.020 0.013 0.19 78.0 0.31
Total Response Time (minutes) 1.83
Unit Peak Flow (cfs/acre) 2.60
Infiltration Rate (inches/hour) 0.2
Infiltration Factor (cfs/acre) 0.31
Percent Impervious 100.00
Watershed Peak Flow 0.49
Area x Unit Peak Flow - (1-Percent Impervious) * Area x Infiltration Factor
Placer County Flood Control and Water Conservation District
Small Watershed Peak Flow Worksheet, Post Development
July, 2014
POST-DEVELOPMENT
CALCULATIONS,
100 Year Period
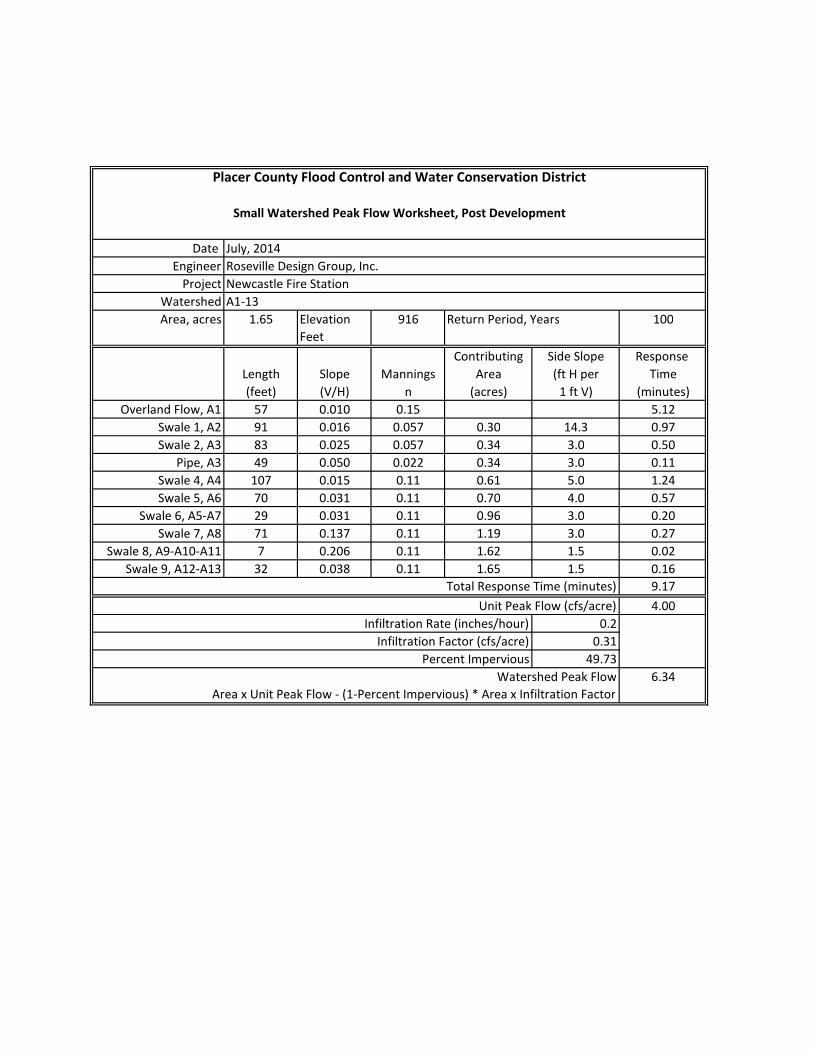
Date
Engineer Roseville Design Group, Inc.
Project Newcastle Fire Station
Watershed A1-13
Area, acres 1.65 Elevation 916 Return Period, Years 100
Feet
Contributing Side Slope Response
Length Slope Mannings Area (ft H per Time
(feet) (V/H) n (acres) 1 ft V) (minutes)
Overland Flow, A1 57 0.010 0.15 5.12
Swale 1, A2 91 0.016 0.057 0.30 14.3 0.97
Swale 2, A3 83 0.025 0.057 0.34 3.0 0.50
Pipe, A3 49 0.050 0.022 0.34 3.0 0.11
Swale 4, A4 107 0.015 0.11 0.61 5.0 1.24
Swale 5, A6 70 0.031 0.11 0.70 4.0 0.57
Swale 6, A5-A7 29 0.031 0.11 0.96 3.0 0.20
Swale 7, A8 71 0.137 0.11 1.19 3.0 0.27
Swale 8, A9-A10-A11 7 0.206 0.11 1.62 1.5 0.02
Swale 9, A12-A13 32 0.038 0.11 1.65 1.5 0.16
Total Response Time (minutes) 9.17
Unit Peak Flow (cfs/acre) 4.00
Infiltration Rate (inches/hour) 0.2
Infiltration Factor (cfs/acre) 0.31
Percent Impervious 49.73
Watershed Peak Flow 6.34
Area x Unit Peak Flow - (1-Percent Impervious) * Area x Infiltration Factor
July, 2014
Small Watershed Peak Flow Worksheet, Post Development
Placer County Flood Control and Water Conservation District

Date
Engineer Roseville Design Group, Inc.
Project Newcastle Fire Station
Watershed A14-16
Area, acres 0.28 Elevation 916 Return Period, Years 100
Feet
Contributing Side Slope Response
Length Slope Mannings Area (ft H per Time
(feet) (V/H) n (acres) 1 ft V) (minutes)
Overland Flow, A14 26 0.031 0.15 2.28
Swale 1, A15 42 0.500 0.11 0.07 2.0 0.19
Swale 2, A16 104 0.061 0.11 0.28 2.0 0.72
Total Response Time (minutes) 3.18
Unit Peak Flow (cfs/acre) 4.90
Infiltration Rate (inches/hour) 0.2
Infiltration Factor (cfs/acre) 0.31
Percent Impervious 4.91
Watershed Peak Flow 1.29
Area x Unit Peak Flow - (1-Percent Impervious) * Area x Infiltration Factor
July, 2014
Placer County Flood Control and Water Conservation District
Small Watershed Peak Flow Worksheet, Post Development

Date
Engineer Roseville Design Group, Inc.
Project Newcastle Fire Station
Watershed A1-3 (Flow at Proposed 8" Culvert, North Side)
Area, acres 0.34 Elevation 916 Return Period, Years 100
Feet
Contributing Side Slope Response
Length Slope Mannings Area (ft H per Time
(feet) (V/H) n (acres) 1 ft V) (minutes)
Overland Flow, A1 57 0.010 0.15 5.12
Swale 1, A2 91 0.016 0.057 0.30 14.3 0.97
Swale 2, A3 83 0.025 0.057 0.34 3.0 0.50
Total Response Time (minutes) 6.59
Unit Peak Flow (cfs/acre) 4.50
Infiltration Rate (inches/hour) 0.2
Infiltration Factor (cfs/acre) 0.31
Percent Impervious 53.86
Watershed Peak Flow 1.48
Area x Unit Peak Flow - (1-Percent Impervious) * Area x Infiltration Factor
Placer County Flood Control and Water Conservation District
Small Watershed Peak Flow Worksheet, Post Development
July, 2014

Date
Engineer Roseville Design Group, Inc.
Project Newcastle Fire Station
Watershed A5 (Flow at Proposed 8" Culvert, South Side)
Area, acres 0.19 Elevation 916 Return Period, Years 100
Feet
Contributing Side Slope Response
Length Slope Mannings Area (ft H per Time
(feet) (V/H) n (acres) 1 ft V) (minutes)
Overland Flow, Street 19 0.040 0.11 1.45
Swale 1, Parking Lot 34 0.667 0.013 0.04 78.0 0.07
Swale 2, Parking Lot 56 0.020 0.013 0.19 78.0 0.31
Total Response Time (minutes) 1.83
Unit Peak Flow (cfs/acre) 4.90
Infiltration Rate (inches/hour) 0.2
Infiltration Factor (cfs/acre) 0.31
Percent Impervious 100.00
Watershed Peak Flow 0.93
Area x Unit Peak Flow - (1-Percent Impervious) * Area x Infiltration Factor
Placer County Flood Control and Water Conservation District
Small Watershed Peak Flow Worksheet, Post Development
July, 2014

POST-DEVELOPMENT
MAP
Post-
Deve
lopme
nt Sh
ed M
ap
Newc
astle
Fire
Sta
tion
Coun
ty of
Plac
er, C
alifor
nia
1" =
50'
JULY
, 201
42 o
f 2
BD PH13
-262
NEWCASTLEFIRE STATION
UNION PACIFIC R.R.
OLD
STATE
TAYLOR RD
HW
Y
INDIAN HILL RD
NEWCASTLE RD
VICINITY MAP
SHED MAP "B"

FEMA
MAP

VICINITY
MAP
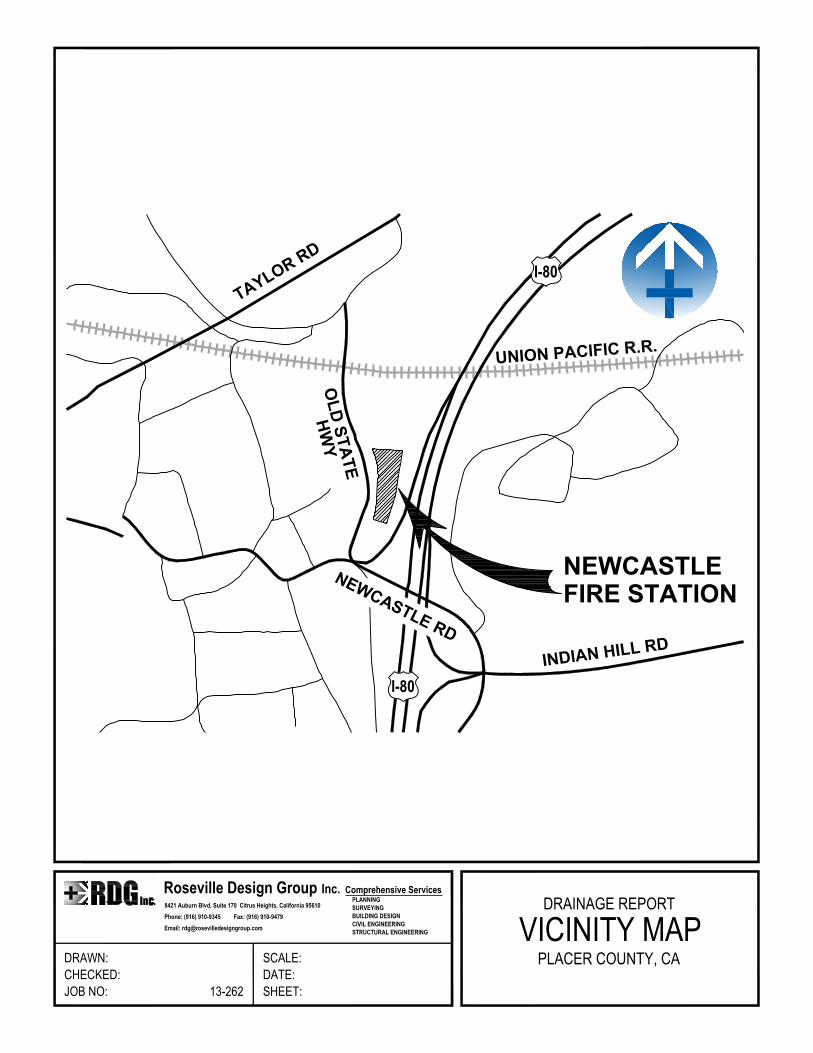
NEWCASTLEFIRE STATION
I-80
I-80
UNION PACIFIC R.R.
OLD
STATE
TAYLOR RD
HW
Y
INDIAN HILL RD
NEWCASTLE RD
CHECKED:DRAWN: SCALE:
SHEET:DATE:
JOB NO: 13-262
Roseville Design Group Inc.8421 Auburn Blvd, Suite 170 Citrus Heights, California 95610Phone: (916) 910-9345 Fax: (916) 910-9479Email: [email protected]
Comprehensive Services PLANNING SURVEYING BUILDING DESIGN CIVIL ENGINEERING STRUCTURAL ENGINEERING
DRAINAGE REPORT
VICINITY MAPPLACER COUNTY, CA
EXCERPTS FROM
“PLACER COUNTY FLOOD CONTROL AND
WATER CONSERVATION DISTRICT
STORMWATER MANAGEMENT MANUAL”