Embed Size (px)
Citation preview

New Zealand Tourism Forecasts 2018 – 2024
May 2018
More information
www.mbie.govt.nz
0800 20 90 20
Information, examples and answers to your questions about the topics covered here can be found on our website www.mbie.govt.nz or by calling us free on 0800 20 90 20.
Ministry of Business, Innovation and Employment (MBIE) Hikina Whakatutuki - Lifting to make successfulMBIE develops and delivers policy, services, advice and regulation to support economic growth and the prosperity and wellbeing of New Zealanders.
MBIE combines the former Ministries of Economic Development, Science + Innovation, and the Departments of Labour, and Building and Housing.
Disclaimer
This document is a guide only. It should not be used as a substitute for legislation or legal advice. The Ministry of Business, Innovation and Employment is not responsible for the results of any actions taken on the basis of information in this document, or for any errors or omissions.
ISSN 2537-8082
MBIE 3627 May 2018
©Crown Copyright 2018
The material contained in this report is subject to Crown copyright protection unless otherwise indicated. The Crown copyright protected material may be reproduced free of charge in any format or media without requiring specific permission. This is subject to the material being reproduced accurately and not being used in a derogatory manner or in a misleading context. Where the material is being published or issued to others, the source and copyright status should be acknowledged. The permission to reproduce Crown copyright protected material does not extend to any material in this report that is identified as being the copyright of a third party. Authorisation to reproduce such material should be obtained from the copyright holders.

MINISTRY OF BUSINESS, INNOVATION AND EMPLOYMENT MAY 2018NEW ZEALAND TOURISM FORECASTS 2018-2024
1
Foreword
It is my pleasure to release the international tourism forecasts from the Ministry of Business, Innovation and Employment (MBIE) for the 2018-2024 period. Tourism makes a critical contribution to New Zealand’s economic success. Government aims to ensure that all New Zealanders benefit from the value that tourism delivers, and that tourism delivers inclusive growth. Its destination marketing investment is focussed on establishing New Zealand as a high value destination that has year-round appeal to visitors from diverse markets. Government also supports the sector and local government to provide the infrastructure, amenities and attractions essential for quality visitor experiences, and to create enduring jobs and skills’ pathways in tourism for New Zealanders.
With international arrivals and spend expected to continue to grow in the coming years, government is focussed on encouraging visitors to explore not only our iconic destinations, but also lesser-known regions across New Zealand. It is also working to encourage and support the sustainable use of New Zealand’s resources for tourism and to manage impacts from rapid growth.
The forecasts are based on econometric modelling, current trends and best available forecasts of international factors. They provide a baseline for what will happen ‘if things keep going this way’. The forecasts do not set targets and are not numbers carved in stone. Rather, I hope that these forecasts will encourage strategic thinking and planning from the industry so that it can continue to provide visitors with high-quality experiences while striving toward the aspirational goals set out in the Tourism 2025 framework. The Government will also use these forecasts to inform its work in supporting the industry.
The forecasts are subject to the global situation. We have modelled a range of possible outcomes and present an average of these. The actual values in the future are likely to deviate from the modelled average.
The Ministry uses a technical committee to moderate and improve the forecast results. The technical committee consists of members from the Ministry, Air New Zealand, Airways New Zealand, Auckland International Airport, Christchurch International Airport, Queenstown Airport, Tourism Holdings Ltd, Tourism Industry Aotearoa, Tourism New Zealand and Wellington International Airport. This approach of combining quantitative modelling with expert industry knowledge has worked well to deliver better results. I would like to take this opportunity to thank all of you who were involved in this process.
I hope that tourism organisations, businesses and stakeholders find these forecasts helpful in their planning and investment decision-making.
Eileen Basher, General ManagerResearch, Evaluation and AnalyticsMinistry of Business, Innovation and Employment

MINISTRY OF BUSINESS, INNOVATION AND EMPLOYMENT MAY 2018NEW ZEALAND TOURISM FORECASTS 2018-2024
2
Contents
Foreword 1
Figures 3
Key Messages 4
Visitor arrivals are forecast to reach 5.1 million by 2024 4
International spend is forecast to reach nearly $15 billion by 2024 4
China is expected to become our largest market by spend 4
Australia will remain our largest source of visitor arrivals 4
Background 5
Interactive web tool and market summaries 5
1. International tourism forecasts, 2018 - 2024 6
2. Drivers of the forecasts 11
Arrivals 12
Air capacity 12
3. Forecast drivers and analysis by country 15
Australia 16
Asia 17
ȓ China 18
ȓ Japan 22
ȓ South Korea 22
ȓ India 23
ȓ Indonesia 24
ȓ Singapore 24
North America 25
ȓ The US 25
ȓ Canada 26
Europe 27
ȓ The UK 27
ȓ Germany 28
4. Uncertainty in the forecasts 29
5. Performance of the 2017-2023 forecasts 32
6. Appendix A: Forecast summaries by country 34

MINISTRY OF BUSINESS, INNOVATION AND EMPLOYMENT MAY 2018NEW ZEALAND TOURISM FORECASTS 2018-2024
3
Figures
Figure 1: Australia is projected to remain New Zealand’s largest market in terms of volume 8
Figure 2: Australia is currently our largest market by spend, but China is projected to overtake it by the end of the forecast period 8
Figure 3: Visitor growth from China and other Asian markets is expected to outperform traditional tourism markets, though Australia remains our largest market by volume 9
Figure 4: China is forecast to be New Zealand’s largest market by spend in 2024 10
Figure 5: Growth of international visitors will be largely driven by holiday-makers – visitor arrivals by purpose of visit 10
Figure 6: Arrivals from Asian markets are growing 12
Figure 7: Overall direct flight capacity to New Zealand will be unchanged in 2018 13
Figure 8: Falling US and Australia air capacity in 2018 offsets growth in most other markets 14
Figure 9: Asian destinations may increasingly compete with New Zealand for Australian tourists 17
Figure 10: Visitor arrivals from some Asian countries grew strongly over 2017 18
Figure 11: Friend and family-based Chinese travel groups dominate the market 19
Figure 12: Chinese holiday-makers are spending more time in New Zealand 19
Figure 13: The share of long-stay Chinese holiday-makers is approaching that of Australia and the United States 20
Figure 14: The Chinese are visiting more regions than before, improving regional dispersal 21
Figure 15: Most US visitors to New Zealand came from California in 2017 26
Figure 16: Prediction intervals of total arrivals and spending of Chinese visitors 30
Figure 17: Prediction intervals of total arrivals and spending of Australian visitors 31
Figure 18: Forecast vs actual for the 2017 -2023 forecasts 33
Figure 19: Forecast vs actual for the 2016 -2022 forecasts by country 34

MINISTRY OF BUSINESS, INNOVATION AND EMPLOYMENT MAY 2018NEW ZEALAND TOURISM FORECASTS 2018-2024
4
Key Messages
Visitor arrivals are forecast to reach 5.1 million by 2024 › International visitor arrivals to New Zealand are forecast to reach 5.1 million visitors in 2024
(from 3.7 million in 2017, up 37.1 per cent). This equates to a growth rate of 4.6 per cent per year.
› Strong short-term growth will be driven by a range of factors, including favourable economic situations, low travel costs, and destination marketing. This growth is forecast to moderate in the medium to long term.
International spend is forecast to reach nearly $15 billion by 2024 › Total annual international spend1 is forecast to reach $14.8 billion in 2024, up 39.7 per
cent from 2017, equating to a 4.9 per cent growth rate per year. Spend growth is forecast to grow at a slightly higher rate than visitor numbers, suggesting that spend per visitor will increase.
China is expected to become our largest market by spend › China is expected to become New Zealand’s largest tourism market by spend at the end
of the forecast period, reaching $3.1 billion annually by 2024 (compared with $3.0 billion for Australia). China visitor numbers are expected to reach 800,000 by the end of the forecast period.
› China is expected to contribute to 27.4 per cent of total international visitor growth from 2017 to 2024, and 38 per cent of total visitor spending.
Australia will remain our largest source of visitor arrivals › Australia is New Zealand’s largest visitor market and is forecast to remain so over the
forecast period. We forecast that this market will contribute 1.8 million annual visitors to New Zealand by 2024, up 23 per cent from 2017, or 3.0 per cent each year.
Other Asian markets will continue to grow › Increased connectivity and air capacity is forecast to drive short-term growth in visitors
from other Asian markets besides China, including India, Indonesia, and Singapore.
1 This measure refers to spend by travellers aged 15 and over, excluding international airfares, and individuals whose purpose of visit to New Zealand was to attend a recognised educational institute, and are foreign-fee paying students.

MINISTRY OF BUSINESS, INNOVATION AND EMPLOYMENT MAY 2018NEW ZEALAND TOURISM FORECASTS 2018-2024
5
BackgroundEach year, the Ministry of Business, Innovation and Employment (MBIE) produces international tourism forecasts to support planning and investment processes in the tourism industry.
The forecasts are developed using MBIE’s tourism forecasting model with input from a technical moderation committee of industry participants. This approach, supported by discussions with members of the industry, helped develop this outlook. The forecasts are based on microeconomic drivers, such as projected airfare costs and airline capacity, as well as macroeconomic drivers, such as projected exchange rates, oil prices, the global economy and the economies of our key visitor markets.
The forecasts provide a baseline for international tourism arrivals and spending. They can be used to help industry plan strategically but are not in any way setting targets for specific markets.
Expenditure in the forecasts refer to spend by travellers aged 15 and older, excluding international airfares, and individuals whose purpose of visit to New Zealand was to attend a recognised educational institute, and who are foreign-fee paying students. They may not align with other measures of tourism expenditure.
MBIE will continue to update the forecasts annually. They are based on estimated future demand and, as such, are not limited by any potential supply constraints, such as the capacity of accommodation, international flights and other factors such as emissions targets, or changes to government policies in our visitor markets or at home. These factors could limit actual growth to below what is forecast.
While the forecasts provide our best estimates of expected growth, the further out the time frame, the greater the uncertainty. The forecasts presented are averages of a range of modelled outcomes adjusted based on intelligence provided by the technical committee members who are tourism industry specialists. The actual values are likely to deviate from the modelled average (see the section on Uncertainty in the Forecasts for details).
A review of the performance of our previous tourism forecast has been conducted and included in the report. The review suggests that last years’ forecasts predicted 2017 arrivals and spend relatively well – though, of course, there remains the potential for improvements (see the section on Performance of the 2017-2023 Forecasts for details).
The Tourism 2025 framework provides a shared vision and common framework for the industry to increase the contribution of tourism to the New Zealand economy – with a goal of achieving $41 billion in domestic and international tourism spending by 2025. Government is helping industry realise that goal by shaping demand towards higher-value visitors, supporting the industry to deliver high-quality visitor experiences and helping ensure all regions and communities benefit from tourism. The tourism forecasts for 2018-2024 project that New Zealand is on target to meet and exceed the industry’s goal, based on the growth of international tourism spending alone.
Interactive web tool and market summariesAn interactive web tool to explore forecast data by market is available on MBIE’s website, as well as downloadable one-page summaries for each market. These can be found here: http://www.mbie.govt.nz/info-services/sectors-industries/tourism/tourism-research-data/international-tourism-forecasts/interactive-web-tool.

MINISTRY OF BUSINESS, INNOVATION AND EMPLOYMENT MAY 2018NEW ZEALAND TOURISM FORECASTS 2018-2024
6INTERNATIONAL TOURISM FORECASTS 2018 – 2024
1/6SECTION

MINISTRY OF BUSINESS, INNOVATION AND EMPLOYMENT MAY 2018NEW ZEALAND TOURISM FORECASTS 2018-2024
7
International tourism forecasts, 2018 – 2024Strong growth is forecast for both international arrivals and spend in New Zealand across the forecast period, driven by strong growth in Asian markets, especially China, and continued growth in established markets such as Australia, US and the UK.
All markets
2017 result 2024 result
Visitor arrivals (m)
3.7 5.1
Visitor spend ($b)
10.6 14.8
Overall international visitor arrivals to New Zealand are forecast to reach 5.1 million visitors in 2024 (from 3.7 million in 2017, up 37.1 per cent). This equates to a growth rate of 4.6 per cent per year.
Overall international visitor spend in New Zealand is forecast to reach $14.8 billion in 2024 (from $10.6 billion in 2017, up 39.7 per cent). This equates to a growth rate of 4.9 per cent per year. Spend is projected to grow at a faster pace than visitor numbers over the forecast period, suggesting that spend per visitor will increase.
Table 1: International tourism forecasts show strong growth in visitors and spend
Year 2017 2018 2019 2020 2021 2022 2023 2024 Total Annual2
Total spend ($m)
$10,563 $11,030 $11,729 $12,334 $12,956 $13,559 $14,164 $14,761 39.7% 4.9%
Total visitors (000s)
3,734 3,916 4,128 4,329 4,527 4,726 4,926 5,120 37.1% 4.6%
Total days (m)
68.9 73 77.2 81.1 84.8 88.8 92.7 96.7 40.3% 5.0%
Spend per day ($)
$190 $198 $199 $201 $202 $205 $207 $208 9.4% 1.3%
Avg length of stay (days)
18.5 18.6 18.7 18.7 18.7 18.8 18.8 18.9 2.3% 0.3%
2 Compound annual growth rate from 2017 to 2024.

MINISTRY OF BUSINESS, INNOVATION AND EMPLOYMENT MAY 2018NEW ZEALAND TOURISM FORECASTS 2018-2024
8 As seen in Figure 1, Australia provides, and will continue to provide, the largest share of our international visitor arrivals. We project that short-term growth will be supported by favourable economic conditions and relatively low travel costs. In the medium-to-long term, growth will continue as long as economic indicators remain strong.
Figure 1: Australia is projected to remain New Zealand’s largest market in terms of volume
0
500
1,000
1,500
2,000
2000 2005 2010 2015 2020 2025
Vis
itor a
rriv
als
(000
s)
AustraliaChinaUSUKGermanyJapanCanada
Source: Stats NZ and MBIE
China is New Zealand’s second largest tourism market in terms of both arrivals and spend. This market is expected to grow strongly during the forecast period, reaching and surpassing Australia as the largest contributor to spend by 20243.
Figure 2: Australia is currently our largest market by spend, but China is projected to overtake it by the end of the forecast period
0
1,000
2,000
3,000
2000 2005 2010 2015 2020 2025
Tota
l spe
nd ($
m)
ChinaAustraliaUSUKGermanyJapan
Source: MBIE
3 Poorer-than-expected results for 2017 in Chinese arrivals and spend estimates have led to a significant revision in forecasts downwards from the 2017-2023 edition. Factors driving the Chinese visitor market are complex and uncertainty remains around expected growth.

MINISTRY OF BUSINESS, INNOVATION AND EMPLOYMENT MAY 2018NEW ZEALAND TOURISM FORECASTS 2018-2024
9Other Asian countries (Japan, South Korea and Singapore) are expected to grow strongly, albeit from relatively smaller visitor bases than the China market. These markets are expected to maintain their growth momentum in the short term, supported by an increase in airline seat capacity and low airfare costs. Visitor growth is expected to moderate in the longer term.
Growth in US visitor arrivals is expected to be strong (especially for the next couple of years) due to favourable economic conditions there. The expected fall in direct flight capacity occurring in 2018 (see Figure 8) is expected to recover in subsequent years. Economic growth and a stronger US dollar is expected to boost spending of US visitors who come to New Zealand in the short-to-medium term.
The DHL British and Irish Lions Tour in 2017 led to an one-off positive shock in UK visitor numbers and spend last year, which are expected to drop slightly in 2018 as the market returns to ‘business as usual’. In the medium and long term, the UK market is expected to show moderate growth as the competition from cheaper European destinations is expected to limit a strong upturn in UK visitor arrivals.
Both the German and Canadian markets are expected to maintain strong growth in the short term, with growth moderating in the medium-to-long term. Short-term growth will be supported by an increase in airline seat capacity, and positive local economic conditions.
Figure 3: Visitor growth from China and other Asian markets is expected to outperform traditional tourism markets, though Australia remains our largest market by volume
Australia
Canada
China
Germany IndiaIndonesia
JapanKorea Singapore
UK
US
0
500
1,000
1,500
4% 6% 8% 10%Forecast compound annual growth rate (2017–2024) for arrivals
Fore
cast
202
4 ar
rival
s (0
00s)
Source: Stats NZ and MBIE
MINISTRY OF BUSINESS, INNOVATION AND EMPLOYMENT MAY 2018NEW ZEALAND TOURISM FORECASTS 2018-2024
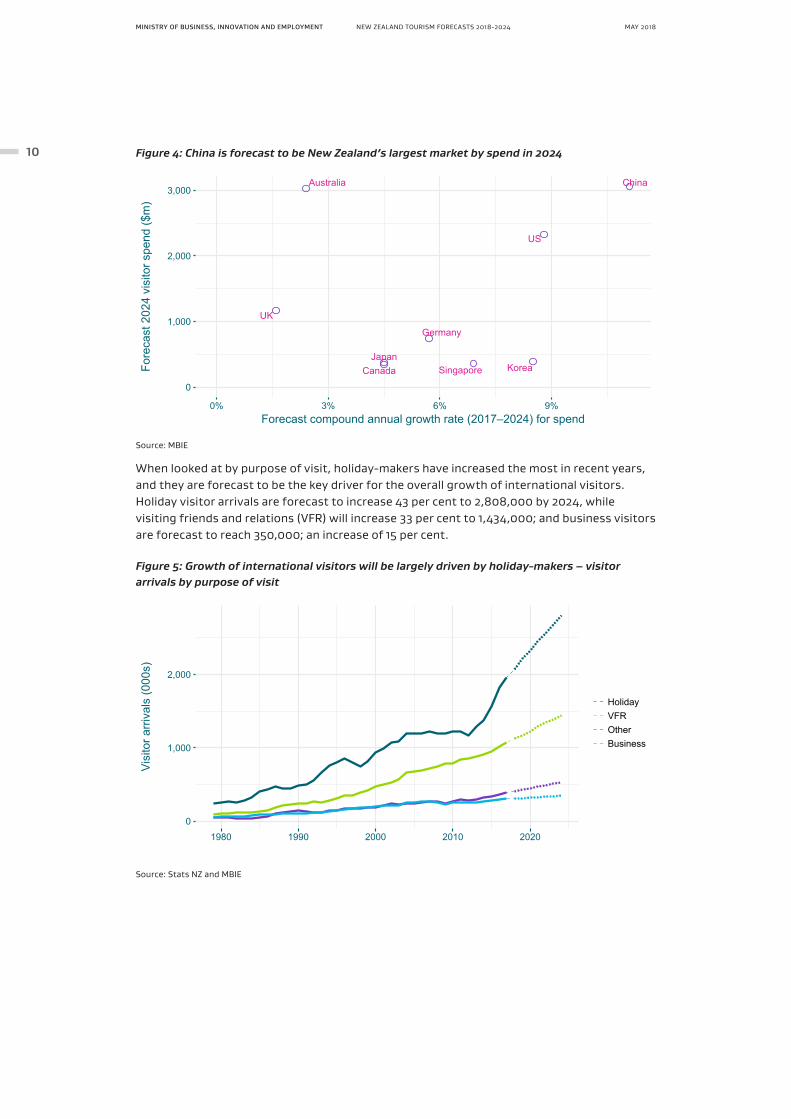
10 Figure 4: China is forecast to be New Zealand’s largest market by spend in 2024
Australia
Canada
China
Germany
JapanKoreaSingapore
UK
US
0
1,000
2,000
3,000
0% 3% 6% 9%Forecast compound annual growth rate (2017–2024) for spend
Fore
cast
202
4 vi
sito
r spe
nd ($
m)
Source: MBIE
When looked at by purpose of visit, holiday-makers have increased the most in recent years, and they are forecast to be the key driver for the overall growth of international visitors. Holiday visitor arrivals are forecast to increase 43 per cent to 2,808,000 by 2024, while visiting friends and relations (VFR) will increase 33 per cent to 1,434,000; and business visitors are forecast to reach 350,000; an increase of 15 per cent.
Figure 5: Growth of international visitors will be largely driven by holiday-makers – visitor arrivals by purpose of visit
0
1,000
2,000
1980 1990 2000 2010 2020
Vis
itor a
rriv
als
(000
s)
HolidayVFROtherBusiness
Source: Stats NZ and MBIE

MINISTRY OF BUSINESS, INNOVATION AND EMPLOYMENT MAY 2018NEW ZEALAND TOURISM FORECASTS 2018-2024
2/6SECTION DRIVERS OF
THE FORECASTS

MINISTRY OF BUSINESS, INNOVATION AND EMPLOYMENT MAY 2018NEW ZEALAND TOURISM FORECASTS 2018-2024
12
Drivers of the forecastsThis section provides an analysis of recent performance and the drivers of the 2018 forecasts.
ArrivalsFigure 6 shows the historic share of international visitor arrivals to New Zealand over time. While visitors from Oceania (mostly Australians) made up the largest share of New Zealand’s international visitors up to 2017, Asian markets are growing proportionately more than other markets in recent years.
In 2017, there was a slowdown in Chinese visitor number growth (up two per cent over the year compared with double digit growth in previous years) which led to a small reduction in overall Asian market share. At the same time, improved airline capacity to the US, Canada and South America has led to an improved market share.
Figure 6: Arrivals from Asian markets are growing
74,000 (2%)
456,000 (12%)
974,000 (26%)
581,000 (16%)
1,639,000 (44%)
0%
25%
50%
75%
100%
1983 1988 1993 1998 2003 2008 2013 2018
Sha
re o
f int
erna
tiona
l vis
itor a
rriv
als
Other Americas Asia Europe Oceania
Source: Stats NZ and MBIE
Air capacityThe increase in airline connectivity and capacity is one of the key contributors to the increase in international visitors to New Zealand. New routes starting and routes being cancelled from a country are likely to make a significant impact on international visitors from that country.
The non-stop flight capacity is projected to stay at the same level in 2018 (see Figure 7). Increases in non-stop flights from Asia (especially China, Japan and South Eastern Asian countries), the Middle East (connecting to European markets), and South America offset decreases from Australia and United States (markets which have been experiencing high levels of competition). Figure 8 illustrates how New Zealand is connected to the rest of world through airlines and where non-stop flights are going to change in 2018.

MINISTRY OF BUSINESS, INNOVATION AND EMPLOYMENT MAY 2018NEW ZEALAND TOURISM FORECASTS 2018-2024
13Figure 7: Overall non-stop flight capacity to New Zealand will be unchanged in 2018
-3% 9%
17%
6% -1% -5% 7% -1% 2%6% -3% 2%
5%5%
15%
8%0%
0
2
4
6
8
10
2001 2003 2005 2007 2009 2011 2013 2015 2017
Dire
ct a
irlin
e ca
paci
ty to
New
Zea
land
(mill
ion
seat
s)
Source: Sabre and MBIE

MINISTRY OF BUSINESS, INNOVATION AND EMPLOYMENT MAY 2018NEW ZEALAND TOURISM FORECASTS 2018-2024
14 Figure 8: Falling US and Australia air capacity in 2018 offsets growth in most other markets

MINISTRY OF BUSINESS, INNOVATION AND EMPLOYMENT MAY 2018NEW ZEALAND TOURISM FORECASTS 2018-2024
3/6SECTION FORECASTS DRIVERS
AND ANALYSIS BY COUNTRY

MINISTRY OF BUSINESS, INNOVATION AND EMPLOYMENT MAY 2018NEW ZEALAND TOURISM FORECASTS 2018-2024
16
Forecast drivers and analysis by countryThis section provides an overview of the drivers behind the forecasts for New Zealand’s largest tourism markets, along with some smaller markets with strong growth potential. Detailed one-page summaries of the forecast numbers by country are available in Appendix A: Forecast summaries by country. Only countries that have a sufficiently large number of visitors have a forecast for tourism spend, due to the limitations of the International Visitor Survey as a data source4.
Australia
2017 result 2024 result
Visitor arrivals (000s)
1,476 1,820 (up 3.0% p.a.)
Visitor spend ($m)
2,557 3,025 (up 2.4% p.a.)
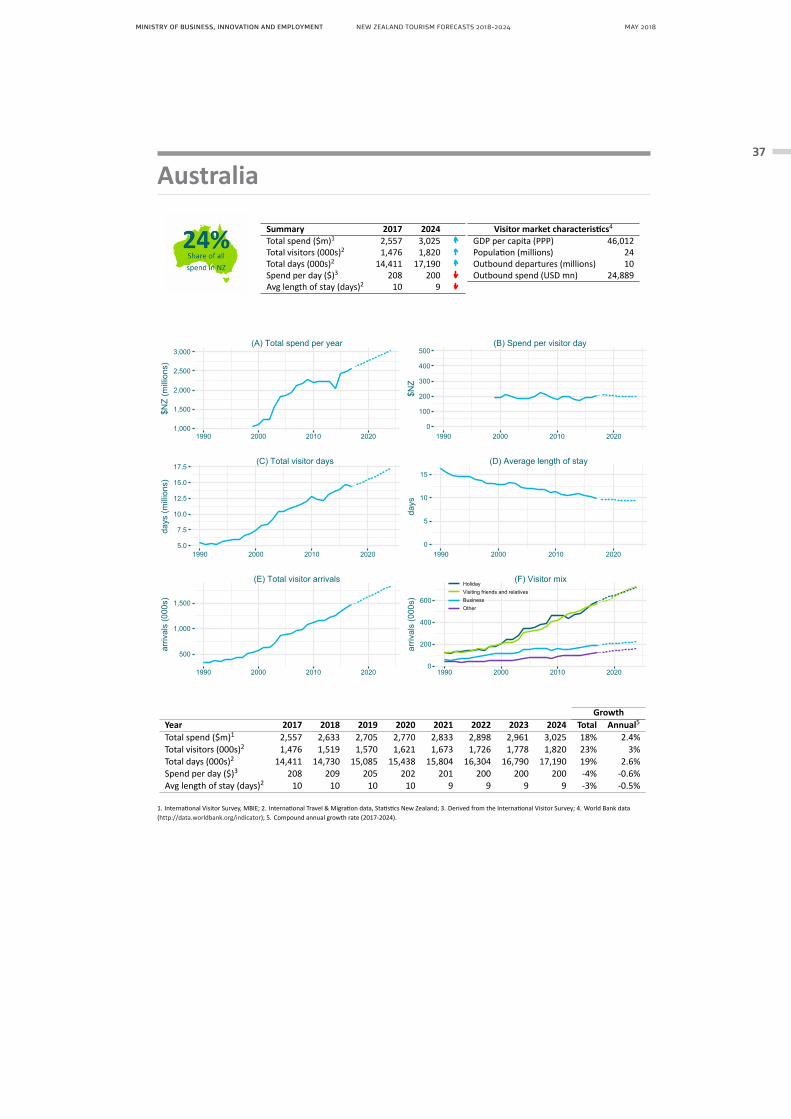
Australia is New Zealand’s only major short-haul market and provides many of our international visitor arrivals. Many Australian residents visit friends and relatives and tend to come more frequently but stay for shorter periods than visitors from long-haul markets. Of the 1.5 million Australian arrivals in 2017, nearly a third were New Zealand passport holders.
The growth in arrivals from Australia was still strong in 2017, up 4.6 per cent, but slightly moderated from the 6 per cent growth seen in the previous two years.
In the short term, we can expect moderate growth in the Australian visitor market due to decreased airline capacity in 2018. The recently announced end of the trans-Tasman alliance between Air New Zealand and Virgin Alliance may lead to a short-term bounce in Australian visitors, mainly across 2019. Long-term drivers include the movement of New Zealanders to Australia and the subsequent growth of travellers visiting friends and relatives.
4 The IVS is a sample survey. Countries with small samples in the survey (due to relatively low visitor numbers) are subject to higher amounts of error. If the historical spend time series for a country is not sufficiently robust, separate spend forecasts are excluded.

MINISTRY OF BUSINESS, INNOVATION AND EMPLOYMENT MAY 2018NEW ZEALAND TOURISM FORECASTS 2018-2024
17We expect that the growth in spending will continue into 2018 and 2019, as long as Australian economic indicators remain solid. The economy will continue growing at a robust pace. Business investment outside the housing and mining sectors will pick up. The strengthening labour market and household incomes will sustain private consumption, and inflation and wages will pick up gradually.
The longer-term outlook for Australia remains optimistic. The movement of New Zealanders (living in Australia) across the Tasman continues to grow visitor arrivals. That said, the broadening appeal of new and growing Asian markets may temper longer-term growth (see Figure 9).
Figure 9: Asian destinations may increasingly compete with New Zealand for Australian tourists
1,000
2,000
2010 2015 2020 2025
Aus
tralia
n ou
tbou
nd tr
avel
lers
(000
s)
Other AsiaEuropeNew ZealandIndonesiaUnited StatesChinaThailandSingaporeMalaysia
Source: Tourism Research Australia
AsiaDue to its proximity and growing middle-class population, Asia is an important source of growth for New Zealand tourism, currently and in the future. Outbound tourism from this region is changing the profile of New Zealand’s international tourism markets. Recent sustained visitor growth has coincided with expanding growth in spend.
Currently visitor numbers from other Asian markets are relatively small (compared to the China market for example) but are growing strongly. According to the latest IMF World Economic Outlook Update for January 20185, GDP growth is forecast to be strong for many of these markets in 2018, such as Indonesia, Philippines, and Vietnam; this suggests that visitor growth in these markets is likely to continue.
Part of Tourism New Zealand’s recent marketing focus has been on India and Indonesia, where it considers there are long-run opportunities for New Zealand. Tourism New Zealand is focused on accelerating growth in high-value visitors from these markets over the long term.
5 https://www.imf.org/en/Publications/WEO/Issues/2018/01/11/world-economic-outlook-update-january-2018

MINISTRY OF BUSINESS, INNOVATION AND EMPLOYMENT MAY 2018NEW ZEALAND TOURISM FORECASTS 2018-2024
18 Figure 10: Visitor arrivals from some Asian countries grew strongly over 2017
Source: International Travel and Migration, Stats NZ
China
2017 result 2024 result
Visitor arrivals (000s)
419 800 (up 9.7% p.a.)
Visitor spend ($m)
1,464 3,064 (up 11.1% p.a.)
Last year, Chinese visitors spent $1.5 billion in the New Zealand economy. Chinese visitors grew by two per cent in 2017 – a significant slowdown compared with previous years. The short-term slowdown in growth is expected to be temporary (with positive signs seen already in 2018) and more sustainable growth is expected to pick up during the medium-to-long term as China transitions from a maturing to a mature tourism market6 for New Zealand. Chinese visitors to Australia have recently replaced New Zealanders as Australia’s largest visitor market, and this is likely to have a flow-on effect onto the New Zealand market.
6 The profile of the Chinese tourism market becomes more similar in that of traditional markets such as the US and UK.

MINISTRY OF BUSINESS, INNOVATION AND EMPLOYMENT MAY 2018NEW ZEALAND TOURISM FORECASTS 2018-2024
19The short-term slowdown in growth may be partly attributed to the relative value of the New Zealand dollar versus the Chinese currency, as well as price sensitivity in this market. The longer-term trend shows that there has been a significant change in the mix of Chinese tourists over the past ten years. The share of working-age visitors (aged from 35 to 55) has decreased significantly while the share of younger and older visitors (those more likely to be travelling within friend or family groups) has increased significantly, as shown in Figure 11.
Figure 11: Friend and family-based Chinese travel groups dominate the market
Source: International Travel and Migration, Stats NZ and MBIE
The change in the mix of Chinese tourists has dramatically increased their length of stay and expanded the regions where they visit. As shown in Figure 12, the share of Chinese holiday-makers spending more than one week in New Zealand has increased from around 10 per cent to more than 50 per cent over the past 10 years.
Figure 12: Chinese holiday-makers are spending more time in New Zealand
1%3%7%
22%
67%
2%3%
10%
21%
64%
2%3%
12%
23%
59%
2%3%
12%
21%
62%
2%4%
14%
20%
60%
2%6%
19%
19%
54%
3%8%
24%
18%
47%
3%9%
29%
17%
43%
3%10%
34%
13%
41%
3%
10%
39%
11%
37%
0%
25%
50%
75%
100%
2008 2009 2010 2011 2012 2013 2014 2015 2016 2017
Sha
re o
f Chi
nese
hol
iday
mak
ers
by le
ngth
of s
tay Length of stay
Less than 3 days4 to 6 daysOne to two weeksTwo weeks to a monthOver a month
Source: International Travel and Migration, Stats NZ and MBIE
MINISTRY OF BUSINESS, INNOVATION AND EMPLOYMENT MAY 2018NEW ZEALAND TOURISM FORECASTS 2018-2024
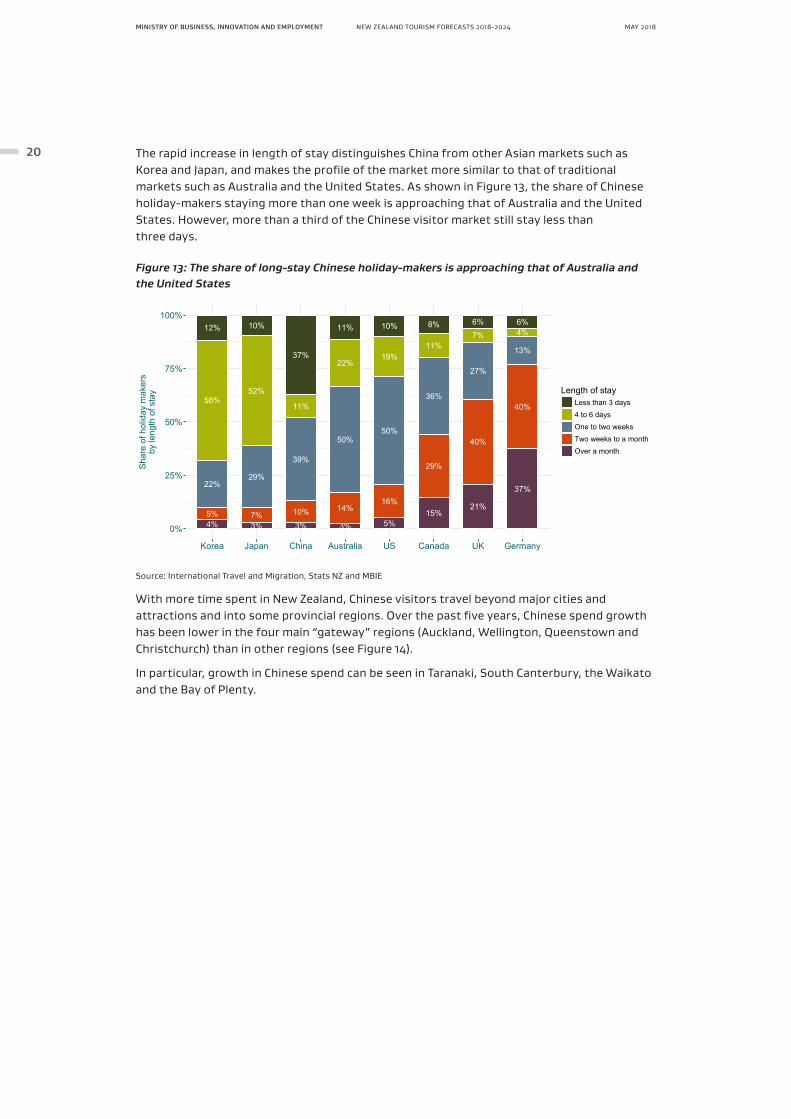
20 The rapid increase in length of stay distinguishes China from other Asian markets such as Korea and Japan, and makes the profile of the market more similar to that of traditional markets such as Australia and the United States. As shown in Figure 13, the share of Chinese holiday-makers staying more than one week is approaching that of Australia and the United States. However, more than a third of the Chinese visitor market still stay less than three days.
Figure 13: The share of long-stay Chinese holiday-makers is approaching that of Australia and the United States
4%5%
22%
56%
12%
3%7%
29%
52%
10%
3%
10%
39%
11%
37%
3%
14%
50%
22%
11%
5%
16%
50%
19%
10%
15%
29%
36%
11%
8%
21%
40%
27%
7%
6%
37%
40%
13%
4%6%
0%
25%
50%
75%
100%
Korea Japan China Australia US Canada UK Germany
Sha
re o
f hol
iday
mak
ers
by le
ngth
of s
tay Length of stay
Less than 3 days4 to 6 daysOne to two weeksTwo weeks to a monthOver a month
Source: International Travel and Migration, Stats NZ and MBIE
With more time spent in New Zealand, Chinese visitors travel beyond major cities and attractions and into some provincial regions. Over the past five years, Chinese spend growth has been lower in the four main “gateway” regions (Auckland, Wellington, Queenstown and Christchurch) than in other regions (see Figure 14).
In particular, growth in Chinese spend can be seen in Taranaki, South Canterbury, the Waikato and the Bay of Plenty.

MINISTRY OF BUSINESS, INNOVATION AND EMPLOYMENT MAY 2018NEW ZEALAND TOURISM FORECASTS 2018-2024
21Figure 14: The Chinese are visiting more regions than before, improving regional dispersal
Spend in gateway RTO regions:(Share | CAGR)
$1,294m (79% | 20%)
Spend in non-gateway RTO regions:(Share | CAGR)
$351m (21% | 23%)0%20%40%
Compound annualgrowth rate(2012-2017)
Spend in year endedDecember 2017 ($m)
250
500
750
Source: Monthly Regional Tourism Estimates, MBIE
Note: RTO stands for Regional Tourism Organisations
Note: Gateway RTO regions include Auckland, Wellington, Christchurch, and Queenstown
Chinese economic growth is projected to be below 7 per cent over the next two to three years (according to the IMF), as China rebalances its economy and increases the quality of economic growth, reorienting itself towards consumption and away from exports (though they remain heavily export-driven). These factors encourage rather than hinder Chinese households from undertaking international travel. We expect visitor arrivals from China to continue to grow strongly over the forecast horizon.

MINISTRY OF BUSINESS, INNOVATION AND EMPLOYMENT MAY 2018NEW ZEALAND TOURISM FORECASTS 2018-2024
22 Japan
2017 result 2024 result
Visitor arrivals (000s)
102 148 (up 4.7% p.a.)
Visitor spend ($m)
271 368 (up 4.5% p.a.)
According to the IMF, the economic growth forecast for Japan has been revised up for 2018 and 2019, reflecting upward revisions to external demand, the supplementary budget for 2018, and the carryover from stronger-than-expected recent activity. Over the medium term, a shrinking labour force will weigh on Japan’s growth prospects, although its per-capita income growth rates are projected to remain near the levels seen over the past several years.
This strong domestic performance, along with recent increases in airline capacity, was the main driver of recent visitor growth. We expect these factors will continue to contribute towards growth in Japanese visitors in the short-to-medium term. Risks to the outlook include geopolitical tension in the East Asian area and/or the global economy, and the subsequent flow-on impact this may have on the Japanese economy.
South Korea
2017 result 2024 result
Visitor arrivals (000s)
91 126 (up 4.7% p.a.)
Visitor spend ($m)
224 395 (up 8.5% p.a.)

MINISTRY OF BUSINESS, INNOVATION AND EMPLOYMENT MAY 2018NEW ZEALAND TOURISM FORECASTS 2018-2024
23The South Korean visitor market has been volatile over the last few years and is difficult to predict, with changes in demand largely driven by internal factors. Korean visitor arrivals increased 10.8 per cent in 2017, to 91,000 visitors. Korean household consumption has increased in 2017 and this trend is expected to continue. We expect moderate growth from the Korean market in the short-to-medium term.
South Korea’s economy improved in 2017 thanks to the Pyeongchang Winter Olympics and easing global trade tensions. Most analysts expect this growth to continue in later years. Interest rates have been low, stimulating consumption and investment in the economy. This contributes to economic growth, which helps to support outbound tourism.
Risks to the outlook include geopolitical tension in the East Asian area and/or the global economy and the subsequent flow-on impact on the South Korean economy.
India
2017 result 2024 result
Visitor arrivals (000s)
62 108 (up 8.3% p.a.)
In the latest IMF forecasts, the growth forecast for India is expected to pick up for 2018 and 2019. Economic growth is projected to strengthen to above 7 per cent, gradually recovering from the short-term adverse impact of rolling out the Goods and Services Tax (GST) and measures to choke off the black economy, including demonetisation. In the longer run, the Indian economy is expected to grow, supporting its outbound tourism.
India holds much promise as an emerging market for New Zealand in the future. The size of the market is huge, with India’s current population at 1.3 billion and it is set to overtake China as the most populous country in 2022 (as forecast by the United Nations). Incomes are also growing along with the cohort of middle class – who are the people most likely to travel. However, India’s average income and GDP per capita is much lower than other emerging regions, such as South America or China, reducing the ability of many people to travel abroad in the short term.
We expect this market to have an increasing propensity to travel to New Zealand. Indian visitors stay a long time in New Zealand; on average for 50 days per trip in 2017. This is driven by a large number of education visitors. Stricter enforcement of student visas may decrease both educational visitors and the average length of stay, but Indian visitors on other classes of visa are predicted to more than make up for this in the medium to long term.
We are unable to produce spend forecasts for this market as the sample size is not sufficiently large in the source data from the International Visitor Survey.

MINISTRY OF BUSINESS, INNOVATION AND EMPLOYMENT MAY 2018NEW ZEALAND TOURISM FORECASTS 2018-2024
24 Indonesia
2017 result 2024 result
Visitor arrivals (000s)
24 50 (up 11.2% p.a.)
Like India, Indonesia has a sizeable and growing population. Over time, Indonesia’s middle class will expand and will look to take advantage of tourism opportunities.
Visitor arrivals from Indonesia have surged in recent years, passing the level seen in the mid-1990s before the Asian financial crisis and Global Financial Crisis when visits plummeted. Although the aggregate arrivals are smaller than arrivals from other destinations, total visitor numbers have more than doubled in the last seven years. Air New Zealand fly a seasonal service to Bali and Emirates are due to start a year-round daily service between Auckland and Denpasar in mid-2018.
The outlook for continued expansion looks positive. Indonesians are starting to travel abroad, know Australia well and are increasingly choosing New Zealand as a destination. Like visitors from India, the number of Indonesian visitors to New Zealand is predicted to experience robust growth over the coming years.
We are unable to produce spend forecasts for this market as the sample size is not sufficiently large in the source data from the International Visitor Survey.
Singapore
2017 result 2024 result
Visitor arrivals (000s)
59 85 (up 5.4% p.a.)
Singapore has long been an important transfer stop connecting New Zealand to European, Middle East, and South East Asian markets. In recent years, strong economic growth, and newly added direct flights has seen Singapore in its own right become an important destination market to New Zealand.
Driven by existing direct connectivity, low airfare prices and their high personal income level, we forecast that arrivals from Singapore will grow at around 5.4 per cent a year, reaching more than 85,000 in 2024. We are unable to produce spend forecasts for this market as the sample size is not sufficiently large in the source data from the International Visitor Survey.

MINISTRY OF BUSINESS, INNOVATION AND EMPLOYMENT MAY 2018NEW ZEALAND TOURISM FORECASTS 2018-2024
25North America
The US
2017 result 2024 result
Visitor arrivals (000s)
331 516 (up 6.5% p.a.)
Visitor spend ($m)
1,294 2,333 (up 8.8% p.a.)
As noted by the IMF, the US tax policy changes are expected to stimulate activity, with the short-term impact mostly driven by the investment response to the corporate income tax cuts. The effect on US growth is estimated to be positive through 2020, cumulating to 1.2 per cent through that year, with a range of uncertainty around this central scenario. Due to the temporary nature of some of its provisions, the tax policy package is projected to lower growth for a few years from 2022 onwards. The effects of the package on output and its trading partners contribute about half of the cumulative revision to global growth over 2018 and 2019.
Growth in visitor arrivals is expected to be strong for the next couple of years. The improving economy, stronger US dollar and the increase in the retired population (who tend to have the biggest travel budget) are expected to boost spending of US visitors who come to New Zealand.
Marketing, airline economics and the capacity on key routes will also help determine how many US visitors will come to New Zealand. Figure 15 shows that in 2017, most US visitors to New Zealand came from California. Air New Zealand’s route to Houston has opened up a direct connection between New Zealand and America’s southern states for the first time. As a result, Texas became the second largest state in terms of arrivals and the fastest in terms of growth in arrivals to New Zealand. The direct flight from Houston is also unlocking the potential for visitors from the East Coast, as will the newly-confirmed direct flight from Chicago, which is due to start in November 2018.

MINISTRY OF BUSINESS, INNOVATION AND EMPLOYMENT MAY 2018NEW ZEALAND TOURISM FORECASTS 2018-2024
26 Figure 15: California contributed the largest share of US visitors to New Zealand of any states
Other
Virginia
Hawaii
Illinois
Colorado
Washington
Florida
New York
Texas
California
0 50,000 100,000
Arizona
California Colorado
FloridaGeorgia
Illinois
Maryland
MassachusettsMichigan
Minnesota
New Jersey
New York
North Carolina
Ohio
Oregon
Pennsylvania
Texas
Utah
Virginia
Washington
10% 20%
Visitor CAGR2012-17 Direct flights to NZ
Houston
Los Angeles
San Francisco
Source: International Travel and Migration, Stats NZ
Canada
2017 result 2024 result
Visitor arrivals (000s)
67 92 (up 4.6% p.a.)
Canada’s economic growth is projected to increase to 2.2 per cent in 2018. Strong economic growth in the first half of 2017 is set to ease in coming quarters. Growth has been led by household consumption, which should slow as rapid job growth and wealth effects from house price appreciation abate.
Visitor growth from Canada was strong in 2017, at 12.7 per cent. Looking forward, we expect strong growth in visitor arrivals and spend from Canada in the short term, slowing in the longer term.
We are unable to produce spend forecasts for this market as the sample size is not sufficiently large in the source data from the International Visitor Survey.

MINISTRY OF BUSINESS, INNOVATION AND EMPLOYMENT MAY 2018NEW ZEALAND TOURISM FORECASTS 2018-2024
27EuropeAccording to the IMF, growth rates for many of the euro area economies have been revised up, especially for Germany, Italy, and the Netherlands, reflecting the stronger momentum in domestic demand and higher external demand.
However, important long-standing commercial agreements, such as the economic arrangements between the United Kingdom and rest of the European Union, are under renegotiation. An increase in trade barriers and regulatory realignments would weigh on global investment and reduce production efficiency, exerting a drag on potential growth in advanced, emerging market, and developing economies. The new Emirates flight between Dubai and Auckland will provide more capacity between New Zealand and Europe going forward.
The UK
2017 result 2024 result
Visitor arrivals (000s)
250 298 (up 2.5% p.a.)
Visitor spend ($m)
1,039 1,164 (up 1.6% p.a.)
The UK’s economic growth is expected to weaken in 2018 and 2019. Private consumption is projected to remain subdued as higher inflation, pushed up by the past depreciation of sterling, holds back household purchasing power. The unemployment rate is at a record low, but with slower growth this is unlikely to persist. Exchange rate depreciation should support exports, while import growth is projected to fall owing to weaker private consumption.
An agreement about a transition period linked to the EU exit after March 2019 is assumed and should support growth in 2018 and in 2019, reducing the extent to which uncertainty weighs on domestic spending. Prospects of maintaining the closest possible economic relationship between the United Kingdom and the European Union would further support economic growth.
The DHL British and Irish Lions Tour stimulated a 13 per cent increase in arrivals from the UK in 2017. In the short term, we expect the level of arrivals to decrease slightly as 2018 returns to ‘business as usual’. For the medium to long term, we expect moderate visitor and spend growth from this market. The competition from cheaper European destinations is expected to limit a strong upturn in UK visitor arrivals going forward.

MINISTRY OF BUSINESS, INNOVATION AND EMPLOYMENT MAY 2018NEW ZEALAND TOURISM FORECASTS 2018-2024
28 Germany
2017 result 2024 result
Visitor arrivals (000s)
105 148 (up 5.0% p.a.)
Visitor spend ($m)
500 740 (up 5.7% p.a.)
The profile of German visitors is materially different to most other visitors to New Zealand. A lot of Germans enter New Zealand on working holiday visas, stay for longer and spend less per day than other international visitors. The overall spend per visitor for this market is above average.
The number of working holiday visas means that labour market conditions in Germany could impact on the number of German visitor arrivals here in the medium term.
German economic growth is projected to remain solid and employment is set to expand further. Stronger activity in the Euro area is boosting exports and business investment. The German economy has had a stronger-than-expected performance during the latter part of 2017. Consequently, the growth projections for 2018 have also been revised upward, supporting the German economic outlook. Household consumption and residential investment are relatively strong and expected to pick up across the rest of 2018 and into 2019. These factors are likely to keep growth in German visitor arrivals strong for the next two to three years.

MINISTRY OF BUSINESS, INNOVATION AND EMPLOYMENT MAY 2018NEW ZEALAND TOURISM FORECASTS 2018-2024
4/6SECTION UNCERTAINTY IN
THE FORECASTS

MINISTRY OF BUSINESS, INNOVATION AND EMPLOYMENT MAY 2018NEW ZEALAND TOURISM FORECASTS 2018-2024
30
Uncertainty in the forecastsThis section shows some of the uncertainty behind the published forecast results.
Any forecast will involve uncertainty; MBIE’s tourism forecasts are no exception. The published results only show a set of point estimates, which can be thought of as weighted-average values of possible outcomes from our forecast models. There is a wide range of uncertainty for those point estimates. Countries that have relatively few visitors to New Zealand, or have volatile or unstable visitor growth patterns, have greater uncertainty around their forecasts and so tend to have wider prediction intervals.
Figure 16 and Figure 17 illustrate the uncertainty in the forecasts. They display the prediction intervals at an 80 per cent (darker grey region) and 95 per cent (dark and light grey regions) confidence level respectively, for the total arrival and spend by both Chinese and Australian visitors. A 95 per cent confidence level would mean that there is a 95 per cent chance that a future value will fall in the grey area. For example, there is a 95 per cent chance that total spend by Chinese visitors in 2024 can be any number ranging between $2.0 billion to $4.0 billion.
Figure 16: Prediction intervals of total arrivals and spending of Chinese visitors
0
250
500
750
1,000
1980 1990 2000 2010 2020Year
Tota
l arr
ival
s (0
00s)
from
Chi
na
0
1,000
2,000
3,000
4,000
2000 2005 2010 2015 2020 2025Year
Tota
l spe
nd b
y C
hine
sevi
sito
rs ($
m)
Source: Stats NZ, MBIE

MINISTRY OF BUSINESS, INNOVATION AND EMPLOYMENT MAY 2018NEW ZEALAND TOURISM FORECASTS 2018-2024
31Figure 17: Prediction intervals of total arrivals and spending of Australian visitors
500
1,000
1,500
2,000
1980 1990 2000 2010 2020Year
Tota
l arr
ival
s (0
00s)
from
Aus
tralia
1,000
2,000
3,000
2000 2005 2010 2015 2020 2025Year
Tota
l spe
nd b
y A
ustra
liavi
sito
rs ($
m)
Source: Stats NZ, MBIE

MINISTRY OF BUSINESS, INNOVATION AND EMPLOYMENT MAY 2018NEW ZEALAND TOURISM FORECASTS 2018-2024
32
5/6SECTION PERFORMANCE OF
THE 2017 – 2023 FORECASTS

MINISTRY OF BUSINESS, INNOVATION AND EMPLOYMENT MAY 2018NEW ZEALAND TOURISM FORECASTS 2018-2024
33
Performance of the 2017 – 2023 forecastsThis section provides an overview of the performance of MBIE’s 2017-2023 tourism forecasts.
For the 2017 year from the 2017-2023 forecasts, total arrivals were over-forecast by 0.3 per cent, while spend was over-forecast by 1.2 per cent, which makes the 2017 forecasts the most accurate forecast over the past seven years.
The greater divergence for spend highlights the fact that spend is more difficult to forecast due to a greater number of complicating factors.
On a per-country basis, results were more varied. Smaller countries showed greater divergence from the forecasts, while more established countries were generally more accurate.
Figure 18: Forecast vs actual for the 2017 -2023 forecasts
0.5% 0.2% 0.7%
-4.8%
-1.8%-4.3%
-0.7%
0.3%
-20%
-10%
0%
10%
20%
2010 2011 2012 2013 2014 2015 2016 2017Year of forecast
Per
cent
age
diffe
renc
e be
twee
n th
e fir
st y
ear f
orec
ast a
nd a
ctua
l
Arrival - the first year forecast vs. actual
-6.8%
-15.9%
4.5%
1.2%
-20%
-10%
0%
10%
20%
2010 2011 2012 2013 2014 2015 2016 2017Year of forecast
Per
cent
age
diffe
renc
e be
twee
n th
e fir
st y
ear f
orec
ast a
nd a
ctua
l
Spend - the first year forecast vs. actual
Source: MBIE

MINISTRY OF BUSINESS, INNOVATION AND EMPLOYMENT MAY 2018NEW ZEALAND TOURISM FORECASTS 2018-2024
34 Figure 19: Forecast vs actual for the 2016 -2022 forecasts by country
0%0.3%
-0.3% -0.6%
1.1%
-3%
4.5%
-6.8%
7.1%
-8.1% -8.2%
-50%
-25%
0%
25%
50%
US All Germany UK Australia Korea Japan India China Indonesia Canada
Per
cent
age
diffe
renc
e be
twee
n th
e fir
st y
ear f
orec
ast a
nd a
ctua
lArrival - the first year forecast vs. actual
0.9% 1.2%
-2.5% -3%
-12.7%
18.1% 19.7% 22.2%
29.9%
-50%
-25%
0%
25%
50%
Australia All US UK Canada Germany Japan China Korea
Per
cent
age
diffe
renc
e be
twee
n th
e fir
st y
ear f
orec
ast a
nd a
ctua
l
Spend - the first year forecast vs. actual
0%0.3%
-0.3% -0.6%
1.1%
-3%
4.5%
-6.8%
7.1%
-8.1% -8.2%
-50%
-25%
0%
25%
50%
US All Germany UK Australia Korea Japan India China Indonesia Canada
Per
cent
age
diffe
renc
e be
twee
n th
e fir
st y
ear f
orec
ast a
nd a
ctua
l
Arrival - the first year forecast vs. actual
0.9% 1.2%
-2.5% -3%
-12.7%
18.1% 19.7% 22.2%
29.9%
-50%
-25%
0%
25%
50%
Australia All US UK Canada Germany Japan China Korea
Per
cent
age
diffe
renc
e be
twee
n th
e fir
st y
ear f
orec
ast a
nd a
ctua
l
Spend - the first year forecast vs. actual
Source: MBIE

MINISTRY OF BUSINESS, INNOVATION AND EMPLOYMENT MAY 2018NEW ZEALAND TOURISM FORECASTS 2018-2024
35
6/6SECTION APPENDIX A:
FORECAST SUMMARIES BY COUNTRY

MINISTRY OF BUSINESS, INNOVATION AND EMPLOYMENT MAY 2018NEW ZEALAND TOURISM FORECASTS 2018-2024
36
All markets
Summary 2017 2024Total spend ($m)1 10,563 14,761Total visitors (000s)2 3,734 5,120Total days (000s)2 68,924 96,726Spend per day ($)3 190 208Avg length of stay (days)2 18 19
5,000
7,500
10,000
12,500
15,000
1990 2000 2010 2020
$NZ
(mill
ions
)
(A) Total spend per year
0
100
200
300
400
500
1990 2000 2010 2020
$NZ
(B) Spend per visitor day
20
40
60
80
100
1990 2000 2010 2020
days
(mill
ions
)
(C) Total visitor days
0
5
10
15
20
1990 2000 2010 2020
days
(D) Average length of stay
1,000
2,000
3,000
4,000
5,000
1990 2000 2010 2020
arriv
als
(000
s)
(E) Total visitor arrivals
0
1,000
2,000
1990 2000 2010 2020
arriv
als
(000
s)
HolidayVisiting friends and relativesBusinessOther
(F) Visitor mix
GrowthYear 2017 2018 2019 2020 2021 2022 2023 2024 Total Annual4
Total spend ($m)1 10,563 11,030 11,729 12,334 12,956 13,559 14,164 14,761 40% 4.9%Total visitors (000s)2 3,734 3,916 4,128 4,329 4,527 4,726 4,926 5,120 37% 4.6%Total days (000s)2 68,924 73,000 77,161 81,050 84,847 88,789 92,749 96,726 40% 5%Spend per day ($)3 190 198 199 201 202 205 207 208 9% 1.3%Avg length of stay (days)2 18 19 19 19 19 19 19 19 2% 0.3%
1. �nterna�onal �isitor S�rvey, ����� 2. �nterna�onal Travel � �igra�on data, Sta�s��s �ew �ealand� 3. �erived from the �nterna�onal �isitor S�rvey� 4. �ompo�nd ann�algrowth rate (2017-2024).
MINISTRY OF BUSINESS, INNOVATION AND EMPLOYMENT MAY 2018NEW ZEALAND TOURISM FORECASTS 2018-2024
37
Australia
Summary 2017 2024Total spend ($m)1 2,557 3,025Total visitors (000s)2 1,476 1,820Total days (000s)2 14,411 17,190Spend per day ($)3 208 200Avg length of stay (days)2 10 9
Visitor mar�et �hara�teris��s4
GDP per capita (PPP) 46,012Popula�on (millions) 24Outbound departures (millions) 10Outbound spend (USD mn) 24,889
1,000
1,500
2,000
2,500
3,000
1990 2000 2010 2020
$NZ
(mill
ions
)
(A) Total spend per year
0
100
200
300
400
500
1990 2000 2010 2020
$NZ
(B) Spend per visitor day
5.0
7.5
10.0
12.5
15.0
17.5
1990 2000 2010 2020
days
(mill
ions
)
(C) Total visitor days
0
5
10
15
1990 2000 2010 2020
days
(D) Average length of stay
500
1,000
1,500
1990 2000 2010 2020
arriv
als
(000
s)
(E) Total visitor arrivals
0
200
400
600
1990 2000 2010 2020
arriv
als
(000
s)
HolidayVisiting friends and relativesBusinessOther
(F) Visitor mix
GrowthYear 2017 2018 2019 2020 2021 2022 2023 2024 Total Annual5
Total spend ($m)1 2,557 2,633 2,705 2,770 2,833 2,898 2,961 3,025 18% 2.4%Total visitors (000s)2 1,476 1,519 1,570 1,621 1,673 1,726 1,778 1,820 23% 3%Total days (000s)2 14,411 14,730 15,085 15,438 15,804 16,304 16,790 17,190 19% 2.6%Spend per day ($)3 208 209 205 202 201 200 200 200 -4% -0.6%Avg length of stay (days)2 10 10 10 10 9 9 9 9 -3% -0.5%
1. �nterna�onal �isitor Survey, ����; 2. �nterna�onal Travel � �igra�on data, Sta�s�cs �ew �ealand; 3. Derived from the �nterna�onal �isitor Survey; 4. �orld �ank data(http://data.worldbank.org/indicator); 5. Compound annual growth rate (2017-2024).
MINISTRY OF BUSINESS, INNOVATION AND EMPLOYMENT MAY 2018NEW ZEALAND TOURISM FORECASTS 2018-2024
38
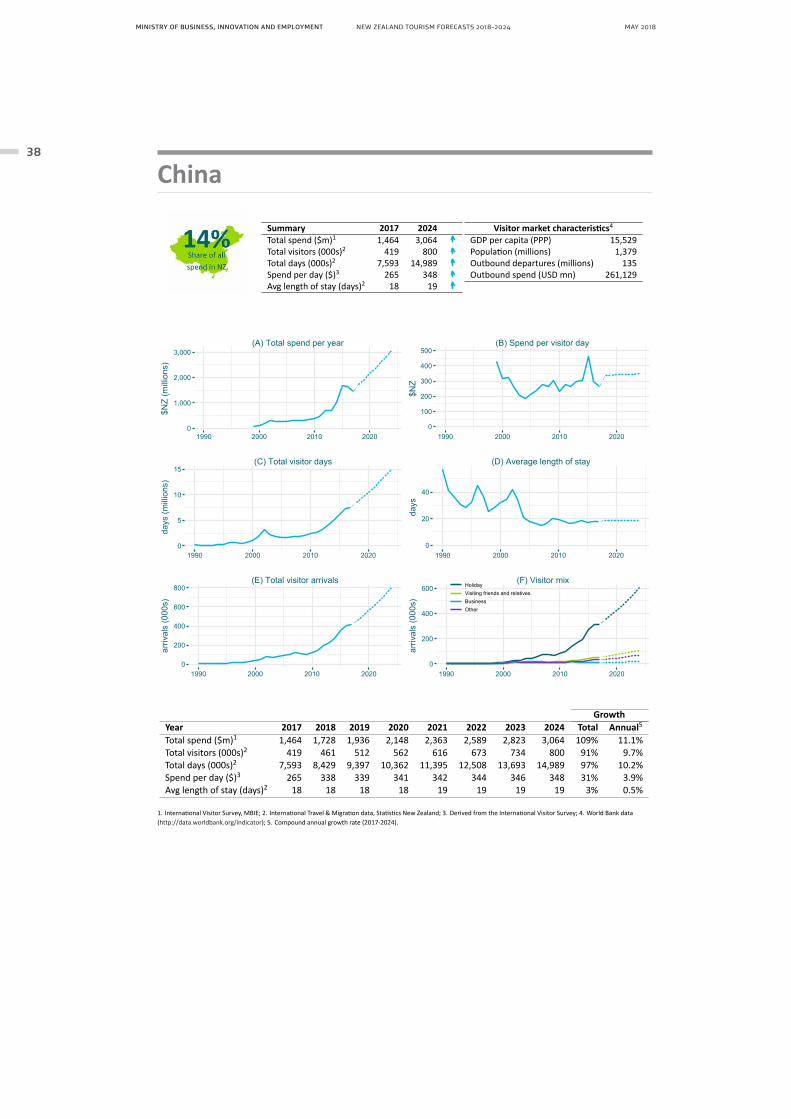
China
Summary 2017 2024Total spend ($m)1 1,464 3,064Total visitors (000s)2 419 800Total days (000s)2 7,593 14,989Spend per day ($)3 265 348Avg length of stay (days)2 18 19
Visitor mar�et �hara�teris��s4
GDP per capita (PPP) 15,529Popula�on (millions) 1,379Outbound departures (millions) 135Outbound spend (USD mn) 261,129
0
1,000
2,000
3,000
1990 2000 2010 2020
$NZ
(mill
ions
)
(A) Total spend per year
0
100
200
300
400
500
1990 2000 2010 2020
$NZ
(B) Spend per visitor day
0
5
10
15
1990 2000 2010 2020
days
(mill
ions
)
(C) Total visitor days
0
20
40
1990 2000 2010 2020
days
(D) Average length of stay
0
200
400
600
800
1990 2000 2010 2020
arriv
als
(000
s)
(E) Total visitor arrivals
0
200
400
600
1990 2000 2010 2020
arriv
als
(000
s)
HolidayVisiting friends and relativesBusinessOther
(F) Visitor mix
GrowthYear 2017 2018 2019 2020 2021 2022 2023 2024 Total Annual5
Total spend ($m)1 1,464 1,728 1,936 2,148 2,363 2,589 2,823 3,064 109% 11.1%Total visitors (000s)2 419 461 512 562 616 673 734 800 91% 9.7%Total days (000s)2 7,593 8,429 9,397 10,362 11,395 12,508 13,693 14,989 97% 10.2%Spend per day ($)3 265 338 339 341 342 344 346 348 31% 3.9%Avg length of stay (days)2 18 18 18 18 19 19 19 19 3% 0.5%
1. �nterna�onal �isitor Survey, ����; 2. �nterna�onal Travel � �igra�on data, Sta�s�cs �ew �ealand; 3. Derived from the �nterna�onal �isitor Survey; 4. �orld �ank data(http://data.worldbank.org/indicator); 5. Compound annual growth rate (2017-2024).

MINISTRY OF BUSINESS, INNOVATION AND EMPLOYMENT MAY 2018NEW ZEALAND TOURISM FORECASTS 2018-2024
39
United States of America
Summary 2017 2024Total spend ($m)1 1,294 2,333Total visitors (000s)2 331 516Total days (000s)2 5,091 7,751Spend per day ($)3 302 303Avg length of stay (days)2 15 15
Visitor mar�et characteris�cs4
GDP per capita (PPP) 57,638Popula�on (millions) 323Outbound departures (millions) 73Outbound spend (USD mn) 123,620
500
1,000
1,500
2,000
1990 2000 2010 2020
$NZ
(mill
ions
)
(A) Total spend per year
0
100
200
300
400
500
1990 2000 2010 2020
$NZ
(B) Spend per visitor day
2
4
6
8
1990 2000 2010 2020
days
(mill
ions
)
(C) Total visitor days
0
5
10
15
1990 2000 2010 2020
days
(D) Average length of stay
200
300
400
500
1990 2000 2010 2020
arriv
als
(000
s)
(E) Total visitor arrivals
0
100
200
300
1990 2000 2010 2020
arriv
als
(000
s)
HolidayVisiting friends and relativesBusinessOther
(F) Visitor mix
GrowthYear 2017 2018 2019 2020 2021 2022 2023 2024 Total Annual5
Total spend ($m)1 1,294 1,482 1,646 1,812 1,957 2,095 2,222 2,333 80% 8.8%Total visitors (000s)2 331 364 399 427 452 475 496 516 56% 6.5%Total days (000s)2 5,091 5,466 5,984 6,407 6,794 7,129 7,452 7,751 52% 6.2%Spend per day ($)3 302 277 285 288 292 296 299 303 0% 0.1%Avg length of stay (days)2 15 15 15 15 15 15 15 15 -2% -0.3%
1. �nterna�onal �isitor Survey, ����; 2. �nterna�onal Travel � �igra�on data, Sta�s�cs �ew �ealand; 3. Derived from the �nterna�onal �isitor Survey; 4. �orld �ank data(http://data.worldbank.org/indicator); 5. Compound annual growth rate (2017-2024).

MINISTRY OF BUSINESS, INNOVATION AND EMPLOYMENT MAY 2018NEW ZEALAND TOURISM FORECASTS 2018-2024
40
United Kingdom
Summary 2017 2024Total spend ($m)1 1,039 1,164Total visitors (000s)2 250 298Total days (000s)2 6,507 8,617Spend per day ($)3 152 165Avg length of stay (days)2 26 29
Visitor mar�et �hara�teris��s4
GDP per capita (PPP) 42,609Popula�on (millions) 66Outbound departures (millions) 71Outbound spend (USD mn) 64,774
600
800
1,000
1,200
1,400
1990 2000 2010 2020
$NZ
(mill
ions
)
(A) Total spend per year
0
100
200
300
400
500
1990 2000 2010 2020
$NZ
(B) Spend per visitor day
4
6
8
1990 2000 2010 2020
days
(mill
ions
)
(C) Total visitor days
0
10
20
30
1990 2000 2010 2020
days
(D) Average length of stay
100
150
200
250
300
1990 2000 2010 2020
arriv
als
(000
s)
(E) Total visitor arrivals
0
50
100
150
1990 2000 2010 2020
arriv
als
(000
s)
HolidayVisiting friends and relativesBusinessOther
(F) Visitor mix
GrowthYear 2017 2018 2019 2020 2021 2022 2023 2024 Total Annual5
Total spend ($m)1 1,039 957 989 1,021 1,055 1,090 1,126 1,164 12% 1.6%Total visitors (000s)2 250 242 255 265 273 281 289 298 19% 2.5%Total days (000s)2 6,507 7,011 7,378 7,683 7,910 8,139 8,375 8,617 32% 4.1%Spend per day ($)3 152 152 153 158 158 161 163 165 8% 1.1%Avg length of stay (days)2 26 29 29 29 29 29 29 29 11% 1.5%
1. �nterna�onal �isitor Survey, ����; 2. �nterna�onal Travel � �igra�on data, Sta�s�cs �ew �ealand; 3. Derived from the �nterna�onal �isitor Survey; 4. �orld �ank data(http://data.worldbank.org/indicator); 5. Compound annual growth rate (2017-2024).

MINISTRY OF BUSINESS, INNOVATION AND EMPLOYMENT MAY 2018NEW ZEALAND TOURISM FORECASTS 2018-2024
41
Germany
Summary 2017 2024Total spend ($m)1 500 740Total visitors (000s)2 105 148Total days (000s)2 4,787 6,733Spend per day ($)3 95 107Avg length of stay (days)2 46 46
Visitor mar�et �hara�teris��s4
GDP per capita (PPP) 48,861Popula�on (millions) 83Outbound departures (millions)6 91Outbound spend (USD mn) 79,906
200
400
600
1990 2000 2010 2020
$NZ
(mill
ions
)
(A) Total spend per year
0
100
200
300
400
500
1990 2000 2010 2020
$NZ
(B) Spend per visitor day
2
4
6
1990 2000 2010 2020
days
(mill
ions
)
(C) Total visitor days
0
20
40
1990 2000 2010 2020
days
(D) Average length of stay
25
50
75
100
125
150
1990 2000 2010 2020
arriv
als
(000
s)
(E) Total visitor arrivals
0
30
60
90
1990 2000 2010 2020
arriv
als
(000
s)
HolidayVisiting friends and relativesBusinessOther
(F) Visitor mix
GrowthYear 2017 2018 2019 2020 2021 2022 2023 2024 Total Annual5
Total spend ($m)1 500 520 554 590 626 663 701 740 48% 5.7%Total visitors (000s)2 105 107 114 120 127 134 141 148 40% 5%Total days (000s)2 4,787 4,861 5,181 5,478 5,786 6,105 6,413 6,733 41% 5%Spend per day ($)3 95 107 107 107 107 107 107 107 12% 1.7%Avg length of stay (days)2 46 45 46 45 46 46 46 46 0% 0%
1. �nterna�onal �isitor Survey, ����; 2. �nterna�onal Travel � �igra�on data, Sta�s�cs �ew �ealand; 3. Derived from the �nterna�onal �isitor Survey; 4. �orld �ank data(http://data.worldbank.org/indicator); 5. Compound annual growth rate (2017-2024); 6. 2009 value.

MINISTRY OF BUSINESS, INNOVATION AND EMPLOYMENT MAY 2018NEW ZEALAND TOURISM FORECASTS 2018-2024
42
Japan
Summary 2017 2024Total spend ($m)1 271 368Total visitors (000s)2 102 141Total days (000s)2 1,612 2,194Spend per day ($)3 200 213Avg length of stay (days)2 16 16
Visitor mar�et �hara�teris��s4
GDP per capita (PPP) 42,203Popula�on (millions) 127Outbound departures (millions) 17Outbound spend (USD mn) 18,562
200
400
600
800
1990 2000 2010 2020
$NZ
(mill
ions
)
(A) Total spend per year
0
200
400
600
1990 2000 2010 2020
$NZ
(B) Spend per visitor day
1.2
1.6
2.0
2.4
1990 2000 2010 2020
days
(mill
ions
)
(C) Total visitor days
0
5
10
15
1990 2000 2010 2020
days
(D) Average length of stay
90
120
150
1990 2000 2010 2020
arriv
als
(000
s)
(E) Total visitor arrivals
0
50
100
150
1990 2000 2010 2020
arriv
als
(000
s)
HolidayVisiting friends and relativesBusinessOther
(F) Visitor mix
GrowthYear 2017 2018 2019 2020 2021 2022 2023 2024 Total Annual5
Total spend ($m)1 271 295 316 331 344 354 361 368 36% 4.5%Total visitors (000s)2 102 108 113 119 124 130 135 141 38% 4.7%Total days (000s)2 1,612 1,677 1,762 1,851 1,935 2,022 2,109 2,194 36% 4.5%Spend per day ($)3 200 201 210 210 209 211 213 213 7% 0.9%Avg length of stay (days)2 16 16 16 16 16 16 16 16 -1% -0.2%
1. �nterna�onal �isitor Survey, ����; 2. �nterna�onal Travel � �igra�on data, Sta�s�cs �ew �ealand; 3. Derived from the �nterna�onal �isitor Survey; 4. �orld �ank data(http://data.worldbank.org/indicator); 5. Compound annual growth rate (2017-2024).

MINISTRY OF BUSINESS, INNOVATION AND EMPLOYMENT MAY 2018NEW ZEALAND TOURISM FORECASTS 2018-2024
43
South Korea
Summary 2017 2024Total spend ($m)1 224 395Total visitors (000s)2 91 126Total days (000s)2 1,413 1,946Spend per day ($)3 245 312Avg length of stay (days)2 15 15
Visitor mar�et �hara�teris��s4
GDP per capita (PPP) 36,532Popula�on (millions) 51Outbound departures (millions) 22Outbound spend (USD mn) 26,642
100
200
300
400
1990 2000 2010 2020
$NZ
(mill
ions
)
(A) Total spend per year
0
100
200
300
400
500
1990 2000 2010 2020
$NZ
(B) Spend per visitor day
0.5
1.0
1.5
2.0
1990 2000 2010 2020
days
(mill
ions
)
(C) Total visitor days
0
10
20
30
40
1990 2000 2010 2020
days
(D) Average length of stay
0
50
100
1990 2000 2010 2020
arriv
als
(000
s)
(E) Total visitor arrivals
0
30
60
90
1990 2000 2010 2020
arriv
als
(000
s)
HolidayVisiting friends and relativesBusinessOther
(F) Visitor mix
GrowthYear 2017 2018 2019 2020 2021 2022 2023 2024 Total Annual5
Total spend ($m)1 224 284 307 329 348 363 379 395 77% 8.5%Total visitors (000s)2 91 99 105 111 115 119 122 126 38% 4.7%Total days (000s)2 1,413 1,530 1,629 1,718 1,788 1,840 1,892 1,946 38% 4.7%Spend per day ($)3 245 310 311 311 311 311 312 312 27% 3.5%Avg length of stay (days)2 15 15 15 15 15 15 15 15 0% 0%
1. �nterna�onal �isitor Survey, ����; 2. �nterna�onal Travel � �igra�on data, Sta�s�cs �ew �ealand; 3. Derived from the �nterna�onal �isitor Survey; 4. �orld �ank data(http://data.worldbank.org/indicator); 5. Compound annual growth rate (2017-2024).

MINISTRY OF BUSINESS, INNOVATION AND EMPLOYMENT MAY 2018NEW ZEALAND TOURISM FORECASTS 2018-2024
44
Canada
Summary 2017 2024Total visitors (000s)1 67 92Total days (000s)1 1,588 2,277Avg length of stay (days) 24 25
Visitor mar�et ��ara�teris��s2
GDP per capita (PPP) 44,644Popula�on (millions) 36Outbound departures (millions) 31Outbound spend (USD mn) 29,067
1.0
1.5
2.0
1990 2000 2010 2020
days
(mill
ions
)
(A) Total visitor days
0
10
20
30
1990 2000 2010 2020
days
(B) Average length of stay
40
60
80
1990 2000 2010 2020
arriv
als
(000
s)
(C) Total visitor arrivals
0
20
40
60
1990 2000 2010 2020
arriv
als
(000
s)
HolidayVisiting friends and relativesBusinessOther
(D) Visitor mix
GROWTHYear 2017 2018 2019 2020 2021 2022 2023 2024 Total Annual3
Total visitors (000s)1 67 72 77 81 84 87 90 92 37% 4.6%Total days (000s)1 1,588 1,787 1,908 2,003 2,085 2,156 2,220 2,277 43% 5.3%Avg length of stay (days)1 24 25 25 25 25 25 25 25 5% 0.7%
1. �nterna�onal Travel � Migra�on data, Sta�s�cs �ew �ealand; 2. �orld �ank data (http://data.worldbank.org/indicator); 3. Compound annual growth rate (2017-2024); 4. ForCanada, Singapore, �ndia, and �nodnesia, we are not able to produce spend forecasts as the sample si�e is not su�ciently large in the source data from the �nterna�onal �isitorSurvey; 5. Please note that March 2017 year visitor arrivals were 63,200, slightly lower than the calendar year 2017 forecast of 62,000. The March results came too late to beincluded, so short-term results may be slightly higher than those forecast.

MINISTRY OF BUSINESS, INNOVATION AND EMPLOYMENT MAY 2018NEW ZEALAND TOURISM FORECASTS 2018-2024
45
Singapore
Summary 2017 2024Total visitors (000s)1 59 85Total days (000s)1 772 1,183Avg length of stay (days) 13 14
Visitor mar�et ��ara�teris��s2
GDP per capita (PPP) 87,833Popula�on (millions) 6Outbound departures (millions) 9Outbound spend (USD mn) 22,102
0.50
0.75
1.00
1990 2000 2010 2020
days
(mill
ions
)
(A) Total visitor days
0
5
10
15
1990 2000 2010 2020
days
(B) Average length of stay
20
40
60
80
1990 2000 2010 2020
arriv
als
(000
s)
(C) Total visitor arrivals
0
20
40
60
1990 2000 2010 2020
arriv
als
(000
s)
HolidayVisiting friends and relativesBusinessOther
(D) Visitor mix
GROWTHYear 2017 2018 2019 2020 2021 2022 2023 2024 Total Annual3
Total visitors (000s)1 59 63 68 72 75 79 82 85 45% 5.4%Total days (000s)1 772 874 940 992 1,044 1,093 1,137 1,183 53% 6.3%Avg length of stay (days)1 13 14 14 14 14 14 14 14 6% 0.8%
1. �nterna�onal Travel � �igra�on data, Sta�s�cs �ew �ealand; 2. �orld �ank data (http://data.worldbank.org/indicator); 3. Compound annual growth rate (2017-2024); 4. ForCanada, Singapore, �ndia, and �nodnesia, we are not able to produce spend forecasts as the sample si�e is not su�ciently large in the source data from the �nterna�onal �isitorSurvey.

MINISTRY OF BUSINESS, INNOVATION AND EMPLOYMENT MAY 2018NEW ZEALAND TOURISM FORECASTS 2018-2024
46
India
Summary 2017 2024Total visitors (000s)1 62 108Total days (000s)1 3,109 5,567Avg length of stay (days) 50 52
Visitor mar�et ��ara�teris��s2
GDP per capita (PPP) 6,571Popula�on (millions) 1,324Outbound departures (millions) 22Outbound spend (USD mn) 16,377
0
2
4
1990 2000 2010 2020
days
(mill
ions
)
(A) Total visitor days
0
10
20
30
40
50
1990 2000 2010 2020
days
(B) Average length of stay
0
30
60
90
1990 2000 2010 2020
arriv
als
(000
s)
(C) Total visitor arrivals
0
10
20
30
40
50
1990 2000 2010 2020
arriv
als
(000
s)
HolidayVisiting friends and relativesBusinessOther
(D) Visitor mix
GROWTHYear 2017 2018 2019 2020 2021 2022 2023 2024 Total Annual3
Total visitors (000s)1 62 69 76 82 89 95 101 108 75% 8.3%Total days (000s)1 3,109 3,498 3,843 4,188 4,532 4,877 5,222 5,567 79% 8.7%Avg length of stay (days)1 50 50 51 51 51 51 51 52 2% 0.3%
1. �nterna�onal Travel � �igra�on data, Sta�s�cs �ew �ealand; 2. �orld �ank data (http://data.worldbank.org/indicator); 3. Compound annual growth rate (2017-2024); 4. ForCanada, Singapore, �ndia, and �nodnesia, we are not able to produce spend forecasts as the sample si�e is not su�ciently large in the source data from the �nterna�onal �isitorSurvey.

MINISTRY OF BUSINESS, INNOVATION AND EMPLOYMENT MAY 2018NEW ZEALAND TOURISM FORECASTS 2018-2024
47
Indonesia
Summary 2017 2024Total visitors (000s)1 24 50Total days (000s)1 420 971Avg length of stay (days) 18 19
Visitor mar�et ��ara�teris��s2
GDP per capita (PPP) 11,609Popula�on (millions) 261Outbound departures (millions) 8Outbound spend (USD mn) 7,549
0.25
0.50
0.75
1.00
1990 2000 2010 2020
days
(mill
ions
)
(A) Total visitor days
0
10
20
30
1990 2000 2010 2020
days
(B) Average length of stay
10
20
30
40
50
1990 2000 2010 2020
arriv
als
(000
s)
(C) Total visitor arrivals
0
10
20
30
40
1990 2000 2010 2020
arriv
als
(000
s)
HolidayVisiting friends and relativesBusinessOther
(D) Visitor mix
GROWTHYear 2017 2018 2019 2020 2021 2022 2023 2024 Total Annual3
Total visitors (000s)1 24 29 33 36 40 43 47 50 110% 11.2%Total days (000s)1 420 531 620 690 756 828 897 971 132% 12.7%Avg length of stay (days)1 18 19 19 19 19 19 19 19 10% 1.4%
1. �nterna�onal Travel � �igra�on data, Sta�s�cs �ew �ealand; 2. �orld �ank data (http://data.worldbank.org/indicator); 3. Compound annual growth rate (2017-2024); 4. ForCanada, Singapore, �ndia, and �nodnesia, we are not able to produce spend forecasts as the sample si�e is not su�ciently large in the source data from the �nterna�onal �isitorSurvey.

MINISTRY OF BUSINESS, INNOVATION AND EMPLOYMENT MAY 2018NEW ZEALAND TOURISM FORECASTS 2018-2024
48
Other
Summary 2017 2024Total spend ($m)1 2,955 3,320Total visitors (000s)2 891 1,179Total days (000s)2 25,920 35,029Spend per day ($)3 170 166Avg length of stay (days)2 29 30
1,500
2,000
2,500
3,000
1990 2000 2010 2020
$NZ
(mill
ions
)
(A) Total spend per year
0
100
200
300
400
500
1990 2000 2010 2020
$NZ
(B) Spend per visitor day
10
20
30
1990 2000 2010 2020
days
(mill
ions
)
(C) Total visitor days
0
10
20
30
1990 2000 2010 2020
days
(D) Average length of stay
250
500
750
1,000
1990 2000 2010 2020
arriv
als
(000
s)
(E) Total visitor arrivals
0
200
400
600
1990 2000 2010 2020
arriv
als
(000
s)
HolidayVisiting friends and relativesBusinessOther
(F) Visitor mix
GrowthYear 2017 2018 2019 2020 2021 2022 2023 2024 Total Annual4
Total spend ($m)1 2,955 2,853 2,980 3,024 3,109 3,174 3,249 3,320 12% 1.7%Total visitors (000s)2 891 943 984 1,023 1,062 1,101 1,140 1,179 32% 4.1%Total days (000s)2 25,920 27,509 28,836 30,110 31,351 32,585 33,805 35,029 35% 4.4%Spend per day ($)3 170 165 165 163 164 165 165 166 -2% -0.3%Avg length of stay (days)2 29 29 29 29 30 30 30 30 2% 0.3%
1. �nterna�onal �isitor S�rvey, ����� 2. �nterna�onal Travel � �igra�on data, Sta�s��s �ew �ealand� 3. �erived from the �nterna�onal �isitor S�rvey� 4. �ompo�nd ann�algrowth rate (2017-2024).


MBIE 3627 May 2018