Embed Size (px)
Citation preview

Investment Intensity Index‘New World Cities’ Reshapingthe Global Investment Landscape
Investment Intensity Index, March 2017
JLL Research
Investment Intensity Index 20172
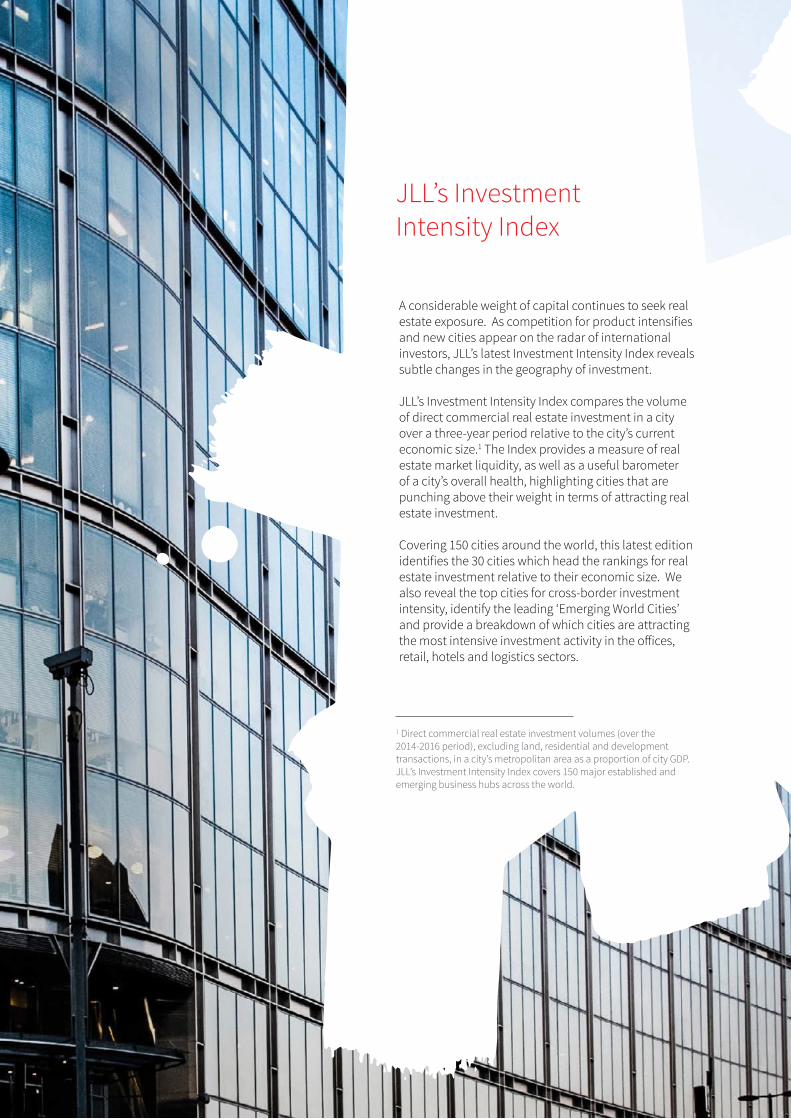
JLL’s Investment Intensity Index
2
A considerable weight of capital continues to seek real estate exposure. As competition for product intensifies and new cities appear on the radar of international investors, JLL’s latest Investment Intensity Index reveals subtle changes in the geography of investment.
JLL’s Investment Intensity Index compares the volume of direct commercial real estate investment in a city over a three-year period relative to the city’s current economic size.1 The Index provides a measure of real estate market liquidity, as well as a useful barometer of a city’s overall health, highlighting cities that are punching above their weight in terms of attracting real estate investment.
Covering 150 cities around the world, this latest edition identifies the 30 cities which head the rankings for real estate investment relative to their economic size. We also reveal the top cities for cross-border investment intensity, identify the leading ‘Emerging World Cities’ and provide a breakdown of which cities are attracting the most intensive investment activity in the offices, retail, hotels and logistics sectors.
1 Direct commercial real estate investment volumes (over the 2014-2016 period), excluding land, residential and development transactions, in a city’s metropolitan area as a proportion of city GDP. JLL’s Investment Intensity Index covers 150 major established and emerging business hubs across the world.

Investment Intensity Index 201733
Key highlightsThe rise of ‘New World Cities’ Mid-sized cities which typically specialise in high-tech and high-value activities are seeing steady growth in investment and dominate the top ranks of this year’s Investment Intensity Index. The contribution of the ‘New World Cities’ group to global investment volumes has risen from 12% in 2006 to 23% in 2016.
High capital flows into European cities Positive qualities relating to transparency, sustainability and stability, combined with strengths in technology, infrastructure and liveability, are supporting strong investor demand in European cities, which account for 12 of the Top 30 cities for overall investment intensity and 10 of the Top 12 for cross-border investment intensity.
Resilience of ‘Established World Cities’ Investor appetite remains robust for assets in the world’s most globalised metropolitan economies. As well as leading the rankings for absolute investment volumes, New York, London, Paris and Tokyo also feature in the Top 30 for investment intensity.
‘Emerging World Cities’ struggling to compete for investor attention With a few notable exceptions such as Shanghai and Beijing, major cities in the world’s fastest growing emerging economies are still struggling to make their mark as real estate investment destinations that match their rising economic weight. There are no ‘Emerging World Cities’ in the Top 30 for investment intensity.

Investment Intensity Index 20174
Investment Intensity Index
Global Top 30
Established World Cities
New World Cities
1. Oslo2. London3. Munich4. Edinburgh5. Silicon Valley6. Frankfurt7. Dublin8. Sydney9. New York10. Copenhagen11. Paris12. San Francisco13. Stockholm14. Boston15. Las Vegas16. Melbourne17. Geneva18. Raleigh-Durham19. Amsterdam20. Los Angeles21. Seattle22. Washington DC23. Austin24. Berlin25. Toronto26. Denver27. Phoenix28. Hong Kong29. San Diego30. Tokyo
Defining a typology of cities
Building on research originally undertaken in 20152, the JLL Investment Intensity Index pursues a ‘typology approach’ by reviewing investment trends in three broad categories of city:
• ‘New World Cities’ are small to medium-sized cities (typically 1-5 million population) that have robust infrastructure and attractive liveability platforms and deliberately focus on a limited number of global specialisms.
• ‘Established World Cities’ are the world’s most highly globalised and competitive economies with the deepest and most settled concentrations of companies, capital and talent.
• ‘Emerging World Cities’ are the business and political capitals of large or medium-sized emerging economies that function as gateways for international firms, trade and investment.
2Globalisation and Competition: The New World of Cities, JLL, 2015
Source: JLL, February 2017

Investment Intensity Index 20175
‘New World Cities’ reshaping the investment landscape
JLL’s latest Investment Intensity Index highlights the further rise of ‘New World Cities’ as destinations for real estate capital. Mid-sized cities, which typically excel in high-tech and high-value sectors supported by robust infrastructure, a favourable quality of life and transparent business practices, are drawing increasing interest from investors and account for 21 of the Investment Intensity Index Top 30 cities. Many are achieving global reach through specialisation and display an ability to adapt to constantly changing economic and technological demands:
• The Nordic cities feature strongly. Oslo tops the global rankings, while neighbouring Scandinavian capitals Copenhagen (10th) and Stockholm (13th) also appear in the Top 30.
• Other favoured ‘New World Cities’ in Europe include Munich (3rd), Edinburgh (4th), Frankfurt (6th), Dublin (7th), Geneva (17th), Amsterdam (19th) and Berlin (24th).
• ‘New World Cities’ also dominate the top rankings in the United States, epitomised by Silicon Valley (5th), San Francisco (12th) and Boston (14th), and also including Las Vegas (15th), Raleigh-Durham (18th), Seattle (21st), Austin (23rd), Denver (26th), Phoenix (27th) and San Diego (29th).
• Meanwhile, Australia’s archetypal ‘New World City’ Melbourne sits in 16th position.
An increasingly important part of the global investment market
Over the past decade, a core set of 40 ‘New World Cities’ has increased its share of global real estate investment volumes, growing from 12% in 2006 to account for 23% of global volumes in 2016, overtaking the share of global investment into the ‘Big 6’ markets of New York, London, Paris, Tokyo, Hong Kong and Singapore.
‘New World Cities’ are also increasingly attractive to cross-border investors and now represent over one-fifth of global cross-border transactional activity, up from 14% 10 years ago and equal to that registered in the ‘Big 6’.
‘New World Cities’ overtake ‘Big 6’ Direct commercial real estate investment, 2006-2016
Source: JLL, February 2017
0%
5%
10%
15%
20%
25%
30%
2006 2007 2008 2009 2010 2011 2012 2013 2014 2015 2016 0%
5%
10%
15%
20%
25%
30%
35%
40%
2006 2007 2008 2009 2010 2011 2012 2013 2014 2015 2016
New World Cities Big 6 Emerging World Cities
Cross-border investmentTotal investment
New World Cities
New World Cities

Investment Intensity Index 20176
‘New World Cities’ dominate Global Top 30
Established World Cities New World Cities
SydneyMelbourne
Hong KongTokyo
OsloLondonMunichEdinburghFrankfurtDublinCopenhagenParisStockholmGenevaAmsterdamBerlin
New YorkBostonWashington DCToronto
Silicon ValleySan FranciscoLas VegasLos AngelesSeattleDenverPhoenixSan Diego
Raleigh-DurhamAustin
Source: JLL, February 2017

Investment Intensity Index 20177
European cities maintain strong presence
European cities with high levels of transparency and sustainability together with robust technology, infrastructure and liveability credentials feature prominently, accounting for 12 of the Top 30 cities and 10 of the Top 12 cities for cross-border investment intensity.
• Oslo leads the global rankings again as a small but highly sought-after market, but the city fails to make the premier group of cities for cross-border investment intensity with its market dominated by domestic players.
• London sits in second position globally and heads the rankings for cross-border investment intensity, testament to its continuing attractiveness following the Brexit vote. Edinburgh (4th) is also placed among the top tier, and is second only to London in cross-border investment intensity.
• With Germany coming close in 2016 to surpassing the UK as the world’s second largest investment market, Munich (3rd), Frankfurt (6th) and Berlin (24th) performed particularly well.
• Meanwhile, Paris (11th) also continues to be among the world’s foremost destinations.
Cross-border capital targeting European citiesGlobal Top 12 - Cross-border investment intensity
Americas
EMEA
Asia Pacific
0% 5% 10% 15%
Berlin
Warsaw
San Francisco
Prague
Paris
Sydney
Amsterdam
Dublin
Munich
Frankfurt
Edinburgh
London
Cross-Border Transaction Volumes / GDP
Source: JLL, February 2017

Investment Intensity Index 20178
U.S. technology hubs attract high levels of investment intensity
Technology and innovation are boosting the attractiveness of ‘New World Cities’ in the U.S., with Silicon Valley, San Francisco, Boston, Seattle, Austin, Denver, Raleigh-Durham, Phoenix and San Diego all appearing in the Top 30. Nonetheless, the large U.S. gateway markets of New York, Washington DC and Los Angeles have maintained their dominance in absolute volumes and also make the top list in investment intensity.
Robust investor appetite for Australia’s Tier 1 cities
Australia’s largest cities continue to register healthy investor interest, with Sydney and Melbourne both among the Top 30. High levels of transparency and sustainability are combining with buoyant economies to support investor interest and strong value growth in Australian cities, with Sydney and Melbourne expected to experience among the world’s highest office rental and capital value growth in 2017.
‘Established World Cities’ top the rankings for absolute investment volumes
While ‘New World Cities’ account for the majority of markets in the Top 30, several ‘Established World Cities’ also make the list, including London (2nd), Sydney (8th), New York (9th), Paris (11th), Los Angeles (20th), Washington DC (22nd), Toronto (25th), Hong Kong (28th) and Tokyo (30th).
Investor appetite for prime assets in the world’s most globalised markets continues to be strong, and ‘Established World Cities’ head the rankings for absolute investment volumes, with 8 cities among the Top 10 markets.
Asian cities under-represented in the Top 30
With only Hong Kong (28th) and Tokyo (30th) in the Top 30, Asian cities are under-represented in the top ranks. This reflects a myriad of factors – local investors still dominate in most markets, core assets are tightly-held by landlords and institutional investment is still at a relatively early stage in some markets. While cities like Shanghai, Bangalore and Manila3 are racing ahead in their speed of development as real estate markets, they still have substantial room to grow when it comes to attracting investment.
3 JLL City Momentum Index, 2017

Investment Intensity Index 20179
Includes cities in the Top 30 for absolute investment volumes and Top 30 for investment intensitySource: JLL, February 2017
Source: JLL, February 2017
New York
London
Paris
Tokyo
Los Angeles
Washington DC
Chicago
Shanghai
Boston
Hong Kong
San Francisco
Seoul
Silicon Valley
Sydney
Seattle
Singapore
Dallas
Toronto
Atlanta
Beijing
11
12
13
14
15
16
17
18
19
20
Munich
Melbourne
Phoenix
Frankfurt
Miami
San Diego
Berlin
Stockholm
Denver
Philadelphia
21
22
23
24
25
26
27
28
29
30
EMEAAmericas Asia Pacific
1
2
3
4
5
6
7
8
9
10
Total investment versus investment intensityLondon, New York and Paris combine significant absolute investment volumes with high intensity
London New York
Paris
Boston San Francisco Silicon Valley
Sydney
Oslo Munich
Frankfurt Edinburgh
Dublin Melbourne Stockholm Edinburgh Las Vegas
Copenhagen Geneva
Inve
stm
ent V
olum
es
Cities with greatest total investment
volumes
Cities with greatest investment volumes and
high investment intensity
Investment Intensity Cities with high levels
of investment intensity
Beijing Philadelphia
Miami
Tokyo Los Angeles
Washington DC Chicago
Shanghai Hong Kong Singapore
Dallas Seattle
Toronto Atlanta Phoenix
Berlin San Diego
Denver Austin
Amsterdam Raleigh-Durham
Seoul
The world’s top real estate investment destinationsTop 30 - Direct Commercial Real Estate Investment, 2014-2016, Absolute Volumes (US$)

Investment Intensity Index 201710
Investment in ‘Emerging World Cities’ struggling to match rising economic weight
While there are now more cities than ever on investors’ radars, there are still no ‘Emerging World Cities’ in the Investment Intensity Index Top 30, with investors continuing to focus overwhelmingly on mature cities in transparent markets. Despite being among the world’s most rapidly globalising cities and acting as gateways for international firms, trade and investment into major emerging economies, combined ‘Emerging World Cities’ still account for only 6% of global volumes.
• Only Shanghai and Beijing have built up a critical mass of investment activity, sitting consistently in the Top 30 for absolute volumes. However, both cities fall short in terms of investment intensity compared with ‘Established World Cities’, serving to highlight the further growth potential of China’s two Alpha Cities.
• Top ranking ‘Emerging World Cities’ in investment intensity comprise transitional markets that have attained a reasonable level of transparency such as Warsaw, Prague, Budapest and Taipei, while Seoul, a hybrid city, saw investment volumes double in 2016. Both Warsaw and Prague have achieved a Top 12 position in cross-border investment intensity.
• Cities that are transitioning to higher-value activities – for instance Shenzhen, Guangzhou and Nanjing in China, together with Bucharest and Dubai – are beginning to witness higher levels of investment compared to historical levels, although these are still low both in absolute terms and in intensity levels.
• A number of emerging megacities – like Moscow, Sao Paulo, Kuala Lumpur, Mexico City and Bangkok – are also generating higher investor interest than most other ‘Emerging World Cities’, but transactional activity remains limited in relation to their economic size.
• Several ‘Emerging World Cities’ are still failing to punch their weight as destinations for direct real estate investment due to issues ranging from transparency, infrastructure challenges, market restrictions and ownership styles to economic and political volatility. These include Johannesburg, Istanbul, Manila and Jakarta as well as the Indian cities of Mumbai, Delhi and Bangalore, where investors frequently look to development and debt lending to gain real estate exposure.
‘Emerging World Cities’: investment volumes versus investment intensityCities with higher transparency are leading
MoscowSao PauloKuala LumpurMexico CityBangkok
ShenzhenGuangzhouNanjingBucharestDubai
MumbaiJohannesburgIstanbulManila
SeoulBeijing
BudapestTaipei
Inve
stm
ent V
olum
es
High
Low
PragueWarsaw
Shanghai
Investment Intensity
DelhiBangaloreJakarta
High
Source: JLL, February 2017

Investment Intensity Index 201711
New possibilities opening up in ‘Emerging World Cities’
A number of ‘Emerging World Cities’, such as Shanghai, Mexico City, Sao Paulo and Dubai, are positioned to draw increased investment activity in the coming years as the quality of stock and transparency improve.
An examination of foreign direct investment (FDI) activity into construction of commercial real estate points to future stock growth, with cities such as Ho Chi Minh City, Kuala Lumpur and Riyadh attracting the greatest amount of investment into construction, ahead of ‘Established World Cities’ like London, New York and Paris. In terms of FDI intensity (FDI investment as a proportion of city GDP), they are joined by Casablanca, Warsaw, Bucharest and Prague among the Top 10.
Growing real estate allocations from institutional investors and new sources of capital targeting the sector will expand the competition for stock. Investors will look increasingly to ‘Emerging World Cities’ to satisfy their requirements, with an estimated 60% of the global office development pipeline to 2020 in emerging markets. While offering huge opportunities, ‘Emerging World Cities’ will need to boost transparency, improve regulatory oversight and build robust financial platforms, otherwise investors will continue to gravitate to the highly transparent mature cities.
Source: FDiMarkets, JLL, February 2017
‘Emerging World Cities’ attracting most FDI in commercial real estate construction
Ho Chi Minh City
Kuala Lumpur
Riyadh
London
New York
Paris
Seoul
Hong Kong
Singapore
Sydney
Ho Chi Minh City
Casablanca
Kuala Lumpur
Riyadh
Manchester
Warsaw
Raleigh-Durham
Bucharest
Prague
Melbourne
1
2
3
4
5
6
7
8
9
10
1
2
3
4
5
6
7
8
9
10
Total Construction FDI Volumes Construction FDI Intensity
Americas
EMEA
Asia Pacific

Investment Intensity Index 201712
Offices Retail Hotels Logistics
Americas
EMEA
Asia Pacific
1. London2. Oslo3. Munich4. Frankfurt5. Paris6. Geneva7. Boston8. Silicon Valley9. Sydney10. Copenhagen11. New York12. Washington DC13. Melbourne14. Amsterdam15. Edinburgh16. Tokyo17. San Francisco18. Seattle19. Stockholm20. Warsaw
1. Las Vegas2. Edinburgh3. Copenhagen4. Oslo5. Auckland6. Dublin7. Toronto8. Raleigh-Durham9. Montreal10. Phoenix11. Brisbane12. Los Angeles13. Adelaide14. Zurich15. Miami16. Hong Kong17. Prague18. Austin19. Salt Lake City20. Sydney
1. Edinburgh2. London3. Oslo4. Munich5. Amsterdam6. Miami7. Hong Kong8. New York9. Dubai10. Frankfurt11. Vancouver12. Berlin13. San Francisco14. Manchester15. Dublin16. Tampa17. Vienna18. Hamburg19. Toronto20. Copenhagen
1. Sydney2. Toronto3. Brisbane4. Hong Kong5. Auckland6. Adelaide7. Singapore8. Fukuoka9. Montreal10. Amsterdam11. Taipei12. Munich13. Columbus14. Salt Lake City15. Perth16. Prague17. Frankfurt18. Phoenix19. Los Angeles20. Stockholm
Investment intensity index by sectorGlobal Top 20
Source: JLL, February 2017

Investment Intensity Index 201713
An analysis of the Investment Intensity Index for each of the main commercial property sectors reveals that many ‘New World Cities’ are successfully attracting investment consistently across multiple sectors, with 17 featuring in the Top 20 of at least two sectors and three European cities – Copenhagen, Edinburgh and Oslo – featuring in the Top 20 of three sectors.
The sector analysis also identifies several cities where investment activity is heavily tilted towards a single property sector:
Offices• Cities which have high Office Investment Intensity are concentrated in high-order business
centres (such as London, Paris, Frankfurt, New York and Tokyo), niche financial centres (like Geneva and Edinburgh), tech hubs (including Boston, Silicon Valley, San Francisco, Seattle, Munich and Stockholm) and seats of government (e.g. Washington DC and Berlin).
Retail• Investment Intensity in the retail sector is skewed by a few large shopping mall transactions.
For example, Las Vegas leads the current Retail Investment Intensity rankings as a consequence of three major mall transactions each exceeding US$1 billion during 2016.
• While many ‘Emerging World Cities’ have among the world’s greatest concentrations of international retailers (as scored by JLL’s Destination Retail 2016), the Retail Investment Intensity Top 20 ranking is heavily dominated by cities with high levels of per capita disposable income.
• Despite the region accounting for only 16% of global retail investment, a number of Asia Pacific cities feature in the Top 20 including Hong Kong as well as the Australasian markets of Auckland, Brisbane, Adelaide and Sydney.
Hotels• The Hotels Investment Intensity Top 20 highlights the attraction of the world’s most
connected gateway cities such as London, Miami, Hong Kong, New York and Dubai. The Top 20 also embraces a number of the world’s most important international conference cities like Amsterdam, Berlin and Vienna. UK regional cities are represented by Edinburgh and Manchester.
Logistics• Australasian cities feature prominently in the Logistics Investment Intensity Index, with Sydney
leading the rankings and Brisbane, Auckland, Adelaide and Perth all among the Top 20. Asian markets are represented by Hong Kong, Singapore, Taipei and Fukuoka (Japan).
• Testament to the depth and liquidity of the logistics market in the United States – which has accounted for over half of global logistics investment over the last three years – the Top 20 features several U.S. cities including Columbus, Salt Lake City, Phoenix and Los Angeles. Meanwhile over the border, Canada’s largest cities – Toronto and Montreal – sit in the Top 10.
• Despite the high proportion of portfolio deals in Europe that are not registered by a specific city – 38% of all logistics deals in Europe over the last three years were platform or portfolio transactions covering more than one city, against 9% in Asia Pacific and 13% in the Americas – several cities from the region make the Top 20, including Amsterdam, Munich, Prague, Frankfurt and Stockholm.

JLL Regional Headquarters
Chicago200 East Randolph DriveChicago IL 60601USA+1 312 782 5800
London30 Warwick StreetLondon W1B 5NHUnited Kingdom+44 20 7493 4933
Singapore9 Raffles Place#39-00 Republic PlazaSingapore 048619+65 6220 3888
Authors
Rosemary [email protected]
Jeremy [email protected]
Matthew [email protected]
To learn more about cities and real estate, visit our websitewww.jll.com/cities-research
COPYRIGHT © JONES LANG LASALLE IP, INC. 2017.This report has been prepared solely for information purposes and does not necessarily purport to be a complete analysis of the topics discussed, which are inherently unpredictable. It has been based on sources we believe to be reliable, but we have not independently verified those sources and we do not guarantee that the information in the report is accurate or complete. Any views expressed in the report reflect our judgment at this date and are subject to change without notice. Statements that are forward-looking involve known and unknown risks and uncertainties that may cause future realities to be materially different from those implied by such forward-looking statements. Advice we give to clients in particular situations may differ from the views expressed in this report. No investment or other business decisions should be made based solely on the views expressed in this report
Contacts