Embed Size (px)
Citation preview

lable at ScienceDirect
Neurobiology of Aging 68 (2018) 102e113
Contents lists avai
Neurobiology of Aging
journal homepage: www.elsevier .com/locate/neuaging
Age affects reinforcement learning through dopamine-basedlearning imbalance and high decision noisednot throughParkinsonian mechanisms
Ravi B. Sojitra a,b,*, Itamar Lerner a,**, Jessica R. Petok a,c, Mark A. Gluck a,**
aCenter for Molecular and Behavioral Neuroscience, Rutgers University, Newark, Newark, NJ, USAbDepartment of Mathematics and Computer Science, Rutgers University, Newark, Newark, NJ, USAcDepartment of Psychology, St. Olaf-College, Northfield, MN, USA
a r t i c l e i n f o
Article history:Received 21 October 2017Received in revised form 26 February 2018Accepted 11 April 2018Available online 19 April 2018
Keywords:AgingReinforcement learningDopamineQ-learningParkinson’s disease
R.B.S and I.L. are considered as co-first authors.* Corresponding author at: 110 Warren St., Rm 402B
973 353 2944.** 197 University Ave, Rm 209, Newark, NJ 07102. Te
E-mail addresses: [email protected] (R.B. Sojitr(I. Lerner), [email protected] (M.A. Gluck).
0197-4580/$ e see front matter � 2018 Elsevier Inc. Ahttps://doi.org/10.1016/j.neurobiolaging.2018.04.006
a b s t r a c t
Probabilistic reinforcement learning declines in healthy cognitive aging. While some findings suggestimpairments are especially conspicuous in learning from rewards, resembling deficits in Parkinson’sdisease, others also show impairments in learning from punishments. To reconcile these findings, wetested 252 adults from 3 age groups on a probabilistic reinforcement learning task, analyzed trial-by-trialperformance with a Q-reinforcement learning model, and correlated both fitted model parameters andbehavior to polymorphisms in dopamine-related genes. Analyses revealed that learning from bothpositive and negative feedback declines with age but through different mechanisms: when learning fromnegative feedback, older adults were slower due to noisy decision-making; when learning from positivefeedback, they tended to settle for a nonoptimal solution due to an imbalance in learning from positiveand negative prediction errors. The imbalance was associated with polymorphisms in the DARPP-32 geneand appeared to arise frommechanisms different from those previously attributed to Parkinson’s disease.Moreover, this imbalance predicted previous findings on aging using the Probabilistic Selection Task,which were misattributed to Parkinsonian mechanisms.
� 2018 Elsevier Inc. All rights reserved.
1. Introduction
Cognitive abilities such as reasoning, perceptual speed, andmemory decline in healthy cognitive aging (Lindenberger andBaltes, 1997; Murray et al., 2015; Salthouse, 1996), impairing theway people use information from previous experiences to makeeveryday decisions. Learning from probabilistic feedback, inparticular, slows with age (Eppinger and Kray, 2011; Samanez-Larkin et al., 2014) and predicts real life debt and asset accumula-tion (Knutson et al., 2011). Yet, the mechanisms driving thisage-related change remain poorly understood.
Probabilistic reinforcement learning occurs when unreliable“feedback” (positive, negative, or absent altogether), received inresponse to actions, informs future decision-making, and learningfrom such feedback requires approximating the value of stimulus-response relationships in face of environmental uncertainty.
, Newark, NJ 07102. Tel.: þ1
l.: þ1 973 353 3674.a), [email protected]
ll rights reserved.
These value updates are hypothesized to be largely based on phasicbursts and dips in striatal dopamine levels, corresponding to un-expected positive and negative outcomes (“prediction errors”),respectively (see Schultz, 2002, for extensive review).
One possible implication of this mechanism is that chronicallylow striatal dopamine, as seen in Parkinson’s disease (PD)(Lotharius and Brundin, 2002), could impair reward learning andfacilitate punishment learning. This has been confirmed by severalbehavioral studies (Bodi et al., 2009; Frank et al., 2004; Rutledgeet al., 2009). For instance, both unmedicated and never-medicated PD patients are impaired in learning from probabilisticrewards and better at learning from probabilistic punishmentscompared to healthy controls, presumably because of sustaineddeclines in baseline striatal dopamine (Bodi et al., 2009). Theopposite pattern emerges when these patients are put on medica-tion that increases baseline levels of striatal dopamine (Bodi et al.,2009; Frank et al., 2004).
Since healthy aging is associated with striatal dopaminergicdenervation and decline (Backman et al., 2006; Bohnen et al., 2009;Gunning-Dixon et al., 1998; Volkow et al., 1996; van Dyck et al.,2002), some have suggested that PD might be a good model ofaccelerated age-related changes in reinforcement learning (Collier
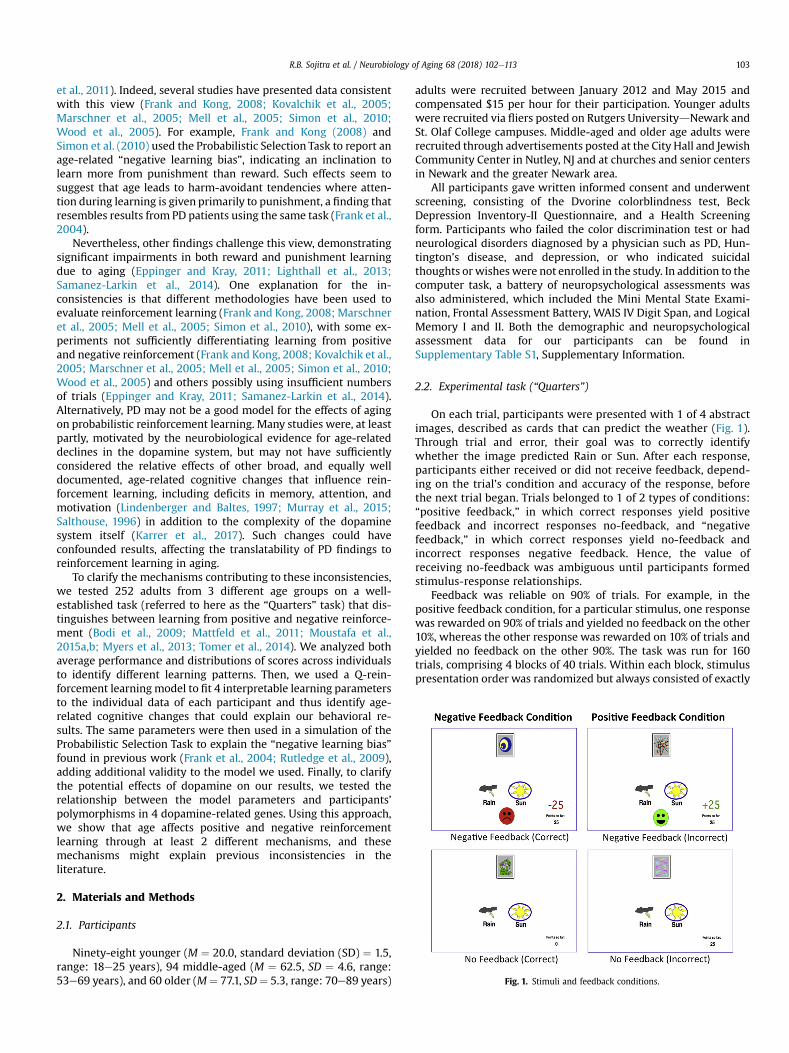
Fig. 1. Stimuli and feedback conditions.
R.B. Sojitra et al. / Neurobiology of Aging 68 (2018) 102e113 103
et al., 2011). Indeed, several studies have presented data consistentwith this view (Frank and Kong, 2008; Kovalchik et al., 2005;Marschner et al., 2005; Mell et al., 2005; Simon et al., 2010;Wood et al., 2005). For example, Frank and Kong (2008) andSimon et al. (2010) used the Probabilistic Selection Task to report anage-related “negative learning bias”, indicating an inclination tolearn more from punishment than reward. Such effects seem tosuggest that age leads to harm-avoidant tendencies where atten-tion during learning is given primarily to punishment, a finding thatresembles results from PD patients using the same task (Frank et al.,2004).
Nevertheless, other findings challenge this view, demonstratingsignificant impairments in both reward and punishment learningdue to aging (Eppinger and Kray, 2011; Lighthall et al., 2013;Samanez-Larkin et al., 2014). One explanation for the in-consistencies is that different methodologies have been used toevaluate reinforcement learning (Frank and Kong, 2008; Marschneret al., 2005; Mell et al., 2005; Simon et al., 2010), with some ex-periments not sufficiently differentiating learning from positiveand negative reinforcement (Frank and Kong, 2008; Kovalchik et al.,2005; Marschner et al., 2005; Mell et al., 2005; Simon et al., 2010;Wood et al., 2005) and others possibly using insufficient numbersof trials (Eppinger and Kray, 2011; Samanez-Larkin et al., 2014).Alternatively, PD may not be a good model for the effects of agingon probabilistic reinforcement learning. Many studies were, at leastpartly, motivated by the neurobiological evidence for age-relateddeclines in the dopamine system, but may not have sufficientlyconsidered the relative effects of other broad, and equally welldocumented, age-related cognitive changes that influence rein-forcement learning, including deficits in memory, attention, andmotivation (Lindenberger and Baltes, 1997; Murray et al., 2015;Salthouse, 1996) in addition to the complexity of the dopaminesystem itself (Karrer et al., 2017). Such changes could haveconfounded results, affecting the translatability of PD findings toreinforcement learning in aging.
To clarify the mechanisms contributing to these inconsistencies,we tested 252 adults from 3 different age groups on a well-established task (referred to here as the “Quarters” task) that dis-tinguishes between learning from positive and negative reinforce-ment (Bodi et al., 2009; Mattfeld et al., 2011; Moustafa et al.,2015a,b; Myers et al., 2013; Tomer et al., 2014). We analyzed bothaverage performance and distributions of scores across individualsto identify different learning patterns. Then, we used a Q-rein-forcement learningmodel to fit 4 interpretable learning parametersto the individual data of each participant and thus identify age-related cognitive changes that could explain our behavioral re-sults. The same parameters were then used in a simulation of theProbabilistic Selection Task to explain the “negative learning bias”found in previous work (Frank et al., 2004; Rutledge et al., 2009),adding additional validity to the model we used. Finally, to clarifythe potential effects of dopamine on our results, we tested therelationship between the model parameters and participants’polymorphisms in 4 dopamine-related genes. Using this approach,we show that age affects positive and negative reinforcementlearning through at least 2 different mechanisms, and thesemechanisms might explain previous inconsistencies in theliterature.
2. Materials and Methods
2.1. Participants
Ninety-eight younger (M ¼ 20.0, standard deviation (SD) ¼ 1.5,range: 18e25 years), 94 middle-aged (M ¼ 62.5, SD ¼ 4.6, range:53e69 years), and 60 older (M¼ 77.1, SD¼ 5.3, range: 70e89 years)
adults were recruited between January 2012 and May 2015 andcompensated $15 per hour for their participation. Younger adultswere recruited via fliers posted on Rutgers UniversitydNewark andSt. Olaf College campuses. Middle-aged and older age adults wererecruited through advertisements posted at the City Hall and JewishCommunity Center in Nutley, NJ and at churches and senior centersin Newark and the greater Newark area.
All participants gave written informed consent and underwentscreening, consisting of the Dvorine colorblindness test, BeckDepression Inventory-II Questionnaire, and a Health Screeningform. Participants who failed the color discrimination test or hadneurological disorders diagnosed by a physician such as PD, Hun-tington’s disease, and depression, or who indicated suicidalthoughts or wishes were not enrolled in the study. In addition to thecomputer task, a battery of neuropsychological assessments wasalso administered, which included the Mini Mental State Exami-nation, Frontal Assessment Battery, WAIS IV Digit Span, and LogicalMemory I and II. Both the demographic and neuropsychologicalassessment data for our participants can be found inSupplementary Table S1, Supplementary Information.
2.2. Experimental task (“Quarters”)
On each trial, participants were presented with 1 of 4 abstractimages, described as cards that can predict the weather (Fig. 1).Through trial and error, their goal was to correctly identifywhether the image predicted Rain or Sun. After each response,participants either received or did not receive feedback, depend-ing on the trial’s condition and accuracy of the response, beforethe next trial began. Trials belonged to 1 of 2 types of conditions:“positive feedback,” in which correct responses yield positivefeedback and incorrect responses no-feedback, and “negativefeedback,” in which correct responses yield no-feedback andincorrect responses negative feedback. Hence, the value ofreceiving no-feedback was ambiguous until participants formedstimulus-response relationships.
Feedback was reliable on 90% of trials. For example, in thepositive feedback condition, for a particular stimulus, one responsewas rewarded on 90% of trials and yielded no feedback on the other10%, whereas the other response was rewarded on 10% of trials andyielded no feedback on the other 90%. The task was run for 160trials, comprising 4 blocks of 40 trials. Within each block, stimuluspresentation order was randomized but always consisted of exactly

R.B. Sojitra et al. / Neurobiology of Aging 68 (2018) 102e113104
10 trials for each stimulus, out of which exactly 9 trials were reli-able, making the distribution of trial type (i.e., positive feedback ornegative feedback condition) uniform across blocks. Within eachfeedback condition, the optimal response for 1 stimulus was “Rain”and the other “Sun”, and these probabilistic stimulus-responsecontingencies were held constant for the duration of the 160 tri-als. Participants were not made aware of any of this structuring oftrials, and they were allowed to complete the task at a pace theywere comfortable with.
2.3. Procedure
The task was programmed using the SuperCard 4.6 program-ming language and run in full screen mode on a 1300 MacBookcomputer. Participants were seated in an isolated testing room at acomfortable viewing distance from the screen. Before beginning thetask, they received thorough instruction and were advised of theprobabilistic nature of the task that even after learning the appro-priate stimulus-response associations, responses would not alwaysyield the expected outcome. Participants were then given 4 sampletrials using 2 stimuli (different from the 4 stimuli used in the task),demonstrating the possible outcomes in the task and introducing arunning total of points on the bottom right hand of the screen,which was initialized to 0 for the actual task (Fig. 1). Responseswere given by pressing 1 of 2 keys on the laptop computer, clearlymarked as “SUN” and “RAIN; ” all other keys were covered with acardboard mask. After a response was given, the answer choice wascircled in blue on the screen and feedback (if any) was given. If theresponse yielded negative feedback, a red frowning face appearedand red text was displayed to indicate a deduction of 25 points fromthe running total. If the response yielded positive feedback, a greensmiling face appeared and green text was displayed to indicate anaddition of 25 points to the running total. If the response yielded nofeedback, nothing additional was displayed. All feedback, including“no feedback”, remained for 2 seconds before the next stimulus waspresented.
2.4. Behavioral data analysis
For statistical analyses, “optimal” answers for each image weredefined as the response that predominantly yielded the feedbackwith the higher value for that image (i.e., choices that led to rewardon 90% of trials in the positive feedback condition and those that ledto no feedback on 90% of trials for the negative feedback condition).Mean optimal accuracy scores were calculated for each participantin each of the 4 blocks of each feedback condition. Those scoreswere then subject to a repeated-measures analysis of variance(ANOVA) with age as a between-subjects factor and block andfeedback as within-subject factors. Details of these analysis andfollow-up analyses are described in Results. All statistical analysiswas performed using the SPSS 20 software.
2.5. Model-based data analysis
Behavioral results were analyzed using a Q-learning reinforce-ment model, which has been established as a sound model ofbehavior in similar tasks used to study reinforcement learning inhumans (Frank et al., 2007; Moustafa et al., 2015b; Myers et al.,2013). The model assumes that participants represent and main-tain an expected value for each response (r) given a stimulus (s) andthat they update these expected values after getting feedback oneach trial. These expected outcome values, denoted by Q[r,s], wereinitialized to 0 for the first trial (of the 160). For each new trial, tþ1,
after a response was made to a stimulus and feedback was given,the value was updated using the following Q-learning rule:
Q ½r; s�tþ1 ¼ Q ½r; s�t þ a$�R� Q ½r; s�t
�(1)
where t denotes the trial number, R the reinforcement value basedon feedback given at that trial, and a the learning rate. The learningrate was dependent on the prediction error term: R � Q[r,s]: if theprediction error was positive, a “positive prediction error learningrate” (aþ) was used, and if it was negative, a “negative predictionerror learning rate” was used (a�). The feedback value, R, was settoþ1 for reward and�1 for punishment. For no feedback, Rwas setto R0, a free parameter for each participant. On each trial, theprobability of choosing one of the categories, for example, Pr (Rain),for a given stimulus, s, was calculated based on the expectancyvalues for each of the 2 possible responses to that stimulus using asoftmax function:
PrðRainÞ ¼ eQ ½Rain;s�=b
eQ ½Rain;s�=b þ eQ ½Sun;s�=b (2)
Here, b is the “noise” parameter of the decision, quantifying thetendency to choose the response with the higher expected value(the higher the b, the lower the tendency). Thus, this noise valuereflects to what degree information gained about the expectedvalues can be utilized in producing appropriate responses. It is alsosometimes interpreted as capturing an exploration mechanism(Frank et al., 2007; Moustafa et al., 2015a).
Model-based analyses were conducted by fitting 4 free param-eters to each participant’s trial-to-trial stimulus-responsesequence: positive prediction error learning rate, negative predic-tion error learning rate, noise in the decision process, and thereinforcement value attributed to no feedback (R0). The lastparameter represents the individual tendency to view the absenceof feedback as rewarding or not (in contrast to positive and negativefeedback, which, as previously mentioned, supplied fixed positiveand negative reinforcement values, respectively). Fitting was con-ducted using a maximum likelihood approach: for a given partici-pant and a given set of these 4 parameter values, the log likelihoodof each response for each trial was computed while updating theexpected values. The sum of these log likelihoods over all trialsrepresented the log likelihood estimate of this set of parameters:
LLE ¼X160
t¼1
log½Prðr; tÞ� (3)
We used grid search to fit the parameters, with aþ, a�, b eachranging between [0, 1] in steps of 0.05, and R0 ranging between [�1,1] in steps of 0.1 (following Myers et al., 2013). For each participant,the set of parameters yielding themaximum log likelihood estimate(LLE) across all 160 trials was chosen as the representative rein-forcement learning profile of that participant (similar results wereachieved using finer grid searches and when using gradient-basedmethods such as the Neldar-Mead algorithm implemented inMatlab’s fminsearch function). After finding the parameter profilefor each participant, we analyzed the difference in the average andthe distribution of those parameter values for each age group, asdetailed in the Results section. All model-based analyses werecarried out with MATLAB 2015a software.
2.6. Analysis of probabilistic selection task
The Probabilistic Selection Task was modeled following theexact procedure administered to real participants (Frank and Kong,
R.B. Sojitra et al. / Neurobiology of Aging 68 (2018) 102e113 105
2008; Frank et al., 2004, 2007; Simon et al., 2010), but using theindividual learning parameters, we fit to the behavioral datacollected from our experiment. On each trial, the same Q-rein-forcement model previously described was presented with 2“stimuli” and tasked with choosing the 1 yielding the higheramount of reward (or lower amount of punishment). The modelchose based on the stimuli’s expected outcome values Q[r,s](initialized to 0 as before) using the softmax function (Equation 3).One of 3 possible pairs was used on each trial: for the AB pair,picking A yielded reward 80% of the time and punishment 20% ofthe time (whereas picking B yielded reward and punishment withthe complementary frequency). Similarly, for the CD pair, reward-punishment frequencies for C were 70e30, and for the EF pair,the frequencies for E were 60e40. The appropriate Q[r,s] value wasupdated after the model’s response using Equation 2, with rewardsyielding feedback value of 1 and punishments a value of �1,consistent with the way we applied the Q-reinforcement learningmodel to our task. No neutral trials exist in the Probabilistic Se-lection Task. Training continued in blocks of 60 trials (20 trials perstimulus pair) and was terminated when performance exceeded adesignated threshold for each of the pair types (65% accuracy forthe AB pair, 60% for the CD pair, and 50% for the EF pair; see Frankand Kong, 2008 and Kovalchik et al., 2005) or after 6 blocks. Wethen extracted several performance measures corresponding to theones regularly reported in this task. For training performance, “win-stay” is computed as the probability of choosing the same responsethat yielded a reward in the previous trial; “lose-shift” is computedas the probability of shifting responses after it yielded punishmentin the previous trial. Both measures were calculated only for thefirst block (see Kovalchik et al., 2005; Simon et al., 2010). Learningbias was computed in accordance with the “test” phase in the hu-man experiments, by examining the probability of the model’ssoftmax choices when responding to novel pairs based on the Qvalues it reached at the end of training (with no further learning orfeedback). “Choose A” is defined as the average probability ofchoosing “A” in pairs AC, AD, AE, AF. “Avoid B” is defined as theaverage probability of not choosing “B” in pairs BC, BD, BE, BF. Thelearning bias is computed as “Avoid B” subtracted from “Choose A”.The simulated experiment was carried out for each of our partici-pants using their individual learning profile (positive and negativeprediction error learning rates and decision noise; R0 is not used inthis task) previously fit to our Quarters task. These simulations wererepeated 10 times, and performance measures were averaged overthe 10 runs.
2.7. Analysis of genetic polymorphism
We genotyped DNA from 212 of 252 participants (almost allremaining samples were discarded because of contamination dur-ing hurricane flooding, and a couple due to mislabeling or partici-pants opting out). Each participant contributed 2 mL of saliva aftercompleting the testing battery (approximately 2 hours), as tominimize sample contamination from prior meals. The salivacollection itself was done using the Oragene Discover (OGR-500) kit(i.e., test tubes), purchased from DNA genoTek. The advertisedmedian DNA yield is 110 micrograms and stability spans years atroom temperature. We took extra precaution and refrigerated thesesamples below room temperature and genotyped the sampleswithin 6 months from extraction. Genotyping occurred at theEnvironmental and Occupational Health Sciences Institute atRutgers UniversitydNew Brunswick, where samples were screenedvia routine polymerase chain reaction or southern blots for poly-morphisms in 4 genes that are implicated in regulating dopamine atthe neural andmolecular levels: DARPP-32, COMT, DRD2, and DAT1.
Following previous reports, we concentrated on single nucleotidepolymorphisms (SNPs) in genes previously shown to modulatereinforcement learning (Frank and Fossella, 2011; Frank et al.,2009): rs907094 for DARPP-32, rs6277 for DRD2, rs4680 forCOMT, and VNTR for DAT1. SNPs of a few individuals could not bedetermined, and several others included rare alleles or variationsand were excluded from further analysis. The final sample includedparticipants with either AA, AG or GG alleles in the DARPP-32,COMT, and DRD2 SNPs (212 participants for DARPP-32, and 211participants for each of the other 2 genes) and either 10/10 tandemrepeat, 9/9 tandem repeat, or 9/10 for DAT1 SNP (189 participants).For each gene, we grouped participants based on the frequency ofone of the alleles (e.g., for DAT1, homozygous 9/9 was 0, hetero-zygous 9/10 was 0.5, and homozygous 10/10 was 1) so as to detectgene dose effects. These frequencies were correlated to behavioraland model-related parameters as discussed in Results. SeeSupplementary Information for additional notes concerning groupdifferences in allelic frequencies.
3. Results
3.1. Basic learning
Participants learned to classify 4 stimuli into 1 of 2 categoriesthrough probabilistic feedback (Fig. 2A). Two stimuli yielded re-wards for correct answers and no feedback for incorrect ones(“positive feedback condition”); the remaining 2 yielded no feed-back for correct answers and punishments for incorrect ones(“negative feedback condition”). No feedback was thereforeambiguous until stimulus-feedback associations were learned.
Mean accuracy scores for all individuals were submitted to a 3(age: younger, middle age, older) � 2 (feedback: positive, negative) �4 (block: 1e4) ANOVA, with age as a between-subjects factor andfeedback and block as within-subjects factors. The analysis revealedmain effects of age [F(2249) ¼ 26.675, p < 0.0005], block [F(3747) ¼133.489, p< 0.0005], and feedback [F(1249)¼ 25.303, p< 0.0005], aswell as interactions of block � feedback [F(3747) ¼ 3.305, p < 0.020]and, at a trend level, feedback � block � age [F(6747) ¼ 1.915, p ¼0.076]. No other interactions were significant.
Examining each of the 2 feedback conditions separately (Fig. 2B),the main effects of age and block were again significant (negativefeedback: [F(2249) ¼ 39.269, p < 0.0005] and [F(1249) ¼ 183.1, p <
0.005], respectively; positive feedback: [F(2249) ¼ 8.482, p <
0.0005] and [F(3747) ¼ 37.597, p < 0.0005], respectively).Bonferroni-corrected pairwise comparisons showed that in bothconditions younger adults outperformed the middle-aged adults (p< 0.0005, p ¼ 0.038 for negative and positive feedback conditions,respectively) and older adults (both p’s < 0.0006). With negativefeedback, middle-aged adults also outperformed the older adults(p ¼ 0.005). The age � block interaction approached significanceonly for positive feedback [F(6747) ¼ 2.027, p ¼ 0.060], indicatingthat the 3 age groups may have learned at different rates.
To follow-up on the (marginal) age � block interaction forpositive feedback, we analyzed this condition separately for eachage group. A one-way ANOVA showed a significant effect of block inthe younger, middle-aged, and older adults ([F(3, 291)¼ 28.434, p<
0.0005], [F(3, 279) ¼ 11.550, p < 0.0005], [F(3, 177) ¼ 5.409, p <
0.001], respectively). Bonferroni-corrected pairwise comparisonsbetween blocks showed that while learning for the younger adultscontinued from block 1 to block 3 (all p’s < 0.05), middle-agedadults only differed significantly between block 1 and each of therest (all p’s< 0.001) and for older adults, only between blocks 1 and3 (p < 0.034).
In sum, we found a strong main effect of age on reinforcement

Fig. 2. Behavioral task and results for the 252 participants. (A) Experimental task. Participants learned to classify 4 stimuli to 1 of 2 arbitrary categories (Rain or Sun) by trial anderror using probabilistic feedback. Two stimuli yielded positive feedback (smiling face and positive points) on 90% of the trials and no feedback on 10% of the trials. The other 2stimuli yielded negative feedback (frowning face and negative points) on 90% of the trials and no feedback on 10% of the trials. Two example trials are presented. (B) Learning curvesfor the positive and negative feedback conditions. Error bars illustrate standard errors of the means (see Supplementary Information for additional analyses). (C) Distributions ofscores on block 4 for the different age groups. Y-axis represents the percent of individual response-sequences within an age group and the x-axis marks each decile of performancescore. The scores for stimulus A and stimulus B of each feedback condition were computed and counted separately to avoid the score of 1 interfering with the other (e.g., when onestimulus receives a perfect score and the other zero, they average to a misleading “random chance” score of 0.5). (D) Left, deviance from chance performance, indicating the degreeof learning a solution irrespective of the type of solution. Right, percent of optimal solutions given convergence to any solution. Convergence to a solution was defined as at least 3consecutive blocks with accuracy reaching higher than 0.9, or lower than 0.1, for the optimal and nonoptimal solutions, respectively. ***p < 0.0001.
R.B. Sojitra et al. / Neurobiology of Aging 68 (2018) 102e113106

1 Two participants out of the 252 yielded a best-fit decision noise of 0 anddegenerate values for all other parameters. They were therefore excluded from allfurther analyses.
R.B. Sojitra et al. / Neurobiology of Aging 68 (2018) 102e113 107
learning deficits for both positive and negative feedback conditions,with some weaker indication that learning in the positive feedbackcondition continuing into later blocks only for younger adults.
3.2. Cognitive strategies
While average performance can be useful for studying groupdifferences, it may overlook meaningful individual learning differ-ences. One way to address this issue is to examine the distributionof accuracy scores. Fig. 2C plots the distributions of block 4 stimuliaccuracy scores organized by feedback and age. For negative feed-back (upper row), accuracy scores generally ranged between 50%(chance) and 100%, with the distribution of participants skewedtoward the latter. This was not the case for positive feedback(Fig. 2C, lower row), where most of participants performed eithernear 0% or 100%. That is, some participants learned to avoid feed-back for at least one of the positive feedback condition stimuli,indicating a nonoptimal behavior of settling for no feedback. Thisstriking difference in distributions suggests a key distinction in theway age may affect performance in the positive and negativefeedback conditions: for negative feedback, age seems to slowdown learning, whereas for positive feedback, age increases thelikelihood of compromising on a nonoptimal solution, opting for nofeedback.
To mathematically confirm our observation for positive feed-back, we attempted to disentangle to what degree a solution waslearned in this condition (irrespective of whether it was optimal,i.e., learning the rewarded response, or nonoptimal, i.e., learningthe no-feedback response), from the type of solution that waslearned (i.e., optimal or not optimal).
To express the degree of learning, we computed the absolutevalue of the deviation from chance performance (defined as a 0.5score), a measure that ignores whether a participant learned theoptimal or nonoptimal solution. These scores were subject to a 2-way ANOVA with block and age as the within and between-subject factors (Fig. 2D, left). The analysis revealed main effectsof block [F(1249) ¼ 130.924, p < 0.0005] and age [F(2, 249) ¼18.131, p < 0.0005] but no interaction [p ¼ 0.11]. Bonferroni-corrected pairwise comparisons showed that the older grouplearned to a lesser degree than each of the other 2 age groups(both p’s < 0.005), but there was no difference between themiddle-aged and younger adults. That is, performance differ-ences between the younger- and middle-aged adults were un-likely to be explained by the degree of learning a solution(regardless of the type of solution).
To analyze the type of solution that was learned irrespective oflearning degree, we took a subset of the data, discarding slow-learned or nonlearned stimuli. We defined “convergence” to asolution as scores that, for at least the last 3 blocks, remainedequal or below 0.1, or equal or above 0.9, for the nonoptimal andoptimal solutions, respectively. This amounted to 84.2%, 78.2%,and 54.2% of stimuli in the younger, middle-aged, and oldergroups. We then compared the frequencies of optimal-learnedsolution versus nonoptimal-learned solution using a c2 test ofindependence with age (younger, middle aged, older) and solution(optimal/nonoptimal) as factors (Fig. 2D, right). The analysisrevealed a significant effect (c(2) ¼ 6.231, p < 0.05). Follow-up c2
tests, partitioning the data to older versus middle age, andyounger versus older and middle age combined, showed thatyounger adults tended to converge to the optimal solution morethan the other age groups (c(1)¼ 5.933 p< 0.02), but there was nodifference between the middle-aged and older groups (c(1) ¼0.262, p ¼ 0.6087).
To summarize, older adults learned from positive feedback to alesser degree than the remaining groups, whereas middle-aged
adults learned from positive feedback to approximately the samedegree as younger participants. However, younger-aged adultswere more likely to converge to the optimal solution than middle-aged adults, resulting in a higher group performance.
3.3. Reinforcement learning model analysis
To identify mechanisms responsible for the differences inlearning between the age groups, we fit 4 parameters to each par-ticipant’s trial-to-trial sequence according to a Q-Reinforcementlearning model (see Materials and Methods): the rate of learningfrom positive prediction errors (aþ), the rate of learning fromnegative prediction errors (a�), the valence assigned to no feedback(R0), and decision noise (b), reflecting the likelihood of choosing aresponse that does not correspond to its expected value. Averagevalues of these parameters for the 3 age groups are plotted inFig. 3A, left1.
Four separate one-way ANOVAs of each parameter, Bonferroni-corrected for multiple comparisons, showed a significant differ-ence between the groups only for the average decision noise [F(2,247)¼ 11.82, p< 0.0001]. Pairwise comparisons indicated the effectstemmed from older adults having higher values than both themiddle-aged and younger adults (p ¼ 0.012; p < 0.0001, respec-tively). No other difference in parameter values reached signifi-cance, though aþ showed a trend (p < 0.09).
We then determined how well decision noise accounts for eachof the age-sensitive performance measures (Fig. 3B, upper row).Wefound that decision noise was strongly correlated with averagescores for block 4 in the negative feedback condition (r(248) ¼ �0.62, p < 0.0001) as well as with the deviance fromchance for block 4 in the positive feedback condition (r(248) ¼ �0.76, p < 0.0001; see also Supplementary Fig. S1, Sup-plementary Information). For both measures, performance deteri-orated as noise increased. However, noise did not distinguishoptimal and nonoptimal learning: considering only participantswho reached convergence (defined earlier and in Fig. 2D) on at leastone of the positive feedback stimuli, there was no difference innoise levels between participants who converged to the optimalsolution on both stimuli (“optimal performers”) and those whoconverged to the nonoptimal solution on at least one of the stimuli(“nonoptimal performers”) (p ¼ 0.246).
To determine whether the difference in learning optimal andnonoptimal solutions can be revealed by more in-depth modelanalyses, we studied the joint distribution between the other 3model parameters (aþ,a�,R0). A 3D scatter plot of these parametervalues for all participants illustrates several clear characteristicsthat distinguish nonoptimal performers from the rest (Fig. 3C, left):first, almost all nonoptimal performers had at least one learningrate parameter (either aþ, a�, or both) with a value near 0. Second,participants who had a low aþtended to have a high R0 value (i.e.,they evaluated no-feedback as very positive). Third, participantsthat had R0 values below 0 (i.e., they tended to see no-feedback asnegative) were almost never nonoptimal performers.
To assess whether these patterns can characterize the 3 agegroups, we plotted the projection of the 3D individual parametervalues for each age group, on 2 planes: the aþ � a�, plane (Fig. 3C,right, upper row), and the a� � R0 plane (Fig. 3C, right, lower row).Comparing the graphs, the degree of scatter on the aþ � a�planetended to decrease with age, suggesting that a near-0 value oneither axis is not only indicative of nonoptimal performance but

Fig. 3. Analysis of fitted model parameters (for 250 participants). (A) Left, average values of the 4 parameters fit to the model, by age group. Right, average LRI measure, by age group.*p < 0.02; **p < 0.008; ***p < 0.0001; ytrend. Error bars illustrate standard errors of the means. (B) Correlations of behavioral performance measures with decision noise (top row)and LRI (bottom row) across all participants. Small amount of Gaussian noise (SD ¼ 0.01) was added to the scatter plots’ data points to improve visualization. ***p < 0.0001. (C) Left,
R.B. Sojitra et al. / Neurobiology of Aging 68 (2018) 102e113108

R.B. Sojitra et al. / Neurobiology of Aging 68 (2018) 102e113 109
also differentiates the groups. On the other hand, the tendency totreat no feedback as highly positive did not help distinguish the agegroups further.
These qualitative observations suggest that older age may beassociated with a tendency toward 1 of 2 different learning stra-tegies: (1) a “reward-seeking” strategy, where learning fromnegative prediction errors is highly diminished, or (2) a “harm-avoidant” strategy, where learning from positive prediction errorsis diminished. Younger adults, on the other hand, seem to be morebalanced, on average, in their positive-negative learning rates. Toformalize this hypothesis, we introduce a new index, the “LearningRate Imbalance” (LRI), calculated by computing the difference be-tween the learning rates divided by their sum (termed here“Learning Rate Disparity”; LRD) and then taking the absolute value:
LRI ¼ absðLRDÞ ¼������aþ � a�
��aþ þ a�
������ (4)
This index ranges from 0, when the learning rates are identical,to 1, when one of the learning rates is infinitely larger than theother, thus capturing the relevant proximity to the axes in Fig. 3C.
A one-way ANOVA confirmed our qualitative observations,showing a highly significant difference in LRI between the agegroups F(2, 247) ¼ 10.71, p < 0.0001; Fig. 3A, right). Bonferroni-corrected pairwise comparisons showed that the younger adultshad lower LRI than both the middle-aged and older adults (p ¼0.007 and p < 0.0001, respectively), but there was no differencebetween middle-aged and older adults (p ¼ 0.2158).
Next, we examined how well LRI accounts for the performancemeasures by repeating the same analysis previously conducted fordecision noise (Fig. 3B, lower row). The results were nearly a mirrorimage of the previous effects: LRI did not correlate with the deviancefrom chance on block 4 in the positive feedback condition (p¼ 0.232),and while it did correlate with the average scores on block 4 of thenegative feedbackcondition (r (248)¼�0.38,p<0.0001), itexplainedfar less of the variance compared to decision noise (R2 ¼ 0.14 vs. R2 ¼0.38). Most important, unlike decision noise, LRI significantly distin-guished between optimal and nonoptimal performers in the positivefeedback condition (t [167]¼ 6.19, p < 0.0001).
In summary, decision noise captured differences in overall speedof learning any solution for both negative and positive feedback;LRI, in contrast, distinguished individuals who converged to theoptimal solution on the positive feedback condition from thosewhodid not but was less predictive of how quickly this convergenceoccurred. Because both measures differed between age groups,these results point to the existence of 2 orthogonal factors throughwhich age affects learning from probabilistic feedback.
3.4. Model reproduces reported age-related differences in theprobabilistic selection task
Using the fitted parameters, our model can explain previousfindings based on the Probabilistic Selection Taskdspecifically, thewidely cited “negative learning bias” used to support the analogybetween striatal and behavioral changes in PD and those of healthycognitive aging (Frank and Kong, 2008; Simon et al., 2010). In thistask, participants are first trained to distinguish between stimulidiffering in the probability of yielding reward versus punishment.
=3D scatter of 3 individually fit parameters: aþ, a�, and R0, for all participants in the study. Esmall gray dot to allow easier understanding of the 3D scatter. Right, 2D projections of the 3Dlearned a nonoptimal solution for at least one of the positive-feedback stimuli (“nonoptimaladded to the data points to improve visualization. Abbreviations: LRI, learning rate imbalan
Three different pairs are used, each with unique reward-punishment probabilities (e.g., 80%e20%, 70%e30%, etc.). Partici-pants are then tested without feedback on novel pairings includinghigh conflict stimuli (e.g., those that previously yielded reward on80% vs. 70% of trials or on 20% vs. 30% of trials). Results show thatcompared to younger, older adults fair worse with novel pairings ofstimuli that were previously mostly rewarded, but similar or evenbetter than younger adults on novel pairings of stimuli that werepreviously mostly punished.
We simulated the exact procedure of the Probabilistic SelectionTask (Frank and Kong, 2008; Frank et al., 2004, 2007; Simon et al.,2010), with each of our individual participants represented by theparameters fit to the data collected using our Quarters task (seeMaterials and Methods for details). We found that the relative age-dependent “negative learning bias” is closely replicated in bothtrend andmagnitude without any need for additional model tuning(Fig. 4A; for visual clarity, middle-aged group, whose values were inbetween the young and old in all measures, is not displayed. SeeSupplementary Fig. S2, Supplementary Information for full results).However, rather than supporting the viewof aging leading to harm-avoidant tendencies, the bias was highly correlated to LRI, meaningthat an imbalance favoring learning from either positive or negativeprediction errors can yield a negative bias (Fig. 4B, left).
Importantly, when plotting the learning bias against theLearning Rate Disparity (Equation 1 without taking the absolutevalue), we found an inverted U-shaped function in which most ofour aged participants were on the high aþ end rather than the higha� end (Fig. 4B, right; see also Fig. 3C). This suggests that: (1)counterintuitively, it is possible to get a “negative bias” in theProbabilistic Selection Task with learning that strongly favors up-dates from positive prediction errors over negative prediction er-rors, and (2) in contrast to previous hypotheses, older adults leantoward reward-seeking rather than the harm-avoidant learningpattern attributed to PD patients.
Thus, our results imply that the similarity of effects found inolder individuals and PD patients using the Probabilistic SelectionTask may mask the fact that the mechanisms contributing to theseeffects are almost opposite, 1 heavily influenced by positive pre-diction errors and the other by negative prediction errors.
3.5. Genotype analysis
Finally, we determined whether polymorphisms in 4 dopamine-related genes previously implicated in reinforcement learning(Frank et al., 2007), DARPP-32, COMT, DRD2, and DAT1, predict ourbehavioral and modeling results. Each individual was characterizedby the frequency of a specific allele for each gene (see Materials andMethods), and these frequencies were correlated across partici-pants to each of the 9 behavioral performance measures and modelparameters previously investigated. Significance values for each ofthe correlations are displayed in Table 1 Taking a highly conserva-tive approach and using Bonferroni correction for the 36 multiplecomparisons, we found that DARPP-32 modulated both the overallreward accuracy and the choice of learned solution, as well as theLRI (all p’s < 0.02 after Bonferroni correction). The more frequentthe “A” allele was, the higher were the reward accuracy and prob-ability of choosing the optimal solution, and the lower was the LRI
ach dot represents 1 participant. Projection of each dot on the X-Y plane is marked by ascatter plot, on 2 different planes, separately for each age group. Red: participants that
performers”). Blue: rest of participants. Small amount of Gaussian noise (SD ¼ 0.01) wasce; n.s, not significant.

Fig. 4. Simulation of the Probabilistic Selection Task using our learned parameters and model (for 250 participants). (A) Simulation results of the Probabilistic Selection Task (upperrow) compared to human results (lower row, reprinted from Simon et al. (2010) with permission). Error bars illustrate standard errors of the means. Only the younger- and older-simulated groups are displayed for easier comparison (see Supplementary Fig. S2, Supplementary Information for full plots). Left, average difference during training on block 1between the probability of reselecting the response that was rewarded on the preceding trial compared to the probability of shifting the response from the one punished on thepreceding trial. Younger adults showed higher difference than older adults (age � Preference: [F(2247) ¼ 13.199, p < 0.0001]; pairwise comparisons for younger vs. older: p <
0.0001). Middle, Learning Bias changes. Average performance at test on novel pairings of stimuli that were previously mostly rewarded (“Choose A”) compared to novel pairings ofstimuli that were previously mostly punished (“Avoid B”). Younger adults had a higher difference between the 2 than older adults (age � Preference: [F(2247) ¼ 14.257, p < 0.0001];pairwise comparisons for younger vs. older: p < 0.04). Right, learning biases (defined as the difference between “Choose A” and “Avoid B’) for all participants, ordered by bias values.Although younger adults had many more individuals with a positive learning bias than negative learning bias, the numbers were more evenly distributed in the older group. (B) Left,learning bias as a function of the LRI, showing a strong negative correlation (r (248) ¼ 0.61, p < 0.0001). Right, learning bias as a function of the LRD, showing an inverted U shape.Low learning bias is achieved either with very low disparity values (in line with “harm avoidant” learning pattern previously hypothesized to characterize PD patients) or with veryhigh disparity values (in line with “reward-seeking” learning pattern, which most older adults in our study actually belonged to; see Fig. 3C). Abbreviations: LRD, learning ratedisparity; LRI, learning rate imbalance; PD, Parkinson’s disease. *** p < 0.0001.
R.B. Sojitra et al. / Neurobiology of Aging 68 (2018) 102e113110
(Fig. 5). COMT was also correlated to LRI at a trend level (p < 0.06).No other parameter was associated with any genotype.
4. Discussion
Previous studies of reinforcement learning in healthy aging re-ported conflicting findings. Some found impairments to be specificto reward learning, possibly resulting from striatal deficits similarto PD patients, while others reported deficits in punishmentlearning as well. By combining behavioral, genetic, and modelingmethods, our work confirms that age impairs both reward andpunishment learning, but these effects stem from 2 very differentmechanisms.
4.1. Age affects two distinct cognitive processes duringreinforcement learning
First, we discovered that a strong predictor of age-related rein-forcement learning deficits, regardless of feedback condition, isnoise in the decision-making process. Decision noise decreases the
Table 1Relationship between genetic polymorphism and behavior
Measuregene
Behavioral parameters Model p
Punishmentaccuracy
Rewardaccuracy
Reward:Deviance
Reward:Solution
Positive
DARPP-32 0.0444 0.0007 0.0174 0.0011 0.6203COMT 0.0198 0.1515 0.5261 0.0513 0.2145DRD2 0.7999 0.1810 0.1034 0.0834 0.7336DAT1 0.5396 0.8899 0.8825 0.4262 0.3283
Uncorrected p values of the correlations between genetic polymorphism in 4 dopamiBonferroni correction are marked in bold.Key: LRI, learning rate imbalance.
likelihood of responding to stimuli in accordance with accumulatedinformation about the stimulus-response relationships. The higherthe noise, the larger the required margins between values of con-flicting choices to consistently make optimal decisions. Sinceaccumulating larger margins requires accumulating more rein-forcement, this amounts to slower learning. Unlike reinforcementlearning rates, decision noise is often understood as representingthe effects of global phenomena, such as cortical changes that affectmemory and inhibitory control or a tendency toward exploratorybehavior (Frank et al., 2009; Moustafa et al., 2015a). Indeed, pre-vious studies using electrophysiological and imaging during rein-forcement learning showed that age-dependent performance ismodulated by both striatal and nonstriatal areas (Marschner et al.,2005) and existing evidence shows substantial alterations to frontalregions during aging (Coffey et al., 1992; Raz et al., 1993; Samanez-Larkin et al., 2012). Nevertheless, because the noise parametercaptures information about how likely a subject is to act out of linewith the expected Q value, an alternative interpretation of thisparameter is that it simply represents a poor model fit to thestudied behavior rather than decision noise. Whether this is the
arameters
learning rate Negative learning rate Decisionnoise
R0 LRI
0.7193 0.0142 0.3836 0.00050.2163 0.0158 0.5527 0.00170.5446 0.2701 0.3025 0.13300.1826 0.9814 0.8130 0.2381
ne-related genes and behavioral and model parameters. Significant p values after

Fig. 5. Effects of DARPP-32 polymorphisms on reward learning and LRI for 212 participants whose genetic data were available. Error bars illustrate standard errors of the means.
R.B. Sojitra et al. / Neurobiology of Aging 68 (2018) 102e113 111
case or whether the noise parameter actually has particular neuralcorrelates needs to be studied in future experimental work com-bined with a comparison between several possible models.
Second, we showed that impairments in learning from positivefeedback are not a simple reflection of rewards having a smallerimpact on evaluations of actions; rather, impairments are bestpredicted by considering the relative influences of positive andnegative learning rates. One possible mechanism may be thatsimilar positive and negative learning rates yield a nonbiasedaccumulation of evidence regarding the reinforcement value of astimulus, whereas more distinct learning rates lead to early valueevaluations being overdominated by either positive or negativefeedback, pushing decisions into nonoptimal solutions that are thendifficult to reverse. In the case of the Probabilistic Selection Task,our simulations showed that either of the overly positive or nega-tive LRIs could recover the so-called “negative learning bias” inreinforcement learning studies. The fact that most of the age-related imbalance in our data was due to higher positivecompared to negative learning rates echoes recent findingsshowing older age does not affect the rate of learning from goodnews but reduces the rate of learning from bad news (Sharot andGarret, 2016). Moreover, because the imbalance measure was alsohighly correlated to DARPP-32 allelic frequency, it likely reflectsdopamine system changes in the striatum during aging. Indeed,previous work has already confirmed that learning in our task re-cruits different subregions of the striatum depending on the feed-back type (Mattfeld et al., 2011) and is sensitive to dopaminesignaling (Tomer et al., 2014). Notably, the disparity between thelearning rates predicted performance according to an “inverted-U”function, consistent with a long-held view of the effects of dopa-mine on cognitive performance (Cools and D’Esposito, 2011; seealso Supplementary Fig. S3, Supplementary Information).
4.2. DARPP-32 and reinforcement learning
While we did not reproduce reported correlations betweenbehavior and COMT, DRD2, and DAT1 polymorphisms, those effectsare not always replicated and might be task-specific or limited tospecific cognitive processes (Frank and Fossella, 2011). The DARPP-32 gene, in contrast, may be more directly involved in reinforce-ment learning, with multiple pieces of evidence suggesting it isspecifically involved in reward learning (Calabresi et al., 2000;Frank et al., 2009; Stipanovich et al., 2008). DARPP-32 is knownto modulate synaptic plasticity of striatal cells and is regulated by
D1 dopamine receptors. Because the D1 signaling pathway is oftenconceived as reflecting positive prediction errors, it is commonlyassumed that DARPP-32 affects reward learning through thispathway (Cavanagh et al., 2014). Nevertheless, the exact process isanything but clear. There is neurobiological evidence that D2-receptors, often associated with negative prediction error (Kravitzet al., 2012), modulate DARPP-32 as well, countering the effects ofD1 receptors (Svenningsson et al., 2004). In addition, somewhatparadoxically, it was found that increased frequency of “A” alleles inthe rs907094 SNP is associated with a positive learning bias but asmaller reward learning rate in a model similar to ours (Frank et al.,2007). The authors explained this finding as resulting from thepossible benefits gained by slow accumulation of information.However, unlike our results, these findings were based on merging“AG” heterozygotes with “GG” homozygotes (thus not showing adosage effect), and the model parameters were not fit to trial-by-trial data. In fact, when trial-by-trial fitting was attempted, no as-sociation of learning rate to DARPP-32 was evident (Frank et al.,2007) (cf. Table 1). Our results suggest an alternative mechanism:given that the “A” allele expression in DARPP-32 was stronglyassociated with the LRI, it is possible that DARPP-32 plays a ho-meostatic role that maintains a balance between positive andnegative learning updates. In other words, it may be that both theD1-pathway and the D2-pathway modulate DARPP-32 expressionin opposite ways, and this modulation, in turn, increases or de-creases plasticity of the same circuits, thus enforcing stability. Bythis account, DARPP-32 “A” alleles improve reward learning bycontributing to balanced learning from positive and negative pre-diction errors rather than by directly influencing the magnitude ofupdates following positive prediction errors alone.
5. Conclusions
In this study, we have shown that age has at least 2 distincteffects on the ability to learn from probabilistic feedback, bothpotentially different from the ones observed in PD. In addition, weshowed through simulations that the well-known ProbabilisticSelection Task actually distinguishes between balanced and non-balanced learning rates rather than reward and punishmentlearning. Our model-derived LRI index, which was highly successfulin explaining behavioral results in both our Quarters task and theProbabilistic Selection Task, may prove to be a better character-ization of striatal learning than either reward- or punishment-related parameters separately.

R.B. Sojitra et al. / Neurobiology of Aging 68 (2018) 102e113112
Beyond its relevance to aging research, our work has implica-tions for studies of human reinforcement learning in general. Evenafter collecting data from large samples of participants, the stan-dard ANOVAs on our behavioral data only showed weak in-teractions between age and feedback condition. However, afterusing a reinforcement learning model to formalize the learningprocess, we revealed specific mechanisms that distinguish behaviorunder different types of reinforcement. A possible reason for whythe standard ANOVAs were not able to fully capture age-dependentdifferences between positive and negative feedback conditionscould be the different distributions of performance scores for thefeedback conditions (a bimodal distribution for positive feedbackcompared to a unimodal skewed distribution for negative feed-back), highlighting the limitations of over-reliance on averageperformance measures in characterizing learning. One implicationof the bimodal distribution is that, in principle, some participantsare unlikely to ever learn the optimal solution, even if they are givenan indefinite opportunity to train. This contrasts what is expectedfrom a unimodal learning profile, where further learning shouldeventually lead to perfect performance as the distribution’s vari-ance is reduced to aminimum. The current work shows thatmodelscan, in fact, capture these differences, emphasizing the importanceof such approaches in analyzing human behavioral data.
That said, the model-based analyses presented here are just afirst step in the direction of computational formalization of theoriesin aging and reinforcement learning. Future work may incorporateadditional statistical techniques for parameter estimation,including hierarchical Bayesian methods and others, which mayreveal further insights into the behavioral data and the underlyingmechanisms.
Disclosure statement
The authors confirm that there are no known conflicts of interestassociated with the publication of this article. The data used tosupport these findings are available from the co-first authors onrequest.
Acknowledgements
This research was supported by NIA/NIH grant R03AG044610-01A1 (PIs: Jessica Petok & Mark Gluck). The authors thank LisaHaber-Chalom, Elyon Obamedo, Iqra Baig, Sylvia Larson, CourtneyBreyer, Hilary Fiske, Chloe Mitchell, Christina Inyang, Ysa Gonzalez,Joshua Kest, and Aparna Govindan for help with data collection.Preliminary findings from this project were presented at the Societyfor Neuroscience conference in Washington DC during November2014 and November 2017 and the Neural Computation and Psy-chology workshop in Philadelphia during August 2016.
Appendix A. Supplementary data
Supplementary data related to this article can be found athttps://doi.org/10.1016/j.neurobiolaging.2018.04.006.
References
Backman, L., Nyberg, L., Lindenberger, U., Li, S.-C., Farde, L., 2006. The correlativetriad among aging, dopamine, and cognition. Neurosci. Biobehav. Rev. 30,791e807.
Bodi, N., Keri, S., Nagy, H., Moustafa, A., Myers, C.E., Daw, N., Dibo, G., Takats, A.,Bereczki, D., Gluck, M.A., 2009. Reward-learning and the novelty-seeking per-sonality: a between-and within-subjects study of the effects of dopamine ag-onists on young Parkinson’s patients. Brain 132, 2385e2395.
Bohnen, N.I., Muller, M.L., Kuwabara, H., Cham, R., Constantine, G.M., Studenski, S.A.,2009. Age-associated striatal dopaminergic denervation and falls incommunity-dwelling subjects. J. Rehabil. R. D. 46, 1045e1052.
Calabresi, P., Gubellini, P., Centonze, D., Picconi, B., Bernardi, G., Chergui, K.,Svenningsson, P., Fienberg, A.A., Greengard, P., 2000. Dopamine andcAMP-regulated phosphoprotein 32 kDa controls both striatal and long-termdepression and long-term potentiation, opposing forms of synaptic plasticity.J. Neurosci. 20, 8443e8451.
Cavanagh, J., Masters, S.E., Bath, K., Frank, M.J., 2014. Conflict acts as an implicit costin reinforcement learning. Nat. Commun. 5, 5394.
Coffey, C.E., Wilkinson, W.E., Parashos, I.A., Soady, S.A., Sullivan, R.J., Patterson, L.J.,Figiel, G.S., Webb, M.C., Spritzer, C.E., Djang, W.T., 1992. Quantitative cerebralanatomy of the aging human brain: a cross-sectional study using magneticresonance imaging. Neurology 42, 527e536.
Collier, T.J., Kanaan, N.M., Kordower, J.H., 2011. Ageing as a primary risk factor forParkinson’s disease: evidence from studies of non-human primates. Nat. Rev.Neurosci. 12, 359e366.
Cools, R., D’Esposito, M., 2011. Inverted-U shaped dopamine actions onhuman working memory and cognitive control. Biol. Psychiatry. 69,e113ee125.
Eppinger, B., Kray, J., 2011. To choose or to avoid: age differences in learning frompositive and negative feedback. J. Cogn. Neurosci. 23, 42e52.
Frank, M.J., Fossella, J.A., 2011. Neurogenetics and pharmacology of learning, moti-vations and cognition. Neuropsychopharmacology 36, 133e152.
Frank, M.J., Kong, L., 2008. Learning to avoid in older age. Psychol. Aging. 23,392e398.
Frank, M.J., Doll, B.B., Oas-Terpstra, J., Moreno, F., 2009. Prefrontal and striataldopaminergic genes predict individual differences in exploration and exploi-tation. Nat. Neurosci. 12, 1062e1068.
Frank, M.J., Moustafa, A.A., Haughey, H.M., Curran, T., Hutchison, K.E., 2007. Genetictriple dissociation reveals multiple roles for dopamine in reinforcementlearning. Proc. Natl. Acad. U. S. A. 104, 16311e16316.
Frank, M.J., Seeberger, L.C., O’Reilly, R.C., 2004. By carrot or by stick: cognitivereinforcement learning in Parkinsonism. Science 306, 1940e1943.
Gunning-Dixon, F.M., Head, D., McQuain, J., Acker, J.D., Raz, N., 1998. Differentialaging of the human striatum: a prospective MR imaging study. AJNR Am. J.Neuroradiol. 19, 1501e1507.
Karrer, T.M., Josef, A.K., Mata, R., Morris, E., Samanez-Larkin, G.R., 2017. Reduceddopamine receptors and transporters but not synthesis capacity in normal ag-ing adults: a meta-analysis. Neurobiol. Aging. 57, 36e46.
Knutson, B., Samanez-Larkin, G.R., Kuhnen, C.M., 2011. Gain and loss learningdifferentially contribute to life financial outcomes. PLoS One 6, e24390.
Kovalchik, S., Camerer, C.F., Grether, D.M., Plott, C.R., Allman, J.M., 2005. Aging anddecision making: a comparison between neurologically healthy elderly andyoung individuals. J. Econ. Behav. Organ 58, 79e94.
Kravitz, A.V., Tye, L.D., Kreitzer, A.C., 2012. Distinct roles for direct and indirectpathway striatal neurons in reinforcement. Nat. Neurosci. 15, 816e818.
Lighthall, N.R., Gorlick, M.A., Schoeke, A., Frank, M.J., Mather, M., 2013. Stressmodulates reinforcement learning in younger and older adults. Psychol. Aging.28, 35e46.
Lindenberger, U., Baltes, P.B., 1997. Intellectual functioning in old and very oldage: cross-sectional results from the Berlin Aging Study. Psychol. Aging. 12,410e432.
Lotharius, J., Brundin, P., 2002. Pathogenesis of Parkinson’s disease: dopamine,vesicles and alpha- synuclein. Nat. Rev. Neurosci. 3, 932e942.
Marschner, A., Mell, T., Wartenburger, I., Villringer, A., Reischies, F.M.,Heekeren, H.R., 2005. Reward-based decision-making and aging. Brain. Res.Bull. 67, 382e390.
Mattfeld, A.T., Gluck, M.A., Stark, C.E.L., 2011. Functional specialization within thestriatum along both the dorsal/ventral and anterior/posterior axes duringassociative learning via reward and punishment. Learn. Memory 18,703e711.
Mell, T., Heekeren, H.R., Marschner, A., Wartenburger, I., Villringer, A.,Reischies, F.M., 2005. Effect of aging on stimulus-reward association learning.Neuropsychologlia 43, 554e563.
Moustafa, A.A., Gluck, M.A., Herzallah, M.M., Myers, C.E., 2015a. The influence oftrial order on learning from reward vs. punishment in a probabilistic catego-rization task: experimental and computational analyses. Front. Behav. Neurosci9, 153.
Moustafa, A.A., Sheynin, J., Myers, C.E., 2015b. The role of informative and ambig-uous feedback in avoidance behavior: empirical and computational findings.PLoS One 10, e0144083.
Murray, B.D., Anderson, M.C., Kensinger, E.A., 2015. Older adults can suppress un-wanted memories when given an appropriate strategy. Psychol. Aging. 30,9e25.
Myers, C.E., Moustafa, A.A., Sheynin, J., Vanmeenen, K.M., Gilbertson, M.W., Orr, S.P.,Beck, K.D., Pang, K.C., Servatius, R.J., 2013. Learning to obtain reward, but notavoid punishment, is affected by presence of PTSD symptoms in male veterans:empirical data and computational model. PLoS One 8, e72508.
Raz, N., Torres, I.J., Spencer, W.D., Acker, J.D., 1993. Pathoclycis in aging human ce-rebral cortex: evidence from in vivo MRI morphometry. Psychobiology 21,151e160.
Rutledge, R.B., Lazzaro, S.C., Lau, B., Myers, C.E., Gluck, M.A., Glimcher, P.W., 2009.Dopaminergic drugs modulate learning rates and perseveration in

R.B. Sojitra et al. / Neurobiology of Aging 68 (2018) 102e113 113
Parkinson’s patients in a dynamic foraging task. J. Neurosci. 29,15104e15114.
Salthouse, T.A., 1996. The processing-speed theory of adult age differences incognition. Psychol. Rev. 103, 403e428.
Samanez-Larkin, G.R., Levens, S.M., Perry, L.M., Dougherty, R.F., Knutson, B., 2012.Frontostriatal white matter integrity mediates adult age differences probabi-listic reward learning. J. Neurosci. 32, 5333e5337.
Samanez-Larkin, G.R., Worthy, D.A., Mata, R., McClure, S.M., Knutson, B., 2014. Adultage differences in frontostriatal representation of prediction error but notreward outcome. Cogn. Affect. Behav. Neurosci. 14, 672e682.
Schultz, W., 2002. Getting formal with dopamine and reward. Neuron 36, 241e263.Sharot, T., Garret, N., 2016. Forming beliefs: why valence matters. Trends. Cogn. Sci.
20, 25e33.Simon, J.R., Howard, J.H., Howard, D.V., 2010. Adult age differences in learning
from positive and negative probabilistic feedback. Neuropsychology 24,534e541.
Stipanovich, A., Valjent, E., Matamales, M., Nishi, A., Ahn, J.-H., Maroteaux, M.,Bertran-Gonzalez, J., Brami-Cherrier, K., Enslen, H., Corbille, A.-G., Fihol, O.,Nairn, A.C., Greengard, P., Herve, D., Girault, J.-A., 2008. A phosphatase cascade
by which natural rewards and drugs of abuse regulate nucleosomal response inthe mouse. Nature 453, 879e884.
Svenningsson, P., Nishi, A., Fisone, G., Girault, J., Nairn, A.C., Greengard, P., 2004.DARPP-32: an integrator of neurotransmission. Annu. Rev. Pharmacol. Toxicol.44, 269e296.
Tomer, R., Slagter, H.A., Christian, B.T., Fox, A.S., King, C.R., Murali, D., Gluck, M.A.,Davidson, R.J., 2014. Love to win or hate to lose? Asymmetry of dopamine D2receptor binding predicts sensitivity to reward versus punishment. J. Cogn.Neurosci. 26, 1039e1048.
van Dyck, C.H., Seibyl, J.P., Malison, R.T., Laruelle, M., Zoghbi, S.S., Baldwin, R.M.,Innis, R.B., 2002. Age-related decline in dopamine transporters: analysis ofstriatal subregions, nonlinear effects, and hemispheric asymmetries. Am. J.Geriatr. Psychiatry 10, 36e43.
Volkow, N.D., Ding, Y.S., Fowler, J.S., Wang, G.J., Logan, J., Gatley, S.J., Hitzemann, R.,Smith, G., Fields, S.D., Gur, R., 1996. Dopamine transporters decrease with age.J. Nucl. Med. 37, 554e559.
Wood, S., Busemeyer, J., Koling, A., Cox, C.R., Davis, H., 2005. Older adults as adaptivedecision makers: evidence from the iowa gambling task. Psychol. Aging. 20,220e225.
![Newark post (Newark, Del.), 1922-11-22, [p 5] · 2017. 12. 12. · NEWARK POST, NEWARK, DELAWARE. NOVEMBER 22, 1922. 5 1 home of Mrs. Wm. J. Rowan, ö per Main Street. FORMER NEWARK](https://img.dokumen.tips/doc/110x75/60a5b524704c030d7b5c79fd/newark-post-newark-del-1922-11-22-p-5-2017-12-12-newark-post-newark.jpg)