Embed Size (px)
Citation preview

NEWARK PUBLIC SCHOOLS and NEWARK TEACHERS UNION Teacher Contract Evaluation
YEAR 1 REPORT
American Institutes for Research would like to thank the Newark Public Schools teachers and school leaders and the Foundation for Newark’s Future for their generous time and support for this evaluation.
Newark Public Schools and Newark Teachers Union Teacher Contract EvaluationYEAR 1 REPORT
FEBRUARY 2016
Eleanor S. Fulbeck, Ph.D.
Martyna Citkowicz, Ph.D.
Candace H. Hester, Ph.D.
David Manzeske, Ph.D.
Melissa Yisak
Ryan Eisner

ContentsExecutive Summary . . . . . . . . . . . . . . . . . . . . . . . . . . . . . . . . vii
Recommendations . . . . . . . . . . . . . . . . . . . . . . . . . . . . . . . . . ix
Introduction . . . . . . . . . . . . . . . . . . . . . . . . . . . . . . . . . . . . 1
Background . . . . . . . . . . . . . . . . . . . . . . . . . . . . . . . . . . 1
Report Focus . . . . . . . . . . . . . . . . . . . . . . . . . . . . . . . . . . 4
Overview of the Teacher Contract . . . . . . . . . . . . . . . . . . . . . . . . . . . . . . . . .5
A Teacher Evaluation System . . . . . . . . . . . . . . . . . . . . . . . . . . 5
Differentiated Teacher Compensation . . . . . . . . . . . . . . . . . . . . . 10
Extended Learning Time. . . . . . . . . . . . . . . . . . . . . . . . . . . . 11
School-Based Decision Making . . . . . . . . . . . . . . . . . . . . . . . . 11
Significance . . . . . . . . . . . . . . . . . . . . . . . . . . . . . . . . . 12
Methods . . . . . . . . . . . . . . . . . . . . . . . . . . . . . . . . . . . . . 13
Teachers’ and School Leaders’ Perceptions of the Teacher Contract. . . . . . . 13
Association Between Teacher Retention and Differentiated Performance Ratings. 15
Limitations . . . . . . . . . . . . . . . . . . . . . . . . . . . . . . . . . . 16
Findings . . . . . . . . . . . . . . . . . . . . . . . . . . . . . . . . . . . . . 17
Teachers’ and School Leaders’ Perceptions of the Teacher Contract. . . . . . . 17
Perceptions of the Teacher Evaluation System . . . . . . . . . . . . . . . . . 17
Perceptions of Differentiated Compensation . . . . . . . . . . . . . . . . . . 22
Perceptions of Extended Learning Time . . . . . . . . . . . . . . . . . . . . 26
General Perceptions and Attitudes. . . . . . . . . . . . . . . . . . . . . . . 29
Differentiated Teacher Retention. . . . . . . . . . . . . . . . . . . . . . . . 31
Districtwide Retention Results. . . . . . . . . . . . . . . . . . . . . . . . . 32
School-Level Retention Results . . . . . . . . . . . . . . . . . . . . . . . . 34
Conclusion . . . . . . . . . . . . . . . . . . . . . . . . . . . . . . . . . . . . 37
Recommendations . . . . . . . . . . . . . . . . . . . . . . . . . . . . . . . . 38
References . . . . . . . . . . . . . . . . . . . . . . . . . . . . . . . . . . . . 39
Appendix A. Evaluation and Teacher Contract Components Background . . . . . . . A-1
Appendix B. Survey Methods . . . . . . . . . . . . . . . . . . . . . . . . . . . B-1
Appendix C. Retention Analysis Methods. . . . . . . . . . . . . . . . . . . . . . C-1

American Institutes for Research vii
Executive SummaryIn 2012–13, Newark Public Schools (NPS) ratified a new teacher contract with the Newark Teachers Union (NTU). The main goal of the NPS/NTU contract and associated initiatives is to implement a high-quality measure of teaching effectiveness and use it to support and manage teachers in ways that improve student outcomes. A secondary goal of the contract is to increase equitable access to effective teachers. The contract includes four components: (1) a more rigorous teacher evaluation system, (2) differentiated teacher compensation, (3) extended learning time, and (4) school-based decision making.
NPS commissioned American Institutes for Research (AIR) to conduct an evaluation of the implementation and impact of the NPS/NTU contract and associated initiatives. The three-year evaluation focuses on a variety of outcomes (e.g., educator perceptions, teacher retention, teacher effectiveness, and student achievement) associated with the four contract components. In the first year of the evaluation, the period to which this report corresponds, the evaluation team used qualitative and quantitative techniques to assess the implementation of the contract components and to examine the association between the new evaluation and compensation systems (i.e., Components 1 and 2) and teacher retention. This report presents findings related to educator perceptions, as captured by teacher and school leader surveys administered in spring 2015, after two years of contract implementation (i.e., as of the 2014–15 school year) and teacher retention after one year of contract implementation (i.e., through the 2013–14 school year).1 The AIR evaluation team plans to examine the contract’s impact on teacher effectiveness and student achievement in 2016 and 2017, respectively.
Key findings related to the new teacher evaluation system and other components of the NPS/NTU contract include the following:
■ The survey findings suggest that the new evaluation system is perceived as valid, accurate, fair, and useful. Both teachers and school leaders reported that the evaluation system is valid, accurate, and fair and that it provides useful and actionable feedback that can inform teachers’ instructional practices.
■ The retention results suggest that teachers who are rated more effective under the new teacher evaluation system are retained at higher rates than teachers who receive lower ratings. The findings suggest that teachers who are “effective” and “highly effective” are more likely to be retained than teachers who are rated “partially effective” or “ineffective.” Specifically, in 2013–14, teachers rated “effective” and “highly effective” were retained at rates that exceed 90 percent throughout the contract implementation period, whereas 72 percent of “partially
effective” and 63 percent of “ineffective” teachers were retained.
1 Please cite this report as follows: Fulbeck, E. S., Citkowicz, M., Hester, C. H., Manzeske, D., Yisak, M., & Eisner, R. (2016). Newark Public Schools and Newark Teachers Union teacher contract evaluation: Year 1 report. Washington, DC: American Institutes for Research.
NEWARK PUBLIC SCHOOLS and NEWARK TEACHERS UNION Teacher Contract Evaluation | YEAR 1 REPORTviii
■ The survey findings suggest that educators reported mixed support for the
differentiated compensation component of the teacher contract. A majority of
teachers and school leaders reported that the bonuses currently included in the
compensation system should be available to teachers. However, teachers and
school leaders had differing perceptions about the fairness of their own salary
scale or the current salary scale at their school. Approximately one quarter of
teachers agreed the compensation system is reasonable, fair, and appropriate,
whereas approximately half of school leaders agreed.
■ The survey findings suggest that extended learning time for student instruction
and teacher planning and collaboration has been implemented in more than
half of NPS schools and is perceived as useful by a majority of educators.
Teachers and school leaders were more likely to report that time has been
added for student instruction than for teacher collaboration and planning. Of
the teachers and school leaders who reported that time for student instruction
was added, more than half reported that time was added to core subjects. Of
the teachers and leaders who reported that time for teacher planning and
collaboration was added, most teachers and school leaders reported that the
time was used for staff professional development, lesson planning and unit
design, analyzing and interpreting student achievement data, and team building.
Approximately two thirds of teachers and school leaders reported that the
additional time for student instruction and teacher planning and collaboration
was useful.
■ The survey findings suggest that teachers who felt supported and both
teachers and school leaders who felt knowledgeable about the teacher
contract also felt more positive about the teacher contract and related
initiatives. Teachers who reported feeling supported by NPS administrators or
parents were more likely to have reported positive feelings about the contract
components and related initiatives. Similarly, teachers and school leaders who
reported having substantial knowledge of a given contract component were more
likely to have reported positive feelings about that contract component. School
leaders generally reported more positive feelings about the contract components
than teachers, although more school leaders also reported having substantial
knowledge of the contract components.
American Institutes for Research ix
Recommendations
From the results presented in the Executive Summary and detailed in the report, we identified several recommendations for NPS. These recommendations include the following:
■ Continue to use the new evaluation system to measure effective teaching and provide teachers with performance feedback, while increasing awareness about opportunities for teachers to provide feedback on the functioning of the system. Most teachers and school leaders reported that the evaluation system is accurate, valid, and useful. Teachers and school leaders who reported feeling more knowledgeable about the evaluation process were more likely than those who reported feeling less knowledgeable to have reported positive feelings about the evaluation system. Given these findings, NPS could consider ways to increase awareness of the opportunities available for teachers to provide feedback about the functioning of the evaluation system. In addition, NPS may want to publicize the changes they have made to the new evaluation system as a result of teacher feedback, thereby validating teachers’ efforts to improve the system. Although these opportunities to provide feedback may not necessarily improve feelings about the evaluation system, they will help to ensure that teachers and school leaders are able to provide feedback about the system.
■ Provide more opportunities for teachers and school leaders to learn about the components of the teacher contract. The survey findings suggest that teachers and school leaders who reported having substantial knowledge of a given contract component were more likely to have reported positive feelings about that component. NPS could consider providing additional trainings, fact sheets, toolkits, and webinars to share information with teachers and school leaders about the contract, in general, and specific contract components, in the event that more information is being sought. Although these learning opportunities may not necessarily improve feelings about teacher contract components and associated initiatives, they will help to ensure that teachers and school leaders understand the components that could improve potential buy-in and fidelity of implementation.
■ Develop a communication plan and trainings for teachers and school leaders to learn more about the differentiated compensation available under the new salary systems. Given the mixed support of teachers and school leaders about differentiated compensation under the new salary system, NPS may want to consider developing communication to advertise the opportunities for additional pay under the new system. In addition, NPS might consider developing trainings to increase educators’ knowledge of the new compensation system.
NEWARK PUBLIC SCHOOLS and NEWARK TEACHERS UNION Teacher Contract Evaluation | YEAR 1 REPORT1
IntroductionIn 2012–13, Newark Public Schools (NPS) ratified a new teacher contract with the Newark
Teachers Union (NTU). The main goal of the NPS/NTU contract and associated initiatives
is to implement a high-quality measure of teaching effectiveness and use it to support
and manage teachers in ways that improve student outcomes. A secondary goal of the
contract is to increase equitable access to effective teachers. The contract includes four
components: (1) a more rigorous teacher evaluation system, (2) differentiated teacher
compensation, (3) extended learning time, and (4) school-based decision making.
In 2014, NPS commissioned American Institutes for Research (AIR) to conduct a three-
year formative and summative evaluation of the NPS/NTU contract
and associated initiatives.2 The three-year evaluation focuses on a
variety of outcomes (e.g., educator perceptions, teacher retention,
teacher effectiveness, and student achievement) associated with
the four contract components. In the first year of the evaluation,
the period to which this report corresponds, the study team used
qualitative and quantitative techniques to assess the implementation
of the four contract components and to examine the impact of the
new evaluation and compensation systems on teacher retention.
In this Introduction, we first provide background information to clarify the context in
which the evaluation occurs, and we then explain the focus of the report.
Background
With 66 schools, 3,086 classroom teachers, and a student population of 35,054, NPS
is the largest school system in New Jersey. Within New Jersey, NPS is comparable in
student demographics and achievement with Camden City School District, Paterson
Public Schools, and Trenton Public School District. Under state control since 1995, NPS
has struggled with persistently low academic achievement, graduation rates, and college
enrollment. In 2010, Facebook Founder and Chief Executive Officer
Mark Zuckerberg tried to change that with a pledge of $100 million,
which was matched with another $100 million, mostly from
foundations and private donors. The goal of these funds was
to dramatically improve education in Newark while developing a
model for urban education in the United States (Kotlowitz, 2015).
In particular, Zuckerberg hoped the funds would support reforms
to raise the status of the teaching profession and reward teachers
who improved students’ performance.
2 Funding for this evaluation was provided to NPS through the Foundation for Newark’s Future. The associated initiatives include the teacher evaluation system, differentiated compensation system, and extended learning time for selected schools.
With 66 schools, 3,086 classroom
teachers, and a student population of 35,054,
NPS is the largest school system in New Jersey.
In 2014, NPS commissioned AIR to conduct a three-year formative and summative evaluation of the NPS/NTU contract and associated initiatives.

American Institutes for Research 2
Chris Christie, governor of New Jersey, and Cory Booker, then mayor of Newark, appointed
Cami Anderson as the superintendent of NPS in May 2011. During the 2011–12 school
year, NPS resumed previously stalled contract negotiations with the NTU. Among other
reforms enacted during her tenure, Anderson led the development of a memorandum of
agreement between NPS and the NTU concerning teacher evaluation and compensation
reforms that would be included in the new teacher contract. Anderson saw the four
components of the new teacher contract as part of a larger theory of action, grounded
in prior research, which could support improved teaching effectiveness and, ultimately,
could increase student learning and achievement in NPS.
In November 2012, the NTU approved the new teacher contract by a vote of 1,767
to 1,088 (62 percent to 38 percent). The contract went into effect immediately in the
2012–13 school year (Mooney, 2012). The NPS/NTU teacher contract was the first
performance-based contract in NPS and in the state of New Jersey. Upon ratification,
NTU members received $31 million in a one-time special payment, and almost an
additional $20 million in stipends in the first year of implementation, according to
district records.
During the 2013–14 and 2014–15 school years, NPS continued to face declining
enrollment and to see low academic achievement and college enrollment (Clark, 2015;
NPS, n.d.). Moreover, the relationship between NPS and the NTU became strained. In
spring 2015, the NTU and the Newark Student Union protested the extended learning
time component of the contract, which extended the school day and summer meeting
requirements for teachers in some schools (Nix, 2015). The NTU also expressed
concerns related to the universal enrollment plan that allowed students to enroll in
schools across the district rather than their neighborhood school, which was established
under Anderson’s “One Newark Plan” (NPS, Office of Strategy and Innovation, n.d.), and
the increased prominence of charter schools in Newark. In June 2015, Anderson
resigned and was replaced by the former New Jersey state education commissioner,
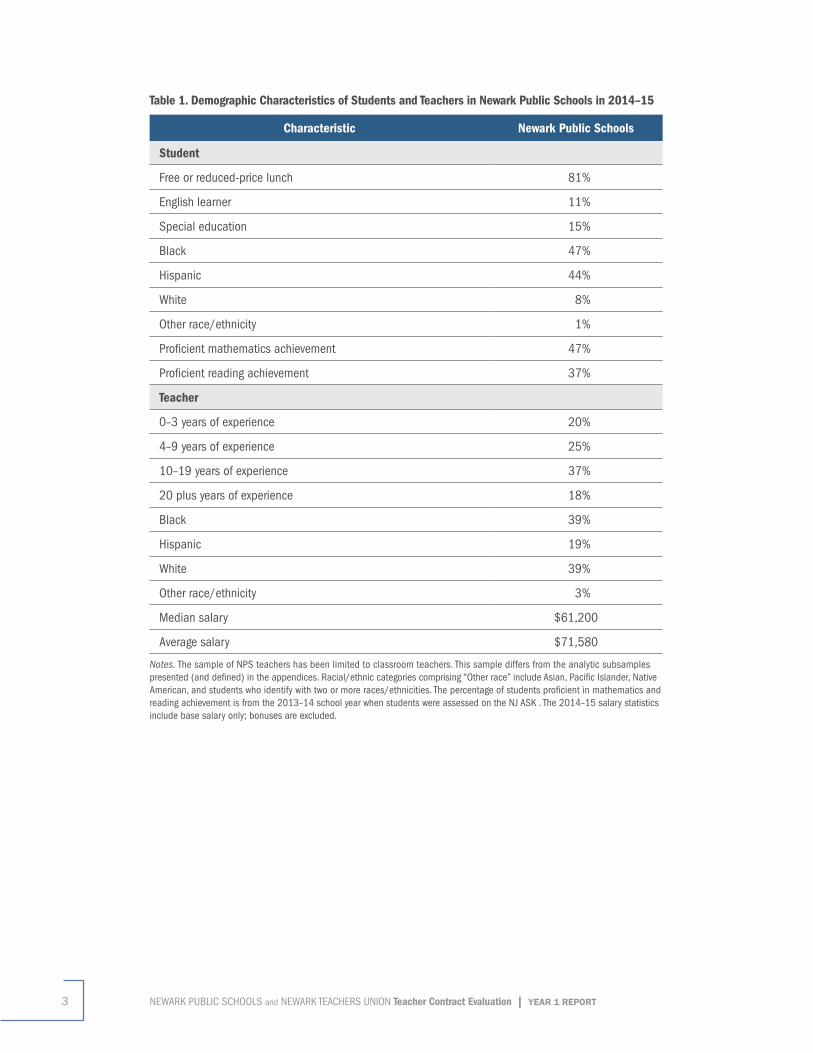
Chris Cerf (Zernike, 2015). Table 1 presents the demographic characteristics of the
students and teachers in NPS in the most recent school year, 2014–15.
NEWARK PUBLIC SCHOOLS and NEWARK TEACHERS UNION Teacher Contract Evaluation | YEAR 1 REPORT3
Table 1. Demographic Characteristics of Students and Teachers in Newark Public Schools in 2014–15
Characteristic Newark Public Schools
Student
Free or reduced-price lunch 81%
English learner 11%
Special education 15%
Black 47%
Hispanic 44%
White 8%
Other race/ethnicity 1%
Proficient mathematics achievement 47%
Proficient reading achievement 37%
Teacher
0–3 years of experience 20%
4–9 years of experience 25%
10–19 years of experience 37%
20 plus years of experience 18%
Black 39%
Hispanic 19%
White 39%
Other race/ethnicity 3%
Median salary $61,200
Average salary $71,580
Notes. The sample of NPS teachers has been limited to classroom teachers. This sample differs from the analytic subsamples presented (and defined) in the appendices. Racial/ethnic categories comprising “Other race” include Asian, Pacific Islander, Native American, and students who identify with two or more races/ethnicities. The percentage of students proficient in mathematics and reading achievement is from the 2013–14 school year when students were assessed on the NJ ASK . The 2014–15 salary statistics include base salary only; bonuses are excluded.
American Institutes for Research 4
Report Focus
The four components included in the teacher contract provide an organizational structure
for the AIR evaluation of the contract. The evaluation research questions align to the
contract components, and we collect data from multiple sources to answer these
research questions. Research questions relate to the following domains:
■ Teacher Evaluation (e.g., Are the evaluations of high quality, providing valid and
accurate information about teacher performance? Are structures in place to allow
for teacher feedback regarding the evaluation system?)
■ Differentiated Pay (e.g., Are the highest performing teachers being financially
rewarded?)
■ Extended Learning Time (e.g., Is there more time for student learning in the
district’s extended learning time schools?)
■ School-Based Decision Making (e.g., Do schools have increased flexibility to
implement innovative approaches to instruction and operations?)
■ Outcomes (e.g., Are the highest rated teachers more likely to stay in the district
and in certain schools?)
The full set of research questions and corresponding data sources are presented in
Appendix A, Table A1.
This is the first report in a series that will summarize efforts related to contract
implementation and the impacts of the contract and related initiatives. In the next
section, we provide an overview of the contract and related initiatives as well as a
logic model that illustrates the theory of action espoused by the new teacher evaluation
system. Following the overview, we present a brief description of the data and the analytic
methods used for each of the analyses.3 Next, we present findings related to teacher
and school leader perceptions of the reforms and findings related to the association
between the new teacher evaluation and compensation systems and teacher retention.
We conclude with a discussion of the results and implications for NPS.
3 Additional information on the data and methods used to examine educator perspectives and teacher retention is presented in Appendix B and Appendix C, respectively.
NEWARK PUBLIC SCHOOLS and NEWARK TEACHERS UNION Teacher Contract Evaluation | YEAR 1 REPORT5
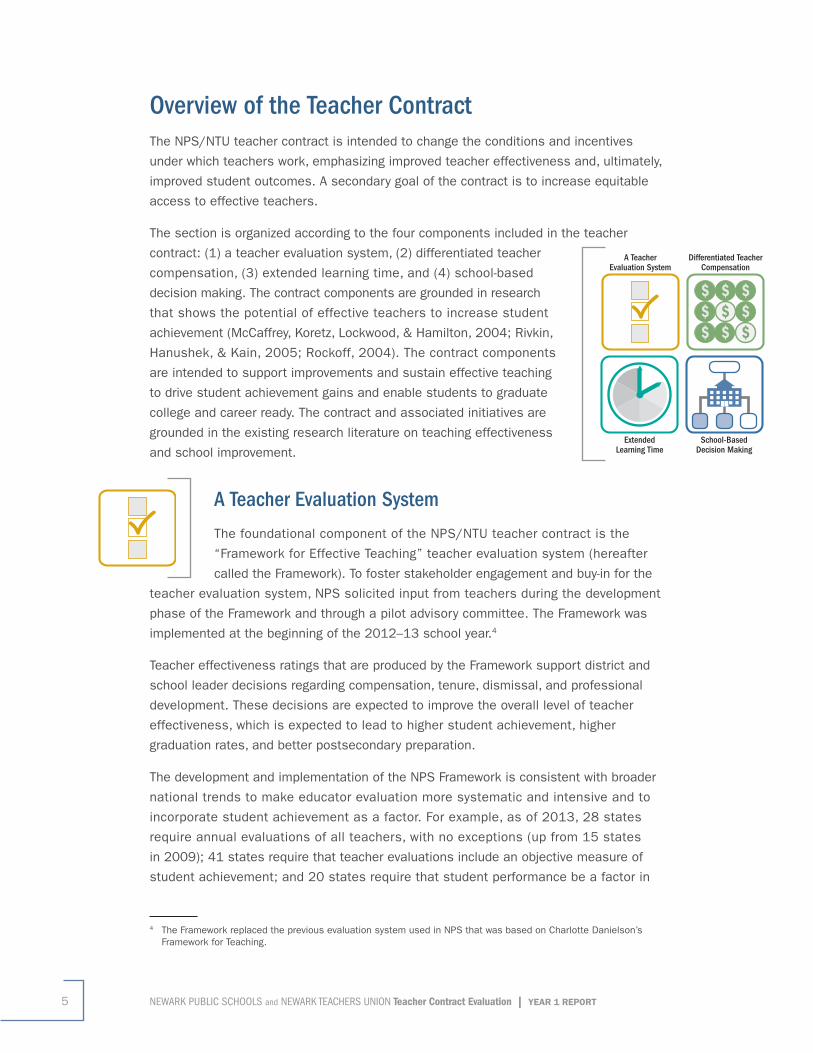
Overview of the Teacher Contract
The NPS/NTU teacher contract is intended to change the conditions and incentives
under which teachers work, emphasizing improved teacher effectiveness and, ultimately,
improved student outcomes. A secondary goal of the contract is to increase equitable
access to effective teachers.
The section is organized according to the four components included in the teacher
contract: (1) a teacher evaluation system, (2) differentiated teacher
compensation, (3) extended learning time, and (4) school-based
decision making. The contract components are grounded in research
that shows the potential of effective teachers to increase student
achievement (McCaffrey, Koretz, Lockwood, & Hamilton, 2004; Rivkin,
Hanushek, & Kain, 2005; Rockoff, 2004). The contract components
are intended to support improvements and sustain effective teaching
to drive student achievement gains and enable students to graduate
college and career ready. The contract and associated initiatives are
grounded in the existing research literature on teaching effectiveness
and school improvement.
A Teacher Evaluation System
The foundational component of the NPS/NTU teacher contract is the
“Framework for Effective Teaching” teacher evaluation system (hereafter
called the Framework). To foster stakeholder engagement and buy-in for the
teacher evaluation system, NPS solicited input from teachers during the development
phase of the Framework and through a pilot advisory committee. The Framework was
implemented at the beginning of the 2012–13 school year.4
Teacher effectiveness ratings that are produced by the Framework support district and
school leader decisions regarding compensation, tenure, dismissal, and professional
development. These decisions are expected to improve the overall level of teacher
effectiveness, which is expected to lead to higher student achievement, higher
graduation rates, and better postsecondary preparation.
The development and implementation of the NPS Framework is consistent with broader
national trends to make educator evaluation more systematic and intensive and to
incorporate student achievement as a factor. For example, as of 2013, 28 states
require annual evaluations of all teachers, with no exceptions (up from 15 states
in 2009); 41 states require that teacher evaluations include an objective measure of
student achievement; and 20 states require that student performance be a factor in
4 The Framework replaced the previous evaluation system used in NPS that was based on Charlotte Danielson’s Framework for Teaching.
A Teacher Evaluation System
Differentiated Teacher Compensation
Extended Learning Time
School-Based Decision Making
A Teacher Evaluation System
Differentiated Teacher Compensation
Extended Learning Time
School-Based Decision Making
A Teacher Evaluation System
Differentiated Teacher Compensation
Extended Learning Time
School-Based Decision Making
A Teacher Evaluation System
Differentiated Teacher Compensation
Extended Learning Time
School-Based Decision Making
A Teacher Evaluation System
Differentiated Teacher Compensation
Extended Learning Time
School-Based Decision Making
American Institutes for Research 6
granting tenure to teachers (National Council on Teacher Quality, 2014). Given these
rapid changes in policy relating to teacher evaluation, there is widespread interest in
guidance about how to develop better measures of teaching effectiveness and use this
information to improve the teaching workforce.
Research suggests that evaluations should draw on multiple measures of teacher
effectiveness (Cantrell & Kane, 2013; Little, Goe, & Bell, 2009). The two most widely
used measures to evaluate teacher performance are quantitative analyses of student
growth measures and classroom observations of teachers’ instructional practices.
Often, these are supplemented by other measures, such as analyses of classroom
artifacts or student work portfolios.
Drawing on this growing body of research, the Framework is made up of direct measures
of teaching that include classroom observations using a locally developed rubric;
student growth percentiles and student growth objectives (i.e., goals for measurable
improvements or “growth” in student learning that teachers write with their principal
at the beginning of the school year); and other information, such as lesson plans
and teacher attendance.
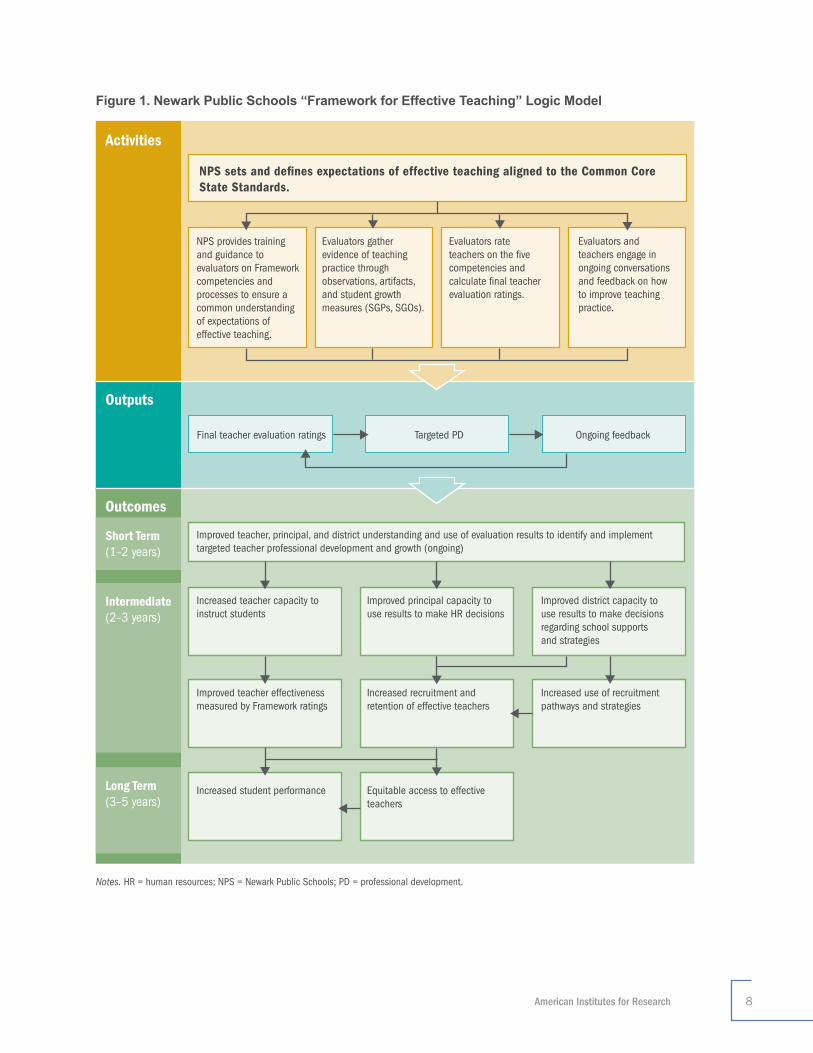
Figure 1 presents a logic model of the relationship between the activities, outputs, and
outcomes anticipated across the district with the implementation of the Framework.
Activities undertaken in the teacher evaluation process include the following:
■ Set and define expectations of effective teaching aligned to the Common Core
State Standards.
■ Provide training and guidance to evaluators regarding the Framework competencies
and processes to ensure a common understanding of expectations of effective
teaching and consistent application of the Framework.
■ Gather evidence of teaching practice through observations, artifacts, and measures
of student growth.
■ Rate teachers on the Framework competencies, and calculate a final teacher
evaluation rating.
■ Engage in ongoing conversations and performance feedback about how to
improve teaching practices.
The key output from the Framework is a learning cycle whereby teachers’ evaluation
ratings inform the ongoing performance feedback they receive. The performance
feedback informs the targeted professional development to support identified areas
of weakness. The performance feedback is also meant to contribute to (and improve)
teachers’ final evaluation ratings in the subsequent year. This professional learning
cycle is, in turn, intended to improve teaching effectiveness and lead to increased
student achievement.
NEWARK PUBLIC SCHOOLS and NEWARK TEACHERS UNION Teacher Contract Evaluation | YEAR 1 REPORT7
In addition to the direct improvement of teaching effectiveness through performance
feedback and targeted professional development, there also are short-, intermediate-,
and long-term outcomes expected with the implementation of the Framework. Short-
term outcomes (anticipated one to two years after implementation) include improved
teacher, principal, and district understanding and use of evaluation results to identify
and implement targeted teacher professional development and growth. We would expect
to observe this outcome starting in the 2013–14 or 2014–15 school years.
Intermediate-term outcomes (anticipated two to three years after implementation)
include the following:
■ Increased teacher capacity to instruct students as measured by the Framework
■ Improved principal capacity to use results from the Framework to inform staffing,
placement, tenure, and dismissal decisions and increased recruitment and
retention of effective teachers
■ Improved district capacity to use results from the Framework to make decisions
regarding school supports and strategies and increased use of recruitment
pathways and strategies
We would expect to observe these outcomes starting in the 2014–15 or 2015–16
school years.
Finally, the long-term outcomes (anticipated three to five years after implementation)
include increasing student performance and providing equitable access to effective
teachers. We would expect to observe these outcomes starting somewhere between
the 2015–16 and 2017–18 school years.
It is possible that factors other than the contract components are drivers of student
learning and achievement. For example, factors related to curriculum, standards,
assessments, leadership effectiveness, and resource funding may also have an
impact on student learning and achievement. These other factors are not the focus
of this report.
American Institutes for Research 8
Figure 1. Newark Public Schools “Framework for Effective Teaching” Logic Model
Notes. HR = human resources; NPS = Newark Public Schools; PD = professional development.
NPS sets and de�nes expectations of effective teaching aligned to the Common Core State Standards.
Activities
Outputs
Outcomes
Short Term (1–2 years)
Intermediate (2–3 years)
Long Term (3–5 years)
NPS provides training and guidance to evaluators on Framework competencies and processes to ensure a common understanding of expectations of effective teaching.
Improved teacher, principal, and district understanding and use of evaluation results to identify and implement targeted teacher professional development and growth (ongoing)
Evaluators gather evidence of teaching practice through observations, artifacts, and student growth measures (SGPs, SGOs).
Evaluators rate teachers on the �ve competencies and calculate �nal teacher evaluation ratings.
Final teacher evaluation ratings Targeted PD Ongoing feedback
Increased teacher capacity to instruct students
Improved principal capacity to use results to make HR decisions
Improved district capacity to use results to make decisions regarding school supports and strategies
Improved teacher effectiveness measured by Framework ratings
Increased recruitment and retention of effective teachers
Increased student performance Equitable access to effective teachers
Increased use of recruitment pathways and strategies
Evaluators and teachers engage in ongoing conversations and feedback on how to improve teaching practice.
NEWARK PUBLIC SCHOOLS and NEWARK TEACHERS UNION Teacher Contract Evaluation | YEAR 1 REPORT9
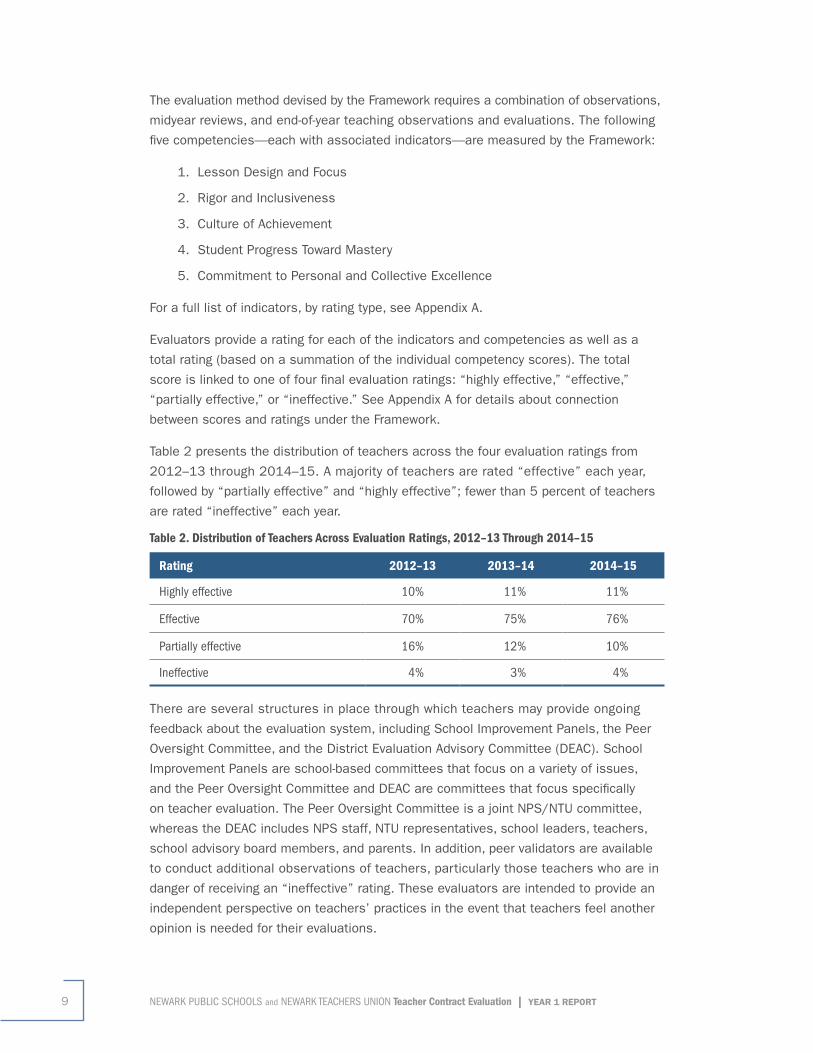
The evaluation method devised by the Framework requires a combination of observations,
midyear reviews, and end-of-year teaching observations and evaluations. The following
five competencies—each with associated indicators—are measured by the Framework:
1. Lesson Design and Focus
2. Rigor and Inclusiveness
3. Culture of Achievement
4. Student Progress Toward Mastery
5. Commitment to Personal and Collective Excellence
For a full list of indicators, by rating type, see Appendix A.
Evaluators provide a rating for each of the indicators and competencies as well as a
total rating (based on a summation of the individual competency scores). The total
score is linked to one of four final evaluation ratings: “highly effective,” “effective,”
“partially effective,” or “ineffective.” See Appendix A for details about connection
between scores and ratings under the Framework.
Table 2 presents the distribution of teachers across the four evaluation ratings from
2012–13 through 2014–15. A majority of teachers are rated “effective” each year,
followed by “partially effective” and “highly effective”; fewer than 5 percent of teachers
are rated “ineffective” each year.
Table 2. Distribution of Teachers Across Evaluation Ratings, 2012–13 Through 2014–15
Rating 2012–13 2013–14 2014–15
Highly effective 10% 11% 11%
Effective 70% 75% 76%
Partially effective 16% 12% 10%
Ineffective 4% 3% 4%
There are several structures in place through which teachers may provide ongoing
feedback about the evaluation system, including School Improvement Panels, the Peer
Oversight Committee, and the District Evaluation Advisory Committee (DEAC). School
Improvement Panels are school-based committees that focus on a variety of issues,
and the Peer Oversight Committee and DEAC are committees that focus specifically
on teacher evaluation. The Peer Oversight Committee is a joint NPS/NTU committee,
whereas the DEAC includes NPS staff, NTU representatives, school leaders, teachers,
school advisory board members, and parents. In addition, peer validators are available
to conduct additional observations of teachers, particularly those teachers who are in
danger of receiving an “ineffective” rating. These evaluators are intended to provide an
independent perspective on teachers’ practices in the event that teachers feel another
opinion is needed for their evaluations.
American Institutes for Research 10
In addition to providing feedback on the new evaluation system, teachers also can provide feedback on how they are treated in their specific evaluations. For example, a rebuttal process provides teachers with the opportunity to refute their final evaluation ratings. Teachers can provide feedback on their specific evaluations through ongoing, informal conversations with their evaluators.
Differentiated Teacher Compensation
In addition to rigorous performance evaluations and the importance of
teacher feedback on such evaluation processes, performance-based
financial incentives for educators have been championed by policymakers
as a way to recruit, recognize, reward, and retain effective educators (Baratz-Snowden, 2007; Chait & Miller, 2009). Recent research suggests that financial incentives—as well as evaluation systems and performance feedback tied to these incentives—may yield compositional effects by improving retention that leads to an overall improvement in teacher effectiveness (Fulbeck, 2014; Glazerman & Seifullah, 2012).5 In addition, evidence shows that performance-based financial incentives and the evaluation systems to which they are tied may cause teachers to increase their effectiveness, as demonstrated in the study of teacher evaluation and compensation practices in Washington, D.C.’s IMPACT system (Dee & Wyckoff, 2015). However, some studies of performance-based incentives suggest that the incentives have no effect when given alone as opposed to when combined with other evaluation reforms such as feedback on teachers’ instructional practices (Yuan et al., 2013). Finally, if highly effective teachers working in the toughest circumstances are differentially rewarded, then this may serve to the goal of equitable distribution of effective teachers and improve retention in the schools most in need of high-quality teachers.
NPS has used the Framework to align teacher compensation to performance. In line with research that has suggested advanced degrees and additional teaching experience (after the first several years) are not meaningful predictors of student performance (Rivkin et al.,), as of the 2012–13 school year, NPS no longer provides teachers with raises solely based on these factors. Rather, under a new “universal salary scale,” teachers earn increments and raises only through effective performance. In addition, NPS offers highly effective teachers annual bonuses for working in a low-performing school and/or teaching a hard-to-staff subject. Incentives are cumulative such that a highly effective teacher who teaches a hard-to-staff subject in a low-performing school would be eligible for multiple incentives in a given year (up to $12,500 in annual bonus compensation in addition to base salary). In addition, teachers rated “partially effective” in the prior year (and who did not receive a raise) but “effective” or “highly effective” in the following year receive a performance improvement stipend accounting for 50 percent of the compensation “step” missed as a result of not obtaining an “effective” rating
5 One part of the theory of action underlying the use of financial incentives to improve educator effectiveness is that the incentives may attract and retain educators who excel at the activities to which incentives have been linked and deter educators who do not excel. This effect has generally been termed a “compositional” effect (Lazear, 2003).
A Teacher Evaluation System
Differentiated Teacher Compensation
Extended Learning Time
School-Based Decision Making

NEWARK PUBLIC SCHOOLS and NEWARK TEACHERS UNION Teacher Contract Evaluation | YEAR 1 REPORT11
previously. Starting in the 2014–15 school year, NPS also offers teachers a one-time bonus for completing a district-approved advanced degree program aligned with district priorities and the Common Core State Standards (see Appendix A for details on the new compensation structure and Table A6 for the universal salary scale).
Extended Learning Time
Increased learning time can be a foundational strategy for persistently
low-performing schools to accelerate student achievement. Successful
extended learning models include more time for students to receive high-
quality academic instruction focused on specific student needs and more time for teachers to plan and collaborate in order to improve instruction and address student learning needs. Research has suggested a positive relationship between teacher collaboration and student achievement (Goddard, Goddard, & Tschannen-Moran, 2007). In addition to providing students with more instruction, teachers can use additional time in an extended schedule to conduct other activities related to student instruction. For example, teachers can use this time to analyze student data and identify which students need specific interventions, determine the focus of interventions, figure out how to group students, and determine what adjustments to instruction and curriculum are necessary. Teachers can use the time to build their expertise in content and instructional strategies through professional learning communities, model lessons, and peer observations.
NPS provides a provision for some schools (called “renew” schools, “turnaround” schools, or “extended learning time” schools)6 to implement an extended schedule in which students learn for at least an hour more per day and teachers work together more in the summer and throughout the school year. This extended schedule provides students with more learning time and teachers with more time to plan and collaborate together. Coupled with the other components included in the teacher contract, extended student learning and teacher collaboration time may serve to provide schools and students most in need of support with the time necessary to put students on a path to college and career readiness. Starting in 2012–13 and through the 2014–15 school year, NPS has designated 28 renew, turnaround, or extended learning time schools.
School-Based Decision Making
Education reform often has called for teacher participation in school-based
decision making as a key component of efforts to restructure and reform
schools (Chubb & Moe, 1990; Smylie, Lazarus, & Brownlee-Conyers, 1996).
Participation is thought to advance communication among teachers and administrators
6 Renew schools are those schools identified for renewal based on a number of factors, including academic performance and enrollment over time, building utilization, and the age and condition of the building. Renew schools have a longer school day, increased professional development time for leaders and teachers, community organizing, and increased social and emotional supports. Similar to renew schools are turnaround or extended learning time schools. Extended learning time schools also have a longer school day and receive a more limited set of supports compared to renew schools. A current list of renew and extended learning time schools is presented in Tables A3 and A4.
A Teacher Evaluation System
Differentiated Teacher Compensation
Extended Learning Time
School-Based Decision Making
A Teacher Evaluation System
Differentiated Teacher Compensation
Extended Learning Time
School-Based Decision Making
American Institutes for Research 12
and improve the quality of educational decision making (Conway, 1984). Moreover,
school-based decision making empowers teachers, along with administrators and others
most familiar with the school, to determine the direction of their schools. Ultimately,
school-based decision making may improve student learning by letting the people
closest to students make educational decisions (National Center for Education
Statistics, 1996).
In line with this research, the teacher contract includes a provision that allows teachers
the opportunity to innovate through increased school-based decision making. Specifically,
the teacher contract includes a provision to allow a school’s teachers to vote to
overturn parts of the collective bargaining agreement they disagree with. This approach
is consistent with evidence that suggests teachers know their schools best and should
be able to pursue innovations. Although this contract component has been in place
since contract ratification, to date, no schools have requested waivers to overturn parts
of the contract.
Significance
Although the NPS/NTU contract did not stem from a Race to the Top grant, it shares
many features, with reforms aimed at improving teacher quality, stemming from earlier
Race to the Top grants. For example, the district has implemented a locally developed
structured teacher observation system as part of the Framework, through which teachers
are observed multiple times a year. The Framework also includes a measure of student
growth that is similar to those measures in widespread use by states and districts.
NPS has adopted an information technology infrastructure—BloomBoard—to support
the collection of data aligned to the Framework. The Framework measures are expected
to guide professional development opportunities, including coaching and workshops.
The evaluation of the NPS/NTU teacher contract provides an opportunity to examine
how these common features have been implemented in the district and to assess their
initial impacts.
This work is particularly important given the widespread adoption of evaluation systems
to measure teaching effectiveness. Advocates argue that, because teachers are the
most important school resource, school systems have to get better at assessing teacher
effectiveness and using this information for personnel decisions. Critics counter that
measures of student achievement that are part of many effectiveness metrics are
statistically complex, based too narrowly on standardized tests, and do not fully account
for factors outside a teacher’s control. The results of AIR’s evaluation of the contract
presented in the subsequent sections of this report provide insight into the challenges
of implementing such reforms and the perceptions of teachers and school leaders
and suggest evidence of early impact. NPS can use these findings to gain a richer
understanding of teacher and school leader perceptions and knowledge related to the
teacher contract and, for example, make adjustments to the ways that contract-related
information is communicated and solicited from teachers.

NEWARK PUBLIC SCHOOLS and NEWARK TEACHERS UNION Teacher Contract Evaluation | YEAR 1 REPORT13
MethodsThis section includes two parts. First, we describe methods for answering questions related to teachers’ and school leaders’ perceptions of the teacher contract. Next, we describe methods to explore the association between teacher retention and differentiated performance levels.
Teachers’ and School Leaders’ Perceptions of the Teacher Contract
As part of the NPS/NTU teacher contract evaluation, the AIR evaluation team administered surveys to teachers and school leaders to obtain their feedback on the districtwide changes that accompanied the NPS/NTU teacher contract, such as the changes in the evaluation system, the new compensation system, extended learning time in some schools, and the school-based decision-making provision.
The AIR team administered two online surveys in spring 2015, one to NPS teachers and the other to school leaders. Teachers and school leaders from all 66 NPS schools participated in the survey.7 Overall, 65 percent of teachers (N = 1,637) and 65 percent of school leaders (N = 143) completed the survey.
The development of the survey items and analyses presented in this report were guided by research questions related to teachers’ and school leaders’ perceptions of how well they understand each of the contract components, in addition to how valid, accurate, useful, and
effective they find each of the components. The specific research questions are listed in the relevant results sections that follow. Survey items closely align to the research questions and are designed to measure the domains and constructs included in the research questions. Table B3 in Appendix B links the research questions to the survey domains and constructs.
The domains in the surveys consist of the four contract components: (1) a teacher evaluation system, (2) differentiated teacher compensation, (3) extended learning time, and (4) school-based decision making. Within each of these domains, we defined the constructs that help us answer each of the research questions. For example, to answer the first research question (To what extent do teachers and school leaders report that the evaluations are of high quality, providing valid and accurate information on teacher performance?), we created two constructs: Perceived Validity and Perceived Accuracy. Perceived Validity helps us to understand the first part of the question (whether teachers and school leaders perceive the evaluations as valid), and Perceived Accuracy helps us to understand the second part of the question (whether teachers and school leaders perceive the evaluations as accurate). The survey results are organized by these domains and constructs embedded in the research questions.
7 Note that four schools are housed within other schools, resulting in 66 functioning schools within 62 school buildings.
65 percent of teachers (N = 1,637) and
65 percent of school leaders (N = 143)
completed the survey
American Institutes for Research 14
In addition to the teacher and school leader survey data, we also used district
administrative data related to schools, teachers, and school leaders to examine
how survey responses differ by various demographic characteristics. For teachers, we
examined how survey responses differ by the following characteristics: years of teaching
experience at NPS, school level, prior year’s evaluation rating, knowledge about a given
contract component, whether the teacher is teaching at a high-poverty school,8 whether
the teacher is teaching at a renew or extended learning time school, whether the teacher
received a bonus, and whether the teacher feels supported by NPS administrators or
parents. For school leaders, we were interested in examining the difference in responses
by the following: position type, years of experience at NPS, school level, knowledge
about a given contract component, and whether the school leader is working at a high-
poverty school.
These characteristics help us answer the research questions by providing evidence as
teacher contract (or component of the contract) than another teacher (or school leader).
For example, it is possible that a larger percentage of teachers who are newer to NPS
will report that the changes to the evaluation system are positive, relative to their more
senior counterparts. It also is possible that teachers’ lack of understanding of the
system could be related to negative views. As such, it is important to examine the
various contract components by educators’ levels of understanding of each component.
The AIR evaluation team conducted descriptive analyses on the survey item responses.
Specifically, we calculated percentages to determine the dominant responses for
each item.
All results use survey weights to adjust for nonresponse. Nonresponse analyses are
conducted to examine whether individuals who completed the survey differ on key
characteristics from those individuals who did not complete the survey. Survey weights
are calculated using the nonresponse analysis results and are used to adjust results to
ensure that they are representative of the population of NPS teachers and school leaders.
In addition, we constructed scales by combining similar survey items. Scales are useful
because they reduce a large number of survey items to a small set of summary
measures that represent specific constructs.9
8 A school was considered a “high-poverty school” if more than 80 percent of enrolled students qualified for free or reduced-price lunch.
9 The scales developed include: perceived validity of the teacher evaluation system, perceived accuracy of the teacher evaluation system, perceived instructional impact of the teacher evaluation system, perceived uses of the teacher evaluation system, knowledge of the teacher evaluation system, perceived fairness of the teacher evaluation system, perceived teacher input, perceived role of peer evaluators, perceived role of School Improvement Panels, knowledge of the differentiated pay system, perceived fairness of potential differentiated pay, perceived fairness of current pay, perceived student learning utility of extended school day, perceived planning and collaboration utility of extended school day, general perceptions of the teacher contract, general attitudes, general perceptions about teachers, and general perceptions about hiring and retention. Table B4 in Appendix B provides the lists of survey items combined to create each scale for each construct for the teacher and school leader surveys.

NEWARK PUBLIC SCHOOLS and NEWARK TEACHERS UNION Teacher Contract Evaluation | YEAR 1 REPORT15
In interpreting the findings, readers should note the population or subpopulation of
respondents who were asked each survey question or set of questions. For example,
although all teachers and school leaders were asked about whether they work at a
school that has extended learning time, only teachers and school leaders who reported
working at an extended learning time school were asked about their experiences related
to working at an extended learning time school. Therefore, some of the descriptive
statistics reported apply to the full population of survey respondents, whereas other
statistics are based on a subset of respondents. When applicable, the respondent
subpopulation is indicated in the table notes immediately following each table.
See Appendix B for additional information about the sample, weighting, scaling, and
analytic processes.
Association Between Teacher Retention and Differentiated Performance Ratings
In the evaluation of the NPS/NTU teacher contract, the evaluation team also examined
the association between teacher retention and differentiated performance ratings.
A key goal for NPS is to retain the most effective teachers to work in the district,
while simultaneously exiting low-performing teachers. This analysis provides descriptive
evidence about the extent to which teachers who received higher Framework ratings are
retained at higher rates than teachers who received lower ratings. If evidence suggests
higher rated teachers are more likely to remain in the district, then it follows that the
average effectiveness of the NPS teacher workforce may increase over time.
The data used to analyze teacher retention include administrative records of NPS
classroom teachers (as opposed to teacher coaches or teachers staffed in administrative
offices) who were evaluated under the new evaluation system. The results presented are
from districtwide and school-level analyses (i.e., retention within the district and within
the same school, respectively).
The data include teachers from the 2012–13 and 2013–14 school years. Retention
is assessed according to whether teachers in place during the 2012–13 school year
continued to work in fall 2013 and whether teachers in place during the 2013–14
school year continued to work in fall 2014. For example, for the districtwide analyses,
a teacher is considered retained if he or she is present in the district, in any position, in
fall of the following year. That is, a 2013–14 retention rate of 80 percent would suggest
that 80 percent of teachers who worked in the 2013–14 school year were employed by
the district in some capacity at the start of the 2014–15 school year.10
10 This convention for estimating retention is consistent with the recent literature (see, for example, Boyd, Lankford, Loeb, & Wyckoff, 2005; Dee & Wykcoff, 2015; Loeb, Kalogrides, & Béteille, 2012), which estimate retention by determining the share of teachers who remain in the district during the school year that follows the initially identified school year.
American Institutes for Research 16
The primary approach used to analyze differences in retention associated with each
Framework rating is a series of linear probability regression models. This approach
yields descriptive information on the average difference in retention rates for teachers
who received a rating of “partially effective,” “effective,” or “highly effective” relative to
those teachers who received a rating of “ineffective.”
Limitations
It is important for readers to keep in mind that results presented herein are those
results produced after the first year of a three-year evaluation of the NPS/NTU teacher
contract. As additional data are collected in future years, subsequent analyses may
confirm or modify the findings presented here, which is to be expected as more
information becomes available. In addition, there are several important limitations
relevant to the survey and retention results presented below.
First, the survey response rates are 65 percent for both the teacher and school leader
surveys. As a result, the survey findings may not represent perceptions of the entire
population of NPS teachers and school leaders (i.e., nonresponse bias, or bias that
occurs when respondents differ in meaningful ways from nonrespondents, may be
present). To address this concern, we adjusted the survey results according to the
differences between the survey respondents and nonrespondents. However, it is not
possible to incorporate unobserved differences, or differences on characteristics that
we were not able to observe, between survey respondents and nonrespondents. For
example, we were able to adjust responses based on respondent characteristics such
as years of experience but not based on unobservable differences such as engagement
to one’s school or to the district. To the extent that such differences exist, the survey
results may contain some remaining nonresponse bias.
A second limitation relevant to the survey results is due to the finite period during which
we measured teacher and school leader perceptions. Results capture respondents’
perceptions at only a single point in time. Future planned survey data collections will
help address this limitation by allowing us to compare perceptions over time.
Third, the retention results are descriptive, as opposed to causal. The results do not
allow for a determination of whether differences in retention for teachers with different
Framework ratings are due to the new evaluation and compensation systems or to other
underlying differences between teachers.

NEWARK PUBLIC SCHOOLS and NEWARK TEACHERS UNION Teacher Contract Evaluation | YEAR 1 REPORT17
FindingsThis section includes two parts. First, we present findings on the perceptions of teacher
and school leader respondents regarding the teacher contract and related initiatives.
Next, we present findings regarding the association between teacher retention and
differentiated performance ratings. Each of the two parts includes subsections in which
we present relevant research questions, followed by the findings.
Teachers’ and School Leaders’ Perceptions of the Teacher Contract
The six subsections that follow present the survey findings organized by the four contract
components: (1) a teacher evaluation system, (2) differentiated teacher compensation,
(3) extended learning time, and (4) school-based decision making. In the sixth subsection,
we report teachers’ and school leaders’ general perceptions and attitudes toward the
current teacher contract and NPS.
Where available, results are presented for both teacher and school leader respondents,
with the former presented on the left panels of tables and the latter presented on the
right panels of the same table. The number of teacher and school leader respondents
included in the results is presented immediately following each table. When results are
not presented in tables, the percentage of responses is presented for specific survey
questions, and the questions are quoted exactly as they appeared in the surveys. When
construct scale scores are reported, the individual questions are not quoted; instead,
the constructs that the questions represent are noted (the individual survey items
combined to create each construct scale may be found in Table B4 in Appendix B).
The main descriptive results are followed by findings from analyses that compared
subgroups of teachers and school leaders to examine the extent to which different
individual and school characteristics, as well as knowledge level, are related to
teachers’ and school leaders’ perceptions.
Perceptions of the Teacher Evaluation System
In this section, we first report on findings related to teachers’ and school leaders’
perceptions of the validity, accuracy, instructional impact, uses, fairness, and
understanding of the new teacher evaluation system; then, we report respondents’
A majority of both teachers and school leaders reported that the evaluation system is valid, accurate, and fair, and that it provides useful and actionable feedback that can inform teachers’ instructional practice; however, a majority of teachers also reported that they are not able to provide feedback on the teacher evaluation system through the current structures in place.
American Institutes for Research 18
perceptions about the structures in place to allow for teacher feedback on the
evaluation system. The specific research questions addressed in this section include
the following:
1. To what extent do teachers and school leaders report that the evaluations are
of high quality, providing valid and accurate information on teacher performance?
2. To what extent do teachers and school leaders report that the content of the
Framework (including the focus on the Common Core State Standards and student
actions) is associated with improvements in teachers’ instructional practice?
3. To what extent do teachers and school leaders report that the evaluations
provide teachers with useful feedback that can inform their practice?
4. To what extent do teachers and school leaders report that teachers have
a clear understanding of the evaluation process?
5. To what extent do teachers and school leaders report that teachers think the
evaluation process is fair and transparent?
6. To what extent do teachers report that the current structures in place that
allow for teacher feedback on the evaluation system are useful?
7. What are teachers’ and school leaders’ perceptions about the role and impact
of peer validators (PVs), the Peer Oversight Committee (POC), and the School
Improvement Panels (SIPs)?
Perceptions About the Validity and Utility of the Evaluation System. Table 3 presents
the results of teachers’ and school leaders’ perceptions of the validity of the evaluation
system components. A majority of teachers reported that the evaluation components
(individually and as a whole) are valid to a moderate or large extent, and nearly all
school leaders indicated that the components are valid. The component for which both
teachers and school leaders reported the lowest level of perceived validity is student
growth percentiles (63 percent and 85 percent, respectively). And the component for
which both teachers and school leaders reported the highest level of perceived validity
is observations of teaching (88 percent and 99 percent, respectively).
When asked a series of questions related to the construct about how these components
are used to evaluate teachers, 53 percent of teachers indicated agree somewhat or agree
strongly to items that suggest the evaluations provide valid information on teacher
performance (not shown in table). This construct includes items such as, “The ways
that student test scores are used to evaluate my performance appropriately adjust for
student factors not under my control” (see Table B4 for a list of items combined to
create this construct scale score). This finding suggests that, although most teachers
believe the components themselves are valid measures, there are teachers who do not
always feel that the way in which those measures are used to evaluate them is valid.

NEWARK PUBLIC SCHOOLS and NEWARK TEACHERS UNION Teacher Contract Evaluation | YEAR 1 REPORT19
Table 3. Percentage of Teachers and School Leaders Who Reported to What Extent They Believe the Evaluation Components to Be Valid
Component
Percentage of Teachers
Percentage of School Leaders
None to Small Extent
Moderate to Large Extent
None to Small Extent
Moderate to Large Extent
Observations of [your] teaching 12 88 1 99
Student growth objectives 24 72 8 90
Student growth percentiles 30 63 11 85
Artifacts (e.g., unit or lesson plans)
21 78 6 94
Teacher attendance 16 82 3 97
All components combined 28 72 3 97
Notes. Teachers, n = 1,637; school leaders, n = 143. Some percentages do not add up to 100 because the response option not applicable was provided on the surveys, but it is not reported here.
In addition, 71 percent of teachers and 98 percent of school leaders agreed that the evaluations provide an accurate measure of teacher performance. Eighty-six percent of teachers also responded moderately accurate or very accurate (46 percent and 40 percent, respectively) to the following statement, “As a summary of your performance as a teacher last year, how accurate do you think the final summative evaluation rating was?”
Similarly, as Table 4 shows, the majority of teachers and school leaders reported that the evaluation competencies (i.e., the content of the Framework) effectively measure
good teaching to a moderate or large extent.
Table 4. Percentage of Teachers and School Leaders Who Reported to What Extent They Believe the Current Evaluation Competencies Effectively Measure Good Teaching
Competency
Percentage of Teachers
Percentage of School Leaders
None to Small Extent
Moderate to Large Extent
None to Small Extent
Moderate to Large Extent
Competency 1: Lesson Design and Focus
17 83 3 97
Competency 2: Rigor and Inclusiveness
19 81 1 99
Competency 3: Culture of Achievement
17 83 3 97
Competency 4: Student Progress Toward Mastery
19 81 1 99
Competency 5: Commitment to Personal and Collective Excellence
19 81 4 96
Notes. Teachers, n = 1,637; school leaders, n = 143.

American Institutes for Research 20
In response to a set of questions about the changes that have occurred in teachers’
instructional practice, 78 percent of teachers and 96 percent of school leaders
indicated that the current evaluation system provides useful feedback and has led
teachers to change the way they teach. This may be, in part, due to the support
provided. Of the teachers who indicated that they received a full evaluation for the
2013–14 school year (n = 1,445), 44 percent of the teachers indicated that support
(e.g., coaching and professional development) was made available to them to address
the needs identified by last year’s evaluation results. Of the teachers who indicated that
support was made available to them (n = 649), 79 percent responded moderate extent
or large extent to the following statement, “To what extent has this support helped you
address the identified needs?”
Teachers and school leaders also were asked about the ways in which the teacher
evaluation results are used. Seventy-five percent of teachers and 97 percent of school
leaders indicated that the results will be used to a moderate or large extent for the
purposes noted in the teacher contract (e.g., to provide teachers with feedback that
they can use to improve their instruction, to identify and recognize effective teachers,
and to identify salary increases and bonuses), suggesting that the majority of teachers
and school leaders are aware of how the results are used. Eighty-seven percent of
school leaders also responded moderate amount or large amount to the following
statement: “How much weight do you give to the evaluation results in deciding (or
recommending) whether to hire a teacher coming from another NPS school?”
In response to a set of questions about their knowledge of the current evaluation
process, 83 percent of teachers and 99 percent of school leaders reported that they
have a clear understanding of the evaluation process. In addition, in response to a set
of questions about the fairness of the evaluation process, 72 percent of teachers and
92 percent of school leaders reported that the evaluation process is fair, which is larger
than the 30 percent reported fairness by teachers in an evaluation of 25 districts in
New Jersey (Firestone, Nordin, Shcherbakov, Kirova, & Blitz, 2014) and the 39 percent
reported fairness by teachers in 10 districts in Arizona (Ruffini, Makkonen, Tejwani, &
Diaz, 2014).
Thus, teachers and school leaders generally reported that the new evaluation system is
valid, accurate, and fair and that the results provide useful and actionable feedback that
can inform teachers’ instructional practice. These findings are similar to those of Jiang
and Sporte (2014) who found that 62 percent of the 19,000 teachers surveyed about
their perceptions of Chicago Public Schools’ Recognizing Educators Advancing Chicago
Students evaluation system were satisfied with the evaluation process. Also similar to
Jiang and Sporte (2014), the results indicate that new teachers (those individuals
teaching at NPS for three or fewer years) were more likely to perceive the evaluation
system positively than teachers who have been at NPS longer (the subgroup analyses
are reported below).

NEWARK PUBLIC SCHOOLS and NEWARK TEACHERS UNION Teacher Contract Evaluation | YEAR 1 REPORT21
The following teacher respondent subgroups were more likely to have reported feeling
that the evaluation system is valid, accurate, and fair and has an impact on teachers’
instructional practice: teachers who worked at NPS for three years or fewer, teachers
who worked at K–8 schools, teachers who obtained a rating of “effective” or above in
the 2013–14 school year, teachers who reported feeling supported by NPS administrators
or parents, and teachers who felt substantially knowledgeable about the new evaluation
system. Teachers who worked at extended learning time schools were more likely to
report that the evaluation system had a strong instructional impact, and teachers who
received a bonus in the 2013–14 school year were more likely to report that the new
evaluation system was accurate. School leaders generally felt more positively about
the evaluation system when they had a better understanding of it.
Perceptions About the Policies in Place to Allow for Teacher Feedback on the
Evaluation System. Teachers were asked about the ways in which they may provide
feedback on the evaluation system. When asked to respond to the following statement,
“Teachers in NPS have the opportunity to provide feedback about the current teacher
evaluation system,” 23 percent of teachers indicated agree somewhat or agree strongly.
However, the responses differed for several subgroups. A larger percentage of the
following teacher respondent groups reported that they are able to provide feedback on
the evaluation system: teachers who worked at NPS for three years or fewer (31 percent),
teachers who worked at K–8 schools (30 percent), teachers who worked at renew schools
(33 percent), teachers who worked at extended learning time schools (32 percent),
teachers who felt substantially knowledgeable about the evaluation system (30 percent),
and teachers who reported feeling supported by NPS administrators (44 percent) or
parents (38 percent).
Of the 556 teachers (33 percent) and 105 school leaders (78 percent) who reported
that they are aware of or have had interaction with School Improvement Panels,
51 percent of the teachers and 84 percent of the school leaders reported that
teachers can use School Improvement Panels to provide feedback on the current
approach to teacher evaluation.
In addition to asking teachers and school leaders about policies that allow for feedback
about the evaluation system, peer validation provides a way for teachers to have some
agency over their evaluations and request a second review, particularly if they are at risk
of being rated “ineffective.” Eighteen percent of teachers reported that they received a
peer validation at some point in the last three years (n = 298), and 94 percent of school
leaders reported that teachers at their school received a peer validation at some point
in the last three years (n = 132). Of the teachers who received a peer validation,
64 percent indicated that their peer validator was useful. Moreover, of the 298 teachers
and 132 school leaders who reported interacting with peer validators in the last three
years, 67 percent of teachers and 73 percent of school leaders responded agree
somewhat or agree strongly to the following statement, “The peer validator provided
American Institutes for Research 22
[me/the teacher(s)] with clear, actionable feedback on [my/their] instructional practice.”
Sixty-six percent of teachers and 77 percent of school leaders responded agree somewhat
or agree strongly to the following statements (respectively), “The peer validator provided
a fair assessment of my teaching effectiveness” and “The peer validator provided the
teacher(s) with a fair assessment of their teaching effectiveness.”
Overall, although most teachers reported that they did not have the opportunity to provide
feedback on the new teacher evaluation system, the extent to which teachers felt this way
depended on several factors. Specifically, those teachers who felt more knowledgeable
about the system, those teachers who felt supported by NPS administrators or
parents, and those teachers who have had some interaction with the peer validation
process and School Improvement Panels were more likely to report positive feelings
about having the resources and ability to provide feedback on the evaluation system.
Perceptions of Differentiated Compensation
In this section, we focus on teachers’ and school leaders’ understanding, perceived
fairness, and impact of the new differentiated compensation system. The primary
research question we address is as follows:
1. To what extent do teachers and school leaders report that differentiated pay
is associated with teacher retention, effectiveness, and morale?
In response to the question, “On which of the following scales are you currently paid,”
44 percent of teachers (n = 682) indicated that they are paid on the traditional scale,
under which teachers receive raises based on performance, advanced degrees, and
teaching experience; 37 percent of teachers (n = 604) indicated that they are paid
on the new universal scale, under which teachers receive raises based on their
performance evaluations as well as have the opportunity to receive bonuses; and
19 percent of teachers (n = 336) indicated that they do not know the scale on which
they are currently paid. Note that, although 37 percent of teachers reported being
paid on the universal salary scale on the teacher survey, district administrative records
indicate that 66 percent of teachers at NPS were paid on the universal scale. This
discrepancy, along with the 19 percent of teachers who indicated they do not know the
scale on which they are paid, suggests that some teachers are unaware that they are
paid under the new salary system. Of the teachers who reported being paid on the
new universal salary scale, 57 percent reported having substantial understanding
of the financial bonuses available as part of the universal scale.
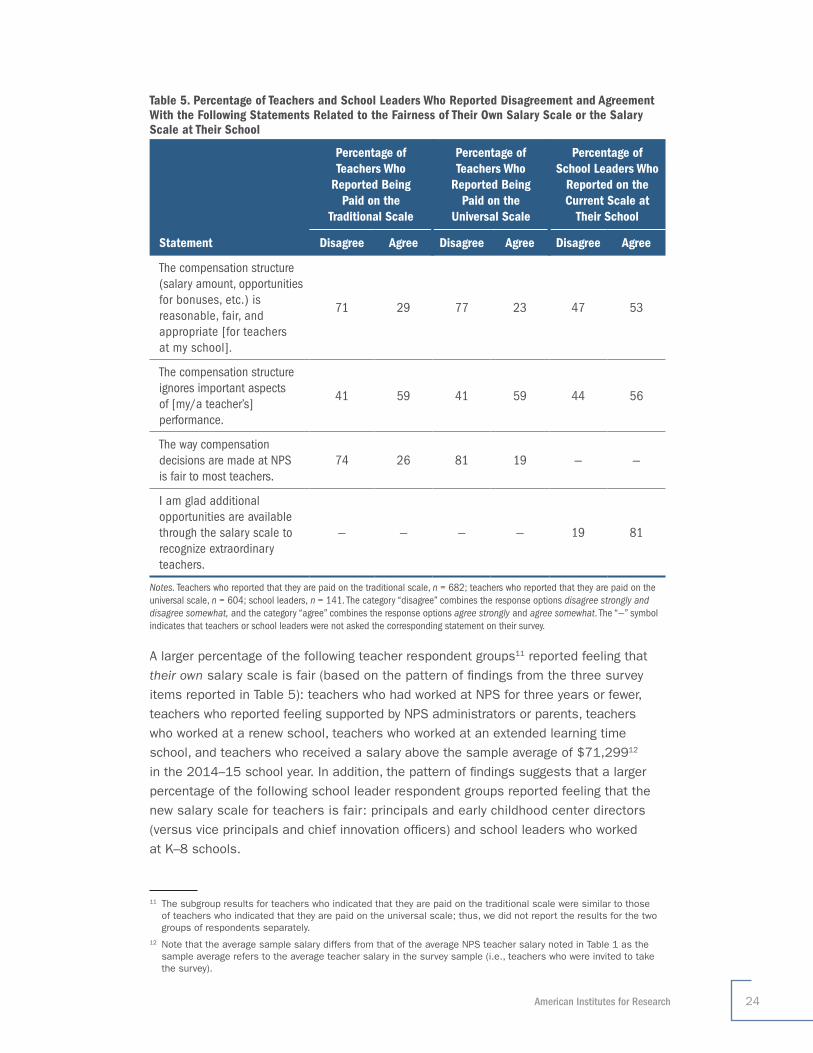
Teachers and school leaders reported mixed support for the current compensation system.
NEWARK PUBLIC SCHOOLS and NEWARK TEACHERS UNION Teacher Contract Evaluation | YEAR 1 REPORT23
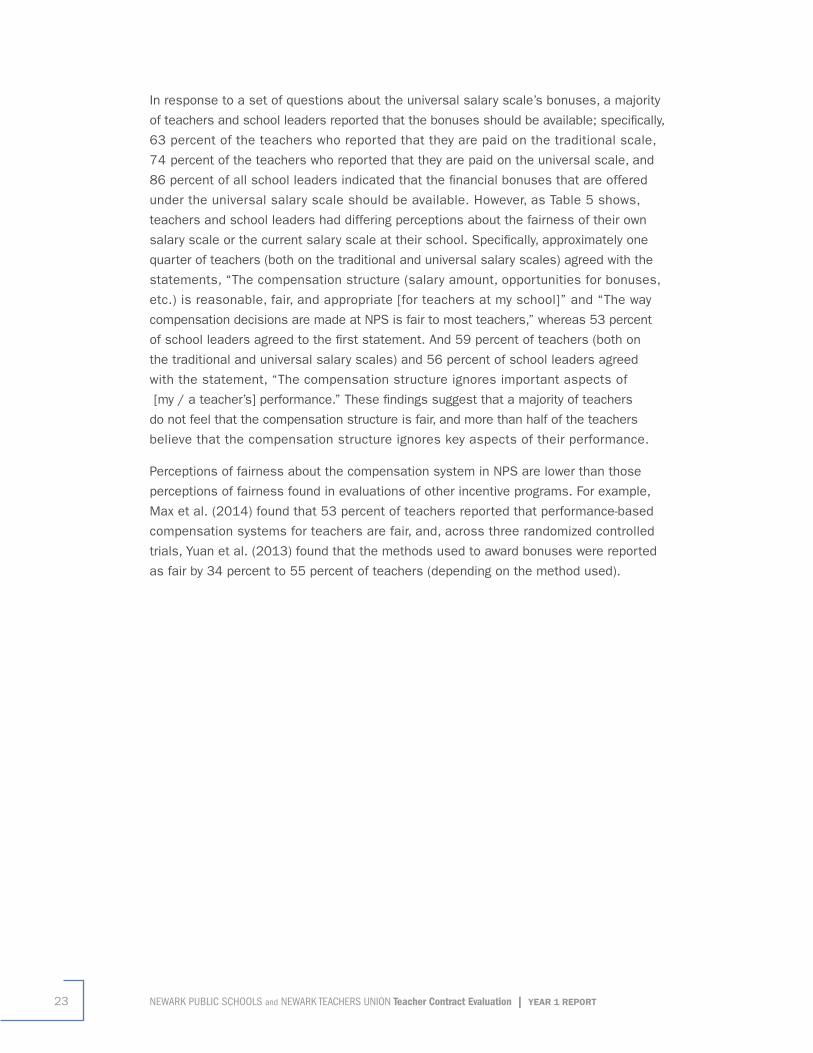
In response to a set of questions about the universal salary scale’s bonuses, a majority
of teachers and school leaders reported that the bonuses should be available; specifically,
63 percent of the teachers who reported that they are paid on the traditional scale,
74 percent of the teachers who reported that they are paid on the universal scale, and
86 percent of all school leaders indicated that the financial bonuses that are offered
under the universal salary scale should be available. However, as Table 5 shows,
teachers and school leaders had differing perceptions about the fairness of their own
salary scale or the current salary scale at their school. Specifically, approximately one
quarter of teachers (both on the traditional and universal salary scales) agreed with the
statements, “The compensation structure (salary amount, opportunities for bonuses,
etc.) is reasonable, fair, and appropriate [for teachers at my school]” and “The way
compensation decisions are made at NPS is fair to most teachers,” whereas 53 percent
of school leaders agreed to the first statement. And 59 percent of teachers (both on
the traditional and universal salary scales) and 56 percent of school leaders agreed
with the statement, “The compensation structure ignores important aspects of
[my / a teacher’s] performance.” These findings suggest that a majority of teachers
do not feel that the compensation structure is fair, and more than half of the teachers
believe that the compensation structure ignores key aspects of their performance.
Perceptions of fairness about the compensation system in NPS are lower than those
perceptions of fairness found in evaluations of other incentive programs. For example,
Max et al. (2014) found that 53 percent of teachers reported that performance-based
compensation systems for teachers are fair, and, across three randomized controlled
trials, Yuan et al. (2013) found that the methods used to award bonuses were reported
as fair by 34 percent to 55 percent of teachers (depending on the method used).
American Institutes for Research 24
Table 5. Percentage of Teachers and School Leaders Who Reported Disagreement and Agreement With the Following Statements Related to the Fairness of Their Own Salary Scale or the Salary Scale at Their School
Statement
Percentage of Teachers Who
Reported Being Paid on the
Traditional Scale
Percentage of Teachers Who
Reported Being Paid on the
Universal Scale
Percentage of School Leaders Who
Reported on the Current Scale at
Their School
Disagree Agree Disagree Agree Disagree Agree
The compensation structure (salary amount, opportunities for bonuses, etc.) is reasonable, fair, and appropriate [for teachers at my school].
71 29 77 23 47 53
The compensation structure ignores important aspects of [my/a teacher’s] performance.
41 59 41 59 44 56
The way compensation decisions are made at NPS is fair to most teachers.
74 26 81 19 — —
I am glad additional opportunities are available through the salary scale to recognize extraordinary teachers.
— — — — 19 81
Notes. Teachers who reported that they are paid on the traditional scale, n = 682; teachers who reported that they are paid on the universal scale, n = 604; school leaders, n = 141. The category “disagree” combines the response options disagree strongly and disagree somewhat, and the category “agree” combines the response options agree strongly and agree somewhat. The “—” symbol indicates that teachers or school leaders were not asked the corresponding statement on their survey.
A larger percentage of the following teacher respondent groups11 reported feeling that their own salary scale is fair (based on the pattern of findings from the three survey items reported in Table 5): teachers who had worked at NPS for three years or fewer, teachers who reported feeling supported by NPS administrators or parents, teachers who worked at a renew school, teachers who worked at an extended learning time school, and teachers who received a salary above the sample average of $71,29912 in the 2014–15 school year. In addition, the pattern of findings suggests that a larger percentage of the following school leader respondent groups reported feeling that the new salary scale for teachers is fair: principals and early childhood center directors (versus vice principals and chief innovation officers) and school leaders who worked at K–8 schools.
11 The subgroup results for teachers who indicated that they are paid on the traditional scale were similar to those of teachers who indicated that they are paid on the universal scale; thus, we did not report the results for the two groups of respondents separately.
12 Note that the average sample salary differs from that of the average NPS teacher salary noted in Table 1 as the sample average refers to the average teacher salary in the survey sample (i.e., teachers who were invited to take the survey).
NEWARK PUBLIC SCHOOLS and NEWARK TEACHERS UNION Teacher Contract Evaluation | YEAR 1 REPORT25
Table 6 shows that teachers on the traditional and universal salary scales reported
similar perceptions of their own current salary scales. In addition, approximately three
quarters of teachers (both on the traditional and universal salary scales) disagreed that
their salary scale influenced their decision to stay at their school or in NPS. School
leaders’ perceptions of the current salary scale at their school were more positive
than teachers’ perceptions, although a majority of school leaders disagreed with the
statements, “The compensation structure has increased teacher morale at my school”
and “The compensation structure motivates teachers at my school to improve their
teaching.” These findings are similar to those of Max et al. (2014), who found that
27 percent of teachers agreed that their job satisfaction increased due to the Teacher
Incentive Fund incentives, and Yuan et al. (2013), who found that just 19 percent to
42 percent of teachers indicated feeling “energized” to improve their teaching based
on a bonus award (depending on which bonus was used).
Table 6. Percentage of Teachers and School Leaders Who Reported Disagreement and Agreement With the Following Statements Related to the Impact of Their Own Salary Scale or the Current Salary Scale at Their School
Statement
Percentage of Teachers Who
Reported Being Paid on the
Traditional Scale
Percentage of Teachers Who
Reported Being Paid on the
Universal Scale
Percentage of School Leaders Who
Reported on the Current Scale at Their School
Disagree Agree Disagree Agree Disagree Agree
Rewarding teachers based on individual performance hurts teacher collaboration.
42 58 45 55 69 31
The compensation structure has increased teacher morale at my school.
85 15 88 12 80 20
The salary scale has influenced my decision to stay in this school.
77 23 78 22 — —
The salary scale has influenced my decision to stay at NPS.
72 28 76 24 — —
The compensation structure motivates teaches at my school to improve their teaching.
— — — — 62 38
Notes. Teachers who reported that they are paid on the traditional scale, n = 682; teachers who reported that they are paid on the universal scale, n = 604; school leaders, n = 141. The category “disagree” combines the response options disagree strongly and disagree somewhat, and the category “agree” combines the response options agree strongly and agree somewhat. The “—” symbol indicates that teachers or school leaders were not asked the corresponding statement on their survey.
American Institutes for Research 26
Overall, teachers (on both the traditional and universal salary scales) and school leaders
reported mixed support for the compensation system at NPS. Certain subgroups were
more likely to report positive feelings about their own salary scale (e.g., teachers new
to NPS).
Perceptions of Extended Learning Time
In this section, we focus on teachers’ and school leaders’ perceptions of the uses and
utility of the additional time spent on student learning, as well as teacher planning and
collaboration at schools designated to have extended learning time. Thus, we restrict
the results to the subset of teachers and school leaders who indicated that they work at
a school that has extended learning time (787 teachers from 53 schools and 71 school
leaders from 38 schools).13 The research questions we address include the following:
1. To what extent do teachers and school leaders report that there is more time
for student instruction and teacher collaboration and planning in the district’s
extended learning time schools? How is this time being used?
2. To what extent do teachers and school leaders report that extended teacher
planning and collaboration is associated with increased trust, improved morale,
and teaching effectiveness?
Of the teachers and school leaders who reported that they work at extended learning
time schools, 83 percent of teachers (n = 651) and 91 percent of school leaders
(n = 64) indicated that time for student instruction was added. Of these respondents,
40 percent of teachers and 38 percent of school leaders indicated that four or more
hours have been added per week. As Table 7 shows, a number of teachers and school
leaders indicated that this time was more commonly spent on additional instructional
time in core subjects or spread evenly across all classes.
13 On the teacher survey, 49 percent of teachers reported that they worked at an extended learning time school; however, according to administrative data, 43 percent of survey respondents worked at extended learning time schools in the 2014–15 school year. Moreover, there is a discrepancy in the number of schools at which teachers and school leaders report having extended learning time. There were 11 schools for which a teacher indicated that the school had extended learning time but for which the school leader reported that the school did not have extended learning time. Possible reasons for these discrepancies could include teachers who moved midyear or were not aware of their school’s extended learning time status.
Teachers and school leaders who work in extended learning time schools generally reported that the extended learning time for student instruction and teacher planning and collaboration is useful.

NEWARK PUBLIC SCHOOLS and NEWARK TEACHERS UNION Teacher Contract Evaluation | YEAR 1 REPORT27
Table 7. Percentage of Teachers and School Leaders Who Reported That the Following Student Instructional Times Were Added as a Result of Extended Learning Time
Instructional TimePercentage of
TeachersPercentage of
School Leaders
Additional instructional time in core subjects 58 54
Additional instructional time in noncore subjects 21 18
Additional study time for students 17 18
More instructional time added evenly to all classes 45 40
Other 7 13
Notes. Teachers, n = 651; school leaders, n = 64. The subpopulation of respondents who reported that time for student instruction was added to their extended learning time. Percentages may add up to more than 100 because respondents could check multiple response options.
Of the teachers and school leaders who reported that time for student instruction has
been added, 66 percent of the teachers and 68 percent of the school leaders perceived
the additional time as useful. A larger percentage of the following teacher respondent
groups reported this perception: teachers who had worked at NPS for at least four years
(68 percent) and teachers who reported feeling supported by NPS administrators
(80 percent) or parents (77 percent).
Fifty-one percent of teachers (n = 402) and 69 percent of school leaders (n = 50)
indicated that time for teacher planning and collaboration was added as a result of
the extended learning time at their school. Of these respondents, 81 percent of teachers
indicated that they participated in activities during the extended learning time (n = 324).
Of the teachers and school leaders who indicated that the time for teacher planning and
collaboration was added, 55 percent of teachers and 52 percent of school leaders
indicated that two or more hours were added per week. In addition, 67 percent of
teachers and 73 percent of school leaders indicated that at least two weeks were
added to the summer or retreat time.
Table 8 presents the activities that occurred during the extra time for teacher planning
and collaboration. Most teachers and school leaders reported that the time was used
for staff professional development, lesson planning and unit design, analysis and
interpretation of student achievement data, and team building; a minority of teachers
and school leaders indicated the time was used for activities such as grading and
administrative tasks. This finding is similar to Checkoway et al. (2012), who found that
most of the teacher collaborative time during expanded learning time in Massachusetts
was spent on analyzing assessment data for students in their classes, strategizing
about effective instructional practices and/or assessments, and reviewing student
work for students they teach.
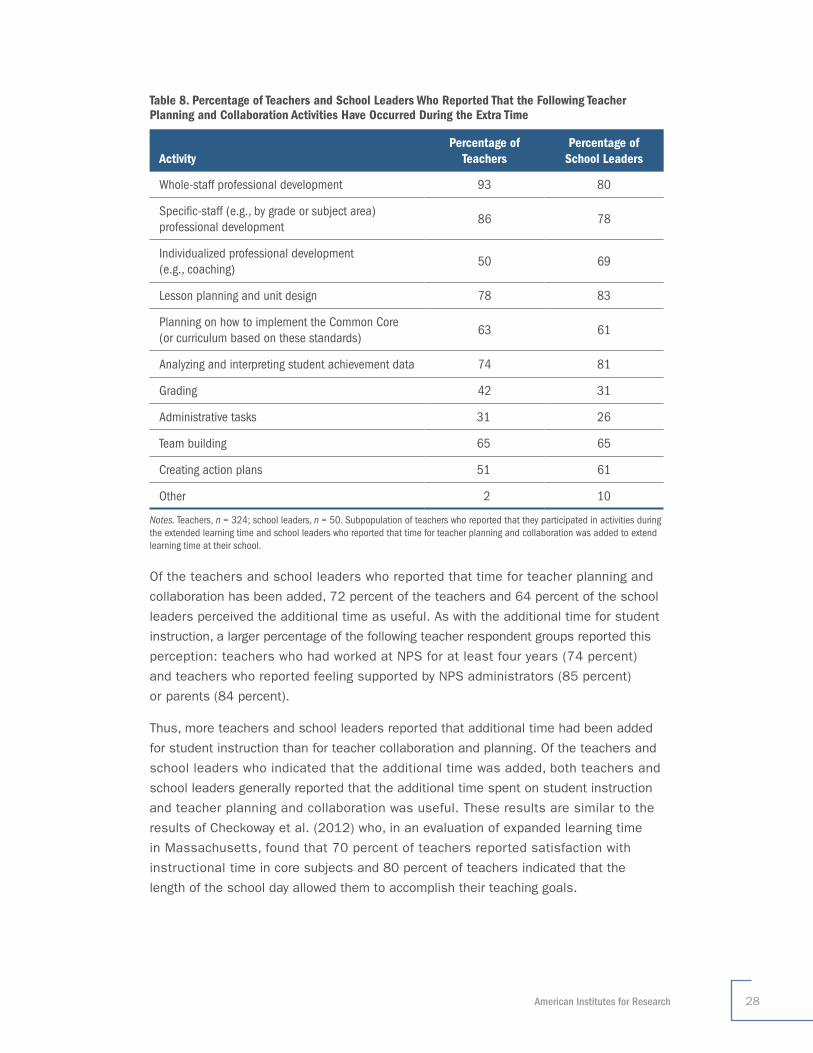
American Institutes for Research 28
Table 8. Percentage of Teachers and School Leaders Who Reported That the Following Teacher Planning and Collaboration Activities Have Occurred During the Extra Time
ActivityPercentage of
TeachersPercentage of
School Leaders
Whole-staff professional development 93 80
Specific-staff (e.g., by grade or subject area) professional development
86 78
Individualized professional development (e.g., coaching)
50 69
Lesson planning and unit design 78 83
Planning on how to implement the Common Core (or curriculum based on these standards)
63 61
Analyzing and interpreting student achievement data 74 81
Grading 42 31
Administrative tasks 31 26
Team building 65 65
Creating action plans 51 61
Other 2 10
Notes. Teachers, n = 324; school leaders, n = 50. Subpopulation of teachers who reported that they participated in activities during the extended learning time and school leaders who reported that time for teacher planning and collaboration was added to extend learning time at their school.
Of the teachers and school leaders who reported that time for teacher planning and
collaboration has been added, 72 percent of the teachers and 64 percent of the school
leaders perceived the additional time as useful. As with the additional time for student
instruction, a larger percentage of the following teacher respondent groups reported this
perception: teachers who had worked at NPS for at least four years (74 percent)
and teachers who reported feeling supported by NPS administrators (85 percent)
or parents (84 percent).
Thus, more teachers and school leaders reported that additional time had been added
for student instruction than for teacher collaboration and planning. Of the teachers and
school leaders who indicated that the additional time was added, both teachers and
school leaders generally reported that the additional time spent on student instruction
and teacher planning and collaboration was useful. These results are similar to the
results of Checkoway et al. (2012) who, in an evaluation of expanded learning time
in Massachusetts, found that 70 percent of teachers reported satisfaction with
instructional time in core subjects and 80 percent of teachers indicated that the
length of the school day allowed them to accomplish their teaching goals.
NEWARK PUBLIC SCHOOLS and NEWARK TEACHERS UNION Teacher Contract Evaluation | YEAR 1 REPORT29
Perceptions of the School-Based Decision-Making Provision
In this section, we focus on teachers’ and school leaders’ understanding and perceived
utility of the school-based decision-making (“flexibility”) provision, an agreement that
allows for schools to make site-based decisions and seek waivers from the collective
bargaining agreement. The primary research question we address is as follows:
1. To what extent do teachers and school leaders report that schools and teachers have increased flexibility to implement innovative approaches to instruction? If so, how are schools and teachers using this flexibility? If not, then what might explain the absence of waiver requests?
Forty-one percent of teachers and 58 percent of school leaders agreed (somewhat or strongly) to the statement, “I understand how staff can trigger a vote to waive certain provisions of the current teacher contract.” Lower percentages of teachers and school leaders agreed to the statement, “Beyond the staff at my school, I am aware of the individuals who must approve the waiver” (30 percent and 49 percent, respectively). Teachers and school leaders who had worked at NPS for at least four years were more likely to report that they understand how staff can trigger a vote (43 percent and 61 percent, respectively). They were also more likely to report that they are aware of the individuals who must approve the waiver (32 percent of teachers and 50 percent of school leaders).
Fifty-five percent of teachers and 45 percent of school leaders agreed (somewhat or strongly) to the statement, “There are parts of the current teacher contract that I would like to waive by utilizing the flexibility provision,” and 30 percent of teachers and 51 percent of school leaders agreed to the statement, “[The teachers at my school do/My school does] not need to formally waive parts of the current teacher contract.”
General Perceptions and Attitudes
In this section, we first report teachers’ and school leaders’ general perceptions about the current teacher contract; then, we report respondents’ general attitudes toward schools, teachers, and NPS.
Both teachers and school leaders indicated a mixed understanding related to the school-based decision-making provision in the teacher contract.
Although teachers and school leaders reported mixed perceptions about the components of the teacher contract, both teachers and school leaders indicated positive feelings about their principals, administrators, and teachers at their school.
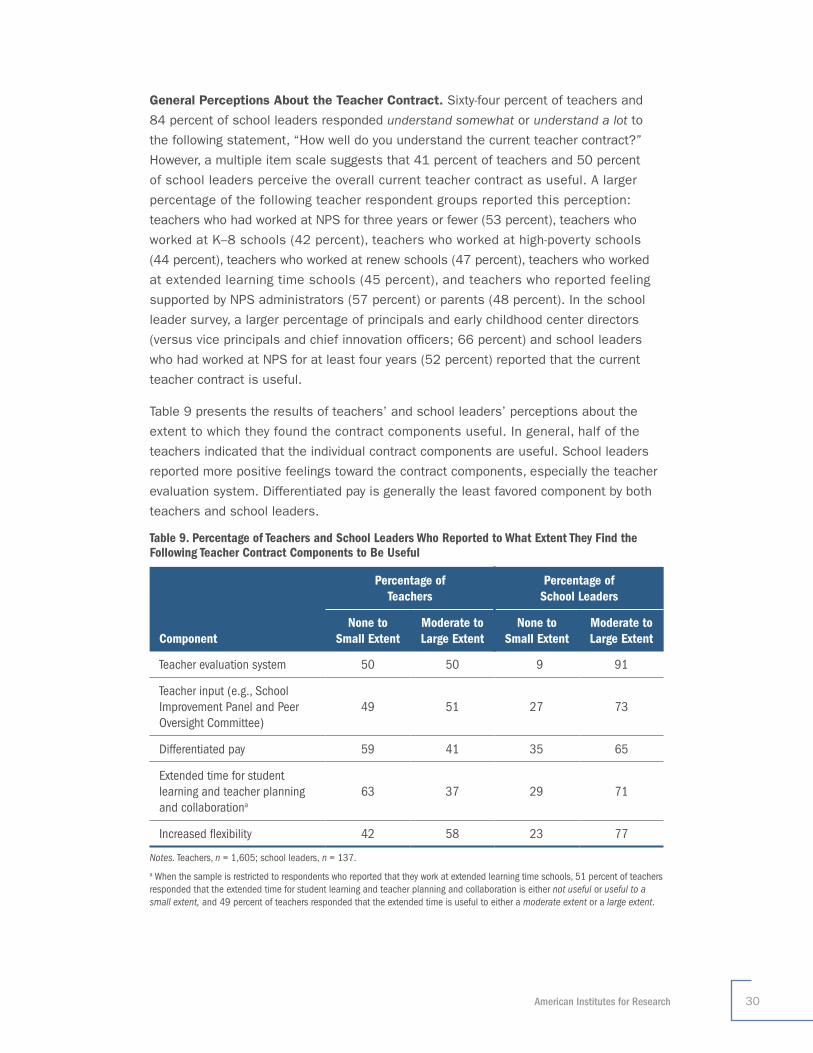
American Institutes for Research 30
General Perceptions About the Teacher Contract. Sixty-four percent of teachers and
84 percent of school leaders responded understand somewhat or understand a lot to
the following statement, “How well do you understand the current teacher contract?”
However, a multiple item scale suggests that 41 percent of teachers and 50 percent
of school leaders perceive the overall current teacher contract as useful. A larger
percentage of the following teacher respondent groups reported this perception:
teachers who had worked at NPS for three years or fewer (53 percent), teachers who
worked at K–8 schools (42 percent), teachers who worked at high-poverty schools
(44 percent), teachers who worked at renew schools (47 percent), teachers who worked
at extended learning time schools (45 percent), and teachers who reported feeling
supported by NPS administrators (57 percent) or parents (48 percent). In the school
leader survey, a larger percentage of principals and early childhood center directors
(versus vice principals and chief innovation officers; 66 percent) and school leaders
who had worked at NPS for at least four years (52 percent) reported that the current
teacher contract is useful.
Table 9 presents the results of teachers’ and school leaders’ perceptions about the
extent to which they found the contract components useful. In general, half of the
teachers indicated that the individual contract components are useful. School leaders
reported more positive feelings toward the contract components, especially the teacher
evaluation system. Differentiated pay is generally the least favored component by both
teachers and school leaders.
Table 9. Percentage of Teachers and School Leaders Who Reported to What Extent They Find the Following Teacher Contract Components to Be Useful
Component
Percentage of Teachers
Percentage of School Leaders
None to Small Extent
Moderate to Large Extent
None to Small Extent
Moderate to Large Extent
Teacher evaluation system 50 50 9 91
Teacher input (e.g., School Improvement Panel and Peer Oversight Committee)
49 51 27 73
Differentiated pay 59 41 35 65
Extended time for student learning and teacher planning and collaborationa
63 37 29 71
Increased flexibility 42 58 23 77
Notes. Teachers, n = 1,605; school leaders, n = 137.
a When the sample is restricted to respondents who reported that they work at extended learning time schools, 51 percent of teachers responded that the extended time for student learning and teacher planning and collaboration is either not useful or useful to a small extent, and 49 percent of teachers responded that the extended time is useful to either a moderate extent or a large extent.
NEWARK PUBLIC SCHOOLS and NEWARK TEACHERS UNION Teacher Contract Evaluation | YEAR 1 REPORT31
Consistent with subgroup analyses reported previously, teachers who had worked at NPS for three years or fewer and teachers who reported feeling supported by NPS administrators or parents were more likely to report that the individual teacher contract components are useful. For school leaders, the opposite appears to be true—school leaders who had worked at NPS for three years or fewer were less likely to report that the individual teacher contract components are useful, suggesting that more senior school leaders and newer teachers feel more positive about the teacher contract components.
General Attitudes Toward Schools, Teachers, and NPS. When asked to rate the following statement, “Overall, I’m satisfied with the quality of the teaching staff as a whole in my school this year,” 80 percent of school leaders responded agree somewhat or agree strongly. Similarly, a multiple item scale indicates that 95 percent of school leaders believed that more than half of the teachers are competent and helpful to their students. Moreover, scale results indicate that 82 percent of school leaders had positive feelings about the hiring process and retention of teachers at their school.
Teachers also generally reported positive feelings toward other teachers at their school. For instance, 86 percent of teachers responded about half, most, or all or nearly all to the following statement, “How many teachers make exceptional progress with their students each year?” Accordingly, 12 percent of teachers responded about half, most, or all or nearly all to the following statement, “How many teachers at your school hold their students back from achieving their academic potential?”
Although teachers raised concerns about how things are run in the district, results on the attitudes scale indicate that, overall, 74 percent of teachers and 94 percent of school leaders have positive attitudes toward the principals, administrators, and teachers at their school. This finding suggests that, although teachers and school leaders may have reported concerns (or negative feelings) about particular components of the contract and the way things are run in NPS, both teachers and school leaders reported feeling positive about the colleagues with whom they work.
Differentiated Teacher Retention
In this section, we present findings on the extent to which the NPS/NTU teacher
contract and related initiatives are related to teacher retention.14 Specifically, we
present the retention rates in 2012–13 and 2013–14 for teachers who received
different final evaluation ratings under the Framework. We focus the discussion
on the results associated with the 2013–14 school year given the consistency
in the findings across years.
14 Ideally, we would like to link survey data to retention data to examine the relationship between educator perceptions and retention. Although we cannot do this in the first year of the evaluation, we plan to link survey data to retention data for the next two years of the evaluation.
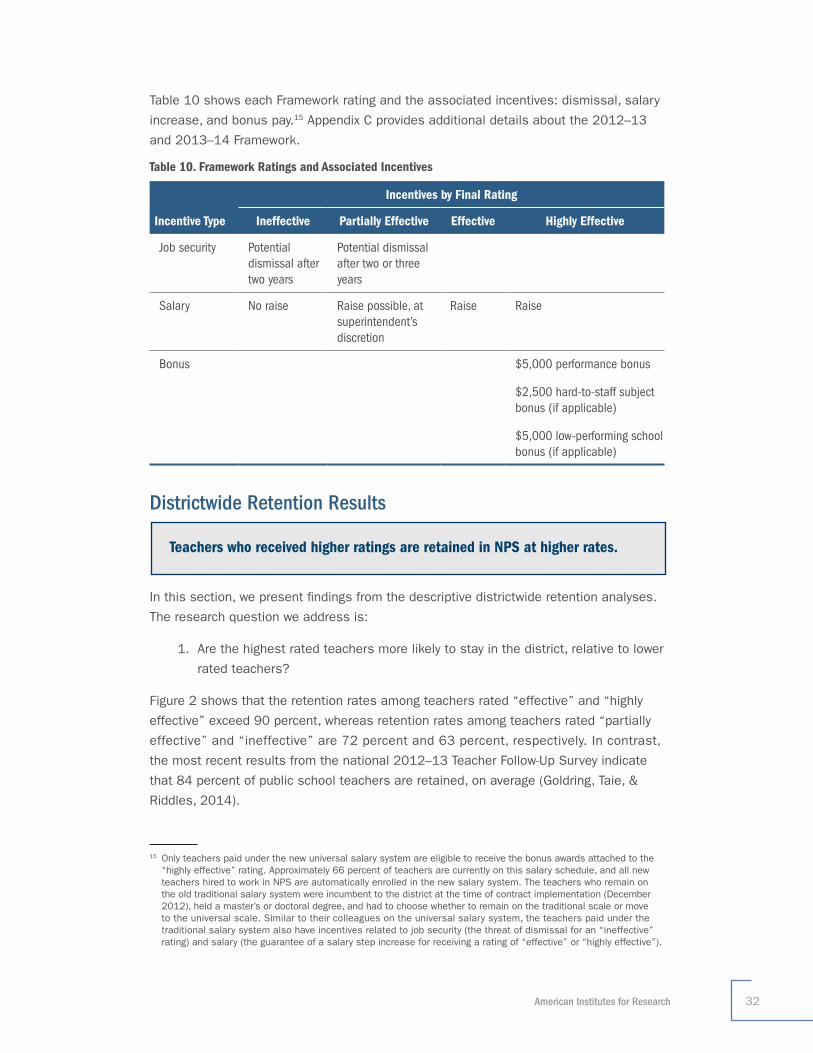
American Institutes for Research 32
Table 10 shows each Framework rating and the associated incentives: dismissal, salary
increase, and bonus pay.15 Appendix C provides additional details about the 2012–13
and 2013–14 Framework.
Table 10. Framework Ratings and Associated Incentives
Incentives by Final Rating
Incentive Type Ineffective Partially Effective Effective Highly Effective
Job security Potential dismissal after two years
Potential dismissal after two or three years
Salary No raise Raise possible, at superintendent’s discretion
Raise Raise
Bonus $5,000 performance bonus
$2,500 hard-to-staff subject bonus (if applicable)
$5,000 low-performing school bonus (if applicable)
Districtwide Retention Results
In this section, we present findings from the descriptive districtwide retention analyses.
The research question we address is:
1. Are the highest rated teachers more likely to stay in the district, relative to lower
rated teachers?
Figure 2 shows that the retention rates among teachers rated “effective” and “highly
effective” exceed 90 percent, whereas retention rates among teachers rated “partially
effective” and “ineffective” are 72 percent and 63 percent, respectively. In contrast,
the most recent results from the national 2012–13 Teacher Follow-Up Survey indicate
that 84 percent of public school teachers are retained, on average (Goldring, Taie, &
Riddles, 2014).
15 Only teachers paid under the new universal salary system are eligible to receive the bonus awards attached to the “highly effective” rating. Approximately 66 percent of teachers are currently on this salary schedule, and all new teachers hired to work in NPS are automatically enrolled in the new salary system. The teachers who remain on the old traditional salary system were incumbent to the district at the time of contract implementation (December 2012), held a master’s or doctoral degree, and had to choose whether to remain on the traditional scale or move to the universal scale. Similar to their colleagues on the universal salary system, the teachers paid under the traditional salary system also have incentives related to job security (the threat of dismissal for an “ineffective” rating) and salary (the guarantee of a salary step increase for receiving a rating of “effective” or “highly effective”).
Teachers who received higher ratings are retained in NPS at higher rates.

NEWARK PUBLIC SCHOOLS and NEWARK TEACHERS UNION Teacher Contract Evaluation | YEAR 1 REPORT33
In the analysis that follows, we use regression models to further examine this pattern of
differential retention. The regression models control for teacher and school characteristics
(e.g., teacher’s prior years of NPS experience, prior school performance). That is, the
regression models provide information about whether teachers with different ratings
are retained at different rates, after accounting for systematic differences in teacher
retention associated with observable teacher and school characteristics included in
the model. As such, the percentage of teachers retained, as noted in Figure 2, will be
similar but not identical to the coefficient estimates produced by the regression models.
Figure 2. District-Level Teacher Retention Rates by Effectiveness Ratings, 2012–13 and 2013–14
Table 11 presents the regression estimates for the likelihood that teachers rated “partially
effective,” “effective,” and “highly effective” remain in the district, relative to teachers
rated “ineffective.” The positive and statistically significant results suggest that higher
rated teachers are more likely to remain in the district the following year than teachers
rated “ineffective.” Specifically, in 2013–14, teachers rated “partially effective” are 12
percentage points more likely to remain than teachers rated “ineffective,” and teachers
rated both “effective” and “highly effective” are 30 percentage points more likely to
remain than teachers rated “ineffective.”
100%
80%
60%
40%
20%
0%
Percentage of Teachers Retained
Ineffective Partially Effective Effective Highly Effective (n = 92–108) (n = 312–462) (n = 2,008–2,010) (n = 283–300)
67%63%
84%
72%
94% 93%96% 95%
2012–13 2013–14
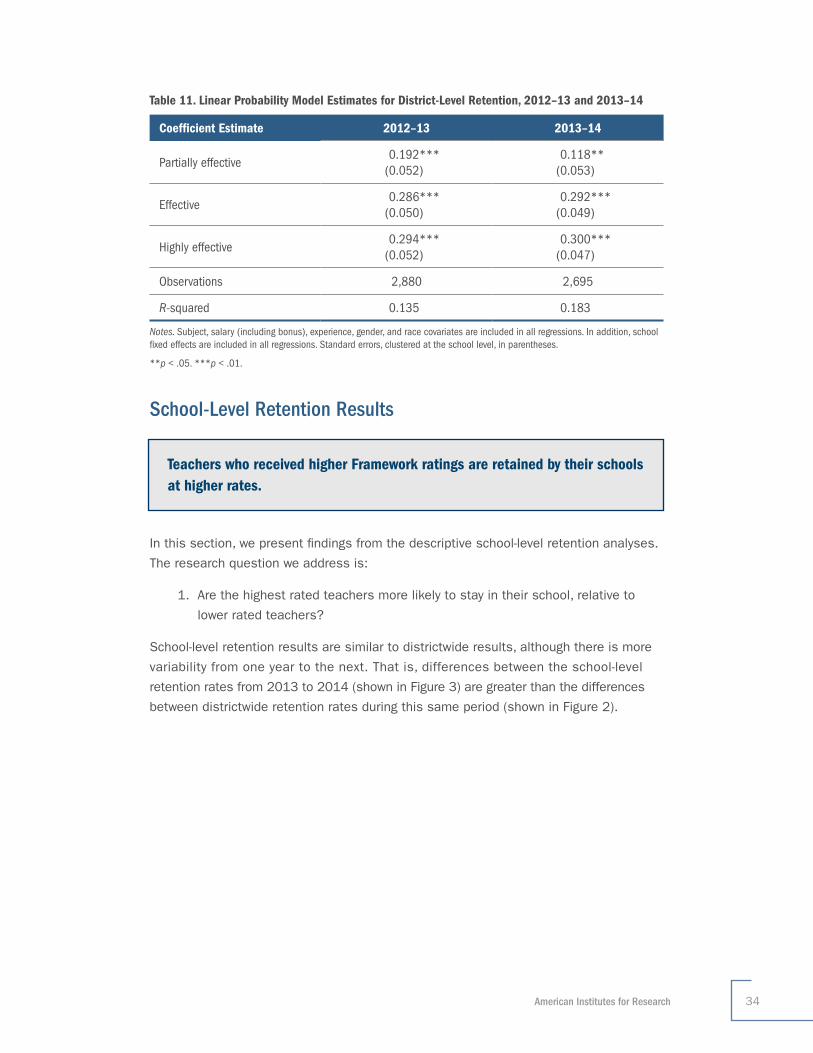
American Institutes for Research 34
Table 11. Linear Probability Model Estimates for District-Level Retention, 2012–13 and 2013–14
Coefficient Estimate 2012–13 2013–14
Partially effective 0.192*** (0.052)
0.118** (0.053)
Effective 0.286*** (0.050)
0.292*** (0.049)
Highly effective 0.294*** (0.052)
0.300*** (0.047)
Observations 2,880 2,695
R-squared 0.135 0.183
Notes. Subject, salary (including bonus), experience, gender, and race covariates are included in all regressions. In addition, school fixed effects are included in all regressions. Standard errors, clustered at the school level, in parentheses.
**p < .05. ***p < .01.
School-Level Retention Results
In this section, we present findings from the descriptive school-level retention analyses.
The research question we address is:
1. Are the highest rated teachers more likely to stay in their school, relative to
lower rated teachers?
School-level retention results are similar to districtwide results, although there is more
variability from one year to the next. That is, differences between the school-level
retention rates from 2013 to 2014 (shown in Figure 3) are greater than the differences
between districtwide retention rates during this same period (shown in Figure 2).
Teachers who received higher Framework ratings are retained by their schools at higher rates.
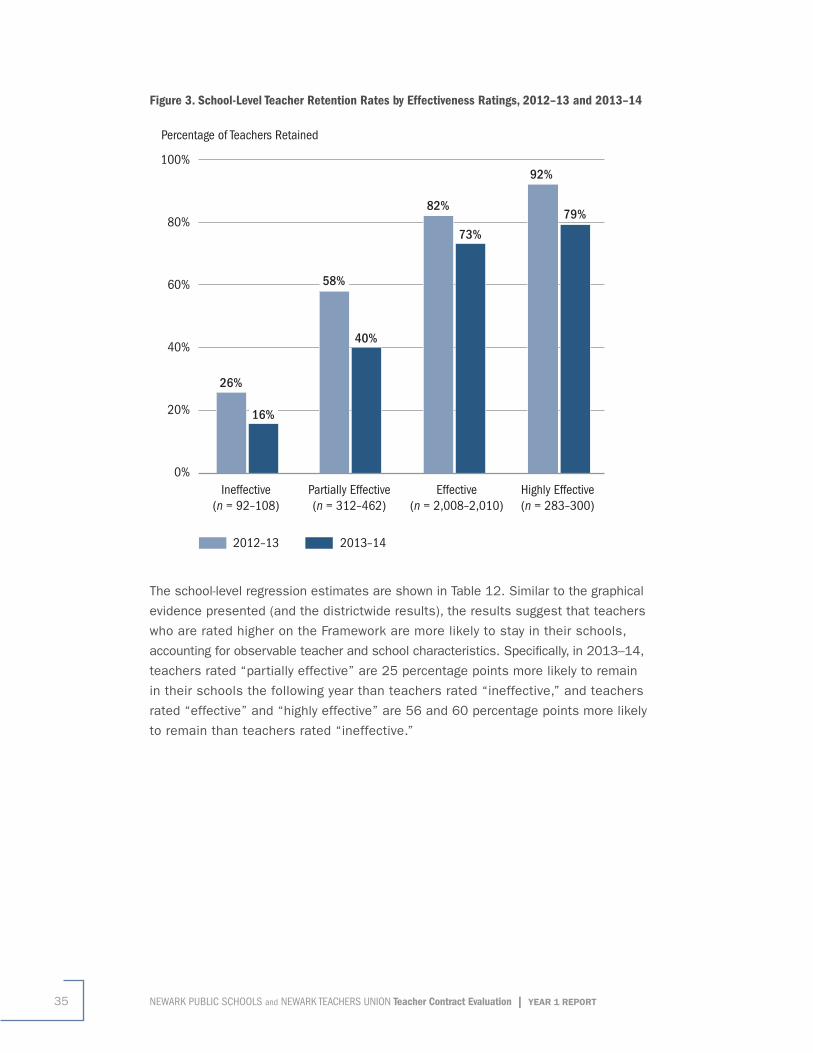
NEWARK PUBLIC SCHOOLS and NEWARK TEACHERS UNION Teacher Contract Evaluation | YEAR 1 REPORT35
Figure 3. School-Level Teacher Retention Rates by Effectiveness Ratings, 2012–13 and 2013–14
The school-level regression estimates are shown in Table 12. Similar to the graphical
evidence presented (and the districtwide results), the results suggest that teachers
who are rated higher on the Framework are more likely to stay in their schools,
accounting for observable teacher and school characteristics. Specifically, in 2013–14,
teachers rated “partially effective” are 25 percentage points more likely to remain
in their schools the following year than teachers rated “ineffective,” and teachers
rated “effective” and “highly effective” are 56 and 60 percentage points more likely
to remain than teachers rated “ineffective.”
100%
80%
60%
40%
20%
0%
Percentage of Teachers Retained
Ineffective Partially Effective Effective Highly Effective (n = 92–108) (n = 312–462) (n = 2,008–2,010) (n = 283–300)
26%
16%
58%
40%
82%
73%
92%
79%
2012–13 2013–14
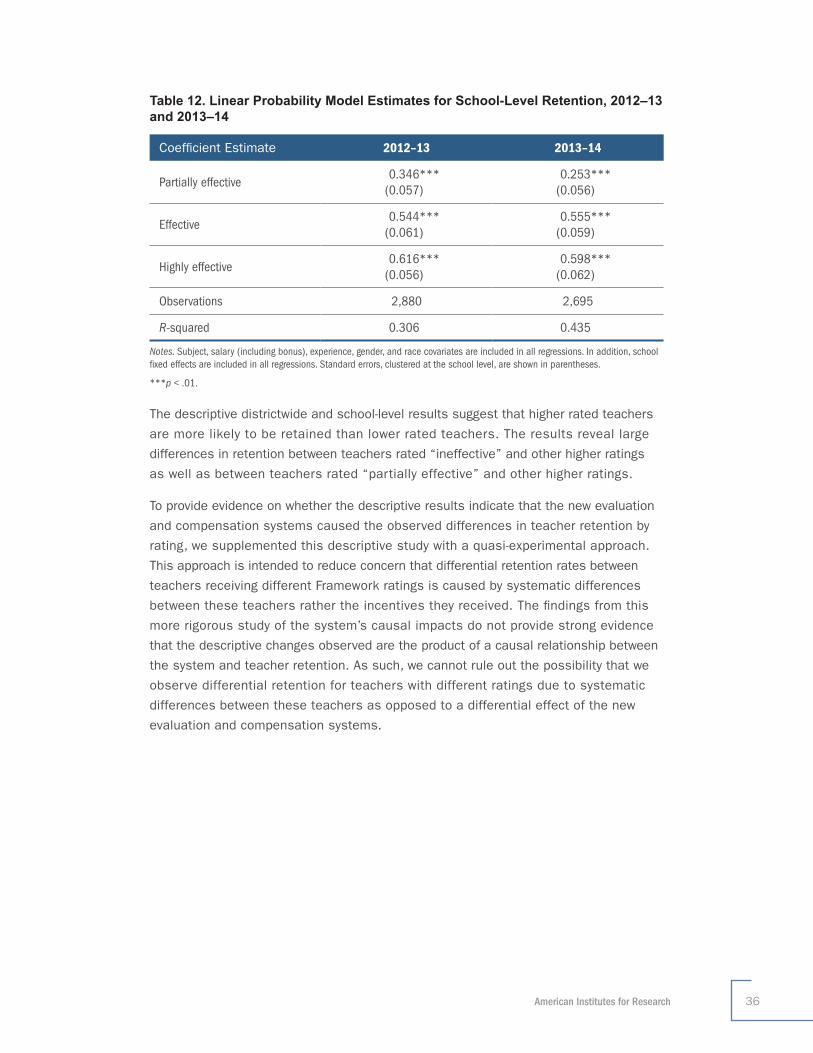
American Institutes for Research 36
Table 12. Linear Probability Model Estimates for School-Level Retention, 2012–13 and 2013–14
Coefficient Estimate 2012–13 2013–14
Partially effective 0.346*** (0.057)
0.253*** (0.056)
Effective 0.544*** (0.061)
0.555*** (0.059)
Highly effective 0.616*** (0.056)
0.598*** (0.062)
Observations 2,880 2,695
R-squared 0.306 0.435
Notes. Subject, salary (including bonus), experience, gender, and race covariates are included in all regressions. In addition, school fixed effects are included in all regressions. Standard errors, clustered at the school level, are shown in parentheses.
***p < .01.
The descriptive districtwide and school-level results suggest that higher rated teachers
are more likely to be retained than lower rated teachers. The results reveal large
differences in retention between teachers rated “ineffective” and other higher ratings
as well as between teachers rated “partially effective” and other higher ratings.
To provide evidence on whether the descriptive results indicate that the new evaluation
and compensation systems caused the observed differences in teacher retention by
rating, we supplemented this descriptive study with a quasi-experimental approach.
This approach is intended to reduce concern that differential retention rates between
teachers receiving different Framework ratings is caused by systematic differences
between these teachers rather the incentives they received. The findings from this
more rigorous study of the system’s causal impacts do not provide strong evidence
that the descriptive changes observed are the product of a causal relationship between
the system and teacher retention. As such, we cannot rule out the possibility that we
observe differential retention for teachers with different ratings due to systematic
differences between these teachers as opposed to a differential effect of the new
evaluation and compensation systems.

NEWARK PUBLIC SCHOOLS and NEWARK TEACHERS UNION Teacher Contract Evaluation | YEAR 1 REPORT37
ConclusionIn this report, we present findings about educators’ perspectives on the components
included in the NPS/NTU teacher contract, as well as the association between teacher
retention and the new evaluation and compensation systems. The findings we present in
the report are intended to be used by NPS to inform the support NPS provides and the
communication NPS has with educators about the contract and related initiatives. The
findings also may suggest areas for refinement and improvement. Accordingly, we
provide three recommendations for NPS that stem from the findings.
Taken together, the findings suggest that NPS educators have positive perceptions about
some of the contract components (e.g., the Framework) and have mixed perceptions
about other components (e.g., differentiated compensation). In addition, the incentive
structure used by the new evaluation and compensation systems is correlated with the
retention of higher rated teachers.
The findings show that most educators believe the new evaluation system is valid, accurate, and useful. However, teachers typically do not feel that they can provide feedback about the new evaluation system. Teachers and school leaders reported mixed support for the new compensation system, suggesting the differentiated compensation component is the least favored component of the teacher contract. The survey findings suggest that extended learning time for student instruction and teacher planning and collaboration has been implemented in some schools and is typically perceived as useful by a majority of educators who work in extended learning time schools. In general, educators are more positive about the teacher contract and related initiatives if they also report having a greater knowledge of the contract and its components.
In addition, findings suggest the implementation of the new evaluation and compensation systems are associated with differential teacher retention. The results from the retention analyses show that a larger percentage of teachers rated “effective” and “highly effective” had been retained relative to teachers rated “partially effective” and “ineffective.” Further, the results indicate that teachers rated “partially effective” are retained at significantly higher rates than teachers rated “ineffective.”
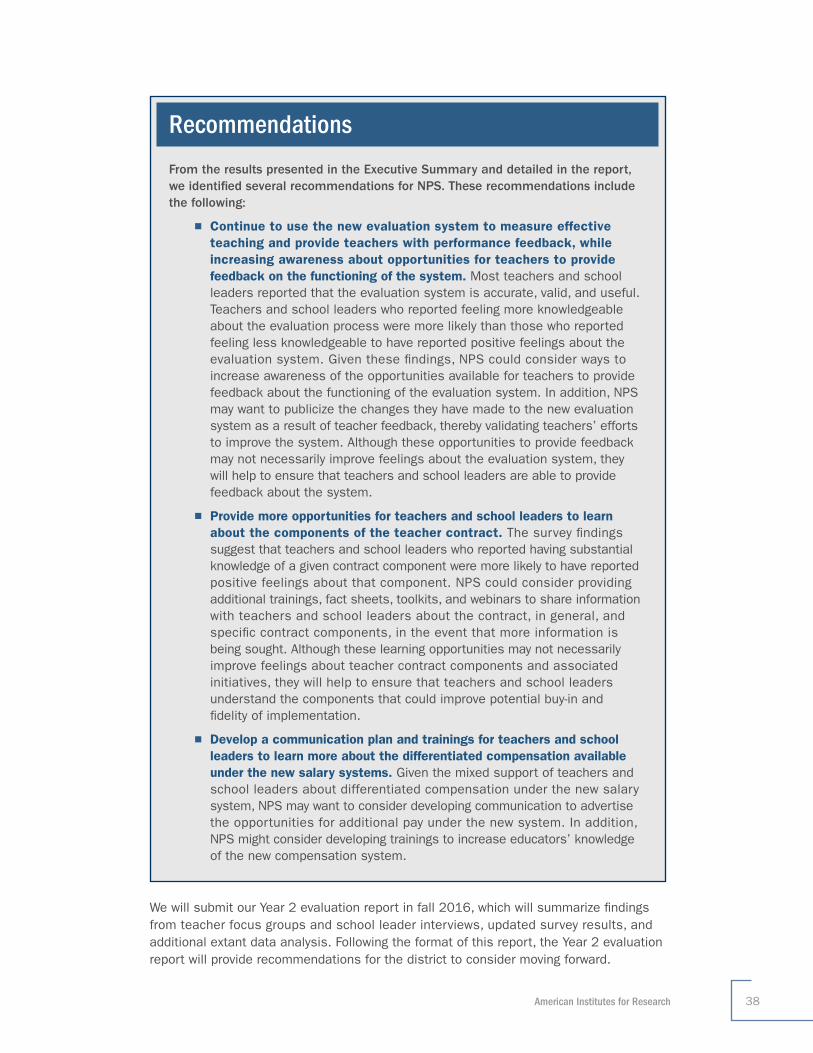
American Institutes for Research 38
Recommendations
From the results presented in the Executive Summary and detailed in the report, we identified several recommendations for NPS. These recommendations include the following:
■ Continue to use the new evaluation system to measure effective teaching and provide teachers with performance feedback, while increasing awareness about opportunities for teachers to provide feedback on the functioning of the system. Most teachers and school leaders reported that the evaluation system is accurate, valid, and useful. Teachers and school leaders who reported feeling more knowledgeable about the evaluation process were more likely than those who reported feeling less knowledgeable to have reported positive feelings about the evaluation system. Given these findings, NPS could consider ways to increase awareness of the opportunities available for teachers to provide feedback about the functioning of the evaluation system. In addition, NPS may want to publicize the changes they have made to the new evaluation system as a result of teacher feedback, thereby validating teachers’ efforts to improve the system. Although these opportunities to provide feedback may not necessarily improve feelings about the evaluation system, they will help to ensure that teachers and school leaders are able to provide feedback about the system.
■ Provide more opportunities for teachers and school leaders to learn about the components of the teacher contract. The survey findings suggest that teachers and school leaders who reported having substantial knowledge of a given contract component were more likely to have reported positive feelings about that component. NPS could consider providing additional trainings, fact sheets, toolkits, and webinars to share information with teachers and school leaders about the contract, in general, and specific contract components, in the event that more information is being sought. Although these learning opportunities may not necessarily improve feelings about teacher contract components and associated initiatives, they will help to ensure that teachers and school leaders understand the components that could improve potential buy-in and fidelity of implementation.
■ Develop a communication plan and trainings for teachers and school leaders to learn more about the differentiated compensation available under the new salary systems. Given the mixed support of teachers and school leaders about differentiated compensation under the new salary system, NPS may want to consider developing communication to advertise the opportunities for additional pay under the new system. In addition, NPS might consider developing trainings to increase educators’ knowledge of the new compensation system.
We will submit our Year 2 evaluation report in fall 2016, which will summarize findings from teacher focus groups and school leader interviews, updated survey results, and additional extant data analysis. Following the format of this report, the Year 2 evaluation report will provide recommendations for the district to consider moving forward.
NEWARK PUBLIC SCHOOLS and NEWARK TEACHERS UNION Teacher Contract Evaluation | YEAR 1 REPORT39
ReferencesBaratz-Snowden, J. (2007). The future of teacher compensation: Déjà vu or something
new? Washington, DC: Center for American Progress.
Boyd, D., Lankford, H., Loeb, S., & Wyckoff, J. (2005). Explaining the short careers of high-achieving teachers in schools with low-performing students. American Economic Review, 95(2), 166–171.
Cantrell, S., & Kane, T. J. (2013). Ensuring fair and reliable measures of effective teaching: Culminating findings from the MET Project’s three-year study. Seattle, WA: Bill & Melinda Gates Foundation. Retrieved from http://www.metproject.org/downloads/MET_Ensuring_Fair_and_Reliable_Measures_Practitioner_Brief.pdf
Chait, R., & Miller, R. (2009). Paying teachers for results: A summary of research to inform the design of pay-for-performance programs for high-poverty schools. Washington, DC: Center for American Progress.
Checkoway, A., Gamse, B., Velez, M., Caven, M., de la Cruz, R., Donoghue, N., et al. (2012). Evaluation of the Massachusetts Expanded Learning Time (ELT) initiative: Year five final report. Cambridge, MA: Abt Associates. Retrieved from http://www.abtassociates.com/AbtAssociates/files/fe/fe87ef4f-3978-4e07-9704-2acbb010680c.pdf
Chubb, J., & Moe, T. (1990). Politics, markets, and America’s schools. Washington, DC: The Brookings Institution.
Clark, A. (2015, April 2). Find out how much your school district is spending per student. NJ.com. Retrieved from http://www.nj.com/education/2015/04/nj_schools_how_much_is_your_district_spending_per.html
Conway, J. (1984). The myth, mystery, and mastery of participative decision making in education. Educational Administration Quarterly, 20, 11–40.
Dee, T. S., & Wyckoff, J. (2015). Incentives, selection, and teacher performance: Evidence from IMPACT. Journal of Policy Analysis and Management, 34(2), 267–297.
Firestone, W. A., Nordin, T. L., Shcherbakov, A., Kirova, D., & Blitz, C. L. (2014). New Jersey’s pilot teacher evaluation program: Year 2 final report. Rutgers, NJ: Rutgers Graduate School of Education. Retrieved from http://www.nj.gov/education/AchieveNJ/resources/FinalRUGSEReport.pdf
Fulbeck, E. S. (2014). Teacher mobility and financial incentives: A descriptive analysis of Denver’s ProComp. Educational Evaluation and Policy Analysis, 36(1), 67–82. Retrieved from http://epa.sagepub.com/content/36/1/67
Glazerman, S., & Seifullah, A. (2012). An evaluation of the Chicago Teacher Advancement Program (Chicago TAP) after four years: Final report. Washington, DC: Mathematica Policy Research. Retrieved from http://www.mathematica-mpr.com/publications/pdfs/education/tap_year4_impacts.pdf
Goddard, Y. L., Goddard, R. D., & Tschannen-Moran, M. (2007). A theoretical and empirical investigation of teacher collaboration for school improvement and student achievement in public elementary schools. Teachers College Record, 109(4), 877–896.
Goldring, R., Taie, S., & Riddles, M. (2014). Teacher attrition and mobility: Results from the 2012–13 Teacher Follow-up Survey (NCES 2014-007). Washington, DC: U.S. Department of Education, National Center for Education Statistics.
American Institutes for Research 40
Jiang, J. Y., & Sporte, S. E. (2014). Teacher evaluation in practice: Year 2 teacher and administrator perceptions of REACH. Chicago, IL: The University of Chicago Consortium on Chicago School Research. Retrieved from https://ccsr.uchicago.edu/sites/default/files/publications/REACH%20Brief.pdf
Kotlowitz, A. (2015, August 19). “The Prize,” by Dale Russakoff. Sunday book review. The New York Times. Retrieved from http://nyti.ms/1J2YzqC
Lazear, E. (2003). Teacher incentives. Swedish Economic Policy Review, 10(2), 179–214.
Linacre, J. M. (2015). Winsteps® (Version 3.91.0) [Computer software]. Beaverton, OR: Winsteps.com.
Little, O., Goe, L., & Bell, C. (2009). A practical guide to evaluating teacher effectiveness. Washington, DC: National Comprehensive Center for Teacher Quality. Retrieved from http://www.gtlcenter.org/sites/default/files/docs/practicalGuide.pdf
Loeb, S., Kalogrides, D., & Béteille, T. (2012). Effective schools: Teacher hiring, assignment, development, and retention. Education Finance and Policy, 7(3), 269–304.
Max, J., Constantine, J., Wellington, A., Hallgren, K., Glazerman, S., Chiang, H., et al. (2014). Evaluation of the Teacher Incentive Fund: Implementation and early impacts of pay-for-performance after one year, Executive summary (NCEE 2014-4020). Washington, DC: U.S. Department of Education, Institute of Education Sciences, National Center for Education Evaluation and Regional Assistance.
McCaffrey, D. F., Koretz, D., Lockwood, J. R., & Hamilton, L. S. (2004). The promise and peril of using value-added modeling to measure teacher effectiveness (Research Brief No. RB-9050-EDU). Santa Monica, CA: RAND Corporation. Retrieved from http://www.rand.org/pubs/research_briefs/RB9050.html
Mooney, J. (2012, November 15). Newark teachers vote “yes” on precedent-setting contract. NJ Spotlight. Retrieved from http://www.njspotlight.com/stories/12/11/14/newark-teachers-vote-yes-on-precedent-setting-contract//
National Center for Education Statistics. (1996). How widespread is site-based decision making in the public schools? (NCES Issue Brief No. IB-8-96). Washington, DC: Author. Retrieved from http://nces.ed.gov/pubs/97908.pdf
National Council on Teacher Quality. (2014). 2014 state teacher policy yearbook: National summary. Washington, DC: Author. Retrieved from http://www.nctq.org/dmsStage/2014_State_Teacher_Policy_Yearbook_National_Summary_NCTQ_Report
Newark Public Schools. (n.d.). Fiscal year 2016 public budget hearing. Retrieved from http://www.nps.k12.nj.us/wp-content/uploads/2015/03/FY16-Budget-Hearing-Presentation_150325_v.FINAL_.pdf
Newark Public Schools, Office of Strategy and Innovation. (n.d.). Correcting the facts about the One Newark Plan. Retrieved from http://www.nps.k12.nj.us/wp-content/uploads/2014/08/StrategicApproach.pdf
Nix, N. (2015, April 30). Activists, union ramp up push against Newark school district’s “turnaround” program. NJ.com. Retrieved from http://www.nj.com/essex/index.ssf/2015/04/activists_union_ramp_up_push_against_newark_school.html.
Rivkin, S. G., Hanushek, E. A., & Kain, J. F. (2005). Teachers, schools, and academic achievement. Econometrica, 79, 417–458.
NEWARK PUBLIC SCHOOLS and NEWARK TEACHERS UNION Teacher Contract Evaluation | YEAR 1 REPORT41
Rockoff, J. E. (2004).The impact of individual teachers on student achievement: Evidence from panel data. The American Economic Review, 94(2), 247–252.
Ruffini, S. J., Makkonen, R., Tejwani, J., & Diaz, M. (2014). Principal and teacher perceptions of implementation on multiple-measure teacher evaluation systems in Arizona (REL 2015-062). Washington, DC: U.S. Department of Education, Institute of Education Sciences, National Center for Education Evaluation and Regional Assistance, Regional Educational Laboratory West. Retrieved from http://ies.ed.gov/ncee/edlabs/regions/west/pdf/REL_2015062.pdf
Smylie, M. A., Lazarus, V., & Brownlee-Conyers, J. (1996). Instructional outcomes of school-based participative decision making. Educational Evaluation and Policy Analysis, 18(3), 181–198.
Yuan, K., Le, V., McCaffrey, D. F., Marsh, J. A., Hamilton, L. S., Stecher, B. M., et al. (2013). Incentive pay programs do not affect teacher motivation or reported practices: Results from three randomized studies. Educational Evaluation and Policy Analysis, 35(1), 3–22.
Zernike, K. (2015, June 22). Cami Anderson, picked by Christie, is out as Newark Schools superintendent. The New York Times. Retrieved from http://www.nytimes.com/2015/06/23/nyregion/newark-schools-superintendent-is-stepping-down.html?_r=0
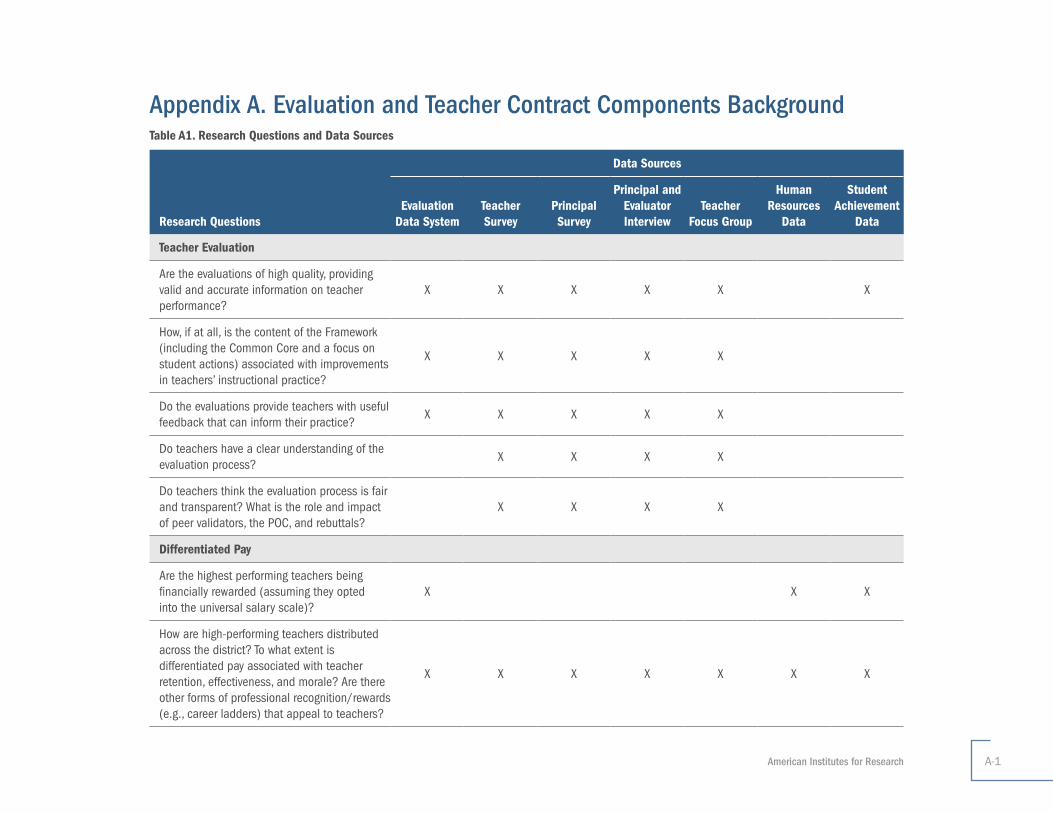
American Institutes for Research A-1
Appendix A. Evaluation and Teacher Contract Components BackgroundTable A1. Research Questions and Data Sources
Research Questions
Data Sources
Evaluation Data System
Teacher Survey
Principal Survey
Principal and Evaluator Interview
Teacher Focus Group
Human Resources
Data
Student Achievement
Data
Teacher Evaluation
Are the evaluations of high quality, providing valid and accurate information on teacher performance?
X X X X X X
How, if at all, is the content of the Framework (including the Common Core and a focus on student actions) associated with improvements in teachers’ instructional practice?
X X X X X
Do the evaluations provide teachers with useful feedback that can inform their practice?
X X X X X
Do teachers have a clear understanding of the evaluation process?
X X X X
Do teachers think the evaluation process is fair and transparent? What is the role and impact of peer validators, the POC, and rebuttals?
X X X X
Differentiated Pay
Are the highest performing teachers being financially rewarded (assuming they opted into the universal salary scale)?
X X X
How are high-performing teachers distributed across the district? To what extent is differentiated pay associated with teacher retention, effectiveness, and morale? Are there other forms of professional recognition/rewards (e.g., career ladders) that appeal to teachers?
X X X X X X X
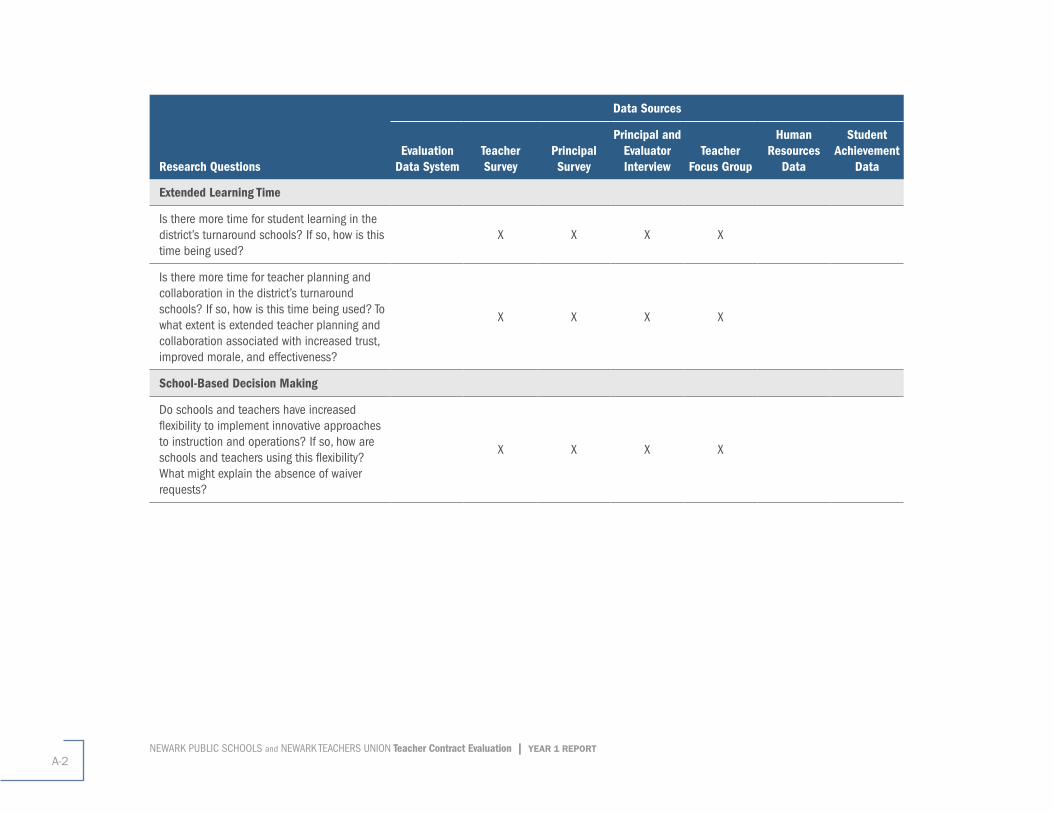
NEWARK PUBLIC SCHOOLS and NEWARK TEACHERS UNION Teacher Contract Evaluation | YEAR 1 REPORTA-2
Research Questions
Data Sources
Evaluation Data System
Teacher Survey
Principal Survey
Principal and Evaluator Interview
Teacher Focus Group
Human Resources
Data
Student Achievement
Data
Extended Learning Time
Is there more time for student learning in the district’s turnaround schools? If so, how is this time being used?
X X X X
Is there more time for teacher planning and collaboration in the district’s turnaround schools? If so, how is this time being used? To what extent is extended teacher planning and collaboration associated with increased trust, improved morale, and effectiveness?
X X X X
School-Based Decision Making
Do schools and teachers have increased flexibility to implement innovative approaches to instruction and operations? If so, how are schools and teachers using this flexibility? What might explain the absence of waiver requests?
X X X X
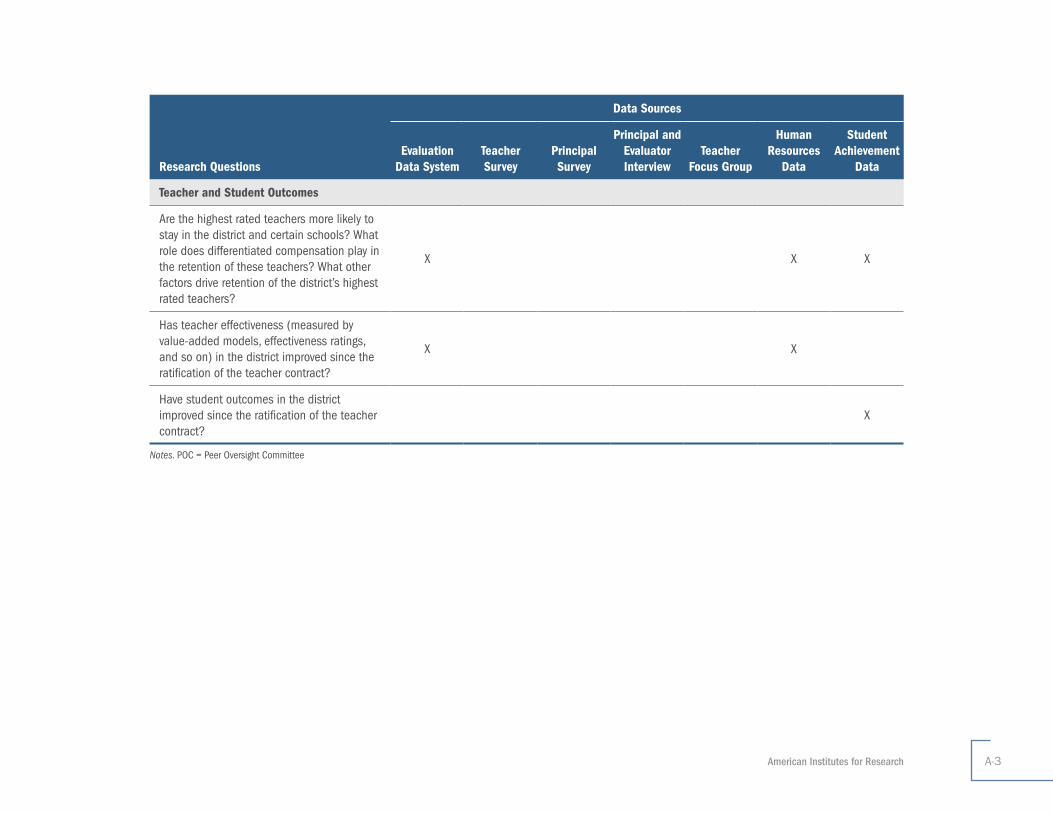
American Institutes for Research A-3
Research Questions
Data Sources
Evaluation Data System
Teacher Survey
Principal Survey
Principal and Evaluator Interview
Teacher Focus Group
Human Resources
Data
Student Achievement
Data
Teacher and Student Outcomes
Are the highest rated teachers more likely to stay in the district and certain schools? What role does differentiated compensation play in the retention of these teachers? What other factors drive retention of the district’s highest rated teachers?
X X X
Has teacher effectiveness (measured by value-added models, effectiveness ratings, and so on) in the district improved since the ratification of the teacher contract?
X X
Have student outcomes in the district improved since the ratification of the teacher contract?
X
Notes. POC = Peer Oversight Committee
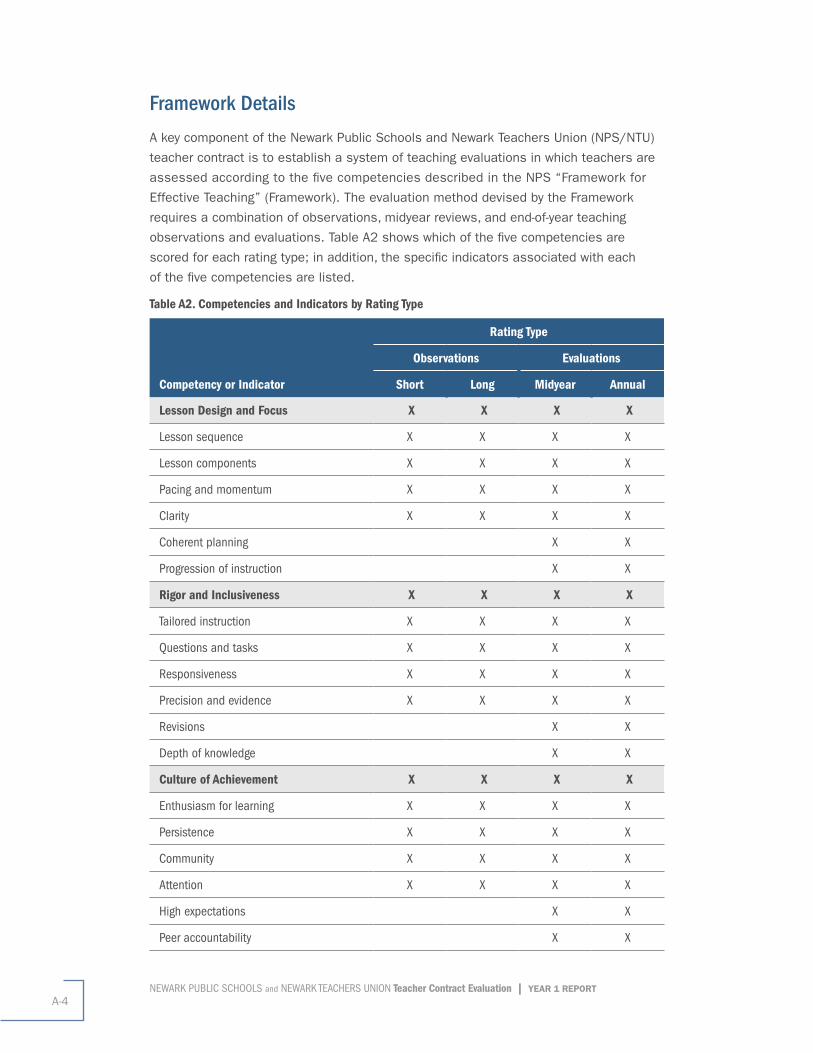
NEWARK PUBLIC SCHOOLS and NEWARK TEACHERS UNION Teacher Contract Evaluation | YEAR 1 REPORTA-4
Framework Details
A key component of the Newark Public Schools and Newark Teachers Union (NPS/NTU)
teacher contract is to establish a system of teaching evaluations in which teachers are
assessed according to the five competencies described in the NPS “Framework for
Effective Teaching” (Framework). The evaluation method devised by the Framework
requires a combination of observations, midyear reviews, and end-of-year teaching
observations and evaluations. Table A2 shows which of the five competencies are
scored for each rating type; in addition, the specific indicators associated with each
of the five competencies are listed.
Table A2. Competencies and Indicators by Rating Type
Competency or Indicator
Rating Type
Observations Evaluations
Short Long Midyear Annual
Lesson Design and Focus X X X X
Lesson sequence X X X X
Lesson components X X X X
Pacing and momentum X X X X
Clarity X X X X
Coherent planning X X
Progression of instruction X X
Rigor and Inclusiveness X X X X
Tailored instruction X X X X
Questions and tasks X X X X
Responsiveness X X X X
Precision and evidence X X X X
Revisions X X
Depth of knowledge X X
Culture of Achievement X X X X
Enthusiasm for learning X X X X
Persistence X X X X
Community X X X X
Attention X X X X
High expectations X X
Peer accountability X X
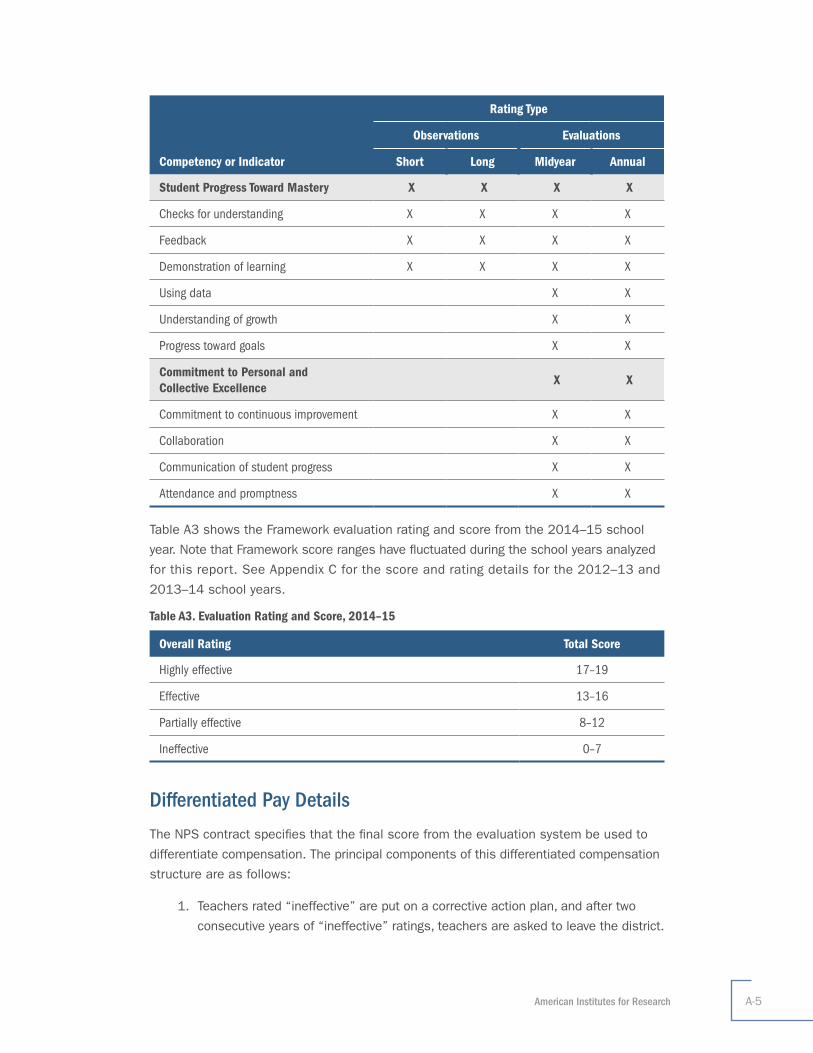
American Institutes for Research A-5
Competency or Indicator
Rating Type
Observations Evaluations
Short Long Midyear Annual
Student Progress Toward Mastery X X X X
Checks for understanding X X X X
Feedback X X X X
Demonstration of learning X X X X
Using data X X
Understanding of growth X X
Progress toward goals X X
Commitment to Personal and Collective Excellence
X X
Commitment to continuous improvement X X
Collaboration X X
Communication of student progress X X
Attendance and promptness X X
Table A3 shows the Framework evaluation rating and score from the 2014–15 school
year. Note that Framework score ranges have fluctuated during the school years analyzed
for this report. See Appendix C for the score and rating details for the 2012–13 and
2013–14 school years.
Table A3. Evaluation Rating and Score, 2014–15
Overall Rating Total Score
Highly effective 17–19
Effective 13–16
Partially effective 8–12
Ineffective 0–7
Differentiated Pay Details
The NPS contract specifies that the final score from the evaluation system be used to
differentiate compensation. The principal components of this differentiated compensation
structure are as follows:
1. Teachers rated “ineffective” are put on a corrective action plan, and after two
consecutive years of “ineffective” ratings, teachers are asked to leave the district.
NEWARK PUBLIC SCHOOLS and NEWARK TEACHERS UNION Teacher Contract Evaluation | YEAR 1 REPORTA-6
2. Teachers rated “partially effective” are put on a corrective action plan, and after
two or three consecutive years of “partially effective” ratings (or a combination
of “partially effective” and “ineffective” ratings for two consecutive years),
teachers are asked to leave the district.
3. Teachers rated “ineffective” are excluded from the opportunity to advance to a
new step on the salary scale. Teachers rated “partially effective” may advance
a step on the salary scale only at the superintendent’s discretion.
4. Teachers who obtain “highly effective” ratings can receive bonuses, which
include a combination of a base “highly effective” rating bonus ($5,000) and
supplemental bonuses available to teachers rated “highly effective” who also
work in one of the district’s lowest performing schools ($5,000) and/or who
teach in a hard-to-staff subject area ($2,500). A school is defined as low
performing if its prior year performance was in the bottom 25 percent and
the hard-to-staff subjects are defined according to which subjects were hard to
staff in that particular year. For example, in 2013–14, the hard-to-staff subjects
included: science (Grades 6–12), physics, biology, chemistry, mathematics
(Grades 6–12), Spanish, Chinese, French, Latin, Portuguese, bilingual education,
and elementary world language.
Four additional stipends are available as a result of the Framework. Only the Performance
Improvement Stipend is related to the Framework rating a teacher receives. This stipend
provides the opportunity for teachers rated “partially effective” in the prior year (and
who did not earn their raise) but “effective” or “highly effective” in the following year to
receive 50 percent of the compensation “step” missed as a result of not obtaining an
“effective” rating previously.
The other three opportunities are not related to differentiated performance. As a result,
data on these stipends are not accounted for in the bonus variable referenced in Table
10 of the report. These compensation opportunities are as follows:
1. A stipend is available to all teachers if they choose to switch from the traditional
salary scale to the universal salary system. This stipend ranges from $500
(for teachers with a bachelor’s degree) to $10,500 (for senior teachers with
a master’s degree).
2. A one-time contract ratification bonus payment was given, ranging from $3,500
to $12,000 (depending on the teacher’s salary), to compensate work since the
last contract expired.
3. A reward is given to teachers on the new universal scale who complete an
education program aligned to district priorities and Common Core State
Standards. This final stipend is available as a one-time bonus of up to
$20,000: $10,000 at the time of program completion and $10,000 after
completing three additional years of service in NPS.
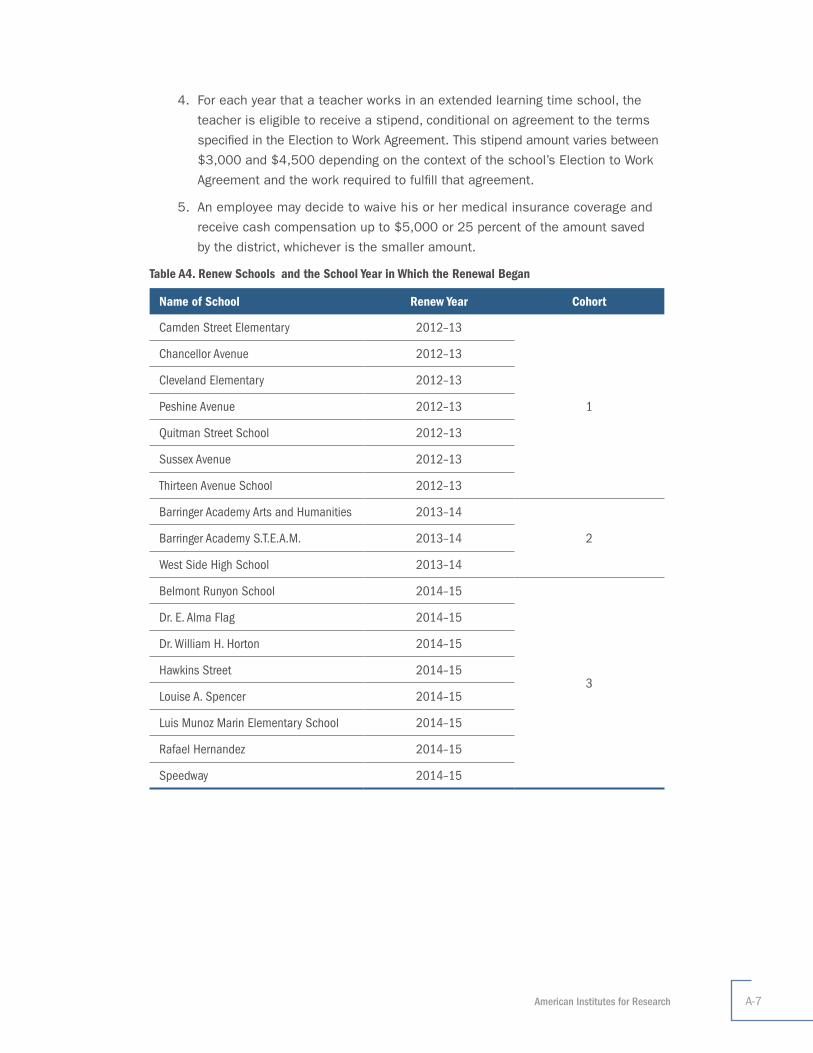
American Institutes for Research A-7
4. For each year that a teacher works in an extended learning time school, the
teacher is eligible to receive a stipend, conditional on agreement to the terms
specified in the Election to Work Agreement. This stipend amount varies between
$3,000 and $4,500 depending on the context of the school’s Election to Work
Agreement and the work required to fulfill that agreement.
5. An employee may decide to waive his or her medical insurance coverage and
receive cash compensation up to $5,000 or 25 percent of the amount saved
by the district, whichever is the smaller amount.
Table A4. Renew Schools and the School Year in Which the Renewal Began
Name of School Renew Year Cohort
Camden Street Elementary 2012–13
1
Chancellor Avenue 2012–13
Cleveland Elementary 2012–13
Peshine Avenue 2012–13
Quitman Street School 2012–13
Sussex Avenue 2012–13
Thirteen Avenue School 2012–13
Barringer Academy Arts and Humanities 2013–14
2Barringer Academy S.T.E.A.M. 2013–14
West Side High School 2013–14
Belmont Runyon School 2014–15
3
Dr. E. Alma Flag 2014–15
Dr. William H. Horton 2014–15
Hawkins Street 2014–15
Louise A. Spencer 2014–15
Luis Munoz Marin Elementary School 2014–15
Rafael Hernandez 2014–15
Speedway 2014–15
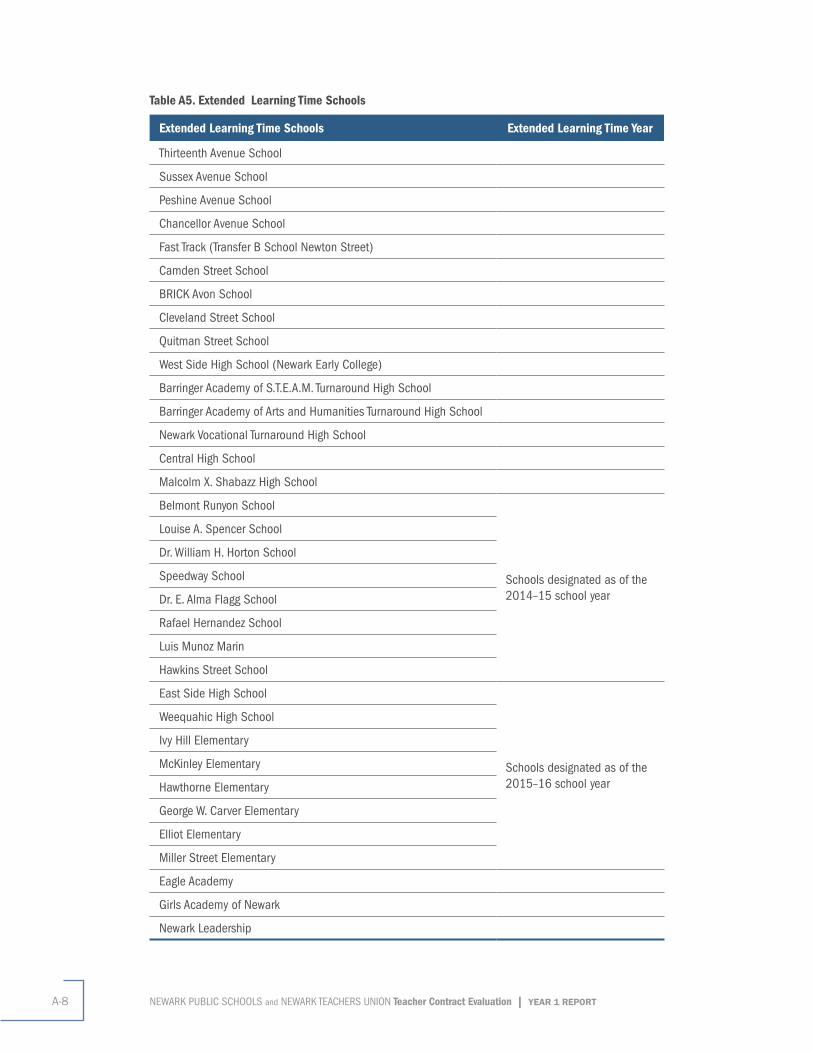
NEWARK PUBLIC SCHOOLS and NEWARK TEACHERS UNION Teacher Contract Evaluation | YEAR 1 REPORTA-8
Table A5. Extended Learning Time Schools
Extended Learning Time Schools Extended Learning Time Year
Thirteenth Avenue School
Sussex Avenue School
Peshine Avenue School
Chancellor Avenue School
Fast Track (Transfer B School Newton Street)
Camden Street School
BRICK Avon School
Cleveland Street School
Quitman Street School
West Side High School (Newark Early College)
Barringer Academy of S.T.E.A.M. Turnaround High School
Barringer Academy of Arts and Humanities Turnaround High School
Newark Vocational Turnaround High School
Central High School
Malcolm X. Shabazz High School
Belmont Runyon School
Schools designated as of the 2014–15 school year
Louise A. Spencer School
Dr. William H. Horton School
Speedway School
Dr. E. Alma Flagg School
Rafael Hernandez School
Luis Munoz Marin
Hawkins Street School
East Side High School
Schools designated as of the 2015–16 school year
Weequahic High School
Ivy Hill Elementary
McKinley Elementary
Hawthorne Elementary
George W. Carver Elementary
Elliot Elementary
Miller Street Elementary
Eagle Academy
Girls Academy of Newark
Newark Leadership
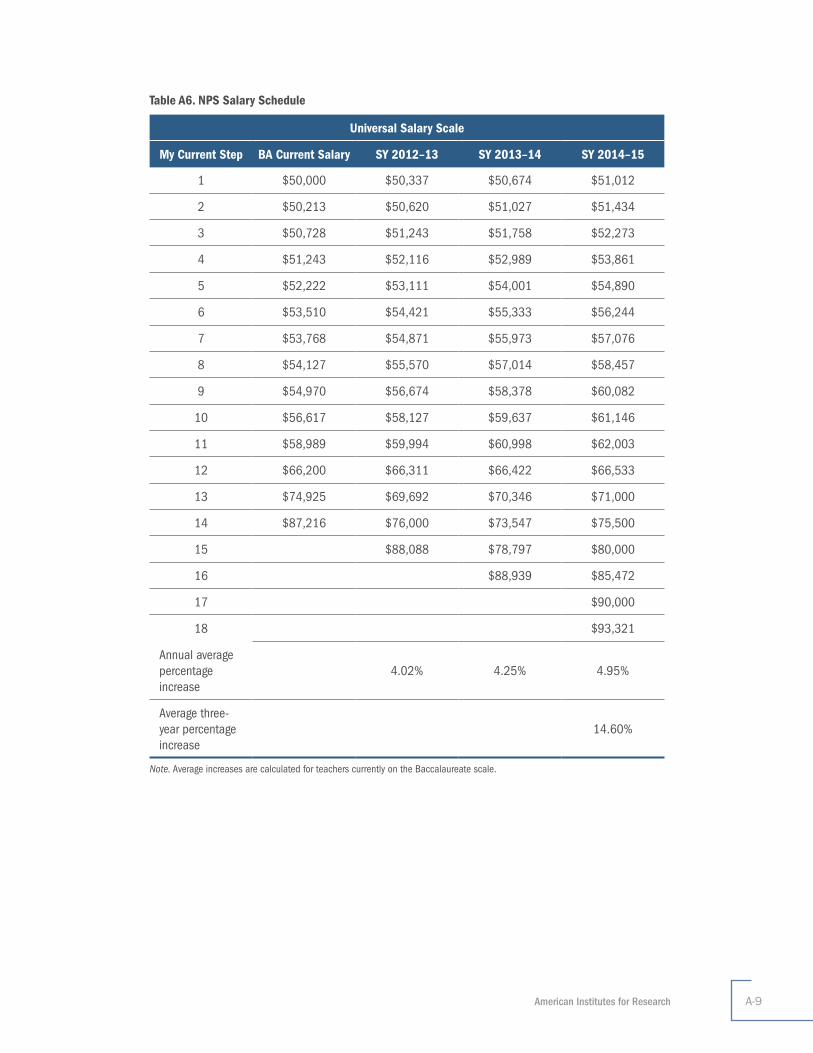
American Institutes for Research A-9
Table A6. NPS Salary Schedule
Universal Salary Scale
My Current Step BA Current Salary SY 2012–13 SY 2013–14 SY 2014–15
1 $50,000 $50,337 $50,674 $51,012
2 $50,213 $50,620 $51,027 $51,434
3 $50,728 $51,243 $51,758 $52,273
4 $51,243 $52,116 $52,989 $53,861
5 $52,222 $53,111 $54,001 $54,890
6 $53,510 $54,421 $55,333 $56,244
7 $53,768 $54,871 $55,973 $57,076
8 $54,127 $55,570 $57,014 $58,457
9 $54,970 $56,674 $58,378 $60,082
10 $56,617 $58,127 $59,637 $61,146
11 $58,989 $59,994 $60,998 $62,003
12 $66,200 $66,311 $66,422 $66,533
13 $74,925 $69,692 $70,346 $71,000
14 $87,216 $76,000 $73,547 $75,500
15 $88,088 $78,797 $80,000
16 $88,939 $85,472
17 $90,000
18 $93,321
Annual average percentage increase
4.02% 4.25% 4.95%
Average three-year percentage increase
14.60%
Note. Average increases are calculated for teachers currently on the Baccalaureate scale.

NEWARK PUBLIC SCHOOLS and NEWARK TEACHERS UNION Teacher Contract Evaluation | YEAR 1 REPORTB-1
Appendix B. Survey Methods
Sample
All teachers and school leaders (principals, vice principals, chief innovation officers, and early childhood center directors) at Newark Public Schools (NPS) were invited to participate in the survey. This sample included 2,713 teachers and 220 school leaders across 63 schools. In all, 1,637 teachers and 143 school leaders completed the survey, resulting in response rates of 65 percent for both groups.16 Table B1 presents individual and school demographic characteristics for teachers who did and did not complete the survey, before weights were applied. Table B2 presents demographic characteristics for school leaders. Overall, respondents appear to differ from nonrespondents on numerous characteristics, including: gender, race, years of experience at NPS, teachers’ bonus receipt in 2013–14, working at a renew school, working at a high-poverty school, and working at a school with a high percentage of students who qualify for limited English proficient services. To examine whether significant differences exist between the two groups on any of the characteristics, nonresponse analyses were conducted. A description of these analyses and their results are presented in the Analytic Approach subsection.
Table B1. Teacher and School Characteristics Sample Size and Percentage by Survey Completion
Characteristics
Not Completed Completed
N Percentage N Percentage
Gender
Male 334 48 364 52
Female 742 37 1,273 63
Race
Asian, American Indian, Pacific Islander, Not specified 37 46 43 54
Black 482 46 557 54
Hispanic 196 37 336 63
White 360 34 701 66
Years of Experience at NPS
0–3 years 196 31 428 69
4–9 years 268 41 382 59
10–19 years 405 41 588 59
20 or more years 207 46 239 54
16 Teachers and school leaders who were not actively working during the survey administration (e.g., those who were on a leave of absence) were not surveyed. Respondents who answered fewer than 50 percent of survey items were considered nonrespondents in the nonresponse analysis. However, these noncompleters (n = 174 teachers) were removed from the response rate calculation in order to avoid penalizing the district for individuals not finishing the survey. Nonetheless, their responses were not analyzed.
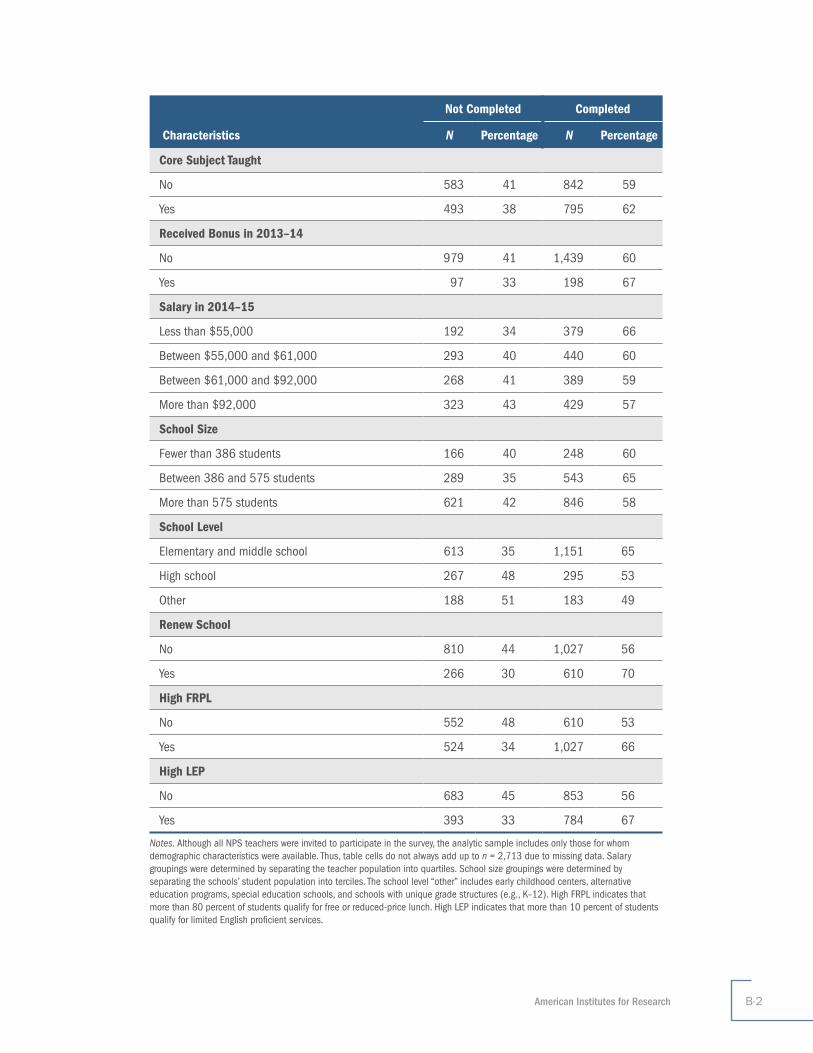
American Institutes for Research B-2
Characteristics
Not Completed Completed
N Percentage N Percentage
Core Subject Taught
No 583 41 842 59
Yes 493 38 795 62
Received Bonus in 2013–14
No 979 41 1,439 60
Yes 97 33 198 67
Salary in 2014–15
Less than $55,000 192 34 379 66
Between $55,000 and $61,000 293 40 440 60
Between $61,000 and $92,000 268 41 389 59
More than $92,000 323 43 429 57
School Size
Fewer than 386 students 166 40 248 60
Between 386 and 575 students 289 35 543 65
More than 575 students 621 42 846 58
School Level
Elementary and middle school 613 35 1,151 65
High school 267 48 295 53
Other 188 51 183 49
Renew School
No 810 44 1,027 56
Yes 266 30 610 70
High FRPL
No 552 48 610 53
Yes 524 34 1,027 66
High LEP
No 683 45 853 56
Yes 393 33 784 67
Notes. Although all NPS teachers were invited to participate in the survey, the analytic sample includes only those for whom demographic characteristics were available. Thus, table cells do not always add up to n = 2,713 due to missing data. Salary groupings were determined by separating the teacher population into quartiles. School size groupings were determined by separating the schools’ student population into terciles. The school level “other” includes early childhood centers, alternative education programs, special education schools, and schools with unique grade structures (e.g., K–12). High FRPL indicates that more than 80 percent of students qualify for free or reduced-price lunch. High LEP indicates that more than 10 percent of students qualify for limited English proficient services.
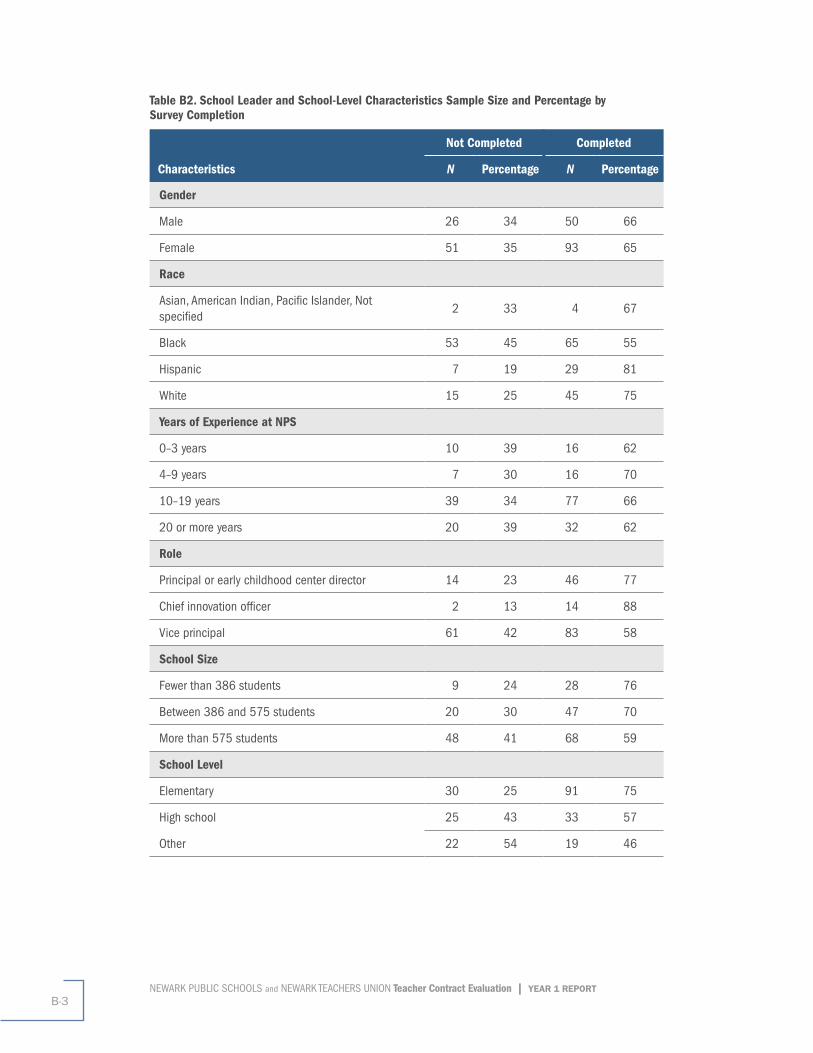
NEWARK PUBLIC SCHOOLS and NEWARK TEACHERS UNION Teacher Contract Evaluation | YEAR 1 REPORTB-3
Table B2. School Leader and School-Level Characteristics Sample Size and Percentage by Survey Completion
Characteristics
Not Completed Completed
N Percentage N Percentage
Gender
Male 26 34 50 66
Female 51 35 93 65
Race
Asian, American Indian, Pacific Islander, Not specified
2 33 4 67
Black 53 45 65 55
Hispanic 7 19 29 81
White 15 25 45 75
Years of Experience at NPS
0–3 years 10 39 16 62
4–9 years 7 30 16 70
10–19 years 39 34 77 66
20 or more years 20 39 32 62
Role
Principal or early childhood center director 14 23 46 77
Chief innovation officer 2 13 14 88
Vice principal 61 42 83 58
School Size
Fewer than 386 students 9 24 28 76
Between 386 and 575 students 20 30 47 70
More than 575 students 48 41 68 59
School Level
Elementary 30 25 91 75
High school 25 43 33 57
Other 22 54 19 46
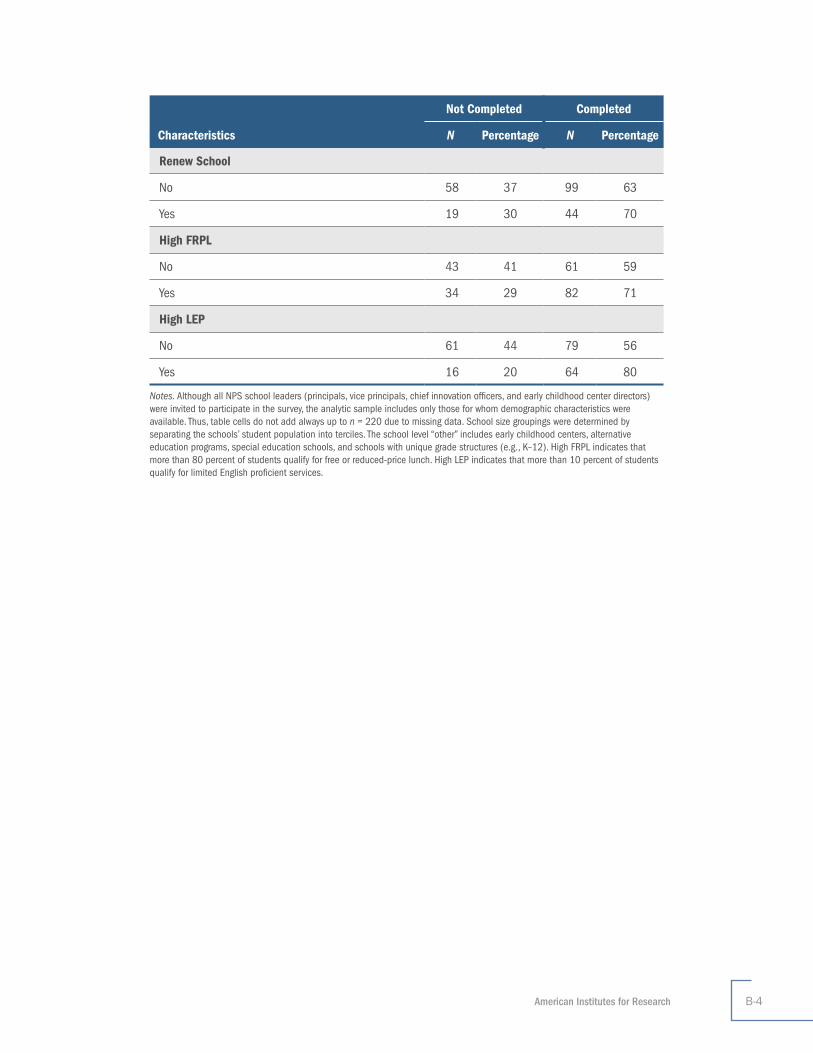
American Institutes for Research B-4
Characteristics
Not Completed Completed
N Percentage N Percentage
Renew School
No 58 37 99 63
Yes 19 30 44 70
High FRPL
No 43 41 61 59
Yes 34 29 82 71
High LEP
No 61 44 79 56
Yes 16 20 64 80
Notes. Although all NPS school leaders (principals, vice principals, chief innovation officers, and early childhood center directors) were invited to participate in the survey, the analytic sample includes only those for whom demographic characteristics were available. Thus, table cells do not add always up to n = 220 due to missing data. School size groupings were determined by separating the schools’ student population into terciles. The school level “other” includes early childhood centers, alternative education programs, special education schools, and schools with unique grade structures (e.g., K–12). High FRPL indicates that more than 80 percent of students qualify for free or reduced-price lunch. High LEP indicates that more than 10 percent of students qualify for limited English proficient services.
NEWARK PUBLIC SCHOOLS and NEWARK TEACHERS UNION Teacher Contract Evaluation | YEAR 1 REPORTB-5
Survey Administration
The AIR evaluation team administered surveys online during a 10-week period, from April
20, 2015, to June 23, 2015. We sent out reminder e-mails each week to teachers and
school leaders who either had not started or had not completed the survey, and we sent
thank you e-mails to teachers and school leaders who completed the survey. Our team
included a survey administrator who was available via e-mail and a toll-free telephone
number to help individuals who had trouble logging into the survey or who had any
concerns regarding the survey or use of survey results.
Incentives were provided to teachers and vice principals. Teachers who completed the
survey were entered into a drawing to win an iPad mini 2 each week, and vice principals
were entered into one drawing at the end of the survey administration period. Principals,
early childhood center directors, and chief innovation officers were not entered into the
drawing. In addition, five schools with the highest response rates above 80 percent
received $150 Visa gift cards, and all schools with response rates above 50 percent
received customized school reports of anonymous survey responses.
Analytic Approach
Scaling. Using the research question–construct links presented in Table B3, we first
conducted a psychometric analysis (separately for teachers and school leaders) to
ensure that appropriate survey items were combined to represent a particular construct.
We combined items to reduce a large set of items to a small number of summary scores
representing each construct. As a result, one or two scale scores, rather than (say) five
or 10 individual survey items, may summarize a construct. Table B4 presents the lists
of survey items combined to create each scale score for each construct for both the
teacher and school leader surveys. After we combined the items, we created Rasch
scale scores for each construct using Winsteps (Linacre, 2015), a Rasch analysis
software program.
We converted the scale scores back into their original metric (i.e., the Likert scale)
using the threshold grouping values from the Rasch scaling results, allowing for more
meaningful interpretation of the scores (i.e., expression as percentages of teachers and
school leaders). We then merged the converted scale scores with administrative and
demographic data.
Nonresponse Analyses. The AIR evaluation team conducted nonresponse analyses to
examine whether individuals who completed the survey differ on key characteristics from
those individuals who did not complete the survey. The analyses, which we conducted
separately for teachers and school leaders, consisted of running multilevel logistic
regression models on individual- and school-level characteristics to determine which
variables were significant in predicting whether an individual completed the survey. In
the teacher survey, females, teachers who received a bonus in the 2013–14 school
American Institutes for Research B-6
year, and teachers with more than three years of experience were significantly more likely
to complete the survey. In the school leader survey, only one variable was significant—
school leaders who work at schools where more than 10 percent of students are
identified as eligible for limited English proficient services were more likely to complete
the survey than school leaders who work at schools with lower percentages of students
with limited English proficiency.
Weighting. The AIR evaluation team used the values from the nonresponse regression
analyses (described in the previous subsection) to calculate a weight for each
respondent.17 Respondents in lower response rate groups (e.g., males on the teacher
survey) are assigned higher weights so that they represent a relatively higher proportion
of nonrespondents, who, in theory, might answer the survey similarly. Accordingly, the
percentages we present in this report are not the raw percentages as calculated from
actual question Ns but rather are estimates of the full population percentages (as if all
teachers had completed the survey).
We also adjusted analyses using a finite population correction, which accounts for
our finite population of teachers and school leaders. Finite populations do not contain
sampling error because sampling is not taking place (i.e., the entire population is
included). Thus, the variance of an estimate is adjusted down to correct for this lack of
(or very minimal) sampling error using the finite population correction.18 We administered
this adjustment for both teacher and school leader results.
Descriptive Analyses. We conducted descriptive analyses on the converted scale
scores as well as on individual survey items. Descriptive analyses summarize data
in a meaningful way, allowing us to determine whether patterns emerge from the
data. Specifically, we calculated percentages to determine the dominant responses
for each item.
We also conducted descriptive analyses on subgroups of individuals to examine how
responses differ by various individual and school characteristics (e.g., number of years
teaching at NPS) and survey responses (e.g., knowledge of a given contract component).
We examined whether differences among the subgroups are statistically significant (i.e.,
if they vary by more than chance) by conducting postestimation Wald tests. Wald tests
are used to determine whether two variables are associated, allowing us to test whether
the responses to a given research question are associated with subgroup membership
(i.e., whether the results differ significantly for various subgroups).
17 The weight for each respondent was calculated as the inverse of the predicted mean derived from the selected logistic regression model.
18 , where n is the sample size and N is the population size. Note that this correction will affect not the percentage estimate reported but rather the variance of the estimate. As a result, the significance test will be affected.

NEWARK PUBLIC SCHOOLS and NEWARK TEACHERS UNION Teacher Contract Evaluation | YEAR 1 REPORTB-7
Table B3. NPS/NTU Teacher Contract Survey Construct Crosswalk
Research Question Domain Construct Definition
1) To what extent do teachers and school leaders report that the evaluations are of high quality, providing valid and accurate information on teacher performance?
Teacher Evaluation
Perceived Validity
Perceptions about the validity (e.g., appropriateness) of the evaluation system as a whole and of specific components of the system.
1) To what extent do teachers and school leaders report that the evaluations are of high quality, providing valid and accurate information on teacher performance?
Teacher Evaluation
Perceived Accuracy
Perceptions about the accuracy (e.g., correctness and consistency) of the evaluation system as a whole, specific components of the system, and (if available) last year’s evaluation rating.
3) To what extent do teachers and school leaders report that the evaluations provide teachers with useful feedback that can inform their practice?
2) To what extent do teachers and school leaders report that the content of the Framework (including the focuses on the Common Core State Standards and student actions) is associated with improvements in teachers’ instructional practice?
Teacher Evaluation
Perceived Instructional Impact
Reports about how the evaluation system has changed the approach to teaching and informed instructional practice.
1) To what extent do teachers and school leaders report that the evaluations are of high quality, providing valid and reliable information on teacher performance?
Teacher Evaluation
Perceived Uses Understanding of the uses of evaluation ratings, as well perceived fairness of these uses.
4) To what extent do teachers and school leaders report that teachers have a clear understanding of the evaluation process?
5) To what extent do teachers and school leaders report that teachers think the evaluation process is fair and transparent?
Teacher Evaluation
Knowledge Understanding of the evaluation process.
5) To what extent do teachers and school leaders report that teachers think the evaluation process is fair and transparent?
Teacher Evaluation
Perceived Fairness
Perceptions about the fairness of the evaluation system.
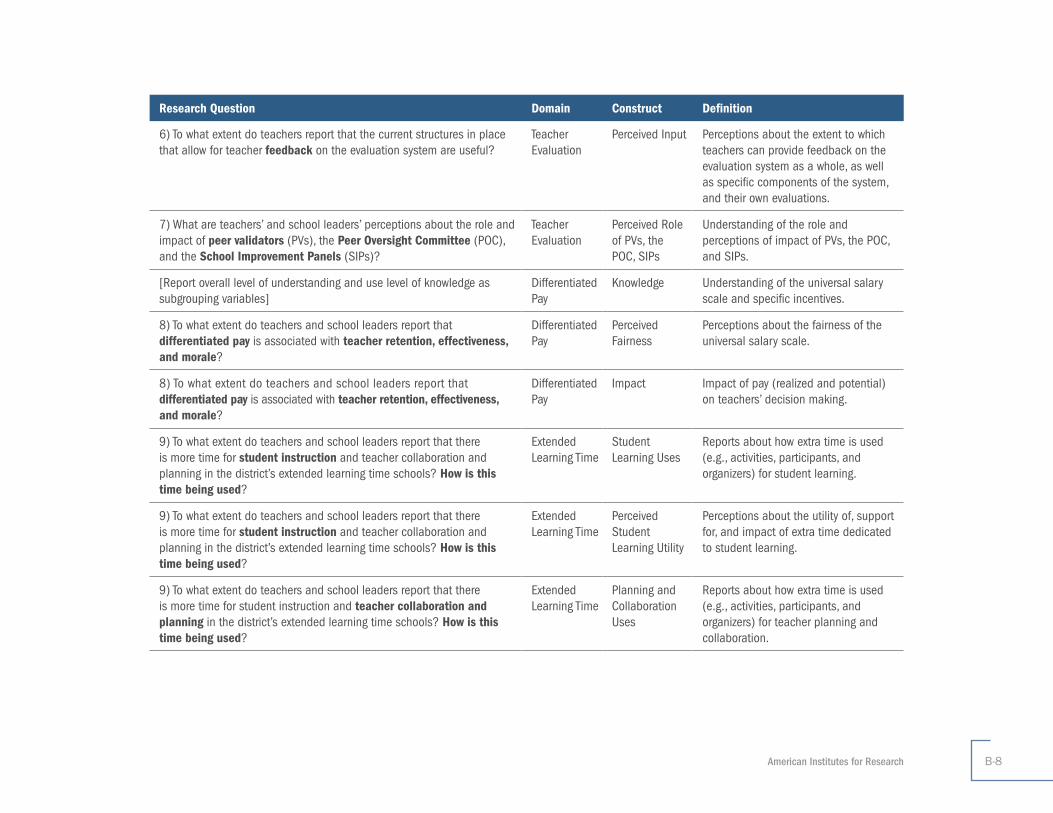
American Institutes for Research B-8
Research Question Domain Construct Definition
6) To what extent do teachers report that the current structures in place that allow for teacher feedback on the evaluation system are useful?
Teacher Evaluation
Perceived Input Perceptions about the extent to which teachers can provide feedback on the evaluation system as a whole, as well as specific components of the system, and their own evaluations.
7) What are teachers’ and school leaders’ perceptions about the role and impact of peer validators (PVs), the Peer Oversight Committee (POC), and the School Improvement Panels (SIPs)?
Teacher Evaluation
Perceived Role of PVs, the POC, SIPs
Understanding of the role and perceptions of impact of PVs, the POC, and SIPs.
[Report overall level of understanding and use level of knowledge as subgrouping variables]
Differentiated Pay
Knowledge Understanding of the universal salary scale and specific incentives.
8) To what extent do teachers and school leaders report that differentiated pay is associated with teacher retention, effectiveness, and morale?
Differentiated Pay
Perceived Fairness
Perceptions about the fairness of the universal salary scale.
8) To what extent do teachers and school leaders report that differentiated pay is associated with teacher retention, effectiveness, and morale?
Differentiated Pay
Impact Impact of pay (realized and potential) on teachers’ decision making.
9) To what extent do teachers and school leaders report that there is more time for student instruction and teacher collaboration and planning in the district’s extended learning time schools? How is this time being used?
Extended Learning Time
Student Learning Uses
Reports about how extra time is used (e.g., activities, participants, and organizers) for student learning.
9) To what extent do teachers and school leaders report that there is more time for student instruction and teacher collaboration and planning in the district’s extended learning time schools? How is this time being used?
Extended Learning Time
Perceived Student Learning Utility
Perceptions about the utility of, support for, and impact of extra time dedicated to student learning.
9) To what extent do teachers and school leaders report that there is more time for student instruction and teacher collaboration and planning in the district’s extended learning time schools? How is this time being used?
Extended Learning Time
Planning and Collaboration Uses
Reports about how extra time is used (e.g., activities, participants, and organizers) for teacher planning and collaboration.
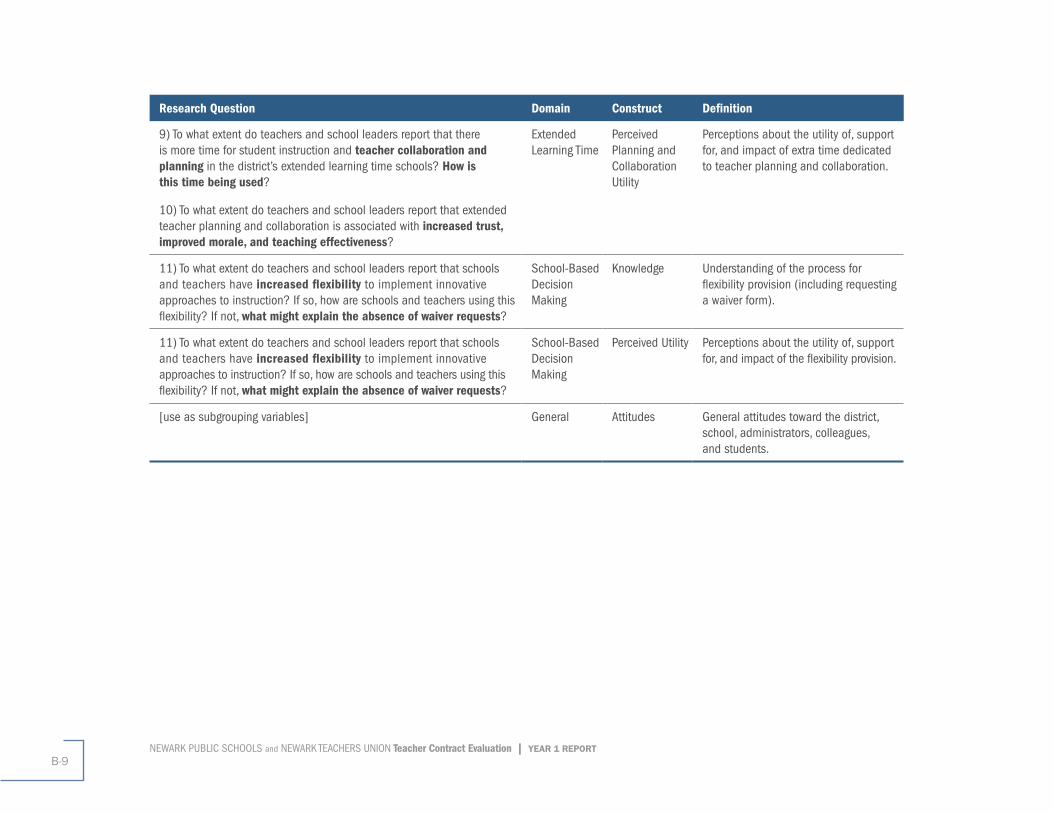
NEWARK PUBLIC SCHOOLS and NEWARK TEACHERS UNION Teacher Contract Evaluation | YEAR 1 REPORTB-9
Research Question Domain Construct Definition
9) To what extent do teachers and school leaders report that there is more time for student instruction and teacher collaboration and planning in the district’s extended learning time schools? How is this time being used?
10) To what extent do teachers and school leaders report that extended teacher planning and collaboration is associated with increased trust, improved morale, and teaching effectiveness?
Extended Learning Time
Perceived Planning and Collaboration Utility
Perceptions about the utility of, support for, and impact of extra time dedicated to teacher planning and collaboration.
11) To what extent do teachers and school leaders report that schools and teachers have increased flexibility to implement innovative approaches to instruction? If so, how are schools and teachers using this flexibility? If not, what might explain the absence of waiver requests?
School-Based Decision Making
Knowledge Understanding of the process for flexibility provision (including requesting a waiver form).
11) To what extent do teachers and school leaders report that schools and teachers have increased flexibility to implement innovative approaches to instruction? If so, how are schools and teachers using this flexibility? If not, what might explain the absence of waiver requests?
School-Based Decision Making
Perceived Utility Perceptions about the utility of, support for, and impact of the flexibility provision.
[use as subgrouping variables] General Attitudes General attitudes toward the district, school, administrators, colleagues, and students.
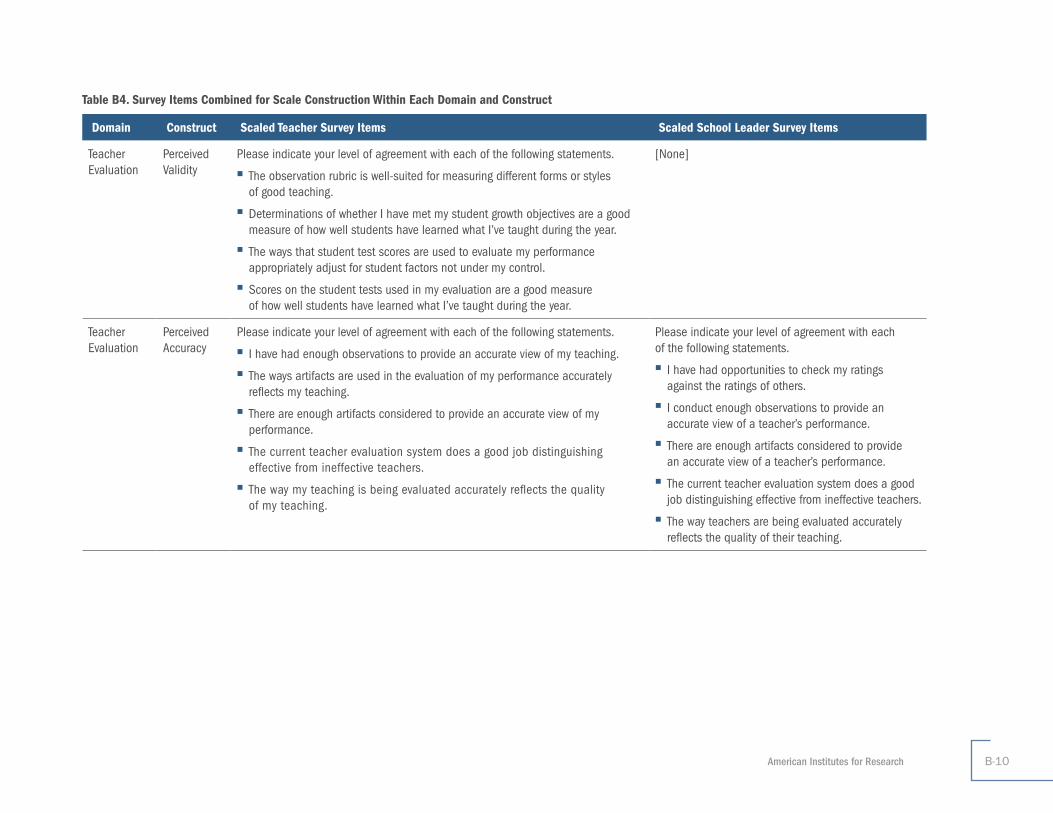
American Institutes for Research B-10
Table B4. Survey Items Combined for Scale Construction Within Each Domain and Construct
Domain Construct Scaled Teacher Survey Items Scaled School Leader Survey Items
Teacher Evaluation
Perceived Validity
Please indicate your level of agreement with each of the following statements. ■ The observation rubric is well-suited for measuring different forms or styles of good teaching.
■ Determinations of whether I have met my student growth objectives are a good measure of how well students have learned what I’ve taught during the year.
■ The ways that student test scores are used to evaluate my performance appropriately adjust for student factors not under my control.
■ Scores on the student tests used in my evaluation are a good measure of how well students have learned what I’ve taught during the year.
[None]
Teacher Evaluation
Perceived Accuracy
Please indicate your level of agreement with each of the following statements. ■ I have had enough observations to provide an accurate view of my teaching. ■ The ways artifacts are used in the evaluation of my performance accurately reflects my teaching.
■ There are enough artifacts considered to provide an accurate view of my performance.
■ The current teacher evaluation system does a good job distinguishing effective from ineffective teachers.
■ The way my teaching is being evaluated accurately reflects the quality of my teaching.
Please indicate your level of agreement with each of the following statements.
■ I have had opportunities to check my ratings against the ratings of others.
■ I conduct enough observations to provide an accurate view of a teacher’s performance.
■ There are enough artifacts considered to provide an accurate view of a teacher’s performance.
■ The current teacher evaluation system does a good job distinguishing effective from ineffective teachers.
■ The way teachers are being evaluated accurately reflects the quality of their teaching.

NEWARK PUBLIC SCHOOLS and NEWARK TEACHERS UNION Teacher Contract Evaluation | YEAR 1 REPORTB-11
Domain Construct Scaled Teacher Survey Items Scaled School Leader Survey Items
Teacher Evaluation
Perceived Instructional Impact
Please indicate your level of agreement with each of the following statements. ■ After my teaching is observed, I receive useful and actionable feedback. ■ I have made changes in the way I teach as a result of feedback I have received from observers.
■ I have made changes in what (or how) I teach based on data from the measures used in my student growth objectives.
■ I receive useful and actionable data from the student tests used in my evaluation. ■ I have made changes in what (or how) I teach based on data from the student tests used in my evaluation.
■ The current approach to teacher evaluation has helped me design lessons with a focus on moving students toward content mastery.
■ The current approach to teacher evaluation has helped me identify instructional strategies to challenge all students.
■ The competencies spelled out in the teacher evaluation framework help foster effective teaching.
■ The current approach to teacher evaluation has encouraged me to examine and monitor evidence of growth in the achievement of my students.
■ The current approach to teacher evaluation has helped me to reflect on my integration of the Common Core State Standards into my instruction.
■ The competencies spelled out by the current approach to teacher evaluation help foster high expectations for student learning.
■ As a result of the current approach to teacher evaluation, I have made changes in the way I teach.
■ I have experienced considerable stress this year as a result of the current teacher evaluation system.
■ The current teacher evaluation system is pushing me to teach in ways I don’t think are good for my students.
■ If I received a very low evaluation rating, I would seriously consider leaving NPS. ■ In the long run, students will benefit from the current teacher evaluation system.
Please indicate your level of agreement with each of the following statements.
■ After I observe a teacher, I provide them with useful and actionable feedback.
■ In my school, under the current teacher evaluation system, teachers who receive low ratings often leave voluntarily.
■ In the long run, students will benefit from the current teacher evaluation system.
■ In my school, we use teacher evaluation results to align professional development to each teacher’s strengths and weaknesses.
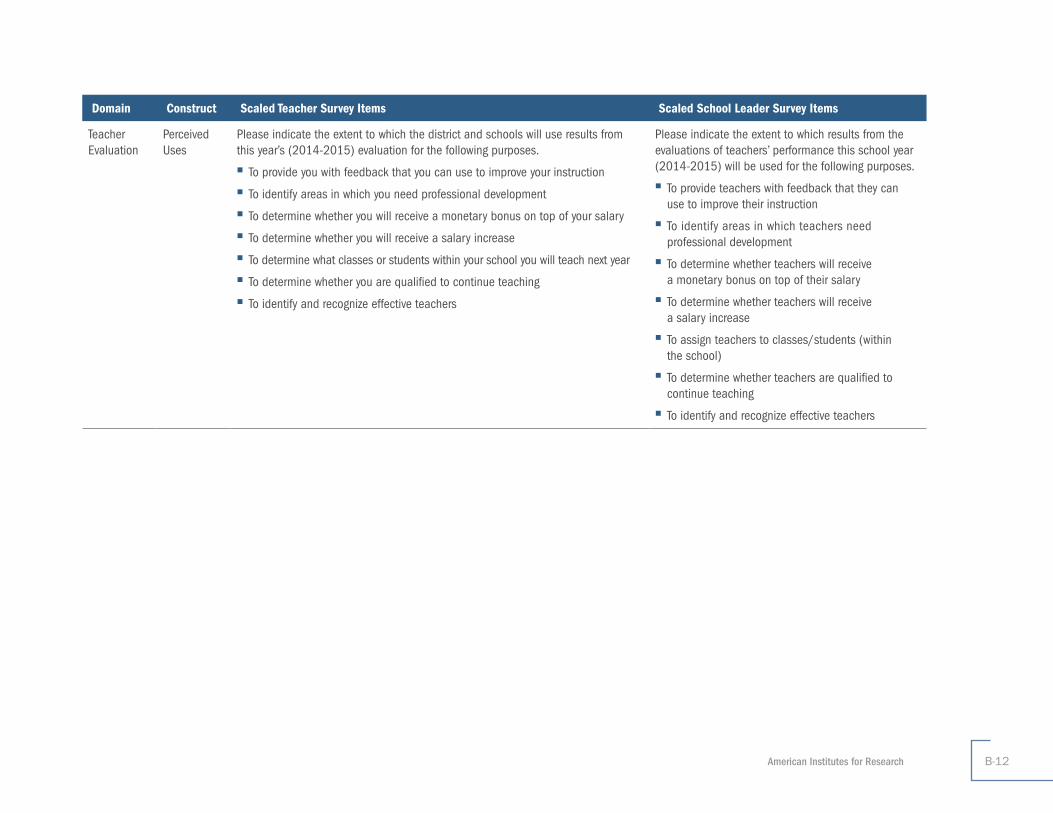
American Institutes for Research B-12
Domain Construct Scaled Teacher Survey Items Scaled School Leader Survey Items
Teacher Evaluation
Perceived Uses
Please indicate the extent to which the district and schools will use results from this year’s (2014-2015) evaluation for the following purposes.
■ To provide you with feedback that you can use to improve your instruction ■ To identify areas in which you need professional development ■ To determine whether you will receive a monetary bonus on top of your salary ■ To determine whether you will receive a salary increase ■ To determine what classes or students within your school you will teach next year ■ To determine whether you are qualified to continue teaching ■ To identify and recognize effective teachers
Please indicate the extent to which results from the evaluations of teachers’ performance this school year (2014-2015) will be used for the following purposes.
■ To provide teachers with feedback that they can use to improve their instruction
■ To identify areas in which teachers need professional development
■ To determine whether teachers will receive a monetary bonus on top of their salary
■ To determine whether teachers will receive a salary increase
■ To assign teachers to classes/students (within the school)
■ To determine whether teachers are qualified to continue teaching
■ To identify and recognize effective teachers
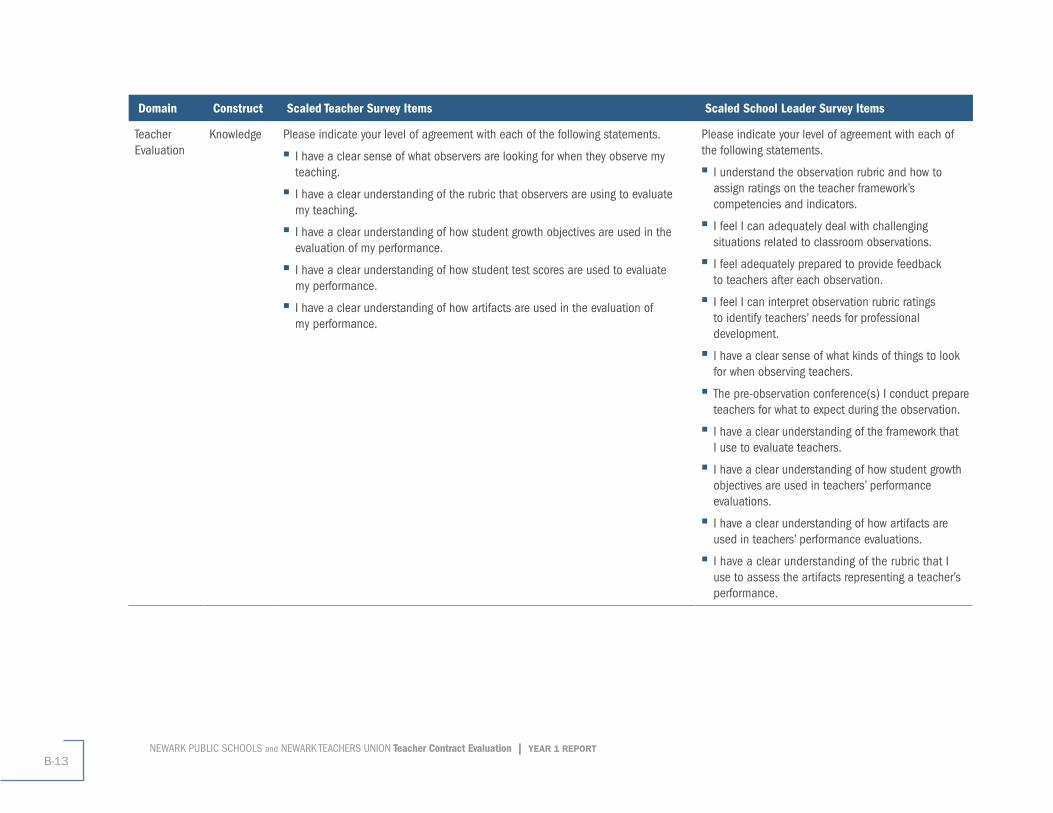
NEWARK PUBLIC SCHOOLS and NEWARK TEACHERS UNION Teacher Contract Evaluation | YEAR 1 REPORTB-13
Domain Construct Scaled Teacher Survey Items Scaled School Leader Survey Items
Teacher Evaluation
Knowledge Please indicate your level of agreement with each of the following statements. ■ I have a clear sense of what observers are looking for when they observe my teaching.
■ I have a clear understanding of the rubric that observers are using to evaluate my teaching.
■ I have a clear understanding of how student growth objectives are used in the evaluation of my performance.
■ I have a clear understanding of how student test scores are used to evaluate my performance.
■ I have a clear understanding of how artifacts are used in the evaluation of my performance.
Please indicate your level of agreement with each of the following statements.
■ I understand the observation rubric and how to assign ratings on the teacher framework’s competencies and indicators.
■ I feel I can adequately deal with challenging situations related to classroom observations.
■ I feel adequately prepared to provide feedback to teachers after each observation.
■ I feel I can interpret observation rubric ratings to identify teachers’ needs for professional development.
■ I have a clear sense of what kinds of things to look for when observing teachers.
■ The pre-observation conference(s) I conduct prepare teachers for what to expect during the observation.
■ I have a clear understanding of the framework that I use to evaluate teachers.
■ I have a clear understanding of how student growth objectives are used in teachers’ performance evaluations.
■ I have a clear understanding of how artifacts are used in teachers’ performance evaluations.
■ I have a clear understanding of the rubric that I use to assess the artifacts representing a teacher’s performance.

American Institutes for Research B-14
Domain Construct Scaled Teacher Survey Items Scaled School Leader Survey Items
Teacher Evaluation
Perceived Fairness
Please indicate your level of agreement with each of the following statements. ■ The people who observe my teaching are well qualified to evaluate it. ■ The student growth objectives I developed with my administrator are attainable. ■ The process of developing student growth objectives with my administrator is fair. ■ The ways artifacts are used in the evaluation of my performance is fair and appropriate.
■ I received adequate training on the purposes, components, and processes of the current teacher evaluation system.
■ The current teacher evaluation system is fair to all teachers, regardless of their personal characteristics or those of the students they teach.
■ The current teacher evaluation system has been fair to me. ■ The consequences tied to teachers’ evaluation results are reasonable and appropriate.
Please indicate your level of agreement with each of the following statements.
■ I am well qualified to evaluate teaching. ■ The student growth objectives teachers develop are attainable.
■ The current teacher evaluation system requires so much of my time that it interferes with other important activities.
■ The current teacher evaluation system is fair to all teachers, regardless of their personal characteristics or those of the students they teach.
■ The consequences tied to teachers’ evaluation results are reasonable and appropriate.
Teacher Evaluation
Perceived Input
[None] [None]
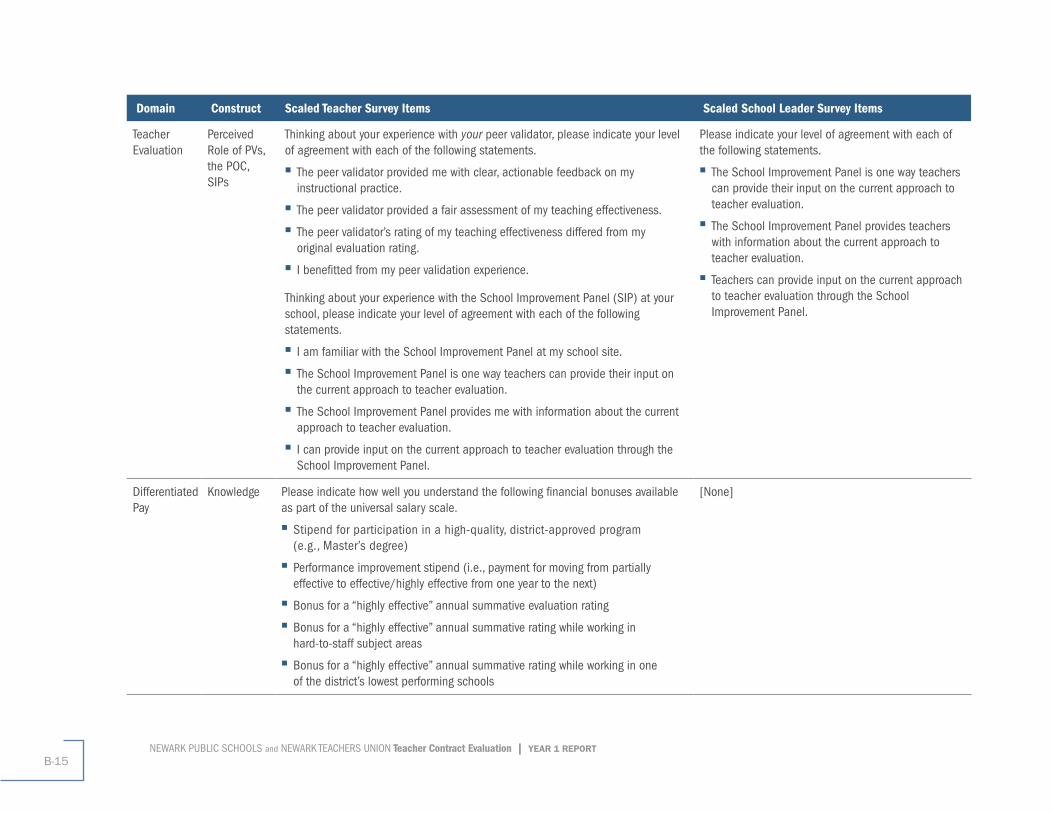
NEWARK PUBLIC SCHOOLS and NEWARK TEACHERS UNION Teacher Contract Evaluation | YEAR 1 REPORTB-15
Domain Construct Scaled Teacher Survey Items Scaled School Leader Survey Items
Teacher Evaluation
Perceived Role of PVs, the POC, SIPs
Thinking about your experience with your peer validator, please indicate your level of agreement with each of the following statements.
■ The peer validator provided me with clear, actionable feedback on my instructional practice.
■ The peer validator provided a fair assessment of my teaching effectiveness. ■ The peer validator’s rating of my teaching effectiveness differed from my original evaluation rating.
■ I benefitted from my peer validation experience.
Thinking about your experience with the School Improvement Panel (SIP) at your school, please indicate your level of agreement with each of the following statements.
■ I am familiar with the School Improvement Panel at my school site. ■ The School Improvement Panel is one way teachers can provide their input on the current approach to teacher evaluation.
■ The School Improvement Panel provides me with information about the current approach to teacher evaluation.
■ I can provide input on the current approach to teacher evaluation through the School Improvement Panel.
Please indicate your level of agreement with each of the following statements.
■ The School Improvement Panel is one way teachers can provide their input on the current approach to teacher evaluation.
■ The School Improvement Panel provides teachers with information about the current approach to teacher evaluation.
■ Teachers can provide input on the current approach to teacher evaluation through the School Improvement Panel.
Differentiated Pay
Knowledge Please indicate how well you understand the following financial bonuses available as part of the universal salary scale.
■ Stipend for participation in a high-quality, district-approved program (e.g., Master’s degree)
■ Performance improvement stipend (i.e., payment for moving from partially effective to effective/highly effective from one year to the next)
■ Bonus for a “highly effective” annual summative evaluation rating ■ Bonus for a “highly effective” annual summative rating while working in hard-to-staff subject areas
■ Bonus for a “highly effective” annual summative rating while working in one of the district’s lowest performing schools
[None]
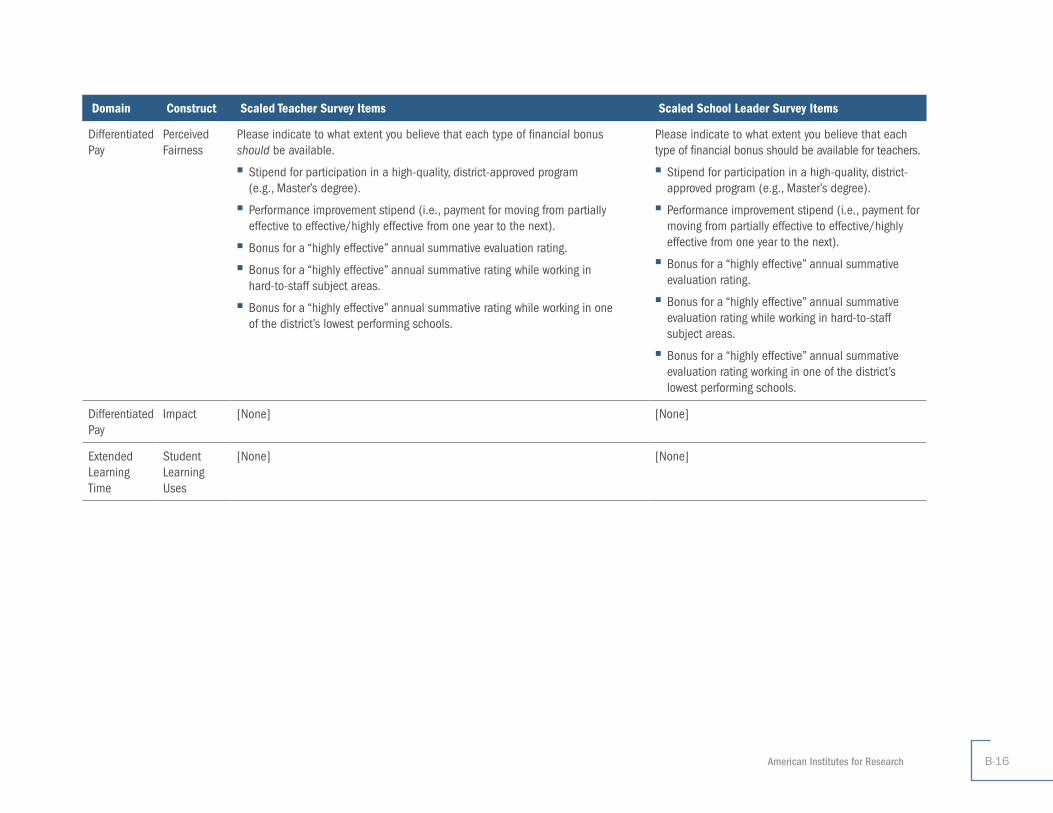
American Institutes for Research B-16
Domain Construct Scaled Teacher Survey Items Scaled School Leader Survey Items
Differentiated Pay
Perceived Fairness
Please indicate to what extent you believe that each type of financial bonus should be available.
■ Stipend for participation in a high-quality, district-approved program (e.g., Master’s degree).
■ Performance improvement stipend (i.e., payment for moving from partially effective to effective/highly effective from one year to the next).
■ Bonus for a “highly effective” annual summative evaluation rating. ■ Bonus for a “highly effective” annual summative rating while working in hard-to-staff subject areas.
■ Bonus for a “highly effective” annual summative rating while working in one of the district’s lowest performing schools.
Please indicate to what extent you believe that each type of financial bonus should be available for teachers.
■ Stipend for participation in a high-quality, district-approved program (e.g., Master’s degree).
■ Performance improvement stipend (i.e., payment for moving from partially effective to effective/highly effective from one year to the next).
■ Bonus for a “highly effective” annual summative evaluation rating.
■ Bonus for a “highly effective” annual summative evaluation rating while working in hard-to-staff subject areas.
■ Bonus for a “highly effective” annual summative evaluation rating working in one of the district’s lowest performing schools.
Differentiated Pay
Impact [None] [None]
Extended Learning Time
Student Learning Uses
[None] [None]
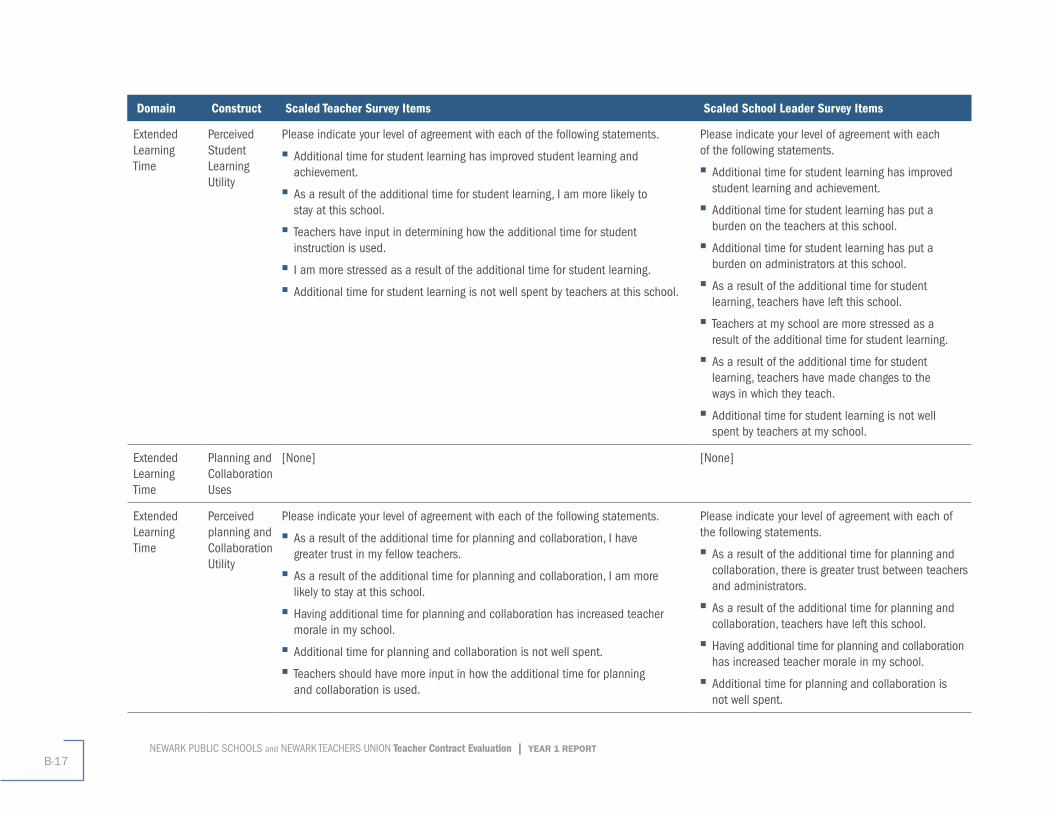
NEWARK PUBLIC SCHOOLS and NEWARK TEACHERS UNION Teacher Contract Evaluation | YEAR 1 REPORTB-17
Domain Construct Scaled Teacher Survey Items Scaled School Leader Survey Items
Extended Learning Time
Perceived Student Learning Utility
Please indicate your level of agreement with each of the following statements. ■ Additional time for student learning has improved student learning and achievement.
■ As a result of the additional time for student learning, I am more likely to stay at this school.
■ Teachers have input in determining how the additional time for student instruction is used.
■ I am more stressed as a result of the additional time for student learning. ■ Additional time for student learning is not well spent by teachers at this school.
Please indicate your level of agreement with each of the following statements.
■ Additional time for student learning has improved student learning and achievement.
■ Additional time for student learning has put a burden on the teachers at this school.
■ Additional time for student learning has put a burden on administrators at this school.
■ As a result of the additional time for student learning, teachers have left this school.
■ Teachers at my school are more stressed as a result of the additional time for student learning.
■ As a result of the additional time for student learning, teachers have made changes to the ways in which they teach.
■ Additional time for student learning is not well spent by teachers at my school.
Extended Learning Time
Planning and Collaboration Uses
[None] [None]
Extended Learning Time
Perceived planning and Collaboration Utility
Please indicate your level of agreement with each of the following statements. ■ As a result of the additional time for planning and collaboration, I have greater trust in my fellow teachers.
■ As a result of the additional time for planning and collaboration, I am more likely to stay at this school.
■ Having additional time for planning and collaboration has increased teacher morale in my school.
■ Additional time for planning and collaboration is not well spent. ■ Teachers should have more input in how the additional time for planning and collaboration is used.
Please indicate your level of agreement with each of the following statements.
■ As a result of the additional time for planning and collaboration, there is greater trust between teachers and administrators.
■ As a result of the additional time for planning and collaboration, teachers have left this school.
■ Having additional time for planning and collaboration has increased teacher morale in my school.
■ Additional time for planning and collaboration is not well spent.
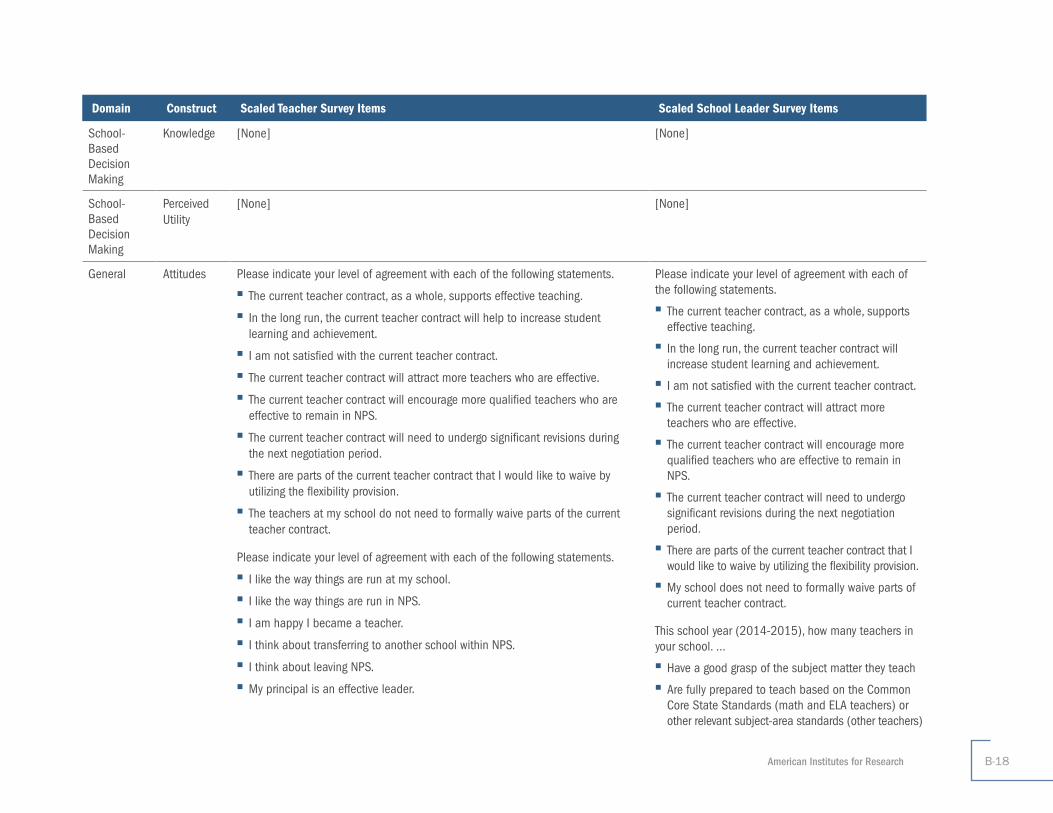
American Institutes for Research B-18
Domain Construct Scaled Teacher Survey Items Scaled School Leader Survey Items
School-Based Decision Making
Knowledge [None] [None]
School-Based Decision Making
Perceived Utility
[None] [None]
General Attitudes Please indicate your level of agreement with each of the following statements. ■ The current teacher contract, as a whole, supports effective teaching. ■ In the long run, the current teacher contract will help to increase student learning and achievement.
■ I am not satisfied with the current teacher contract. ■ The current teacher contract will attract more teachers who are effective. ■ The current teacher contract will encourage more qualified teachers who are effective to remain in NPS.
■ The current teacher contract will need to undergo significant revisions during the next negotiation period.
■ There are parts of the current teacher contract that I would like to waive by utilizing the flexibility provision.
■ The teachers at my school do not need to formally waive parts of the current teacher contract.
Please indicate your level of agreement with each of the following statements. ■ I like the way things are run at my school. ■ I like the way things are run in NPS. ■ I am happy I became a teacher. ■ I think about transferring to another school within NPS. ■ I think about leaving NPS. ■ My principal is an effective leader.
Please indicate your level of agreement with each of the following statements.
■ The current teacher contract, as a whole, supports effective teaching.
■ In the long run, the current teacher contract will increase student learning and achievement.
■ I am not satisfied with the current teacher contract. ■ The current teacher contract will attract more teachers who are effective.
■ The current teacher contract will encourage more qualified teachers who are effective to remain in NPS.
■ The current teacher contract will need to undergo significant revisions during the next negotiation period.
■ There are parts of the current teacher contract that I would like to waive by utilizing the flexibility provision.
■ My school does not need to formally waive parts of current teacher contract.
This school year (2014-2015), how many teachers in your school. …
■ Have a good grasp of the subject matter they teach ■ Are fully prepared to teach based on the Common Core State Standards (math and ELA teachers) or other relevant subject-area standards (other teachers)
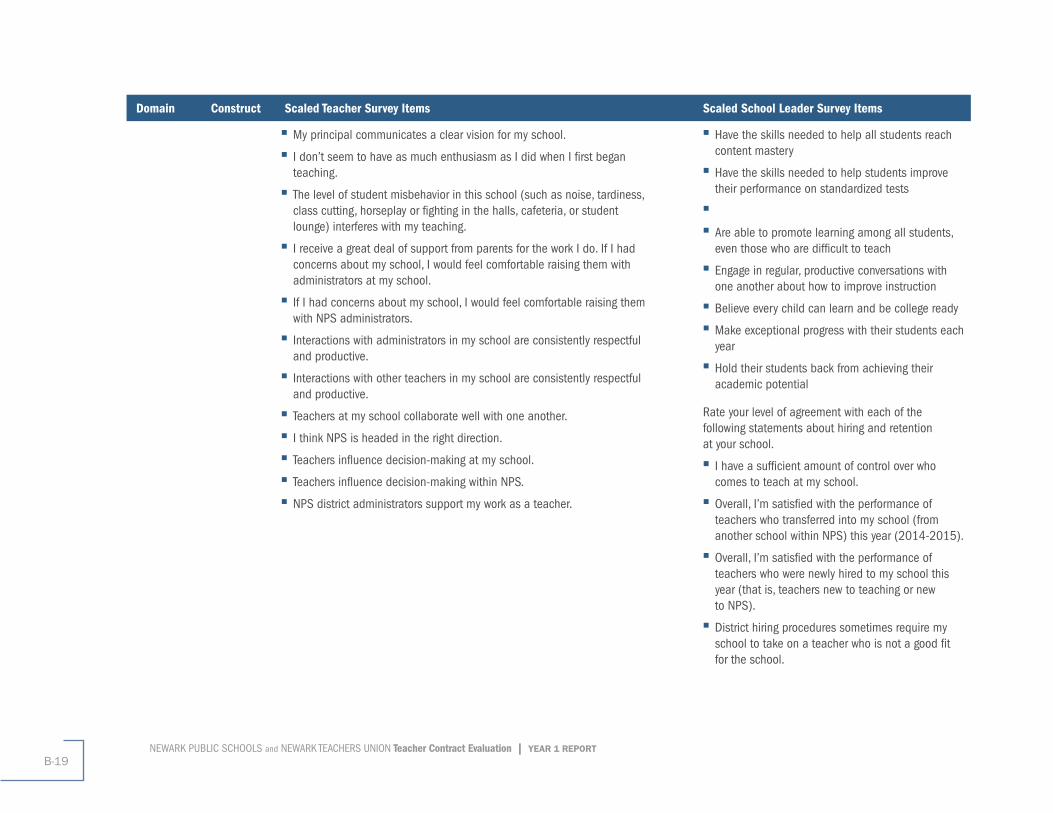
NEWARK PUBLIC SCHOOLS and NEWARK TEACHERS UNION Teacher Contract Evaluation | YEAR 1 REPORTB-19
Domain Construct Scaled Teacher Survey Items Scaled School Leader Survey Items
■ My principal communicates a clear vision for my school. ■ I don’t seem to have as much enthusiasm as I did when I first began teaching.
■ The level of student misbehavior in this school (such as noise, tardiness, class cutting, horseplay or fighting in the halls, cafeteria, or student lounge) interferes with my teaching.
■ I receive a great deal of support from parents for the work I do. If I had concerns about my school, I would feel comfortable raising them with administrators at my school.
■ If I had concerns about my school, I would feel comfortable raising them with NPS administrators.
■ Interactions with administrators in my school are consistently respectful and productive.
■ Interactions with other teachers in my school are consistently respectful and productive.
■ Teachers at my school collaborate well with one another. ■ I think NPS is headed in the right direction. ■ Teachers influence decision-making at my school. ■ Teachers influence decision-making within NPS. ■ NPS district administrators support my work as a teacher.
■ Have the skills needed to help all students reach content mastery
■ Have the skills needed to help students improve their performance on standardized tests
■
■ Are able to promote learning among all students, even those who are difficult to teach
■ Engage in regular, productive conversations with one another about how to improve instruction
■ Believe every child can learn and be college ready ■ Make exceptional progress with their students each year
■ Hold their students back from achieving their academic potential
Rate your level of agreement with each of the following statements about hiring and retention at your school.
■ I have a sufficient amount of control over who comes to teach at my school.
■ Overall, I’m satisfied with the performance of teachers who transferred into my school (from another school within NPS) this year (2014-2015).
■ Overall, I’m satisfied with the performance of teachers who were newly hired to my school this year (that is, teachers new to teaching or new to NPS).
■ District hiring procedures sometimes require my school to take on a teacher who is not a good fit for the school.

American Institutes for Research B-20
Domain Construct Scaled Teacher Survey Items Scaled School Leader Survey Items
■ Teachers’ evaluation results should be factored in to decisions about how teachers are placed at schools.
■ Too often, good teachers leave my school because they perceive better opportunities elsewhere.
Thinking about your school and district environment in general, please indicate your level of agreement with each of the following statements.
■ I like the way things are run in NPS. ■ Teachers at my school collaborate well with one another.
■ Interactions with other administrators in my school are consistently respectful and productive.
■ Interactions with teachers in my school are consistently respectful and productive.
■ If I had concerns about my school, I would feel comfortable raising them with NPS administrators.
■ I think NPS is headed in the right direction.

NEWARK PUBLIC SCHOOLS and NEWARK TEACHERS UNION Teacher Contract Evaluation | YEAR 1 REPORTC-1
Appendix C. Retention Analysis Methods
2012–13 and 2013–14 Framework Details
This section summarizes the Newark Public Schools “Framework for Effective Teaching”
(Framework) details for 2012–13 and 2013–14 because these are the years included
in retention analysis presented in the body of the Year 1 report.
Evaluators provide a rating for each of the indicators and competencies as well as a
total rating (based on a summation of the individual competency scores). The manner
in which the overall score is calculated depends on the type of rating. For observations,
each of the first four competencies is scored 1 to 4 (corresponding to the categories of
“ineffective,” “partially effective,” “effective,” and “highly effective,” respectively) and
then summed to create an overall score. (The fifth competency is not included in the
observation score.) The overall rating category (for observations) is determined as
shown in Table C1.
Table C1. Overall Rating Category by Total Score Range (Observations)
Overall Rating Category Total Score Range
Highly effective 15–16
Effective 11–14
Partially effective 6–10
Ineffective 4–5
For midyear and annual evaluations, the correspondence between the rating and
the number of points varies by competency. Competencies 1–4 are scored like the
observations (a score of 1 to 4 corresponding to the categories of “ineffective,” “partially
effective,” “effective,” and “highly effective,” respectively).19 Table C2 shows the points
for Competency 5. These points are then summed to produce a total score. The total
score is then linked to the final evaluation rating as shown in Table C3.
Table C2. Evaluation Points by Rating: Competency 5
Rating Points
Exceeds expectations 1
Meeting expectations 0
Slightly below expectations -2
Significantly below expectations -6
19 Note that this is for the 2012–13 and 2013–14 years, but in the 2014–15 school year, the rating of Competency 4 was adjusted, where a rating of “highly effective” received 6 points, a rating of “effective” received 5 points, a rating of “partially effective” received 2 points, and a rating of “ineffective” received 1 point.
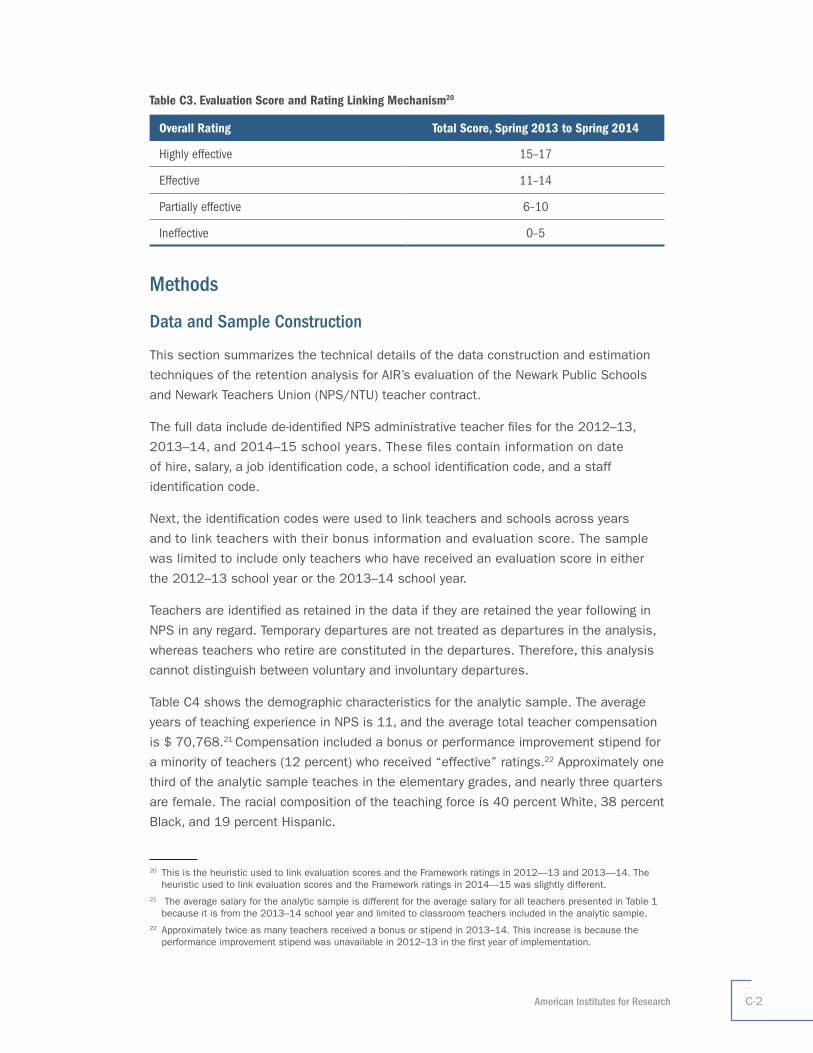
American Institutes for Research C-2
Table C3. Evaluation Score and Rating Linking Mechanism20
Overall Rating Total Score, Spring 2013 to Spring 2014
Highly effective 15–17
Effective 11–14
Partially effective 6–10
Ineffective 0–5
Methods
Data and Sample Construction
This section summarizes the technical details of the data construction and estimation
techniques of the retention analysis for AIR’s evaluation of the Newark Public Schools
and Newark Teachers Union (NPS/NTU) teacher contract.
The full data include de-identified NPS administrative teacher files for the 2012–13,
2013–14, and 2014–15 school years. These files contain information on date
of hire, salary, a job identification code, a school identification code, and a staff
identification code.
Next, the identification codes were used to link teachers and schools across years
and to link teachers with their bonus information and evaluation score. The sample
was limited to include only teachers who have received an evaluation score in either
the 2012–13 school year or the 2013–14 school year.
Teachers are identified as retained in the data if they are retained the year following in
NPS in any regard. Temporary departures are not treated as departures in the analysis,
whereas teachers who retire are constituted in the departures. Therefore, this analysis
cannot distinguish between voluntary and involuntary departures.
Table C4 shows the demographic characteristics for the analytic sample. The average
years of teaching experience in NPS is 11, and the average total teacher compensation
is $ 70,768.21 Compensation included a bonus or performance improvement stipend for
a minority of teachers (12 percent) who received “effective” ratings.22 Approximately one
third of the analytic sample teaches in the elementary grades, and nearly three quarters
are female. The racial composition of the teaching force is 40 percent White, 38 percent
Black, and 19 percent Hispanic.
20 This is the heuristic used to link evaluation scores and the Framework ratings in 2012—13 and 2013—14. The heuristic used to link evaluation scores and the Framework ratings in 2014—15 was slightly different.
21 The average salary for the analytic sample is different for the average salary for all teachers presented in Table 1 because it is from the 2013–14 school year and limited to classroom teachers included in the analytic sample.
22 Approximately twice as many teachers received a bonus or stipend in 2013–14. This increase is because the performance improvement stipend was unavailable in 2012–13 in the first year of implementation.
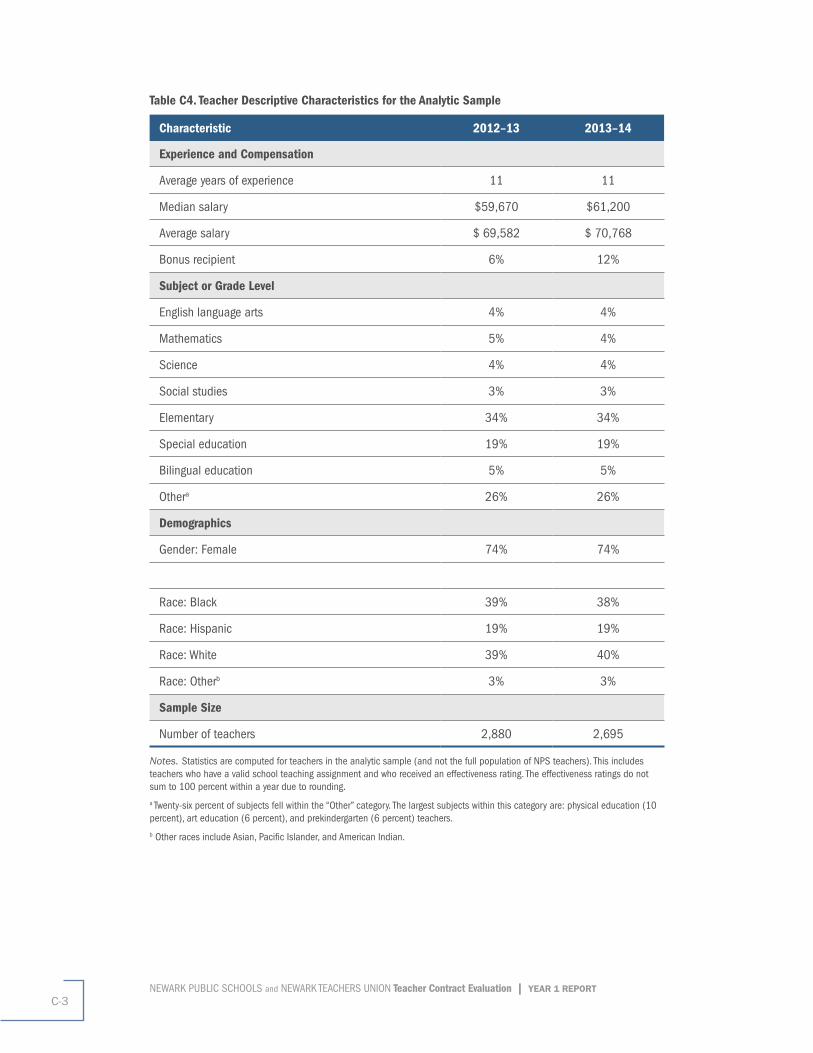
NEWARK PUBLIC SCHOOLS and NEWARK TEACHERS UNION Teacher Contract Evaluation | YEAR 1 REPORTC-3
Table C4. Teacher Descriptive Characteristics for the Analytic Sample
Characteristic 2012–13 2013–14
Experience and Compensation
Average years of experience 11 11
Median salary $59,670 $61,200
Average salary $ 69,582 $ 70,768
Bonus recipient 6% 12%
Subject or Grade Level
English language arts 4% 4%
Mathematics 5% 4%
Science 4% 4%
Social studies 3% 3%
Elementary 34% 34%
Special education 19% 19%
Bilingual education 5% 5%
Othera 26% 26%
Demographics
Gender: Female 74% 74%
Race: Black 39% 38%
Race: Hispanic 19% 19%
Race: White 39% 40%
Race: Otherb 3% 3%
Sample Size
Number of teachers 2,880 2,695
Notes. Statistics are computed for teachers in the analytic sample (and not the full population of NPS teachers). This includes teachers who have a valid school teaching assignment and who received an effectiveness rating. The effectiveness ratings do not sum to 100 percent within a year due to rounding.
a Twenty-six percent of subjects fell within the “Other” category. The largest subjects within this category are: physical education (10 percent), art education (6 percent), and prekindergarten (6 percent) teachers.
b Other races include Asian, Pacific Islander, and American Indian.
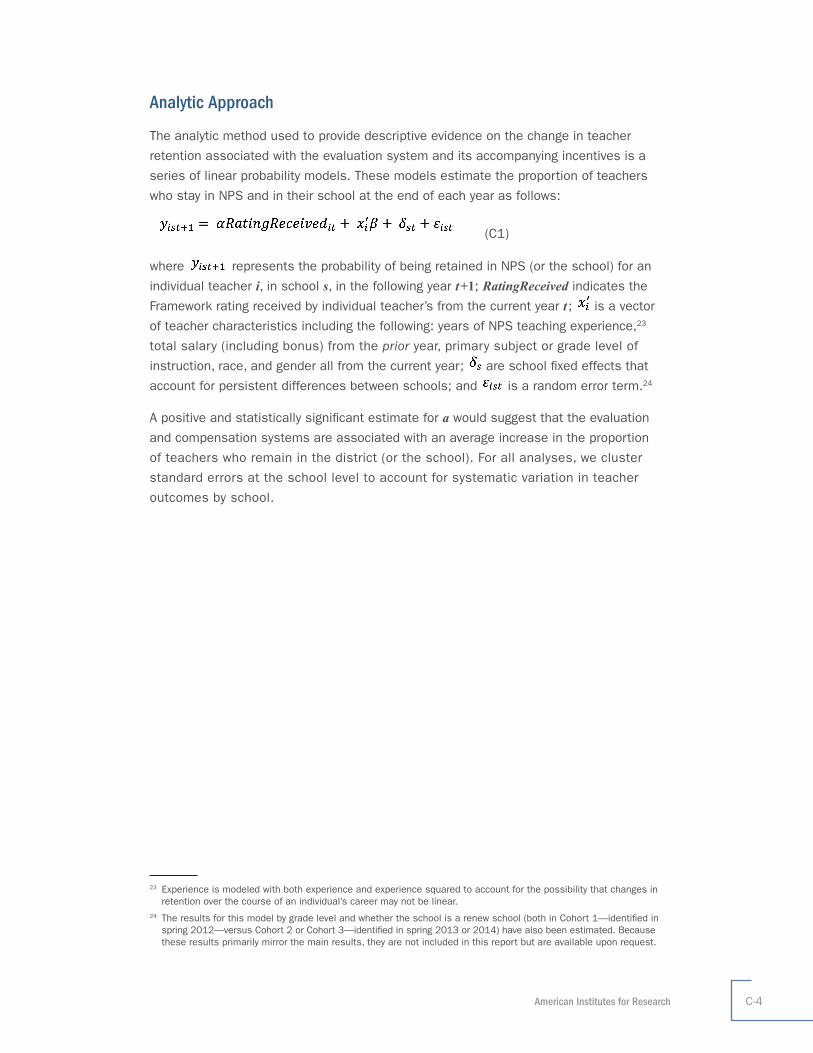
American Institutes for Research C-4
Analytic Approach
The analytic method used to provide descriptive evidence on the change in teacher
retention associated with the evaluation system and its accompanying incentives is a
series of linear probability models. These models estimate the proportion of teachers
who stay in NPS and in their school at the end of each year as follows:
(C1)
where represents the probability of being retained in NPS (or the school) for an
individual teacher i, in school s, in the following year t+1; RatingReceived indicates the
Framework rating received by individual teacher’s from the current year t ; is a vector
of teacher characteristics including the following: years of NPS teaching experience,23
total salary (including bonus) from the prior year, primary subject or grade level of
instruction, race, and gender all from the current year; are school fixed effects that
account for persistent differences between schools; and is a random error term.24
A positive and statistically significant estimate for a would suggest that the evaluation
and compensation systems are associated with an average increase in the proportion
of teachers who remain in the district (or the school). For all analyses, we cluster
standard errors at the school level to account for systematic variation in teacher
outcomes by school.
23 Experience is modeled with both experience and experience squared to account for the possibility that changes in retention over the course of an individual’s career may not be linear.
24 The results for this model by grade level and whether the school is a renew school (both in Cohort 1—identified in spring 2012—versus Cohort 2 or Cohort 3—identified in spring 2013 or 2014) have also been estimated. Because these results primarily mirror the main results, they are not included in this report but are available upon request.
About American Institutes for Research
Established in 1946, American Institutes for Research (AIR) is an
independent, nonpartisan, not-for-profit organization that conducts
behavioral and social science research on important social issues and
delivers technical assistance, both domestically and internationally, in the
areas of education, health, and workforce productivity.
Copyright © 2016 American Institutes for Research. All rights reserved. 4999_02/16
1000 Thomas Jefferson Street NW Washington, DC 20007-3835202.403.5000
www.air.org